Embed Size (px)
Citation preview

Rev Chem Eng 2018; aop
Baharak Sajjadi*, Wei-Yin Chen and Nosa O. Egiebora
A comprehensive review on physical activation of biochar for energy and environmental applicationshttps://doi.org/10.1515/revce-2017-0113Received November 26, 2017; accepted May 7, 2018
Abstract: Biochar is a solid by-product of thermochemi-cal conversion of biomass to bio-oil and syngas. It has a carbonaceous skeleton, a small amount of heteroatom functional groups, mineral matter, and water. Biochar’s unique physicochemical structures lead to many valu-able properties of important technological applications, including its sorption capacity. Indeed, biochar’s wide range of applications include carbon sequestration, reduc-tion in greenhouse gas emissions, waste management, renewable energy generation, soil amendment, and envi-ronmental remediation. Aside from these applications, new scientific insights and technological concepts have continued to emerge in the last decade. Consequently, a systematic update of current knowledge regarding the complex nature of biochar, the scientific and technologi-cal impacts, and operational costs of different activation strategies are highly desirable for transforming biochar applications into industrial scales. This communication presents a comprehensive review of physical activation/modification strategies and their effects on the phys-icochemical properties of biochar and its applications in environment-related fields. Physical activation applied to the activation of biochar is discussed under three differ-ent categories: I) gaseous modification by steam, carbon dioxide, air, or ozone; II) thermal modification by conven-tional heating and microwave irradiation; and III) recently developed modification methods using ultrasound waves, plasma, and electrochemical methods. The activation results are discussed in terms of different physicochemical
properties of biochar, such as surface area; micropore, mesopore, and total pore volume; surface functionality; burn-off; ash content; organic compound content; polar-ity; and aromaticity index. Due to the rapid increase in the application of biochar as adsorbents, the synergistic and antagonistic effects of activation processes on the desired application are also covered.
Keywords: biochar; electrochemical activation; gaseous activation; physical activation; plasma activation; thermal activation; ultrasound activation.
1 Introduction
Biochar, a low-cost carbon-rich material, is produced from the thermal decomposition of (waste) biomass, such as wood chips, manure, and crop residue in the absence of oxygen or under oxygen-limited conditions. Biochar (BC) is also a solid byproduct in the production of high-energy-density fuels, including bio-oil and biogas. Raw chars produced from the pyrolysis of biomass, coal, and lignite in an inert gas contain clusters of four to six par-allel graphene and graphitic oxide sheets that comprise the backbone of these materials (Figure 1), as illustrated in Franklin (1951) and Hammes and Schmidt (2009).
Thermochemical conversion of biomass in anoxic or oxygen-limited conditions results in the production of a mixture of solid (BC), liquid (bio-oil), and gas (syngas) (Mohan et al. 2006). Not only the distribution (volume fraction) of these phases but also their properties depend on the process conditions as well as the biomass source. Hence, different thermal decomposition processes have been defined and employed so far, as summarized in Table 1. The lowest range of temperature (200–300°C) belongs to the torrefaction, also named as mild pyroly-sis, which is normally used to improve biomass prop-erties rather than BC production (Tumuluru et al. 2011, Chen et al. 2015). In other words, the solid produced by torrefaction still contains some volatile organic com-pounds and hence has the properties between BC and raw biomass. In pyrolysis, biomass is heated up to tem-peratures generally between 300 and 800°C, in which
aFormerly with Chemical Engineering Department, School of Engineering, University of Mississippi, 134 Anderson Hall, Oxford, MS 38677-1848, USA*Corresponding author: Baharak Sajjadi, Department of Chemical Engineering, University of Mississippi, University, MS 38677, USA, e-mail: [email protected] Chen: Department of Chemical Engineering, University of Mississippi, University, MS 38677, USANosa O. Egiebor: Environmental Resources Engineering Department, College of Environmental Science and Forestry (ESF), 206 Bray Hall, Syracuse, NY 13210, USA
Brought to you by | University of Michigan-Flint
Authenticated
Download Date | 9/17/18 4:43 PM

2 B. Sajjadi et al.: Activation of biochar for energy and environment
the maximum temperature, heating rate, and residence time determine the desired procedure (slow, fast, and flash pyrolysis). The highest quantity of BC is produced through slow and flash pyrolysis, while condensable liquid makes the major product of fast pyrolysis. Gasifica-tion needs the highest temperature and a limited quan-tity of oxygen. In this process, biomass is partially burnt and most of the organic materials are converted to syngas along with small fractions of BC. The wet pyrolysis of the biomass-water mixture under elevated pressure at tem-peratures between 180 and 400°C is also named as hydro-thermal carbonization. Most of the organic materials in this process are converted to solid particles (hydrochar) and liquid (bio-oil mixed with water), while the amount of gas produced is very small.
1.1 BC characteristics
1.1.1 Elemental content
BCs usually contain carbon (C) (40–70%), oxygen (O) (10–45%), hydrogen (H) (1–5%), nitrogen (N) (0–3%), sulfur (S) (<1%), and other trace elements. The O/C value represents the quantity of superficial polar functional groups and the hydrophilicity of BC, whereas the H/C value indicates the aromatization of the organic struc-ture (Fang et al. 2014, Han et al. 2017). During pyroly-sis, under increasing temperature, the higher degree of carbonization reduces the atomic ratios of H/C, O/C, and N/C, followed by a reduction in the abundances of carboxylic, hydroxyl, and amino groups. Different ele-ments of BC are (usually) determined by dry combustion, Ta
ble
1:
Typi
cal t
herm
al p
roce
sses
and
pro
duct
pro
pert
ies
for b
ioch
ar p
rodu
ctio
n.
Co
nve
rsio
n t
ype
O
pe
rati
ng
tem
pe
ratu
re
P
roce
ss
du
rati
on
H
ea
tin
g
rate
Pro
du
ct d
istr
ibu
tio
n
So
lid
pro
xim
ate
an
aly
sis
R
efe
ren
ce
So
lid
Li
qu
id
Ga
sM
ois
ture
V
M
Ash
Fi
xed
C
Torr
efac
tion
(no
oxyg
en)
20
0–30
0
10–
120
min
<
1
30–
85
0 10
–60
0–
1
50–
89
0.5–
10
13–
50
Bac
h et
al.
(201
6), C
hen
et a
l. (2
017)
, Spo
kas
et a
l. (2
012)
, Bam
dad
et a
l. (2
017)
Slo
w p
yrol
ysis
(car
boni
zati
on)
(no
oxyg
en)
30
0–70
0
Hou
rs–
days
1–
100
15
–40
20
–55
15
–60
0–
5
5–20
2–
10
40–
90
Raja
paks
ha e
t al.
(201
6), G
ogoi
et a
l. (2
017)
, Q
ambr
ani e
t al.
(201
7), Z
hang
et a
l. (2
017)
, S
poka
s et
al.
(201
2), B
amda
d et
al.
(201
7)Fa
st p
yrol
ysis
(no
oxyg
en)
45
0–55
0
<1
min
>
1000
10
–35
50
–70
5–
30
0–5
40
30
40
–60
Ch
a et
al.
(201
6), Q
ambr
ani e
t al.
(201
7),
Spo
kas
et a
l. (2
012)
, Bam
dad
et a
l. (2
017)
Flas
h py
roly
sis
(no
oxyg
en)
30
0–80
0
<2
s
>10
00
12–
40
–
60–
70
0–5
5–
26
0–40
40
–60
Ch
a et
al.
(201
6), Q
ambr
ani e
t al.
(201
7),
Spo
kas
et a
l. (2
012)
, Bam
dad
et a
l. (2
017)
Gas
ific
atio
n (p
arti
al o
xidi
zati
on)
800–
1200
10
s to
1 m
in
Vari
able
0–
10
5 85
–10
0 n/
a
n/a
n/
a
n/a
Ch
a et
al.
(201
6), Q
ambr
ani e
t al.
(201
7),
Spo
kas
et a
l. (2
012)
, Bam
dad
et a
l. (2
017)
Hyd
roth
erm
al c
arbo
niza
tion
18
0–40
0
1–16
h
n/a
50
–80
5–
40
2–10
10
–40
50
–90
5–
15
4–10
Ch
a et
al.
(201
6), Q
ambr
ani e
t al.
(201
7), Y
ou e
t al.
(201
7), S
poka
s et
al.
(201
2), B
amda
d et
al.
(201
7)M
icro
wav
e as
sist
ed p
yrol
ysis
25
0–60
0
3 m
in–
4 h
n/
a
20–
30
0–20
50
–70
10
–25
20
–30
20
–25
50
–60
W
ahi e
t al.
(201
7), S
poka
s et
al.
(201
2), B
amda
d et
al.
(201
7)
Figure 1: Postulated structures of chars derived from nongraphitic coal (Franklin 1951), copyright license no. 4307130512402, The Royal Society.
Brought to you by | University of Michigan-Flint
Authenticated
Download Date | 9/17/18 4:43 PM

B. Sajjadi et al.: Activation of biochar for energy and environment 3
in which elements such as carbon, hydrogen, nitrogen, and oxygen are converted to simple gasses of CO
2, H
2O,
N2, and CO, respectively. The product gasses are then
separated under steady-state conditions and measured as a function of thermal conductivity. The remaining frac-tion of BC is made of ash that contains Na, Mg, K, Ca, P, and other mineral elements. Mineral elements play key roles in the treatment of wastewater, especially those containing metal compounds (Tan et al. 2017). Depend-ing on biomass feedstock, different quantities of mineral compounds exist in BCs. For example, poultry litter- and swine manure-based BCs generally contain higher K contents (1.6–5.9%) than do BCs from other materials (Komiyama et al. 2013). Apart from feedstock, the concen-trations of mineral components are influenced by pyroly-sis temperature. BCs produced at higher temperatures are enriched in mineral compounds (Rafiq et al. 2016). However, water-soluble concentrations of mineral com-ponents behave differently from their total concentra-tions. Generally, water-soluble concentrations of mineral compounds increase with synthesis temperature up to 200°C, but a further increase in temperature decreases this portion of mineral compounds, which is due to the increased crystallization (Li et al. 2017).
1.1.2 Functional groups
The properties of BC and the reaction mechanisms of the charring processes are closely related to functional groups, mainly oxygen-containing groups (Tables 2 and 3). The oxygen complexes include carboxylic, hydroxyl, phenolic (hydroxyl), carbonyl, lactone, carboxylic acid anhydride, and cyclic peroxide groups (see, e.g. Cookson 1978 and Figure 2). These surface oxides may exist in the origi-nal biomass or be formed either during the pyrolysis or the subsequent activation stage that involves oxidation.
Moreover, carboxyl and hydroxyl groups also form salts with metallic cations such as K+, Na+, Ca+2, and Mg+2 in BC. These salts enhance the BC alkalinity and contribute to the soil cation exchange capacity (Yuan et al. 2011, Xu et al. 2012) when BC is applied as a soil amendment.
The surface oxides can be quantified by titration method (Boehm 1966, 2002), temperature-programmed desorption (TPD) (Calo and Hall 1991), FTIR-PAS, or Fourier transform mid-infrared photoacoustic spectro-scopy (Yuan et al. 2011, Xu et al. 2012), and X-ray photo-electron spectroscopy (XPS) (Boehm 1966). In the widely used selective titration method of Boehm, four bases of different strengths, NaHCO
3, Na
2CO
3, NaOH, and NaOC
2H
5,
are used to neutralize oxygen functional groups of differ-ent acidities. NaHCO
3 neutralizes carboxylic acid func-
tionalities; Na2CO
3 neutralizes both carboxylic acids and
lactones; NaOH neutralizes carboxylic acids, lactones, and phenols; and the groups reacting with NaOC
2H
5 but
not with NaOH are suggested to be carbonyl (Derry 2001). Desorption of CO, CO
2, and H
2O from char at various tem-
peratures during TPD is another major approach in char-acterizing surface functional groups (see Tables 2 and 3, and also Cookson 1978, Marsh et al. 1997). While exten-sive TPD work has been devoted to the characterization of surface oxide below 1000°C, Chen et al. (2008) reported the existence of abundant “stable” surface oxide above 1000°C. Chars oxidized at 1000°C with less than 0.3 s residence time shows CO desorption peaks during TPD at three distinct temperatures: 730, 1280, and 1560°C. The peaks at 730°C are mainly caused by incomplete devolatil-ization. The peaks at 1280°C mainly represent desorption of stable surface oxides and incomplete devolatilization. Increasing the gas phase oxidants notably increases the amount of stable surface oxides. The broad peaks between 1400 and 1650°C are attributed to the reactions of oxidants decomposed from minerals and carbon in the char.
Oxygen- and nitrogen-containing functional groups on AC have been considered as the major active sites for adsorption (Biniak et al. 1999, Hulicova-Jurcakova et al. 2009, Marsh and Reinoso 2006). Mattson and Mark (Mark and Mattson 1971) and Cookson (1978) reviewed the con-tributions of surface oxides on BC adsorption behaviors. The unpaired electrons of oxygen (such as carbonyls) and nitrogen enhance the adsorption of polar and polarizable species, through Lewis acid-base (or electron acceptor-donor) interactions. For instance, acidic surface oxides attract water and reduce the adsorption of nonpolar par-affin and many aromatic compounds. However, if acidic oxides on the carbon surface can form stronger hydrogen bonds with other compounds rather than with water, the compound can displace water from the acidic sites.
Table 2: Surface functional groups and the corresponding products on temperature-programmed desorption (Chen et al. 2008, Marsh et al. 1997).
Surface functional group TPD products
Carbonyl COQuinone COEther COCarboxylic anhydride CO, CO2
Lactone CO2
Carboxylic acid CO2, H2OPhenol CO, H2OIntercalated oxygen CO
Brought to you by | University of Michigan-Flint
Authenticated
Download Date | 9/17/18 4:43 PM

4 B. Sajjadi et al.: Activation of biochar for energy and environment
Surface acidity is commonly determined by the zeta potential in electrophoretic mobility measurement (e.g. Corapcioglu and Huang 1987, Chiang et al. 2002b). Pyrol-ysis temperature has profound impacts on the surface functional groups and the properties of BCs (e.g. Cookson 1978). Carbons produced at high temperatures, or the H-type, tend to be hydrophobic, adsorb acids in water, and exhibit positive charges in the electrophoretic mobil-ity measurement. On the contrary, carbons produced at low temperatures, or the L-type, tend to be hydrophilic, adsorb bases in water, and exhibit negative charges in the electrophoretic mobility measurement. These properties have fundamental importance on the behaviors of acti-vated carbon.
1.1.3 Surface charge and pH
Surface charge and pH are the other important charac-teristics of BCs. The analysis between functional groups, pyrolysis temperature, and BC properties demonstrated that BC pH increases with pyrolysis temperature. In other words, high-temperature pyrolysis produces alkaline BCs, whereas low-temperature pyrolysis yields acidic BCs. Two
reasons suggest this phenomenon: first, the loss of acidic functional groups during pyrolysis at high temperatures, and second, the increase in ash content with temperature. Both the loss of acidic groups and high contents of alkali and alkaline earth metals in ash give alkaline character-istic to BC (Jung and Kim 2014). Surface charge is the dif-ference between the electrical potential of the inner and outer surface of a particle in a solution. The net surface charge density is easily measured by acid-base titration (Lützenkirchen et al. 2012). The surface charge of a par-ticle is strongly affected by the solution pH. The point of zero charge (pH
PZC) refers to the pH at which the net
charge of BC surface is zero. When solution pH is lower than pH
PZC, the BC is positively charged, and when solu-
tion pH is higher than pHPZC
, the BC is negatively charged. In the former, BC binds metal anions such as –
4HCrO and
2–4
HAsO , while in the latter, it binds to metal cations such as + +
2 2Hg , Pb , and +
2Cd . It should be noted that the quan-
tity of oxygen-containing groups that can be negatively charged is reduced at higher temperatures, increasing the surface charge. Klüpfel et al. (2014) demonstrated that BC produced from pyrolysis in temperatures from 400 to 700°C possessed the potentiality to donate or accept up to 2 mmol electrons per gram. The electron accepting moieties increase with temperature. The authors there-fore proposed environmental engineering applications (as redox-active organic phases) that required controlled electron transfer redox reactions. Saquing et al. (2016) recently reported such redox reactions to facilitate abiotic and microbial transformation. In their work, chemically or biotically reduced BC served as an electron donor to reduce nitrate to N
2 while air-oxidized BC served as an
electron acceptor facilitating acetate oxidation. On the basis of nitrate reduction and acetate oxidation, the bio-available (to the bacterium Geobacter metallireducens, GS-15) electron storage capacities of the BC were estimated
Table 3: Major surface functional groups in biochar structure as identified by FTIR spectra.
Peaks (cm − 1) Chemical bonds Vibration Composition
3100–3800 Alcohol/phenol O-H stretch Stretching H2O or alcohols2800–3000 Alkyl C-H stretch Stretching CH4, alkyl structure2380–2100 C=O i.e. carbonyl bond group Stretching 1700–1760 C=O stretch Stretching Aldehyde, ketone, ester, carboxylic acid1400–1660 C=C stretch Stretching Aromatics1300–1400 Phenol O-H bending Bending 1080–1300 C-O stretching C-O-C groups and aryl ethers;
phenolic C-O associated with lignin Stretching
Bending Alkanes, alcohols, phenols, ethers, lipid
980–1080 C-O-C stretching; phosphines and phosphine oxides Stretching 550–800 Aromatic C-H bending Bending Aromatic
References: Qian et al. (2015), Ahmed et al. (2016), Işıtan et al. (2016), Qambrani et al. (2017).
Carboxyl LactoneO
OOH
O
EtherO
Carboxyl
Phenol
Chromene
OO
Pyrone
O
OHO
Figure 2: Representative surface functional groups on carbonaceous materials.
Brought to you by | University of Michigan-Flint
Authenticated
Download Date | 9/17/18 4:43 PM

B. Sajjadi et al.: Activation of biochar for energy and environment 5
to be 0.87 and 0.85 mmol e-/g, respectively, comparable to the capacities of a natural organic electron acceptor and donor such as humic acid (HA).
1.1.4 Surface area and porosity
Surface area and porosity as the major physical proper-ties directly affect the sorption capacity. Gas adsorption analysis is commonly used for porosity and surface area measurements. In this process, solid material is exposed to vapors or gases at a variety of conditions. Analysis of either the weight uptake or the sample volume provides information regarding the physical characteristics of the solid, including skeletal density, porosity, total pore volume, and pore size distribution. Nitrogen and carbon dioxide are generally employed as the probe molecules.
Surface area and porosity are influenced by BC feed-stock, pyrolysis temperature, and the activation process (Figure 3). The dehydration process due to water loss during pyrolysis generates pores of different sizes, which can be categorized into three levels, namely, nano (<0.9 nm), micro (<2 nm), and macro (>50 nm). Regard-less of their charges or polarity, BC with a small pore size cannot trap large sorbate. Larger pore size and the subsequent larger surface area are obtained at higher pyrolysis temperatures. In terms of the effect of feed-stock compositions, microporous structures have mainly been observed in BCs produced from cellulose-enriched biomass (e.g. husks), while biomass with a high quantity of lignin (e.g. bamboo and coconut shell) yields a pre-dominantly macroporous-structured BC. Moreover, the surface area and porosity of biosolid and manure BC are much smaller than those of plant BC, which is due to the lower C content of animal-waste-derived BCs compared with plant-derived BC (Qiu et al. 2014). Aside from this, BC origin significantly affects the surface morphology of BC, its subsequent application, and its efficiency. Scan-ning electron microscopy and electron dispersive X-ray analysis techniques provide us a direct way to observe the surface structure of BC (Feng et al. 2017a,b). Surface area,
aromatic carbonaceous skeleton, mineral compounds, surface charge, and various polar functional groups are the key physicochemical characteristics of BC. The appli-cation and efficiency of BC (soil amendment, contami-nant adsorption, CO
2 capture, etc.) depend on its origin
and thermal history; however, it is often limited by the functional groups. Hence, BC produced from pyrogenic processes is often activated to form functional groups on it or to increase its specific surface area, pore fraction, and pore size distribution. Physical and chemical activa-tion are the two common modification methods prior to use of BC. The objective of this review is to provide a com-prehensive, updated view on the physical activations of BC through gaseous modification by H
2O, CO
2, air, and O
3;
thermal modification by conventional heating and micro-wave irradiation; and the most recent methods involving ultrasound, plasma, and electrochemical modifications. Our review on the chemical activation and modification of BC will soon appear as a sequel.
2 Physical activation of BC
Physical activations of carbonaceous materials include a sequence of processes (Marsh and Reinoso 2006). The two most important steps in these processes are carboni-zation and activation. Partial carbonization (pyrolysis) of biomass and complete carbonization of BC are usually conducted in an inert gas atmosphere with temperatures between 600 and 900°C. In commercial and labora-tory production, raw BC is often produced in flue gas or oxygen-limited gas. Carbonization removes the noncar-bon species and produces a BC with a high percentage of carbon. Raw BC is then activated with the primary objec-tive of increasing the internal surface area via partial gasi-fication of the carbon skeleton. This objective is usually achieved by applying thermal treatment in a partial oxi-dizing medium (e.g. steam, CO
2, ozone, and limited air) or
an inert agent (He or N2). These methods are simple but
energy intensive since they normally need high tempera-ture. Hence, activation by microwave, ultrasound irradia-tion, plasma treatment, and electrochemical modification methods has recently emerged to improve BC characteris-tics such as adsorption capacity at a reasonable cost.
2.1 Gaseous activation
In physical activation using an oxidizing agent, also named as “gaseous activation,” BC is exposed to a desired
Figure 3: Growing of micropores and mesopores under steam activation process.
Brought to you by | University of Michigan-Flint
Authenticated
Download Date | 9/17/18 4:43 PM

6 B. Sajjadi et al.: Activation of biochar for energy and environment
volume of either steam, ozone, carbon dioxide, or air at temperatures usually above 700°C. These oxidizing agents penetrate into the internal structure of char and gasify the carbon atoms, which results in opening and widening of inaccessible pores (Dalai and Azargohar 2007). BCs acti-vated in such oxidizing environments not only have higher internal surface areas but also abundance of oxygen func-tional groups that often serve as active sites for adsorp-tion. The mechanisms of these activation methods are investigated in the next sections. Note that in all reactions, a free active carbon site and a surface complex are desig-nated by C
f and C(n), respectively, where n is the type of
complex.
∆ −
+ → + = ⋅0 1
f 2 2 rC H O C(O) H H 131 kj mol Chemisor ption (1)
→ + −
fC(O) CO C Scavenging of surface oxide by CO (2)
+ + + −
fCO C(O) CO g C Carbon gasific(g) ( ) ation
2 (3)
∆ −
+ → + = − ⋅0 1
2 2 2 rCO H O CO H H 41 kj mol Shift reaction (4)
f 2 2 2C 2H O CO 2H Carbon gasification by water+ + −→ (5)
∆ −
+ → = ⋅0 1
f 2 rC CO 2CO H 171 kj mol Carbon gasification by carbon dioxide (6)
∆ −
+ − ⋅→0 1
f 2 4 rC 2H CH H = 74.5 kj mol Carbon gasification by hydrogen (7)
∆ −
+ → + ⋅0 1
4 2 2 rCH H O CO 3H H =208 kj mol Carbon gasification by hydrogen (8)
2.1.1 Steam activation
Compared with the other activating gases, steam and carbon dioxide are the most commonly used ones for either pyroly-sis of biomass or physical activation of BC. It should be noted that steam and CO
2 can also be used during pyrolysis
of biomass. The presence of steam or CO2 in the pyrolysis of
biomass increases the rate of thermal conversion of biomass by means of two hierarchical steps: i) homogeneous and ii) heterogeneous. The homogeneous reaction between volatile organic compounds from pyrolysis and steam or CO
2 reduces
the amount of tar formed during pyrolysis, thereby increas-ing the production of syngas at high temperatures. The het-erogeneous reaction between the surface of the biomass and the gasifying agent increases the pyrolysis atmosphere and affects the chemical functional groups on BC surface. Also, this process can be applied to produce a high-quality bio-oil from fast pyrolysis of biomass (Lee et al. 2017).
In terms of activation of BC, steam or CO2 can be
injected either at the end of the pyrolysis process or a separated activation can be applied to the synthesized
BC. The smaller size of water molecule compared with CO2
facilitates the activation by using steam. Unlike air activa-tion, the reaction between steam and carbon is an endo-thermic process, which is easier to control and is better suited for gasifying carbons with high surface activity. Thus, BC in this process is normally imposed to super-heated steam (800–900°C) for 30 min to 3 h (Demiral et al. 2011, Girgis et al. 2011, Han et al. 2013). The overall reac-tion between carbon and steam includes chemisorption of water, carbon gasification, water shift, and gasification by steam, CO
2, and hydrogen. The generally accepted mech-
anism of BC activation using steam is described in reac-tions 1–8 (R1–R8) as below (Lussier et al. 1998):
The process starts with the exchange of oxygen from the water molecule to the carbon surface to create a surface oxide (R1), which may be devolved as CO (R2). CO may increase the rate of gasification by scavenging the surface oxide to produce CO
2 (R3). The process is fol-
lowed by a water-gas shift reaction in which water vapor is broken down to CO
2 and hydrogen gas (R4), which may
activate the surface by R6 or R7, respectively. The hetero-geneous and endothermic gas-solid reactions (R1 and R6) play a key role in noncondensable gas formation, while the equilibrium of gaseous homogeneous reactions (R4 and R8) defines the final composition of noncondensa-ble gases (Sattar et al. 2014, Ferreira et al. 2017). On the other hand, H
2 can inhibit carbon gasification. Huttinger
(Hermann and Hüttinger 1986) introduced three possible mechanisms by which hydrogen may inhibit the steam gasification:
f 2
1C H C(H) Dissociative hydrogen
2 adsorption+ ↔
(9)
+ +→2 f 2
C(O) H C H O Reverse oxygen exchange (10)
Brought to you by | University of Michigan-Flint
Authenticated
Download Date | 9/17/18 4:43 PM

B. Sajjadi et al.: Activation of biochar for energy and environment 7
+ ↔f 2 2 2
C H C(H) Scavenging of surface oxide by H (11)
Through the aforementioned reactions, the produced hydrogen reacts with the carbon surface and block and deactivate the active sites, yielding a surface hydrogen complex (R9–11) (Lussier et al. 1998). It should be noted that hydrogen adsorbed onto carbon surfaces requires temperatures up to 1500°C to completely desorb. More details about the hydrogen sorption on graphite at ele-vated temperatures are available in Redmond and Walker (1960).
The procedure of pore formation in steam activation is closely and mainly related to the water-gas shift reac-tions and the depletion of carbon (Rajapaksha et al. 2015). Steam activation also improves the porous structure of BC by removing the trapped products (e.g. some acids, alde-hydes, ketones, or particular constituents of the biomass; Santos et al. 2015) as a result of incomplete combustion during pyrolysis. Thus, unlike carbon dioxide, which forms and widens micropores, steam develops both micropores and mesopores and produces a wider range of pore size distribution (Dalai and Azargohar 2007, Feng et al. 2018).
Three parameters, including activation temperature (T), the mass ratio of steam to char (S/C), and activation time (t), play the key roles in steam activation. In general, the volume/radius of pores and surface area increase with steam temperature and treatment time, due to further removal of carbon atoms from the carbon surface (Table 4). The trend of increments is more significant at higher tem-peratures. It has also been reported that high-tempera-ture steam activation mostly compensates the negative effect of low-temperature pyrolysis on BC porosity and its surface area (Kołtowski et al. 2016). For instance, specific surface area (SSA) enhancement is up to almost 6 times its initial value at a lower temperature, while it reaches 76 times its value in the original BC at higher steam temper-ature. However, reduction in surface area has also been observed in some cases activated with low-temperature steam (Rajapaksha et al. 2015). The greatest reactivity of H
2O-activated BC was observed in activating temperatures
from 700 to 800°C as per Table 4 and Feng et al. (2017b,c). In such temperatures, the changes in BC structures (i.e. aromatic structure and surface oxygen-containing groups) and the alkali and alkaline earth metallic (AAEM) species in BC would contribute to the reactivity of H
2O-activated
BC (H2O-ABC). In short, the reactivity of BC depends on
the balance between the accumulation of AAEM species, which has catalytic effects, and the BC structure. Highly condensed/graphitized aromatic structures have lower activity. By increasing the temperature under H
2O
activation up to 700°C, the accumulation of AAEM species (even clusters) on the surface, along with the removal of carbonaceous matter, increases the BC reactivity. The highest content of AAEM along with the well-developed structures of BC is observed at 800°C. In temperatures between 700 and 800°C, the H radicals penetrate deep into the BC structure to initiate/enhance the ring conden-sation reactions; meanwhile, the AAEM species agglom-erate and enlarge their particle size. Reactivity then decreases with a further increase in activation tempera-ture under H
2O due to the effect of temperature on physi-
cal structure. At temperatures above 800–850°C during activation with H
2O, the small aromatic ring structures are
gradually consumed; hence, BC becomes more ordered so that less reactive structures are generated. It should also be noted that AAEM species improve O-containing groups at the beginning of gasification and they are gradually consumed as the carbon conversion increases, resulting in a decrease in reactivity. Although a higher temperature of steam (up to 800°C) demonstrates positive results on the physicochemical properties of BC, a longer duration of activation (>45–60 min depends on the BC origin) with steam imposes negative effects on those characteristics. In longer duration at high temperatures, which would allow faster and more gasification to occur, overactivation can happen. In such situation, pores are developed, while on the other hand, walls begin to collapse, and thus, pore sizes exceed the desired size for adsorption. In short, micropores are converted to mesopores and macropores and the volume fraction of micropores decreases (Fan et al. 2004). Longer duration also leads to a lower total surface area and higher ash content in BC. In terms of steam flow at low temperatures, no significant improvement on pore size distribution has been reported by a higher steam flow. The increase in steam flow yields more water vapor on the particles’ outer surface, resulting in mass loss and/or the creation of macropores. The reason is that the steam on the internal portions of the carbon is diluted by the inhib-iting factors produced by gasification (CO and H
2), thus
leaving the highest concentrations of pure steam on the external surface of the particle, which would lead to exter-nal gasification rather than internal. This is known as dilution theory (Martín-Gullón et al. 1996, Arriagada et al. 1997). However, an increase in the volume of mesopores with the steam flow is observed at higher temperatures. This observation was explained by Rodríguez-Reinoso et al. (1995) by noting that at higher temperatures, where the gas-water shift is less efficient, the inhibiting effect of hydrogen is less effective. Thus, an increase in the oxidant concentration would yield an increase in oxida-tion without a significant effect on hydrogen inhibition.
Brought to you by | University of Michigan-Flint
Authenticated
Download Date | 9/17/18 4:43 PM

8
B. S
ajjadi et al.: Activation of biochar for energy and environm
ent
Table 4: Effects of steam modification on physicochemical properties of biochar (numbers in parentheses refer to activated biochar).
Biochar source Pyrolysis
temperature (°C),
time (h)
Steam
temperature (°C),
time (h)
pH SBET
(m2/g) Smicro
(m2/g) Vmicro
(cm3 g − 1) Vmeso
(cm3 g − 1) VP (total)
(cm3 g − 1)
Ash Rp (nm) C H N O Reference
Burcucumber
plants
300, 2 300, 0.75 10.8 (11.1) 2.28 (0.85) – – – 0.006 (0.004) 13.5 (25.4) 3.6 (3.1) 66.0 (68.1) 5.55 (5.11) 5.08 (5.1) 23.1 (21.4) Rajapaksha et al. (2015)
Burcucumber
plants
700, 2 700, 0.75 12.32 (11.7) 2.31 (7.10) – – – 0.008 (0.038) 43.7 (70.7) 6.8 (8.4) 69.4 (50.5) 1.3 (1.7) 4.6 (2.5) 24.5 (44.9) Rajapaksha et al. (2015)
Wheat straw 650, 1.3 800, – 9.9 (8.8) 26.3 (246) 10.8 (140) 0.0046 (0.06) – 0.026 (0.159) – 1.95 (1.0) – – – – Kołtowski et al. (2016)
Coconut 650, 1.3 800, – 8 (7.2) 3.1 (627) 2.3 (472) 0.0087 (0.21) – 0.0009 (0.336) – 0.6 (0.85) – – – – Kołtowski et al. (2016)
Willow 650, 1.3 800, 1 9.1 (8.2) 11.4 (840) 4.5 (509) 0.0016 (0.22) – 0.006 (0.576) 7.7 (20.5) 1.08 (1.09 69.9 (56.9) 2.08 (0.59) 1.13 (0.37) 19.1 (21.7) Kołtowski et al. (2017a)
Broiler litter
manure
350, 1 800, 0.75 – 59 (335) 0 (276) 0 (0.134) – – – – 45.6 (30.4) 4 (1.14) 4.5 (1.85) – Uchimiya et al. (2010)
Broiler litter
manure
700, 1 800, 0.75 – 94 (335) 41 (278) 0.018 (0.136) – – – – 46 (29.1) 1.42 (1.14) 2.8 (1.72) – Uchimiya et al. (2010)
Broiler litter 700, – 800, 0.25–0.75
Flow: 1–5 ml/min
↑↓ with time
↑↓ with time
↓ with time
↓ with flow
↓ with time
↓ with flow
– – – – – – – – Lima and Marshall (2005)
Broiler cake 700, – 800, 0.25–1
Flow: 1–5 ml/min
↑↓ with time
↑↓ with time
↓ with time
↓ with flow
↓ with time
↓ with flow
– – – – – – – – Lima and Marshall (2005)
Rice husk 700, 2 700, 0.75 9.9 (9.5) 52 (223) – – – 0.04 (0.08) 39.2 (45.6) 4.8 (14.9) – – – Herath et al. (2016)
Tea waste 300, 2 300, 0.75 7.9 (8.6) 2.3 (1.5) – – – 0.006 (0.004) 5.7 (6.4) 1.14↑ 70.0 (71.5) 5.2 (4.75) 5 (5.5) 19.6 (18.2) Rajapaksha et al. (2014)
Tea waste 700, 2 700, 0.75 11 (10.5) 342 (576) – – – 0.022 (0.109) 10.9 (16.7) 1.08↑ 85 (82.4) 1.98 (2.06) 3.92 (3.89) 8.9 (11.6) Rajapaksha et al. (2014)
Giant Miscanthus 500, 1 800, – – 181 (322) – – – – – – 80.9 (82.1) 2.8 (2.67) 0.29 (0.31) 12.2 (11.0) Shim et al. (2015)
Porphyra tenera 500, 1 700, 1 – ND (22) – – – ND (0.01) 21.3 (30.7) ND (12.9) 74.7 (89) 3.0 (1.8) 9.1 (6.6) 9.0 (1.3) Park et al. (2016)
Enteromorpha
compressa
500, 1 700, 1 – ND (52) – – – ND (0.021) 43.3 (60) ND (1.61) 57.6 (79.8) 2.6 (1.6) 5.6 (5.2) 22.4 (0.4) Kim et al. (2016)
Oat hulls 500, 1.5S 450, 2 – 4.8 (625) – ↓ ↑ – 0 (39.7)a – – – – – Fan et al. (2004)
Corn stover 500, 1.5S 450, 1
450, 2
– 5.8 (442)
5.8 (311)
– ↓ ↑ – 0 (30.5)a
0 (40.2)a
– – – – – Fan et al. (2004)
Olive bagasse 500, – 900, 0.75
900, 1
– 0.009 (1106)
0.009 (915)
0.006 (659)
0.006 (608)
(0.40)
(0.37)
(0.2055)
(0.1011)
0.0033 (0.61)
0.0033 (0.47)
– – – – – – Demiral et al. (2011)
Switchgrass 500, 1 800, 0.75 – 3.62 (167.8) ND (92.3) ND (0.145) 0.022 (15.41) – – 86.5 (15.4) – – – – Han et al. (2013)
Hardwood 500, 1 800, 0.75 – 119 (343.9) 67 (318.4) 0.03 (0.0151) 0.046 (15.49) – – 17.6 (15.5) – – – – Han et al. (2013)
Softwood 500, 1 800, 0.75 – 94.7 (383.7) 63.6 (340) 0.033 (0.196) 0.023 (15.42) – – 15.5 (15.42) – – – – Han et al. (2013)
Peanut hulls 500, 2 850, 2 7.65 (9) 162 (600) 74 (452) 0.029 (0.181) 0.094 (0.188) 0.158 (0.427) 7.9 (11.6) 25 (14) Å – – – – Girgis et al. (2011)
Cottonseed hulls 500, 2 850, 2 7.3 (9.12) 132 (226) 7 (200) 0.008 (0.079) 0.081 (0.084) 0.120 (0.187) 7.3 (10.4) 18 (46) Å – – – – Girgis et al. (2011)
Broad Bean hulls 500, 2 850, 2 7.25 (8.76) 105 (225) 29 (107) 0.012 (0.036) 0.084 (0.091) 0.132 (0.156) 9.6 (15.2) 25 (14) Å – – – – Girgis et al. (2011)
Soyabean hulls 500, 2 850, 2 7.1 (8.65) 121 (208) 21 (137) 0.023 (0.061) 0.067 (0.067) 0.112 (0.163) 6.7 (9.5) 18 (16) Å – – – – Girgis et al. (2011)
Lupine hulls 500, 2 850, 2 7.15 (8.9) 51 (216) 48 (105) 0.045 (0.048) 0.054 (0.103) 0.072 (0.187) 6.6 (10.9) 28 (17) Å – – – – Girgis et al. (2011)
Sunflower hulls 500, 2 850, 2 7.35 (8.75) 118 (223) 7 (117) 0.008 (0.054) 0.093 (0.093) 0.134 (0.174) 9.7 (11.5) 23 (16) Å – – – – Girgis et al. (2011)
Rice husk 700, 3 700, 0.75 9.9 (10.1) 236.7 (251.5) – – – 0.05 (0.08) 39.2 (45.6) 5.29 (4.86) 50.6 (–) 1.29 (–) 0.65 (–) 7.67 (–) Mayakaduwa et al. (2016)
In all tables, the values before and after activation are provided outside and inside of parenthesis, respectively. Å, Angstrom.aBurn-off.
Bro
ught to
you b
y | U
niv
ers
ity o
f Mic
hig
an-F
lint
Auth
entic
ate
d
Dow
nlo
ad D
ate
| 9/1
7/1
8 4
:43 P
M

B. Sajjadi et al.: Activation of biochar for energy and environment 9
Thus, it can be concluded that the steam flow has no effect at lower temperatures, while the rate of steam flow yields an increase in gasification at higher temperatures. More details about the exact effect of temperature and duration are summarized in Table 4.
As an oxidizing agent, steam introduces oxygen-con-taining functional groups onto the surface of BC. In most cases, phenolic groups and carboxylic groups increase after steam activation, increasing BC hydrophilicity subsequently (Herath et al. 2016, Feng et al. 2017c). A reduction in pH after steam activation suggests the introduction of a more acidic group to the surface of BC. However, high-temperature steam activation (especially after a low-temperature pyrol-ysis) causes a severe loss of the three categories of surface functional groups: phenolic, carboxylic, and lactonic (Han et al. 2013, Shim et al. 2015, Mayakaduwa et al. 2016). Shim et al. (2015) suggested that the functional groups may have partially been degraded, as indicated by the decrease in the polarity index of BC (produced from miscanthus sac-chariflorus) during the thermal activation using steam; however, they are not likely completely eliminated after this process. Fu et al. (2013) demonstrated that the intensi-ties of OH (stretching vibration of hydroxyl at 3200–3500), C-O (stretching at 1043), and C=O (stretching vibration of quinoid structure at 1636) peaks of carbonized black liquor lignin decreased likely due to cracking of the functional groups. Generally, and as expected according to R1–R7, steam-activated BCs contain fewer quantities of carbon, hydrogen, and oxygen in their structure compared with original BCs. Exceptions are mainly those BCs synthesized at low temperatures (300–500°C) (Rajapaksha et al. 2015, Kim et al. 2016, Park et al. 2016). The ratios of C, H, and O after steam activation depend on the process temperature. It can be summarized that the quantity of oxygen functional groups increases with treatment time at lower tempera-tures, while an opposite trend has been observed at higher temperatures. This is attributed to the degradation of func-tional groups and the limited replacement of new functional groups at higher temperatures (Arriagada et al. 1997).
The sorption capacity of BCs activated under super-heated steam usually increases due to an increase in surface area, micropore volume, and oxygen functional groups; hence, H
2O-ABC can efficiently remove con-
taminants from soil and water (Table 5). As an example, in terms of heavy metals, it was reported that the steam amendment of carbonaceous matters, regardless of pyrolysis conditions and biomass source, enhanced the immobilization of Cu(II), Ni(II), and Cd(II) in alkaline soil (Uchimiya et al. 2010). The improved sorption capacity of BC to Cu ions was also demonstrated by Shim et al. (2015). However, the success of steam-activated BC to immobilize
Cu in soils or removing it from water depends on the con-ditions used. Longer activation durations or greater steam flow may reduce the Cu sorption capacity of BC. By ana-lyzing four different activation rates (ranging from 15 to 60 min) along with different steam flow rates (ranging from 1 to 5 ml/min), Lima and Marshall (2005) demon-strated that the greatest Cu sorption was obtained when the BC was activated under a specific steam condition (3 ml/min, for 45 min). In order to obtain a higher adsorp-tion capacity, some authors have used chemical activat-ing agents in parallel with the steam flow. For instance, Ippolito et al. (2012) showed the potential of combined KOH- and steam-activated pecan shell BC in the adsorp-tion of Cu ions from wastewaters at pH 6.
In recent years, great attention has also been dedi-cated to the behavior and life cycle of pharmaceutical com-pounds, most of which are, by nature, biologically active and hydrophilic, in order that the human body can take them up easily. Moreover, these compounds are persistent and are not degraded easily. Sulfamethazine and raniti-dine hydrochloride (RH) are the two examples of pharma-ceuticals compounds. Steam-activated BC has shown a significant improvement in adsorption of such compounds due to increased polarity and hydrophilicity. The sorption capacity of sulfamethazine on steam-activated BC showed a great improvement (55%) compared with the nonacti-vated BC (Rajapaksha et al. 2015), which may be attrib-uted to the enhanced aromaticity and electronegativity of BC after activation. Steam-activated tea waste BC was also successfully used as an adsorbent of sulfamethaz-ine from aqueous solution with the maximum capacity of 33.81 mg/g at pH 3, while the maximum capacities of acti-vated BC under limited oxygen and N
2 were 30.06 mg/g and
7.12 mg/g, respectively (Rajapaksha et al. 2014). Mondal et al. (2016) reported the great sorption of RH (12 mg/g) from aqueous solution by using steam-activated BC. Apart from heavy metals and pharmaceutical compounds, the adsorption capacity of H
2O-ABC has been tested on pesti-
cides too (Yu et al. 2009). It is concluded that steam activa-tion of BC is capable of escalating its adsorption capacity by almost 60%. However, the final results depend on the operating conditions to a large extent. Generally, a steam flow rate between 3 and 5 ml/min with a temperature of between 700 and 800°C for 45–60 min has resulted in the highest adsorption capacity improvement.
2.1.2 CO2 activation
As already stated, CO2 can alternatively be used during
either the pyrolysis of biomass or the activation of BC.
Brought to you by | University of Michigan-Flint
Authenticated
Download Date | 9/17/18 4:43 PM
10 B. Sajjadi et al.: Activation of biochar for energy and environment
Elemental analysis showed that BC pyrolyzed under CO2
flow contained more O and N than under N2, while that
produced under N2 contained more C, H, and S (as per
references collected in Table 6). Lower H/C ratio of BC pyrolyzed under CO
2 (PB-CO
2) means a higher degree
of carbonization (highly condensed structures), and
higher O/C ratios of PB-CO2 indicate that it might be more
hydrophilic than BC pyrolyzed under nitrogen (PB-N2),
as observed in others (Lee et al. 2017). It has also been reported that BC produced under CO
2 contained a much
higher content of alkali metals (including Na, K, and Ca) than those pyrolyzed under N
2 atmosphere, especially at
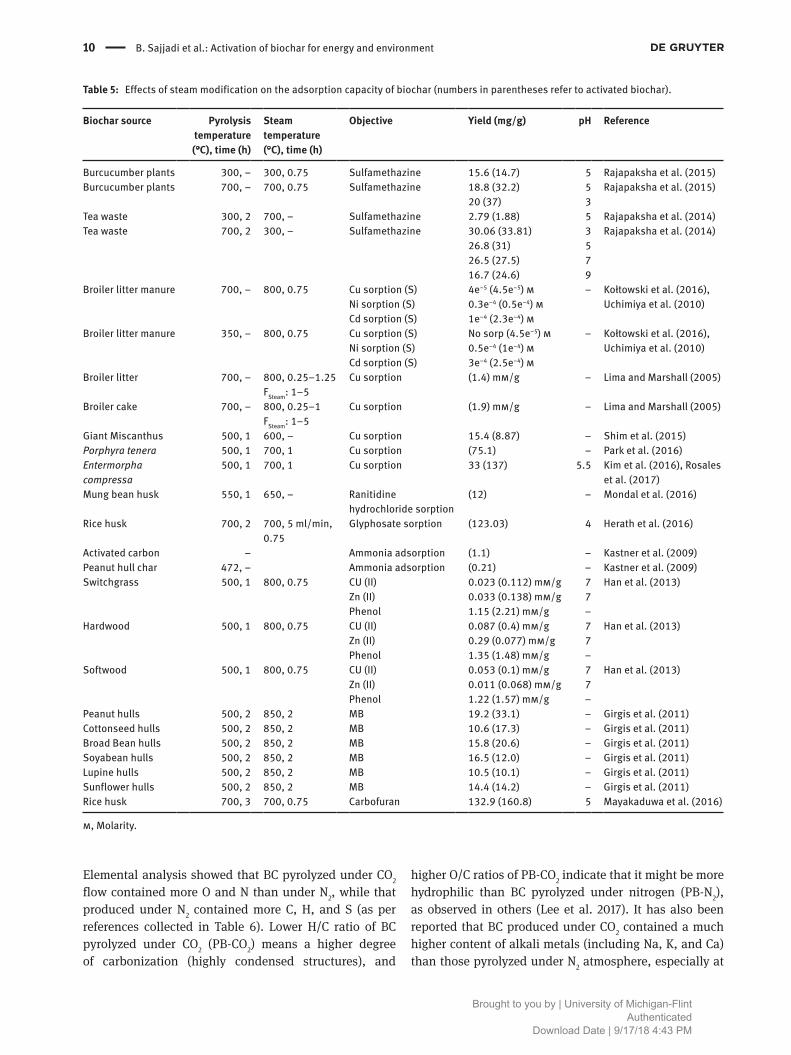
Table 5: Effects of steam modification on the adsorption capacity of biochar (numbers in parentheses refer to activated biochar).
Biochar source Pyrolysis
temperature
(°C), time (h)
Steam
temperature
(°C), time (h)
Objective Yield (mg/g) pH Reference
Burcucumber plants 300, – 300, 0.75 Sulfamethazine 15.6 (14.7) 5 Rajapaksha et al. (2015)Burcucumber plants 700, – 700, 0.75 Sulfamethazine 18.8 (32.2)
20 (37)53
Rajapaksha et al. (2015)
Tea waste 300, 2 700, – Sulfamethazine 2.79 (1.88) 5 Rajapaksha et al. (2014)Tea waste 700, 2 300, – Sulfamethazine 30.06 (33.81)
26.8 (31)26.5 (27.5)16.7 (24.6)
3579
Rajapaksha et al. (2014)
Broiler litter manure 700, – 800, 0.75 Cu sorption (S)Ni sorption (S)Cd sorption (S)
4e−5 (4.5e−5) m0.3e−4 (0.5e−4) m1e−4 (2.3e−4) m
– Kołtowski et al. (2016), Uchimiya et al. (2010)
Broiler litter manure 350, – 800, 0.75 Cu sorption (S)Ni sorption (S)Cd sorption (S)
No sorp (4.5e−5) m0.5e−4 (1e−4) m3e−4 (2.5e−4) m
– Kołtowski et al. (2016), Uchimiya et al. (2010)
Broiler litter 700, – 800, 0.25–1.25FSteam: 1–5
Cu sorption (1.4) mm/g – Lima and Marshall (2005)
Broiler cake 700, – 800, 0.25–1FSteam: 1–5
Cu sorption (1.9) mm/g – Lima and Marshall (2005)
Giant Miscanthus 500, 1 600, – Cu sorption 15.4 (8.87) – Shim et al. (2015)Porphyra tenera 500, 1 700, 1 Cu sorption (75.1) – Park et al. (2016)Entermorpha
compressa
500, 1 700, 1 Cu sorption 33 (137) 5.5 Kim et al. (2016), Rosales et al. (2017)
Mung bean husk 550, 1 650, – Ranitidine hydrochloride sorption
(12) – Mondal et al. (2016)
Rice husk 700, 2 700, 5 ml/min, 0.75
Glyphosate sorption (123.03) 4 Herath et al. (2016)
Activated carbon – Ammonia adsorption (1.1) – Kastner et al. (2009)Peanut hull char 472, – Ammonia adsorption (0.21) – Kastner et al. (2009)Switchgrass 500, 1 800, 0.75 CU (II)
Zn (II)Phenol
0.023 (0.112) mm/g0.033 (0.138) mm/g1.15 (2.21) mm/g
77–
Han et al. (2013)
Hardwood 500, 1 800, 0.75 CU (II)Zn (II)Phenol
0.087 (0.4) mm/g0.29 (0.077) mm/g1.35 (1.48) mm/g
77–
Han et al. (2013)
Softwood 500, 1 800, 0.75 CU (II)Zn (II)Phenol
0.053 (0.1) mm/g0.011 (0.068) mm/g1.22 (1.57) mm/g
77–
Han et al. (2013)
Peanut hulls 500, 2 850, 2 MB 19.2 (33.1) – Girgis et al. (2011)Cottonseed hulls 500, 2 850, 2 MB 10.6 (17.3) – Girgis et al. (2011)Broad Bean hulls 500, 2 850, 2 MB 15.8 (20.6) – Girgis et al. (2011)Soyabean hulls 500, 2 850, 2 MB 16.5 (12.0) – Girgis et al. (2011)Lupine hulls 500, 2 850, 2 MB 10.5 (10.1) – Girgis et al. (2011)Sunflower hulls 500, 2 850, 2 MB 14.4 (14.2) – Girgis et al. (2011)Rice husk 700, 3 700, 0.75 Carbofuran 132.9 (160.8) 5 Mayakaduwa et al. (2016)
m, Molarity.
Brought to you by | University of Michigan-Flint
Authenticated
Download Date | 9/17/18 4:43 PM

B. S
ajjadi et al.: Activation of biochar for energy and environm
ent
11
Table 6: Effects of CO2 modification on the physicochemical properties of biochar (numbers in parentheses refer to activated biochar).
Biochar source Pyrolysis
temperature (°C),
time (h)
CO2
temperature (°C),
time (h)
Burn-off Ash SBET
(m2/g) Smicro
(m2/g) Vmicro
(cm3/g) Vmeso
(cm3/g) VP (cm3/g) R
p (nm) C (%) H (%) N (%) O (%) Reference
Oak 500, – 800, 1
900, 1
27
67.1
3.7 (7.1)
3.7 (12.1)
107 (786)
107 (807)
– 0.046 (0.328)
0.046 (0.335)
0.004 (0.0086)
0.004 (0.0099)
0.050 (0.337)
0.05 (0.01)
– 80.9 (86.1)
80.9 (85.1)
2.9 (0.6)
2.9 (0.4)
0.5 (0.6)
0.5 (1.1)
12 (5.6)
12 (1.3)
Jung and Kim (2014)
Peat CO2-pyrolysis 650, – – 73.5 (74.9) 85.43 (93.04) – – – – – 25.5 (22.9) 0.65 (0.52) 0.57 (1.14) 4.13 (4.38 Lee et al. (2017)
Aspen wood
H3PO4, 500
800, – 800, 0.3
800, 1.0
800, 1.8
800, 3.6
– – 440 (540)
440 (690)
440 (750)
440 (910)
– 0.17 (0.18)
0.17 (0.16)
0.17 (0.22)
0.17 (0.30)
0.02 (0.09)a
0.02 (0.22)a
0.02 (0.21)a
0.02 (0.19)a
– – – – – – Veksha et al. (2016)
Rice husk 15% V H2O, 700
29% V CO2, 700
–
–
– – – – – – – – 86.3 (84.14)
86.3 (85.2)
– 0.51 (0.58)
0.51 (0.5)
12.5 (14.3)
12.5 (13.6)
Feng et al. (2017a)
Willow tree 700, – CO2, 800, –
H2O, 800, –
MW, 800, –
– – 11.4 (512)
11.4 (840)
11.4 (443)
4.5 (380)
4.5 (509)
4.5 (259)
0.0016 (0.169)
0.0016 (0.224)
0.0016 (0.114)
– 0.006 (0.276)
0.006 (0.576)
0.006 (0.242)
1.08 (1.08)
1.08 (1.37)
1.08 (1.1)
– – – Kołtowski et al.
(2017b)
Oak 500, – 700, 1
700, 2
800, 1
800, 2
31.8
41.8
43.0
51.4
– 92 (642)
92 (644)
92 (845)
92 (985)
– – (0.27)
– (0.24)
– (0.32)
– (0.38)
– 0.146 (0.41)
0.146 (0.40)
0.146 (0.60)
0.146 (0.64)
– 70.8 (NM) 3.16 (NM) – 13.2 (NM) Zhang et al. (2004)
Corn hulls 500, – 700, 1
700, 2
800, 1
800, 2
32.3
37.0
44.4
45.2
– 48 (977)
48 (902)
48 (1010)
48 (975)
– – (0.33)
– (0.33)
– (0.43)
– (0.38)
– 0.058 (0.89)
0.058 (0.82)
0.058 (0.83)
0.058 (0.68)
– 70.3 (NM) 6.97 (NM) – 16.7 (NM) Zhang et al. (2004)
Corn stover 500, – 700, 1
700, 2
800, 1
800, 2
41.5
41.7
42.6
50.2
– 38 (660)
38 (432)
38 (712)
38 (616)
– – (0.38)
– (0.18)
– (0.28)
– (0.23)
– 0.054 (0.48)
0.054 (0.33)
0.054 (0.54)
0.054 (0.42)
– 59.4 (NM) 3.06 (NM) – 16.9 (NM) Zhang et al. (2004)
Aspen wood 600, 0.5 780, 1.66 0 (76) – 480 (886) – 0.19 (0.29) 0.01 (0.16) – – – – – Veksha et al. (2015)
Oil palm shell 400–800, 25 min
Under MW
600, 450 W – – 23 (151) – 0.009 (0.077) 0.0057 (0.012) 0.015 (0.089) – – – – – Abioye and Ani (2015)
Willow tree 700, low O2 < 2% CO2, 800, 1
H2O, 800, 1
MW, 200, –
– 7.72 (11.3)
7.72 (20.5)
7.72 (15.8)
11.4 (512)
11.4 (840.6)
11.4 (443)
4.5 (380)
4.5 (509)
4.5 (258.6)
0.002 (0.169)
0.002 (0.225)
0.002 (0.114)
– 0.002 (0.276)
0.002 (0.577)
0.002 (0.242)
– 69.9 (70.8)
69.9 (56.8)
69.9 (73.9)
2.08 (0.7)
2.08 (0.59)
2.08 (0.95)
1.13 (0.8)
1.13 (0.4)
1.13 (0.7)
19.1 (16.4)
19.1 (21.7)
19.1 (8.7)
Kołtowski et al.
(2017a)
Rice straw 700–900, 1, N2 700, 1
800, 1
800, 3
800, 6
900, 1
–
34.2
–
73.3
280 (490)
550 (650)
680 (790) 530
(780)
430 (480)
– – – – 21.3 Å
22.5 Å
23.9 Å
26.2 Å
26.9 Å
–
53.8 (–)
–
73.9 (–)
–
–
0.5 (–)
–
0.2 (–)
–
–
0.6 (–)
–
0.8 (–)
–
–
45.1 (–)
–
73.9 (–)
–
Yun et al. (2001)
Coconut shell 600, 2, N2 750, 4
900, 4
950, 4
– 186 (613)
186 (1391)
186 (1323)
– 0.043 (0.307)
0.043 (0.73)
0.043 (0.671)
– 0.268 (0.44)
0.268 (0.84)
0.268 (0.88)
– – – – – Guo et al. (2009)
Sewage sludge – 750, – 17 66.1 13 (62) – – – 0.01 (0.03) – 24.4 (–) 1 (–) 2.7 (–) 14.9 (–) Ros et al. (2006)
Olive stone 850, – 850, 1 – – 349 (677) – 0.168 (0.29) – 0.188 (0.34) – – – – – El-Sheikh et al. (2004)
Pistachio-nut
shells
300, 2
600, 2
900, 2
900, 0.5 – 1.1 (1.9)
1.2 (2.4)
2.0 (3.9)
– (361.8)
– (699.1)
– (748.8)
– (187.1)
– (452.0)
– (457.8)
– (0.086)
– (0.211)
– (0.213)
– – (0.202)
– (0.408)
– (0.451)
– – – – – Lua et al. (2004)
Pistachio-nut
shells
500, 1
500, 2
500, 3
900, 0.5 – –
1.1 (2.1)
–
– (637.5)
– (778.1)
– (688.3)
– (431.3)
– (476.9)
– (450.6)
– (0.201)
– (0.222)
– (0.219)
– – (0.367)
– (0.466)
– (0.39)
– – – – – Lua et al. (2004)
Bro
ught to
you b
y | U
niv
ers
ity o
f Mic
hig
an-F
lint
Auth
entic
ate
d
Dow
nlo
ad D
ate
| 9/1
7/1
8 4
:43 P
M

12 B. Sajjadi et al.: Activation of biochar for energy and environment
the higher temperatures (700°C) (Tian et al. 2017). Hence, CO
2-assisted pyrolysis process can potentially be used to
control the properties of BC for various applications of adsorption and soil amendment.
The mechanism of char (C) activation with CO2
involves the Boudouard reaction (C + CO2 ↔ 2CO). In this
process, CO2 undergoes dissociative chemisorption on the
carbon surface to form a surface oxide and carbon mon-oxide as shown in R12. The surface oxide, C(O), is sub-sequently desorbed from the surface, further developing the pore structure (R13). CO in the gaseous product can also be adsorbed on the carbon active site and retards the gasification (R14).
+ → +
f 2C CO C(O) CO (12)
→C(O) CO (13)
→
fC +CO C(CO) (14)
Thermodynamically, Boudouard reaction is endo-thermic, and due to its large positive enthalpy (∼172 kJ/mol at 298 K), the equilibrium of Boudouard reac-tion does not favor CO production until temperatures >700°C. Thus, elevated temperatures promote the forward reaction, removing carbon atoms in activated carbon, which results in the increase in burn-off (Jung and Kim 2014). Moreover, similar to steam activation, an increase in the flow of carbon dioxide causes a higher concentration gradient, which compels the oxidant to enter the pores at a faster rate (i.e. bulk diffusion), enhancing the gasification yield. Generally, there are two similarities between steam and CO
2 activation. I)
CO formed by Boudouard reaction may remain in the vicinity of the carbon surface to retard further reac-tions. II) The presence of oxygen in CO
2 increases the
formation of O-containing functional groups on the BC surface (Feng et al. 2016). However, more O-containing functional groups are formed on the BC surface by H
2O
than CO2, and hence, H
2O-activated char is usually more
active than CO2-activated char (Feng et al. 2016). This
may be attributed to the dimensions of water molecules, which is smaller than CO
2 and therefore facilitates the
diffusion of steam into the porous network, inducing a faster reaction rate (Dalai and Azargohar 2007). In activation with CO
2, eliminations of O-H (phenolic at
around 3620 cm−1) and C=O (at 1700–1600 cm−1) (Jung and Kim 2014) are normally observed, while a loss of carboxylic (COOH) and an increase in the content of phenolic functional group have been reported during activation with steam (Kołtowski et al. 2017a). This Ta
ble
7:
Effe
cts
of o
zone
mod
ific
atio
n on
the
phys
icoc
hem
ical
pro
pert
ies
of b
ioch
ar (n
umbe
rs in
par
enth
eses
refe
r to
acti
vate
d bi
ocha
r).
Bio
cha
r
sou
rce
P
yro
lysi
s
tem
pe
ratu
re
(°C
), t
ime
(h
) O
zon
e
tem
pe
ratu
re
(°C
), t
ime
(h
)
B
urn
-off
p
H
SB
ET (
m2/g
) S
mic
ro (
m2/g
)
Vm
icro
(cm
3/g
) V
me
so (
cm3/g
) V
P (
cm3/g
) R
p (
nm
) C
(%
) H
(%
) N
(%
) O
(%
) R
efe
ren
ce
Gra
pe
seed
** 8
00, f
lash
250
, 227
5, 2
50
%75
%
–
47 (9
00)
47 (1
200)
–
–
0.03
(0.4
)0.
03 (0
.5)
0.00
7 (0
.04)
0.00
7 (0
.06)
1.
37 (1
.7)
1.37
(1.9
) –
–
–
–
Jim
enez
-Cor
dero
et a
l. (2
015)
Pean
ut h
ull
500
/0.6
7 S
team
/Ozo
ne23
, 0.5
–
5.9
(4.6
) 1
(506
) –
–
–
–
–
–
–
–
–
Kas
tner
et a
l. (2
009)
Filt
raso
rb
400
Com
mer
cial
– 2
5, 0
.16
25, 0
.33
25, 2
–
8.
8 (6
)8.
8 (5
.5)
8.8
(3.3
) 100
0 (1
023)
1000
(943
)10
00 (6
32) 5
3.7
(87)
Ex
53.7
(74.
8)53
.7 (6
4.4)
–
0.4
74 (0
.472
)0.
474
(0.4
37)
0.47
4 (0
.297
) 0.0
19 (0
.031
)0.
019
(0.0
27)
0.01
9 (0
.023
) –
–
–
–
–
Val
dés
et a
l. (2
002)
,Va
ldes
et a
l. (2
003)
Act
ivat
ed
carb
on U
nkno
wn
NM
-1N
M-2
NM
-4
–
–
120
0 (1
102)
1200
(103
8)12
00 (8
17) –
0.4
81 (0
.435
)0.
481
(0.4
03)
0.48
1 (0
.324
) 0.4
66 (0
.423
)0.
466
(0.3
90)
0.46
6 (0
.310
) –
–
–
–
–
–
Par
k an
d Jin
(200
5)
Carb
on b
lack
– A
mbi
ent T
–
–
38
.5 (3
6.7)
–
–
–
–
–
–
–
–
– C
hen
et a
l. (2
003)
Carb
on b
lack
– A
mbi
ent T
, ai
r oxi
dize
d
–
–
38.5
(234
) –
–
–
–
–
–
–
–
–
Che
n et
al.
(200
3)
Act
ivat
ed
carb
on –
– 0
.5
–
–
783
(851
) 67
7 (7
27)
0.
367
(0.4
) 0.
32 (0
.344
) –
14.
6 (1
4.67
) 86
.5 (8
7.2)
1.6
9 (1
.6)
0.22
(0.2
) 10
.9 (1
1.4)
Chi
ang
et a
l. (2
002a
)
Cycl
ic a
ctiv
atio
n (1
0 ro
unds
) wit
h oz
one.
NM
, Not
men
tion
ed; E
x, e
xter
nal s
urfa
ce a
rea.
Brought to you by | University of Michigan-Flint
Authenticated
Download Date | 9/17/18 4:43 PM

B. Sajjadi et al.: Activation of biochar for energy and environment 13
point has also been observed in reforming of model tar compounds using thermal cracking reactions. The more O-containing groups on the char surface activated by steam compared with CO
2-activated one, the more acidic
centers are formed. The acidic centers can be combined with polyaromatic rings containing negatively charged electrons and activate the thermal cracking reaction (Feng et al. 2016). As another example, CO
2-activated
BCs, especially those produced under higher pyrolysis temperature (800°C rather than 700°C), have demon-strated weaker results in adsorption of organic com-pounds compared to steam-activated ones (Toles et al. 2000). However, the effect of surface area should not be ignored. Consistently higher surface area for steam-activated BC compared with CO
2-activated samples (e.g.
almond shell-based BC) has been observed in some pub-lished results when the same pyrolysis conditions, acti-vation times, and temperatures had been applied (Toles et al. 2000).
Therefore, although not as significant as steam activa-tion, CO
2 plays a particular role in promoting the surface
area and improving the pore structure of BC in tempera-tures between 700 and 900°C. As an instance, Jung and Kim (2014) applied CO
2 activation under 800°C in three
different conditions, including pyrolysis under N2 followed
by CO2 activation without cooling in between, the same
procedure with a cooling step in between, and both pyroly-sis and activation under CO
2. The authors demonstrated
that all three methods significantly increased the surface area from 249 to almost 720 m2/g and porosity from 0.11 to ∼0.33. Surprisingly, the increase in temperature from 800 to 900°C for 60 min (W/O cooling) remarkably increased these values to 1126 m2/g and 0.49 cm3/g. As another
example, enhancing activation temperature to 900°C was favorable to the development of Brunauer–Emmett–Teller (BET) surface area (S
BET) and micropore volume of
BC derived from coconut shells. A further increase in tem-perature widened the pores and increased the mesopores. In the same way, very long activation time (>4 h) would result in collapsing of pores, and a high flow rate of CO
2
(>400 cm3/min) would lead carbon to burnout and was unfavorable to the formation of pores (Guo et al. 2009).
Unlike steam activation, which yields a wide distribu-tion of micropores and mesopores, activation with carbon dioxide mainly develops micropores. Generally, having a wide pore size distribution is preferred as mesopores and macropores are responsible for the efficient removal of large molecules. Moreover, larger pore sizes act as “road-ways” by which the target molecule can travel to its final adsorption site. But for adsorption of smaller molecules, micropores (high surface areas) are more important (Valderrama et al. 2008). Therefore, the development of a high quantity of micropores by burning of carbon matter in the BC and the simultaneous creation of new microporous structures in CO
2-activated BCs (Kołtowski
et al. 2017b) make them a better absorbent for smaller molecules. Kołtowski et al. (2017b) compared the activa-tion of BC using CO
2, steam, and microwave irradiation.
They concluded that, although steam activation resulted in a higher surface area, the most effective adsorbents for reducing the concentration of 16 freely dissolved polyaro-matic hydrocarbons (PAHs) were those activated under CO
2
rather than steam or microwave. This could be attributed to the higher concentration of micropores with respect to an SSA (74%) and the larger micropore volume with respect to the total pore volume (61%) in samples activated
Table 8: Effects of ozone modification on the adsorption capacity of biochar (numbers in parenthesis refer to activated biochar).
Biochar source
(raw biochar)
Pyrolysis
temperature (°C)
Ozone temperature
(°C), time (h)
Objective Adsorption
(mg/g)
Capacity
(mg/g)
Reference
Palm oil shell 500 23, 0.5 Ammonia adsorption – 1.25 Kastner et al. (2009)Peanut hull 500
500 23, 0.5
23, 1 Ammonia adsorption – 0.11
0.15 Kastner et al. (2009)
Peanut hull 472/Steam 23, 0.5 Ammonia adsorption – 0.17 Kastner et al. (2009)Filtrasorb 400 –
– 25, 0.16
25, 0.3325, 2
MB – 98.8 (92.4)98.8 (91.3)98.8 (77.3)
Valdés et al. (2002)
Filtrasorb 400 Commercial–
25, 0.5 2-mercaptobenzothiazole 250 170 Valdes et al. (2003)
Carbon black – Ambient T Surfactant (Darex II) 30a 5.5a Chen et al. (2003)Carbon black – Ambient T Surfactant (SDS) 25a 4a Chen et al. (2003)Carbon black – Ambient T Surfactant (Tergitol) 32a 4a Chen et al. (2003)
aUnit: 6 × ml surfactant solution/g-carbon.
Brought to you by | University of Michigan-Flint
Authenticated
Download Date | 9/17/18 4:43 PM

14 B. Sajjadi et al.: Activation of biochar for energy and environment
under CO2 atmosphere (Kołtowski et al. 2017b). As with
gaseous-activation conditions, the nature of the BC plays a key role in activation under CO
2 atmosphere. According
to the literature, CO2 activation has demonstrated better
results for those BCs containing higher quantities of C (lower H/C). Zhang et al. performed CO
2 activation on BCs
produced from three different agricultural and forest resi-dues. Among them, BCs produced from oak chips and corn hulls gave the highest C contents (70%) and maximum BET surface areas (ranging from 640 to 1010 m2/g), while corn-stover-produced BC had lower C content (59%) and lower BET surface area values of 400–700 m2/g (Zhang et al. 2004). CO
2 activation was ineffective for an efficient
porosity development in sewage-sludge-based BC con-taining 31.4% of C (H/C = 15%) (Ros et al. 2006). Longer activation times with CO
2 at higher temperatures have
also demonstrated a better effect on increasing the BET surface area and micropore and mesopore volumes of the BCs with lower H/C (Veksha et al. 2016). It has also been reported that gasification agents such as H
2O and CO
2
affect the aromatic rings of BC as well. During this process, the intermediate atoms (from the steam-char or CO
2-char
reactions) penetrate into the char matrix, contributing to the transformation of small aromatic ring systems to large ring systems. Therefore, some small aromatic rings in char are removed or consumed, while some large rings become larger. According to Song et al. (2015), the gasification agent has showed a larger effect on the reforming of large aromatic ring systems compared with smaller and isolated aromatics. However, Feng et al. (2018) could catalytically increase the reforming of both large and small aromatic rings. As per their results, the effect of steam was larger than that of CO
2 on both single and multiple rings.
Toles et al. (2000) estimated the cost of carbon-di-oxide-activated and steam-activated almond shell carbons for a manufacturing facility with an input of 14,000 kg of shells per day and a carbon yield of 16% for both processes. For such a process, the authors estimated an electricity usage of 7501 and 4075 (KWH/day) for carbon-dioxide- and steam-activation processes, respectively. Moreover, the cost differential between water and carbon
dioxide gas is the other factor that makes steam activation considerably cheaper than carbon dioxide activation.
2.1.3 Ozone activation
Ultraviolet (UV) excitation of O2 at 242 nm generates
gaseous ozone, O3, which involves the photodissocia-
tion of O2 followed by collisions of an oxygen atom with
an O2 and a third body, either O
2 or N
2. O
3 decomposes to
O2 and oxygen atom either by collision with an oxygen
atom or by photoirradiation in the wavelength range of 240–320 nm. The above stratospheric O
3 formation and
destruction reactions collectively are called the Chapman mechanism (Seinfeld and Pandis 1998). In practice, ozone is produced by a UV-light or corona-discharge genera-tor. Ozone is a strong oxidizing agent that plays a central role in the atmospheric chemistry and deployed water purification technologies. The stratospheric ozone oxi-dizes chorine species and nitrogen oxides, leading to the formation of polar ozone hole about 12 and 24 km altitude (Seinfeld and Pandis 1998). In the troposphere, photooxi-dation of organic compounds emitted from anthropogenic and biogenic processes (e.g. Atkinson and Arey 2003) by ground-level ozone creates smog that causes health and environmental impacts. Ozone’s oxidizing strength has been widely used in water and wastewater treatment (e.g. Langlais et al. 1991, Von Sonntag and Von Gunten 2012). Bailey (1978, 1982) critically reviewed the historical devel-opment of ozone reactions with organic compounds and their mechanisms, in both gas and liquid phases. The kinetics and mechanisms of paraffin hydrocarbons and ozone were investigated by Schubert et al. (1956a,b). Oxi-dation of carbonaceous materials by Ozone has also been extensively used for activation of biochar (Tables 7 and 8).
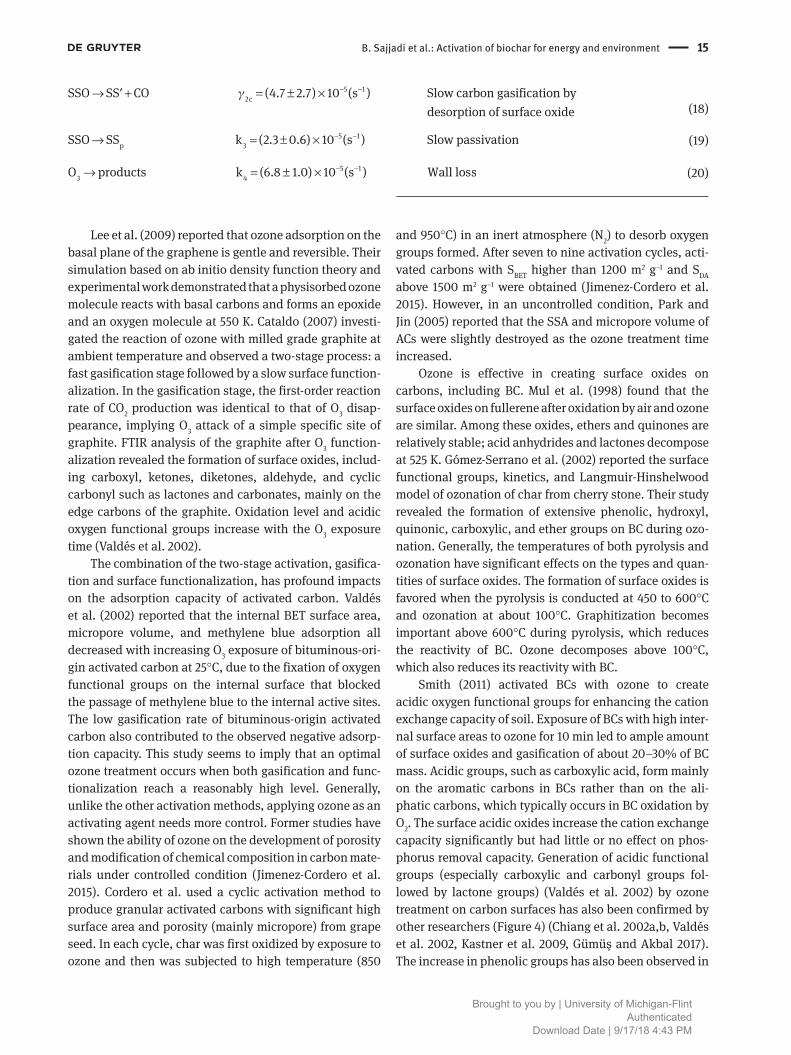
Ozone attacks both the basal and edge carbons in the chars. Kamm et al. (1999) investigated the kinetics of ozone reaction with carbon on the basal plane of soot in the temperature range 238–330 K. Their study revealed four quasi-elementary reactions in three rate regimes (SS denotes reactive surface site):
Rate parameter at 296 K
3
3 2S 3.3 10 Fast surface coveragS O SSO O e
iγ −
+ → + = × (15)
7
2ab 33 2(1.0 0.6) 10 Slow scavenging of surfSSO O SS ace oxide b OO y2 γ −
= ±+ → + × (16)
3
3
2 2Slow carbon gasification by combined
scavenging of surface oxide by O and
desorption o
SSO O SS O CO
f surface oxide
+ → + +′
(17)
Brought to you by | University of Michigan-Flint
Authenticated
Download Date | 9/17/18 4:43 PM
B. Sajjadi et al.: Activation of biochar for energy and environment 15
Lee et al. (2009) reported that ozone adsorption on the basal plane of the graphene is gentle and reversible. Their simulation based on ab initio density function theory and experimental work demonstrated that a physisorbed ozone molecule reacts with basal carbons and forms an epoxide and an oxygen molecule at 550 K. Cataldo (2007) investi-gated the reaction of ozone with milled grade graphite at ambient temperature and observed a two-stage process: a fast gasification stage followed by a slow surface function-alization. In the gasification stage, the first-order reaction rate of CO
2 production was identical to that of O
3 disap-
pearance, implying O3 attack of a simple specific site of
graphite. FTIR analysis of the graphite after O3 function-
alization revealed the formation of surface oxides, includ-ing carboxyl, ketones, diketones, aldehyde, and cyclic carbonyl such as lactones and carbonates, mainly on the edge carbons of the graphite. Oxidation level and acidic oxygen functional groups increase with the O
3 exposure
time (Valdés et al. 2002).The combination of the two-stage activation, gasifica-
tion and surface functionalization, has profound impacts on the adsorption capacity of activated carbon. Valdés et al. (2002) reported that the internal BET surface area, micropore volume, and methylene blue adsorption all decreased with increasing O
3 exposure of bituminous-ori-
gin activated carbon at 25°C, due to the fixation of oxygen functional groups on the internal surface that blocked the passage of methylene blue to the internal active sites. The low gasification rate of bituminous-origin activated carbon also contributed to the observed negative adsorp-tion capacity. This study seems to imply that an optimal ozone treatment occurs when both gasification and func-tionalization reach a reasonably high level. Generally, unlike the other activation methods, applying ozone as an activating agent needs more control. Former studies have shown the ability of ozone on the development of porosity and modification of chemical composition in carbon mate-rials under controlled condition (Jimenez-Cordero et al. 2015). Cordero et al. used a cyclic activation method to produce granular activated carbons with significant high surface area and porosity (mainly micropore) from grape seed. In each cycle, char was first oxidized by exposure to ozone and then was subjected to high temperature (850
and 950°C) in an inert atmosphere (N2) to desorb oxygen
groups formed. After seven to nine activation cycles, acti-vated carbons with S
BET higher than 1200 m2 g−1 and S
DA
above 1500 m2 g−1 were obtained (Jimenez-Cordero et al. 2015). However, in an uncontrolled condition, Park and Jin (2005) reported that the SSA and micropore volume of ACs were slightly destroyed as the ozone treatment time increased.
Ozone is effective in creating surface oxides on carbons, including BC. Mul et al. (1998) found that the surface oxides on fullerene after oxidation by air and ozone are similar. Among these oxides, ethers and quinones are relatively stable; acid anhydrides and lactones decompose at 525 K. Gómez-Serrano et al. (2002) reported the surface functional groups, kinetics, and Langmuir-Hinshelwood model of ozonation of char from cherry stone. Their study revealed the formation of extensive phenolic, hydroxyl, quinonic, carboxylic, and ether groups on BC during ozo-nation. Generally, the temperatures of both pyrolysis and ozonation have significant effects on the types and quan-tities of surface oxides. The formation of surface oxides is favored when the pyrolysis is conducted at 450 to 600°C and ozonation at about 100°C. Graphitization becomes important above 600°C during pyrolysis, which reduces the reactivity of BC. Ozone decomposes above 100°C, which also reduces its reactivity with BC.
Smith (2011) activated BCs with ozone to create acidic oxygen functional groups for enhancing the cation exchange capacity of soil. Exposure of BCs with high inter-nal surface areas to ozone for 10 min led to ample amount of surface oxides and gasification of about 20–30% of BC mass. Acidic groups, such as carboxylic acid, form mainly on the aromatic carbons in BCs rather than on the ali-phatic carbons, which typically occurs in BC oxidation by O
2. The surface acidic oxides increase the cation exchange
capacity significantly but had little or no effect on phos-phorus removal capacity. Generation of acidic functional groups (especially carboxylic and carbonyl groups fol-lowed by lactone groups) (Valdés et al. 2002) by ozone treatment on carbon surfaces has also been confirmed by other researchers (Figure 4) (Chiang et al. 2002a,b, Valdés et al. 2002, Kastner et al. 2009, Gümüş and Akbal 2017). The increase in phenolic groups has also been observed in
5 12c
(4.7 2.7) 10 s Slow carbon gasification by
desorptio
SSO SS CO
n of surface oxide
( )γ − −
→ +′ = ± ×
(18)
5 1
3pk (2.3 0.6) 10 s Slow passivatSSO SS ) ion(− −
= ± ×→ (19)
5 1
43k (6.8 1.0O products ( ) ) 10 s Wall loss− −
= ± ×→ (20)
Brought to you by | University of Michigan-Flint
Authenticated
Download Date | 9/17/18 4:43 PM

16 B. Sajjadi et al.: Activation of biochar for energy and environment
other studies (Chiang et al. 2002b). Acidic and polar func-tional groups on the carbon surface are responsible for the adsorption of polar compounds, e.g. ammonia adsorption (Park and Jin 2005). This observation has also been con-firmed by Kastner et al. (2009). The authors demonstrated that short-term ozone treatment of BC at room tempera-ture successfully increased acidic functional groups and, hence, the ammonia adsorption capacity of the palm oil shell char. The higher the ozone dose, the higher is the oxidation of the carbon and the lower is the point of zero charge (Valdés et al. 2002, Smith 2011). On the other hand, Chen et al. (2003) investigated the surfactant adsorption on the air-oxidized and ozone-treated carbon surface and found that adsorption capacity decreased with increasing surface oxidation. Surfactant adsorp-tion takes place mainly on the nonpolar carbon surface, where it is driven by hydrophobic interactions. A similar observation was reported by Valdes et al. (2003) in case of 2-mercaptobenzothiazole (MBT). The authors reported that ozone treatment led to a significant reduction in the carbon’s MBT adsorption capacity, due to the increase in polar hydrophilic groups. A detailed IR study of ozone adsorption on metal oxides dehydrated at different tem-peratures revealed at least four forms of ozone adsorp-tion (Bulanin et al. 1995). These interactions are physical adsorption, the formation of weak hydrogen bonds with surface OH group, molecular adsorption via coordinative bonding to weak Lewis sites, and dissociative adsorp-tion on interaction with strong Lewis sites, resulting in
the formation of atomic oxygen atoms. The latter implies the possible catalytic role of ozone on carbon-containing metal oxides, such as CO oxidation.
Ozone as a selective oxidant has also emerged as an attractive oxidation agent in advanced oxidation process (AOP) for enhancing the oxidation rate in water and wastewater treatment. AOP involves either a combina-tion of oxidants or oxidants with UV radiation (Glaze et al. 1987, Andreozzi et al. 1999). Oxygen-based AOPs include O
3/uv, O
3/H
2O
2, H
2O
2/uv, and O
3 at high pH. Glaze
and Kang (1989) reported that the hydroxyl radical is reactive and nonselective and plays a pivotal role in the O
3/H
2O
2 system. Moreover, their experimental and mech-
anistic study validated that bicarbonate, carbonate, and natural organic matters are free radical scavengers and terminate the oxidation chain reactions. Bicarbonate and carbonate react with hydroxyl radical and forms water, –2
3CO , and –1
3CO , respectively (Weeks and Rabani
1966, Andreozzi et al. 1999). Activated carbon, in com-bination with ozone (O
3/AC), was introduced in AOP as
an option to minimize the radical termination reactions. Kaptijn (1997), Zaror (1997), and Jans and Hoigné (1998) reported that activated carbon can accelerate ozone decomposition, resulting in the formation of hydroxyl radicals. The ratio between hydroxyl radical and ozone concentrations can increase up to 3–5 times. In a series of subsequent studies (Rivera-Utrilla et al. 2002, Rivera-Utrilla and Sánchez-Polo 2002, 2004, Sánchez-Polo and Rivera-Utrilla 2003, Sánchez-Polo et al. 2005), it has been demonstrated that bases on the carbon surface including metal centers, basal plane electrons, and other basic functional groups, such as pyrrole, are the main sites for the decomposition of O
3. The charged radical,
−
2O , is the major reaction intermediate. The activated carbon is consumed during the process, suggesting its role as an initiator or a promoter, rather than a catalyst, for the transformation. Valdés and Zaror (2006) reported the positive effects of activated carbon on the oxidation of benzothiazole in the aqueous phase during ozonation in the absence of radical scavenger. They also confirmed that the basic functional groups, such as the dissociated carboxylic acid anhydrides and carboxylic acids on the carbon surface, are responsible for the observed oxida-tion of ozone. Valdés et al. (2009) studied ozone decom-position promoted by natural zeolite and volcano sand. They demonstrated the roles of the basic sites of these minerals and that of a radical scavenger, acetic acid. The significant catalytic potential was observed when pista-chio hull BC was introduced to the ozonation reactor for the decolorization and mineralization of RR198, a reac-tive azo dye (Moussavi and Khosravi 2012).
H
A B D
C G H
E F
H
H
HH H
H
HH
HH
OOH
–H2O2
O3
HH
O
H
H
O
OOOH OO
HH
OHO3
Figure 4: Proposed reaction pathways for O3 reaction with activated carbon modified based on (Chiang et al. 2002b).
Brought to you by | University of Michigan-Flint
Authenticated
Download Date | 9/17/18 4:43 PM

B. Sajjadi et al.: Activation of biochar for energy and environment 17
According to the results of different studies, ozone needs an activation energy of 44.4 ± 4.6 kJ mol−1 for the activation/gasification of BC in the temperature range 296–418 K (Stephens et al. 1989, Kamm et al. 1999). The endothermic activation of the carbonaceous structure needs an energy of 159–172 and 117 kJ mol−1 with the gasi-fying agents of CO
2 and steam, respectively. Accordingly,
activation with ozone needs the least amount of energy (Toles et al. 2000, Aworn et al. 2008).
2.1.4 Air activation
Most processes to activate BC include heating the char (or carbon) in the presence of aggressive oxidizing reagents, either as a gas (e.g. steam, ozone, and CO
2) or liquid via
wet impregnation (e.g. strong acids and ZnCl). Alterna-tively, a gaseous oxidizing agent, such as air, can be used (Table 9). Applying air (oxygen) as a gasifying agent is an economically attractive approach for physical activation, but challenging. Reactions of graphite with O
2 includes
the formation of surface oxides on the edge, basal and off-plane carbons, followed by the formation of gaseous CO by desorption of surface oxide (Blyholder and Eyring 1959, Laurendeau 1978, Chen and Yang 1998). The ab initio molecular orbital study of Chen and Yang (1998) revealed the mechanisms of edge and near-edge carbon in graph-ite with O
2, H
2O, and CO
2 shown in Figure 5. For the C + O
2
reaction, the process starts with the dissociation of in-plane semiquinone oxygen with low activation energy (∼58 kcal/mol) because epoxy oxygen weakens the C-CO bond (I). Meanwhile, the epoxy oxygen flips over to the edge to transform into in-plane carbonyl oxygen (II). In the next step, new epoxy oxygen is generated by further chemisorption of oxygen (III), and the carbonyl breaks off (by releasing CO) to regenerate the active edge carbon sites (IV). The process immediately is followed by the dis-sociative chemisorption of O
2 on active sites forming the
semiquinone oxygen (I). The C-C bond in C-C=O (structure II) is not as strong as either one of the two C-C bonds in structure I. The breakage of carbonyl bond in structures of II and III includes only one C-C bond to release CO, while the breakage to free the semiquinone oxygen requires breaking two C-C bonds to free one CO, which is consid-ered as the rate-limiting step.
For the C + CO2 and C + H
2O reactions, there is no
remarkable quantity of the epoxy oxygen intermediate. Therefore, the activation energy of semiquinone oxygen (I) dissociation increases up to 85 kcal/mol, forming a dangling carbon bond (II). In the next step, chemisorp-tion of oxygen to the dangling carbon generates carbonyl
groups. Dissociation of these groups regenerates the bare edge sites, which lead to semiquinone oxygen by dissocia-tive chemisorption of CO. As per the aforementioned dis-cussion (for the C + O
2 reaction), the breakage of two C-C
bonds to free the semiquinone CO is the rate-limiting step.Air activation of carbonized charcoal is more complex
than graphite/O2 reaction and contains at least five major
reaction steps as follows (Smith and Polley 1956, Laine et al. 1963, Bach 2007):
+ →f 2
Oxygen c2C O (g) 2C hemisorp(O) tion (21)
→ Carbon gasiC(O) ficaCO(g) tion (22)
+ →f 2 2
Carbon gasification by C O (g) CO
oxygen (23)
+ →f 2
Oxide gasification by CO(g carb) C(O) C +CO on
mono
(g)
xide (24)
+ →f 2
Carbon gasification by
car
C CO (g) 2
bon dio
CO(g)
xide (25)
The mechanism starts with the chemisorption of oxygen onto the carbon to form surface oxides (R21), fol-lowed by desorption of CO and CO
2 (R22 and R23). In the
first step, oxygen is bound to the surface in the form of various functional groups, which are similar to those known in organic chemistry. Since carbon-oxygen reac-tions are exothermic, chemisorption of oxygen rapidly happens even at low temperatures. However, desorption requires energy, and at temperatures below 380°C, only some of the surface oxides can desorb to form CO
2. In
other words, lower temperatures favor the formation of stable surface oxides, making the second step challeng-ing. Reactions with CO (R24) causes the concentration of surface oxides available to participate in R22 to decrease, inhibiting the of gasification (Walker et al. 1959). Thus, the relative amounts of active sites and stable surface oxides complicate studies of the kinetics of the carbon-oxygen reaction and predictions of the amount of oxygen chem-isorbed. With respect to oxygen partial pressure, some researchers reported that the chemisorption and gasifica-tion reactions are close to first order. The apparent acti-vation energies of oxygen chemisorption and gasification vary between 40 and 80 kJ/mol and 110 and 150 kJ/mol, respectively. Tam and Antal (1999) analyzed the gasifica-tion of macadamia nut shell and developed a model for the complex kinetics of carbon gasification by oxygen. According to their model, R21 is the formation of stable surface oxides, which occupy free active sites and reduce the sites for gasification (R22). R23 is the usual gasification of the active carbon sites to form CO
2. They also included
an Eley-Rideal-type oxide gasification step (R24) based on
Brought to you by | University of Michigan-Flint
Authenticated
Download Date | 9/17/18 4:43 PM

18
B. S
ajjadi et al.: Activation of biochar for energy and environm
ent
Table 9: Effects of air modification on the physicochemical properties of biochar (numbers in parenthesis refer to activated biochar).
Biochar source Pyrolysis
temperature (°C),
time (h)
Air condition
temperature (°C),
time (h)
Burn-off Ash pH SBET
(m2/g) Vmicro
(cm3/g) Vmeso
(cm3/g) VP (cm3/g) R
p (nm) C (%) H (%) N (%) O (%) Reference
Woods of hybrid
Poplar
400, 0.5
500, 0.5
600, 0.5
250, 0.5 – 3.8
4.8
6.0
10.1 (9.8)
10.5 (10)
10.4 (10)
262 (277)a
404 (386)a
500 (570)a
0.10 (0.11)
0.16 (0.15)
0.20 (0.23)
– 0.28 (0.43)
0.43 (0.54)
0.57 (0.75)
– 76.2 (69.9)
78.6 (74.7)
83.1 (81.4)
4.5 (3.9)
4.1 (3.6)
3.4 (3.4)
0.45 (0.36)
0.41 (0.43)
0.5 (0.41)
13.4 (22)
11.4 (16.4)
6.7 (8.8)
Suliman et al. (2016)
Douglas fir 400, 0.5
500, 0.5
600, 0.5
250, 0.5 – 0.6
0.9
0.9
8.3 (8.0)
8.8 (8.2)
8.8 (8.3)
211 (227)a
318 (355)a
424 (550)a
0.08 (0.09)
0.13 (0.14)
0.17 (0.22)
– 0.20 (0.29)
0.36 (0.47)
0.43 (0.81)
– 74.5 (70.1)
80 (76.3)
87.8 (85.1)
5.1 (4.1)
4.3 (3.6)
3.7 (3.4)
0.29 (0.3)
0.36 (0.33)
0.38 (0.32)
19.2 (25)
14.8 (18.9)
7.1 (10.3)
Suliman et al. (2016)
Douglas fir bark 400, 0.5
500, 0.5
600, 0.5
250, 0.5 – 5.6
7.4
7.7
8 (6.9)
9.9 (8.0)
10.2 (10)
259 (257)a
361 (313)a
417 (557)a
0.10 (0.10)
0.14 (0.13)
0.17 (0.22)
– 0.31 (0.35)
0.50 (0.91)
0.65 (0.87)
– 69.8 (68.9)
75 (69.8)
77.6 (78.1)
4.5 (4.1)
3.8 (3.5)
3.2 (3.3)
0.65 (23.6)
0.67 (18.6)
0.73 (10.2)
18.6 (23.6)
12.6 (18.6)
8.9 (10.2)
Suliman et al. (2016)
Taiheiyo NM 150, 1 – – – – 0.062 (0.05) – – – 77.8 (76.4) 6 (6.2) – – Oda et al. (1981)
Bibai NM 150, 1 – – – – 0.065 (0.043) – – – 81.1 (79.3) 6 (5.6) – – Oda et al. (1981)
Akabira NM 150, 1 – – – – 0.054 (0.041) – – – 83.4 (80.4) 6.2 (5.4) – – Oda et al. (1981)
Miike NM 150, 1 – – – – 0.035 (0.02) – – – 84.5 (85) 6.1 (5.8) – – Oda et al. (1981)
Yubari NM 150, 1 – – – – 0.033 (0.031) – – – 86.2 (87.7) 6.3 (5.7) – – Oda et al. (1981)
Moura NM 150, 1 – – – – 0.053 (0.066) – – – 87.6 (87.8) 5.3 (4.9) – – Oda et al. (1981)
Nishikawachi NM 150, 1 – – – – 0.03 (0.038) – – – 89.8 (90.4) 5.2 (4.8) – – Oda et al. (1981)
Macadamia nut
shell
Chemi-Desorp
400 280, 6
5280, 14
– 1.04 (2.11) – 510 (1 Cycle)
962 (3 Cycle)
1060 (4 Cycle)
0.32 cc/g
0.37 cc/g
0.32
– 0.36 (–)
0.58 (–)
0.8 (–)
– 94.6 (92.3) 0.97 (1.1) 0.47 (0.35) 2.9 (5.16) Tam and Antal (1999)
Coconut shell
Chemi-Desorp
400 280, 6
280, 14.5
– 2.8 (3.44) – 474 (1 cycle)
833 (3 cycle)
1028 (4 cycle)
–
–
0.32
– –
–
0.74 (–)
– 92.3 (91.7) 1.09 (1.07) 0.47 (0.19) 3.08 (4.37) Tam and Antal (1999)
Waste rubber
Chemi-Desorp
800, 0.17 O2 21%, 500, 0.08
O2 21%, 500, 0.5
O2 10%, 500, 0.08
O2 10%, 500, 0.5
O2 10%, 500, 0.33 O2
10%, 550, 0.33
O2 10%, 600, 0.33
(5%)
(80%)
(5%)
(28%)
(15%)
(22%)
(25%)
– – 142 (–)
237 (–)
160 (–)
282 (–)
252 (–)
272 (–)
170 (–)
0.018 (–)
0.045 (–)
0 (–)
0.069 (–)
0.06 (–)
0.062 (–)
0.024 (–)
0.039 (–)
0.050 (–)
0.011 (–)
0.015 (–)
0.012 (–)
0.062 (–)
0.024 (–)
– – – – – – Heras et al. (2004)
Waste rubber 800, 0.33 210 Chemisorption
750 Desorption
– – 60 (240) – (0.06) 0.02 (–) – 60 (15) – – – – Heras et al. (2009)
Ta90
Coconut based
– 200 Chemisorption
900 Desorption
22% – – 23 (56) Ex
23 (42) Ex
0.54 (0.6)
0.54 (0.48)
– – 12 (19) Å (4 cycle)
12 (16) Å (7 cycle)
– – – Py et al. (2003)
Ctpkn
Pitch based
– 200 Chemisorption
900 Desorption
17% (4 cycle)
45% (7 cycle)
– – 18 (38) Ex
18 (85) Ex
0.47 (0.62) – – 7.6 (15) Å (7 cycle) – – – Py et al. (2003)
CmS5A
Coconut based
– 200 Chemisorption
900 Desorption
15% (7 Cycle) – – 18 (20) Ex 0.23 (0.25) – – 6.4 (6.7) Å (7 cycle) – – – Py et al. (2003)
Almond nutshell 700, 1, CO2 300 Chemisorption – – 10 (10.3) 424 (497) 0.19 (0.32) 0.038 (0.073) – – – – – – Wartelle and Marshall (2001)
Pecan 700, 1, CO2 300 Chemisorption – – 9.5 (8.3) 466 (608) 0.21 (0.25) 0.051 (0.119) – – – – – – Wartelle and Marshall (2001)
Pistachio nut 700, 1, CO2 300 Chemisorption – – 9.6 (10) 544 (572) 0.24 (0.26) 0.042 (0.04) – – – – – – Wartelle and Marshall (2001)
Hazelnut shell 700, 1, CO2 300 Chemisorption – – 9.1 (8.3) 501 (745) 0.24 (0.3) 0.067 (0.256) – – – – – – Wartelle and Marshall (2001)
Macadamia nut 700, 1, CO2 300 Chemisorption – – 9.2 (5.6) 503 (791) 0.24 (0.28) 0.107 (0.28) – – – – – – Wartelle and Marshall (2001)
Bro
ught to
you b
y | U
niv
ers
ity o
f Mic
hig
an-F
lint
Auth
entic
ate
d
Dow
nlo
ad D
ate
| 9/1
7/1
8 4
:43 P
M
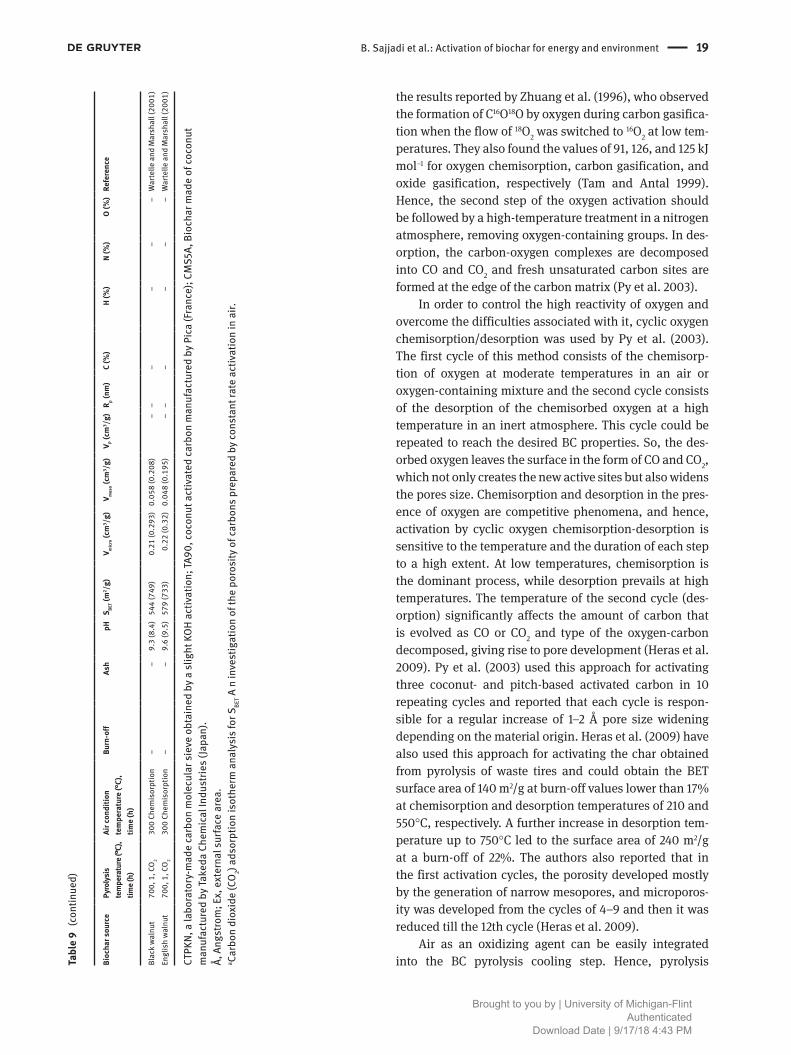
B. Sajjadi et al.: Activation of biochar for energy and environment 19
the results reported by Zhuang et al. (1996), who observed the formation of C16O18O by oxygen during carbon gasifica-tion when the flow of 18O
2 was switched to 16O
2 at low tem-
peratures. They also found the values of 91, 126, and 125 kJ mol−1 for oxygen chemisorption, carbon gasification, and oxide gasification, respectively (Tam and Antal 1999). Hence, the second step of the oxygen activation should be followed by a high-temperature treatment in a nitrogen atmosphere, removing oxygen-containing groups. In des-orption, the carbon-oxygen complexes are decomposed into CO and CO
2 and fresh unsaturated carbon sites are
formed at the edge of the carbon matrix (Py et al. 2003).In order to control the high reactivity of oxygen and
overcome the difficulties associated with it, cyclic oxygen chemisorption/desorption was used by Py et al. (2003). The first cycle of this method consists of the chemisorp-tion of oxygen at moderate temperatures in an air or oxygen-containing mixture and the second cycle consists of the desorption of the chemisorbed oxygen at a high temperature in an inert atmosphere. This cycle could be repeated to reach the desired BC properties. So, the des-orbed oxygen leaves the surface in the form of CO and CO
2,
which not only creates the new active sites but also widens the pores size. Chemisorption and desorption in the pres-ence of oxygen are competitive phenomena, and hence, activation by cyclic oxygen chemisorption-desorption is sensitive to the temperature and the duration of each step to a high extent. At low temperatures, chemisorption is the dominant process, while desorption prevails at high temperatures. The temperature of the second cycle (des-orption) significantly affects the amount of carbon that is evolved as CO or CO
2 and type of the oxygen-carbon
decomposed, giving rise to pore development (Heras et al. 2009). Py et al. (2003) used this approach for activating three coconut- and pitch-based activated carbon in 10 repeating cycles and reported that each cycle is respon-sible for a regular increase of 1–2 Å pore size widening depending on the material origin. Heras et al. (2009) have also used this approach for activating the char obtained from pyrolysis of waste tires and could obtain the BET surface area of 140 m2/g at burn-off values lower than 17% at chemisorption and desorption temperatures of 210 and 550°C, respectively. A further increase in desorption tem-perature up to 750°C led to the surface area of 240 m2/g at a burn-off of 22%. The authors also reported that in the first activation cycles, the porosity developed mostly by the generation of narrow mesopores, and microporos-ity was developed from the cycles of 4–9 and then it was reduced till the 12th cycle (Heras et al. 2009).
Air as an oxidizing agent can be easily integrated into the BC pyrolysis cooling step. Hence, pyrolysis B
ioch
ar
sou
rce
P
yro
lysi
s
tem
per
atu
re (°
C),
tim
e (h
)
A
ir c
on
dit
ion
tem
pe
ratu
re (
°C),
tim
e (
h)
B
urn
-off
A
sh
pH
S
BE
T (m
2/g
)
Vm
icro
(cm
3/g
) V
me
so (
cm3/g
) V
P (
cm3/g
) R
p (
nm
)
C (
%)
H
(%
) N
(%
) O
(%
) R
efe
ren
ce
Bla
ck w
alnu
t
700,
1, C
O2
30
0 Ch
emis
orpt
ion
–
–
9.
3 (8
.4)
544
(749
)
0.21
(0.2
93)
0.05
8 (0
.208
) –
–
–
–
–
–
W
arte
lle a
nd M
arsh
all (
2001
)
Engl
ish
wal
nut
70
0, 1
, CO
2
300
Chem
isor
ptio
n
–
–
9.6
(9.5
) 57
9 (7
33)
0.
22 (0
.32)
0.
048
(0.1
95)
–
–
–
–
–
–
War
telle
and
Mar
shal
l (20
01)
CTP
KN
, a la
bora
tory
-mad
e ca
rbon
mol
ecul
ar s
ieve
obt
aine
d by
a s
light
KO
H a
ctiv
atio
n; T
A90
, coc
onut
act
ivat
ed c
arbo
n m
anuf
actu
red
by P
ica
(Fra
nce)
; CM
S5A
, Bio
char
mad
e of
coc
onut
m
anuf
actu
red
by T
aked
a Ch
emic
al In
dust
ries
(Ja
pan)
.Å
, Ang
stro
m; E
x, e
xter
nal s
urfa
ce a
rea.
a Carb
on d
ioxi
de (C
O2) a
dsor
ptio
n is
othe
rm a
naly
sis
for S
BET
A n
inve
stig
atio
n of
the
poro
sity
of c
arbo
ns p
repa
red
by c
onst
ant r
ate
acti
vati
on in
air
.
Tab
le 9
(c
onti
nued
)
Brought to you by | University of Michigan-Flint
Authenticated
Download Date | 9/17/18 4:43 PM

20 B. Sajjadi et al.: Activation of biochar for energy and environment
temperature plays an important role in the final struc-ture and the susceptibility of carbonaceous materials to air oxidation. Working on three different feedstocks, Suliman et al. (2016) reported that the quantity of C, H, and N decreased in all oxidized BC compared to the unoxidized ones. These changes were more significant for those synthesized at lower temperatures (<500°C), which were more susceptible to oxidation due to the removal of labile C and volatile organic compounds compared with higher temperature ones. As per Table 10, the bulk oxygen mass fraction in BC increases with air oxidation due to the formation of oxygenated functional groups. The values are again more pronounced for BCs produced at a low temperature, which have a higher mass fraction of volatile and less stabilized aromatic carbon (Suliman et al. 2016). These observations have been confirmed by
the other researchers too. Oda et al. analyzed seven differ-ent sources of BC and reported that although oxidation of all of the coals employed resulted in hydrogen-poor and oxygen-rich products, oxidation of samples with a higher content of carbon lasted more than 1 h to show the reduc-tion of C content. The reason is that BCs synthesized at higher temperatures have a denser and robust graphitic structure. These observations were confirmed with the content of functional groups in BC after oxidation. FTIR analysis of BC after oxidation demonstrates an increase in carbonyl and carboxyl group due to which negative surface charge in most air activated BCs increased too. In some cases, carbonyl increase is more significant (e.g. in almond-based BC) (Toles et al. 2000), while in some others, carboxyl (e.g. Douglas fir Bark BCs) (Suliman et al. 2016), and in some cases, both of the groups increased
O
O O O
O O O O
–CO +CO2/H2O
+CO2/H2O
–CO
C C C
C C C C
OOOO
O O O O O O
O OO
C
–CO +O2
+O2A
B
(I) (II) (III) (IV)
(I) (II) (III) (IV)
–CO
C C
C C C CO O
O O O O
O
Figure 5: Reaction pathways for (A) graphite gasification by O2 (activation energy: 58 kcal/mol), (B) graphite gasification by CO2 and H2O (activation energy: 85 kcal/mol), from ab initial orbital study, including three oxygen intermediates semiquinone, carbonyl and off-plane epoxyl; modified based on Chen and Yang (1998).
Table 10: Effects of air modification on the adsorption capacity of biochar (numbers in parentheses refer to activated biochar).
Biochar source Pyrolysis cond.
temperature (°C), time (h)
Air temperature (°C) Objective Adsorption capacity Reference
Almond nutshell 700, 1, CO2 300 Chemisorption Removal of Cu2+ 607.8 (620.3) Wartelle and Marshall (2001)Pecan 700, 1, CO2 300 Chemisorption Removal of Cu2+ 689.8 (664.3) Wartelle and Marshall (2001)Pistachio nut 700, 1, CO2 300 Chemisorption Removal of Cu2+ 687.4 (690.4) Wartelle and Marshall (2001)Hazelnut shell 700, 1, CO2 300 Chemisorption Removal of Cu2+ 637 (608.7) Wartelle and Marshall (2001)Macadamia nut 700, 1, CO2 300 Chemisorption Removal of Cu2+ 543.1 (589.0) Wartelle and Marshall (2001)Black walnut 700, 1, CO2 300 Chemisorption Removal of Cu2+ 618.2 (627.6) Wartelle and Marshall (2001)English walnut 700, 1, CO2 300 Chemisorption Removal of Cu2+ 697.5 (667.2) Wartelle and Marshall (2001)
Brought to you by | University of Michigan-Flint
Authenticated
Download Date | 9/17/18 4:43 PM

B. Sajjadi et al.: Activation of biochar for energy and environment 21
(e.g. Douglas fir wood BCs and poplar wood BCs) (Suliman et al. 2016). Although the quantity of acidic functional groups increases in all BCs oxidized by air, the trend of oxidation decreases with pyrolysis temperature. Similar results were found by Dong et al. (2013), who reported high-temperature BCs contained a lower quantity of oxygen functional groups. In other words, the susceptibil-ity of BCs to oxidation by air has a reverse relation with pyrolysis temperature as more stable poly-aromatic struc-tures are formed at high temperature. In terms of physi-cal structure, oxygenation using air does not change the microporous structure and surface area of BC produced at lower temperatures significantly. Surface area has slightly increased in some cases pyrolyzed at high temperatures. The decrease in microporous volume can be explained by the partial blockage of micropores by oxygen-containing functional groups, and the slight increase in area may attribute to the oxidation and removal of some of the carbonaceous walls (Suliman et al. 2016). Oda et al. also reported that the micropore volume decreased with slight oxidation (1 h) but increased considerably with extensive oxidation (5–10 h). Similar results were reported by Tam and Antal (1999), who worked on oxidizing the macada-mia nut and coconut shells in different durations. As per their results, BET surface area significantly increased with activation cycles and the duration from 240 to 840 min. However, the micropore volume slightly increased from 32 to 37 cc/g. It should be noted that a further increase in oxidization duration considerably increased the meso and macropore volume while it slightly reduced the micropore volume (Tam and Antal 1999).
2.2 Thermal activation
2.2.1 Conventional thermal activation
Thermal decomposition of biomass in an oxygen-depleted atmosphere leads to a series of phenomena, including decomposition, transformation, and rearrangement in biomass molecular structure (Figure 6). At low tempera-tures (100–200°C), biomass is mainly dehydrated and remains almost unaltered. As temperature increases, con-nections between organic molecules (including cellulose, lignin, and hemicellulose biopolymers, which are the main organic structures in biomass) are decomposed, and sub-sequently, isolated aromatic rings (transition BC) begin to form. By a further increase in temperature, all recogniz-able biopolymers are completely degraded and substituted with isolated aromatic molecules with two to three rings (amorphous BC). These small and somewhat defective
sheets of aromatic rings stack up at higher temperatures and form small three-dimensional structures, consisting of three to five stacked C sheets with a lateral extension of 2–5 nm and a vertical height of 12 nm (turbostratic crys-tallites). However, the exact dimensions depend on feed-stock type and its mineral content, as well as treatment temperature. In a wide range of temperatures, a significant quantity of both amorphous material and turbostratic crys-tallites presents in BC structure (composite BC). As soon as all amorphous organic C is either converted into aromatic rings or volatilized, a BC is recognized as “carbonized” or “turbostratic.” BCs do not usually get to this region as they either require heating temperatures beyond 700°C or pro-longed residence during pyrolysis. Hence, most BCs have a highly disordered and heterogeneous carbon structure (belonging to either amorphous or composite categories), and hence, the thermal treatment process has considera-ble influences on their structures and gasification behavior (Keiluweit et al. 2010, Claoston et al. 2014).
In a conventional thermal modification, BC is heated to a high temperature (600–1500°C) for a desired dura-tion (1–2 h) (Table 11 and Figure 7). Thermal treatment removes the hydrogen and heteroatoms such as oxygen via the release of gases, resulting in a reduction of BC yield. Therefore, a more condensed/ordered carbona-ceous structure is generated. The heterogeneity of the carbon structure is reduced through two simultaneous processes: I) loss of that part of the amorphous structure during gas release and II) transformation of the amor-phous and disordered structures into larger aromatic ring system (Kleber et al. 2015). Dehydrogenation and aromati-zation reactions assist the formation of larger polynuclear aromatic hydrocarbons at higher activation temperatures and eventually increase the carbonization yield (Dodevski et al. 2017). The effect of thermal treatment is more sig-nificant at initial steps, and it gradually decreases with further release of heteroatoms. Under these conditions,
Figure 6: Phase conversion of biochar under different temperatures, modified based on Lehmann and Joseph (2015).
Brought to you by | University of Michigan-Flint
Authenticated
Download Date | 9/17/18 4:43 PM

22
B
. Sajjadi et al.: A
ctivation of biochar for energy and environment
Table 11: Effects of conventional thermal modification on the physicochemical properties of biochar (numbers in parentheses refer to activated biochar).
Biochar
source
Pyrolysis
temperature
(°C), time (h)
Agent Ash Agent
temperature
(°C), time (h)
Objective Yield
(mg/g)
pH SBET
(m2/g) Smicro
(m2/g) Vmicro
(cm3/g) Vmeso
(cm3/g) VP (cm3/g) R
p (nm) C (%) H (%) O (%) N (%) Reference
Aspen wood 600, 0.5 – – CO2, 780, 1.7 MO, W 0 (93.46%) 480 (886) – – 0.19 (0.29) 0.01 (0.16) – – – – – Veksha et al.
(2015)
Oak 500, – – 3.7 (7.1)
3.7 (12.1)
CO2, 800, 1
CO2, 900, 1
– – 8.3 (8.8)
8.3 (9.7)
107 (786)
107 (807)
– 0.05 (0.04)
0.05 (0.35)
0.046 (0.328)
0.046 (0.335)
0.004 (0.008)
0.004 (0.01)
– 81 (86)
81 (85)
2.9 (0.6)
2.9 (0.4)
12 (5.6)
12 (1.3)
0.5 (0.6)
0.5 (1.1)
Jung and Kim
(2014)
Pistachio
nutshells
450, – – – CO2, 800, –
CO2, 900, –
Physical
comparison
– – – (543)
– (680)
– – (0.22)
– (0.29)
– (0.208)
– (0.262)
– – – – – – Işıtan et al.
(2016)
Pistachio
nutshells
550, – – – CO2, 800, –
CO2, 900, –
– – – – (554)
– (650)
– – (0.23)
– (0.27)
– (0.217)
– (0.257)
– – – – – – Işıtan et al.
(2016)
Pistachio
nutshells
650, – – – CO2, 800, –
CO2, 900, –
– – – – (606)
– (810)
– – (0.25)
– (0.34)
– (0.233)
– (0.313)
– – – – – – Işıtan et al.
(2016)
Palm kernel
shells
– – – CO2, 900, 1
CO2, 900, 2
CO2, 900, 3
Iodine
adsorption
– – 34 (600)
34 (695)
34 (807)
– 0.022 (0.28)
0.022 (0.34)
0.022 (0.38)
0.015 (0.25)
0.015 (0.29)
0.015 (0.34)
0.007 (0.031)
0.007 (0.044)
0.007 (0.044)
– – – – – Choi et al.
(2015)
Forestry
waste
400, – – 3.6
3.5
CO2, 400, 2
CO2, 400, 4
Analysis of
temperature
effect
– – 52 (73)
37.5 (135)
4.8 (8)
4.08 (17.8)
0.036 (0.039)
0.034 (0.069)
0.0017 (0.0016)
0.0013 (0.0038)
– 2.75 (2.14)
3.71 (2.05)
– – – – Grima-Olmedo
et al. (2016)
Forestry
waste
600, – – 4.7
5.0
CO2, 600, 2
CO2, 600, 4
– – – 370.5 (377)
367 (390)
296 (304)
299 (337)
0.19 (0.19)
0.199 (0.199)
0.138 (0.142)
0.139 (0.16)
– 1.6 (1.55)
1.57 (1.54)
– – – – Grima-Olmedo
et al. (2016)
Forestry
waste
800, – – 10.6
25.4
CO2, 800, 2
CO2, 800, 4
– – – 435 (905)
436 (1034)
366.7 (544)
371.1 (570)
0.23 (0.55)
0.23 (0.61)
0.173 (0.25)
0.174 (0.26)
– 1.58 (1.79)
1.57 (1.78)
– – – – Grima-Olmedo
et al. (2016)
Pistachio nut
shell
350, 2
500, 2
800, 2
– – CO2, 900, 2 – – – – (611)
– (896)
– (724)
– – (0.393)
– (0.532)
– (0.454)
– (0.18)
– (0.237)
– (0.17)
– (0.213)
– (0.295)
– (0.284)
– (2.57)
– (2.38)
– (2.51)
– – – 10 Lua and Yang
(2004)
Oak – – (31.8)
(43)
CO2, 700, 1
CO2, 800, 1
– – – – (642)
– (845)
– – (0.4113)
– (0.6011)
– (0.2704)
– (0.3212)
– – 70.84 (–) 3.165 (–) 13.225 (–) – Zhang et al.
(2004)
Corn hulls – – (32.3)
(44.4)
CO2, 700, 1
CO2, 800, 1
– – – – (977)
– (1010)
– – (0.8923)
– (0.8341)
– (0.3352)
– (0.4348)
– – 70.33 (–) 3.226 (–) 16.733 (–) – Zhang et al.
(2004)
Corn stover – – (41.5)
(42.6)
CO2, 700, 1
CO2, 800, 1
– – – – (660)
– (712)
– – (0.4879)
– (0.5494)
– (0.2817)
– (0.2849)
– – 59.36 (–) 3.06 (–) 16.936 (–) – Zhang et al.
(2004)
Willow tree 700, – – – CO2, 900, 1 PAH
removal,
85.12 – 11.4 (512) 4.5 (380) 0.006 (0.276) 0.0016 (0.169) – 1.08 (1.08) – – – – Kołtowski
et al. (2017b)
Willow tree 700, – – – MW, 200, 0.5 PAH
removal,
81.00 – 11.4 (443) 4.5 (259) 0.006 (0.242) 0.0016 (0.1138) – 1.08 (1.10) – – – – Kołtowski
et al. (2017b)
Willow tree 700, – – – Steam, 800, 1 PAH
removal,
74.93 – 11.4 (841) 4.5 (509) 0.006 (0.576) 0.0016 (0.2245) – 1.08 (1.37) – – – – Kołtowski
et al. (2017b)
Wheat straw 650, – – – Steam, 800, 1.3 PAH
removal,
67%↑ 9.9 (8.8) 26.3 (246) 10.8 (140) 0.0256 (0.16) 0.0046 (0.0622) – 1.95 (1.02) – – – – Kołtowski
et al. (2016)
Coconut 650, – – – Steam, 800, 1.3 PAH
removal,
83.4%↑ 8.0 (7.2) 3 (626.8) 2.3 (472) 0.001 (0.336) 0.0087 (0.0219) – 0.6 (0.85) – – – – Kołtowski
et al. (2016)
Willow 650, – – – Steam, 800, 1.3 PAH
removal,
51.0%↑ 9.1 (8.2) 11.4 (841) 4.5 (509) 0.006 (0.576) 0.0016 (0.2245) – 1.08 (1.09) – – – – Kołtowski
et al. (2016)
Wheat straw – – Steam, 900, 1 Cd immob.,
S
14.2 (8.9) 7.6 (7.8) 137 (961) – – – – – – – – – Wu et al.
(2016)
Wheat straw – – Steam, 900, 1 Cu immob.,
S
45.7
(12.58)
– – – – – – – – – – – Wu et al.
(2016)
Miscanthus
sacchariflorus
500, – – 3.81
(3.92)
Steam, 800,– Cu sorption 15.4 (13.8) – 181 (322) – – – – – 80.9 (82.1) 2.8 (2.67) 12.2 (11) 0.29 (0.31) Shim et al.
(2015)
Pine nut shell – – – Steam, 750, 1.3
Steam, 850, 1.3
Steam, 950, 1.3
Iodine
adsorption
At least
17%↑
– 800 (–)
1020 (–)
750 (–)
– – – – – – – – – Chen et al.
(2016)
Bro
ught to
you b
y | U
niv
ers
ity o
f Mic
hig
an-F
lint
Auth
entic
ate
d
Dow
nlo
ad D
ate
| 9/1
7/1
8 4
:43 P
M

B. S
ajjadi et al.: Activation of biochar for energy and environm
ent
2
3
Biochar
source
Pyrolysis
temperature
(°C), time (h)
Agent Ash Agent
temperature
(°C), time (h)
Objective Yield
(mg/g)
pH SBET
(m2/g) Smicro
(m2/g) Vmicro
(cm3/g) Vmeso
(cm3/g) VP (cm3/g) R
p (nm) C (%) H (%) O (%) N (%) Reference
Pine nut shell – – – Steam, 850, 0.7
Steam, 850, 1.3
Steam, 850, 2
Iodine
adsorption
At least
17%↑
– 750 (–)
1020 (–)
850
– – – – – – – – – Chen et al.
(2016)
Sugar cane
bagasse
460, – – 14 (22)
14 (16.1)
14 (12.2)
Steam, 700, 1
Steam, 800, 1
Steam, 900, 1
MB 16%↑ 259 (441)
259 (570)
259 (561)
194 (399)
194 (345)
194 (289)
0.136 (0.189)
0.136 (0.356)
0.136 (0.526)
0.088 (0.181)
0.088 (0.157)
0.088 (0.131)
– 21 (33)
21 (25.5)
21 (20.4)
62.5 (73.6)
62.5 (77.9)
62.5 (78.2)
1.7 (0.6)
1.7 (0.6)
1.7 (0.6)
– 0.9 (0.7)
0.9 (0.9)
0.9 (0.6)
Carrier et al.
(2012)
Oak 200, 1
400, 1
600, 1
– 800 Steam/CO2200
Steam/CO2400
Steam/CO2600
Good
Comparison
– 4.6 (9.6)
6.9 (9.6)
9.6 (9.6)
– – – – – – 48.8 (30.6)
42.7 (30.3)
45.5 (37.1)
– – 0.2 (0.5)
0.3 (0.5)
0.4 (0.4)
Zhang et al.
(2015)
Poplar wood 550 NaOH 3.7 (4.55) 750, 2 Organic
compounds
83.7%↑ – – – – – – – 80.3 (85) 2.8 (1.55) 12.8 (8.8) 0.34 (0.1) de Caprariis
et al. (2017)
Debarked
loblolly pine
chips
300, –
500, –
700, –
NaOH – 300, –
500, –
700, –
PAH removal 29.91↑ – 1.41 (1250)
239 (346)
321 (57)
– – 0 (0.289)
0.076 (0.128)
0.129 (0.013)
0.009 (0.78)
0.075 (0.16)
0.045 (0.04)
– 23.6 (79.7)
79.4 (86.5)
87.1 (83.8)
– – – Park et al.
(2013)
Torrefied
loblolly pine
chips
300, 0.25 NaOH – 800, 2 Cd 167.3 – 1150.7 – ↑ – – – – – – – Park et al.
(2017)
Safflower
seeds
500, 1 KOH – 800, 1 Iodine
adsorption
– – 14.14
(1277)
– (1133) – (0.663) – (0.49) – – (2.08) 62.45 (72.1 1.85 (2.7) 31.6 (22.5) 4.07 (2.8) Angın et al.
(2013b)
Unknown
provenance
600, fast KOH – 475, 2
675, 2
875, 2
Comparison
of electrical
conductivity
– – – (894)
– (1807)
– (2247)
– – – (0.35)
– (0.73)
– (0.08)
– (0.06)
– (0.09)
– (1.41)
– (1.95)
– (1.90)
– (2.76)
– – – – Dehkhoda
et al. (2016)
Pistachio nut
shell
KOH – – – – – 700.5 – – – – – – Foo and
Hameed
(2011b)
Bamboo
chips
700, 2 KOH – 700, 2 [BMIM][Cl] (0.513)mmol/g – 355 (1195) – 0.195 (0.585) 0.127 (0.436) 0.069 (0.149) 0.6 (0.548) – – – – Yu et al.
(2016)
Hazelnut
shells, M3
500, 1 KOH W C 900, 1 – – 2319 – – (0.936) KOH – (0.042) – (40.96) – (56.78) Kwiatkowski
and Broniek
(2017)
DDGS 600, 45
min
KOH – KOH, 950, 3
KOH, 1050, 3
Analysis of
temperature
effect
1.78f↑
F/g
– 2959 (2684) – – (1.52)
– (2.72)
– (0.99)
– (0.5)
– (0.39)
– (2.19)
– (892)
– (90.8)
– (10.01)
– (9.067)
(1.790) Jin et al.
(2014)
Bamboo 550, – – W C 800, air, 2 Furfural 109 (253) – 42.8 (494) 35 (427) 0.022 (0.24) 0.016 (0.198) – 2.04 (1.94) 63.5 (70.7) 2.9 (1.1) 33 (27.6) 0.55 (0.58) Li et al. (2014)
Corn straw 500, 1.5 KOH – 800, 0.5 Hg2+ 0.91 (1.19) – 32.85 (466) – 0.0148 (0.08) – 0.018 (0.093) 5.01 (4.4) 42.3 (67.2) 1.16 (0.8) 1.2 (6.8) 0.82 (0.53) Tan et al.
(2016)
Corn straw 500, 1.5 KOH – – Hg2+ 0.91 (0.98) – 32.85 (59) – 0.0148 (0.02) – 0.018 (0.026) 5.01 (7.6) 42.3 (43.08) 1.16 (1.14) 1.2 (15.4) 0.82 (0.86) Tan et al.
(2016)
Corn straw 500, 1.5 KOH 800, 0.5 Atrazine 2.5 (74.23) – – – – – – – – – – Tan et al.
(2016)
Corn straw 500, 1.5 KOH – – Atrazine 2.5 (2.82) – – – – – – – – – – Tan et al.
(2016)
Corn straw 500, 1.5 Na2S – – Atrazine 2.5 (2.74) – – – – – – – – – – Tan et al.
(2016)
Corn straw 500, 1.5 Na2S – – Hg2+ 0.91 (1.24) – 32.85 (53) – 0.0148 (0.02) 0.018 (0.024) 5.01 (5.84) 42.3 (42.92) 1.16 (1) 1.2 (15.09) 0.82 (0.49) Tan et al.
(2016)
Hazelnut
shells
500, 1 CO2 WO/C 800, 0.5 – – – 921 – – (0.443) – (0.098) – – (27.45) – (59.81) – Kwiatkowski
and Broniek
(2017)
Table 11 (continued)
Bro
ught to
you b
y | U
niv
ers
ity o
f Mic
hig
an-F
lint
Auth
entic
ate
d
Dow
nlo
ad D
ate
| 9/1
7/1
8 4
:43 P
M

24
B
. Sajjadi et al.: A
ctivation of biochar for energy and environment
Biochar
source
Pyrolysis
temperature
(°C), time (h)
Agent Ash Agent
temperature
(°C), time (h)
Objective Yield
(mg/g)
pH SBET
(m2/g) Smicro
(m2/g) Vmicro
(cm3/g) Vmeso
(cm3/g) VP (cm3/g) R
p (nm) C (%) H (%) O (%) N (%) Reference
Hazelnut
shells
500, 1 H2O WO/C 900, 0.5 – – – 922 – – (0.553) – (0.105) – – (26.64) – (60.05) – Kwiatkowski
and Broniek
(2017)
Golden
shower
800, 4 K2CO3 – 800, air, 4 MG 5 32.6
(233.6)
5.25
(7.25)
1413 (812) 1302 (684) 0.66 (0.38) 0.55 (0.26) 0.11 (0.12) 1.86 (1.87) 71 (76.3) 0.59 (0.19) 27.8 (22.8) 0.6 (0.65) Tran et al.
(2017a,b)
Hazelnut
shells
500, 1 K2CO3 W C 900, 1 – – – 887 – – (0.403) – – (0.013) – – (37.61) – (58.93) – Kwiatkowski
and Broniek
(2017)
Hazelnut
shells, M3
450, 1 H3PO4 – – – – – 1492 – – (1.055) – – (0.166) – – (39.43) – (57.67) – Kwiatkowski
and Broniek
(2017)
Hazelnut
shells
500, 1 ZnCl2 – – – – – 1731 m2/g – – (1.043) – – (0.110) – – (39.95) – (56.2) – Kwiatkowski
and Broniek
(2017)
Safflower
seed
500, – ZnCl2 – 600, 1
700, 1
800, 1
900, 1
MB – (16.2)
– (62.1)
– (107.5)
– (128.2)
– 14.1 (249)
14.1 (491)
14.1 (772)
14.1 (801)
(188)
(424)
(701)
(707)
– (0.151)
– (0.249)
– (0.357)
– (0.393)
– (0.08)
– (0.17)
– (0.28)
– (0.28)
– (0.07)
– (0.08)
– (0.08)
– (0.11)
– (2.42)
– (2.02)
– (1.85)
– (1.96)
62.4 (70.44)
62.4 (71.7)
62.4 (73.8)
62.4 (76.3)
1.8 (2.8)
1.8 (2.66)
1.8 (2.39)
1.8 (2.26)
31.6 (23.3)
31.6 (22.5)
31.6 (20.8)
31.6 (18.9)
4.1 (3.5)
4.1 (3.1)
4.1 (2.97)
4.1 (2.48)
Angın et al.
(2013a)
Almond
Shell, M3
103 days ZnCl2 (67) 750–850, 2 Phenol,
MB
– (70.4)
– (1.33)
– – (736) – – – – – – (79.2) – (0.64) – – Aygün et al.
(2003)
Apricot
Stone, M3
103 days ZnCl2 (70) 750–850, 2 Phenol
MB
– (100)
– (3.53)
– – (783) – – – – – – (76) – (0.49) – – Aygün et al.
(2003)
Hazelnut
Shells, M3
103 days ZnCl2 (63) 750–850, 2 Phenol
MB
– (145)
– (8.82)
– – (793) – – – – – – (72) – (1.8) – – Aygün et al.
(2003)
Walnut Shell,
M3
103 days ZnCl2 (70) 750–850, 2 Phenol
MB
– (126)
– (4.11)
– – (774) – – – – – – (75.3) – (0.71) – – Aygün et al.
(2003)
RBBR, Remazol Brilliant Blue R; PAH, polycyclic aromatic hydrocarbon; d, dehydration process; W C, with cooling, Cu immob.; S, copper immobilization in soil.
Table 11 (continued)
Bro
ught to
you b
y | U
niv
ers
ity o
f Mic
hig
an-F
lint
Auth
entic
ate
d
Dow
nlo
ad D
ate
| 9/1
7/1
8 4
:43 P
M

B. Sajjadi et al.: Activation of biochar for energy and environment 25
the inorganic species in BC undergo relatively lower con-version to a gaseous phase.
Thermal treatment in the absence of an electron donor or acceptor (inert atmosphere) is accompanied by chemical changes. In thermal treatment, carbonization is a complex process including simultaneous dehydrogena-tion, isomerization, and hydrogen transfer. This process results in the formation and condensation of C rings and their growth into larger sheets and stacks. When C atoms are transformed into rings with C=C double bonds, the overlap of P-orbitals can probably happen and π-electrons can become delocalized, creating aromatic molecules (Figure 8). Hence, aromaticity increases while the oppo-site trend is observed for polarity. Higher temperatures cause higher aromaticity (indicated by aromaticity index) and lower polarity (indicated by polarity index (O + N)/C) (Table 12) (Park et al. 2017).
As it is expected, with the progress of thermal anneal-ing, carbon content increases while the oxygen and hydrogen contents decrease due to the loss of H- and
O-containing functional groups by dehydration and decarboxylation reactions. A decrease in the oxygen and hydrogen contents is coupled with the release of H
2, CO,
CO2, and CH
4. The evolution of hydrocarbons (e.g. C
2H
4 and
C2H
6), is normally observed at low temperatures, under-
going a slight reduction in high temperatures (Yip et al. 2011). CO and H
2 concentrations increase with tempera-
ture, while a reduction in CO2 concentration is observed.
The variation in CO2 and CO concentrations is justified by
the reaction between CO2 and carbon that produces CO; in
other words, a portion of CO2 is converted to CO at higher
temperatures:
2 298KC(s)+CO (g) 2CO(g) H 173 kJ/mol∆↔ = (26)
Yip et al. (2011) analyzed BC thermal annealing at temperatures of 750 and 900°C. The authors reported that the gaseous products were predominantly H
2 and, to a
much less extent, CO, plus trace amounts of CO2 and CH
4
at both modifying temperatures. Thermal treatment can be accomplished either in an inert atmosphere (nitrogen, argon) or in the presence of hydrogen or oxidants such as CO
2, steam, air, and/or a strong base (e.g. KOH). As per
Table 12, the increment of C content, but in lower inten-sity, could also be observed for BCs activated under CO
2
or steam atmospheres, which is due to the oxidation fol-lowed by desorption of surface oxide as CO from the BC. Reduction of C and O content was also reported wherein the CO desorption is more severe, such as activation under the mixture of steam, CO
2 (Zhang et al. 2015) or under
limited oxygen. Zarifyanz et al. (1967) demonstrated that oxygen reacts with graphite at temperatures below −40°C to form surface oxides, which can be readily removed as CO
2 or CO at temperatures above 200°C.Thermal posttreatment modifies not only the carbo-
naceous matrix of BC but also the concentration or even the nature of surface functional groups. Generally, car-boxylic and lactone groups begin to decompose at about 250°C, and the phenol and quinone groups almost com-pletely decompose between 500 and 900°C. At 900°C, the hydroxyl group decreases drastically and the other oxy-gen-containing surface functional groups are completely eliminated (Kinoshita 1988, Chiang et al. 2002a). Hence, thermal treatment under an inert atmosphere at a specific temperature could be used to selectively reduce the con-centration of surface oxygen groups, while heating in an oxidizing gas or liquid phase might increase such groups. Moreover, heat treatment of BC in an inert atmosphere could increase carbon hydrophobicity by removing hydro-philic groups, particularly acidic surface functionalities (Shin et al. 1997).
Figure 7: The effect of high temperature thermal treatment (HTT) on biochar structure development: (A) increased proportion of highly disordered aromatic rings in amorphous mass, (B) growing and turbostratically arranging sheets of conjugated aromatic carbon, and (C) structure becomes graphitic with order in the third dimension modified based on Emmerich et al. (1987).
Figure 8: Overlap of P-orbitals and creation of aromatic molecules.
Brought to you by | University of Michigan-Flint
Authenticated
Download Date | 9/17/18 4:43 PM

26
B
. Sajjadi et al.: A
ctivation of biochar for energy and environment
Table 12: Effects of microwave irradiation on the physicochemical properties of biochar (numbers in parentheses refer to activated biochar).
Biochar source Pyrolysis temperature
(°C) or MW power (W),
time (h)
MW power (W) or
temperature (°C),
time (min)
Agent time
(h)
Adsorbate
(mg/g)
Yield
(mg/g)
SBET
(m2/g) Smicro
(m2/g) Vmicro
(cm3/g) Vmeso
(cm3/g) VP (cm3/g) R
p (nm) C (%) H (%) O (%) N (%) Reference
Oat hull 600°C, 3 100°C, 30
140°C, 30
Sulfuric acid – – 49.3 (30.6)
49.3 (5.43)
– 0.008 (0.055)
0.008 (0.008)
– – – 81.6 (70.6)
81.6 (66.3)
2.0 (1.98)
2.0 (1.99)
– 1.14 (1.3)
1.14 (0.83)
González et al. (2017)
Willow 700°C, slow 800°C, 78
200°C, 30
300 W, 45 bar, 10
CO2
H2O
MW
– – 11.4 (512.0)
11.4 (840.6)
11.4 (443.2)
4.5 (380)
4.5 (509)
4.5 (259)
0.006 (0.276)
0.006 (0.577)
0.006 (0.242)
0.002 (0.17)
0.002 (0.225)
0.002 (0.114)
– – 69.94 (70.82)
69.94 (56.86)
69.94 (73.92)
2.08 (0.70)
2.08 (0.59)
2.08 (0.95)
19.13 (16.37)
19.13 (21.68)
19.13 (8.72)
1.13 (0.82)
1.13 (0.37)
1.13 (0.66)
Kołtowski et al. (2017a)
Dairy manure 600°C, 4 –
1000 W, 30
Ni-loaded
Ni-loaded
– – 37.4 (36.1)
37.4 (29.8)
– – 0.017 (0.012)
0.017 (0.013)
0.018 (0.17)
0.018 (0.015)
– 77.6 (75.2)
77.6 (55.3)
2.3 (2.17)
2.3 (1.1)
8.1 (8.05)
8.1 (65.2)
Wang et al. (2017)
Sewage sludge 600°C, 4 –
1000 W, 30
Ni-loaded
Ni-loaded
– – 47 (45.2)
47 (31.5)
– – 0.012 (0.011)
0.012 (0.009)
0.014 (0.013)
0.014 (0.013)
– 65.1 (63.2)
65.1 (43.1)
4.42 (4.51)
4.42 (3.31)
16.6 (16.5)
16.6 (39.3)
Wang et al. (2017)
Prosopis juliflora MW-assisted –
600 W, –
300 W, –
H2O2, 24
H2O2, 24
H2O2, 24
MB –
91.0
–
–
(357)
(277.5)
–
(82.6) Ex
(127.2) Ex
–
– (0.13)
– (0.07)
– – –
– (35.4)
– (94.4)
76.44 (70.56)
76.44 (77.80)
76.44 (75.13)
0.69 (0.28)
0.69 (0.58)
0.69 (0.21)
20.91 (27.89)
20.91 (20.65)
20.91 (22.99)
1.96 (1.27)
1.96 (0.97)
1.96 (1.67)
Nair and Vinu (2016)
Prosopis juliflora 560 W, 6–0.25
500–600°C
–
600 W, –
300 W, –
H2O2, 24
H2O2, 24
H2O2, 24
RBBR –
83.3
–
– – – – – – – Nair and Vinu (2016)
Peanut hull, M3 500 W, 0.17 H3PO4, 24 RBBR 149.3 952.6 (–) 0.8807 (–) 0.2777 (–) – – – – – – Zhong et al. (2012)
Rice husk 700°C, – 600 W, 7 In KOH MB 362.6 164 (752) 52 (406) Ex 0.1 (0.64) 0.06 (0.26) 0.04 (0.38) 24.4 (34.1) – – – – Foo and Hameed (2011c)
Rice husk 700°C, – 600 W, 7 In K2CO3 MB 441.52 164 (1165) 52 (558) Ex 0.1 (0.78) 0.06 (0.33) 0.04 (0.45) 24.4 (26.89) – – – – Foo and Hameed (2011c)
Cotton stalk 560 W, 0.15 Best In ZnCl2 MB 170 794.84 (–) 0.63 (–) 0.083 (–) – – – – – – Deng et al. (2009)
Orange peel 700°C, – 600 W, 6 K2CO3 MB 379.63 6.9 (1104.45) 3.6 (684) Ex 0.615 (0.615) 0.008 (0.247) 0.008 (0.368) 24.8 (22.3) 57.16 (72.66) 1.42 (0.76) 38.37 (24.83) 2.83 (1.54) Foo and Hameed (2012a)
Jatropha hull 600°C, 1 3000 W, – – – – 480 (1350) – 0.42 (1.07) 0.4366 (–) – 3.5 (3.1) – – – – Xin-hui et al. (2011b)
Bamboo, M3 350 W, 0.33
600°C, 0.5
600°C, 1
– H3PO4 – – 1432
1215
1416
– 0.696 (–)
0.56 (–)
0.673 (–)
0.503 (–)
0.448 (–)
0.511 (–)
– – 84.7 (–)
83.6 (–)
– 14.0 (–)
14.6 (–)
– Liu et al. (2010)
Pistachio shell – 600 W, 7 KOH MB 296.57 115.5 (700.5) – 0.069 (0.375) – 23.4 (21.4) Å – – – Foo and Hameed (2011b)
Cotton stalk – 680 W, 10 KOH
K2CO3
MB 294.12
285.7
729.3
621.5
529.5 (–)
384.7 (–)
0.38 (–)
0.38 (–)
0.26 (–)
0.11 (–)
– 2.08 (–)
2.43 (–)
– – – Deng et al. (2010)
Jatropha hull – 900°C, 22, Conv.
900°C, 40, Conv.
900°C, 19, MW
900°C, 30, MW
Steam
CO2
Steam
CO2
– – 480 (748)
480 (1207)
480 (1350)
480 (1284)
– 0.42 (0.53)
0.42 (0.86)
0.42 (1.07)
0.42 (0.87)
– 3.5 (2.85)
3.5 (2.86)
3.5 (3.10)
3.5 (2.71)
– – – Xin-hui et al. (2011a)
Pulp mill sludge 400°C, 2 1200 W, 5
1200 W, 5
1200 W, 5
1200 W, 5
800°C, 120
800°C, 120
KOH:C (1:1)
KOH:C (3:1)
NaOH:C (1:1)
NaOH:C (3:1)
KOH:C (1:1)
KOH:C (3:1)
– – – (700)
– (300)
– (400)
– (1200)
– (500)
– (2100)
– – (0.20)
– (0.25)
– (0.07)
– (0.056)
– (0.13)
– (0.46)
– (0.36)
– (0.16)
– (0.11)
– (0.42)
– (0.35)
– (0.54)
– (0.56)
– (0.41)
– (0.18)
– (0.98)
– (0.48)
– (1.00)
– – – – Namazi et al. (2016)
Ex, External surface area; MB, methylene blue; RBBR, Remazol Brilliant Blue R; Ye, Conv.: conventional heating; Å, Angstrom.
Bro
ught to
you b
y | U
niv
ers
ity o
f Mic
hig
an-F
lint
Auth
entic
ate
d
Dow
nlo
ad D
ate
| 9/1
7/1
8 4
:43 P
M

B. Sajjadi et al.: Activation of biochar for energy and environment 27
Exposure to hydrogen gas can effectively stabilize the carbon surface by deactivating some active sites (i.e. by formatting stable C-H bonds and/or gasification of unstable and reactive carbon atoms) and thus producing a more stable and basic carbon surface (Menéndez et al. 1995, Radovic et al. 1997). Accordingly, carbons thermally treated under H
2 atmosphere are expected to have much
lower reactivity toward chemical agents and oxygen com-pared to those treated in an inert atmosphere, indicating that H
2 treatment effectively stabilizes the surfaces of
various carbons. As an instance, Dastgheib and Karanfil (2004) found that thermally activated coal-based AC and a commercial AC fiber at 900°C under hydrogen flow had lower amounts of oxygen uptake than the vacuum-treated carbons (Dastgheib and Karanfil 2004).
The effect of oxidants has been discussed in the previous parts of this review, and hence, a brief com-parison is presented here to clarify the role of thermal treatment, with a particular focus on the temperature and duration of the process. The mechanism of char (C) activation with CO
2 involves the endothermic Boud-
ouard reaction (C + CO2 ↔ 2CO), which was explained in
Section 2.1.2. The rate of the carbon-CO2 reaction is tem-
perature dependent and is slow at temperatures below 800°C (Işıtan et al. 2016). Although at high temperatures, micropores are converted to mesopores due to the faster C-CO
2 reaction, it has been reported that both those poros-
ities were identified with an increase in activation temper-ature from 750 to 850°C (Dodevski et al. 2016). However, a very long activation time, along with a high tempera-ture under CO
2, would destroy the pore skeleton, thereby
reducing SBET
and the micropore volume of BC (Choi et al. 2015). Similarly, steam activation should also be accom-panied by thermal treatment. Hence, in this process, super-heated steam is applied, which enlarges the diam-eters of smaller pores created during pyrolysis and forms new pores (Kołtowski et al. 2017b). Similar to CO
2 activa-
tion, the increase in temperature up to 850°C induces a more severe reaction between carbon and steam that, in turn, raises the number of the activated carbon atoms, generating abundant microporous and some mesopore structures, but with moderate yield. However, since H
2O
molecule is smaller than CO2, the former easily and deeply
diffuses to all pores in the network, which increases the reaction rate and the final product. Hence, thermal activa-tion under superheated steam is more effective compared with CO
2 atmosphere (Kołtowski et al. 2017b). In order
to raise the effectiveness of CO2 activation, a prolonged
process is recommended. Most authors have applied the thermal treatment of 80 min in the presence of steam, while longer activation periods up to 2 h have been used
for CO2 treatment. At either temperatures above 850°C or
activation time beyond 80 min (for steam) and 120 min (for CO
2), the micropores are constantly transformed into
mesopores or even macropores. The collapse and loss in numbers of the formed pores result in low adsorption capacity and SSA of the activated carbon.
Compared with steam and CO2, thermal activation
using air is more sensitive to temperature. Hence, most of the research works have focused on physical activation using CO
2 or steam, whereas little attention has been dedi-
cated to oxygen as an alternative approach (Heras et al. 2009). The challenge is that oxygen exhibits a very high reactivity with chars, and the process is very difficult to control. High-temperature air activation may be associ-ated with high burn-off and a poor development of poros-ity with high percentages of macropores (Heras et al. 2009). On the other hand, activation in low-temperature air (<400°C) favors the formation of stable surface oxides. At higher temperatures (<650°C), only some of the surface oxides can desorb from the surface, and hence, the analy-sis of relative amounts of stable surface oxides and active sites is more complex in this range of temperature (400–650°C) (Tam and Antal 1999). In order to get benefit from low-temperature activation with air, but also overcoming the problems associated with a high-temperature process, Tam and Antal (1999) used an alternative strategy involv-ing a controlled low-temperature air oxidation by step-wise heating from 180 to 390°C temperatures, followed by thermal treatment at high temperature in an inert gas. By doing so, the authors could produce activated carbons with surface areas greater than 1000 m2/g. Li et al. (2014) used another strategy by applying a high-temperature thermal treatment followed by cooling and air injection at room temperature. This process caused the formation of new functional groups onto the BC surface. These groups were identified as basic pyrone-type groups resulting from the residual carbonyl group and the ether-type groups formed during pyrolysis.
The synergistic contribution of combined thermal treatment and chemical modification is another deter-minant factor that will be discussed in a sequel to this study. Aside from the effects of activating agents, three points should be considered in thermal treatment. I) Most authors have reported that final activation temperature had a greater effect on microporosity than final activation time did (Angın et al. 2013a, Jung and Kim 2014). II) Poros-ity, surface area, and the other physicochemical properties are improved if the BC is cooled down between pyrolysis and the subsequent thermal treatment, compared with processes without cooling (Tam and Antal 1999, Jung and Kim 2014, Kwiatkowski and Broniek 2017). III) Pyrolysis
Brought to you by | University of Michigan-Flint
Authenticated
Download Date | 9/17/18 4:43 PM

28 B. Sajjadi et al.: Activation of biochar for energy and environment
at temperatures beyond 400°C, prior to thermal activa-tion, has minimal effects on the properties of the resultant activated chars, but the impacts of pyrolysis temperatures lower than 400°C become serious (Işıtan et al. 2016).
The interactions among pore size distribution, surface area, and surface functional groups govern the adsorption capacity of activated BC. After thermal treat-ment, both the positive and negative impacts of these variables on adsorption capacities have been observed. Here, we discuss the effects of thermal treatment on the adsorption of heavy metals, methylene orange, and PAHs. It should be noted that acid-base reactions and surface charges often govern these interactions in the cases discussed below. Thermal treatment of BC in steam atmosphere showed a negative effect on both Cu and Cd immobilization. The reason is the loss of carboxylic acid (-COOH), carbonyl (C=O), and phenol (-OH) groups at high temperature. These groups could form stable com-plexes with heavy metals (e.g. (SCO)
2Cu2+, (SCO)
2Cu(OH)−
at pH < 7), and thus, reduction of their quantity has a negative effect on the specific adsorption of the metals (Shim et al. 2015, Wu et al. 2016). In order to overcome this challenge and utilize the highly condensed aromatic structure and greater micropore volume of thermally treated BC, Park et al. (2017) added humic acid (HA) to the adsorption solution and found that negatively charged surfaces for HA-coated BC enhanced the Cd(II) uptake at low pH. In this case, π-electron delocalization of BC acted as a Lewis base to donate unshared pairs of electrons to metal ions as a Lewis acid (Park et al. 2017). In terms of Hg(II), a remarkable increase in surface area (from 32 to 466 m2/g) in spite of the reduction in acidic functional groups helped the adsorption process. Hence, thermal treatment, along with KOH modification, resulted in a moderate improvement in the removal of Hg(II) and a significant improvement in the removal of atrazine, com-pared to pristine BC (Tan et al. 2016).
Thermal activation of BC donates extra adsorption ability to BC too. Veksha et al. (2015) have found that thermally activated BC could remove methylene orange up to 99.48% under microwave irradiation, while unacti-vated BC could not adsorb it under the same condition. No evidence was found for the formation of hydroxyl radicals or “hot” spots on the BC surface that would cause degradation of methyl orange. In other words, the methyl orange was adsorbed by activated carbon rather than degraded. Similar effects have been reported for adsorption of hydrophobic pollutants such as polycyclic aromatic hydrocarbons. In those cases, BCs synthesized at higher temperatures, which have higher aromaticity than those synthesized at lower temperatures, have been
shown to be better sorbents due to higher hydrophobic-ity and π-π interactions (Park et al. 2013). Hence, thermal treatment of the latter resulted in a great improvement in PAH adsorption compared with high-temperature synthe-sized BC (Kołtowski et al. 2017b). These results have been confirmed by the other researchers. As an instance, Jung et al. (2013) concluded that thermal activation increased the adsorption capacity toward endocrine disrupting compounds/pharmaceutical active compounds compared to commercialized powdered activated carbon.
2.2.2 Microwave activation
Microwaves are electromagnetic waves with frequencies between 300 MHz (100 cm) and 300 GHz (0.1 cm) and wavelength ranging from 1 m to 1 mm (Huang et al. 2016). Irradiation of microwaves offers quick and uniform inter-nal and volumetric heating through three mechanisms, including ionic conduction, dipole polarization, and the combination of those two, which is called interfa-cial polarization (Wang et al. 2017). Unlike conventional heating, where heat is transferred from the surface of the material to its interior through convection and con-duction phenomena, the entire volume of the material is heated with limited temperature gradient under micro-wave irradiation via dielectric heating. Heat is then trans-ferred from the core of the material toward its surface. Microwave heating generates tiny microplasma spots throughout the reaction mixture, enhancing the local temperature even at low bulk temperatures. Therefore, the rates of chemical reactions are selectively accelerated while energy consumption is minimized. Although micro-wave is very beneficial, especially in advanced applica-tions such as BC activation, it cannot be easily employed in large scales (Chu et al. 2017), limiting its industrial application.
Recently, microwave-assisted synthesis and activa-tion of BC have gained much attention. It should be noted that microwave-assisted pyrolysis (MAP) is different from microwave-assisted activation. In the former, micro-wave energy is used for thermal treatment of biomass to produce BC, while in the latter, microwave energy associ-ated with various chemical reagents is used to selectively treat and modify functional groups in BC that is a key step in chemical activation. In both of these concepts, micro-wave energy accelerates the process at a lower activation temperature with a shorter duration, which considerably reduces the energy consumption. It was reported that microwave heating can be achieved at pyrolysis tempera-tures around 200°C (Mašek et al. 2013). Under microwave
Brought to you by | University of Michigan-Flint
Authenticated
Download Date | 9/17/18 4:43 PM

B. Sajjadi et al.: Activation of biochar for energy and environment 29
irradiation, the polar atoms or molecules of biomass absorb energy, oscillate, and collide with their neighbors. These collisions eventually generate thermal energy that promotes the production of volatiles and the development of a porous structure inside the biomass. An increase in the release of gases like H
2, CO, CO
2, CH
4, C
2H
4, and C
2H
6
under microwave irradiation compared to conventional heating assists the formation of pores in the char.
However, due to localized high temperatures, CO2
concentration in the gases produced under microwave irradiation is significantly lower compared with those produced with conventional heating. Consistent with this and aforementioned hypothesis, Menéndez et al. (2007) reported that the CO/CO
2 ratio is much higher for micro-
wave pyrolysis than that under conventional pyrolysis in an electrical furnace at a relatively low temperature of 500°C. Moreover, localized high temperatures also assist the H
2 and CO production reactions:
∆↔ =+ +298 K4 2 2
CH H 260.5CO k2CO 2H J/mol (27)
∆ =↔ +2984 2 K
CH H 75.6 kJC 2H /mol (28)
Hence, the concentrations of H2 and CO in the gases
produced by microwave were much higher than that of their counterparts obtained by conventional heating (Menéndez et al. 2007). Aside from temperatures, the yield of pyrolysis under microwave irradiation is greatly influ-enced by feedstock materials (Chu et al. 2017). In other words, microwave absorber (Lin and Chen 2015) plays a significant role in the pyrolysis yield. Microwave adsorp-tion abilities are not similar for all materials, and biomass is among the materials with low absorption ability. Thus, the desired pyrolysis temperature cannot be obtained by just irradiating a pure biomass with direct microwave irra-diation. Hence, microwave absorbers (e.g. metallic oxides or charcoal) can be impregnated into biomass structure, be heated by microwave radiation, and then indirectly transfer the heat energy to the neighbors by conduction, causing them to decompose. However, in such a condi-tion, the catalytic effects of the microwave absorber, the mechanism of the process, and biomass pyrolysis char cannot be easily specified (Menéndez et al. 2004, Wang et al. 2009). More details about MAP in the production of BC with different pore structures and surface areas can be found in Ahmed (2016) and Nair and Vinu (2016). A comprehensive literature review in this area was also pre-sented by Li et al. (2016).
Aside from pyrolysis, there are three major characteristics of microwave-assisted activation com-pared with the conventional thermal activation. I)
Temperature is controlled by both activating agent ratio and the microwave power. II) Activation temperature during the process is not constant, due to the reactions involving carbon loss from BC and consumption of the activating agent. III) Activation rate is normally higher when heating with microwaves (Namazi et al. 2016). Hence, microwave power and duration should be care-fully designed and controlled to develop an efficient process for the activation of BC. Higher activation power should be associated with shorter duration and vice versa. As per Table 12, depending on the biomass source, the best results with the activation power of 200 and 350 W are obtained in 30 and 25 min, respectively, while as the microwave power increased up to 600, 800, and 1200 W, the process can be accomplished in shorter durations of 6–7, 4–5, and 2–3 min, respectively. However, it should be noted that microwave activation could only be achieved in a very short period of time compared to furnace acti-vation. An increase in either power intensity or activation duration beyond the optimal value results in a reduction of micropore and mesopore volumes and, hence, SSA, micropore, mesopore, and total pore volumes (Namazi et al. 2016). Optimal microwave power is usually adopted when the average SSA and pore diameter/area/volume are at their maximal, but microwave power does not cause any overgasification with its detrimental impact. Gener-ally, increasing the microwave power until its optimal value enhances the number of microscale explosions, joining the micropores together, and ultimately results in the formation of narrow and deep mesopores. Beyond optimal power, overgasification might occur due to the higher density of microplasma spots, resulting in the destruction of the pore structures and carbon burn (Foo and Hameed 2011a, 2012b, Nair and Vinu 2016, Chu et al. 2017). In other words, more micropore and mesopores are created at optimal conditions (power, duration, and tem-perature), while an increase in those parameters beyond their optimal values destroys the porosity of the BC struc-ture. However, the addition of chemical reagents changes the balance of the activation reaction. Compounds such as KOH, NaOH, K
2CO
3, and H
2O
2 under microwave irradia-
tion are expected to be the main wave absorbers. These compounds assist the process to promptly reach the acti-vation temperature (in the range of 500–800°C) (Namazi et al. 2016). Therefore, chemical supply should be suffi-cient to accelerate the activation reaction and develop the surface area as carbon is consumed. The addition of chemical activation with alkali metal hydroxides resulted in the generation of a highly porous and dense carbon AC with a high surface area (Lam et al. 2017). Namazi et al. (2016) investigated the effect of KOH and NaOH during
Brought to you by | University of Michigan-Flint
Authenticated
Download Date | 9/17/18 4:43 PM
30 B. Sajjadi et al.: Activation of biochar for energy and environment
chemical activation of a BC sample using microwaves. The authors found that NaOH-activated carbon produced with microwaves in a short duration (5 min) had similar properties and yield with those activated by the conven-tional furnace in 1.5 h. In other words, KOH and NaOH as microwave absorbers increased the rate of activation by 15 times compared with the furnace activation. The SSA and micropore and mesopore volumes all were significantly higher in NaOH-activated BC, while activation yield was greater in the system containing KOH. The authors con-cluded that the smaller size of NaOH ions could facilitate the temperature rise during microwave activation, and hence, the rate of the NaOH activation reaction is higher than that with KOH in microwaves (Namazi et al. 2016).
In terms of the potential benefits of microwaves com-pared to conventional heating methods, most authors have reported that microwave-assisted production or activation is a more efficient process due to its rapid rise and uniform distribution of temperature in carbon substrates. For example, Chu et al. (2017) compared the properties of peanut shell BCs produced by using MW and muffle furnace. At an equal temperature, MW BCs pos-sessed larger surface areas due to the higher population of micropores and exhibited higher adsorption of bisphenol A and carbamazepine than those produced in the conven-tional furnace.
Although carbonization and condensation in both conventional and microwave heating result in decreased O and H and increased C contents with increased tem-perature, the quantity of elemental composition change is less dramatic in MW BCs. Therefore, the atomic ratios of H/C and (O + N)/C and the subsequent polarity and the abundance of functional groups are usually higher for MW-treated BCs (Chu et al. 2017). Additionally, if the solution is air bubbled, microwave activation can capture more O element from the air and transfer it on BC surface, resulting in oxidation of the surface groups (Park and Sujandi 2008, Yin et al. 2009). Hence, MW oxidation is an effective method for activation of BC to adsorb heavy metals. As an example, Wang et al. (2017) used microwave oxidation in order to convert the heavy metal-loaded BC into supercapacitor and to promote its electrochemical property. The results showed an increase in capacitance of the MW-treated Ni-loaded BC supercapacitor, mainly because of the conversion of Ni into NiO and NiOOH. H
2O
2
is another oxidizing agent that can induce the generation of hydroxyl radical during the microwave treatment (Huff and Lee 2016). BC treated by H
2O
2-assisted microwave
exhibited superior performance compared to untreated char in the adsorption of dyes (60% improvement) (Nair and Vinu 2016). Other functional groups can also be easily
introduced to the structure of BC under microwave irra-diation. As an example, in order to produce an efficient catalyst for transesterification reaction (biodiesel produc-tion), González introduced sulfonic groups in BC using a microwave reactor, which resulted in a 90% increment in transesterification yield (González et al. 2017).
2.3 Ultrasound activation
Acoustic cavitation consists of at least three distinct, suc-cessive stages: nucleation, bubble growth, and implosive collapse (Ince et al. 2001). During the collapse stage, the energy released is so extreme that trapped gases undergo molecular fragmentation, which is the underlying phe-nomenon in homogeneous sonochemistry. This collapse is accompanied by the emission of light, or sonolumines-cence (SL; Suslick and Flannigan 2008). Spectroscopic analysis of SL reveals that temperature and pressure can reach 5000 K and 1000 bar, respectively, in clouds of cavi-tating bubbles and even more extreme conditions in iso-lated single bubble cavitation. The implosive collapse of bubbles generates a shock wave that propagates out into the liquid medium. The thin shell of liquid surrounding the collapsing bubbles and the liquid droplets injected into the bubbles can reach 1900 and 5200 K, respectively. Moreover, bubble collapse near a solid surface disrupts the spherical shape of the bubble and induces the forma-tion of microjets that can impact the surface in addition to the shock wave. The results of this physical process include mixing, erosion, and particle collisions. The com-bined primary sonochemical reactions in the gas phase, the secondary sonochemical reactions in the liquid phase, and the physical impact of bubble collapse have gener-ated many novel technological concepts in the last three decades (see, e.g. Chatel and Colmenares 2017), such as the manufacturing the nanostructured materials (Hinman and Suslick 2017). In the case where water is sonicated, water splitting during the bubble-collapse stage leads to the formation of oxygen, hydroxyl, and peroxyl radicals (Kohno et al. 2011), which are attractive for oxidizing organic waste in water and for the oxidative desulfuriza-tion of fuels (Pethrick 1991). Strongly reducing protons also form during water splitting. Thus, oxidation, hydro-genation, and hydroxylation can take place simultane-ously in sonicated aqueous solutions.
Sonication has been widely adopted to enhance mixing and reduce mass transfer limitations in liquid/solid inter-actions. Ultrasound is also capable of leaching fine miner-als such as K, Na, S, Cl, P, Mg, Ca, Fe, and Al from porous carbonaceous materials (Ahmad et al. 2004). As a result of
Brought to you by | University of Michigan-Flint
Authenticated
Download Date | 9/17/18 4:43 PM

B. Sajjadi et al.: Activation of biochar for energy and environment 31
leaching of minerals and swelling of BC by a solvent such as water, the internal surface area of the carbon increases. The internal surface area is a major factor governing the adsorption capacity and latitude to chemically functional-ize the interface surface of BC for subsequent adsorption. Three to five stacked graphitic and graphitic oxide sheets with a vertical height of 1–2 nm and a lateral extension of 2–5 nm form the backbone of the BC structure (Kleber et al. 2015). Graphite can be oxidized to graphite oxide, producing intercalated hydroxyl and epoxide groups and a disrupted sp2-bonded carbon network. Stankovich et al. (2006) demonstrated that graphite oxide in phenyl isocy-anate can be completely exfoliated by ultrasound (150 W) for 1 h, producing single-layer graphene oxide (GO). Exfo-liated GO platelets are expected to offer higher contact surface area than graphitic oxide clusters.
The water splitting, leaching of minerals, and exfolia-tion stated above provide bases for a novel approach for activating BC (Chen et al. 2014, Mulabagal et al. 2017). It was demonstrated that exfoliation of graphitic oxide clus-ters, reductive CO
2 fixation, hydrogenation, and leaching
of minerals take place simultaneously in a single-stage BC/CO
2/H
2O system under ultrasound irradiation at 65°C and
1 atm. The ultrasonic treatment simultaneously induces desired physical and chemical changes on BC, including not only graphite oxide exfoliation, water splitting, and leaching of minerals but also carboxylation, hydrogena-tion, and swelling. The treated BCs mainly have a higher internal surface area, heating value, and reaction rates. The energy throughput for this activation is much lower than the traditional methods. As a comparison, thermal treatment alone without acoustic irradiation induces a similar increase in internal surface area, but a loss in hydrogen and no notable change in carbon content.
Specifically, the BET surface area of BC samples were found to increase from 12.9 to 151.4 m2/g after acoustic treat-ment in water/CO
2 (Chen et al. 2014). It was observed that CO
2
plays an important role in enhancing the internal surface area. This activation approach is simple and requires only reagents that are readily available everywhere, as shown in Figure 9. Considering the remarkably lower temperature adopted in the proposed treatment, the energy and cost of the new activation procedure are likely to be competitive in comparison with current carbon activation methods. Our calculation revealed that the energy consumptions in tra-ditional thermal and acoustics activation are 18,600 and 1135 kcal/kg of activated BC produced, respectively (Chen et al. 2014). Due to this notably low energy consumption, the cost of activated carbon production is reduced to $1.56 per pound. The current listed price of activated carbon from coconut shell on the Internet varies from the US$2.83
to US$4.8 per pound (Delta Adsorbent 2018). The acoustic activation concept is still in its very early stages of devel-opment. The observed synergisms of sorghum BC of Chen et al. (2014) likely depend on biomass origin, the thermal history of BC, and treatment conditions. Moreover, surface functionality and pollutant adsorption capacity have not been systematically investigated. Nevertheless, our recent studies revealed that ultrasound treatment of BC in a CO
2/
H2O system enhances the adsorption capacity of spilled
oil in contaminated water. We also found that ultrasound-assisted functionalization of BC enhances the CO
2 capture
capacity up to 9 times greater than that of raw BC. As a summary, recent studies of ultrasound activation of BC have demonstrated that it is a fruitful research topic that can lead to many exciting new technologies. Ultrasound-assisted surface modification of BC seems to be an emerg-ing research topic to explore.
2.4 Plasma activation
Plasma is the fourth state of matter, which, unlike the other three (gas, liquid, and solid), does not naturally exist and is produced by electric discharge. Electric current and voltage affect the neutral and charged parti-cles in the plasma, which, in turn, affect the temperature and ionization density of the plasma. Plasma systems are typically classified on the basis of their plasma gen-eration method, and/or thermodynamic equilibrium state of the plasma. In the former, direct current, alternate current, radiofrequency (RF), and microwave make the main plasma generators, and the latter category is divided
3.75 l CO2
3.75 l recycled CO2
50°C–100°C
1–100 atm
Biochar
activation unit2.57 l CO2
2.5 ml H2O
0.8 g Activated
biochar
Ultrasonic irradiation
2.5 ml recycled H2O
1 g biochar
2.5 ml H2O
Figure 9: The proposed biochar activation by ultrasound.Raw biochar is produced from inert-gas pyrolysis of biomass in bio-oil production or lignin after pretreatment in a biological conversion of biomass. The proposed activation is conducted at 65°C, a temperature that is well below traditional char activation temperatures, 600–900°C. The activated biochar has a significantly higher internal surface area and will be tested for adsorption of pollutants in water and waste water (Chen et al. 2014, Mulabagal et al. 2017).
Brought to you by | University of Michigan-Flint
Authenticated
Download Date | 9/17/18 4:43 PM

32 B. Sajjadi et al.: Activation of biochar for energy and environment
into equilibrium plasma (high temperature or fusion plasma), quasi-equilibrium plasma (thermal plasma or low-temperature plasma), and nonequilibrium plasma (nonthermal plasma [NTP] or cold plasma) (Karim et al. 2017). Depending upon the application, thermal plasma reactors operate with power levels ranging from few hundred watts to tens of megawatts (Karim et al. 2017). The thermal plasma process is a promising method for pyrolysis and gasification. Compared with conventional heating in traditional furnaces or reactors, the presence of a highly active plasma environment with different acti-vated ions, electrons, atoms, and molecule in plasma reactors leads to a higher energy density, faster reaction rate, and lower formation of heavy tarry compounds. Quick start-up and shut down of the plasma reactors due to their rapid heating and cooling rate are the other ben-efits of such reactors over conventional furnaces (Karim et al. 2017). NTP has also gained much attention in BC activation and modification. The high electron energy emitted by the plasma can easily break the surface chemi-cal bonds in a short duration (a few minutes to 30 min; Gupta et al. 2015, Niu et al. 2017) and chemically trans-form the surface to the desired textural properties with the least undesired changes. Unlike traditional activa-tion methods in which chemical washing and prolonged drying are of the necessary steps, no chemical compound is added to plasma system and no toxic pollutant is gen-erated as well; hence, plasma treatment is considered as an eco-friendly method (Niu et al. 2017). Depending on the desired functional groups to be created, the addi-tion of gas species is a key step in NTP modification. In order to increase the quantity of oxygen-containing func-tional groups on the surface, BC is usually exposed to the ionized oxygen for at least 0.1–5 min (maximum 60 min) within a temperature range of about 15–30°C (Lee 2013, pp. 39–40). According to Gudmundsson et al. (2000), four charged species can be formed in oxygen plasma: i) elec-trons; ii) +
2O created by electron impact ionization of the
O2 molecule and the metastable oxygen molecule O
2(a1∆
g);
iii) O+ created by electron impact ionization of excited oxygen atoms O(1D), oxygen atoms O(3P), and O
2 pair crea-
tion; and iv) O− created mainly by dissociative attachment. These species contribute to a set of chain reactions, which have been summarized by Gudmundsson et al. (2000), as also provided in Table 13. In these equations, O(3P) and O(1D) are very reactive atomic oxygens that tend to quickly bond with nearby molecules. The O atom in an excited singlet state is named O(1D), which is rapidly stabilized to O(3P) by collision with O
2 (R27) or a third party (M, e.g.
N2 if there is in the system [R28]). O atom in the ground-
level triplet state with two unpaired electrons is named
O(3P), which is rapidly combined with O2 to form ozone
(O(3P) + O2 + M → O
3 + M) (Biedenkapp et al. 1970, Gud-
mundsson et al. 2000, Kogelschatz 2003). These active species might react with carbon surface and generate oxygen-containing functional groups, especially carbonyl groups. Zhou et al. (2012) observed that plasma modifica-tion of activated carbon fibers using a mixture of N
2 and O
2
results in a significant increase in C=O (at 287.0 ev) (55.6%), a remarkable decrease in C-O (at 285.5 ev, C-OH, C-O-C) (46% reduction), and slight increases in COOH quantity. In the presence of steam, water ion clusters +
⋅2 2
(O H O) are generated, which are further dissociated to ˙OH (R28 and R29). Afterward, O
3 (which is produced from the reaction
between O(3P) and O2) might be consumed to produce ˙OH
(R30 and R31), participating in the generation of more oxygen-containing functional groups (OCFGs). Moreover, the presence of H
2O in the gas mixture facilitates the direct
decomposition of H2O into ˙OH via R32, and the ˙OH gen-
erated is involved in producing the OCFGs onto carbon surface (Bai et al. 2012, Niu et al. 2017). However, in dried oxygen-containing gas or air, reactive oxygen species +
2(O )
may be quenched due to its short lifetime.
+ +
+ + → ⋅ +2 2 2 2
O H O M O H O M (29)
+ +
⋅ + → + +⋅2 2 2 2 3
O H O H O O H O OH (30)
+ → +
2 3 2 2 2H O O H O O (31)
2 2H O OH OH→ +
⋅ ⋅ (32)
2e H O e OH H+ → + +
⋅ (33)
Niu et al. (2017) introduced different concentrations of moisture in a plasma containing N
2 and O
2. The authors
reported an increase in the C=O functional group up to 3-fold of that in raw BC (28.44% in modified BC versus 9.45% in raw BC), which, in turn, enhanced the adsorp-tion capacity of the modified BC for elemental mercury (Hg0) up to 3.2 and 4.7 times compared with two com-mercial activated carbons. The authors observed a slight decrease in the surface area and pore volume of modi-fied BCs due to the damage to pore structure. Although exposure to the ionized oxygen is normally used in plasma treatment of BC, other gases have also been used. In order to enhance energy storage in supercapaci-tors, Fan et al. (2016) activated BC by using a methane (10%)/argon mixture. The results showed a significant improvement in specific capacitance of BC (from 135.6 to
Brought to you by | University of Michigan-Flint
Authenticated
Download Date | 9/17/18 4:43 PM
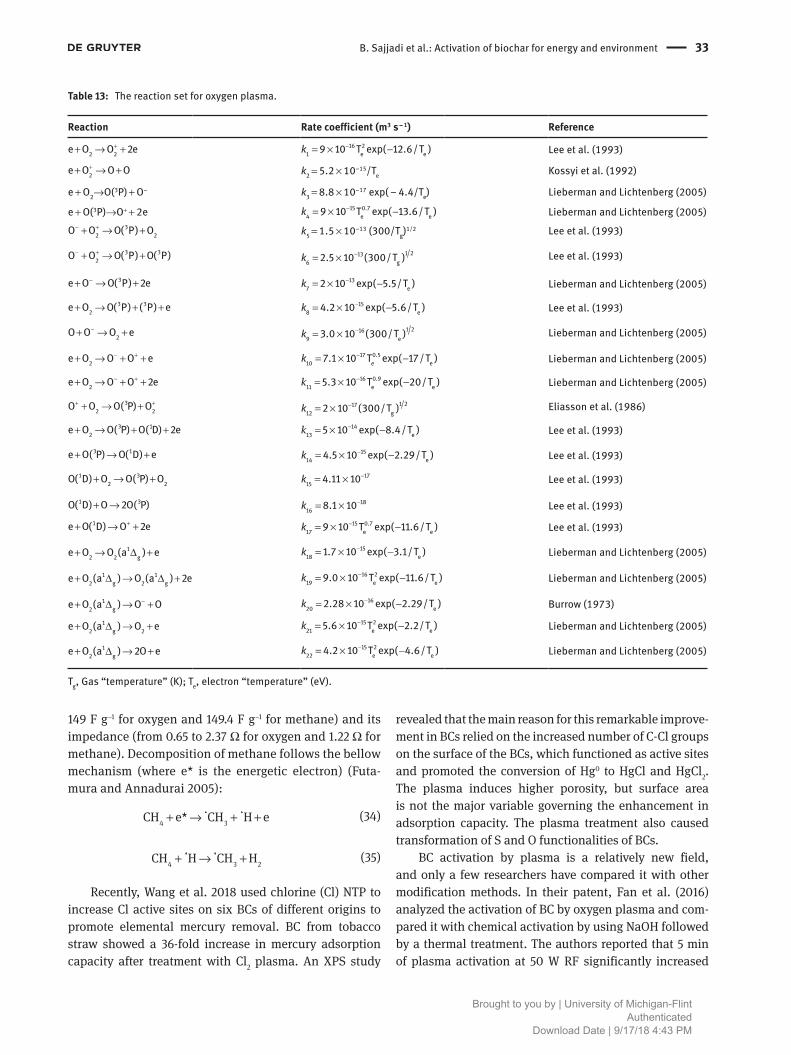
B. Sajjadi et al.: Activation of biochar for energy and environment 33
149 F g−1 for oxygen and 149.4 F g−1 for methane) and its impedance (from 0.65 to 2.37 Ω for oxygen and 1.22 Ω for methane). Decomposition of methane follows the bellow mechanism (where e* is the energetic electron) (Futa-mura and Annadurai 2005):
+ → + +4 3
CH e* CH H e⋅ ⋅ (34)
+ → +4 3 2
CH H CH H⋅ ⋅ (35)
Recently, Wang et al. 2018 used chlorine (Cl) NTP to increase Cl active sites on six BCs of different origins to promote elemental mercury removal. BC from tobacco straw showed a 36-fold increase in mercury adsorption capacity after treatment with Cl
2 plasma. An XPS study
revealed that the main reason for this remarkable improve-ment in BCs relied on the increased number of C-Cl groups on the surface of the BCs, which functioned as active sites and promoted the conversion of Hg0 to HgCl and HgCl
2.
The plasma induces higher porosity, but surface area is not the major variable governing the enhancement in adsorption capacity. The plasma treatment also caused transformation of S and O functionalities of BCs.
BC activation by plasma is a relatively new field, and only a few researchers have compared it with other modification methods. In their patent, Fan et al. (2016) analyzed the activation of BC by oxygen plasma and com-pared it with chemical activation by using NaOH followed by a thermal treatment. The authors reported that 5 min of plasma activation at 50 W RF significantly increased
Table 13: The reaction set for oxygen plasma.
Reaction Rate coefficient (m3 s − 1) Reference
2 2e O O 2e+
+ → +−
= × −16 2
1 e e9 10 T exp( 12.6/T )k Lee et al. (1993)
2e O O O+
+ → + k2 = 5.2 × 10⁻¹⁵/Te Kossyi et al. (1992)
e + O2→O(3P) + O− k3 = 8.8 × 10⁻¹⁷ exp( − 4.4/Te) Lieberman and Lichtenberg (2005)
e + O(3P)→O+ + 2e −= × −
15 0.74 e e
9 10 T exp( 13.6/T )k Lieberman and Lichtenberg (2005)3
2 2O O O( P) O− +
+ → + k5 = 1.5 × 10⁻¹³ (300/Tg)1/2 Lee et al. (1993)
3 32
O O O( P) O( P)− +
+ → +1 213
6 g2.5 10 (300/T )k −
= × Lee et al. (1993)
3e O O( P) 2e−+ → +
−= × −
137 e
2 10 exp( 5.5/T )k Lieberman and Lichtenberg (2005)
3 32
e O O( P) ( P) e+ → + +−
= × −15
8 e4.2 10 exp( 5.6/T )k Lee et al. (1993)
2O O O e−
+ → +−
= ×1 216
9 e3.0 10 (300/T )k Lieberman and Lichtenberg (2005)
2e O O O e− +
+ → + +−
= × −17 0.5
10 e7.1 10 T exp( 17/T )
ek Lieberman and Lichtenberg (2005)
2e O O O 2e− +
+ → + + k −= × −
16 0.911 e e
5.3 10 T exp( 20/T ) Lieberman and Lichtenberg (2005)
32 2
O O O( P) O+ ++ → + 1 217
12 g2 10 (300/T )k −
= × Eliasson et al. (1986)
3 12
e O O( P) O( D) 2e+ → + +14
13 e5 10 exp( 8.4/T )−
= × −k Lee et al. (1993)
3 1e O( P) O( D) e+ → +15
14 e4.5 10 exp( 2.29/T )k −
= × − Lee et al. (1993)
1 32 2
O( D) O O( P) O+ → +17
154.11 10k −
= × Lee et al. (1993)
1 3O( D) O 2O( P)+ →18
168.1 10k −
= × Lee et al. (1993)
1e O( D) O 2e++ → +
15 0.717 e e
9 10 T exp( 11.6/T )k −= × − Lee et al. (1993)
12 2 g
e O O (a ) e+ → ∆ +15
18 e1.7 10 exp( 3.1/T )k −
= × − Lieberman and Lichtenberg (2005)
1 12 g 2 g
e O (a ) O (a ) 2e+ ∆ → ∆ +16 2
19 e e9.0 10 T exp( 11.6/T )k −
= × − Lieberman and Lichtenberg (2005)
12 g
e O (a ) O O−+ ∆ → +
1620 e
2.28 10 exp( 2.29/T )k −= × − Burrow (1973)
12 g 2
e O (a ) O e+ ∆ → +15 2
21 e e5.6 10 T exp( 2.2/T )k −
= × − Lieberman and Lichtenberg (2005)
12 g
e O (a ) 2O e+ ∆ → +15 2
22 e e4.2 10 T exp( 4.6/T )k −
= × − Lieberman and Lichtenberg (2005)
Tg, Gas “temperature” (K); Te, electron “temperature” (eV).
Brought to you by | University of Michigan-Flint
Authenticated
Download Date | 9/17/18 4:43 PM

34 B. Sajjadi et al.: Activation of biochar for energy and environment
the oxygen content of BC (from 9.86 to 15.69%), while O content enhanced to the value of 12.86% in chemical acti-vation by NaOH. Gupta et al. (2015) reported that oxygen plasma activated yellow pine BC yielded much higher spe-cific capacitance (e.g. 171.4 F g−1) than chemically activated BC (99.5 F g−1) and untreated BC (60.4 F g−1). The authors also demonstrated that, unlike chemical activation, which created uniformly sized micropores, oxygen plasma effi-ciently created porous structures that combined micropo-res, mesopores, and macropores (Gupta et al. 2015).
The surface chemical bonds of carbonaceous com-pound can easily be broken by the highly active free radicals generated in plasma medium. Therefore, plasma treatment usually takes a short time. In most of the aforementioned examples, BCs have mainly been exposed to plasma for a minimum duration of 0.1–5 min to a maximum of 60 min (Lee 2013, pp. 39–40). Moreover, both high temperature (around 100°C; Gupta et al. 2015) and low temperature (e.g. room temperature; Lee 2013, pp. 39–40) can be used to introduce oxygen functional groups onto BC and increase BC O:C ratios. Besides, RF source (e.g. 13.56 MHz at an RF power of about 10–100 W) is used to ionize the oxygen. Therefore, a very low amount of energy is consumed in this procedure. However, the C and O content and their ratio depend on the competition of oxygen-containing functional groups. For example, C-C (284 eV) and C=O (287 eV) significantly increased, while an opposite trend was observed for C-O (285.5 eV). Hence, the resultant surface element (O/C) decreased in modified BC in the work of Zhou et al. (2012), while a slight increase in (O/C) was observed in the work of Niu et al. (2017) due to the significant increase in C=O (531.1 eV) and some other oxygen-containing peaks at 532.3 eV. Therefore, although plasma treatment can be considered as a promising tech-nique for BC modification or activation, it is not a simple process of introducing oxygen-containing functional groups into a sample surface, but a complicated process of tradeoff and refreshing.
2.5 Electro/electrochemical modification
An electric field can also modify the physicochemical properties of BC. Enhancement of BC surface area and impregnation of chemicals on the surface are simultane-ously achieved in electro or electrochemical modifica-tion, which was first suggested by Jung et al. (2015a). The authors successfully modified the physical (porosity) and chemical (functionality) properties of BC by applying a current of 93.96 mA/cm2 in a system of aluminum-based electrode with the presence of H
2SO
4 and NaOH solutions
within 5 min, followed by pyrolysis at 450°C for 2 h. Gen-erally, in the electrochemical process, hypochlorous acid and hypochlorite ions (HOCl/OCl−) are generated in the presence of NaCl solution. These two strong oxidants can significantly improve the porosity and morphology of BC. Simultaneously, if an aluminum electrode is used in the process, aluminum ions are generated at the anode side. These ions, which predominantly exist in the solution below pH 4.0, can be employed as a precursor for the for-mation of the nanosized crystalline structures containing aluminum (AlOOH, beohemite), which is an environmen-tally friendly material for applications in natural water, onto the BC surface (Jung et al. 2015a). Based on the afore-mentioned discussion, Jung and Ahn (2016) developed a combined electrochemical modification (CEM) method, using a graphite electrode-based electric field and MgCl
2
as the electrolyte, in their subsequent work. The authors immersed the dried marine macroalgae in the MgCl
2 solu-
tion prior to pyrolysis to prepare porosity-enhanced BC containing periclase (MgO) nanocomposites, under the voltage of 20 V for 10 min. The dual advantages of elec-trochemical modification of CEM-modified BC by using the aluminum and graphite electrode-based setup were further demonstrated by a significant increase (up to 4 (Jung et al. 2015a) to 7 (Jung and Ahn 2016) times) in BC adsorption capacities toward phosphate, compared to raw BC. MgCl
2 as an electrolyte creates strong oxidants (i.e.
HOCl and OCl−) in the aluminum-electrode-based system that further improves the porosity and texture properties of BC, and disperses of Mg-nanocomposites (e.g. MgO, spinel MgAl
2O
4, AlOOH, and Al
2O
3) on the surface resulted
in higher phosphate adsorption (Jung et al. 2015b). It should be noted that electric techniques have great poten-tiality in BC modification or activation. Therefore, further researches in this field are required, which can be an open topic for future work.
3 Conclusion
With the rapid increase in the application of BCs, the necessity of improving its physicochemical properties in an environmentally friendly manner at a reasonable cost, but with the most desired outcome, has become increas-ingly important. Therefore, studies on classic physical or chemical modification methods have significantly increased. Meanwhile, various promising strategies are also being developed. This review lays great emphasis on the physical modification and activation of BC that are cat-egorized into traditional gas modifications (using steam,
Brought to you by | University of Michigan-Flint
Authenticated
Download Date | 9/17/18 4:43 PM
B. Sajjadi et al.: Activation of biochar for energy and environment 35
CO2, ozone, and air), thermal modifications (conventional
and microwave), and the most recent techniques includ-ing ultrasound modification, plasma modification, and electrochemical modification. Moreover, the synergistic and antagonistic interaction between pyrolysis and modi-fication conditions was presented with significant atten-tion to their effects on micro/macro surface area (S
micro and
SBET
), micro/macro pore volume (Vmicro
and Vmacro
), total pore volume (V
p), pore size (R
p), ash content, pH, aroma-
ticity (H/C), and polarity (O + N)/C of BC. In addition, the effect of each activation method on the distribution of the various functional groups and their impacts on BC appli-cations were discussed. This review also highlighted the effect of each modification method on its related BC appli-cation, along with the recent advances that are undergo-ing more research studies and are therefore open topics for future works.
Acknowledgments: The authors are grateful for the finan-cial support by the National Science Foundation (NSF EPSCoR RII grant no. OIA-1632899). Various other sup-port from the University of Mississippi is also gratefully acknowledged.
References
Abioye AM, Ani FN. The characteristics of oil palm shell biochar and activated carbon produced via microwave heating. Appl Mech Mater 2015; 695: 12–15.
Ahmad I, Khan MA, Shakirullah M, Ishaq M. Effect of leaching time on the removal of lithophile elements of operational concern from coal samples. J Chem Soc Pak 2004; 26: 107–110.
Ahmed MJ. Application of agricultural based activated carbons by microwave and conventional activations for basic dye adsorption: review. J Environ Chem Eng 2016; 4: 89–99.
Ahmed MB, Zhou JL, Ngo HH, Guo W, Chen M. Progress in the preparation and application of modified biochar for improved contaminant removal from water and wastewater. Bioresource Technol 2016; 214: 836–851.
Andreozzi R, Caprio V, Insola A, Marotta R. Advanced oxidation processes (AOP) for water purification and recovery. Catalysis Today 1999; 53: 51–59.
Angın D, Altintig E, Köse TE. Influence of process parameters on the surface and chemical properties of activated carbon obtained from biochar by chemical activation. Bioresource Technol 2013a; 148: 542–549.
Angın D, Köse TE, Selengil U. Production and characterization of activated carbon prepared from safflower seed cake biochar and its ability to absorb reactive dyestuff. Appl Surf Sci 2013b; 280: 705–710.
Arriagada R, García R. Molina-Sabio M, Rodriguez-Reinoso F. Effect of steam activation on the porosity and chemical nature of activated carbons from Eucalyptus globulus and peach stones. Microporous Mater 1997; 8: 123–130.
Atkinson R, Arey J. Gas-phase tropospheric chemistry of biogenic volatile organic compounds: a review. Atmospheric Environ 2003; 37: 197–219.
Aworn A, Thiravetyan P, Nakbanpote W. Preparation and characteristics of agricultural waste activated carbon by physical activation having micro- and mesopores. J Analytical Appl Pyrolysis 2008; 82: 279–285.
Aygün A, Yenisoy-Karakaş S, Duman I. Production of granular activated carbon from fruit stones and nutshells and evaluation of their physical, chemical and adsorption properties. Microporous Mesoporous Mater 2003; 66: 189–195.
Bach MT. Impact of surface chemistry on adsorption: tailoring of activated carbon. Florida: University of Florida, 2007.
Bach Q-V, Chen W-H, Chu Y-S, Skreiberg Ø. Predictions of biochar yield and elemental composition during torrefaction of forest residues. Bioresour Technol 2016; 215: 239–246.
Bai M, Zhang Z, Bai M. Simultaneous desulfurization and denitrification of flue gas by ·OH radicals produced from O2+ and water vapor in a duct. Environ Sci Technol 2012; 46: 10161–10168.
Bailey PS. Ozonation in organic chemistry volume 1: olefinic compounds. New York: Academic Press, 1978.
Bailey PS. Ozonation in organic chemistry volume 2: nonolefinic compounds. New York: Academic Press, 1982.
Bamdad H, Hawboldt K, MacQuarrie S. A review on common adsorbents for acid gases removal: focus on biochar. Renew Sust Energ Rev 2017; 81: 1705–1720.
Biedenkapp D, Hartshorn LG, Bair EJ. The O(1D) + H2O reaction. Chem Phys Lett 1970; 5: 379–381.
Biniak S, Pakuła M, Szymański GS, Światkowski A. Effect of activated carbon surface oxygen- and/or nitrogen-containing groups on adsorption of copper(II) ions from aqueous solution. Langmuir 1999; 15: 6117–6122.
Blyholder G, Eyring H. Kinetics of graphite oxidation II. J Phys Chem 1959; 63: 1004–1008.
Boehm HP. Chemical identification of surface groups. Adv Catal 1966; 16: 179–274.
Boehm HP. Surface oxides on carbon and their analysis: a critical assessment. Carbon 2002; 40: 145–149.
Bulanin KM, Lavalley JC, Tsyganenko AA. IR spectra of adsorbed ozone. Colloids Surf A Physicochem Eng Asp 1995; 101: 153–158.
Burrow PD. Dissociative attachment from the O2(a1∆g) state. J Chem Phys 1973; 59: 4922–4931.
Calo JM, Hall PJ. Applications of energetic distributions of oxygen surface complexes to carbon and char reactivity and characterization. In: Lahaye J, Ehrburger P, editors. Fundamental issues in control of carbon gasification reactivity. Springer Netherlands, Dordrecht, 1991: 329–368.
Carrier M, Hardie AG, Uras Ü, Görgens J, Knoetze J. Production of char from vacuum pyrolysis of South-African sugar cane bagasse and its characterization as activated carbon and biochar. J Anal Appl Pyrolysis 2012; 96: 24–32.
Cataldo F. Ozone reaction with carbon nanostructures. 2: the reaction of ozone with milled graphite and different carbon black grades. J Nanosci Nanotechnol 2007; 7: 1446–1454.
Cha JS, Park SH, Jung S-C, Ryu C, Jeon J-K, Shin M-C, Park Y-K. Production and utilization of biochar: a review. J Ind Eng Chem 2016; 40: 1–15.
Chatel G, Colmenares JC. Sonochemistry: from basic principles to innovative applications. Top Curr Chem 2017; 375: 8.
Brought to you by | University of Michigan-Flint
Authenticated
Download Date | 9/17/18 4:43 PM

36 B. Sajjadi et al.: Activation of biochar for energy and environment
Chen N, Yang RT. Ab Initio molecular orbital study of the unified mechanism and pathways for gas-carbon reactions. J Phys Chem A 1998; 102: 6348–6356.
Chen X, Farber M, Gao Y, Kulaots I, Suuberg EM, Hurt RH. Mechanisms of surfactant adsorption on non-polar, air-oxidized and ozone-treated carbon surfaces. Carbon 2003; 41: 1489–1500.
Chen W-Y, Shi G, Wan S. Characterization of early-stage coal oxidation by temperature-programmed desorption. Energy Fuels 2008; 22: 3724–3735.
Chen W-Y, Mattern DL, Okinedo E, Senter JC, Mattei AA, Redwine CW. Photochemical and acoustic interactions of biochar with CO2 and H2O: applications in power generation and CO2 capture. AIChE J 2014; 60: 1054–1065.
Chen W-H, Peng J, Bi XT. A state-of-the-art review of biomass torrefaction, densification and applications. Renew Sust Energ Rev 2015; 44: 847–866.
Chen D, Chen X, Sun J, Zheng Z, Fu K. Pyrolysis polygeneration of pine nut shell: quality of pyrolysis products and study on the preparation of activated carbon from biochar. Bioresour Technol 2016; 216: 629–636.
Chen W-H, Hsu H-J, Kumar G, Budzianowski WM, Ong HC. Predictions of biochar production and torrefaction performance from sugarcane bagasse using interpolation and regression analysis. Bioresour Technol 2017; 246: 12–19.
Chiang H-L, Chiang PC, Huang CP. Ozonation of activated carbon and its effects on the adsorption of VOCs exemplified by methylethylketone and benzene. Chemosphere 2002a; 47: 267–275.
Chiang H-L, Huang CP, Chiang PC. The surface characteristics of activated carbon as affected by ozone and alkaline treatment. Chemosphere 2002b; 47: 257–265.
Choi G-G, Oh S-J, Lee S-J, Kim J-S. Production of bio-based phenolic resin and activated carbon from bio-oil and biochar derived from fast pyrolysis of palm kernel shells. Bioresour Technol 2015; 178: 99–107.
Chu G, Zhao J, Chen F, Dong X, Zhou D, Liang N, Wu M, Pan B, Steinberg CEW. Physi-chemical and sorption properties of biochars prepared from peanut shell using thermal pyrolysis and microwave irradiation. Environ Pollut 2017; 227: 372–379.
Claoston N, Samsuri AW, Husni MHA, Amran MSM. Effects of pyrolysis temperature on the physicochemical properties of empty fruit bunch and rice husk biochars. Waste Manag Res 2014; 32: 331–339.
Cookson J. Adsorption mechanism: the chemistry of organic adsorption on activated carbon. In: Cheremisinoff PN, Ellerbuseh F, editors. Carbon adsorption handbook. New York: Ann Arbor Science, 1978: 241–280.
Corapcioglu MO, Huang CP. The surface acidity and characterization of some commercial activated carbons. Carbon 1987; 25: 569–578.
Dalai AK, Azargohar R. Production of activated carbon from biochar using chemical and physical activation: mechanism and modeling, materials, chemicals, and energy from forest biomass. Am Chem Soc 2007; 463–476.
Daniel JJ. Introduction to atmospheric chemistry, Chapter 10. Princeton, New Jersey: Princeton University Press, 1999.
Dastgheib SA, Karanfil T. Adsorption of oxygen by heat-treated granular and fibrous activated carbons. J Colloid Interface Sci 2004; 274: 1–8.
de Caprariis B, De Filippis P, Hernandez AD, Petrucci E, Petrullo A, Scarsella M, Turchi M. Pyrolysis wastewater treatment by adsorption on biochars produced by poplar biomass. J Environ Manage 2017; 197: 231–238.
Dehkhoda AM, Gyenge E, Ellis N. A novel method to tailor the porous structure of KOH-activated biochar and its application in capacitive deionization and energy storage. Biomass Bioenerg 2016; 87: 107–121.
Delta Adsorbent. Activated carbon granular coconut shell based 4 × 8 mesh. Delta Enterprises Inc. 2018. https://www.deltaadsorbents.com/activated-carbon-coconut-shell-granular.
Demiral H, Demiral İ, Karabacakoğlu B, Tümsek F. Production of activated carbon from olive bagasse by physical activation. Chem Eng Res Des 2011; 89: 206–213.
Deng H, Yang L, Tao G, Dai J. Preparation and characterization of activated carbon from cotton stalk by microwave assisted chemical activation – application in methylene blue adsorption from aqueous solution. J Hazard Mater 2009; 166: 1514–1521.
Deng H, Li G, Yang H, Tang J, Tang J. Preparation of activated carbons from cotton stalk by microwave assisted KOH and K2CO3 activation. Chem Eng J 2010; 163: 373–381.
Derry GN. Chapter 5-Surface segregation in binary metal alloys A2. Nalwa, Hari Singh, Handbook of surfaces and interfaces of materials. Burlington: Academic Press, 2001: 329–382.
Dodevski V, Stojmenović M, Vujković M, Krstić J, Krstić S, Bajuk-Bogdanović D, Kuzmanović B, Kaluđerović B, Mentus S. Complex insight into the charge storage behavior of active carbons obtained by carbonization of the plane tree seed. Electrochim Acta 2016; 222: 156–171.
Dodevski V, Janković B, Stojmenović M, Krstić S, Popović J, Pagnacco MC, Popović M, Pašalić S. Plane tree seed biomass used for preparation of activated carbons (AC) derived from pyrolysis. Modeling the activation process. Colloids Surf A Physicochem Eng Asp 2017; 522: 83–96.
Dong X, Ma LQ, Zhu Y, Li Y, Gu B. Mechanistic investigation of mercury sorption by brazilian pepper biochars of different pyrolytic temperatures based on x-ray photoelectron spectroscopy and flow calorimetry. Environ Sci Technol 2013; 47: 12156–12164.
El-Sheikh AH, Newman AP, Al-Daffaee HK, Phull S, Cresswell N. Characterization of activated carbon prepared from a single cultivar of Jordanian Olive stones by chemical and physicochemical techniques. J Anal Appl Pyrolysis 2004; 71: 151–164.
Eliasson B, Kogelschatz U, Boveri ABBAB, Segelhof BBF. Basic data for modelling of electrical discharges in gases: oxygen. ABB Asea Brown Boveri, Baden, 1986.
Emmerich WE, Frasier GW, Fink DH. Relation between soil properties and effectiveness of low-cost water-harvesting treatments. Sci Soc Am J 1987; 51: 213–219.
Fan M, Marshall W, Daugaard D, Brown RC. Steam activation of chars produced from oat hulls and corn stover. Bioresour Technol 2004; 93: 103–107.
Fan QH, Dubey MK, Gu ZR. Method for plasma activation of biochar material. Google Patents, 2016.
Fang Q, Chen B, Lin Y, Guan Y. Aromatic and hydrophobic surfaces of wood-derived biochar enhance perchlorate adsorption via hydrogen bonding to oxygen-containing organic groups. Environ Sci Technol 2014; 48: 279–288.
Brought to you by | University of Michigan-Flint
Authenticated
Download Date | 9/17/18 4:43 PM

B. Sajjadi et al.: Activation of biochar for energy and environment 37
Feng D, Zhao Y, Zhang Y, Sun S, Meng S, Guo Y, Huang Y. Effects of K and Ca on reforming of model tar compounds with pyrolysis biochars under H2O or CO2. Chem Eng J 2016; 306: 422–432.
Feng D, Zhao Y, Zhang Y, Gao J, Sun S. Changes of biochar physiochemical structures during tar H2O and CO2 heterogeneous reforming with biochar. Fuel Process Technol 2017a; 165: 72–79.
Feng D, Zhao Y, Zhang Y, Zhang Z, Che H, Sun S. Experimental comparison of biochar species on in-situ biomass tar H2O reforming over biochar. Int J Hydrogen Energy 2017b; 42: 24035–24046.
Feng D, Zhao Y, Zhang Y, Zhang Z, Zhang L, Gao J, Sun S. Synergetic effects of biochar structure and AAEM species on reactivity of H2O-activated biochar from cyclone air gasification. Int J Hydrogen Energy 2017c; 42: 16045–16053.
Feng D, Zhang Y, Zhao Y, Sun S, Gao J. Improvement and maintenance of biochar catalytic activity for in-situ biomass tar reforming during pyrolysis and H2O/CO2 gasification. Fuel Process Technol 2018; 172: 106–114.
Ferreira SD, Lazzarotto IP, Junges J, Manera C, Godinho M, Osório E. Steam gasification of biochar derived from elephant grass pyrolysis in a screw reactor. Energy Convers Manag 2017; 153: 163–174.
Foo KY, Hameed BH. Microwave-assisted preparation of oil palm fiber activated carbon for methylene blue adsorption. Chem Eng J 2011a; 166: 792–795.
Foo KY, Hameed BH. Preparation and characterization of activated carbon from pistachio nut shells via microwave-induced chemical activation. Biomass Bioenergy 2011b; 35: 3257–3261.
Foo KY, Hameed BH. Utilization of rice husks as a feedstock for preparation of activated carbon by microwave induced KOH and K2CO3 activation. Bioresour Technol 2011c; 102: 9814–9817.
Foo KY, Hameed BH. Preparation, characterization and evaluation of adsorptive properties of orange peel based activated carbon via microwave induced K2CO3 activation. Bioresour Technol 2012a; 104: 679–686.
Foo KY, Hameed BH. Textural porosity, surface chemistry and adsorptive properties of durian shell derived activated carbon prepared by microwave assisted NaOH activation. Chem Eng J 2012b; 187: 53–62.
Franklin RE. Crystallite growth in graphitizing and non-graphitizing carbons. Proc R Soc Lond A Math Phys Sci 1951; 209: 196–218.
Fu K, Yue Q, Gao B, Sun Y, Zhu L. Preparation, characterization and application of lignin-based activated carbon from black liquor lignin by steam activation. Chem Eng J 2013; 228: 1074–1082.
Futamura S, Annadurai G. Plasma reforming of aliphatic hydrocarbons with CO2. IEEE Trans Ind Appl 2005; 41: 1515–1521.
Girgis BS, Soliman AM, Fathy NA. Development of micro-mesoporous carbons from several seed hulls under varying conditions of activation. Micropor Mesopor Mater 2011; 142: 518–525.
Glaze WH, Kang JW. Advanced oxidation processes. Description of a kinetic model for the oxidation of hazardous materials in aqueous media with ozone and hydrogen peroxide in a semibatch reactor. Ind Eng Chem Res 1989; 28: 1573–1580.
Glaze WH, Kang JW, Chapin DH. The chemistry of water treatment processes involving ozone, hydrogen peroxide and ultraviolet radiation, ozone. Sci Eng 1987; 9: 335–352.
Gogoi D, Bordoloi N, Goswami R, Narzari R, Saikia R, Sut D, Gogoi L, Kataki R. Effect of torrefaction on yield and quality of pyrolytic products of arecanut husk: an agro-processing wastes. Bioresour Technol 2017; 242: 36–44.
Gómez-Serrano V, Álvarez PM, Jaramillo J, Beltrán FJ. Formation of oxygen complexes by ozonation of carbonaceous materials prepared from cherry stones. Carbon 2002; 40: 513–522.
González ME, Cea M, Reyes D, Romero-Hermoso L, Hidalgo P, Meier S, Benito N, Navia R. Functionalization of biochar derived from lignocellulosic biomass using microwave technology for catalytic application in biodiesel production. Energy Convers Manag 2017; 137: 165–173.
Grima-Olmedo C, Ramírez-Gómez Á, Gómez-Limón D, Clemente-Jul C. Activated carbon from flash pyrolysis of eucalyptus residue. Heliyon 2016; 2: e00155.
Gudmundsson JT, Marakhtanov AM, Patel KK, Gopinath VP, Lieberman MA. On the plasma parameters of a planar inductive oxygen discharge. J Phys D Appl Phys 2000; 33: 1323–1331.
Gümüş D, Akbal F. A comparative study of ozonation, iron coated zeolite catalyzed ozonation and granular activated carbon catalyzed ozonation of humic acid. Chemosphere 2017; 174: 218–231.
Guo S, Peng J, Li W, Yang K, Zhang L, Zhang S, Xia H. Effects of CO2 activation on porous structures of coconut shell-based activated carbons. Appl Surf Sci 2009; 255: 8443–8449.
Gupta RK, Dubey M, Kharel P, Gu Z, Fan QH. Biochar activated by oxygen plasma for supercapacitors. J Power Sources 2015; 274: 1300–1305.
Hammes K, Schmidt MWI. Changes of biochar in soil. In: Lehmann J, Joseph S, editors. Biochar for environmental management, science and technology. United Kingdom: EarthScan, 2009.
Han Y, Boateng AA, Qi PX, Lima IM, Chang J. Heavy metal and phenol adsorptive properties of biochars from pyrolyzed switchgrass and woody biomass in correlation with surface properties. J Environ Manage 2013; 118: 196–204.
Han L, Qian L, Yan J, Chen M. Effects of the biochar aromaticity and molecular structures of the chlorinated organic compounds on the adsorption characteristics. Environ Sci Pollut Res 2017; 24: 5554–5565.
Heras F, Castrodá S, Alonso-Morales N, Gilarranz MA, González V, Rodríguez JJ. Activation with oxygen of the char obtained by waste tyres rubber pyrolysis. Madrid: Universidad Autónoma de Madrid, 2004.
Heras F, Alonso N, Gilarranz MÁ, Rodriguez JJ. Activation of waste tire char upon cyclic oxygen chemisorption-desorption. Ind Eng Chem Res 2009; 48: 4664–4670.
Herath I, Kumarathilaka P, Al-Wabel MI, Abduljabbar A, Ahmad M, Usman ARA, Vithanage M. Mechanistic modeling of glyphosate interaction with rice husk derived engineered biochar. Micropor Mesopor Mater 2016; 225: 280–288.
Hermann G, HÜttinger KJ. Mechanism of water vapour gasification of carbon – a new model. Carbon 1986; 24: 705–713.
Hinman JJ, Suslick KS. Nanostructured materials synthesis using ultrasound. Top Curr Chem 2017; 375: 12.
Huang Y-F, Chiueh P-T, Kuan W-H, Lo S-L. Microwave pyrolysis of lignocellulosic biomass: heating performance and reaction kinetics. Energy 2016; 100: 137–144.
Huff MD, Lee JW. Biochar-surface oxygenation with hydrogen peroxide. J Environ Manage 2016; 165: 17–21.
Brought to you by | University of Michigan-Flint
Authenticated
Download Date | 9/17/18 4:43 PM

38 B. Sajjadi et al.: Activation of biochar for energy and environment
Hulicova-Jurcakova D, Seredych M, Lu GQ, Bandosz TJ. Combined effect of nitrogen- and oxygen-containing functional groups of microporous activated carbon on its electrochemical performance in supercapacitors. Adv Funct Mater 2009; 19: 438–447.
Ince NH, Tezcanli G, Belen RK, Apikyan İG. Ultrasound as a catalyzer of aqueous reaction systems: the state of the art and environmental applications. Appl Catal B Environ 2001; 29: 167–176.
Ippolito JA, Strawn DG, Scheckel KG, Novak JM, Ahmedna M, Niandou MA. Macroscopic and molecular investigations of copper sorption by a steam-activated biochar. J Environ Qual 2012; 41: 1150–1156.
Işıtan S, Ceylan S, Topcu Y, Hintz C, Tefft J, Chellappa T, Guo J, Goldfarb JL. Product quality optimization in an integrated biorefinery: conversion of pistachio nutshell biomass to biofuels and activated biochars via pyrolysis. Energy Convers Manag 2016; 127: 576–588.
Jans U, Hoigné J. Activated carbon and carbon black catalyzed transformation of aqueous ozone into OH-radicals. Ozone Sci Eng 1998; 20: 67–90.
Jimenez-Cordero D, Heras F, Alonso-Morales N, Gilarranz MA, Rodriguez JJ. Ozone as oxidation agent in cyclic activation of biochar. Fuel Process Technol 2015; 139: 42–48.
Jin H, Wang X, Gu Z, Anderson G, Muthukumarappan K. Distillers dried grains with soluble (DDGS) bio-char based activated carbon for supercapacitors with organic electrolyte tetraethylammonium tetrafluoroborate. J Environ Chem Eng 2014; 2: 1404–1409.
Jung K-W, Ahn K-H. Fabrication of porosity-enhanced MgO/biochar for removal of phosphate from aqueous solution: application of a novel combined electrochemical modification method. Bioresour Technol 2016; 200: 1029–1032.
Jung S-H, Kim J-S. Production of biochars by intermediate pyrolysis and activated carbons from oak by three activation methods using CO2. J Anal Appl Pyrolysis 2014; 107: 116–122.
Jung C, Park J, Lim KH, Park S, Heo J, Her N, Oh J, Yun S, Yoon Y. Adsorption of selected endocrine disrupting compounds and pharmaceuticals on activated biochars. J Hazard Mater 2013; 263: 702–710.
Jung K-W, Hwang M-J, Jeong T-U, Ahn K-H. A novel approach for preparation of modified-biochar derived from marine macroalgae: dual purpose electro-modification for improvement of surface area and metal impregnation. Bioresour Technol 2015a; 191: 342–345.
Jung K-W, Jeong T-U, Hwang M-J, Kim K, Ahn K-H. Phosphate adsorption ability of biochar/Mg–Al assembled nanocomposites prepared by aluminum-electrode based electro-assisted modification method with MgCl2 as electrolyte. Bioresour Technol 2015b; 198: 603–610.
Kamm S, Möhler O, Naumann KH, Saathoff H, Schurath U. The heterogeneous reaction of ozone with soot aerosol. Atmos Environ 1999; 33: 4651–4661.
Kaptijn JP. The Ecoclear® Process. Results from full-scale installations. Ozone Sci Eng 1997; 19: 297–305.
Karim AA, Kumar M, Singh SK, Panda CR, Mishra BK. Potassium enriched biochar production by thermal plasma processing of banana peduncle for soil application. J Anal Appl Pyrolysis 2017; 123: 165–172.
Kastner JR, Miller J, Das KC, Pyrolysis conditions and ozone oxidation effects on ammonia adsorption in biomass generated chars. J Hazard Mater 2009; 164: 1420–1427.
Keiluweit M, Nico PS, Johnson MG, Kleber M. Dynamic molecular structure of plant biomass-derived black carbon (biochar). Environ Sci Technol 2010; 44: 1247–1253.
Kim B-S, Lee HW, Park SH, Baek K. Removal of Cu2 + by biochars derived from green macroalgae. Environ Sci Pollu Res Int 2016; 23: 985–994.
Kinoshita K. Carbon: electrochemical and physicochemical properties. New York: Wiley, 1988.
Kleber M, Hockaday W, Nico PS. Characteristics of biochar: macro-molecular properties, Chapter 6. In: Lehmann J, Joseph S, editors. Biochar for environmental management: science and technology and implementation. New York: Routledge, 2015.
Klüpfel L, Keiluweit M, Kleber M, Sander M. Redox properties of plant biomass-derived black carbon (biochar). Environ Sci Technol 2014; 48: 5601–5611.
Kogelschatz U. Dielectric-barrier discharges: their history, discharge physics, and industrial applications. Plasma Chem Plasma Process 2003; 23: 1–46.
Kohno M, Mokudai T, Ozawa T, Niwano Y. Free radical formation from sonolysis of water in the presence of different gases. J Clin Biochem Nutr 2011; 49: 96–101.
Kołtowski M, Hilber I, Bucheli TD, Oleszczuk P. Effect of steam activated biochar application to industrially contaminated soils on bioavailability of polycyclic aromatic hydrocarbons and ecotoxicity of soils. Sci Total Environ 2016; 566: 1023–1031.
Kołtowski M, Charmas B, Skubiszewska-Zięba J, Oleszczuk P. Effect of biochar activation by different methods on toxicity of soil contaminated by industrial activity. Ecotoxicol Environ Saf 2017a; 136: 119–125.
Kołtowski M, Hilber I, Bucheli TD, Charmas B, Skubiszewska-Zięba J, Oleszczuk P. Activated biochars reduce the exposure of polycyclic aromatic hydrocarbons in industrially contaminated soils. Chem Eng J 2017b; 310, Part 1: 33–40.
Komiyama T, Kobayashi A, Yahagi M. The chemical characteristics of ashes from cattle, swine and poultry manure. J Mater Cycles Waste Manage 2013; 15: 106–110.
Kossyi IA, Kostinsky AY, Matveyev AA, Silakov VP. Kinetic scheme of the non-equilibrium discharge in nitrogen-oxygen mixtures. Plasma Sources Sci Technol 1992; 1: 207–220.
Kwiatkowski M, Broniek E. An analysis of the porous structure of activated carbons obtained from hazelnut shells by various physical and chemical methods of activation. Colloids Surf A Physicochem Eng Asp 2017; 529: 443–453.
Laine NR, Vastola FJ, Walker PL. The importance of active surface area in the carbon-oxygen reaction. J Phys Chem 1963; 67: 2030–2034.
Lam SS, Liew RK, Wong YM, Peter Yek NY, Ma NL, Lee CL, Chase HA. Microwave-assisted pyrolysis with chemical activation, an innovative method to convert orange peel into activated carbon with improved properties as dye adsorbent. J Clean Prod 2017; 162: 1376–1387.
Langlais B, Reckhow DA, Brink DR. Ozone in water treatment: application and engineering. Boca Roton, Florida: CRC Press, 1991.
Laurendeau NM. Heterogeneous kinetics of coal char gasification and combustion. Prog Energy Combust Sci 1978; 4: 221–270.
Lee JW. Advanced biofuels and bioproducts. Springer New York Heidelberg Dordrecht London, London, 2013: 1101.
Brought to you by | University of Michigan-Flint
Authenticated
Download Date | 9/17/18 4:43 PM

B. Sajjadi et al.: Activation of biochar for energy and environment 39
Lee C, Graves DB, Lieberman MA, Hess DW. Global model of plasma chemistry in a high density oxygen discharge. J. Electrochem. Soc. 1993; 141: 1546–1555.
Lee G, Lee B, Kim J, Cho K. Ozone Adsorption on graphene: ab initio study and experimental validation. J Phys Chem C 2009; 113: 14225–14229.
Lee J, Yang X, Song H, Ok YS, Kwon EE. Effects of carbon dioxide on pyrolysis of peat. Energy 2017; 120: 929–936.
Lehmann J, Joseph S. Biochar for environmental management: science, technology and implementation. New York: Routledge, 2015: 976.
Li Y, Shao J, Wang X, Deng Y, Yang H, Chen H. Characterization of modified biochars derived from bamboo pyrolysis and their utilization for target component (furfural) adsorption. Energy Fuels 2014; 28: 5119–5127.
Li J, Dai J, Liu G, Zhang H, Gao Z, Fu J, He Y, Huang Y. Biochar from microwave pyrolysis of biomass: a review. Biomass Bioenergy 2016; 94: 228–244.
Li H, Dong X, da Silva EB, de Oliveira LM, Chen Y, Ma LQ. Mechanisms of metal sorption by biochars: biochar characteristics and modifications. Chemosphere 2017; 178: 466–478.
Lieberman MA, Lichtenberg AJ. Molecular collisions, principles of plasma discharges and materials processing. Hoboken, New Jersey: John Wiley & Sons, Inc., 2005: 235–283.
Lima IM, Marshall WE. Granular activated carbons from broiler manure: physical, chemical and adsorptive properties. Bioresour Technol 2005; 96: 699–706.
Lin B-J, Chen W-H. Sugarcane bagasse pyrolysis in a carbon dioxide atmosphere with conventional and microwave-assisted heating. Front Energy Res 2015; 3: 1–9.
Liu Q-S, Zheng T, Wang P, Guo L. Preparation and characterization of activated carbon from bamboo by microwave-induced phosphoric acid activation. Ind Crops Prod 2010; 31: 233–238.
Lua AC, Yang T. Effects of vacuum pyrolysis conditions on the characteristics of activated carbons derived from pistachio-nut shells. J Colloid Interface Sci 2004; 276: 364–372.
Lua AC, Yang T, Guo J. Effects of pyrolysis conditions on the properties of activated carbons prepared from pistachio-nut shells. J Anal Appl Pyrolysis 2004; 72: 279–287.
Lussier MG, Zhang Z, Miller DJ. Characterizing rate inhibition in steam/hydrogen gasification via analysis of adsorbed hydrogen. Carbon 1998; 36: 1361–1369.
Lützenkirchen J, Preočanin T, Kovačević D, Tomišić V, Lövgren L, Kallay N. Potentiometric titrations as a tool for surface charge determination. Croat Chem Acta 2012; 85: 391–417.
Mark HB, Mattson JS. Activated carbon: surface chemistry and adsorption from solution. In: Dekker M, editor. New York, 1971.
Marsh H, Reinoso FR. Activated carbon. Netherland: Elsevier, 2006.Marsh H, Heintz EA, Rodríguez-Reinoso F. Introduction to
carbon technologies. Universidad de Alicante, Servicio de Publicaciones, 1997.
Martín-Gullón I, Asensio M, Font R, Marcilla A. Steam-activated carbons from a bituminous coal in a continuous multistage fluidized bed pilot plant. Carbon 1996; 34: 1515–1520.
Mašek O, Budarin V, Gronnow M, Crombie K, Brownsort P, Fitzpatrick E, Hurst P. Microwave and slow pyrolysis biochar – comparison of physical and functional properties. J Anal Appl Pyrolysis 2013; 100: 41–48.
Mayakaduwa SS, Herath I, Ok YS, Mohan D, Vithanage M. Insights into aqueous carbofuran removal by modified and non-modified rice husk biochars. Environ Sci Pollu Res 2016; 24: 22755–22763.
Menéndez JA, Illán-Gómez MJ, y León CAL, Radovic LR. On the difference between the isoelectric point and the point of zero charge of carbons. Carbon 1995; 33: 1655–1657.
Menéndez JA, Domınguez A, Inguanzo M, Pis JJ. Microwave pyrolysis of sewage sludge: analysis of the gas fraction. J Anal Appl Pyrolysis 2004; 71: 657–667.
Menéndez JA, Domínguez A, Fernández Y, Pis JJ. Evidence of self-gasification during the microwave-induced pyrolysis of coffee hulls. Energy Fuels 2007; 21: 373–378.
Mohan D, Pittman CU, Steele PH. Pyrolysis of wood/biomass for bio-oil: a critical review. Energy Fuels 2006; 20: 848–889.
Mondal S, Aikat K, Halder G. Ranitidine hydrochloride sorption onto superheated steam activated biochar derived from mung bean husk in fixed bed column. J Environ Chem Eng 2016; 4: 488–497.
Moussavi G, Khosravi R. Preparation and characterization of a biochar from pistachio hull biomass and its catalytic potential for ozonation of water recalcitrant contaminants. Bioresour Technol 2012; 119: 66–71.
Mul G, Neeft JPA, Kapteijn F, Moulijn JA. The formation of carbon surface oxygen complexes by oxygen and ozone. The effect of transition metal oxides. Carbon 1998; 36: 1269–1276.
Mulabagal V, Baah DA, Egiebor NO, Chen WY. Biochar from biomass: a strategy for carbon dioxide sequestration, soil amendment, power generation, and CO2 utilization. In Handbook of Climate change mitigation and adaptation, 2nd edition, Vol. III. In: Chen WY, Suzuki T, Lackner M, editors. Switzerland: Springer International Publishing, 2017.
Nair V, Vinu R. Peroxide-assisted microwave activation of pyrolysis char for adsorption of dyes from wastewater. Bioresour Technol 2016; 216: 511–519.
Namazi AB, Allen DG, Jia CQ. Benefits of microwave heating method in production of activated carbon. Can J Chem Eng 2016; 94: 1262–1268.
Niu Q, Luo J, Xia Y, Sun S, Chen Q. Surface modification of bio-char by dielectric barrier discharge plasma for Hg0 removal. Fuel Process Technol 2017; 156: 310–316.
Oda H, Takeuchi M, Yokokawa C. Effect of air-oxidation on the pore-structure of coals and cokes or chars obtained from oxidized coals. Fuel 1981; 60: 390–396.
Park S-J, Jin S-Y. Effect of ozone treatment on ammonia removal of activated carbons. J Colloid Inter Sci 2005; 286: 417–419.
Park S-E, Sujandi, Green approaches via nanocatalysis with nanoporous materials: functionalization of mesoporous materials for single site catalysis. Curr Appl Phys 2008; 8: 664–668.
Park J, Hung I, Gan Z, Rojas OJ, Lim KH, Park S. Activated carbon from biochar: influence of its physicochemical properties on the sorption characteristics of phenanthrene. Bioresour Technol 2013; 149: 383–389.
Park SH, Cho HJ, Ryu C, Park Y-K. Removal of copper(II) in aqueous solution using pyrolytic biochars derived from red macroalga Porphyra tenera. J Ind Eng Chem 2016; 36: 314–319.
Park CM, Han J, Chu KH, Al-Hamadani YAJ, Her N, Heo J, Yoon Y. Influence of solution pH, ionic strength, and humic acid on cadmium adsorption onto activated biochar: experiment and modeling. J Ind Eng Chem 2017; 48: 186–193.
Brought to you by | University of Michigan-Flint
Authenticated
Download Date | 9/17/18 4:43 PM

40 B. Sajjadi et al.: Activation of biochar for energy and environment
Pethrick RA. Chemistry with ultrasound. Critical reports on applied chemistry, vol. 28. Edited by T. J. Mason, published for SCI by Elsevier Science Publishers, London, 1990. pp. vii + 195, price £46.00. ISBN 1-85166-422-X. Polymer International 1991; 24: 62–62.
Py X, Guillot A, Cagnon B. Activated carbon porosity tailoring by cyclic sorption/decomposition of molecular oxygen. Carbon 2003; 41: 1533–1543.
Qambrani NA, Rahman MM, Won S, Shim S, Ra C. Biochar properties and eco-friendly applications for climate change mitigation, waste management, and wastewater treatment: a review. Renew Sust Energ Rev 2017; 79: 255–273.
Qian K, Kumar A, Zhang H, Bellmer D, Huhnke R. Recent advances in utilization of biochar. Renew Sust Energ Rev 2015; 42: 1055–1064.
Qiu M, Sun K, Jin J, Gao B, Yan Y, Han L, Wu F, Xing B. Properties of the plant- and manure-derived biochars and their sorption of dibutyl phthalate and phenanthrene. Sci Rep 2014; 4: 5295.
Radovic LR, Silva IF, Ume JI, Menéndez JA, Leon CALY, Scaroni AW. An experimental and theoretical study of the adsorption of aromatics possessing electron-withdrawing and electron-donating functional groups by chemically modified activated carbons. Carbon 1997; 35: 1339–1348.
Rafiq MK, Bachmann RT, Rafiq MT, Shang Z, Joseph S, Long R. Influence of pyrolysis temperature on physico-chemical properties of corn stover (Zea mays L.) biochar and feasibility for carbon capture and energy balance. PLoS One 2016; 11: e0156894.
Rajapaksha AU, Vithanage M, Zhang M, Ahmad M, Mohan D, Chang SX, Ok YS. Pyrolysis condition affected sulfamethazine sorption by tea waste biochars. Bioresour Technol 2014; 166: 303–308.
Rajapaksha AU, Vithanage M, Ahmad M, Seo D-C, Cho J-S, Lee S-E, Lee SS, Ok YS. Enhanced sulfamethazine removal by steam-activated invasive plant-derived biochar. J Hazard Mater 2015; 290: 43–50.
Rajapaksha AU, Chen SS, Tsang DCW, Zhang M, Vithanage M, Mandal S, Gao B, Bolan NS, Ok YS. Engineered/designer biochar for contaminant removal/immobilization from soil and water: potential and implication of biochar modification. Chemosphere 2016; 148: 276–291.
Redmond JP, Walker PL. Hydrogen sorption on graphite at elevated temperatures. J Phys Chem 1960; 64: 1093–1099.
Rivera-Utrilla J, Sánchez-Polo M. Ozonation of 1,3,6-naphthalen-etrisul phonic acid catalysed by activated carbon in aqueous phase. Appl Catal B Environ 2002; 39: 319–329.
Rivera-Utrilla J, Sánchez-Polo M. Ozonation of naphthalenesulphonic acid in the aqueous phase in the presence of basic activated carbons. Langmuir 2004; 20: 9217–9222.
Rivera-Utrilla J, Sánchez-Polo M. Mondaca M, Zaror C. Effect of ozone and ozone/activated carbon treatments on genotoxic activity of naphthalenesulfonic acids. J Chem Technol Biotechnol 2002; 77: 883–890.
Rodríguez-Reinoso F, Molina-Sabio M, González MT. The use of steam and CO2 as activating agents in the preparation of activated carbons. Carbon 1995; 33: 15–23.
Ros A, Lillo-Ródenas MA, Fuente E, Montes-Morán MA, Martín MJ, Linares-Solano A. High surface area materials prepared from sewage sludge-based precursors. Chemosphere 2006; 65: 132–140.
Rosales E, Meijide J, Pazos M, Sanromán MA. Challenges and recent advances in biochar as low-cost biosorbent: from batch assays to continuous-flow systems. Bioresour Technol 2017; 246: 176–192.
Sánchez-Polo M, Rivera-Utrilla J. Effect of the ozone-carbon reaction on the catalytic activity of activated carbon during the degradation of 1,3,6-naphthalenetrisulphonic acid with ozone. Carbon 2003; 41: 303–307.
Sánchez-Polo M, von Gunten U, Rivera-Utrilla J. Efficiency of activated carbon to transform ozone into OH radicals: influence of operational parameters. Water Res 2005; 39: 3189–3198.
Santos RM, Santos AO, Sussuchi EM, Nascimento JS, Lima ÁS, Freitas LS. Pyrolysis of mangaba seed: production and characterization of bio-oil. Bioresour Technol 2015; 196: 43–48.
Saquing JM, Yu Y-H, Chiu PC. Wood-derived black carbon (biochar) as a microbial electron donor and acceptor. Environ Sci Technol Lett 2016; 3: 62–66.
Sattar A, Leeke GA, Hornung A, Wood J. Steam gasification of rapeseed, wood, sewage sludge and miscanthus biochars for the production of a hydrogen-rich syngas. Biomass Bioenergy 2014; 69: 276–286.
Schubert CC, Schubert SJ, Pease RN. The oxidation of lower paraffin hydrocarbons. I. Room temperature reaction of methane, propane, n-butane and isobutane with ozonized oxygen. J Am Chem Soc 1956a; 78: 2044–2048.
Schubert CC, Schubert SJ, Pease RN. The oxidation of lower paraffin hydrocarbons. II. Observations on the role of ozone in the slow combustion of isobutane. J Am Chem Soc 1956b; 78: 5553–5556.
Seinfeld JH, Pandis S. Atmospheric chemistry and physics, from air pollution to climate change, New York: Wiley-Interscience, 1998.
Shim T, Yoo J, Ryu C, Park Y-K, Jung J. Effect of steam activation of biochar produced from a giant Miscanthus on copper sorption and toxicity. Bioresour Technol 2015; 197: 85–90.
Shin S, Jang J, Yoon SH, Mochida I. A study on the effect of heat treatment on functional groups of pitch based activated carbon fiber using FTIR. Carbon 1997; 35: 1739–1743.
Smith M. Evolution of acidic functional groups on biochars by ozone oxidation to improve performance as a soil amendment. Biological and agricultural engineering. Washington State University, 2011.
Smith WR, Polley MH. The oxidation of graphitized carbon black. J Phys Chem 1956; 60: 689–691.
Song Y, Wang Y, Hu X, Xiang J, Hu S, Mourant D, Li T, Wu L, Li C-Z. Effects of volatile-char interactions on in-situ destruction of nascent tar during the pyrolysis and gasification of biomass. Part II. Roles of steam. Fuel 2015; 143: 555–562.
Spokas KA, Cantrell KB, Novak JM, Archer DW, Ippolito JA, Collins HP, Boateng AA, Lima IM, Lamb MC, McAloon AJ, Lentz RD, Nichols KA. Biochar: a synthesis of its agronomic impact beyond carbon sequestration. J Environ Qual 2012; 41: 973–989.
Stankovich S, Dikin DA, Dommett GHB, Kohlhaas KM, Zimney EJ, Stach EA, Piner RD, Nguyen ST, Ruoff RS. Graphene-based composite materials. Nature 2006; 442: 282–286.
Stephens SL, Birks JW, Calvert JG. Ozone as a sink for atmospheric carbon aerosols today and following nuclear war. Aerosol Sci Technol 1989; 10: 326–331.
Brought to you by | University of Michigan-Flint
Authenticated
Download Date | 9/17/18 4:43 PM
B. Sajjadi et al.: Activation of biochar for energy and environment 41
Suliman W, Harsh JB, Abu-Lail NI, Fortuna A-M, Dallmeyer I, Garcia-Perez M. Modification of biochar surface by air oxidation: role of pyrolysis temperature. Biomass Bioenergy 2016; 85: 1–11.
Suslick KS, Flannigan DJ. Inside a collapsing bubble: sonoluminescence and the conditions during cavitation. Annu Rev Phys Chem 2008; 59: 659–683.
Tam MS, Antal MJ. Preparation of activated carbons from macadamia nut shell and coconut shell by air activation. Ind Eng Chem Res 1999; 38: 4268–4276.
Tan G, Sun W, Xu Y, Wang H, Xu N. Sorption of mercury (II) and atrazine by biochar, modified biochars and biochar based activated carbon in aqueous solution. Bioresour Technol 2016; 211: 727–735.
Tan Z, Lin CSK, Ji X, Rainey TJ. Returning biochar to fields: a review. Appl Soil Ecol 2017; 116: 1–11.
Tian S, Tan Z, Kasiulienė A, Ai P. Transformation mechanism of nutrient elements in the process of biochar preparation for returning biochar to soil. Chinese J Chem Eng 2017; 25: 477–486.
Toles CA, Marshall WE, Wartelle LH, McAloon A. Steam- or carbon dioxide-activated carbons from almond shells: physical, chemical and adsorptive properties and estimated cost of production. Bioresour Technol 2000; 75: 197–203.
Tran HN, Chao H-P, You S-J. Activated carbons from golden shower upon different chemical activation methods: synthesis and characterizations. Adsorpt Sci Technol 2017a: 0263617416684837.
Tran HN, You S-J, Chao H-P. Fast and efficient adsorption of methylene green 5 on activated carbon prepared from new chemical activation method. J Environ Manage 2017b; 188: 322–336.
Tumuluru JS, Wright CT, Hess JR, Kenney KL. A review of biomass densification systems to develop uniform feedstock commodities for bioenergy application. Biofuels Bioprod Bior 2011; 5: 683–707.
Uchimiya M, Lima IM, Klasson KT, Wartelle LH. Contaminant immobilization and nutrient release by biochar soil amendment: roles of natural organic matter. Chemosphere 2010; 80: 935–940.
Valderrama C, Gamisans X, de las Heras X, Farrán A, Cortina JL. Sorption kinetics of polycyclic aromatic hydrocarbons removal using granular activated carbon: intraparticle diffusion coefficients. J Hazard Mater 2008; 157: 386–396.
Valdés H, Zaror CA. Heterogeneous and homogeneous catalytic ozonation of benzothiazole promoted by activated carbon: kinetic approach. Chemosphere 2006; 65: 1131–1136.
Valdés H, Sánchez-Polo M, Rivera-Utrilla J, Zaror CA. Effect of ozone treatment on surface properties of activated carbon. Langmuir 2002; 18: 2111–2116.
Valdes H, Sanchez-Polo M, Zaror CA. Effect of ozonation on the activated carbon surface chemical properties and on 2-mercaptobenzothiazole adsorption. Lat Am Appl Res 2003; 18: 2111–2116.
Valdés H, Farfán VJ, Manoli JA, Zaror CA. Catalytic ozone aqueous decomposition promoted by natural zeolite and volcanic sand. J Hazard Mater 2009; 165: 915–922.
Veksha A, Pandya P, Hill JM. The removal of methyl orange from aqueous solution by biochar and activated carbon under microwave irradiation and in the presence of hydrogen peroxide. J Environ Chem Eng 2015; 3: 1452–1458.
Veksha A, Bhuiyan TI, Hill JM. Activation of Aspen wood with carbon dioxide and phosphoric acid for removal of total organic carbon from oil sands produced water: increasing the yield with bio-oil recycling. Materials 2016; 9: 20.
Von Sonntag C, Von Gunten U. Chemistry of ozone in water and wastewater treatment. London, UK: IWA Publishing, 2012.
Wahi R, Zuhaidi NFQ, Yusof Y, Jamel J, Kanakaraju D, Ngaini Z. Chemically treated microwave-derived biochar: an overview. Biomass and Bioenergy 2017; 107: 411–421.
Walker PL, Rusinko F, Austin LG. Gas reactions of carbon. In: Eley DD, Selwood PW, Weisz PB, editors. Pennsylvania: Academic Press, 1959: 133–221.
Wang X-H, Chen H-P, Ding X-J, Yang H-P, Zhang S-H, Shen Y-Q. Properties of gas and char from microwave pyrolysis of pine sawdust. BioResources 2009; 4: 946–959.
Wang Y, Zhang Y, Pei L, Ying D, Xu X, Zhao L, Jia J, Cao X. Converting Ni-loaded biochars into supercapacitors: implication on the reuse of exhausted carbonaceous sorbents. Sci Rep 2017; 7: 415–423.
Wang T, Liu J, Zhang Y, Zhang H, Chen W-Y, Norris P, Pan W-P. Use of a non-thermal plasma technique to increase the number of chlorine active sites on biochar for improved mercury removal. Chem Eng J 2018; 331: 536–544.
Wartelle LH, Marshall WE. Nutshells as granular activated carbons: physical, chemical and adsorptive properties. J Chem Technol Biotechnol 2001; 76: 451–455.
Weeks JL, Rabani J. The pulse radiolysis of deaerated aqueous carbonate solutions. I. Transient optical spectrum and mechanism. II. pK for OH radicals. J Phys Chem 1966; 70: 2100–2106.
Wu B, Cheng G, Jiao K, Shi W, Wang C, Xu H. Mycoextraction by Clitocybe maxima combined with metal immobilization by biochar and activated carbon in an aged soil. Sci Total Environ 2016; 562: 732–739.
Xin-hui D, Srinivasakannan C, Jin-hui P, Li-bo Z, Zheng-yong Z. Comparison of activated carbon prepared from Jatropha hull by conventional heating and microwave heating. Biomass Bioenergy 2011a; 35: 3920–3926.
Xin-hui D, Srinivasakannan C, Jin-hui P, Li-bo Z, Zheng-yong Z. Preparation of activated carbon from Jatropha hull with microwave heating: optimization using response surface methodology. Fuel Process Technol 2011b; 92: 394–400.
Xu R-k, Zhao A-z, Yuan J-h, Jiang J. pH buffering capacity of acid soils from tropical and subtropical regions of China as influenced by incorporation of crop straw biochars. J Soils Sediments 2012; 12: 494–502.
Yin S, Shen PK, Song S, Jiang SP. Functionalization of carbon nanotubes by an effective intermittent microwave heating-assisted HF/H2O2 treatment for electrocatalyst support of fuel cells. Electrochim Acta 2009; 54: 6954–6958.
Yip K, Xu M, Li C-Z, Jiang SP, Wu H. Biochar as a fuel: 3. Mechanistic Understanding on biochar thermal annealing at mild temperatures and its effect on biochar reactivity. Energy Fuels 2011; 25: 406–414.
You S, Ok YS, Chen SS, Tsang DCW, Kwon EE, Lee J, Wang C-H. A critical review on sustainable biochar system through gasification: energy and environmental applications. Bioresour Technol 2017; 246: 242–253.
Yu X-Y, Ying G-G, Kookana RS. Reduced plant uptake of pesticides with biochar additions to soil. Chemosphere 2009; 76: 665–671.
Brought to you by | University of Michigan-Flint
Authenticated
Download Date | 9/17/18 4:43 PM

42 B. Sajjadi et al.: Activation of biochar for energy and environment
Yu F, Zhou Y, Gao B, Qiao H, Li Y, Wang E, Pang L, Bao C. Effective removal of ionic liquid using modified biochar and its biological effects. J Taiwan Inst Chem Eng 2016; 67: 318–324.
Yuan J-H, Xu R-K, Zhang H. The forms of alkalis in the biochar produced from crop residues at different temperatures. Bioresour Technol 2011; 102: 3488–3497.
Yun CH, Park YH, Park CR. Effects of pre-carbonization on porosity development of activated carbons from rice straw. Carbon 2001; 39: 559–567.
Zarifyanz YA, Kisekv VF, Lezhnev NN, Nikitina OV. Interaction of graphite fresh surface with different gases and vapor. Carbon 1967; 5: 127–135.
Zaror CA. Enhanced oxidation of toxic effluents using simultaneous ozonation and activated carbon treatment. J Chem Technol Biotechnol 1997; 70: 21–28.
Zhang T, Walawender WP, Fan LT, Fan M, Daugaard D, Brown RC. Preparation of activated carbon from forest and agricultural residues through CO2 activation. Chem Eng J 2004; 105: 53–59.
Zhang H, Voroney RP, Price GW. Effects of temperature and processing conditions on biochar chemical properties and their influence on soil C and N transformations. Soil Biol Biochem 2015; 83: 19–28.
Zhang S, Chen T, Xiong Y, Dong Q. Effects of wet torrefaction on the physicochemical properties and pyrolysis product properties of rice husk. Energy Convers Manag 2017; 141: 403–409.
Zhong Z-Y, Yang Q, Li X-M, Luo K, Liu Y, Zeng G-M. Preparation of peanut hull-based activated carbon by microwave-induced phosphoric acid activation and its application in Remazol Brilliant Blue R adsorption. Ind Crops Prod 2012; 37: 178–185.
Zhou J-Y, Wang Z-W, Zuo R, Zhou Y, Cao X-M, Cheng K. The surface structure and chemical characters of activated carbon fibers modified by plasma. Asia-Pac J Chem Eng 2012; 7: S245–S252.
Zhuang Q, Kyotani T, Tomita A. Desorption behavior of surface oxygen complexes on carbon in an inert gas and in O2-gasification atmosphere. Energy Fuels 1996; 10: 169–172.
Brought to you by | University of Michigan-Flint
Authenticated
Download Date | 9/17/18 4:43 PM