Embed Size (px)
Citation preview

A COMPREHENSIVE STUDY ON SCREW DESIGN AND PROCESS OPTIMIZATION
OF SINGLE-SCREW AND TWIN-SCREW EXTRUSION OF POLYPROPYLENE
by
Kun Mo Lee
A thesis submitted to Johns Hopkins University in conformity with the requirements for
the degree of Master of Science
Baltimore, Maryland
November 2019
© 2019 Kun Mo Lee
All rights reserved

ii
Acknowledgements
First, I would like to extend my sincerest thanks to my advisers, W.R. Grace, and the
university as a whole for granting me the opportunity to perform the research that I present in
this thesis. Dr. Clancy, Jing, and Amaiya – without your support I could not have progressed
through my internship with W.R. Grace, and for that I am very grateful. A warm thank you also
to Dr. Cui, who so graciously agreed to be the second reader of my work. I also would like to
thank Mr. Thorstenson and Ms. Mathis from INBT, who run the co-op program at Johns
Hopkins.
I would like to thank all the colleagues with whom I have had the pleasure of working
with during my time with Grace. Your patience and guidance made my experience at Grace all
the more rewarding. Mark, Dan, Mimi, Victoria, Peter, Iwona, Jim, Tim, Paul, Andrew, and
everyone from the Special Catalysts Division in Grace – thank you so very much for all your
support.
Lastly, I would like to mention my family and friends who have made this journey
possible. To my parents and siblings for your long reaching love and support and my close
friends Siu Tong, Justin, Young-Wook, Arthur, Edward, Seung-Ju, and Soo-Jung for keeping me
sane during the rougher times of my academic career – thank you from the bottom of my heart.

iii
Abstract
The mechanical properties of the extrudate and the processing conditions of the extrusion
must be studied in concert to make the proper recommendations on overall screw design of both
single-screw extruders (SSE) and twin-screw extruders (TSE). In this paper, we present a
detailed approach to comparing the screw designs of a 30 L/D Brabender SSE and a 32 L/D
Japan Steel Works TSE on their effectiveness of polypropylene processing. We observe changes
in the torque, pressure, and throughput brought upon by input changes in the extruder screw
speed and the material feed rate, which we relate to changes in the mechanical properties of the
resulting polypropylene.
The first half of our investigation is concerned with the studying of homopolymer
polypropylene (HPP) and random-copolymer polypropylene (RCP) and how the haze and
flexural modulus of the two are affected by different single-screw designs. By increasing the
specific mechanical energy requirement of the screw design by 17±4 kJ/kg, we were able to
produce up to a 130±20 MPa increase in the flexural modulus of 2 MFR HPP with no significant
increases in haze values.
The latter part of our study involves observing how the addition of kneading elements
into the design of a TSE can change the mixing behavior and ultimately the impact toughness of
impact co-polymers (ICP). By inducing changes in the specific mechanical energy profiles of the
screw, we were able to produce increases in the Izod impact resistance of ICPs ≤ 40±10 J/m2 and
increases in the flexural modulus ≤ 80±40 MPa. We also study the PP matrix morphology using
SEM to make conclusions on the relationship between rubber dispersion and ICP mechanical
properties.

iv
Primary Reader: Dr. Paulette Clancy
Secondary Reader: Dr. Honggang Cui

v
Contents
Acknowledgements ....................................................................................................................... ii
Abstract ......................................................................................................................................... iii
List of Tables .............................................................................................................................. viii
List of Figures ............................................................................................................................... ix
Background ....................................................................................................................................1
Chemical Structure and Isotacticity .............................................................................................2
Crystal Phases of Polypropylene ..................................................................................................3
Nucleating Agents ........................................................................................................................4
Nucleation: A Thermodynamic Approach ...................................................................................6
Types of Polypropylene: Homopolymer, Random Co-Polymer, and Impact Co-Polymer .........7
Impact Co-Polymer: Particle Size and Distribution of Rubber Particles in PP-Blend .................8
Fundamentals of Extrusion ...........................................................................................................8
Distributive Mixing vs. Dispersive Mixing ................................................................................13
The Melt Flow Rate and Viscosity .............................................................................................14
Materials and Methods ................................................................................................................16
Single Screw Extrusion ..............................................................................................................16
Twin Screw Extrusion ................................................................................................................19
Differential Scanning Calorimetry (DSC) and Notes about Contamination ................................7
Haze ............................................................................................................................................24
Flexural Modulus .......................................................................................................................25
Izod Impact Strength ..................................................................................................................26

vi
SSE Processing Data ....................................................................................................................27
Throughput .................................................................................................................................27
Pressure ......................................................................................................................................29
Torque ........................................................................................................................................30
Specific Mechanical Energy (SME) ...........................................................................................31
MFR Break .................................................................................................................................33
Polydispersity Index and the Molecular Weight Distribution ....................................................35
Blending Behavior ......................................................................................................................37
Results and Discussion ...............................................................................................................39
Effect of Screw Design and Viscosity on Flexural Modulus .................................................40
Effect of Screw Speed on the Flexural Modulus ....................................................................44
Effect of Residence Time on the Flexural Modulus ...............................................................46
TSE Processing Data....................................................................................................................47
The Effect of Feed Speed on Throughput of HPPs and RCPs ...................................................48
MFR Break of HPPs and RCPs ..................................................................................................49
Comparison of HPP and RCP MFR Break between TEX25-MS and TEX25-HS3 ..................52
MFR Break of ICP Extruded Through Different Screw Designs ..............................................54
Results and Discussion ...............................................................................................................57
Flexural Modulus....................................................................................................................57
Impact Strength of ICPs .........................................................................................................59
Mechanical Properties of Different Fc ICPs ...........................................................................61
Mechanical Properties of Low β/α ICP Formulations ............................................................64
Microscopy .............................................................................................................................65

vii
Conclusions and Future Work ....................................................................................................69
Bibliography .................................................................................................................................71
Vita ................................................................................................................................................75

viii
List of Tables
Table 2.1: SSE experiments .......................................................................................19
Table 2.2: Experimental scheme for TEX25-MS extruding HPP and RCP ..............21
Table 2.3: ICP formulations extruded using ZSK-30, TEX25-MS, TEX25-HS1,
TEX25-HS2, and TEX25-HS3 ..................................................................................22
Table 2.4: HPP and RCP extrusion scheme using TEX25-HS3 ................................22
Table 3.1: Differences in MFR break between Screw 2 and Screw 1 .......................35
Table 4.1 Temperature profile along JSW twin-screw extruder ................................47

ix
List of Figures
Figure 1.1: Polymerization of propene into polypropylene .......................................2
Figure 1.2: Schematic of a single-screw extruder (SSE) ...........................................9
Figure 1.3: Differences between distributive and dispersive mixing ........................13
Figure 2.1: A schematic of different single-screw designs ........................................17
Figure 2.2: Schematic of Extruder and Sensor-Placement ........................................18
Figure 2.3: Design of TSE screws .............................................................................20
Figure 2.4: Stabilization of crystallization temperature over extrusion time .............23
Figure 2.5: Schematic of simple hazemeter ...............................................................24
Figure 3.1: Linear dependency of throughput on extrusion speed for high viscosity
HPPs ...........................................................................................................................28
Figure 3.2: Linear dependency of throughput on extrusion speed for lower viscosity
PP ...............................................................................................................................28
Figure 3.3: Change in throughput with increasing extrusion speed...........................29
Figure 3.4: Pressure profiles of two SSE screw designs extruding various
viscosities of PP .........................................................................................................30
Figure 3.5: Torque profiles of two SSE screw designs extruding various viscosities
of PP ...........................................................................................................................31
Figure 3.6: SME profiles of Screw 1 and Screw 2 of SSE ........................................32
Figure 3.7: MFR break of high viscosity HPPs .........................................................33
Figure 3.8: MFR break of lower viscosity PP with increasing screw speed..............34
Figure 3.9: PDI of 0.1 MFR HPP of two screw designs with increasing screw
Speed ..........................................................................................................................36

x
Figure 3.10: PDI of 2 MFR HPP of two screw designs with increasing screw
speed ..........................................................................................................................36
Figure 3.11: Screw 1 blending behavior ....................................................................37
Figure 3.12: Screw 2 blending behavior ....................................................................38
Figure 3.13: Haze comparison of different SSE screws and twin-screw ZSK30 ......39
Figure 3.14: Flexural moduli data for 0.1 MFR HPP for different screw designs
at 100 RPM ................................................................................................................41
Figure 3.15: Flexural moduli data for 2 MFR HPP for different screw
designs at 100 RPM ...................................................................................................42
Figure 3.16: Flexural moduli data for 10 MFR HPP (NaBz/HPN20E) for different
screw designs at 100 RPM .........................................................................................43
Figure 3.17: Flexural moduli data for 60 MFR RCP with HPN20E for different
screw designs at 100 RPM .........................................................................................44
Figure 3.18: Flexural modulus of high viscosity PP with increasing screw speed ....45
Figure 3.19: Flexural modulus of 60 MFR HPN20E RCP (Screw 1) with
increasing screw speed ...............................................................................................45
Figure 3.20: Effect of residence time on the flexural moduli of blends (Screw 2)....46
Figure 4.1: Throughput as a function of feed rate of twin-screw extrusion using
TEX25-MS .................................................................................................................48
Figure 4.2: MFR break of 0.1 MFR HPP as a function of feed rate and extrusion
speed for TEX25-MS .................................................................................................50
Figure 4.3: MFR break of 2 MFR HPP as a function of feed rate and extrusion
speed for TEX25-MS .................................................................................................51
Figure 4.4: MFR break of 10 MFR HPP (NaBz) as a function of feed rate and
extrusion speed for TEX25-MS .................................................................................51
Figure 4.5: MFR break of 60 MFR HPP (HPN20E) as a function of feed rate

xi
and extrusion speed for TEX25-MS ..........................................................................52
Figure 4.6: MFR break of high viscosity HPP with respect to extrusion speed and
feed speed for TEX25-HS3 ........................................................................................53
Figure 4.7: MFR break of medium and low viscosity HPP (10 MFR NaBz) and
RCP (60 MFR HPN20E) with respect to extrusion speed and feed speed
TEX25-HS3 ...............................................................................................................53
Figure 4.8: Comparison of SME dissipation of Screw 2 of SSE, TEX25-MS, and
TEX25-HS3 for different viscosities of PP ...............................................................54
Figure 4.9: MFR break of different viscosity ICP using different TSE screw
design .........................................................................................................................55
Figure 4.10: SME dissipation at different viscosities of ICP for different screw
designs........................................................................................................................56
Figure 4.11: Comprehensive flexural modulus data for all TSE screw designs
across MFR range ......................................................................................................57
Figure 4.12: Comparison of TSE (TEX25-MS) and SSE (Screw 2) flexural modulus
values for HPP (0.1, 2, and 10 MFR) and RCP (60 MFR) ........................................58
Figure 4.13: Changes in flexural modulus in TSE (TEX25-HS3) with changes in
extrusion speed...........................................................................................................59
Figure 4.14: Comprehensive Izod impact strength data for a range of ICP viscosities
for all TSE screw designs ..........................................................................................60
Figure 4.15: Changes in the Izod impact strength for TEX25-HS3 with changing
screw speed ................................................................................................................61
Figure 4.16: Izod strength for ICP blends with rubber concentrations less
15 wt. % .....................................................................................................................63
Figure 4.17: Izod strength for ICP blends with rubber concentrations between
22 and 25 wt. %. ........................................................................................................63

xii
Figure 4.18: Izod strength for ICP blends with rubber concentrations between
28 and 33 wt. % .........................................................................................................64
Figure 4.19: Mechanical properties of low β/α ratio ICPs .........................................65
Figure 4.20: SEM imaging of microtome section taken from 96 MFR ICP with 15
wt. % Fc and 2.3 β/α extruded using in order from left to right: ZSK30, TEX25-MS,
and TEX25-HS3.........................................................................................................66
Figure 4.21: Observation of large agglomeration of rubber particles in ICP
matrix .........................................................................................................................67
Figure 4.22: Crack propagation of 18 MFR ICP with 28 wt. % Fc and 2.1 β/α across
various screw designs. ...............................................................................................68

1
Background
Polypropylene (PP) is a thermoplastic, semi-crystalline polymer consisting of repeating
propylene units and has found use across a wide range of industries. First polymerization of
isotactic polypropylene was achieved by Dr. Giulio Natta in the laboratories of industrial
chemistry of the Milan Polytechnic in 1954, and ever since the first successful commercial
production process launched in Ferrara in 1957, the PP industry has exhibited steady yet
substantial growth to become the multi-billion dollar giant it is today [1],[2]. A breakdown of the
world demand for plastics by resin type in a 2006 study saw PP accounting for 19% of the 49.5
million tonnes of plastic produced annually [3]. With future projections of the plastics industry
being worth upwards of over a trillion dollars by 2020, advances in polypropylene technologies
are all the more important to polypropylene production licensors and licensees alike.
The reason for PP’s widespread use across a variety of industries lies in its mechanical
and structural properties. PP’s lightweight (density of 0.90 g/cm3) and semi-crystalline structure
provides high stiffness while exhibiting decent impact resistance as well – proving especially
useful in the automobile industry. The material also provides good chemical and thermal
resistance, which is useful in heat-sterilization often performed on medical devices. The addition
of stabilizers to the PP matrix can also increase the material’s resistance to degradation by
radiation or oxidation [4]. Depending on its crystal size, PP also exhibits good optical properties
and consequently, is widely used to create thin films for packaging industries. Due to PP’s
stability in high temperature environments, the material can be processed through a variety of
methods such as thermoforming, blow forming, and injection molding to produce items ranging
from household items like bottle caps, containers, and children’s toys to more niche items like
medical syringes and automobile casings [5],[6].

2
Chemical Structure and Isotacticity
Polypropylene is produced through a polymerization reaction of propene monomers with
the aid of Ziegler-Natta catalysts or metallocenes and exists in three stereochemical
configurations: isotactic, syndiotactic, and atactic. A basic visualization of this reaction is
pictured in Figure 1.1.
Figure 1.1: Polymerization of propene into polypropylene.
The tacticity of PP is dependent of the configuration of the repeating side methyl groups on the
PP backbone. In the case of isotactic polypropylene (iPP), the side methyl groups configure
themselves on the same side of the polymer chain, resulting in an infinitely repeating pattern of
meso diads in a 3,1 helical coil to reduce the steric clash between the adjacent groups. In
syndiotactic PP (sPP), the side methyl groups are in an alternating pattern (racemo diads). The
most stable form of sPPs is configured as a twofold helix (s(2/1)2) with 0.74 nm repeating units
as reported by Corradini et al. [7]. Atactic PP (aPP) have no defined patterning of its methyl side
groups and instead consist of an infinite sequence of randomly distributed but equal number of
racemo- and meso- diads. As a result of this random sequencing, the determination of the
macromolecular structure of aPPs is much more complex than it is for iPPs and sPPs. Doi
provides a statistical approach to calculating the probabilities of each possible pentad existing in
an aPP chain. In theory, one could calculate the degree of isotacticity or sterotacticity in an aPP
polymer chain and from there obtain an understanding of an aPP supramolecular structure [8].

3
The repeating structure of iPPs and sPPs allow for greater lamellar packing in spherulites
as a result of a greater number of intermolecular contacts and therefore contributes to enhanced
mechanical properties associated with their higher degree of crystallinity. iPPs and sPPs observe
higher melting points and stiffness compared to aPPs, while aPP is more amorphous and more
flexible than the other two stereoisomers.
Crystal Phases of Polypropylene
Polypropylene exists in at least three crystalline phases: the monoclinic α-phase, the
hexagonal β phase, and the orthorhombic γ phase. In general cases, the α-phase is the most
commonly formed crystalline phase in PP as β-phase transformation usually occurs only in the
presence of external forces like temperature gradients, shear fields, or nucleating agents. The
least common and practical of the three crystalline phases is the γ-phase, which only forms under
elevated pressure or in low molecular weight samples (1000-3000 g/mol). As one can expect, the
β- and the γ- phases of PP are less stable than the α-phase – the α-phase has a melting
temperature of 186.1°C as reported by Yamada et al. [9], the β-phase a Tm of 177ºC [10], and
lastly the γ-phase has a Tm of 187.2ºC [11]. All values for Tm were obtained via extrapolation
using Hoffman-Weeks analysis in respective studies.
The α-, β-, and γ- phase all share the right or left-handed 31 helical structure which
orients the methyl groups either in the up- or down- configuration. Where they differ is in the
packing of these helices in their respective lamellae and the arrangement of said lamellae. The
intricacies of the packing of each respective phasic PP is beyond the scope of this paper but can
be found in Ref. 12, 13, and 14.

4
The mechanical properties of the β-PP differ from their α counterpart, primarily being
superior in impact strength but inferior in elastic and yield strength. For a semi-crystalline
polymer, the stress-stress curve consists of three characteristic regions: 1) elastic deformation, 2)
orientation of the crystals to the necking direction, and 3) neck formation and plastic deformation
until failure. Once the neck is formed for β-PP, increasing stress is required to produce the same
incremental change in strain – a phenomenon known as strain hardening. This behavior is
attributed to a β-fortified α transformation which is correlated to the increase in tensile strength
and elongation upon neck formation.
A study by Zeng et al. showed, however, that it is possible to maintain the tensile strength
of the α-phase while enhancing the PP’s impact strength by promoting β-nucleation. Zeng used a
lanthanum complex of a cyclodextrin as the nucleator (0.8 wt. %) and produced an increase in
impact strength of the PP (from 9.44 kJ/m2 to 13.09 kJ/m2) while maintaining the tensile strength
and elastic modulus within 6% and 7% of the values observed in α-PP respectively [15]. In
another study conducted by Varga, Charpy-impact testing at room temperature revealed the
ductile failure of β-PP compared to the brittle failure observed in α-PP, and Gardner drop-impact
testing supported the higher impact resistance values for β-PP. Varga attributes the increased
toughness of the β-phase to the mechanical stress induced α-β transformation and the packing
differences of β-PP and α-PP (spherulite structure) – the latter of which causes greater crazing to
dissipate the fracture energy more effectively in β -PP than in α-PP [16].
Nucleating Agents
Polypropylene is a semi-crystalline polymer and as such behaves in a way that can be
modeled by a classical crystallization approach. A fundamental approach to explaining

5
crystallization revolves around the crystallization temperature, Tc. Above this temperature,
polymer chains lack any tertiary structure and exist in the melt as separate entities. Once the
temperature decreases to the Tc, the polymer chains begin to reorient themselves into lamellae
and then pack themselves into greater tertiary structures (i.e. spherulites). The site at which this
reorganization of free polymer chains occurs is called a nucleus. Two main types of nucleation
can occur in a polymer: homogenous and heterogenous, the latter of which involves the addition
of foreign material to polypropylene to serve as sites for nucleation once the polymer melt cools
to Tc and is the method of nucleation utilized throughout our experiments. These foreign
contaminants, or nucleating agents, lower the energy requirement for the nucleation process to
spontaneously occur. Two main analytical methods exist to study the effectiveness of different
nucleating agents – differential scanning calorimetry (DSC) and electron microscopy
(SEM/TEM). Because the effectiveness of nucleating agents is directly correlated to changes in
the Tc as well in the spherulite sizes, we can ascertain which nucleating agents work best for
certain polymers by studying these parameters using the aforementioned analytical techniques
[17].
Beck in his 1967 paper outlined the five characteristics a good nucleating agent should
have for use with polypropylene. These properties are: 1) the ability of the nucleating agent to
reduce the interfacial surface energy, 2) insolubility in polypropylene below the melting point, 3)
the ability to melt above the polypropylene melting point, 4) nonvolatility and stability when
exposed to a variety of environmental factors, and 5) similar crystalline structure to that of
polypropylene [18]. For the purpose of this paper, there are two types of nucleators of concern:
particulate and soluble. Particulate nucleators, like sodium benzoate, have an organic soluble
group and a polar insoluble group. The effectiveness of these nucleators largely depend on the

6
lattice compatibility of the PP and nucleator crystals, which is important in epitaxial growth and
in the orientation of the soluble groups of the nucleators. Soluble nucleators, generally sorbitol
derivatives, have a lower melting temperature than particulate nucleators, which allow them to
melt with the polymer resin. Existing in fine fibrils throughout the polymer matrix, the high
solubility of these nucleators allow for greater optical transparency [18].
All nucleating agents increase the crystallinity of the polypropylene as well as decrease
the crystal sizes by providing more nucleation sites for crystal growth to occur. Generally, the
greater crystal structure allows for improvements in tensile strength and elastic modulus, and
particularly in the case of soluble nucleators, the optical properties of the polypropylene. The
effect of nucleators on impact resistance is largely related to the molecular weight of the polymer
chains and their corresponding distributions for homopolymers, the comonomer content in
random co-polymers, and elastomer particle dispersions in impact co-polymers [18],[19].
Nucleation: A Thermodynamic Approach
A detailed explanation of nucleation kinetics and thermodynamics is beyond the scope of
this paper but a fundamental understanding of the energetics of the nucleation process is useful
in extrusion optimization. As such, a brief look at the thermodynamic principles behind
nucleation will be explained in this section.
Nucleation of crystals in semi-crystalline polymers is related to the Gibbs-free energy of
the system, which is the sum of the surface energies associated with the clustering of the loose-
chains ΔGsurface and the volume-dependent energy ΔGvolume:
𝛥𝐺𝑐𝑟𝑦𝑠𝑡𝑎𝑙𝑙𝑖𝑧𝑎𝑡𝑖𝑜𝑛 = 𝛥𝐺𝑠𝑢𝑟𝑓𝑎𝑐𝑒 + 𝛥𝐺𝑣𝑜𝑙𝑢𝑚𝑒 [Equation 1].

7
Here, ΔGsurface is a positive term since it is related to the energy terms associated with the
formation of new surfaces of the clusters, while ΔGvolume is representative of the volume change
that occurs in liquid-solid phase transition and is negative. As in any other thermodynamic
consideration, the nucleation process is spontaneous once the change in Gibbs-free energy is
negative. Upon initial formation of the cluster (modeled by a cylindrical geometry by
convention), the surface area grows at a much faster rate than the volume does, which means the
overall ΔG is positive. However, once the cluster reaches a certain size, the surface area to
volume ratio decreases once enough polymer chains are added to the geometry, thus making
ΔGvolume and consequently ΔGcrystallization negative. The point at which this critical cluster size is
reached represents the energy barrier that the system must overcome in order for a stable nucleus
to form [20].
Types of Polypropylene: Homopolymer, Random Co-Polymer, and Impact Co-
Polymer
There are three different types of polypropylene: homopolymer (HPP), random
copolymer (RCP), and impact co-polymer (ICP). Homopolymer is catalyzed in a single reactor
from propene monomers and observes the highest degree of crystallinity and consequently high
stiffness. Random co-polymer is also synthesized in a single reactor but with small amounts of
ethylene (<5% weight) to disrupt the highly crystalline regions of the polymer chains with
amorphous regions. These amorphous regions make RCP much more flexible than their HPP
counterparts, increasing room temperature impact resistance at the expense of tensile strength.
Impact co-polymers are created in a two-reactor process, where homopolymer from the first
reactor is combined with ethylene and propene comonomers to create nodes of ethylene-

8
propylene rubber (EPR) dispersed throughout the polymer matrix. These particles grant ICPs
enhanced impact resistance at both room and lower temperatures [4].
The different types of polypropylene and their different properties are suited for
understandably different purposes. Homopolymer, for example, are used in applications that
require high transparency without sacrificing high tensile strength like in medical syringes. RCPs
are used in the food industry for containers and films. ICPs are used in automobile parts and
other products that require high impact resistance.
Impact Co-Polymer: Particle Size and Distribution of Rubber Particles in PP-
Blend
Homopolymers and random co-polymers depend primarily on tacticity and ethylene
content respectively when gauging their mechanical properties. The addition of nucleators, as
explained in a previous section, also play a role in what properties the polypropylene can exhibit.
For impact co-polymers, the heterophasic nature of the polypropylene requires that we take
special notice of how the rubber particles behave in the polymer matrix. There are three main
properties of the rubber particles that have an effect on the impact resistance and fracture
mechanics of ICPs – the rubber dispersion, concentration, and particle size. A series of papers by
van der Wal use the brittle-to-ductile transition temperatures of ICPs to explain the effects each
of the three aforementioned parameters have on the Izod impact strength of the PP. In summary,
increasing the rubber concentration, decreasing the particle size, and increasing the dispersion of
the rubber particles throughout the PP matrix all correlate to greater Izod impact strength [21-
25].

9
Fundamentals of Extrusion
One of the most important downstream processing methods for thermoplastic polymers is
extrusion. Extrusion in its simplest form is the conveying of molten polymer using screws and
eventually forcing the material through a die via a pressure gradient established across the length
of the screw. Extrusion can be separated into two categories: single-screw extrusion (SSE) and
twin-screw extrusion (TSE).
In PP processing, single-screw extruders are mostly used for HPPs and RCPs and for
dispersing the additives throughout the PP matrix. For a basic schematic of a single-screw
extruder, refer to Figure 1.2.
Figure 1.2: Schematic of a single-screw extruder (SSE). The feed, transition, and metering stage
are depicted in the diagram of the screw below the SSE schematic.
A SSE can be separated into three distinct sections: a feeding or conveying stage, a
plasticizing/transition stage, and a metering stage. Each of these sections vary in channel depth
(distance between the non-screw element and the wall of the barrel). In the feeding stage of the
extruder, the polymer (either in pellets or powder form) is compacted together as the screw
Hopper
Die Barrel
Screw

10
rotates, and fresh material is continually introduced into barrel via the hopper. The transition
section is where the outermost portion of the solid polymer melts and experiences shearing. By
the time the polymer is introduced into the metering section, most of the polymer is in a molten
form, and further shearing allows for greater stabilization of the polymer before it is ultimately
extruded through a die and cooled.
Mol and Darnell, and later Chung, were able to model the pressure gradient in the
feeding section of a SSE as a function of the helix angle (angle the flights make with respect to
the perpendicular of the screw axis), channel depth, screw diameter, densities of the molten and
solid phases of the polymer, friction coefficients between the polymer and the barrel surface and
screw surface respectively, and the plug traveling angle (angle with respect to axis normal to the
screw axis) in which the polymer mass moves [26]. An optimal throughput as reported by
Vlachopoulos and Strutt was found to be a function of the drag flow force ṁD and is between
1.5ṁD and 0.75 ṁD. ṁD is the product of the volumetric flow QD and the melt density ρm:
ṁ𝐷 = 𝜌𝑚𝑄𝐷 =1
2𝜌𝑚𝜋2𝐷2𝐻𝑚𝑁𝑠𝑖𝑛𝜑𝑐𝑜𝑠𝜑 [Equation 2]
where D is the diameter of the screw, Hm is the height of the channel, N is the rotation speed, and
φ is the flight angle. The power input requirement is calculated from the heat energy required to
bring the polymer to its melting temperature and melt the volume of polymer in the screw in
addition to the energy required in moving that volume across the length of the screw and
eventually out the die. This can be calculated using the following equation:
𝑃 = 𝜌𝑚𝑄𝐶𝑝(𝑇𝑜𝑢𝑡 − 𝑇𝑖𝑛) + 𝜌𝑚𝑄𝐻𝑓 + ∆𝑃𝑄 [Equation 3]

11
where T is indicative of temperature, Q is the volumetric flow rate, Hf is the latent heat of fusion,
and ΔP is the pressure gradient [27].
For more rigorous mixing where the shearing requirement is much higher than for single-
screw extrusion, a twin-screw extruder is often used. As the name implies, a TSE configuration
consists of two screws which are orientated side-by-side in the extruder barrel instead of the
single screw in SSE. The screws can either be corotating intermeshing, counterrotating
intermeshing, or counterrotating non-intermeshing. Generally, TSEs provide greater mixing
capabilities than SSEs and offer greater control over residence time distributions of the polymer.
The screws of a TSE are often fully modular and can be exchanged for different screw
geometries to impart the desired mixing of the polymer but generally, most TSEs have a
conveying region, a kneading region, and a mixing region. The shear profiles of TSEs are much
more complex than that of SSEs due to the geometries of the kneading blocks, where most of the
dispersive mixing occurs. Nevertheless, the shear experienced in a certain region of the screw
can be related to the number of lobal regions of the kneading blocks that reside in that section of
the screw. For each cross-sectional geometry between the kneading block and the barrel, we can
develop a general shear profile based on which regions experiences low shear and high shear
respectively. Martin gives a visual representation of the shear profiles of an intermeshing co-
rotating twin-screws in Ref. 28 and we will be using his methodology as a reference. The number
of lobes that can be included in a TSE configuration is limited by the ratio of the inner and outer
diameters of the screw elements (smallest and largest distance respectively measured from end-
to-end of the specified geometry).
In addition to the shear history of the polymer, another variable that determines the
degree of mixing in a TSE is the residence time of the polymer within the barrel, or more

12
specifically the residence time distribution of the polymer across the length of the screw, τ. Kao
and Allison were able to model the average residence time of a starve-fed corotating
intermeshing TSE by approximating the flow behavior of the polymer across the screw as a
rectangular plug flow in the screw axial dimension. Kao and Allison were able to relate the
average residence time as a function of the packing fraction, the free volume per channel, and the
volumetric flow rate:
𝜏𝑎𝑣𝑒𝑟𝑎𝑔𝑒 =𝑉𝑓
𝑄 [Equation 4]
where V is the free volume per channel, f is the packing fraction, and Q is the volumetric flow
rate. By solving for the viscous terms of the Navier-Stokes equation assuming a Newtonian
incompressible fluid, they were able to relate the volumetric flow per channel as:
𝑄 = 𝛼𝑁𝐹𝐷 , where 𝛼 =1
2𝜋𝐷𝑐𝑜𝑠𝜑𝑊𝐻 and 𝐹𝐷 =
32𝑓2𝑤
𝜋3𝐻∑
1
𝑛3 tanh (𝑛𝜋𝐻
4𝑓𝑤)∞
𝑛=1,3… [Equation 5]
and where D is diameter of the screw, H is the height of the screw channel, N is the screw speed,
φ is the screw helical angle, and W is the width of the screw channel. A computer simulation of
the same configuration of screws calculated the residence time for full and starved operation:
𝜏𝑓𝑢𝑙𝑙 =3.08𝐿𝐻𝐷
𝑄 , 𝜏𝑠𝑡𝑎𝑟𝑣𝑒𝑑 =
2𝐿
𝑍𝑁 [Equation 6]
where L is the length of the screw region and Z is the flight pitch [29].

13
The power input requirements of TSE are higher due to the driving of two separate
screws but also due to the nature of the shearing forces required in TSE operation. A method to
empirically calculate the power draw of a TSE (or any other extrusion system) is by calculating
the specific mechanical energy (SME) of the process:
𝑆𝑀𝐸 =𝑃×𝜏×
𝑁𝑎𝑐𝑡𝑢𝑎𝑙𝑁𝑟𝑎𝑡𝑒𝑑
ṁ [Equation 7]
where P is the power rating of the motor driving the two screws, τ in this case is the torque of the
process, N is still the rotation speed of the screw, and ṁ is the throughput of the process.30
Distributive Mixing vs. Dispersive Mixing
Here we dedicate some time to describe the differences between distributive and
dispersive mixing. Figure 1.3 provides a visual representation of each process.
Figure 1.3: Differences between distributive and dispersive mixing.

14
Distributive mixing is associated with the uniformity of the distribution of a melt while
dispersive mixing is more related to elongation and shearing of the melt to create smaller particle
sizes. Both facets of mixing are important in PP extrusion, but for TSE especially, the ability of
the kneading blocks to provide adequate dispersive mixing capabilities is critical in judging TSE
performance and eventually the mechanical properties of the extrudate.
The Melt Flow Rate and Viscosity
In rheology, the melt flow rate (MFR) refers to the amount of molten polymer that passes
through a standardized die orifice in 10 minutes. For our studies, MFR of PP was recorded
according to ASTM D1238 Procedure B. MFR is inversely proportional to the material viscosity,
η, and the average molecular weight, M respectively. Shenoy was able to use the relationship
between the shear stress τ and the shear rate γ of PP in the melt flow indexer constrained by
ASTM D1238 to determine the relationship between the viscosity and the MFR:
𝑀𝐹𝑅 =4.98×10⁴𝜌𝐿
𝜂 [Equation 8]
where ρ is the density of the polymer and L is the distance the test load F travels down the
apparatus [30]. For blends of two different viscosities, Heitiller et al. proposes the following
model:
1
𝜂𝐵=
𝑉1
𝜂1+
𝑉2
𝜂2 [Equation 9]

15
where V is the volume fraction and the subscripts B, 1, and 2 refer to the resultant blend and the
two components respectively [31].
The relationship between M and η for entangled linear polymers can be approximated
using a simple power law proposed first by Fox and Flory:
𝜂0 ~ 𝑀3.4 [Equation 10]
where η0 is the melt viscosity [32].

16
Methods and Materials
The overall purpose of our investigation is to understand the relationship between screw
design and processing parameters of both SSE and TSE on PP mechanical properties such as
viscosity, flexural modulus, and Izod impact strength. We have structured our experiments first
on the type of extrusion involved (SSE vs TSE), the screw design used, the specific process
parameters used, and finally the specific formulation of PP that was used (including type, melt
flow rate, blending, and additives). Depending on the formulation of PP that was used, we then
injection molded the extrudate into test parts for mechanical testing. The type of PP and additives
were what ultimately decided which mechanical property was tested (i.e. the haze and clarity of
RCPs were measured to study the effectiveness of dispersion of the clarifiers that were added in
their formulations).
Single Screw Extrusion
Single screw extrusion work was limited to studying homopolymer and random co-polymer PP
due to the lack of shearing force required to properly disperse the rubber particles across an
impact co-polymer matrix. These series of experiments were primarily conducted to study the
effectiveness of additive dispersion of two screw designs listed below in Figure 2.1.

17
Figure 2.1: A schematic of different single-screw designs. The feed stage of Screw 1 is twice as
long as that of Screw 2, at the expense of a shorter transitioning and metering stage.
We can observe that the main difference between the two designs tested is the lengths of the
feeding, transitioning, and metering section in each screw. The feeding section in Screw 1 is
twice as long as it is in Screw 2, while the other two sections are half as long respectively in
Screw 1 than they are in Screw 2. The transitioning and metering stage are where most of the
polymer melting occurs, so a general hypothesis that Screw 2 should show greater additive
mixing and consequently greater mechanical properties can be made. We aim to substantiate this
hypothesis through data we present in the coming sections.
On the single screw extruder, the heating zones across the length of the barrel were kept
constant to ensure proper melting of the PP throughout the extruder without degradation of the
polymer. A schematic of the Brabender SSE is shown in Figure 2.2.

18
Figure 2.2: Schematic of Extruder and Sensor-Placement. Figure 2.2 visualizes the 5 heating
zones located throughout the length of the screw, the temperature sensor, pressure transducer,
hopper, gearbox, and the control unit are depicted.
As a result, the only other parameter that we were able to control on the SSE was the speed of
the screw (measured in RPM). Altering the speed of the screw affected the resulting torque
profiles (Nm), die pressure (PSI), and throughput (kg/hr) of the process. We separated our SSE
experiments into two classifications, the first to study the effect of screw speed on MFR break
(viscosity changes) and flexural moduli, and the second to study if re-extruding the extrudate
would produce improvements in polymer mixing and mechanical properties. We repeated the
experiments for both screw designs using the same formulations to compare the performances of
each while at the same time obtaining data about how processing conditions affected the PP
extruded using each screw.
We investigated the mixing of three different additives in our SSE studies: two nucleators
NaBz and HPN20E (700 PPM and 250 PPM respectively) and a clarifier NX8000 (2000 PPM).
These additives were added in addition to the basic stabilizing and anti-oxidizing additive
package added to every formulation that was extruded. Four different test speeds were used to
map out the effect of screw speed on the PP – 70, 100, 120, and 135 RPM. Finally, a range of PP
of different viscosities were tested: 0.1, 2, 10, 60 MFR. Five blend formulations were also
studied: 0.1+40 MFR, 0.1+60 MFR, 0.1+70 MFR, 0.1+200 MFR, and 2+200 MFR (10 wt.%
lower MFR). We summarize our experimental scheme in Table 2.1 below:

19
Screw
Design
PP Type MFR Additive RPM Multi-Pass
1 HPP 0.1 N/A 70,100,120,135 No
1 HPP 2 N/A 70,100,120,135 No
1 HPP 10 NaBz/HPN20E 100,120,135 No
1 HPP/RCP 60 (72) HPN20E/NX8000 100,120 Yes
1 HPP 0.1+40 N/A 100,135 Yes
1 HPP 0.1+60 N/A 100,135 Yes
2 HPP 0.1 N/A 70,100,120,135 No
2 HPP 2 N/A 70,100,120,135 No
2 HPP 10 NaBz/HPN20E 100,120,135 No
2 HPP/RCP 60 HPN20E/NX8000 100,120,135 Yes
2 HPP 0.1+60 N/A 100,135 Yes
2 HPP 0.1+200 N/A 100,135 Yes
2 HPP 2+200 N/A 100,135 Yes
Table 2.1: SSE experiments. The different screw speed inputs for the different PP formulations
are listed for each screw. Multi-pass indicates whether or not there was re-extrusion of the PP.
Twin Screw Extrusion
The experiments for twin screw extrusion are more involved due to the nature of the
processing parameters for TSE. In addition to changing the speed of the screw, for TSE, we were
also able to change the feed rate of the PP into the extruder as well, hence being able to control
the throughput of the process. The feed rate is theoretically dependent on the behavior of the
material being fed into the extruder (i.e. packing density) but empirically, we have observed that
the maximum throughput of our TSE to be approximately 25~33 kg/hr depending on the MFR of
the PP. Due to ease of convention, we will use percentages of the maximum feed rate when
describing our experimental scheme.

20
Four different TSE designs were tested to see how each design performed when
extruding a variety of different PP formulations. The designs of the TSE screws are much more
complex than the simple Archimedean screw designs of the SSE due to the variability of the
different types of kneading blocks available in TSEs. For our purposes, we focus on the location
and density of the kneading region in each screw to draw conclusions on the screw performance.
Figure 2.3 shows a schematic of each screw design with different screw elements. Sloped lines
with respect to the direction of the screw axis represent conveying elements in the direction of
the lines. Perpendicular lines with respect to the screw axis represent kneading elements – the
proximity in which these lines coexist correlate to the number of lobes of the kneading elements,
therefore representing the shearing capability of that screw region.
Figure 2.3: Design of TSE screws. The different screw elements for each screw design are
shown. The JSW screw designs depicted here have a 32 L/D ratio.
In addition to these four screw designs, an old TSE ZSK30 model was used as a reference to
compare the performance of the other four screws.
Due to having two controllable variables – feeder speed and the screw speed – compared
to the case with the SSE when we only had one, the design of experiments for TSE is much more
involved. We can categorize the entirety of our experiments to two approaches: 1) the processing

21
conditions mapping and 2) the comparison of screw performance. In the first phase of
experiments, a combination of four screw speeds - 200, 300, 500 RPM, and 600 RPM - and four
feeder speeds – 30%, 45%, 60%, and 90% - were used to process four of the PP blends studied in
the SSE experiments – 0.1 MFR, 2 MFR, 10 MFR with NaBz, and 60 MFR with HPN20E. Then,
with optimal processing conditions determined from data obtained from the first group of
experiments, we compared the performances of the five screw designs (including ZSK30) in
processing ICPs with different MFRs, rubber content Fc, and β/α ratios. In order to definitize the
results from the first phase of TSE experiments as well as provide a more comprehensive
comparison of the performance of the TSE and the SSE, the same four HPP/RCP blends tested
on the SSEs and TEX25-MS were extruded using TEX25-HS3 as well. Tables 2.2, 2.3, and 2.4
provide a tabulated summary of experiments conducted on the TSE.
Screw Design MFR
(dg/min) Additive Screw Speed (RPM) Feeder Speed (% max.)
TEX25-MS 60 HPN20E
200
300
500
45/60
30/45
30/60
TEX25-MS 10 NaBz
200
300
500
45/60
30/45/90
30/60/90
TEX25-MS 2 N/A
200
300
500
45/60
30/45/90
30/60/90
TEX25-MS 0.1 N/A
200
300
500
45/60
45/90
60/90
Table 2.2: Experimental scheme for TEX25-MS extruding HPP and RCP. The feed rate and
screw speed combinations are the input conditions of these experiments.

22
MFR (dg/min) Fc (wt. %) β/α
96.0 15 2.3
90.0 22 1.8
54.0 12 2
53.0 24 1.8
51.0 22 2.3
46.7 33 1.5
31.0 21 1.8
26.2 28 2.1
20.5 28 1.9
9.0 11 2.7
Table 2.3: ICP formulations extruded using ZSK30, TEX25-MS, TEX25-HS1, TEX25-HS2, and
TEX25-HS3. The melt flow rate, rubber content Fc, and β/α ratio of the ICP formulations
extruded using the 5 various screw designs are listed. The shaded formulations were extruded on
every screw design.
MFR
(dg/min) Additive Screw Speed (RPM) Feeder Speed (% max.)
60 HPN20E 300
500
60/90
60/90
10 NaBz 300
500
60/90
60/90
2 N/A 200
300
60/90
60/90
0.1 N/A 200
300
60/90
60/90
Table 2.4: HPP and RCP extrusion scheme using TEX25-HS3. Analogous to Table 2.2.
Differential Scanning Calorimetry (DSC) and Notes about Contamination
In order to make sure that there is no contamination from residual nucleator in the screw
flights of the extruder, we monitored the crystallinity temperature Tc of a PP that did not have a
nucleator added to its formulation. Because nucleating agents increase the Tc as they increase the

23
number of nuclei in the polymer matrix, by monitoring the Tc of samples of the non-nucleated PP
purge at different process times, we can obtain the proper amount of purge time required to
eliminate a significant amount of contaminant nucleator in the screw.
A Discovery DSC 2500 from TA Instruments was used to record the Tc values of two
formulations of PP that were extruded using Screw 2. Two MFR HPP which was extruded after a
60 MFR RCP with HPN20E nucleator and a blend of 0.1 and 200 MFR HPP extruded after a 10
MFR HPP with NaBz were selected for this study. Figure 2.4 below shows the Tc decreasing
with respect to time of extrusion.
Figure 2.4: Stabilization of crystallization temperature over extrusion time. A decrease in Tc as
the concentration of nucleator in the purging PP decreases as extrusion time increases is
observed.
We observe that the Tc reaches an asymptotic value after around 6 minutes of processing, with
the 2 MFR PP exhibiting an average 119.72±0.1°C over the last four data points and the 0.1+200
117
118
119
120
121
122
123
124
125
0 2 4 6 8 10
Tc
(°C
)
Time Elapsed (minutes)
2 MFR 0.1+200 MFR Blend

24
MFR blends with an average of 118.51±0.1°C over the last two data points. For the rest of our
experiments, we maintained this 6-minute purging process for every sample extruded.
Polydispersity Index and the Molecular Weight Distribution
The polydispersity index (I) is the ratio of the number averaged molecular weight and the weight
averaged molecular weight and is described by the following equation [33]:
𝐼 =𝑀𝑛
𝑀𝑤, 𝑤ℎ𝑒𝑟𝑒 𝑀𝑛 =
∑ 𝑀𝑖𝑁𝑖
∑ 𝑀𝑖, 𝑀𝑤 =
∑ 𝑀𝑖2𝑁𝑖
∑ 𝑀𝑖𝑁𝑖. [Equation 11]
The polydispersity index, also abbreviated PDI, represents the width of a molecular weight
distribution for a given polymer system. The PDI was measured using an ARES-G2 rheometer
from TA Instruments.
Haze
The haze of 50 mm x 25 mm x 0.1 mm samples (with the last dimension measuring thickness)
was measured using BYK-Gardner Hazemeter from BYK Instruments in accordance with ASTM
1003 Procedure A. According to ASTM 1003, haze is defined as the flux of transmitted light that
is scattered greater than 2.5° as the incident beam travels through a specimen. Figure 2.5 shows a
simple depiction of the integrating sphere used in haze measurements:
Figure 2.5: Schematic of a simple hazemeter. Points A and B refer to positions of the light
scattering sample and a calibration blank respectively.

25
where H, the haze, is measured as percentage value of the follow measurements:
𝐻 = [𝑇4
𝑇2−
𝑇3
𝑇1] × 100 [Equation 12]
and T1, T2, T3, T4 can be found in Section 7.2.1 of ASTM D 1003 [34].
Flexural Modulus
The flexural modulus, Ef, also called the bending modulus is a compound stress state
consisting of tensile and compressive stresses as a rectangular prismatic beam is loaded
perpendicular to the tensile direction. According to ASTM D 790, a homogenous elastic material
supported at two point and loaded a midpoint experiences the following flexural stress:
𝜎𝑓 = 3𝑃𝐿/2𝑏𝑑2 [Equation 13]
where σf is the flexural stress (MPa), P is the load a given point in the stress-strain curve, L is the
distance between the two supporting points, b is the width of the beam, and d is the depth of the
beam (length in mm). The flexural strain is calculated using the following relationship:
𝜖𝑓 =6𝐷𝑑
𝐿2 [Equation 14]
where ϵf is the flexural strain (mm/mm) and D is maximum deflection of the beam in the loading
direction (mm). The flexural modulus is simply defined as the ratio of these two quantities at a
given point along the stress-strain curve:
𝐸𝑓 =𝜎𝑓
𝜖𝑓 [Equation 15] [35].
For all values of the flexural modulus discussed in our course of experiments, the secant modulus
at 0.1 strain is reported. The dimensions of the test bars are 127 mmx 12.4 mm x 3.05 mm. Upon

26
injection molding, the test parts were conditioned at 23±2°C and 50±5% humidity for 48 hours
prior to testing.
Izod Impact Strength
Izod impact strength is a measurement of a material’s impact resistance (joules per square
meter) that is calculated from the difference in a swinging pendulum’s height prior to and after
impacting a notched test sample. The change in gravitational potential energy of the pendulum is
then used as a measure of a material’s impact resistance. Our values were recorded in accordance
with the procedure outlined in ASTM D 256 [36]. The dimensions of the test specimens were
63.5 mm x 10.150 mm x 3.100 mm, where the second dimension was measured from the tip of
the notch to the end of the specimen width. The samples were conditioned in 23±2°C and 50±5%
humidity for 24 hours upon notching for testing. Notching the samples was done in a two-hour
time frame two hours after the sample was injection molded. Five samples were tested for each
ICP formulation and their average and associated standard deviation were recorded.

27
SSE Processing Data
Throughput
In this section, we will present the processing data for the single-screw extrusion
experiments. Figures 3.1 and Figures 3.2 show the distinct linear correlation between the
extruder throughput and speed for a range of different viscosities of polypropylene. The additives
used for the 10 MFR and 60 MFR formulations are NaBz and NX8000 respectively. We observe
that a linear relationship exists between extruder throughput and speed for both low and high
viscosity polypropylene. Figure 3.3 shows the change in throughput between Screw 1 and Screw
2 (with Screw 2 values being generally higher) across different viscosities and different extrusion
speeds. Lower MFR blends show greater predictability in terms of producing a lower throughput
than the higher MFR blends. There were no conclusive throughput differences between the two
screws for 60 MFR polypropylene. Higher molecular weight polypropylene (with greater bulk
density and greater viscosity) generate a stronger correlation between throughput and extrusion
speed.

28
Figure 3.1: Linear dependency of throughput on extrusion speed for high viscosity HPPs.
Figure 3.2: Linear dependency of throughput on extrusion speed for lower viscosity PP. We
notice a weaker correlation with lower viscosity PP.
R² = 0.9811
R² = 0.9864
R² = 0.9961
R² = 0.9994
0
2
4
6
8
10
12
14
16
18
20
60 70 80 90 100 110 120 130 140
Thro
ughput
(kg/h
r)
Extruder Speed (RPM)
0.1 MFR Screw 1 0.1 MFR Screw 2 2 MFR Screw 1 2 MFR Screw 2
R² = 0.7101 R² = 0.9762 R² = 0.9144R² = 0.9229
0
2
4
6
8
10
12
14
16
18
20
90 100 110 120 130 140
Th
roughput
(kg/h
r)
Extruder Speed (RPM)
10 MFR Screw 1 10 MFR Screw 2 60 MFR Screw 1 60 MFR Screw 2

29
Figure 3.3: Change in throughput with increasing extrusion speed.
Pressure
The pressure transducer of the Brabender SSE is located between heating zones 4 and 5
in Figure 2.2 right before the extrudate leaves the die. Figure 3.4 shows the pressure profiles of
the two screw designs across a range of different PP viscosities at 100 RPM screw speed, where
HPN20E was chosen as the nucleating agent for both 10 MFR and 60 MFR PP. We observe that
the values of pressure for the Screw 1 are higher than the values for Screw 2, which can be
attributed to a greater flow of material through Screw 1 per unit time since Screw 1 has shown
higher throughput values. The longer feeding section conveying more material into Screw 1
coupled with a lower melting capacity than Screw 2 explains the discrepancy in the two pressure
profiles. We also notice that this discrepancy decreases as the viscosity of the PP decreases. At
0.1 MFR, the difference in the two pressure profiles is 294±2 PSI, which decreases to 123±2 PSI
at 2 MFR, and decreases yet again to 92±2 PSI at 10 MFR. We can conclude that the pressure of
R² = 0.9538
R² = 0.943
R² = -0.862
R² = 0.1258
-2
-1
0
1
2
3
4
5
6
60 70 80 90 100 110 120 130 140
ΔT
hro
ughput
(kg/h
r)
Extruder Speed (RPM)
0.1 MFR 2 MFR 10 MFR NaBz 60 MFR NX8000

30
the SSE process is dependent not only on the design of the screw, but also on viscosity of the
material flowing through the extruder as well.
Figure 3.4: Pressure profiles of two SSE screw designs extruding various viscosities of PP. Note
the x-axis is logarithmic to produce a linear relationship.
Torque
The torque profiles at 100 RPM for Screw 1 and Screw 2 for different viscosities are
shown in Figure 3.5, where NaBz was used to nucleate 10 MFR HPP and NX8000 was used as a
clarifier for 60 MFR RCP. The elongated transitioning and metering sections of Screw 2 should
produce greater torque values than the ones observed in Screw 1. The average difference in
torque between Screw 2 and Screw 1 is relatively small – 6±5 Nm. Surprisingly, the torque of
Screw 1 is actually higher than Screw 2 when processing fractional MFR HPP. This anomaly can
be explained as a balancing effect between the enhanced melting characteristic and the greater
0
200
400
600
800
1000
1200
1400
1600
1800
2000
0.1 1 10 100
Pre
ssure
(P
SI)
MFR (dg/min)
Screw 1 Screw 2

31
shearing capabilities of Screw 2. In the case of very viscous PP, proper heat transfer is required
to melt the PP and decrease the torque required for mixing. Due to the shorter transitioning and
metering section, Screw 1 compensates by experiences a greater torque than Screw 2 for the 0.1
MFR PP. Once the viscosity of the PP decreases, less efficient heat transfer from the metal of the
screw to the PP produces a subtler effect on the torque values, thus we observe lower values of
torque for Screw 1 than Screw 2 at MFR values higher than 0.1.
Figure 3.5: Torque profiles of two SSE screw designs extruding various viscosities of PP.
Specific Mechanical Energy (SME)
The specific mechanical energy discussed in the Background is reproduced here for
convenience:
𝑆𝑀𝐸 =𝑃×𝜏×
𝑁𝑎𝑐𝑡𝑢𝑎𝑙𝑁𝑟𝑎𝑡𝑒𝑑
ṁ [Equation 7].
0
20
40
60
80
100
120
140
160
180
200
0 10 20 30 40 50 60 70
Torq
ue
(Nm
)
MFR (dg/min)
Screw 1 Screw 2
32
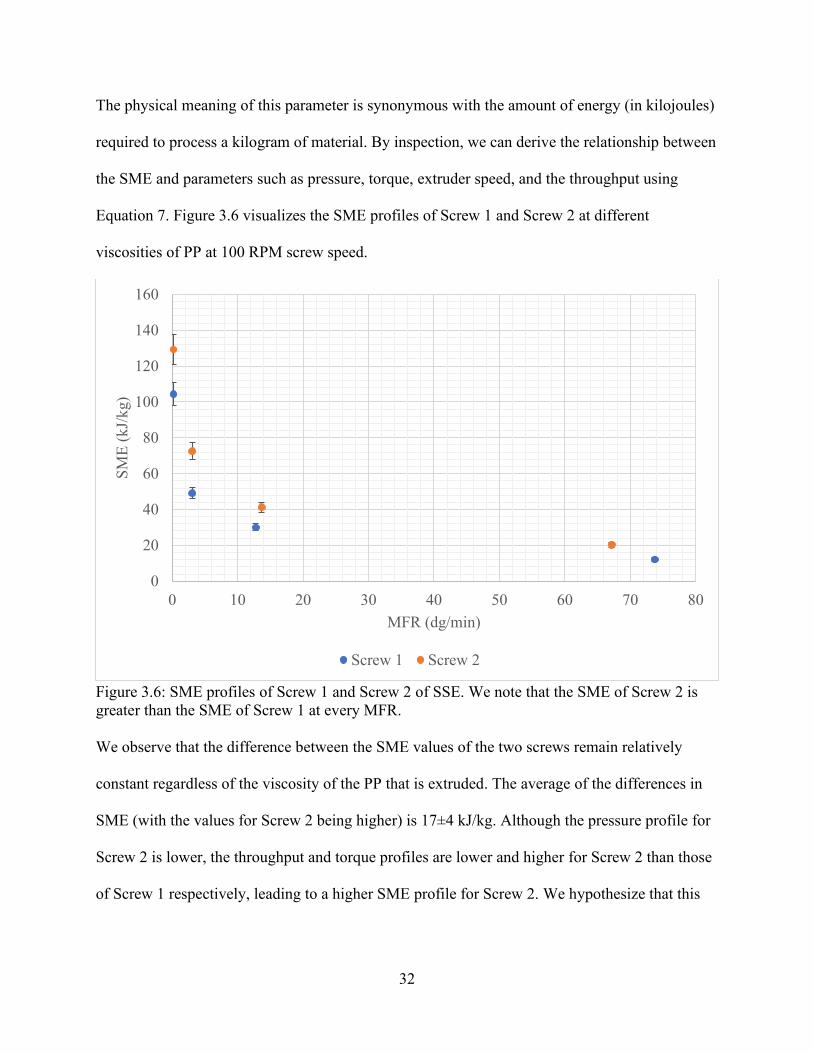
The physical meaning of this parameter is synonymous with the amount of energy (in kilojoules)
required to process a kilogram of material. By inspection, we can derive the relationship between
the SME and parameters such as pressure, torque, extruder speed, and the throughput using
Equation 7. Figure 3.6 visualizes the SME profiles of Screw 1 and Screw 2 at different
viscosities of PP at 100 RPM screw speed.
Figure 3.6: SME profiles of Screw 1 and Screw 2 of SSE. We note that the SME of Screw 2 is
greater than the SME of Screw 1 at every MFR.
We observe that the difference between the SME values of the two screws remain relatively
constant regardless of the viscosity of the PP that is extruded. The average of the differences in
SME (with the values for Screw 2 being higher) is 17±4 kJ/kg. Although the pressure profile for
Screw 2 is lower, the throughput and torque profiles are lower and higher for Screw 2 than those
of Screw 1 respectively, leading to a higher SME profile for Screw 2. We hypothesize that this
0
20
40
60
80
100
120
140
160
0 10 20 30 40 50 60 70 80
SM
E (
kJ/
kg)
MFR (dg/min)
Screw 1 Screw 2

33
discrepancy in energy between the two screw designs is what allows for better distribution of the
additive packages throughout the polymer matrix.
MFR Break
The melt flow rate (MFR) inherently is a measure of the average molecular weight of the
polymer chains because the average size of a polymer is related to the viscosity of the polymer
which in turn is related to MFR by Equation 8. An increase in the MFR or decrease in the
viscosity of the PP occurs as the polymer is exposed to heat and shearing forces as the material
travels down the length of the extrusion screw. The cleaving of previously longer polymer chains
is what contributes to this eventually increase in MFR after the PP is extruded. Because the
viscosity of the PP is directly related to important mechanical properties such as tensile strength
and impact strength, changes in the MFR of the PP is an unfavorable result of extrusion that is
sought to be limited. In the case of our two screw designs, we compare the changes in viscosity –
which we call MFR break each formulation experiences upon extrusion. Figure 3.7 and 3.8
visualize the MFR break with respect to extrusion speed for the two screws, which has been
normalized using the original MFR value of each PP formulation. Both 10 and 60 MFR
formulations were nucleated using HPN20E.

34
Figure 3.7: MFR break of high viscosity HPPs. The MFR of 0.1 MFR HPP for Screw 2 has
increased approximately 50% at 100 RPM.
Figure 3.8: MFR break of lower viscosity PP with increasing screw speed. The MFR break of
Screw 2 is always greater than values observed for Screw 1, regardless of the PP viscosity.
We observe that regardless of the PP MFR, Screw 2 exhibits greater MFR break than Screw 1.
Due to the shearing profiles of each screw, these findings are within expectation. Table 3.1
summarizes the differences in MFR break at 100 RPM between the two screws for different
viscosities of PP tested.
1
1.1
1.2
1.3
1.4
1.5
1.6
1.7
0 20 40 60 80 100 120 140 160
No
rmal
ized
MF
R
Extruder Speed (RPM)
0.1 MFR - Screw 2
0.1 MFR - Screw 1
2 MFR - Screw 2
2 MFR - Screw 1
1
1.05
1.1
1.15
1.2
1.25
1.3
0 50 100 150
Norm
aliz
ed M
FR
Extruder Speed (RPM)
10 MFR Screw 1 10 MFR HPN20E Screw 2
60 MFR Screw 1 60 MFR HPN20E Screw 2

35
PP MFR (dg/min) ΔMFR break (%)
0.1 27±8
2 4.8±0.2
10 8.42±0.04
60 4.295±0.003
Table 3.1: Differences in MFR break between Screw 2 and Screw 1 at 100 RPM.
Figures 3.7 and 3.8 depict how the PP behaves as it travels through the extruder. The MFR break
will increase for a given PP formulation until a sufficient extruder speed is reached to
homogenize the polymer. Then the MFR break will decrease with increasing screw speed (as
more energy is imparted to the polymer to better mix the additives and homogenize the
formulation) until shear degradation occurs at a certain screw speed, past which the MFR break
will increase again. Increasing the extrusion speed from 70 RPM to 100 RPM for 0.1 MFR and 2
MFR for Screw 1 shows lower viscosity changes, which is a sign of sufficient mixing in the
screw. For Screw 2, lower viscosity changes are observed at higher extrusion speeds (120 RPM).
For lower viscosity PP, lower viscosity changes are observed after 100 RPM for both screw
designs.
Polydispersity Index and the Molecular Weight Distribution
Changes in the PDI upon extrusion represent decreases in the sizes of the polymer chains
as the shearing forces alter the molecular weight distribution. The PDI for different viscosities of
PP for each screw with respect to the screw speed is shown Figure 3.9 and 3.10.

36
Figure 3.9: PDI of 0.1 MFR HPP of two screw designs with increasing screw speed.
Figure 3.10: PDI of 2 MFR HPP of two screw designs with increasing screw speed.
3.5
3.7
3.9
4.1
4.3
4.5
4.7
4.9
5.1
5.3
5.5
60 80 100 120 140
PD
I
Extrusion Speed (RPM)
0.1 MFR Screw 1 0.1 MFR Screw 2
4
4.1
4.2
4.3
4.4
4.5
4.6
4.7
4.8
4.9
60 80 100 120 140
PD
I
Extrusion Speed (RPM)
2 MFR Screw 1 2 MFR Screw 2

37
We observe the largest change in PDI as we increase the screw speed from 70 to 135 RPM for
Screw 1, where the PDI decreases by 1.2±0.1. This decrease can be explained as the higher
molecular weight chains are cleaved to produce smaller chains, which lead to a tighter molecular
weight distribution. Recall that the 0.1 MFR PP for Screw 1 showed a greater torque input than
when extruded using Screw 2. This is further evidence to support our hypothesis that polymer
cleavage is indeed the reason for the particularly large PDI change observed for low viscosity
PP.
Blending Behavior
The blending capabilities of the two screw designs were studied by extruding a
compounded formulation consisting of 10 wt. % low MFR PP and 90 wt. % high MFR PP. We
also re-extruded these blends to observe if increasing the effective residence time in the screw
enhanced the mixing in any of the two screw designs. We extruded two blends using Screw 1
and three blends using Screw 2. Figures 3.11 and 3.12 visualize the MFR in one and two-pass
extrusion for the different blends in each screw design respectively. We observe that increasing
the processing time via re-extrusion does not change the MFR of the extrudate. We also notice
that the 60 MFR PP with nucleator HPN20E shows essentially the same MFR value for both
screws and likewise for similar composition blends (0.1+70 MFR and 0.1+60 MFR in Screw 1
and Screw 2 respectively). We can ascertain that the blending capabilities of the two screws are
similar.

38
Figure 3.11: Screw 1 blending behavior. We notice minimal differences between the two screws.
Figure 3.12: Screw 2 blending behavior. Again, we notice minimal differences between the two
screws.
0
10
20
30
40
50
60
70
0 1
MF
R (
dg/m
in)
Pass Number
0.1 MFR + 40 MFR 0.1 MFR + 70 MFR 60 MFR
0
10
20
30
40
50
60
70
80
0 1
MF
R (
dg/m
in)
Pass Number
0.1 MFR + 200 MFR 2 MFR + 200 MFR
0.1 MFR + 60 MFR 60 MFR HPN20E

39
Results and Discussion
We summarize the haze measurements of three different formulations of PP for different
screw designs in Figure 3.13.
Figure 3.13: Haze comparison of different SSE screws and twin-screw ZSK30. When 60 MFR
RCP is extruded through the three different screw configurations, we observe very little
difference in haze.
We see that there are no significant differences in the haze of 10 MFR HPP nucleated with
HPN20E and NaBz regardless of the screw design incorporated. We also see that the clarifier
NX8000 performs the same regardless of the screw design used (including a twin-screw design).
Goossens et al. explains that a clarifier works to decrease the wide-angle scattering of light in the
crystalline structure of PP by a twofold approach: 1) by decreasing/preventing spherulite
formations in the crystal structure of the PP matrix and 2) the induction of randomly-ordered or
shish-kebab crystal structures via nanofibrillar scaffolds with a high density of nucleation sites
[37]. In the case of HPN20E and NaBz which just decrease the sizes of the spherulites we
observe that the haze is significantly higher than the NX8000 which incorporates the latter part
0
5
10
15
20
25
30
35
40
45
50
55
60
10 MFR HPP HPN20E 10 MFR HPP NaBz 60 MFR RCP NX8000
Haz
e
Formulation
Screw 1 Screw 2 ZSK30 Twin Screw

40
of the twofold approach as well. We also take into consideration that the average molecular
weights of the 10 MFR samples are higher which generally result in larger spherulites.
Distributive mixing in both Screw 1 and Screw 2 seem to be similar in additive mixing
capabilities when comparing the 10 MFR and 60 MFR PP. For the 10 MFR especially, we can
generalize that that the spherulite sizes of PP are unaffected by the design of the screw since both
NaBz and HPN20E show essentially identical haze measurements.
Effect of Screw Design and Viscosity on the Flexural Modulus
Figure 3.14, 3.15, 3.16, and 3.17 show the flexural moduli for different screw designs and
additives at 0.1 MFR HPP, 2 MFR HPP, 10 MFR HPP, and 60 MFR RCP. Only the 2 MFR HPP
show significant increases in the flexural modulus when using Screw 2 over the other two screw
designs, where Sterling is a decommissioned single-screw extruder with established similar
mixing capabilities as Screw 1. Screw 2 shows an increase of 130±20 MPa over Screw 1 in 2
MFR extrusion. The flexural moduli of the 0.1 HPP, 10 MFR HPP, and 60 MFR RCP do not
replicate these findings. Instead, the changes are within the error propagated in the measurement
and no significant conclusion can be drawn at these PP viscosities in relation to the type of screw
used – regardless of the additives used. Referring to 3.7 and 3.9 where the MFR break and PDI
changes of 0.1 MFR PP were investigated respectively, we see a greater PDI change in Screw 2
than Screw 1 at 100 RPM coupled with a much greater MFR break in Screw 2 as well. The
intense shearing history of Screw 2 allows for the long polymer chains in the high viscosity PP to
be cleaved (as evident in the greater change in MFR). A lower PDI with smaller chains suggest
that the sizes of the polymer chains and the effective spherulite sizes have decreased when using
Screw 2 to perform the extrusion. The same approach can be used to explain the large

41
differences in flexural moduli observed with the 2 MFR HPP. We do not see this effect in the
higher viscosity PP due to the ease with which the smaller molecular weight polymer chains
disentangle from each other. With 0.1 MFR HPP, the high viscosity coupled with the greater
shearing forces exhibited in Screw 2 leading to eventual polymer degradation explain why a
similar increase in flexural modulus is not observed as with the 2 MFR. In terms of additive
distribution, we observe no significant differences between Screw 1 and Screw 2 as evident in
the flexural moduli data of the nucleated PP. The differences in the two screw designs are more
of a result in the nature of the greater shearing forces induced in Screw 2 compared to Screw 1,
which provides greater uniformity within the melt.
Figure 3.14: Flexural moduli data for 0.1 MFR HPP for different screw designs at 100 RPM.
1380
1400
1420
1440
1460
1480
1500
Sterling Screw 1 Screw 2
Fle
xura
l M
odulu
s (M
Pa)
Screw Type

42
Figure 3.15: Flexural moduli data for 2 MFR HPP for different screw designs at 100 RPM.
1300
1350
1400
1450
1500
1550
1600
1650
Screw 1 Sterling Screw 2
Fle
xura
l M
od
ulu
s (M
Pa)
Screw Type

43
Figure 3.16: Flexural moduli data for 10 MFR HPP (NaBz/HPN20E) for different screw designs
at 100 RPM.
0
200
400
600
800
1000
1200
1400
1600
1800
2000
NaBz HPN20E
Fle
xura
l M
odulu
s (M
Pa)
Additive Type
Screw 1 Screw 2 Screw 2 (Check)

44
Figure 3.17: Flexural moduli data for 60 MFR RCP with HPN20E for different screw designs at
100 RPM. This figure shows the differences in flexural modulus between the two screw designs.
We can also describe how residence time affects the Screw 1 flexural modulus.
Effect of Screw Speed on the Flexural Modulus
Figures 3.18 and 3.19 visualize the flexural moduli of different viscosities at different
screw speeds for Screw 1 and Screw 2. We readily observe that there are no significant
differences in the flexural moduli of 2 MFR and 60 MFR when comparing the two screw
designs. For 0.1 MFR HPP, however, we observe a substantial increase in the flexural modulus
by 51±33 MPa for Screw 1 when increasing the screw speed from 100 RPM to 135 RPM. For
Screw 2, this change is negative at 16±16 MPa. Increasing the screw speed past 100 RPM for
Screw 2 show signs of polymer degradation evident in the loss of flexural strength. Screw 1
extrusion at 100 RPM is not sufficient in properly uniformizing the melt, which is why we
observe increases in the flexural modulus at 135 RPM. From these findings, we conclude that
Screw 2 is able to better melt and homogenize higher viscosity PP at operational screw speed.
800
820
840
860
880
900
920
940
Pass 1 Pass 2
Fle
xura
l M
odulu
s (M
Pa)
Pass Number
Screw 1 Screw 2

45
Figure 3.18: Flexural modulus of high viscosity PP with increasing screw speed. 2 MFR HPP
observes very little change with increasing screw speed.
Figure 3.19: Flexural modulus of 60 MFR HPN20E RCP (Screw 1) with increasing screw speed.
We observe almost no differences in flexural modulus.
1300.0
1325.0
1350.0
1375.0
1400.0
1425.0
1450.0
1475.0
1500.0
1525.0
1550.0
1575.0
1600.0
1625.0
1650.0
100 RPM 135 RPM
Fle
xura
l M
odulu
s (M
Pa)
Extruder Speed (RPM)
0.1 MFR Screw 1 0.1 MFR Screw 2 2 MFR Screw 1 2 MFR Screw 2
0.00
100.00
200.00
300.00
400.00
500.00
600.00
700.00
800.00
900.00
1000.00
100 RPM 120 RPM
Fle
xura
l M
odulu
s (M
Pa)
Extruder Speed (RPM)

46
Effect of Residence Time on the Flexural Modulus
Figures 3.17 and 3.20 show the effect of the residence time on the flexural modulus for
PP-blends and 60 MFR RCP nucleated with HPN20E respectively for Screw 2 at a constant
extrusion speed of 100 RPM. In both cases, we observe no significant differences between
single-pass and double-pass extrusion. From this result, we can conclude that the melt has been
sufficiently homogenized during the first extrusion by Screw 2 for both 60 MFR RCP and the
three blends. Increasing the process residence time may introduce shear degradation of the
polymer as evident in the slight decrease in flexural moduli of the blends upon re-extrusion.,
albeit these values are also within the propagated error.
Figure 3.20: Effect of residence time on the flexural moduli of blends (Screw 2). The flexural
moduli decrease with additional pass of extrusion – a sign of shear degradation of the polymer.
1450
1500
1550
1600
1650
1700
1750
1800
0.1 + 200 MFR 2+200 MFR 0.1+60 MFR
Fle
xura
l M
odulu
s (M
Pa)
Blend Composition
Pass 1 Pass 2

47
TSE Processing Data
A JSW twin screw extruder with 32 L/D was used for the twin-screw design study.
Twelve heating zones with a temperature profile outlined in Table 4.1 was used to melt the
polypropylene in the barrel chamber. The heating zone number correlates to the distance away
from the feeding position of the extruder, where Zone 1 would be the feeding zone.
Heating Zone Temperature (°C)
2 50
3 50
4 200
5 200
6 210
7 220
8 225
9 235
10 235
11 235
12 235
Table 4.1: Temperature profile along JSW twin-screw extruder. The feed position is at heating
zone 1.
The maximum limit of torque, pressure, and extrusion speed for the extruder was reported to be
387 Nm, 3000 PSI, and 962 RPM respectively. The four screw designs described in Figure 2.1
were compared by extruding the ICP formulations outlined in Table 2.3 according to ideal
process conditions for the extruder determined by studying the processing data of RCPs and
HPPs on TEX25-MS. For each screw study, 500 ppm of nucleating agent Na11, 180 ppm of anti-
corrosive additive DHT-4A, 1000 ppm of anti-oxidants Irgafos 168, and 500 ppm of anti-oxidant

48
Igranox 1010 were added to every ICP formulation. The formulations for RCPs and HPPs used
in the single-screw experiments were replicated here as well.
The Effect of Feed Speed on Throughput of HPPs and RCPs
Compared to a single-screw extruder, a twin-screw extruder and its processing variables
are affected by two control inputs – the extrusion speed and the feed speed (rate of material into
the extruder). Figure 4.1 shows the predictability of the throughput of the process when plotted
as a function of the feed speed for different viscosities of PP for TEX25-MS.
Figure 4.1: Throughput as a function of feed rate of twin-screw extrusion using TEX25-MS. We
notice a strong linear correlation between control input and the throughput.
This correlation makes sense as a simple mass balance relates the mass flow into an extrusion
system to the mass flow (throughput) out of a system once we neglect any generation terms.
R² = 0.9898
R² = 0.9734R² = 0.9987
R² = 0.9934
0
5
10
15
20
25
30
35
0 20 40 60 80 100
Thro
ughput
(kg/h
r)
Feeder Speed (%)
60 MFR 10 MFR 2 MFR 0.1 MFR

49
�̇�𝑖𝑛 − �̇�𝑜𝑢𝑡 = �̇�𝑎𝑐𝑐 [Equation 16]
where macc represents the accumulation rate of residual polymer in the screw. If we assume that
the accumulation rate of residual polymer in the screw is sufficiently small compared to the flow
rates, we essentially observe a simple linear relationship between the throughput and the feed
rate.
MFR Break of HPPs and RCPs
The MFR break of HPPs and RCPs were measured and plotted with respect to the screw
speed as well as the feed rate in Figures 4.2, 4.3, 4.4, and 4.5. Due to the high shearing profiles
of the co-rotating screws of a TSE, the MFR break of a TSE is generally higher than that of a
SSE. We see this exemplified well in the 0.1 MFR HPP, which observes above a 500% increase
in MFR upon extrusion at 90% feed rate and 500 RPM. In higher viscosity PP, specifically the
10 MFR NaBz nucleated HPP and the 60 MFR HPN20E nucleated RCP, we observe that
differences in the MFR break with changes in the screw speed are within 10%. These changes
are much larger in higher viscosity HPPs. We also observe that for high viscosity PP, increasing
the feed rate of material into the extruder decreases the MFR break when compared to lower feed
rates. This finding can be a result of the lower bulk density of higher viscosity PP. We do not see
this result replicated with the 0.1 MFR HPP, where instead greater feed rates increase the MFR
break. The packing ability of the polymer which is linked directly to the bulk density of the
polymer seems to be a dominant effect in determining overall viscosity changes upon extrusion
in a twin-screw system. It is of important note that the twin-screw design TEX25-MS was
exposed to atmosphere at around Position C10 referring back to Figure 2.1. Exposing the
polymer to atmosphere during extrusion could have led to oxidative degradation which might

50
have affected the results of extrusions performed on TEX25-MS. Because we observe a minimal
effect on the MFR break with changes in the feed rate and increasing MFR break with increases
in the extrusion speed, we determined that a high feed rate coupled with a lower extrusion speed
was the best set of parameters to limit the MFR break during extrusion while maximizing
productivity. For future ICP work, we decided to extrude samples at 300 RPM and 90% feed
rate, a set of parameters chosen with low extrusion speed and high feeding rate.
Figure 4.2: MFR break of 0.1 MFR HPP as a function of feed rate and extrusion speed for
TEX25-MS. Bubble size from smallest to largest is indicative of extrusion speed: 200 RPM, 300
RPM, 500 RPM.
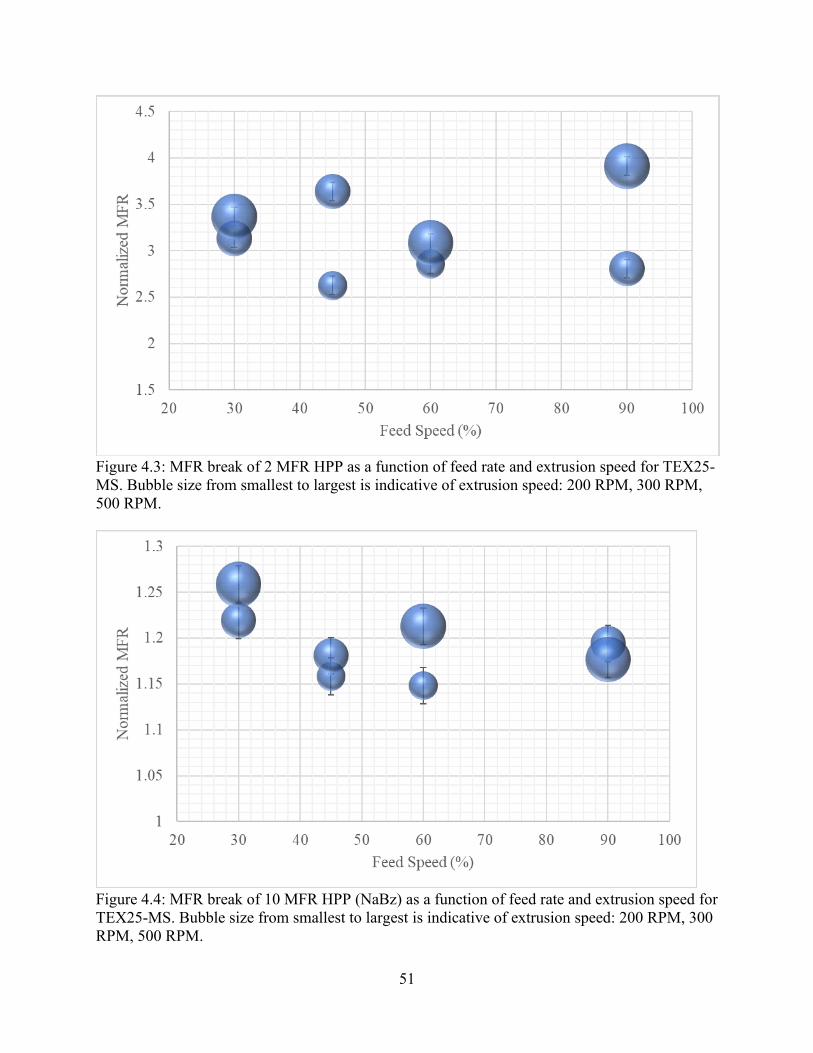
51
Figure 4.3: MFR break of 2 MFR HPP as a function of feed rate and extrusion speed for TEX25-
MS. Bubble size from smallest to largest is indicative of extrusion speed: 200 RPM, 300 RPM,
500 RPM.
Figure 4.4: MFR break of 10 MFR HPP (NaBz) as a function of feed rate and extrusion speed for
TEX25-MS. Bubble size from smallest to largest is indicative of extrusion speed: 200 RPM, 300
RPM, 500 RPM.

52
Figure 4.5: MFR break of 60 MFR HPP (HPN20E) as a function of feed rate and extrusion speed
for TEX25-MS. Bubble size from smallest to largest is indicative of extrusion speed: 200 RPM,
300 RPM, 500 RPM.
Comparison of HPP and RCP MFR Break between TEX25-MS and TEX25-HS3
The same HPP and RCP formulations tested in our SSE and TEX25-MS screw
experiments have been repeated for TEX25-HS3 to provide a comparison of MFR breaking
behavior across the three screw designs. We do note that the shearing history of TSE is much
more significant by design than it is in SSE. Figures 4.6 and 4.7 show the MFR break for 0.1, 2,
10, and 60 MFR PP extruded through TEX25-HS3. Referring to Figures 4.2-4.5 and 4.6-4.7 we
observe much higher values of MFR break in TEX25-MS than TEX25-HS3 when extruding high
viscosity PP and similar MFR break when extruding lower viscosity PP. From this finding, if we
can conclude that the mechanical properties of PP extruded through TEX25-HS3 are superior to
those of PP extruded through TEX25-MS, we can link the two together to arrive at a definitive
conclusion.

53
Figure 4.6: MFR break of high viscosity HPP with respect to extrusion speed and feed speed for
TEX25-HS3. Bubble sizes from smaller to larger: 60% and 90% feed rate.
Figure 4.7: MFR break of medium and low viscosity HPP (10 MFR NaBz) and RCP (60 MFR
HPN20E) with respect to extrusion speed and feed speed TEX25-HS3. Bubble sizes from
smaller to larger: 60% and 90% feed rate.

54
SME vs. MFR
The combined processing parameter SME will be used to study the changes of the MFR
with variabilities in pressure, torque, and throughput. Figure 4.8 shows the SME for different
viscosities of PP tested on three different screw designs – Screw 2 of the SSE, the moderate
shear profile TEX25-MS, and the highest shear profile TEX25-HS3. We observe that TEX25-
HS3 has a higher SME value for every viscosity of PP tested when compared to the other two
screws.
Figure 4.8: Comparison of SME dissipation of Screw 2 of SSE, TEX25-MS, and TEX25-HS3
for different viscosities of PP.
MFR Break of ICP Extruded Through Different Screw Designs
A range of different viscosity ICPs were extruded through the five different screw
designs (including the ZSK30) and their MFR values were normalized using the MFR values of
the ICPs prior to extrusion. Figure 4.9 presents the data for 96, 90, 51, and 46 MFR ICPs. Each
0
20
40
60
80
100
120
140
160
180
0.1 1 10 100
SM
E (
kJ/
kg)
MFR (dg/min)
SSE TEX25-MS TEX25-HS3

55
extrusion was operated at 90% feed rate and 300 RPM. We observe that some of the normalized
MFR values are below 1, which is nonsensical considering the shearing degradation of the
polymer matrix that occurs during extrusion which by definition works to increase the MFR
values. A probably explanation to this phenomenon is an issue with sampling, where MFR
samples are typically taken from a large container consisting of the PP. Once collected from the
reactor, the PP in the container may be uneven in terms of MFR, where samples collected from
different parts of the container may yield different results. Regardless, the respective MFR break
values are what are of importance, so this issue may be disregarded for purposes of this study.
Upon inspection, we determine that the MFR break of TEX25-HS3 is lower than those
experienced using other high shear screws, except for when extruding 90 MFR ICP.
Figure 4.9: MFR break of different viscosity ICP using different TSE screw design. The MFR
break of TEX25-HS3 is lower than TEX25-MS for all 4 MFR ICPs.
When we study the SME data for the same groupings of ICPs for the four JSW screw designs in
Figure 4.10, we observe that the SME values of TEX25-HS3 is similar to and sometimes lower
0
0.2
0.4
0.6
0.8
1
1.2
1.4
96 90 51 46
Norm
aliz
ed M
FR
MFR (dg/min)
ZSK30 TEX25-MS TEX25-HS1 TEX25-HS2 TEX25-HS3

56
than that of the other high shear screw designs. The addition of the more kneading blocks does
impart more shearing force and increases the torque required for operation, but due to the fact
that SME is a compound metric of energy factoring in the throughput, we observe that increasing
the density of kneading blocks in TSE screw design does not necessarily translate into increases
in the SME dissipation of the screw. The lower SME values observed with the TEX25-HS3
explain the lower MFR break exhibited by this screw design.
Figure 4.10: SME dissipation at different viscosities of ICP for different screw designs. We
observe no significant changes in SME of higher shear screw designs. Higher shear screw
designs exhibit higher SME values than TEX25-MS.
0
10
20
30
40
50
60
70
80
90
100
96 90 51 46
SM
E (
kJ/
kg)
MFR (dg/min)

57
Results and Discussion
In this section we will investigate how the different screw designs affect mechanical
properties such as the flexural modulus and Izod impact strength. Then, we will study the
polymer surface and matrix morphology using microscopy methods.
Flexural Modulus
We measured the flexural moduli of the different viscosities of ICPs extruded through the
five screw designs and summarized the results in Figure 4.11.
Figure 4.11: Comprehensive flexural modulus data for all TSE screw designs across MFR range.
We observe that the flexural modulus of the 96 and 90 MFR samples extruded through TEX25-
HS3 are higher than the samples extruded using TEX25-MS. Differences between the flexural
moduli of the 51 and 46 MFR ICP samples extruded through TEX25-MS and TEX25-HS3 seem
to be within the propagated error. In terms of ICP flexural moduli, we observe limited
improvements by using a greater shear inducing screw.
800
900
1000
1100
1200
1300
1400
1500
1600
1700
96 90 54 51 46 26 9
Fle
xura
l M
odulu
s (M
Pa)
MFR (dg/min)
ZSK30 TEX25-MS TEX25-HS1 TEX25-HS2 TEX25-HS3

58
Figure 4.12 compares the flexural moduli of HPP/RCP samples extruded through Screw
2 SSE and TEX25-MS to gain an understanding of the degree of shearing forces and additive
mixing in each scenario. We observe an increase in flexural modulus of 46±36 MPa for the 60
MFR HPN20E when using the twin screw over single screw. Differences in the flexural moduli
are insignificant when studying the 2 MFR and 10 MFR NaBz HPPs. The largest discrepancy in
flexural moduli is observed when extruding the 0.1 MFR, with TEX25-MS producing values
180±30 MPa than its single-screw counterpart. The increasing shearing rates of the twin-screw
design could be leading to mechanical degradation of the polymer in the case the polymer
viscosity is very high. When the viscosity is lower (observed in the 60 MFR), the increasing
shearing forces of the twin-screw configuration do not degrade the polymer and instead lead to
greater additive mixing as evident in increased flexural moduli of nucleated samples.
Figure 4.12: Comparison of TSE (TEX25-MS) and SSE (Screw 2) flexural modulus values for
HPP (0.1, 2, and 10 MFR) and RCP (60 MFR).
0.00
200.00
400.00
600.00
800.00
1000.00
1200.00
1400.00
1600.00
1800.00
2000.00
60 MFR HPN20E 10 MFR NaBz 2 MFR 0.1 MFR
FL
exura
l M
odu
lus
(MP
a)
MFR (dg/min)
Flexural Modulus Comparison Between TSE and SSE
Screw 2 SSE TSE

59
Lastly, we study the flexural moduli data for different viscosity ICPs to observe the effect
of increasing the screw speed on the mechanical properties of the extrudate. Figure 4.13
summarizes the flexural moduli data of samples extruded through TEX25-HS3. We observe that
regardless of the MFR, increasing the extrusion speed from 300 to 500 RPM produces negligible
improvements in the flexural moduli of the ICP. This finding supports our earlier decision to
limit the MFR break during extrusion by operating at 300 RPM for all samples, since we do not
observe significant differences in the mechanical properties.
Figure 4.13: Changes in flexural modulus in TSE (TEX25-HS3) with changes in extrusion speed.
We notice that the changes in the flexural modulus are negligible when changing the screw speed
from 300 to 500 RPM.
Impact Strength of ICPs
The Izod impact strength of ICP samples extruded through the 5 different screw designs
were recorded and visualized in Figure 4.14. In Figure 4.14, we observe that the Izod impact
strength of the 96 MFR ICP shows no significant differences regardless of what screw was used
to perform the extrusion. We notice a small difference between the values for TEX25-MS and
0
200
400
600
800
1000
1200
53 31 20.5
Fle
xura
l M
odulu
s (M
Pa)
MFR (dg/min)
300 RPM 500 RPM

60
TEX25-HS3 when observing the 90 MFR ICP. However, when we restrict our comparison to the
51 and 46 MFR ICPs, we begin to see a great improvement in the Izod impact strength when
using TEX25-HS3 over TEX25-MS by 40±10 and 32±6 J/m2 respectively. We attribute this
increase in Izod impact strength to the better dispersive mixing of TEX25-HS3 which was able
to reduce the rubber particles sizes throughout the polymer matrix more effectively than TEX25-
MS due to its higher shearing profile.
Figure 4.14: Comprehensive Izod impact strength data for a range of ICP viscosities for all TSE
screw designs.
Again, here we report the Izod impact data for 53, 31, and 20.5 MFR ICP as we change
the extrusion speed to observe if changing the screw speed imparted better mixing in the PP.
TEX25-HS3 was used as the screw for these set of experiments. Upon inspection in Figure 4.15,
0
50
100
150
200
250
300
96 90 54 51 46 26 9
IZO
D (
J/m
2)
MFR (dg/min)
ZSK30 TEX25-MS TEX25-HS1 TEX25-HS2 TEX25-HS3

61
we observe almost no changes between the two extrusion speeds. Selecting to operate at 300
RPM sacrifices no mechanical properties while also limiting the MFR break in the polymer.
Figure 4.15: Changes in the Izod impact strength for TEX25-HS3 with changing screw speed.
We notice no significant differences in the Izod impact strength with changing the screw speed
from 300 RPM to 500 RPM.
Mechanical Properties of Different Fc ICPs
Figures 4.16, 4.17, and 4.18 show the mechanical properties of the different ICPs
categorized by the rubber concentration and screw designs. Figure 4.16 shows the Izod impact
strength and flexural modulus for rubber concentrations 15 wt. % and lower. We call these ICP
formulations high stiffness ICPs. We observe that at lower viscosities, the Izod impact strength is
essentially constant regardless of the screw design used. The flexural modulus however, favors
the TEX25-HS3 with an increase of 52±48 MPa from values observed with TEX25-MS. At low
viscosities, the Izod impact strength does seem to depend on the screw design. Observing the 10
MFR grouping, we conclude that TEX25-MS with the lowest shearing history actually
outperforms the higher shear screw designs. In theory, the greater shearing capabilities of
0
100
200
300
400
500
600
700
53 31 20.5
Izod I
mpac
t S
tren
gth
(J/
m2)
MFR (dg/min)
300 RPM 500 RPM

62
ZSK30, TEX25-HS1, and TEX25-HS2 should lead to greater rubber particle dispersion in the
matrix, which in turn impart greater Izod impact strength. We surmise that the reason TEX25-
MS performs better in the case of lower rubber concentrations in the ICP is due to balancing the
degradation of the polymer brought upon by the shearing forces with dispersing the rubber
particles well enough throughout the polymer matrix.
Figure 4.17 shows the mechanical properties of ICPs with rubber contents between 22
and 25 wt. %. Studying the 50 MFR grouping, when the rubber content is sufficiently large, we
observe that the Izod impact strength begins to depend on the shearing capabilities of the screw
design. TEX25-MS, with its lower shearing profile, exhibits the lowest Izod strength of the
grouping. When observing the lower viscosity MFR, we determine that the Izod impact strength
varies less due to the lowered SME requirement to extrude the ICP, meaning it becomes easier to
distribute the rubber particles throughout the polymer matrix. We observe that the higher shear
screws again produce greater flexural modulus values than the lower shear screws. We surmise
that larger rubber particle sizes in TEX25-MS could be a reason for this discrepancy, which we
will discuss in future sections.
Figure 4.18 shows the Izod impact strength and flexural modulus data for different
viscosity ICPs with high rubber content (28-33 wt. %). We predict that with very high rubber
content, the Izod impact strength correlates very strongly with the shearing capabilities of the
screw. We find this to be true as TEX25-MS underperforms in Izod impact strength significantly
in both MFR groupings. As for flexural modulus of the high shear screw designs, the differences
between the values seem to be statistically insignificant.

63
Figure 4.16: Izod strength for ICP blends with rubber concentrations less 15 wt. %. We notice
significant differences in the Izod strength only at high viscosity ICP and differences in the
flexural moduli at lower viscosity ICPs.
Figure 4.17: Izod strength for ICP blends with rubber concentrations between 22 and 25 wt. %.
TEX25-HS3 provides a good balance of Izod impact strength and high flexural modulus at both
MFR.
0
20
40
60
80
100
120
1400 1450 1500 1550 1600
IZO
D (
J/m
2)
Flex Modulus (MPa)
ZSK30
TEX25-MS
TEX25-HS1
TEX25-HS2
TEX25-HS3
10 MFR
50 MFR
90 MFR
0
20
40
60
80
100
120
140
1050 1100 1150 1200 1250 1300 1350
IZO
D (
J/m
2)
Flex Modulus (MPa)
ZSK30
TEX25-MS
TEX25-HS1
TEX25-HS2
TEX25-HS3
50 MFR
90 MFR

64
Figure 4.18: Izod strength for ICP blends with rubber concentrations between 28 and 33 wt. %.
We that TEX25-MS performs poorly in Izod impact strength for both groupings. TEX25-HS3
exhibits similar flexural modulus values for 18 MFR when compared to TEX25-MS values.
Mechanical Properties of Low β/α ICP Formulations
The β/α ratio of an ICP formulation is also closely related to the viscosity ratio of the
rubber phase and the PP matrix. When we study the flexural moduli and Izod impact strength of
low β/α ICPs (at 1.8 β/α) or low differences in the viscosities of the rubber and the surrounding
PP matrix, we can derive some interesting conclusions. At 27 MFR, higher shear screw designs
provide significant improvements in the Izod impact strength without decreases in the flexural
modulus (TEX25-HS3 shows 32±6 J/m2 improvement in Izod impact strength when compared to
TEX25-MS with only a 6.2 MPa loss in flexural modulus – which is within the propagated
error). At higher MFR, the Izod impact strength is unaffected by the screw design but the
flexural modulus is greater in higher shear screws (TEX25-HS3 observes values 80±40 MPa
greater than TEX25-MS). At low β/α ratios, the dispersion of the rubber particles plays a large
0
50
100
150
200
250
300
840 860 880 900 920 940 960
IZO
D (
)J/m
2)
Flex Modulus (MPa)
ZSK30
TEX25-MS
TEX25-HS1
TEX25-HS2
TEX25-HS3
27 MFR
27 MFR
18 MFR
18 MFR

65
role in the fracture behavior of the ICP. For higher viscosity ICPs with low β/α, we conclude that
a higher shear screw is necessary to properly disperse the rubber particles throughout the
polymer matrix. For lower viscosities with low β/α, a higher shearing screw and a lower shearing
screw will perform similarly in terms of distributive mixing, but in order to limit particle
agglomeration within the matrix, a higher shearing screw is recommended.
Figure 4.19: Mechanical properties of low β/α ratio ICPs. We observe that TEX25-HS3 provides
the best blend of high stiffness and high impact resistance along with TEX-25-HS2.
Microscopy
In order to reinforce the conclusions that were drawn from our mechanical properties
data, we imaged microtome sections of Izod samples of 96 MFR ICP extruded using the ZSK30,
TEX25-MS, and TEX25-HS3 using a scanning electron microscope (HITACHI TM3030 Plus).
We surprisingly observe very little visual differences between the three SEM images, which are
0
20
40
60
80
100
120
140
160
180
800 900 1000 1100 1200 1300 1400
Izod (
J/m
2)
Flexural Modulus (MPa)
ZSK30 TEX25-MS TEX25-HS1 TEX25-HS2 TEX25-HS3
27 MFR
1.8 β/α
90 MFR 1.8 β/α

66
shown in Figure 4.20. The images correspond to the following labeling scheme from left to right:
ZSK30, TEX25-MS, and TEX25-HS3. The black background represents the polymer matrix
while the white particles image the rubber particles disperse throughout the PP matrix. When we
decrease the magnification shown at Figure 4.21, we observe that larger 20-25 μm clusters of
rubber exist in the matrix of the ZSK30 sample. This clustering phenomenon may exist in the
TEX25-MS sample as well but might be absent in the TEX25-HS3 sample, which could explain
improvements in Izod impact strength observed with samples extruded using TEX25-HS3.
We also used a light microscope to image the crack propagation of 18 MFR ICP with 28
Fc and 2.1 β/α. From Figure 4.22, we observe the crack length of the tested sample extruded
using TEX25-MS, TEX25-HS1, and TEX25-HS2 respectively. The propagated crack length is
520±10 μm shorter in TEX25-HS1 and 360±10 μm shorter in TEX25-HS2, which yield
65.5±1.2% and 45.3±1.2% decreases in crack length respectively. The higher shear screws
produce smaller size rubber particles which in turn are able to arrest crack propagation within the
test samples when exposed to dynamic loading.
Figure 4.20: SEM imaging of microtome section taken from 96 MFR ICP with 15 wt. % Fc and
2.3 β/α extruded using in order from left to right: ZSK30, TEX25-MS, and TEX25-HS3.

67
Figure 4.21: Observation of large agglomeration of rubber particles in ICP matrix. The
highlighted portions of the image refer to the unusually large rubber particles found thorughout
the Izod sample.

68
Figure 4.22: Crack propagation of 18 MFR ICP with 28 wt. % Fc and 2.1 β/α across various
screw designs. From top to bottom: TEX25-MS, TEX25-HS1, and TEX25-HS2.

69
Conclusions and Future Work
Through our efforts, we were able to present the methodology behind optimizing screw
designs for both single-screw and twin-screw configurations for HPPs, RCPs, and ICPs of
different viscosities, additives, rubber concentrations (ICPs), and crystalline phase ratios (ICPs).
In the first half of our study, we investigated the differences in the feeding, transitioning, and
metering stages of single-screw design and the effects they posed on process parameters and
ultimately the flexural modulus of PP extruded using the different screw designs. We maintain
that by increasing the SME of the screw design, we were able to increase the flexural modulus of
lower viscosity HPPs. For twin screw extrusion, we studied the design of five different screw
configurations, and again by increasing the SME dissipation of the screw design, we were able to
make improvements in the flexural moduli of low viscosity ICPs (90 MFR) and the Izod impact
strength of higher viscosity ICPs (27-50 MFR). We also commented on the effect of rubber
content and β/α ratios on the mechanical properties of ICPs extruded through TSE screw designs
with differing levels of shear. By the end of our investigation, we were able to successfully
recommend and commission two screw designs (Screw 2 for SSE and TEX25-HS3 for TSE) for
future PP research at W.R. Grace and Company.
We have yet to arrive at a definitive conclusion on how PP mechanical properties are
related to screw design for high β/α (greater differences in the viscosities of the rubber and the
PP matrix) (>1.8). Also, a closer look at how each individual screw element geometry affects the
processing capabilities of the overall screw can vastly decrease the research required to
commission the proper screw design for a set of given conditions. In future studies, looking at
the morphology of the ICP matrix in closer detail as to better understand the relationship

70
between the polymer’s mechanical properties and the distribution and dispersion of rubber
particles within the matrix would prove useful.

71
Bibliography
[1] Natta G, Corradini P. Structure and properties of isotactic polypropylene. Il Nuovo Cimento
(1955-1965) 1960;15:40-51.
[2] Vogl O. Polypropylene: An introduction. 1999.
[3] Andrady AL, Neal MA. Applications and societal benefits of plastics. Philosophical
Transactions of the Royal Society B: Biological Sciences 2009;364(1526):1977-84.
[4] Modjarrad K, Ebnesajjad S. Handbook of polymer applications in medicine and medical
devices. Elsevier; 2013.
[5] Maddah HA. Polypropylene as a promising plastic: A review. Am.J.Polym.Sci 2016;6(1):1-
11.
[6] Clayman HM. Polypropylene. Ophthalmology 1981;88(9):959-64.
[7] Crystal structure of syndiotactic polypropylene. Journal of polymer science part C: Polymer
symposia Wiley Online Library; 1967.
[8] Doi Y. Structure and stereochemistry of atactic polypropylenes. statistical model of chain
propagation. Die Makromolekulare Chemie, Rapid Communications 1982;3(9):635-41.
[9] Yamada K, Hikosaka M, Toda A, Yamazaki S, Tagashira K. Equilibrium melting
temperature of isotactic polypropylene with high tacticity. 2. determination by optical
microscopy. Macromolecules 2003;36(13):4802-12.
[10] Juhász P, Varga J, Belina K, Marand H. Determination of the equilibrium melting point of
the β-form of polypropylene. Journal of Thermal Analysis and Calorimetry 2002;69(2):561-74.
[11] Mezghani K, Phillips PJ. The γ-phase of high molecular weight isotactic polypropylene: III.
the equilibrium melting point and the phase diagram. Polymer 1998;39(16):3735-44.

72
[12] Norton DR, Keller A. The spherulitic and lamellar morphology of melt-crystallized
isotactic polypropylene. Polymer 1985;26(5):704-16.
[13] Awaya H. Morphology of different types of isotactic polypropylene spherulites crystallized
from melt. Polymer 1988;29(4):591-6.
[14] Campbell RA, Phillips PJ, Lin JS. The gamma phase of high-molecular-weight
polypropylene: 1. morphological aspects. Polymer 1993;34(23):4809-16.
[15] Zeng A, Zheng Y, Qiu S, Guo Y, Li B. Mechanical properties and crystallization behavior
of polypropylene with cyclodextrin derivative as β-nucleating agent. Colloid Polym Sci
2011;289(10):1157-66.
[16] Varga J. Β-modification of isotactic polypropylene: Preparation, structure, processing,
properties, and application. Journal of Macromolecular Science, Part B 2002;41(4-6):1121-71.
[17] Nagarajan K, Levon K, Myerson A. Nucleating agents in polypropylene. Journal of Thermal
Analysis and Calorimetry 2000;59(1-2):497-508.
[18] Beck HN. Heterogeneous nucleating agents for polypropylene crystallization. J Appl Polym
Sci 1967;11(5):673-85.
[19] Gahleitner M, Grein C, Kheirandish S, Wolfschwenger J. Nucleation of polypropylene
homo-and copolymers. International Polymer Processing 2011;26(1):2-20.
[20] Graeser KA, Patterson JE, Zeitler JA, Rades T. The role of configurational entropy in
amorphous systems. Pharmaceutics 2010;2(2):224-44.
[21] Van der Wal A, Mulder JJ, Oderkerk J, Gaymans RJ. Polypropylene–rubber blends: 1. the
effect of the matrix properties on the impact behaviour. Polymer 1998;39(26):6781-7.
[22] Van der Wal A, Nijhof R, Gaymans RJ. Polypropylene–rubber blends: 2. the effect of the
rubber content on the deformation and impact behaviour. Polymer 1999;40(22):6031-44.

73
[23] Van der Wal A, Gaymans RJ. Polypropylene–rubber blends: 3. the effect of the test speed
on the fracture behaviour. Polymer 1999;40(22):6045-55.
[24] Van der Wal A, Verheul A, Gaymans RJ. Polypropylene–rubber blends: 4. the effect of the
rubber particle size on the fracture behaviour at low and high test speed. Polymer
1999;40(22):6057-65.
[25] Van der Wal A, Gaymans RJ. Polypropylene–rubber blends: 5. deformation mechanism
during fracture. Polymer 1999;40(22):6067-75.
[26] Chung CI. Maximum pressure developed by solid conveying force in screw extruders.
Polymer Engineering & Science 1975;15(1):29-34.
[27] Vlachopoulos J, Strutt D. Polymer processing. Materials Science and Technology
2003;19(9):1161-9.
[28] Martin C. Twin screw extrusion for pharmaceutical processes. In: Melt extrusion. Springer;
2013.
[29] Kao SV, Allison GR. Residence time distribution in a twin screw extruder. Polymer
Engineering & Science 1984;24(9):645-51.
[30] Godavarti S, Karwe MV. Determination of specific mechanical energy distribution on a
twin-screw extruder. J Agric Eng Res 1997;67(4):277-87.
[30] ASTM D1238-13, Standard Test Method for Melt Flow Rates of Thermoplastics by
Extrusion Plastometer, ASTM International, West Conshohocken, PA, 2013, www.astm.org.
[31] Shenoy AV, Saini DR, Nadkarni VM. Melt rheology of polymer blends from melt flow
index. Int J Polym Mater 1984;10(3):213-35.
[32] Colby RH, Fetters LJ, Graessley WW. The melt viscosity-molecular weight relationship for
linear polymers. Macromolecules 1987;20(9):2226-37.

74
[33] Rogošić M, Mencer HJ, Gomzi Z. Polydispersity index and molecular weight distributions
of polymers. European Polymer Journal 1996;32(11):1337-44.
[34] Bernland K, Goossens J, Smith P, Tervoort TA. On clarification of haze in polypropylene.
Journal of Polymer Science Part B: Polymer Physics 2016;54(9):865-74.
[35] ASTM D790-17, Standard Test Methods for Flexural Properties of Unreinforced and
Reinforced Plastics and Electrical Insulating Materials, ASTM International, West
Conshohocken, PA, 2017, www.astm.org.
[36] ASTM D256-10(2018), Standard Test Methods for Determining the Izod Pendulum Impact
Resistance of Plastics, ASTM International, West Conshohocken, PA, 2018, www.astm.org.
[37] Billmeyer Jr FW, Chen Y. On the measurement of haze. Color Research & Application
1985;10(4):219-24.

75
David (Kun Mo) Lee 1 East University Parkway, Baltimore, MD 21218
(201)-220-2449 [email protected]
EDUCATION
Johns Hopkins University Baltimore, MD
Bachelor of Science in Chemical and Biomolecular Engineering May 2018 Cumulative GPA: 3.31
WORK EXPERIENCE
W.R. Grace Specialty Catalysts Columbia, MD Co-Op January 2019 – July 2019
● Commissioned two novel screw designs for polypropylene extrusion (single-screw and twin-screw extruders)
o Performed mechanical properties testing (Izod, flexural modulus, haze) of PP
o Oversaw injection molding of ASTM standard test parts for mechanical testing
o Trained in different analytical techniques (FTIR, SEM, DSC)
o Established design of experiments based off of knowledge of rheology and SSE/TSE screw design
o Recommended process parameters and overall screw designs of extruders for future PP research
Hufnagel Material Science Lab at Johns Hopkins University Baltimore, MD Undergraduate Researcher January 2016 – January 2018
● Assisted PhD candidate in engineering steel compositions with high ballistic resistance and tensile strength
o Analyzed stress-to-strain curves o Applied various multi-stage heat treatment processes to change austenite volume fractions
o Performed quasi-static compression tests on steel samples and studies resulting microstructures o Trained in X-Ray Diffraction and Scanning Electron Microscopy
Becton, Dickinson, and Co. Pre-Analytical Systems Franklin Lakes, NJ
Research and Development Intern September 2013 – June 2014
● Assisted in product testing and data collection processes for various projects o Observed product performance in extreme temperature ranges
● Generated computer models using Solidworks for laboratory fixtures used for product testing ● Helped validate new test procedures for quality and aesthetics control
o New test procedure established pass/fail standards for streaks in product test tubes
Johns Hopkins University Center for Bioengineering Design and Innovation (VectorBrain) Baltimore, MD Research Assistant January 2017 – June 2018
● Imaged species of mosquitos for identification via machine learning program coded on MATLAB
● Maintained database of existing mosquito specimens that were catalogued using unique identifiers
● Debugged existing MATLAB code that stored image data onto a cloud server
HONORS & AWARDS
Dean’s List Fall 2014, Fall 2016, Spring 2017, Fall 2017, Spring 2018
Toshiba/NSTA ExploraVision Contest Honorable Mention 2014 Asian and Pacific Islander American Scholarship Fund/BBCN Bank Scholarship Winner
EXTRA-CURRICULAR ACTIVITIES
Hummingjay Acapella Group Johns Hopkins University Treasurer / Business Manager December 2015 – December 2016
● Organized invoices of club transactions and reports on projected spending costs and balances ● Managed social media networks to communicate organization events and client meetings
LiNK (Liberty in North Korea) Johns Hopkins University Member September 2014 - May 2016
● Participates in fundraisers and volunteer work to raise funds for North Korean refugees
SKILLS
Computer: Autodesk Inventor, AutoCAD, MATLAB, MAPLE, Microsoft Office (Word, Excel, Powerpoint), Solidworks
Foreign Languages: Korean (fluent), Japanese (1 year of study)