Embed Size (px)
Citation preview

Purdue UniversityPurdue e-PubsInternational High Performance BuildingsConference School of Mechanical Engineering
2018
A computational investigation of the effect ofground clearance in vertical ducting systems -ASHRAE RP-1743Romit MaulikOklahoma State University, United States of America, [email protected]
Omer SanOklahoma State University, United States of America, [email protected]
Christian Konrad BachOklahoma State University, United States of America, [email protected]
Follow this and additional works at: https://docs.lib.purdue.edu/ihpbc
This document has been made available through Purdue e-Pubs, a service of the Purdue University Libraries. Please contact [email protected] foradditional information.Complete proceedings may be acquired in print and on CD-ROM directly from the Ray W. Herrick Laboratories at https://engineering.purdue.edu/Herrick/Events/orderlit.html
Maulik, Romit; San, Omer; and Bach, Christian Konrad, "A computational investigation of the effect of ground clearance in verticalducting systems - ASHRAE RP-1743" (2018). International High Performance Buildings Conference. Paper 308.https://docs.lib.purdue.edu/ihpbc/308
3586, Page 1
A computational investigation of the effect of ground clearance in verticalducting systems - ASHRAE RP-1743
Romit Maulik1, Omer San2, Christian Konrad Bach3*
School of Mechanical & Aerospace Engineering, Oklahoma State University, Stillwater, Oklahoma-74078,USA
1Contact Information: Phone - 405-982-0161, E-Mail: [email protected] Information: Phone - 405-744-5900, E-Mail: [email protected] Information: Phone - 405-744-5900, E-Mail: [email protected]
* Corresponding Author
ABSTRACT
The design of vertical ducting systems is a critical component of indoor climate control with the necessity of striking abalance between the dimensions of the duct and optimal ventilation. ASHRAE RP-1743 specifially adresses the lengthand geometry of inlet ductwork for equipment performance tests, and this paper is part of that project. In this study,we assess the effect of vertical clearance for a rectangular duct utilized for a uniform flow rate suction of ambient air.Our goal is ascertain the effect of reducing clearances and their effect on flow velocity profiles within the duct. Ourcomputational framework is given by an unsteady Reynolds-averaged Navier-Stokes (RANS) simulation to simulatea medium intensity turbulence framework. Through this framework, we observe the formation of a stagnation point atthe floor of our simulated room which is perturbed increasingly with reducing heights eventually leading to limit-cycleinstabilities being triggered in the flow through the duct. Our conclusions indicate that the clearance plays an importantrole in optimizing steady flow patterns through the duct.
1. INTRODUCTION
Vertical duct design for large enclosed spaces are vital for providing optimal environmental conditions for the purpose ofthe room. The design and clearance of these ducts are an important factor in controlling room temperatures, ventilation,noise and particulate matter deposition (Sippola and Nazaroff, 2004; Zhang and Li, 2008; Jaeger et al., 2008) and mustbe optimized for flow velocities and pressures. In this manner, efficient environment manipulation and control may beobtained.
The purpose of this study is to establish trends in flow behavior for different vertical duct clearances as a function oftheir hydraulic diameter. To that end, a computational domain is formulated to represent a body of ambient air beingperturbed under the effect of suction through a vertical rectangular duct. We perform a transient Reynolds-averagedNavier-Stokes simulation followed by statistical assessments of flow behavior to help with our observations. Indeed, asshown in Zhang et al. (2007) andWang and Chen (2009), CFD is a powerful tool for informing engineering decisions inclimate control applications. Through the solution of partial differential equations to account for flow phenomena andembedded nonlinearities, accurate reproductions of physical experiments may be obtained. Therefore our first goal isto establish a distributed multiprocessing computational workflow with low turnover time to inform design decisionswith high accuracy. This workflow encompasses strategies starting at solid model generation and proceeding throughdomain discretization, domain distribution and solution over multiple processing nodes and postprocessing throughvisualization and statistical assessments. In general, these assessments are given by probing our solution field (thedetails of which shall be presented below). Our goal is to provide some insight into the flow patterns in the vicinity of(and within) the rectangular duct to aid in improved design of HVAC systems.
To summarize, this study consists of three phases of which the first phase deals with establishing a computationalworkflow for pre-processing, efficient simulation and post-processing of the aforementioned test case. In the secondphase, different geometries representing different vertical clearances are solved for with the final phase being an in-
17th International Refrigeration and Air Conditioning Conference at Purdue, July 9-12, 2018
3586, Page 2
tercomparison of statistical results for a conclusion regarding our objectives. For this purpose our article is dividedinto the following sections: we introduce our computational domain in the section related to geometry, our compu-tational workflow is discussed next and statistical assessments are described in the results section followed by someconclusions in the last section.
2. GEOMETRY
Our geometry is a simplified room filled with air (at density ρ = 1.225 kg/m3). The center of the room has a rectangularduct of aspect ratio 1.2. The length of the duct from the top of the computational domain towards the floor is 0.815 m.The width (i.e. the x dimension) and breadth (the y dimension) of the duct is given by a cross-section of 0.495 m by0.597 m. The room, reflecting a similar aspect ratio has dimensions of 2.476 m x 2.985 m. Elevations of two slices(with normals given by the x and y axes) of the computational domain can be seen in Figure 1. Here we remark thatthe origin of the computational domain is situated at the center of the rectangular duct as it opens to the broader room(as indicated by the position of the axes in the schematics). The duct is assumed to have walls which are 0.04 m and0.05 m thick in the x and y directions respectively. The different thickness are utilized to prevent asymmetric flowdevelopment in the domain (by respecting aspect ratios). The hydraulic diameter (Dh) corresponding to the previouslymentioned dimensions of the rectangular duct is given by 0.54 m. We utilize no-slip wall boundary conditions for thefloor and the duct walls, reflective (i.e. zero-gradient velocity and zero total pressure) boundary conditions for theinlets and uniform flow-rate velocity and zero-gradient pressure boundary conditions for the outlet. Our flow rate isgiven by a time-independent value of 0.137 m3/s in the positive z direction. We note here that the distance from themouth of the duct to the floor (denoted h in the schematic) represents a control parameter for this study. Hence, weintroduce a non-dimensional number given by h/Dh to outline our studies. We also remark that a Reynolds numberof approximately 17,000 is estimated for this geometry and flow condition based on the relevant length scale of thehydraulic diameter.
For assessing the effect of the clearance, we devise 4 test-cases with varying values of h/Dh as shown in Table 1.Solution methodologies and mesh quality (introduced in the next section) are identical for all four cases. We also notehere that when mentioned as is, ‘pressure’ and density-normalized pressure are equivalent.
Table 1: Test cases for proposed investigation. Vertical clearance is reduced by decreasing values of h/Dh.Maximum velocity magnitude and minimum density normalized pressures for each case are also tabulated.
Test Case h/Dh Simulation time (s) Max velocity magnitude (m/s) Min pressure (Pa m 3/ kg)Baseline 1.103 180 0.846 -0.307
Reduced Bottom 1 0.551 120 0.863 -0.329Reduced Bottom 2 0.275 100 0.926 -0.386Reduced Bottom 3 0.138 180 1.142 -0.919
3. COMPUTATIONALWORKFLOW
For the purpose of simulating the desired geometry and flow conditions, we utilize OpenFOAM’s (Jasak et al., 2007)transient incompressible solver (pimpleFoam) with the K-Omega-SST RANS turbulence model (Menter, 1994) withbenchmark turbulence coefficients suggested therein. Our choice of turbulence model is motivated by the strong po-tential curvature of the flow for which K-Omega-SST has been proven to adept at recovering effect statistical trends(Menter, 1993). In essence, the K-Omega-SST model utilizes the original Wilcox K-Omega model which is integrableto the wall and a standard K-Epsilon model away from the walls using a blending function. Accordingly the eddyviscosity formulation is modified to account for the transport effects of the turbulent shear stress. This model giveshighly accurate predictions of the onset and the amount of flow separation under adverse pressure gradients and is thusrecommended for high accuracy boundary layer simulations (Zhang, 2017).
Our choice of turbulence model is utilized in ‘hybrid’ mode with the use of wall-functions for both turbulence kineticenergy (k) and specific dissipation rate (ω) which allow for meshes varying between y+ values between 1 and 30through a switching condition between viscous and log-law regions. This approach has been successful in capturing
17th International Refrigeration and Air Conditioning Conference at Purdue, July 9-12, 2018

3586, Page 3
Figure 1: Schematic representing the computational domain and color-coded boundary conditions (Red -Walls,Black - Inlets - Blue - Outlet). Notice how lengths are selected to preserve the aspect ratio of the inlet duct andthe computational domain and introduce x and y planes of symmetry.
strongly separated flows inmany applications (Cappelli andMansour, 2013). Accordingly, our choice of eddy-viscosityνt is given by freestream calculations away from walls and a continuous wall-function near them. Our wall-functionsin OpenFOAM for the turbulence variables are given by ‘omegaWallFunction’ for ω, ‘kLowReWallFunction’ for k and‘nutUSpaldingWallFunction’ for νt. We remark that all these wall functions are capable of operating in low and highReynolds number modes. However, for additional accuracy, our y+ values near the critical separated zone ensuredthese were utilized in low Reynolds number mode alone. Table 2 shows a collection of boundary conditions for ourpartial differential equations to be solved in this simulation. The reader may refer Figure 1 for the location of theboundary patches. The turbulence relationships utilized to calculate boundary conditions at the outlet of the duct awayfrom the domain are given by (Wilcox et al., 1993)
k =
√3
2(UIl) (1)
ω =
√k
l(2)
where I is the turbulence intensity estimated at 0.02 (i.e., 2% for medium turbulence). U is the mean flow velocityobtained from the flow rate outlet condition and l is the turbulence length scale estimated at 7% of the hydraulicdiameter Dh.
Table 2: Boundary conditions for field variables in our computational framework.
Variable Inlets Outlet WallsVelocity Zero Gradient Flow rate velocity No-slipPressure Total pressure 0.0 Zero gradient Zero-gradient
k 1.0e-10 From turbulence relationships kLowReWallFunctionω 1.0e-10 From turbulence relationships omegaWallFunctionνt Calculated Calculated nutUSpaldingWallFunction
The pimpleFOAM algorithm is based on the merged PISO-SIMPLE algorithm which allows for larger time steps intransient solution of computational domains. We utilize OpenFOAM’s inbuilt distributedmultiprocessing ability (givenby the OpenMPI API) to run our cases on our high performance computing resources. Surface triangulations for ourgeometry are devised using the tool Salome which reads STEP files with CAD information to give us high fidelitySTL files (i.e. files with surface information) for making quality meshes. For the purpose of domain discretization,we utilize OpenFOAM’s native preprocessing utility SnappyHexMesh (SHM) which leads to a hexahedron dominatedmesh with the possibility of specifying viscous layers near walls. We note that hex-dominated meshes are desirable forCFD applications due to wider scale seperation and boundary layer effects. We note that our meshes are all in the region
17th International Refrigeration and Air Conditioning Conference at Purdue, July 9-12, 2018
3586, Page 4
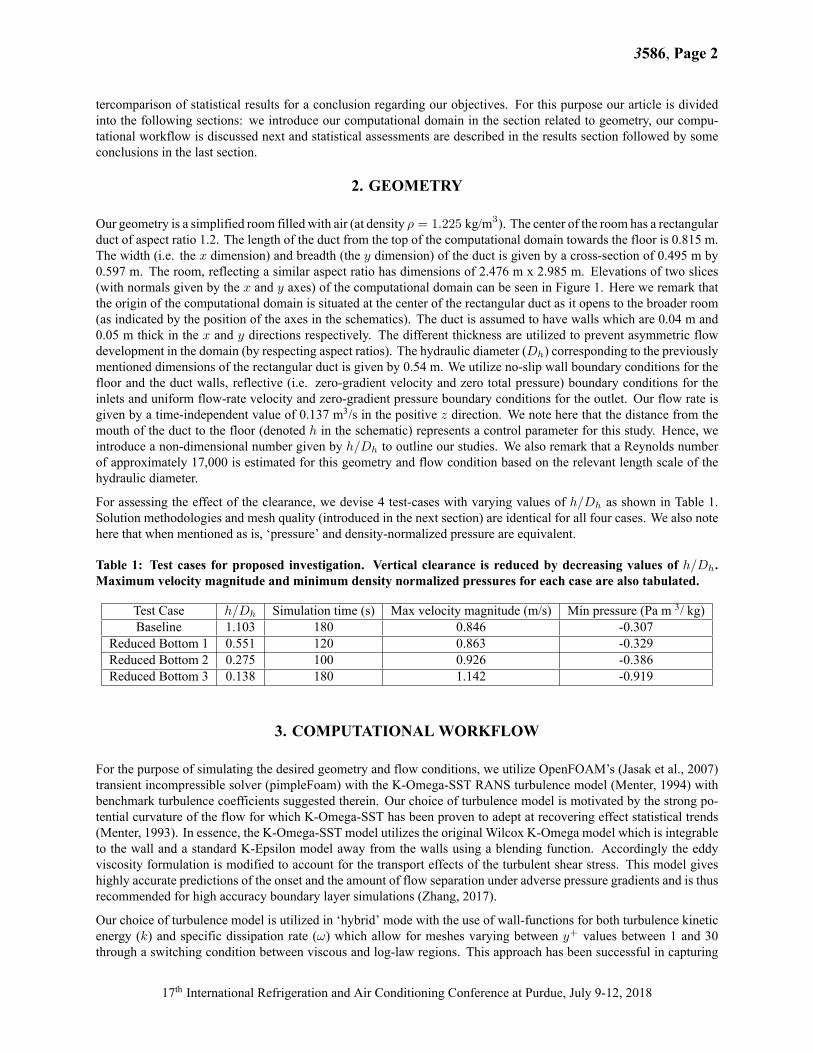
of y+ ≈ 1 near the areas with strong recirculation affects. SHM also allows us the option of designing meshes overmultiple processors which leads to significant reduction in simulation turnover time and is generally recommendedfor avoiding compatibility issues with the OpenFOAM framework. Subfigure (b) of Figure 2 shows a close up of themouth of the vertical duct through a slice along the x axis of symmetry, where one can see the specification of a finemesh with viscous layers near the duct to ensure low y+ values and an accurate capture of recirculation characteristics.We note that the grid is not purely structured and areas specified with lower refinement criteria are automaticallyselected by SHM for tetrahedral meshing. This ensures a good mix of hex, prism and tetrahedral meshes which balancecomputational efficiency and physics accuracy.
(a) Discretized domain (b) Selective mesh refinement
Figure 2: A three-dimensional representation of our domain showing the direction of slicing for reporting results(left) and the result 2D plane (right). We can see a glimpse ofmesh refinement specific to areas of greater physicalinterest. Note that SHM prepares meshes which are hexahedra dominated and allows for the addition of solelyprismatic or hexahedral wall boundary resolving viscous layers.
Our mesh-examination, post-processing and statistical analysis is carried out using Paraview and matplotlib. We utilizethe former to interface with OpenFOAM case directories and extract volume interpolated fields which are then probedfor quantities of interest at the final time. We also note here that our meshing and simulation was carried out bydecomposing our domain over 18 processing nodes with a 3x3x2 block decomposition of the geometry.
4. RESULTS
For assessing the flow patterns of our different test cases, we utilize point and line probes on our computational domain.Our length wise probe, denoted ’z direction probe’, measures the flow velocity magnitude and density normalized totalpressure from the outlet of the computational domain located at (0.0, 0.0, 0.81) in Cartesian space all the way to (0.0,0.0, -h). We also use a horizontal line probe, denoted ’x direction probe’ which measures the flow velocity magnitudesbetween (-0.25, 0.0, 0.0) and (0.25, 0.0, 0.0) in Cartesian space. In addition a point probe for total pressure is utilizedto collected data through computational runtime. This point probe is located at (0.0, 0.0, 0.0) in the computationaldomain and is used to assess steady or limit cycle behavior (as shall be demonstrated below). We note that the four testcases for assessing the effect of vertical clearance were simulated till confirmed steady (or quasi-periodic behavior)and these durations are presented in Table 1. Within the steady scenarios, it can be seen that the flows settled into asteady flow quicker as the value of h was reduced. The Reduced Bottom 2 case was evaluated for a greater durationdue to the permanence of its transience.
Figure 3 shows typical velocity magnitude contours for a slice through the x plane of symmetry for the given compu-tational domain. One can observe low velocities for the air at larger distances from the duct with an eventual increase
17th International Refrigeration and Air Conditioning Conference at Purdue, July 9-12, 2018

3586, Page 5
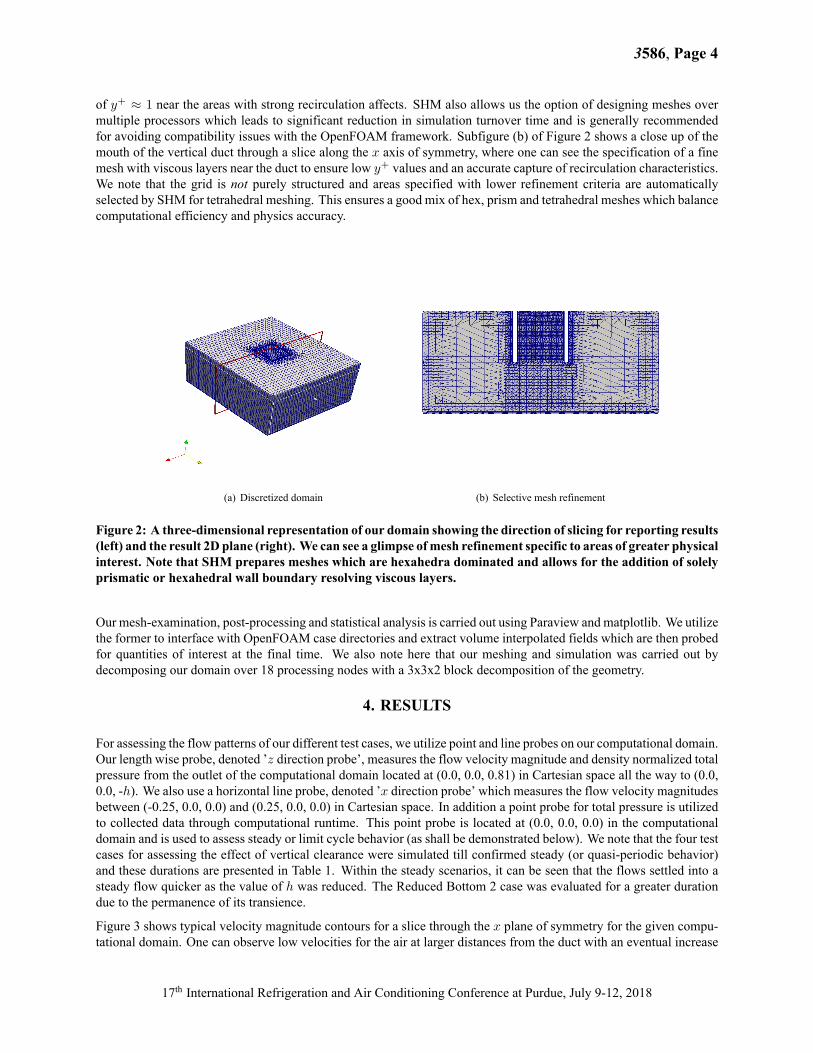
closer to the mouth of the plenum. The strong curvature of the flow leads to a separated behavior at the mouth of theduct with the boundary layer eventually reattaching to the wall downstream of the mouth. The strong curvature of theflow may be demonstrated through the three-dimensional glyphvector plot in the same image where the curved natureof the streamlines is clearly distinguishable. We note that this image corresponds to the ‘Baseline’ configuration of ourdifferent test cases but similar behavior is observed for all our test case geometries. Our contours are also presentedwith mesh information for another glimpse at refinement in critical regions. A close up of the recirculation zone is alsoprovided in Figure 4 where the importance of the viscous layers can clearly be distinguished.
Figure 3: Typical velocity contours for baseline configuration. One can observe high curvature in the flow aswell as the formulation of recirculation zones at the mouth of the duct. Three-dimensional glyph vectors arealso provided for reference.
17th International Refrigeration and Air Conditioning Conference at Purdue, July 9-12, 2018
3586, Page 6
Figure 4: A close up of the separated zone at the mouth of the inlet showing recirculation. The viscous layerhexahedra are instrumental in capturing reversed flow directions.
In the following we display results from probes in our computational domain given by locations as specified in Figure 5.Figure 6 shows the line probe values for the z direction (along the height of the rectangular duct) and in the x directionat the opening of the duct. Here we begin assessments of the effect of h/Dh through our different test cases. Onecan clearly observe well-defined trends for changing our control parameter. Greater pressure drops (both height andlength wise) are obtained with reducing vertical clearance. In the x direction probe one can also observe the velocitymagnitude spikes towards the edge of the channel indicating separation zones. While our Baseline, Reduced Bottom 1and Reduced Bottom 2 cases show no severe oscillations in the velocity profiles, we can observe the Reduced Bottom 3case showing oscillatory behavior. To confirm this observation we plot time-series data for density-normalized pressureusing our point probe at the origin. Results for this time-series data are shown in Figure 7 where one can clearly see thelimit cycle behavior of the pressure values after an initial period of transience. Uniform time-periods are obtained afterapproximately half the time of the simulation has elapsed. Maximummagnitudes of velocity and minimummagnitudesof density-normalized total pressure are provided in Table 1 which also confirm our trends for varying clearances. Onecan thus conclude that for very low values of h/Dh the steady flow patterns expected within the rectangular duct arelost with the eventual onset of quasi-periodic fluctuations in the pressure and velocity profiles. Our preliminary studiessuggest that this may be due to the interactions of the strongly curved flow with a stagnation point in the center of thefloor leading to an oscillating equilibrium. Figure 8 shows the flow vectors and their complicated interaction with thestagnation point.
17th International Refrigeration and Air Conditioning Conference at Purdue, July 9-12, 2018

3586, Page 7
Figure 5: A schematic showing location of probes in our computational study
Figure 8: The complicated nonlinear and unsteady interaction in the vicinity of the inlet between the mean flow,the stagnation point and the separated region for test case - Reduced Bottom 2. We remark that velocity vectorsperpendicular to the wall are those with zero magnitude.
5. CONCLUSIONS
The primary conclusions of this study can be enumerated as follows:
• A computational workflow utilizing Salome, OpenFOAM and Paraview is established for distributed CFD sim-
17th International Refrigeration and Air Conditioning Conference at Purdue, July 9-12, 2018

3586, Page 8
Figure 6: Density normalized pressure (left) and velocity (right) probes in the z direction at the center of theduct (above) and in the x direction at the opening of the duct to the domain.
ulations of vertical rectangular ducts on a supercomputing cluster. Our workflow is distributed for both mesherand solver leading to quick turnover times benefitting engineering decisions.
• Different clearances are simulated using a RANS simulation utilizing the K-Omega-SST model for mediumintensity turbulence. Clearances are categorized according to a non-dimensional number given by the ratio ofthe clearance height to the hydraulic diameter.
• Statistical assessments for velocity and pressure profiles are provided to analyse trends due to decreasing clear-ance. It is observed that velocity magnitudes show increasing trends with reducing clearance and greater totalpressure drops are obtained as well. It is also seen that quasi-periodic oscillations indicating limit cycle behavioremerge as the clearance reduces below a certain threshold. Our hypothesis suggests interaction with a stagnationpoint formed in the center of the floor.
In addition, we also introduce some potential studies which may utilize this work as a foundation. For instance, ourgoal is to evaluate the effect of adding surface baffles to the floor on the velocity profiles and pressures drops in theduct. In addition, efforts are underway to understand the effect of air-sampling trees (situated at the mouth of the duct)on the flow profile as well. Different flow rates are to be studied as well. These would potentially necessitate a revisitof meshing strategies with the requirement of finer discretizations. Therefore, to conclude, this work establishes aunified framework for high fidelity computational studies of medium turbulence intensity flows in vertical rectangular
17th International Refrigeration and Air Conditioning Conference at Purdue, July 9-12, 2018

3586, Page 9
Figure 7: Progress to limit cycle behavior with declining clearance for pressure probe readings. This is a pointprobe at the duct outlet to domain located at (0.0, 0.0, 0.0).
ducts and reveals insights into the effect of ground clearance on flow and pressure profiles.
NOMENCLATUREDh - Hydraulic diameterh - Vertical clearance of rectangular duct from floor (m)I - Turbulence intensityk - Turbulence kinetic energy (m2/s2)l - Turbulence length scale (m)νt - Turbulent eddy viscosity (m2/s)ω - Specific dissipation rate (s-1)ρ - density (kg /m3) U - Mean flow velocity in duct (m/s)y+ - Non-dimensional distance of cell center from nearest wall
REFERENCES
Cappelli, D. and Mansour, N. N. (2013). Performance of Reynolds averaged Navier-Stokes models in predictingseparated flows: study of the hump flow model problem. In 31st AIAA Applied Aerodynamics Conference, page3154.
Jaeger, A., Decker, F., Hartmann, M., Islam, M., Lemke, T., Ocker, J., Schwarz, V., Ullrich, F., Crouse, B., Balasubra-manian, G., et al. (2008). Numerical and experimental investigations of the noise generated by a flap in a simplifiedHVAC duct. In 14th AIAA/CEAS Aeroacoustics Conference (29th AIAA Aeroacoustics Conference), page 2902.
Jasak, H., Jemcov, A., Tukovic, Z., et al. (2007). OpenFOAM: A C++ library for complex physics simulations. InInternational workshop on coupled methods in numerical dynamics, volume 1000, pages 1–20. IUC Dubrovnik,Croatia.
Menter, F. (1993). Zonal two equation kw turbulence models for aerodynamic flows. In 23rd fluid dynamics, plasma-dynamics, and lasers conference, page 2906.
17th International Refrigeration and Air Conditioning Conference at Purdue, July 9-12, 2018
3586, Page 10
Menter, F. R. (1994). Two-equation eddy-viscosity turbulence models for engineering applications. AIAA journal,32(8):1598–1605.
Sippola, M. R. and Nazaroff, W. W. (2004). Experiments measuring particle deposition from fully developed turbulentflow in ventilation ducts. Aerosol Science and technology, 38(9):914–925.
Wang, M. and Chen, Q. (2009). Assessment of various turbulence models for transitional flows in an enclosed envi-ronment (RP-1271). HVAC&R Research, 15(6):1099–1119.
Wilcox, D. C. et al. (1993). Turbulence modeling for CFD, volume 2. DCW industries La Canada, CA.
Zhang, D. (2017). Comparison of Various Turbulence Models for Unsteady Flow around a Finite Circular Cylinder atRe= 20000. In Journal of Physics: Conference Series, volume 910, page 012027. IOP Publishing.
Zhang, J. and Li, A. (2008). Study on particle deposition in vertical square ventilation duct flows by different models.Energy Conversion and Management, 49(5):1008–1018.
Zhang, Z., Zhang, W., Zhai, Z. J., and Chen, Q. Y. (2007). Evaluation of various turbulence models in predicting air-flow and turbulence in enclosed environments by CFD: Part 2—Comparison with experimental data from literature.HVAC & R Research, 13(6):871–886.
ACKNOWLEDGEMENT
Simulations for this investigation were obtained using the services of the High Performance Computing Center (HPCC)at Oklahoma State University.
17th International Refrigeration and Air Conditioning Conference at Purdue, July 9-12, 2018