Embed Size (px)
Citation preview

A Computational Model of
Observer Stress
Nandita Lata Sharma
July 2013
A thesis submitted for the degree of
Doctor of Philosophy
of the Australian National University
Research School of Computer Science
College of Engineering and Computer Science
The Australian National University


To Mum, Dad and my brother
for all your love, understanding and encouragement


The work in this thesis is my own except where otherwise stated.
Nandita Lata Sharma
July 2013


vii
Acknowledgement
I acknowledge the support and contributions of everyone who has made my
research journey a stimulating and a rewarding experience. I am indebted to
my supervisor Professor Tom Gedeon for being a tremendous mentor and
inspiration for me. His unconditional support and encouragement throughout
the research and valuable feedback and comments have been extremely useful.
His style of supervision was stimulating and very effective. I have greatly
enjoyed working with him.
I am thankful for Associate Professor Kristen Pammer and Dr Catherine
Summerhayes for providing their guidance and support as members of the
supervisory panel.
The Research School of Computer Science provided a conducive
environment for my research work. Associate Professor Henry Gardner,
Professor Richard Jones, Dr Duncan Stevenson, Dr Qing Wang, Dr Peter
Christen, Dr Roland Goeke, Ms Lynette Johns-Boast, Dr Peter Strazdins,
Dr Ramesh Sankaranarayana and Dr Shayne Flint had all taken good interest in
my work and provided advice and encouragement. I thank them for their
support and kindness.
Thanks to all my colleagues and friends from the School who have
contributed to making my journey enjoyable and special – a special thanks to
Dingyun Zhu, Leana Copeland, Minkyoung Kim, Soohwan Kim, Sukanya
Manna, Jessica Tsimeris, Dinusha Vatsalan, Abhinav Dhall, Beata Faller,
Narjess Afzaly, Sabrina Caldwell, Alexander Krumpholz, Martin Henschke,
Toktam Ebadi, Paul Thomas, Grace Xu, Luke Nguyen-Hoan, Banda Ramadan,
Elly Liang, Sally Fu, Tan Vo and Ying-Hsang Liu.
I acknowledge the assistance and support from the School’s
administrative and technical staff – thanks to Ms Julie Arnold, Ms Bindi

Acknowledgement
viii
Mamouney, Mr Jadon Radcliffe, Ms Janette Garland, Ms Chelsea Holton,
Ms Shaw Tyi Tan, Mr James Fellows and Ms Diane Wellach-Smith.
Thanks to Ms Mary Dalton and Ms Iris Carter for providing me training
on the use of physiological sensors and methods to conduct physiological data
collection processes. Thanks to Dr Dingyun Zhu who provided me with
training to use the eye and face tracking system. I also thank all the volunteers
who participated in the experiments for me to develop stress data sets for my
thesis work.
I sincerely thank my mother Madhuri, father Dharmendra and brother
Shivendra for their limitless love, invaluable support, encouragement and
understanding in seeing me through the most challenging endeavour in my
life. They have been always there for me to listen to me when I wanted to
bounce off my ideas or share frustration and agony. This is for you folks!

ix
Abstract
Stress is a major growing concern in our age, adversely impacting individuals
and society. Stress research has a wide range of benefits with the potential to
improve health and wellbeing, personal day-to-day activities, increase work
productivity and benefit society as a whole. This makes it an interesting and
socially beneficial area of research. It motivates objective understanding of how
average individuals respond to events they observe in typical environments
they encounter, which this thesis investigates through artificial intelligence
particularly bio-inspired computing and data mining.
This thesis presents a review of the sensors that show symptoms which
have been used to detect stress and computational modelling of stress. It
discusses non-invasive and unobtrusive sensors for measuring computed
stress. The focus is on sensors that do not impede everyday activities which
could be used to monitor stress levels on a regular basis. Several computational
techniques have been developed previously by others to model stress based on
techniques including machine learning techniques but these are quite simplistic
and inadequate. This thesis presents novel enhanced methods for modelling
stress for classification and prediction using real-world stress data sets.
The main aims for this thesis are to propose and define the concept of
observer stress and develop computational models of observer stress for typical
environments. The environments considered in this thesis are abstract virtual
environments (text), virtual environments (films) and real environments (real-
life settings). The research comprised stress data capture for the environments,
multi-sensor signal processing and fusion, and knowledge discovery methods
for the computational models to recognise and predict observer stress.

Abstract
x
Experiments were designed and conducted to acquire real-world
observer stress data sets for the different environments. The data sets contain
physiological and physical sensor signals of observers and survey reports that
validate stress in the environments. The physiological stress signals in the data
sets include electroencephalogram (EEG), electrocardiogram (ECG), galvanic
skin response, blood pressure and the physical signals include eye gaze, pupil
dilation and videos of faces in visible and thermal spectrums.
Observer stress modelling systems were developed using analytics on
the stress data sets. The systems generated stress features from the data and
used these features to develop computational models based on techniques such
as support vector machines and artificial neural networks to capture stress
patterns. Some systems also optimised features using techniques such as
genetic algorithm or correlation based techniques for developing models to
capture better stress patterns for observer stress recognition. Additionally, a
computational stress signal predictor system was developed to model temporal
stress. This system was based on a novel combination of support vector
machine, genetic algorithm and an artificial neural network.
This thesis contributes a significant dimension to computational stress
research. It investigates observer stress, proposes novel computational methods
for stress, models stress with novel stress feature sets, and proposes a model for
a temporal stress measure. The research outcomes provide an objective
understanding on stress levels of observers, and environments based on
observer perceptions. Further research suggested includes investigating models
to manage stress conditions and observer behaviours.

xi
List of Publications
The work in this thesis is the original work of the author except where specific
reference or acknowledgement is made to the work or contribution of others.
Some of the material in this work has appeared in publications and
presentations by the author. Only the contribution made by the author has been
included in this work unless specific reference to the contrary has been made.
The publications produced from the thesis are:
1. Sharma, N. and Gedeon, T. (2013) “Modelling Observer Stress: A
Computational Approach”, Journal of Computer Methods and Programs in
Biomedicine. (in press)
2. Sharma, N. and Gedeon, T. (2013) “Modelling a Stress Signal”, Applied
Soft Computing Journal. (in press)
3. Sharma, N. and Gedeon, T. (2013) “Modelling Observer Stress for
Typical Real Environments”, Expert Systems and Applications: An
International Journal. (in press)
4. Sharma, N., Dhall, A., Gedeon, T. and Goeke, R. (2013) “Thermal Spatio-
Temporal Data for Stress Recognition”, European Association for Signal
and Image Processing (EURASIP) Journal on Image and Video Processing. (in
press)
5. Sharma, N. and Gedeon, T. (2013) “Classification of Physiological Sensor
Signals Using Artificial Neural Networks”, International Conference on
Neural Information Processing (ICONIP 2013), Part II, Lecture Notes in
Computer Science 8227, Springer-Verlag Berlin Heidelberg, pp. 504–511.

List of Publications
xii
6. Sharma, N., Dhall, A., Gedeon, T. and Goeke, R. (2013) “Modelling Stress
Using Thermal Facial Patterns: A Spatio-Temporal Approach”,
International Conference on Affective Computing and Intelligent Interaction
(ACII 2013).
7. Sharma, N. and Gedeon, T. (2013) “Modelling Stress Recognition in
Typical Virtual Environments”, V. Osmani, A. T. Campbell and
P. Lukowicz (Eds.): International Conference on Pervasive Computing
Technologies for Healthcare (PervasiveHealth 2013), IEEE, pp. 441-448.
8. Sharma, N. and Gedeon, T. (2013) “Optimal Time Segments for Stress
Detection”, P. Perner (Ed.): International Conference on Machine Learning
and Data Mining (MLDM 2013), Lecture Notes in Artificial Intelligence
7988, Springer-Verlag Berlin Heidelberg, pp. 421-433.
9. Sharma, N. and Gedeon, T. (2013) “Hybrid Genetic Algorithms for Stress
Recognition in Reading”, L. Vanneschi, W. S. Bush and M. Giacobini
(Eds.): European Conference on Evolutionary Computation, Machine Learning
and Data Mining in Bioinformatics (EvoBIO 2013), Lecture Notes in
Computer Science 7833, Springer Berlin Heidelberg, pp. 117-128.
10. Sharma, N. and Gedeon, T. (2013) “Computational Models of Stress in
Reading Using Physiological and Physical Sensor Data”, J. Pei, V. S.
Tseng, L. Cao, H. Motoda and G. Xu (Eds.): Pacific-Asia Conference in
Knowledge Discovery and Data Mining (PAKDD 2013), Part I, Lecture
Notes in Artificial Intelligence 7818, Springer-Verlag Berlin Heidelberg,
pp. 111-122.
11. Sharma, N. and Gedeon, T. (2012) “Objective measures, sensors and
computational techniques for stress recognition and classification: A
survey,” Journal of Computer Methods and Programs in Biomedicine,
vol. 108, pp. 1287-1301.

List of Publications
xiii
12. Sharma, N. and Gedeon, T. (2012) “Artificial Neural Network
Classification Models for Stress in Reading,” T. Huang, Z. Zeng, C. Li
and C. Leung (Eds): International Conference on Neural Information
Processing (ICONIP 2012), Part IV, Lecture Notes in Computer Science
7666, Springer-Verlag Berlin Heidelberg, pp. 388-395.
13. Sharma, N. and Gedeon, T. (2011), “Stress Classification for Gender Bias
in Reading”, B. L. Lu, L. Zhang and J. Kwok (Eds.): International
Conference on Neural Information Processing (ICONIP 2011), Part III,
Lecture Notes in Computer Science 7064, Springer-Verlag Berlin
Heidelberg, pp. 348–355.

List of Publications
xiv

xv
Contents
Acknowledgement vii
Abstract ix
List of Publications xi
List of Figures xxi
List of Tables xxv
Glossary of Terms xxvii
Chapter 1 Introduction 1
1.1 Motivation ........................................................................................................... 1
1.2 Research Question and Objectives .................................................................. 3
1.3 Thesis Organisation ........................................................................................... 5
Chapter 2 Background 9
2.1 Introduction ........................................................................................................ 9
2.2 Definition of Stress ........................................................................................... 11
2.3 Sources of Stress ............................................................................................... 14
2.4 Measuring Stress .............................................................................................. 16
2.5 Subjective Assessment Stress Measures ....................................................... 19
2.6 Physiological Stress Measures ........................................................................ 21
2.6.1 Skin Conductivity .................................................................................... 22
2.6.2 Heart Activity ........................................................................................... 27
2.6.3 Brain Activity ............................................................................................ 32
2.6.4 Other Primary Physiological Measures ................................................ 42
Contents
xvi
2.7 Physical Measures ............................................................................................ 45
2.7.1 Behaviour, Gesture and Interaction ...................................................... 45
2.7.2 Facial Features .......................................................................................... 46
2.7.3 Voice .......................................................................................................... 49
2.8 Fusion of Measures .......................................................................................... 50
2.9 Evaluation of Primary Stress Measures ........................................................ 51
2.10 Published Stress Data Sets .............................................................................. 52
2.11 Stress Monitoring Systems ............................................................................. 53
2.12 Computational Techniques for Modelling Stress ....................................... 54
2.12.1 Data Preparation ...................................................................................... 54
2.12.2 Feature Extraction Techniques ............................................................... 55
2.12.3 Feature Selection Techniques ................................................................. 55
2.12.4 Artificial Neural Networks ..................................................................... 57
2.12.5 Support Vector Machines ....................................................................... 58
2.12.6 Bayesian Classification ............................................................................ 59
2.12.7 Decision Trees .......................................................................................... 59
2.12.8 Markov Chains and Hidden Markov Models ..................................... 60
2.12.9 Fuzzy Techniques .................................................................................... 61
2.13 Fusion of Computational Techniques ........................................................... 61
2.14 Evaluation of Computational Techniques for Modelling Stress ............... 62
2.15 Summary ........................................................................................................... 63
Chapter 3 Computational Observer Stress 65
3.1 Background: Stress Scales ............................................................................... 65
3.2 Definition of Computational Stress ............................................................... 66
3.3 Definition of Computational Observer Stress ............................................. 66
3.4 A Computational Model of Observer Stress ................................................ 68
3.5 Stress Data ......................................................................................................... 72
3.6 Summary ........................................................................................................... 75

Contents
xvii
Chapter 4 Modelling Computational Observer Stress for Abstract
Virtual Environments 77
4.1 Data Collection ................................................................................................. 77
4.2 Evaluation of the Environments for Observer Stress.................................. 83
4.3 Observer Stress Feature Set ............................................................................ 84
4.4 Stress Models for an Observer ....................................................................... 84
4.4.1 Computational Stress Classifiers ........................................................... 85
4.4.2 Performance of the Classifiers ................................................................ 87
4.5 Individual-Independent Stress Models ........................................................ 89
4.5.1 Feature Selection Methods ...................................................................... 89
4.5.2 Computational Stress Classifiers ........................................................... 93
4.5.3 Performance of the Classifiers ................................................................ 96
4.6 A Stress Model System with Feature and Model Selection ..................... 100
4.6.1 A Hybrid Genetic Algorithm Stress Model ........................................ 100
4.6.2 Performance of the Hybrid Genetic Algorithm Stress Model ......... 106
4.7 Optimal Time Segments for Stress Detection ............................................ 107
4.7.1 Motivation for Optimal Time Segment Selection .............................. 108
4.7.2 A Genetic Algorithm Based System for Feature and Time Segment
Selection ............................................................................................................... 109
4.7.3 Critical Time Segments from the Genetic Algorithm System.......... 111
4.8 Summary ......................................................................................................... 117
Chapter 5 Modelling Computational Observer Stress for Virtual
Environments 119
5.1 Data Collection ............................................................................................... 119
5.1.1 Data Collection Using Contact Sensors .............................................. 120
5.1.2 Data Collection Using Non-Obtrusive Sensors ................................. 123
5.2 Evaluation of the Environments for Observer Stress................................ 125
5.3 Observer Stress Feature Set .......................................................................... 129

Contents
xviii
5.4 Observer Stress Models Using Stress Response Signals Sourced by
Contact Sensors ...................................................................................................... 136
5.4.1 Stress Classification Systems ................................................................ 137
5.4.2 Performance of the Classification Systems ........................................ 137
5.5 Observer Stress Models Using Thermal Facial Patterns .......................... 140
5.5.1 Stress Classification Systems ................................................................ 140
5.5.2 Performance of the Stress Classification Systems ............................. 142
5.6 Summary ......................................................................................................... 145
Chapter 6 Modelling Computational Observer Stress for Real
Environments 147
6.1 Data Collection ............................................................................................... 147
6.1.1 Data Collection for the Interview Environment ................................ 148
6.1.2 Data Collection for the Meditation Environment ............................. 151
6.2 Evaluation of the Environments for Observer Stress ............................... 153
6.3 Observer Stress Feature Set .......................................................................... 153
6.4 Observer Stress Models ................................................................................. 155
6.5 Performance of the Stress Models ............................................................... 156
6.6 Observer Stress Signal Predictor ................................................................. 160
6.6.1 Computational Classification Models to Determine the Trend of the
Stress Signals ...................................................................................................... 161
6.6.2 A Computational Model for Estimating a Stress Signal .................. 161
6.6.3 Performance of the Stress Signal Predictor ........................................ 165
6.7 Summary ......................................................................................................... 169
Chapter 7 Conclusions and Future Work 173
7.1 Conclusions ..................................................................................................... 173
7.2 Future Work ................................................................................................... 176

Contents
xix
Appendix A Experiment Material for Acquiring Observer Stress Data for
Abstract Virtual Environments 181
Appendix B Experiment Material for Acquiring Observer Stress Data for
Virtual Environments 193
Appendix C Experiment Material for Acquiring Observer Stress Data for
Real Environments 199
References 207

Contents
xx

xxi
List of Figures
Figure 1.1: A high-level architecture of the computational observer stress model
................................................................................................................................... 5
Figure 2.1: Common physical and physiological responses used to detect stress
................................................................................................................................. 18
Figure 2.2: Examples of GSR signal acquisition systems ....................................... 23
Figure 2.3: An example of an ECG waveform for one heart beat in one second
with a sampling rate of 256 Hz .......................................................................... 29
Figure 2.4: Biopac system for obtaining ECG signals ............................................. 30
Figure 2.5: The brain lobes .......................................................................................... 34
Figure 2.6: International 10-10 system standard for placement locations for
electrodes on a human’s head to obtain EEG signals ..................................... 35
Figure 2.7: Examples of equipment systems that are used to source EEG signals
................................................................................................................................. 36
Figure 2.8: Examples of blood pressure monitoring systems ................................ 43
Figure 2.9: The FaceLAB system for face, eye and pupil tracking ........................ 47
Figure 2.10: Examples of stress monitoring systems .............................................. 53
Figure 3.1: Architecture of the computational observer stress model .................. 69
Figure 3.2: A visualisation of the stress data for one person ................................. 73
Figure 3.3: A visualisation of the stress data for multiple observers .................... 74
Figure 4.1: The Inquisition room for the reading experiment where experiment
participants did the experiment ......................................................................... 78
Figure 4.2: Process followed by participants during the reading experiment for
data collection ....................................................................................................... 79

List of Figures
xxii
Figure 4.3: The bounding rectangles defined the different regions of the
computer screen to determine a subset of eye gaze features ........................ 81
Figure 4.4: A schematic diagram of the equipment setup for the reading
experiment ............................................................................................................ 82
Figure 4.5: A box plot for the distributions of experiment participant responses
to the survey question on “In terms of stress, how would you rate the
text?” for the different types of text .................................................................. 83
Figure 4.6: Observer stress classification performance values obtained for the
stress classifiers using 10-fold cross-validation ............................................... 88
Figure 4.7: The PISA algorithm to generate a set of pseudo-independent
features for observer stress classification ......................................................... 91
Figure 4.8: An example to illustrate the inputs and corresponding output for the
PI algorithm presented in Figure 4.7 using a simple set of features ............ 92
Figure 4.9: The architecture of a hybrid observer stress classification system
defined by a GA and a classifier which was either an ANN or SVM .......... 95
Figure 4.10: Performances for PISA based observer stress classification for
different degrees of pseudo-independence ...................................................... 99
Figure 4.11: The architecture for the GA hybrid algorithm for observer stress
classification that was used for feature and model selection ...................... 105
Figure 4.12: Distribution for the stress episodes produced by OTSSD searches
.............................................................................................................................. 115
Figure 4.13: Average eye fixation coordinates of experiment participants
reading a text excerpt over different time intervals of the total reading time
.............................................................................................................................. 116
Figure 5.1: A schematic diagram of the equipment setup for the film experiment
.............................................................................................................................. 122

List of Figures
xxiii
Figure 5.2: Setup for the film experiment to collect facial video data in thermal
and visible spectrums, and EEG, GSR, eye gaze and pupil dilation signals
............................................................................................................................... 124
Figure 5.3: Box plots for distributions of experiment participant responses to the
survey questions for the different types of films ........................................... 127
Figure 5.4: Examples of facial regions extracted from VS and TS videos .......... 130
Figure 5.5: Examples of facial volumes extracted from the ANUStressDB
database ............................................................................................................... 131
Figure 5.6: The facial region in Figure 5.5(a) segmented into 3 × 3 blocks ........ 132
Figure 5.7: The HDTP algorithm captures dynamic thermal patterns in
histograms from thermal image sequences .................................................... 135
Figure 5.8: Performance measures for SVM and GA-SVM stress classification
systems ................................................................................................................. 144
Figure 6.1: Setup for the Interview environment .................................................. 150
Figure 6.2: Setup for the Meditation environment ................................................ 152
Figure 6.3: A thermal face volume of an observer ................................................ 155
Figure 6.4: Forms of the stress signal ...................................................................... 163
Figure 6.5: Average mean square error of the outputs produced by the stress
signal predictors in relation to their corresponding curve forms presented
in Figure 6.4 ......................................................................................................... 167
Figure 6.6: Outputs of the ANN based stress signal predictors for an observer of
the meditation environment ............................................................................. 169
Figure 6.7: Architecture of the stress signal predictor system ............................. 171


xxv
List of Tables
Table 2.1: Analysis of GSR measurement systems .................................................. 24
Table 2.2: Components of an ECG waveform .......................................................... 29
Table 2.3: Analysis of heart activity measurement systems .................................. 31
Table 2.4: Definitions for letters and numbers in EEG electrode names .............. 34
Table 2.5: Analysis of brain activity measurement systems .................................. 37
Table 2.6: EEG frequency band categories ............................................................... 39
Table 2.7: Empirical ranking of primary stress measures ...................................... 52
Table 2.8: Rankings of computational techniques used for modelling stress ..... 63
Table 4.1: Implementation settings for the genetic algorithm component in
observer stress modelling systems .................................................................... 87
Table 4.2: Performance measures for observer stress models produced by the
different individual-independent computational models using 10-fold
cross-validation .................................................................................................... 96
Table 4.3: Relative execution times for the different classification techniques ... 97
Table 4.4: Performance for observer stress classification models of abstract
virtual environments using 10-fold cross-validation .................................... 106
Table 4.5: Execution times for the stress classification methods ......................... 107
Table 4.6: Summary of the results obtained for different types of chromosomes
used to find stress episodes in the reading data set ...................................... 112
Table 5.1: Results from the Wilcoxon statistical test on experiment survey
responses for stressed and non-stressed types of films ................................ 128
Table 5.2: Performance measures for observer stress models for virtual
environments defined from primary stress signals using 10-fold cross
validation ............................................................................................................. 138

List of Tables
xxvi
Table 5.3: Performance measures for stress classification models defined from
EEG signals of observers of virtual environments using 10-fold cross
validation ............................................................................................................ 139
Table 6.1: Performance measures for observer stress computational models for
real environments using 10-fold cross validation ......................................... 156
Table 6.2: Performance measures for stress computational models for
classifying real environments using observer stress response signals based
on 10-fold cross validation ............................................................................... 157
Table 6.3: Performance measures for stress computational models using 10-fold
cross validation for observers of the interview environment ..................... 158
Table 6.4: Performance measures for stress computational models using 10-fold
cross validation for observers of the meditation environment ................... 159
Table 6.5: Performance measures for stress computational models for observers
of real environments using 10-fold cross validation using EEG band power
features as input ................................................................................................. 160
Table 6.6: Performance measures for the stress computational classification
models using 10-fold cross validation for observers of the meditation
environment ........................................................................................................ 165

xxvii
Glossary of Terms
ANN artificial neural network
ANS autonomic nervous system
AVE abstract virtual environment
BN Bayesian network
BVP blood volume pulse
computed stress stress computationally derived from instantaneous
measures of stress symptoms obtained by non-invasive
methods
ECG electrocardiogram
EDA electrodermal activity
EEG electroencephalogram
EMG electromyogram
FFT fast fourier transform
fMRI functional magnetic resonance imaging
FT fourier transform
GA genetic algorithm
GSR galvanic skin response
HDTP histograms dynamic thermal patterns
HMM hidden markov model

Glossary of Terms
xxviii
HRV heart rate variability
ICA independent component analysis
MSE mean squared error
observer stress stress of an observer who sees an environment that has
a stressor stimulated by actors in the environment and
their stress does not influence the environment
OTSSD optimal time segments for stress detection
PCA principal component analysis
PD pupil dilation
PISA pseudo-independent feature selection algorithm
PNS parasympathetic nervous system
primary stress signal physiological or physical response signal sourced using
a sensor for stress symptoms analysis
RE real environment
SNS sympathetic nervous system
stressor a source of stress
TS thermal spectrum
SVM support vector machine
VE virtual environment
VS visible spectrum

1
Chapter 1 Introduction
This chapter provides an introduction to the thesis. It presents the motivation
for the proposed research on computational observer stress and identifies the
main research questions and objectives. A schematic diagram is presented to
describe the characteristics and components of a computational model for stress
modelling. The chapter also summarises the organisation of the thesis.
1.1 Motivation
There are ongoing significant changes in technology and its uptake in society
particularly to improve the health and wellbeing of people. A technical
challenge confronting researchers and technology developers is to meet the
escalating demands for approaches to monitor wellbeing to address everyday
unavoidable life pressures and challenges. Stress is a leading threat to people
because the demands imposed by modern lifestyles on people cannot be
satisfactorily controlled. This is a major risk to health and social aspects of life.
In general, stress is a “complex reaction pattern that often has psychological,
cognitive and behavioural components” [1]. It can be used to describe the
physiological and health wear and tear of the body experiencing changing
environments having three main facets – input stimulus, processing and
evaluation, and response [2].
The medical literature indicates that stress, when sufficiently powerful
so that it overcomes defence mechanisms, has a range of severe impacts on
immune and cardiovascular systems on individuals. As stress becomes chronic,
it makes individuals more vulnerable to infections and incurable diseases, and
slows down the body’s immune and recovery processes [3]. Individuals are
continuously exposed to viruses and infectious diseases, which their immune

Chapter 1: Introduction
2
system defeats but will have lower or no capability to do so when the
individual is under stress [4]. In the developed world, stress is becoming the
main cause of cardiovascular diseases and depression [5].
In addition, stress is a major cause of financial burden on society [6].
Statistics in 2005 show that above 75% of visits to medical practitioners in the
United States of America were due to stress-related symptoms [7, 8]. Stress
costs Australian Taxpayers at least $300,000 every day according to a report in
2009 [6]. Several government and non-government organisations (e.g.
International Stress Management Association UK [9], SupportLine [10] and
Lifeline Australia [11]) are established to help individuals deal with stress and
to create awareness of the issues associated with stress, a major problem faced
by the world today.
Stress research has a wide range of potential applications and benefits
including the capacity to improve personal, government and industry
operations. This research has the potential to increase the robustness of military
operations, law enforcements, athlete performance [12], games and education
software, life support systems, learning and increase work productivity [13].
Computer systems using non-invasive techniques that dynamically provide
assessment of stress using human stress response signals have been exploited
to determine stress in fighter pilots [14], but these systems are obtrusive and do
not suit flight operations and behaviour. Some less intrusive systems have been
developed to detect stress in a range of people including car drivers [15-17],
computer users [18], army officers [19, 20], pilots in flight [20, 21], surgeons
[22], and surgical patients [23]. However, the data analysis methods and
models are quite simplistic and have not been shown to scale across different
day-to-day environments.
There is a growing research interest to analyse stress objectively. The
stress research community acknowledges that stress is “too well known and too
little understood at the same time” [2]. The major current focus in stress
research is to determine objective ways to detect stress with minimal obtrusion.

1.2 Research Question and Objectives
3
The variables associated with stress and their modelling come from various
disciplines including signal sourcing, signal processing, data knowledge
discovery, computer science, physiology, and bio-physical analysis making it
multidisciplinary by nature. A range of relevant techniques from various fields
including computer science (e.g. machine learning, data mining), mathematics,
statistics, and hybrid methods have been applied to stress research, which will
be discussed in Chapter 2 of this thesis. These provide a rich hybrid
environment for investigation in the proposed research.
1.2 Research Question and Objectives
Study of stress detection, modelling and management is an important need to
address the major concerns stress poses to the world today and in the future.
This motivates an objective understanding of how average people respond to
events they observe in environments they encounter, which is captured in the
main question for the research of this thesis:
Can observer stress be modelled computationally?
The aim for this thesis is to develop a computational model of stress based on
objective human responses collected from human observers of environments.
The model will be used to recognise and predict stress of a person during an
environment they encounter. The environments will range from abstract virtual
environments (text) through virtual environments (film) to real environments
with real human interactions. Various non-invasive and less or non-obtrusive
sensors and computational techniques will be used to develop computational
models for observers of the environments. The sensors will be used to source
human response signals showing stress symptoms, which this thesis will refer
to as primary stress signals. The signals will include physiological and physical
signals and will be recorded for observers while they see an environment
during data collection. The physiological signals will be captured by electrodes

Chapter 1: Introduction
4
placed on the human body that are non-invasive (i.e. electrodes that do not
penetrate the body by incision) and less or non-obtrusive (i.e. electrodes that
minimise obstructing natural movement) and the physical signals will be
captured by camera and vision-based sensors. Signal processing, feature
extraction, feature selection and modelling methods will be proposed and
developed to discover stress patterns to recognise and predict observer stress.
A high level architecture of the computational model of observer stress
envisaged is presented in Figure 1.1. The computational model of observer
stress will be a contribution to Human Centred Computing in the
understanding of stress behaviour.
The main objectives towards answering the research question include:
1. Review literature and discuss how stress has been defined and
modelled;
2. Define an objective stress measure;
3. Define observer stress;
4. Collect real-world observer stress data: design and conduct experiments
and record primary stress signals for observers of abstract virtual
environments, virtual environments and real environments;
5. Develop computational models for observer stress for abstract virtual
environments, virtual environments and real environments; and
6. Propose future research from the work presented in this thesis.

1.3 Thesis Organisation
5
Primary Measures
Physical Signals
Physiological Signals
Human Assessment
Computational Stress Model
Stress Evaluator
Environments
Abstract Virtual Environments
Virtual Environments
Real Environments
Refine Measures
Observer
Figure 1.1: A high-level architecture of the computational observer stress model
1.3 Thesis Organisation
The thesis comprises 7 chapters and 3 appendices. Chapter 1 provided an
overview of the research in this thesis, Chapter 2 presents the context of the
research, Chapter 3 proposes definitions of computational observer stress and
proposes an architecture of a computational model of observer stress, Chapters
4-6 present computational observer stress models for different types of typical
environments, and the final chapter summarises the outcomes and
contributions. The appendices present research material for experiments
Chapter 1: Introduction
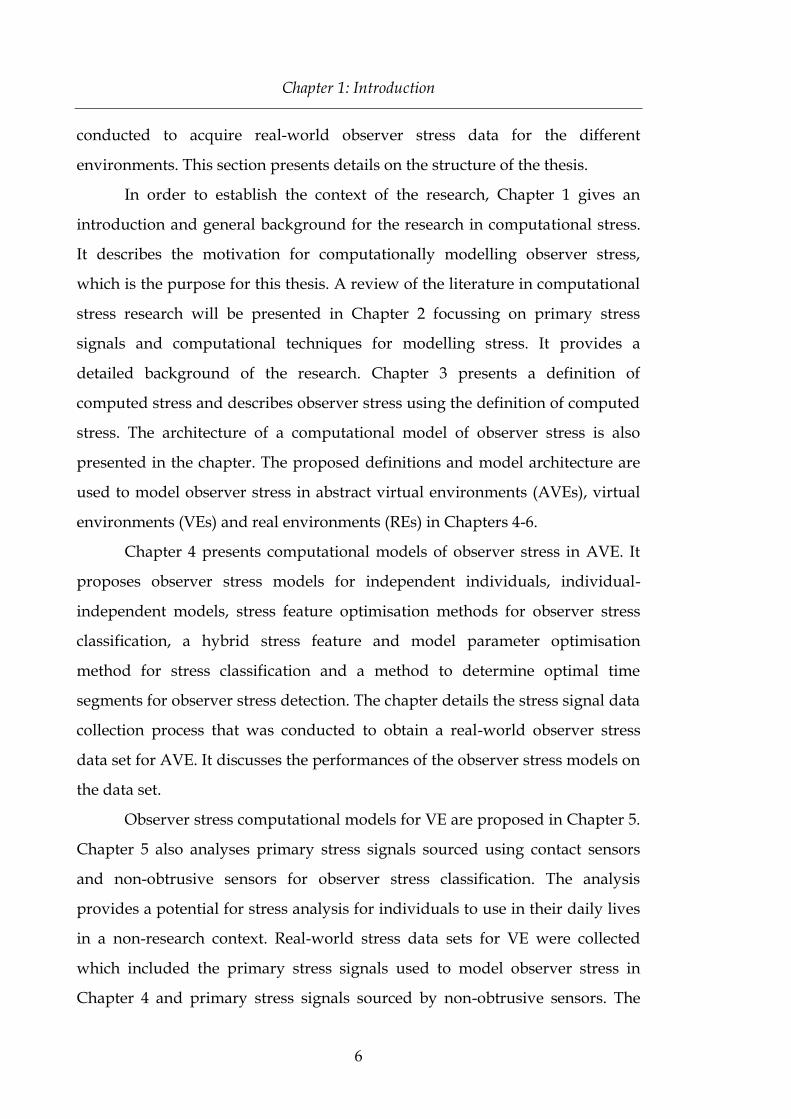
6
conducted to acquire real-world observer stress data for the different
environments. This section presents details on the structure of the thesis.
In order to establish the context of the research, Chapter 1 gives an
introduction and general background for the research in computational stress.
It describes the motivation for computationally modelling observer stress,
which is the purpose for this thesis. A review of the literature in computational
stress research will be presented in Chapter 2 focussing on primary stress
signals and computational techniques for modelling stress. It provides a
detailed background of the research. Chapter 3 presents a definition of
computed stress and describes observer stress using the definition of computed
stress. The architecture of a computational model of observer stress is also
presented in the chapter. The proposed definitions and model architecture are
used to model observer stress in abstract virtual environments (AVEs), virtual
environments (VEs) and real environments (REs) in Chapters 4-6.
Chapter 4 presents computational models of observer stress in AVE. It
proposes observer stress models for independent individuals, individual-
independent models, stress feature optimisation methods for observer stress
classification, a hybrid stress feature and model parameter optimisation
method for stress classification and a method to determine optimal time
segments for observer stress detection. The chapter details the stress signal data
collection process that was conducted to obtain a real-world observer stress
data set for AVE. It discusses the performances of the observer stress models on
the data set.
Observer stress computational models for VE are proposed in Chapter 5.
Chapter 5 also analyses primary stress signals sourced using contact sensors
and non-obtrusive sensors for observer stress classification. The analysis
provides a potential for stress analysis for individuals to use in their daily lives
in a non-research context. Real-world stress data sets for VE were collected
which included the primary stress signals used to model observer stress in
Chapter 4 and primary stress signals sourced by non-obtrusive sensors. The

1.3 Thesis Organisation
7
chapter presents the process taken to collect the stress data. The chapter also
proposes video imaging techniques of faces and presents novel stress features
based on videos of faces of observers in the thermal spectrum for observer
stress modelling and analysis.
Chapter 6 proposes computational models of observer stress in RE. The
architectures for the models were adapted from Chapter 5 based on their
performance on stress data for stress classification. The chapter also proposes a
computational stress signal predictor system to estimate a stress signal for
observer stress. The models were tested on real-world observer stress data sets
for RE. The primary stress signals in the data sets collected were based on their
performance in stress classification in Chapter 5, the level of obtrusiveness of
the stress sensors and the potential for the sensors to be ubiquitous. The process
for the data acquisition is described in the chapter.
The thesis concludes with Chapter 7 summarising the major
contributions made in this research for computational stress research and
identifying questions emerging from this work for future research. Appendices
A-C provide material used in the research experiments that were conducted to
collect real-world data sets for observer stress for AVE, VE and RE.

Chapter 1: Introduction
8

9
Chapter 2 Background
This chapter* presents a literature survey and provides a background for the
work in this thesis. It discusses the definition of stress used in the literature,
sources of stress, human response signals to detect stress and computational
methods developed in the literature to objectively model stress. Subjective
assessment measures (e.g. survey reports), physiological measures (e.g. skin
conductivity, heart activity and brain activity) and physical measures (e.g.
behaviour, facial expressions and eye gaze) have been used to detect stress
which this chapter details and evaluates. These measures are referred to as
primary stress measures in this thesis. An evaluation of the objective measures is
given. This chapter also discusses stress monitoring systems available to
consumers, which are based on the primary stress measures. Further,
computational techniques that have been used to develop models of stress for
stress detection are discussed and evaluated.
2.1 Introduction
Traditional stress management and treatment techniques [25] that outline
general practices to implement have been utilised to facilitate coping and
dealing with stress to reduce the risk of negative effects on individuals, but
these practices are too general. Computer systems that dynamically provide
indications of stress have been exploited to determine stress in fighter pilots
[14], but were obtrusive and do not suit usual operations and behaviour.
However, less intrusive systems have been developed to detect stress in car
drivers [17].
* Portions of this chapter have been published in [24].
Chapter 2: Background
10
Various response (or symptom) measures have been used to interpret
stress. The response measures reflect reactions of individuals and their body to
stressful situations. Some individuals may react differently to stressful events
from others due to their body conditions, age, gender, experience and so on.
There are techniques, such as artificial neural networks, that can deal with these
variables [26]. Additionally, uncertainties and complexities also exist that need
to be dealt with when defining stress. Techniques, such as fuzzy logic, can
narrow the gap.
Hormonal imbalances and physiological and physical changes are some
characteristics associated with stress i.e. they are symptoms of stress. When a
person is under stress, increased amounts of stress hormones (e.g. cortisol or
catecholamine levels) are released and measures for these hormones are
obtained via invasive methods (e.g. taking blood, saliva or urine samples),
possibly performed by qualified practitioners, and require lengthy analysis
procedures conducted by qualified scientists ([27-30]). Also under stress,
changes in heart rate (HR) [31], blood pressure (BP) [32], pupil dilation (PD)
[33], breathing pattern [34], galvanic skin response (GSR) [35], emotion [36],
voice intonation [37] and body pose [38] are observed, which, unlike measuring
stress hormones, can be acquired through non-invasive means. This thesis
concentrates on non-invasive and automated methods requiring shorter time
periods for detecting and analysing stress. Physiological (e.g. heart rate, skin
conductivity) and physical (e.g. facial expressions, voice intonation, body poses,
and gestures) features enable such methods and can be used to model stress
objectively.
The current focus of stress research is to determine ways to detect stress
and is in the early stages of computational modelling. A range of techniques
from various fields, including computer science (e.g. bio-inspired, machine
learning, data mining), engineering and statistics, have been applied to stress
problems. This chapter will investigate sensors for primary measures
(physiological and physical measures) of stress and computational techniques

2.2 Definition of Stress
11
used for signal analysis, feature extraction, stress detection and recognition, and
computational models used in the literature over the recent years.
In this chapter, a measure of stress refers to a primary (or symptom)
measure (or signal) for stress, monitoring stress means examining fluctuations in
primary measures for stress, and indication or detection of stress refers to certain
fluctuations in primary measures for stress that show an increase in stress
towards distress. These terms will be used in the chapter to describe work done
in the literature.
2.2 Definition of Stress
The term, stress, as applied to biology was coined by Hans Selye in the 1930s.
Selye defined stress as “the non-specific response of the body to any demand
for change”. In general, stress is a “complex reaction pattern that often has
psychological, cognitive and behavioural components” [1]. It can essentially be
used to describe the wear and tear of the body that experiences changing
environments, thus giving three main facets – input stimulus, evaluation and
response [2]. Stress has been studied in a range of fields with different
backgrounds and focus. It has been described differently in different fields with
diverse meanings, but the definition of stress is still elusive, even within a
single field, like psychology [39]. In medical terms, stress is defined as the
body’s psychological and physical (including behavioural) reaction or response
to the imbalance between demands and the resources available for a person. It
is known as a natural alarm, resistance and exhaustion [40] system for the body
to prepare for a fight or flight response to protect the body from threats and
make the body adjust to changes. The different phases of stress, response,
resistance and exhaustion, are defined in Selye’s famous definition of the
General Adaptation Syndrome [41].
When an individual is under a stressful situation, hormonal and nerve
signals are sent by the hypothalamus gland to the adrenal glands. Then

Chapter 2: Background
12
hormones including stress hormones, such as cortisol and adrenaline, are
released for the body to provoke action. Stress affects various areas of the body,
with physiological changes, such as heart rate, blood pressure, pupil dilation,
breathing patterns [34], and galvanic skin response. Glucose levels are rapidly
elevated in the bloodstream, and energy supplies are mobilised and directed to
critical regions of the body. Stress can be good, but it can also be dangerous
depending of the intensity, duration and frequency.
There are two forms of stress, which have been defined by Selye [42].
Good stress, eustress, results in a more favourable and positive state whereas
bad stress, distress, leads to an eventual negative biased (emotional, mental or
physical) state. Some indicators of eustress have been defined to be pleasurable
psychological states, positive emotions (e.g. joy, happiness, and excitement),
hope and meaningfulness [43-45]. In this thesis, stress will be referred to
negative stress in the dimension towards distress, tension, fear and anger.
Stress can provide benefits [46] in various ways, including taking forms
of motivation or encouragement to complete tasks. On the other hand, stress
has been known to decrease concentration and attention levels [47, 48], impair
capabilities in learning and decision making [49], and reduce performance [50].
Long-term or chronic stress can lead to illnesses affecting the brain [51], immune
[52], cardiovascular [53] and gastrointestinal systems [2], and has been found to
have links to diseases, such as, depression [54], cancer [55] and sleeping [34]
problems. In addition, stress has been reported to promote cancer growth and
reduce the effectiveness of cancer treatments in animal models [56]. Without
stress, individuals run the risk of boredom and with too much stress they are in
threat of damaging their well-being. Therefore, it is important to strike the right
balance of stress to maximise the benefits. This thesis aims to develop a
computational method to objectively understand stress.
Usually, people can subconsciously determine whether an environment
is stressful well. The challenge in this thesis is to develop objective methods for
assessing stress and develop a model computationally based on people’s

2.2 Definition of Stress
13
physiology, affect, cognition and behaviour. As a consequence, the model could
be used to interpret the stress of the environment based on objective reactions
of people, thus giving a stress model of an environment based on people’s
perceptions of the environment.
Short-term or acute stress is a common type of stress and has been a
common area of study. During the initial phase of stress, cortisol is secreted the
most [57]. In high doses or in cases of slow recovery [58], acute stress can be as
harmful as chronic stress. Through the study of hormone production
behaviour, an individual may form an adaptation mechanism for being
exposed to a stressor for an extended period [57], but the body shows more
distinctive signs of stress to novel stressors [59] or in the case of increased
perceived impact [60]. Health and psychological problems can be better
predicted by acute stress [25], thus there is vast amount of literature
surrounding these types of stress [61-66]. Moreover, acute stress can be
recognised by most people because the symptoms are new to the body.
Observers are good predictors of stress as well. A scenario is when a person
stands up in front of an audience to talk. Members of the audience can deduce
that the presenter is stressed by analysing physical characteristics, such as,
voice and gestures.
Some symptoms of stress, generally obvious to individuals, include
anxiety, anger, agitation, annoyance, fear, frustration, preoccupation [67],
tension and depression [68, 69]. Stress can be measured by measuring these
symptoms or emotions. Emotions have been defined by valence and arousal
dimensions. The valence and arousal dimensions are continuous scales ranging
from negative to positive. Valence depicts pleasantness, whereas the arousal
dimension shows excitement. Physiological and physical measures and human
reports can be used to determine valence and arousal thus emotions that show
stress.
Hormonal imbalances, physiological and physical changes are some
characteristics that show symptoms of stress thus giving an objective definition

Chapter 2: Background
14
for stress. Stress hormones can be obtained to measure stress but such measures
are obtained invasively. This thesis will concentrate on non-invasive methods
for obtaining stress characteristics, which can be acquired from physiological
and physical signals. Physiological features, such as, increase in heart rate and
higher skin conductivity, are related to stress. Some examples of physical
features that are affected by stress are changes facial expressions, voice
intonation and gestures. Changes in these physical features can mount to
change in behaviour and from which stress could be recognised as well. In this
thesis, physiological and physical characteristics are used to model stress levels
of an individual influenced by their environment.
There is a wide range of individuals considered in stress research. The
groups of people whose stress has been monitored using non-invasive
techniques include computer users [18], army officers [19, 20], car drivers [15-
17], pilots in flight [20, 21], surgeons conducting an operation [22], and surgical
patients [23]. Agitation in dementia patients have been automatically
recognised as well [70, 71]. Stress on drivers has been found to have the same
devastating effects on driving as talking on a mobile phone or having eyes off
the road [47]. The research in this thesis could potentially benefit these people.
2.3 Sources of Stress
Stress is caused by an unpleasant intervention in the form of real events or
perceived impact, namely a stressor. High cognitive load, extreme temperatures,
demanding physical activities, and predicting and waiting, or witnessing a
present or past horrific experience, are some forms of ways to increase stress
levels. Meditation [72], hypnosis [8], listening to relaxing music [73] and
reading [27] are known to reduce stress. In some cases, activities affect stress
levels more than others for instance, classical or self-selected relaxing music
reduces stress levels significantly compared to silence or listening to rock music
[35]. In terms of the symptoms of stress, meditation has been found to have a

2.3 Sources of Stress
15
greater impact on GSR than listening to music [74]. Drinking black tea [58]
reduces stress by reducing levels of cortisol. In a physiological sense, the
activities reduce cortisol levels, and increase HRV.
However the effects are quite the opposite when an individual is
exposed to stressors. Common stressors tend to contribute to cognitive load.
Stressors that have been used in stress experiments to stimulate stress or
emotions that induce stress include video (action) games [75, 76], solving
difficult mathematical/logical problems [77], energetic music (including rock
[75]), movies or film clips [75, 78], public speaking [79], and preparing and
delivering verbal responses to threats and accusations [58]. Other forms of
stressors include the Paced Stroop Test [80, 81] (a clinical mental stress test that
uses an interactive software application for individuals to identify font colours
of words within a given time period where the words spell out colours) and the
Cold Pressor Test [30, 82] (requires immersing a person’s body in icy cold
water).
There are mixed classifications for exercise as a stressor [27, 83-86].
Exercise has physiological characteristics of a stressor, but it improves mood,
fitness and health (provided that it is not excessive) [77], which is quite the
opposite to other stressors. However, exercise is generally considered to be a
stressor [87, 88].
Stressors can be characterised as physical, biological, cognitive,
emotional and psychosocial. In this thesis we do not make distinctions between
the different types of stressors and thus, stress.
Symptoms of stress tend to appear a brief period of time after a stressor is
observed [17]. The expected physiological effect of a stressor takes may take up
to several seconds or minutes to recover. The recovery time is dependent on the
type of stressor and physiology of individuals. Research suggests that
physically active individuals respond to stress with lower variations in stress
hormones and lower physiological responses compared to individuals who do

Chapter 2: Background
16
not exercise regularly [79]. As a result, exercise makes an individual more
resistant to stress.
2.4 Measuring Stress
Traditionally, stress has been measured using assessment based on humans
rating stress levels on some scale (e.g. Relative Stress Scale [89], Fear Survey
Schedule [90], Cook-Medley Hostility Scale [91], and Brief Symptom Inventory
[67, 92]), which are subjective. All these assessments require major human
intervention, including manually recognising and interpreting visual patterns
(possibly with some support tools) of behaviour in observational studies. Stress
experiments that use various sensors to obtain objective measures of stress also
use subjective assessment to verify measurements obtained from sensors [17].
Lack of data and insufficient capability of existing modelling techniques force
the activity of measuring stress to include these subjective conventional
methods. It is regarded that self-assessment is a good measure of stress [89, 91],
and this motivates this research that more work needs to be done to bring
objective methods for measuring stress up to par (if not, even better).
Techniques that measure stress hormones, e.g. salivary cortisol levels
[27-29], urinary catecholamine levels [30], and blood glucose levels can be used
to determine stress levels but require invasive methods. In addition, an increase
in cortisol levels is “positively correlated with negative perceptions” [77].
However, in some stressful situations cortisol levels are significantly low, which
can result from other processes in the human body e.g. enhanced short-term
memory [93]. As a consequence, cortisol measurements cannot be solely used to
determine stress.
The primary measures for stress investigated in this thesis are
physiological and physical measures. A physical feature or characteristic is
defined as a property in which humans can see changes without the need for
equipment and tools, unlike physiological features, which require the use of

2.4 Measuring Stress
17
tools that need to be attached to individuals to detect general fluctuations.
However, sophisticated equipment and sensors using vision and audio
technologies are still needed to obtain physical signals at sampling rates
sufficient for data analysis and modelling.
Common techniques for detecting stress include analysing physiological
signals, electroencephalography (EEG), blood volume pulse (BVP), heart rate
variability (HRV), galvanic skin response (GSR), and electromyography (EMG).
In addition, physical signals for measuring stress include eye gaze, pupil
dilation, voice characteristic, and face movement. Figure 2.1 shows the physical
and physiological signals that will be investigated and in this research.
Some high level properties for primary measures that indicate stress are:
1. Increase in galvanic skin response over a period of time
(1)
2. Increase in heart rate variability over a period of time (which is the rate
of change of heart beat)
(2)
3. Increase in pupil dilation over a period of time
(3)
4. Decrease in skin temperature over a period of time
(4)
5. Decrease in blood volume pulse over a period of time

Chapter 2: Background
18
(5)
Figure 2.1: Common physical and physiological responses used to detect stress.
The figure shows the usual sources for the responses. The responses in this
figure are investigated in this survey. The person figure is adapted from [94].
Gesture,
Interaction &
Behaviour Hand & Finger
Movements
Facial
Movement
Physiological Measure
Physical Measure
Legend
BVP
HRV
GSR
Eye Gaze Voice
EEG Pupil
Dilation
EMG
BP

2.5 Subjective Assessment Stress Measures
19
2.5 Subjective Assessment Stress Measures
A common approach for stress measurement is subjective self assessment
because it is widely accepted that individuals are generally good assessors of
their personal stress levels. It is the result of the fact that individuals are
different and have different experiences, personalities and have developed
somewhat different stress resistance and coping mechanisms. Logically, this
would suggest that individuals can assess and manage their stress solely, but it
is not always true. There is evidence showing that underlying assessment,
resistance and coping mechanisms may not be that different after all. Stress
management and treatment techniques have been developed and there are
organisations established with the goal to help individuals coping with stress.
Research has moved in the direction to measure stress objectively and results of
initial research suggests that it has the potential to be used solely without the
need for human intervention in stress assessment [95].
Subjective based measures for stress have been used widely [96].
Assessments based self-reports and observational studies, induced by tasks e.g.
driving tasks [17], interview and/or questionnaires [97-99], are a common type
of measure for stress [17, 35], especially in the field of Psychology. There is a
range of stress (or stress-related) assessment scales, including the Relative
Stress Scale [89], Fear Survey Schedule [90], Cook-Medley Hostility Scale [91],
and Brief Symptom Inventory [67, 92]. All these assessments require major
human intervention, including manually recognising and interpreting visual
patterns (possibly with some support tools) of behaviour in observational
studies. Solely, stress inventories measure baseline stress, but our focus is to
measure instantaneous stress that accounts for baseline stress and stress caused
by the environments observed by individuals. Then this can be used to
determine stress patterns across multiple individuals.
Stress experiments that use various sensors to obtain objective measures
of stress also use questionnaires to verify measurements obtained from sensors

Chapter 2: Background
20
[17], which is due to the lack of data and techniques developed for stress
research from which models and classification techniques can be compared. It is
regarded that self assessment is a good measure of stress [89, 91], which could
be due to the lack of objective measures. Another reason for such a claim is the
vagueness in the definition of stress.
Subjective measures may not be reliable methods for measuring stress
especially when used in isolation because of the encouragement of cognitive
mediation [76]. The context in which a particular type of subjective assessment
is done could influence the assessment as reported in a study done to assess
media quality [100]. In addition, these measures have been used to measure
stress in simple or familiar environments e.g. listening to music of different
genres [35]. The method of subjective assessment also raises problems for
measuring stress in complex and changing environments e.g. individuals find it
challenging to determine stress levels in unfamiliar environments [95]. Recent
research in stress has been investigating objective measures for stress. In a
research project that investigated the effectiveness of music in dealing with
stress, physiological measures along with self-assessment reports were used to
determine stress [35]. Physiological signals have been shown to be highly
correlated with subjective assessment [76]. Our research aims to develop an
objective metric for stress.
Provided that the raw rating, mean and standard deviation are , and
respectively, numerical ratings in stress questionnaires have been normalised
using equation (6) and then back transformation used to obtain the average and
standard deviation statistics to determine statistical significance.
(6)
Methods and tools required for subjective assessment as stress measures
are less expensive compared to those that require high-sophisticated sensors,
computational power and memory and similar technologies. The problems
2.6 Physiological Stress Measures
21
with self assessment include under or over-estimating stress levels. In order to
minimise these deviations, questions and the structure of assessment in self
assessments must be carefully designed [101, 102].
2.6 Physiological Stress Measures
The Autonomic Nervous System (ANS), responsible for involuntary activities,
is made up of Sympathetic and Parasympathetic nervous systems. Stressful
events or emergency situations cause dynamic changes in ANS, where the
activity rate in the Sympathetic Nervous System (SNS) increases and the
Parasympathetic Nervous System (PNS) activity decreases. Alternatively,
activities in the PNS dominate during resting activities. SNS and PNS regulate
the galvanic skin response, heart rate variability, and brain waves, which are
the main measures for stress used in the literature, and other physiological
systems including blood pressure. Details of how stress affects the ANS at
molecular and cellular levels are provided in [103]. Note that stress towards
distress is not a sole contributor to changes in the ANS and the features it
controls, for instance, eustress (which characterises as a positive state e.g. joy)
can elevate skin conductance like distress [104].
Symptoms of stress appear as time progresses and this makes continuous
recordings of physiological signals significant to monitor variations and trends
to detect stress reliably. In order to deal with voluminous data associated with
such recordings, measurements from physiological sensors are usually divided
into segments before features are obtained. In a driving experiment [17],
segments were made up of 5 minute data out of 30 minutes, which included
rest, city and highway driving representing low, medium and high stress
respectively. Main statistical features obtained from physiological data have
included normalised mean, root mean square, mean amplitude, variance, and
normalised signals. Using feature values over time segments does not only
provide data from different perspectives but also helps reduce the effect of

Chapter 2: Background
22
noisy or missing data during analysis as opposed to analysing raw signal
values.
2.6.1 Skin Conductivity
Galvanic skin response (GSR), also known as skin conductance or electrodermal
activity response, is reliable indicator of stress [17, 35, 105, 106]. It is a
measurement of flow of electricity through the skin of an individual. When the
individual is under stress, skin conductance is increased [107] due to increase in
moisture on the surface of the skin, which increases the flow of electricity.
Conversely, the skin conductance is reduced when the individual becomes less
stressed. Physiological details of the way the SNS affects skin conductance can
be found in [108].
The fluctuations in skin conductance are recorded as changes in GSR.
Variations in GSR have reflected stress levels in individuals while they played a
competitive racing game [73]. In addition, cognitive load [109] and work
performance [76], which can be seen as stressors [110, 111], have strong
correlations with GSR.
GSR measurement can be taken by measuring electrical potentials
between electrodes placed on surfaces of the skin. Electrodes are typically
placed on the hand, first and middle fingers. Some popular equipment used in
stress related research experiments to monitor GSR include the Biopac
GSR100C [73], Thought Technology Limited GSR2 [81], Affectiva Q Sensor
[112], BodyMedia Sensewear [78], and BodyBugg [113]. A couple of these
systems are shown in Figure 2.2. An analysis of the characteristics of the
equipment systems is given in Table 2.1.

2.6 Physiological Stress Measures
23
(a)
(b)
Figure 2.2: Examples of GSR signal acquisition systems: (a) Biopac GSR100C (b)
BodyBugg

Chapter 2: Background
24
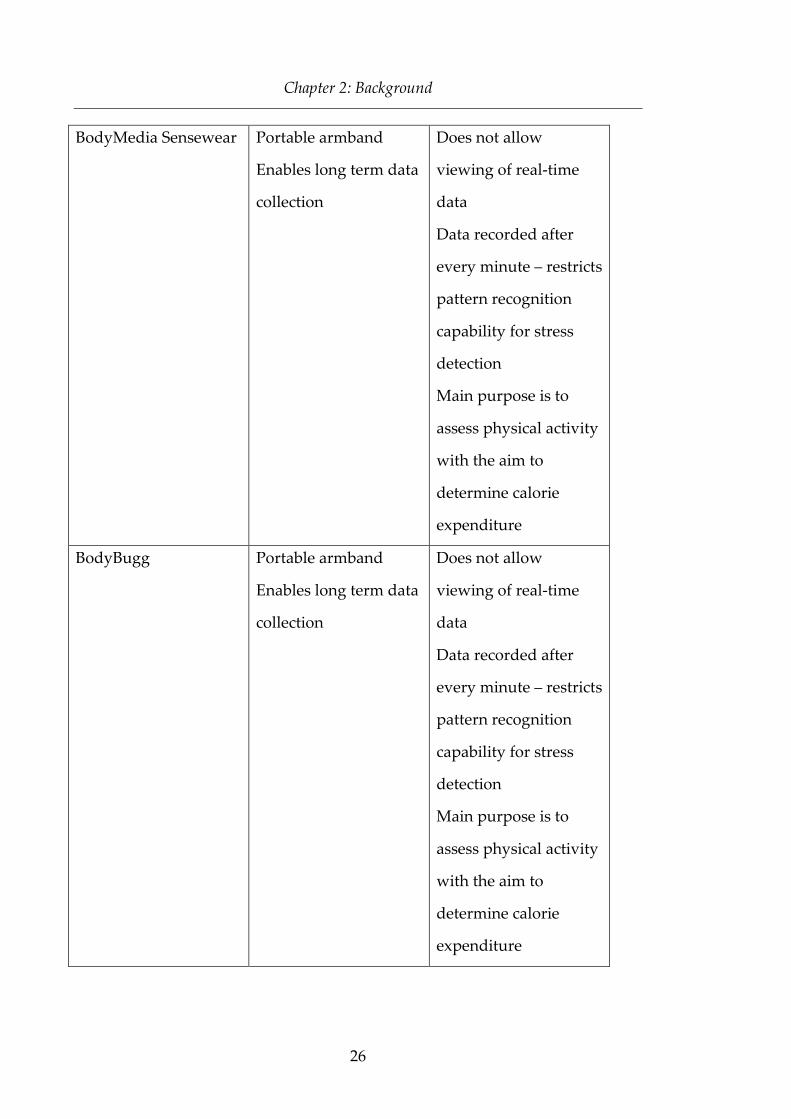
Table 2.1: Analysis of GSR measurement systems
GSR Measurement
System
Advantages Disadvantages
Biopac GSR100C
(connected to a
computer with
AcqKnowledge
software suite)
Data transferred to a
computer in real-time
Allows real-time
viewing and analysis
of data and trends
Raw data is available
Sampling rate of 1kHz
Equipment not
portable
Sensitive to equipment
movement
Electrodes are attached
to fingers using
conductive gel
Expensive
Thought Technology
FlexComp (connected
to a computer with
Biograph software
suite)
Data transferred to a
computer in real-time
Allows real-time
viewing and analysis
of data
Waveforms accurate to
500 Hz
2000 samples/second
Equipment not
portable
Expensive

2.6 Physiological Stress Measures
25
Thought Technology
GSR2
Frequency range from
0-40,000 Hz
Does not allow
viewing of real-time
data
Fingers have to be
stably placed on
electrode plates for
data acquisition
Requires RelaxTrace
software to upload and
view data on the
computer
Affectiva Q Sensor Sampling rate of 2-32
readings per minute
Portable armband
Enables long term data
collection
Enables real-time data
viewing and collection
Theoretical
characteristics have
been reviewed by
researchers
Relatively new – lacks
usage reviews
Expensive
Chapter 2: Background
26
BodyMedia Sensewear Portable armband
Enables long term data
collection
Does not allow
viewing of real-time
data
Data recorded after
every minute – restricts
pattern recognition
capability for stress
detection
Main purpose is to
assess physical activity
with the aim to
determine calorie
expenditure
BodyBugg Portable armband
Enables long term data
collection
Does not allow
viewing of real-time
data
Data recorded after
every minute – restricts
pattern recognition
capability for stress
detection
Main purpose is to
assess physical activity
with the aim to
determine calorie
expenditure
2.6 Physiological Stress Measures
27
GSR features that require minimal calculations (e.g. mean and sum) have
been used to compare stress in different tasks [109]. More complex features
such as, the number of orienting responses in a time segment, sum of the startle
magnitudes, sum of the response durations, and sum of the estimated areas
under the responses have also been used [114]. However, it is not known
whether these complex measures gave better indications of stress than minimal
calculations.
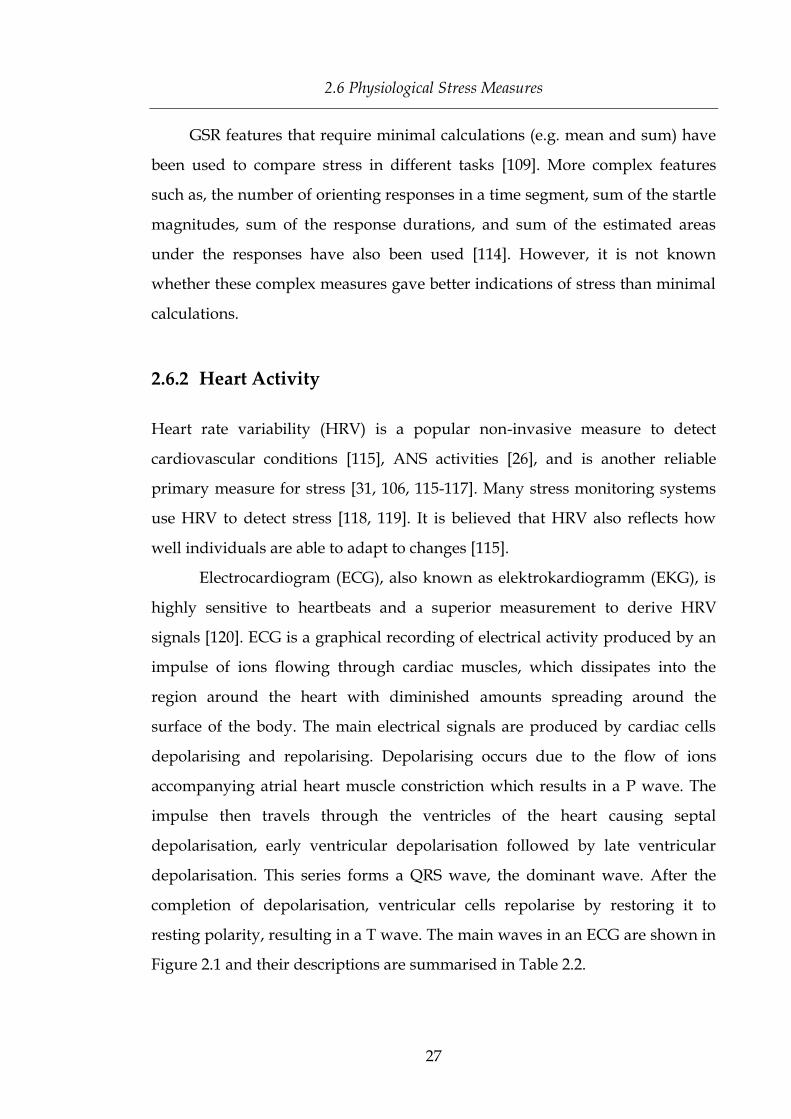
2.6.2 Heart Activity
Heart rate variability (HRV) is a popular non-invasive measure to detect
cardiovascular conditions [115], ANS activities [26], and is another reliable
primary measure for stress [31, 106, 115-117]. Many stress monitoring systems
use HRV to detect stress [118, 119]. It is believed that HRV also reflects how
well individuals are able to adapt to changes [115].
Electrocardiogram (ECG), also known as elektrokardiogramm (EKG), is
highly sensitive to heartbeats and a superior measurement to derive HRV
signals [120]. ECG is a graphical recording of electrical activity produced by an
impulse of ions flowing through cardiac muscles, which dissipates into the
region around the heart with diminished amounts spreading around the
surface of the body. The main electrical signals are produced by cardiac cells
depolarising and repolarising. Depolarising occurs due to the flow of ions
accompanying atrial heart muscle constriction which results in a P wave. The
impulse then travels through the ventricles of the heart causing septal
depolarisation, early ventricular depolarisation followed by late ventricular
depolarisation. This series forms a QRS wave, the dominant wave. After the
completion of depolarisation, ventricular cells repolarise by restoring it to
resting polarity, resulting in a T wave. The main waves in an ECG are shown in
Figure 2.1 and their descriptions are summarised in Table 2.2.

Chapter 2: Background
28
A change in potential can be measured between electrodes attached to a
person’s body on each side of the heart during the electrical stimulation cycle of
the heart. ECG signals are periodic and have persistent features such as R-R
intervals, a parameter to determine HRV. The Einthoven’s Triangle, theoretical
triangle area around the heart representing lead vectors, can be used for lead
configuration based on desired information. There are three main lead
configurations, but Lead I is sufficient to obtain a HRV signal because it gives
the complete QRS waveform [121].
Popular systems used to obtain continuous heart rate include the
Thought Technology FlexComp and Biopac ECG100C (shown in Figure 2.4)
[73]. An analysis of these systems is presented in Table 2.3.
Acute stress causes the heart to contract with high force and increased
frequency. With more chronic stress, the mass of the heart is increased to
provide the body with greater response to stressors [122]. A decrease in ECG
amplitude is an indicator of stress in healthy individuals [123]. This is due to
vasoconstriction, where peripheral blood vessels constrict. Details of how the
SNS affects heart activity when an individual is exposed to stressors are
presented in [124].
Heart activity has been found to be more correlated with stress as
opposed to EMG and respiration recordings [17]. However, the baseline heart
rate depends on cardiovascular fitness of an individual and the activity the
individual is doing at the time. This means that heart activity measurements
cannot be directly compared across multiple people for stress unless
measurements are standardised using some baseline measurements.
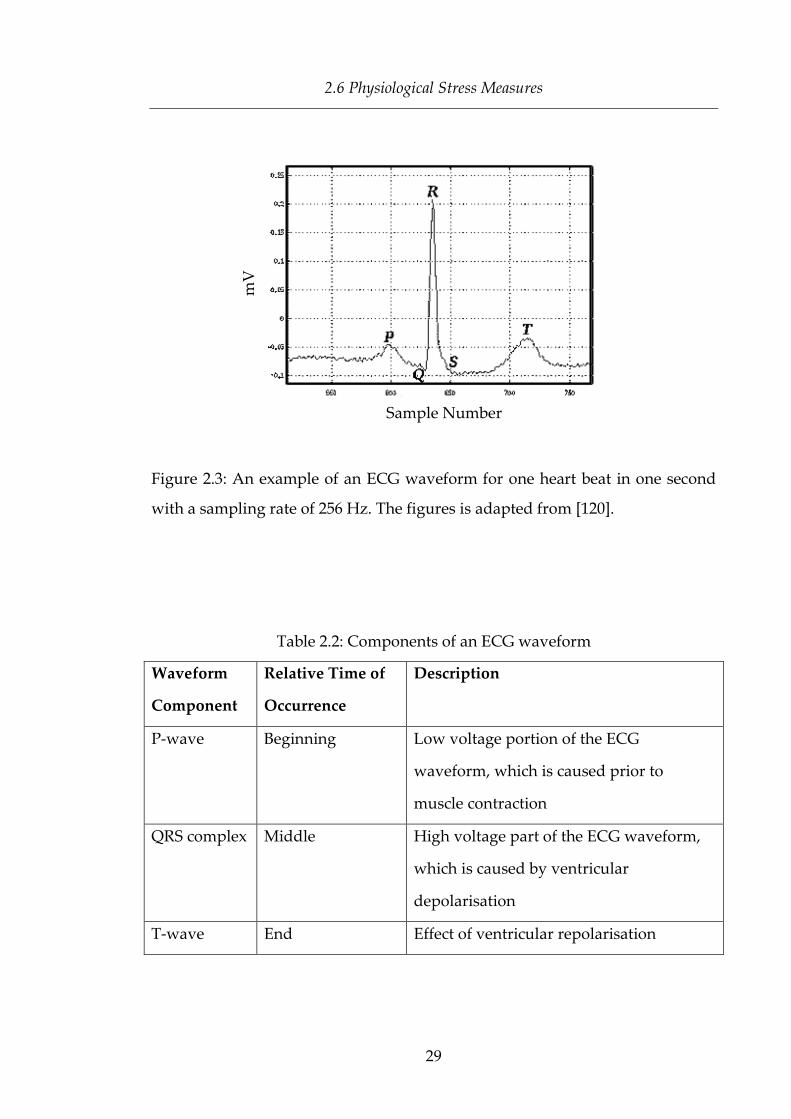
2.6 Physiological Stress Measures
29
Figure 2.3: An example of an ECG waveform for one heart beat in one second
with a sampling rate of 256 Hz. The figures is adapted from [120].
Table 2.2: Components of an ECG waveform
Waveform
Component
Relative Time of
Occurrence
Description
P-wave Beginning Low voltage portion of the ECG
waveform, which is caused prior to
muscle contraction
QRS complex Middle High voltage part of the ECG waveform,
which is caused by ventricular
depolarisation
T-wave End Effect of ventricular repolarisation
Sample Number
mV

Chapter 2: Background
30
Figure 2.4: Biopac system for obtaining ECG signals

2.6 Physiological Stress Measures
31
Table 2.3: Analysis of heart activity measurement systems
Heart Rate
Measurement System
Advantages Disadvantages
Thought Technology
FlexComp (connected
to a computer with
Biograph software
suite)
Data transferred to a
computer in real-time
Allows real-time
viewing and analysis
of data and trends
Waveforms accurate to
500 Hz
2000 samples/second
Equipment not
portable
Expensive
Biopac ECG100C
(connected to a
computer with
AcqKnowledge
software suite)
Data transferred to a
computer in real-time
Allows real-time
viewing and analysis
of data and trends
Sampling rate of 1kHz
Equipment not
portable
Sensitive to equipment
movement
Electrodes are attached
to skin using
conductive gel
Expensive
HRV is an indicator of dynamic and cumulative load, making it a good
measure for stress. Short term lower HRV reflects acute stress, which means
that HRV can be negatively affected during stress [125]. Generally, low
frequency (LF) and high frequency (HF) bands of HRV are used to analyse
stress. LF and HF are known to reflect SNS and PNS activities respectively. LF
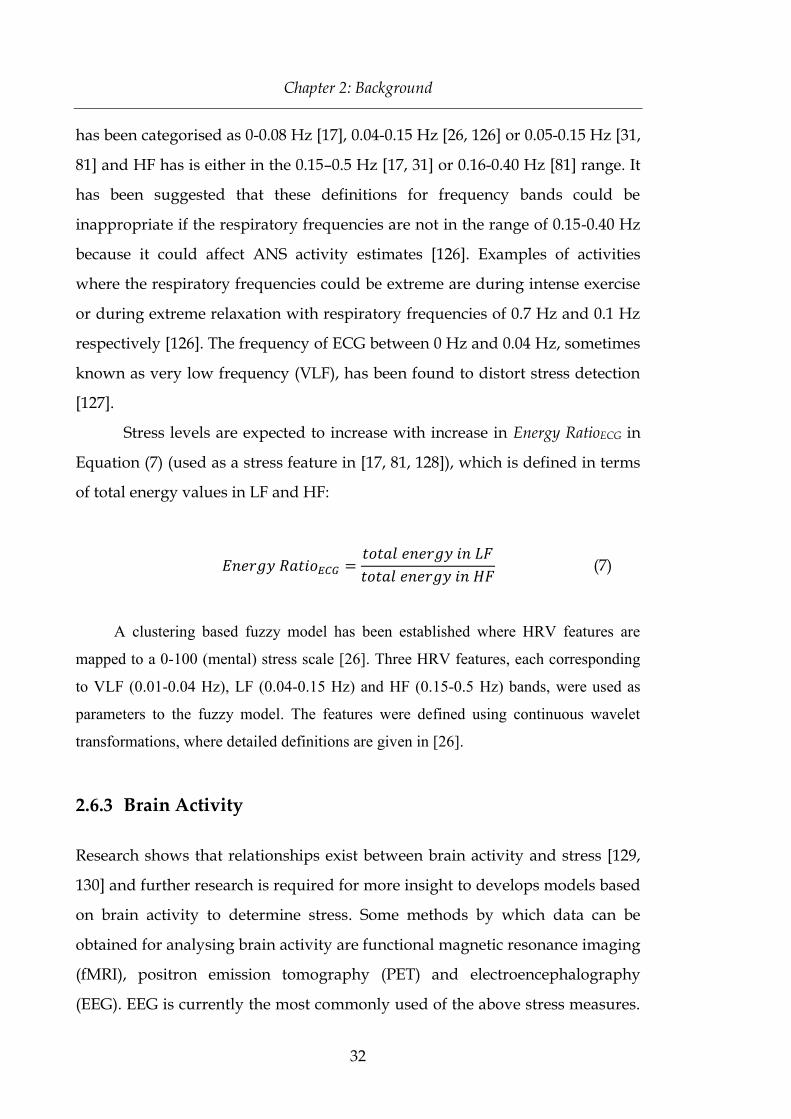
Chapter 2: Background
32
has been categorised as 0-0.08 Hz [17], 0.04-0.15 Hz [26, 126] or 0.05-0.15 Hz [31,
81] and HF has is either in the 0.15–0.5 Hz [17, 31] or 0.16-0.40 Hz [81] range. It
has been suggested that these definitions for frequency bands could be
inappropriate if the respiratory frequencies are not in the range of 0.15-0.40 Hz
because it could affect ANS activity estimates [126]. Examples of activities
where the respiratory frequencies could be extreme are during intense exercise
or during extreme relaxation with respiratory frequencies of 0.7 Hz and 0.1 Hz
respectively [126]. The frequency of ECG between 0 Hz and 0.04 Hz, sometimes
known as very low frequency (VLF), has been found to distort stress detection
[127].
Stress levels are expected to increase with increase in Energy RatioECG in
Equation (7) (used as a stress feature in [17, 81, 128]), which is defined in terms
of total energy values in LF and HF:
(7)
A clustering based fuzzy model has been established where HRV features are
mapped to a 0-100 (mental) stress scale [26]. Three HRV features, each corresponding
to VLF (0.01-0.04 Hz), LF (0.04-0.15 Hz) and HF (0.15-0.5 Hz) bands, were used as
parameters to the fuzzy model. The features were defined using continuous wavelet
transformations, where detailed definitions are given in [26].
2.6.3 Brain Activity
Research shows that relationships exist between brain activity and stress [129,
130] and further research is required for more insight to develops models based
on brain activity to determine stress. Some methods by which data can be
obtained for analysing brain activity are functional magnetic resonance imaging
(fMRI), positron emission tomography (PET) and electroencephalography
(EEG). EEG is currently the most commonly used of the above stress measures.

2.6 Physiological Stress Measures
33
This is due to its high temporal resolution, low intrusive equipment and low
cost. EEG has been used to determine stress levels in computer game players
[129] and biofeedback games [130].
Neural activity in the brain produces electrical signals, including well
known signals that are captured in EEG. EEG records complex electrical
waveforms at the scalp formed by action electrical potentials during synaptic
excitations and inhibitions of dendrites. Potentials at the scalp range from 20 to
100 V [131], which can be recorded by pairs of electrodes attached to the scalp
on opposite sides of the brain hemisphere. The diagram in Figure 2.6 shows the
placement locations for EEG electrodes according to the International 10-10
system standard. In this configuration, distances between adjacent electrodes
are 10% of the total front-back or right-left of the skull. The International 10-20
system standard is a variation of the International 10-10 system standard in that
it does not require as many electrodes. The International 10-20 system standard
has distances between adjacent electrodes that are 10% or 20% of the total front-
back or right-left of the skull.
EEG electrodes are identified by their names, which include information
on their placement location on the head. The name of an electrode consists of a
letter and a number, which correspond to the brain lobe and the location on the
hemisphere respectively. The brain lobes are shown in Figure 2.5. Letters and
numbers in the electrode names and their respective lobes and positions on the
brain hemisphere are presented in Table 2.4.
The EEG waveforms are characterised by frequency, amplitude, shape
and sites of the scalp. Also, age and state of alertness is also relevant to analyse
the waveforms [131]. Activities in the right hemisphere of the brain dominate
the activities in the left hemisphere of the brain during negative emotions [132],
which suggests an area for stress detection. Details of the way stress affects the
brain are provided in [133].

Chapter 2: Background
34
Figure 2.5: The brain lobes
Table 2.4: Definitions for letters and numbers in EEG electrode names
EEG Electrode Letter or
Number Brain Location Area
F Frontal lobe
T Temporal lobe
C Central lobe
P Parietal lobe
O Occipital lobe
z stands for zero and refers to mid-line position
odd numbers (1, 3, 5, 7, 9) positions on the left hemisphere
even numbers (2, 4, 6, 8, 10) positions on the right hemisphere
Temporal Lobe
Occipital Lobe
Parietal Lobe Frontal Lobe

2.6 Physiological Stress Measures
35
Figure 2.6: International 10-10 system standard for placement locations for
electrodes on a human’s head to obtain EEG signals. The highlighted electrodes
correspond to the electrodes of the Emotiv EPOC headset which follows the
International 10-20 system standard. The figure is adapted from [134].
Examples of systems used to source EEG are BioSemi and FlexComp
systems. These equipments require a relatively higher degree of intrusion
because the subject has to wear a head cap with electrical conductivity gel and
electrodes that need to be attached to particular positions of the subject’s head.
The level of intrusion can stir potential subjects away from research
experiments that use such equipment. In addition, preparing the equipment
and the subjects for EEG data acquisition can take a relatively long time.
Alternatively, EEG can be sourced using less intrusive equipments, such as the
Emotiv EPOC headset. The highlighted electrode positions in Figure 2.6
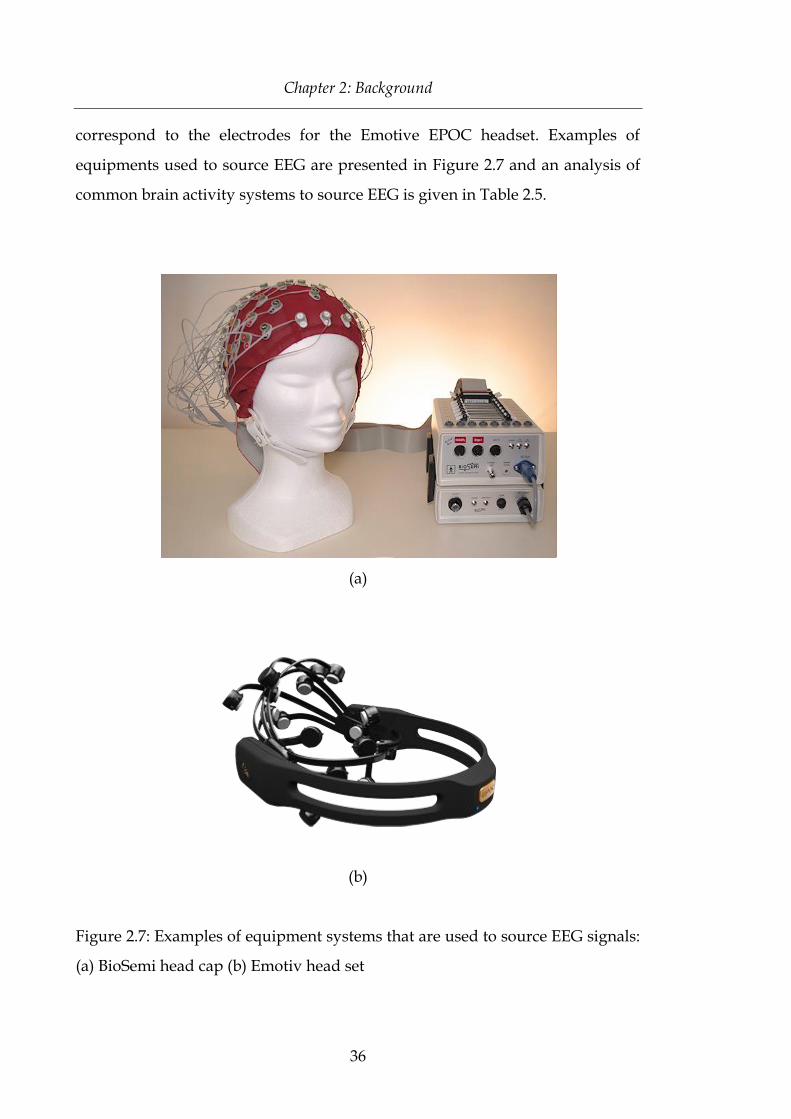
Chapter 2: Background
36
correspond to the electrodes for the Emotive EPOC headset. Examples of
equipments used to source EEG are presented in Figure 2.7 and an analysis of
common brain activity systems to source EEG is given in Table 2.5.
(a)
(b)
Figure 2.7: Examples of equipment systems that are used to source EEG signals:
(a) BioSemi head cap (b) Emotiv head set

2.6 Physiological Stress Measures
37
Table 2.5: Analysis of brain activity measurement systems
Brain Activity
Measurement System
Advantages Disadvantages
BioSemi (connected to
a computer with
ActiView software
suite)
Data transferred to a
computer in real-time
Allows real-time
viewing and analysis
of data and trends
Sampling rate of 16
kHz
Expensive
Requires the subject to
wear a head cap with
electrodes and
conductivity gel which
can be obtrusive
Expert training
required to operate the
system
Thought Technology
FlexComp Infiniti
(connected to a
computer with
Biograph Infiniti
software suite)
Data transferred to a
computer in real-time
Allows real-time
viewing and analysis
of data and trends
Waveforms accurate to
500 Hz
2000 samples/second
Equipment not
portable
Expensive
Requires the subject to
wear a head cap with
electrodes and
conductivity gel which
can be obtrusive
Expert training
required to operate the
system

Chapter 2: Background
38
Emotiv Research
Edition SDK
Portable headband
Less intrusive than
conventional EEG caps
Allows real-time
viewing of data and
trends
Sampling rate of 128
Hz
No data analysis tools
(e.g. Fourier transform)
available with the
system
Data analysis has to be
done offline
EEG signals are categorised by frequency and each category represents
some state for a person. The indices, waves or bands in the EEG are categorised
in Table 2.6. Beta and alpha waves represent conscious states whereas theta and
delta waves signify unconscious states [135]. Rapid beta wave frequencies
(resulting from a decrease in alpha wave frequencies) is the main characteristic
indicating stress [75, 131, 135]. Alpha waves appear on both sides of the brain,
but slightly higher in amplitude on the non-dominant side, generally observed
in people who are right-handed [131]. Band pass filtering can be used to
remove noise and obtain certain parts and features of an EEG signal before
analysis. EEG signals can be filtered using a band pass filter with appropriate
values for low and high pass filters e.g. 30 Hz and 4 Hz respectively.

2.6 Physiological Stress Measures
39
Table 2.6: EEG frequency band categories
Band Category Frequency
Range (Hz)
Person’s State
Beta 13 – 30 Alertness or anxiety
Alpha 8 – 13 Relaxation
Theta 4 – 8 Dream sleep or phase between
consciousness and drowsiness
Delta 0.5 – 4 Coma or deep sleep
Brain activity has been examined for those who have experienced
chronic stress. It has been found that females with post-traumatic stress have an
increased activation in the anterior and middle insula when presented with
stimuli that reminded them of the previous stressful events [136]. This
characteristic was obtained through fMRI recordings and analysis. In a different
study, positive, neutral and negative emotions were classified using EEG [132].
EEG frequency band power, cross-correlation between band powers, peak
frequency in alpha band and Hjorth parameters [137] were some features used.
Hjorth parameters are time-based characteristics of an EEG signal and details
can be found in [137].
Signal processing methods (e.g. FT) have been applied to EEG and
analysed in time, frequency and spatial domains. For physical stress [138], Ratio
of Power Spectral Densities of the Alpha and Beta bands has been calculated
and analysed for stress [139]. Results suggested that the ratios for Alpha ( )
and Beta ( ) powers defined as given in equations (8) and (9) respectively were
negatively correlated with self-reports.
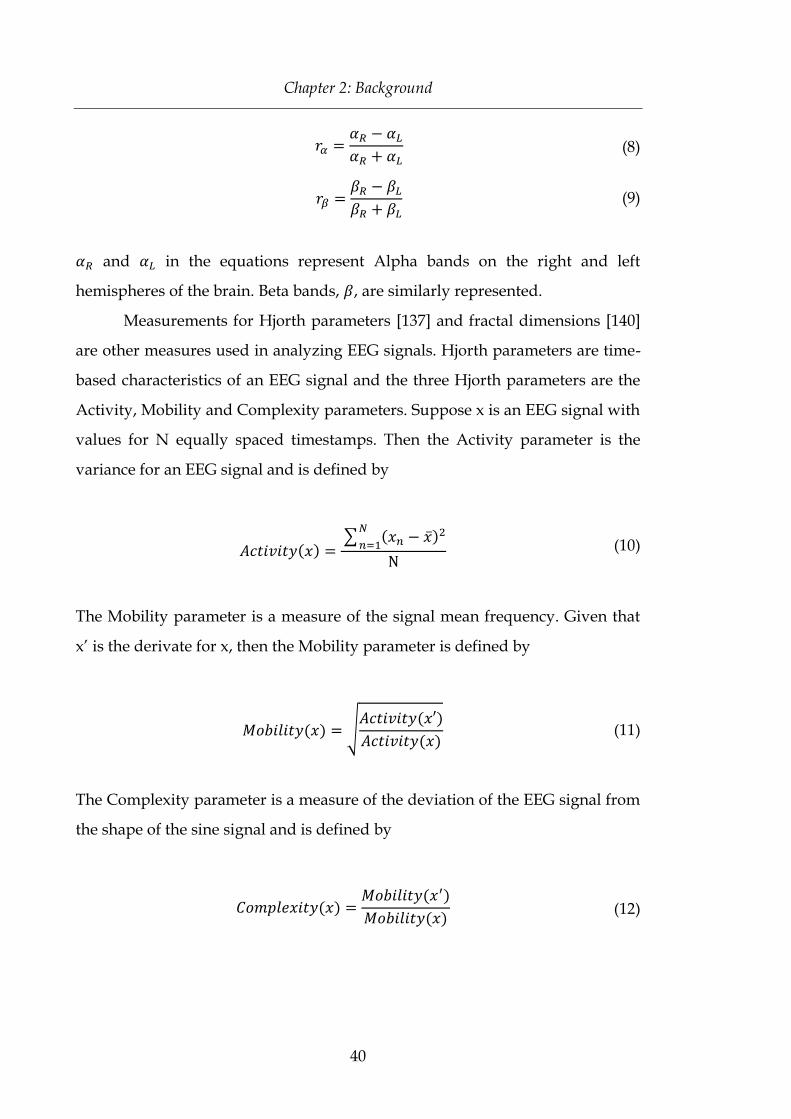
Chapter 2: Background
40
(8)
(9)
and in the equations represent Alpha bands on the right and left
hemispheres of the brain. Beta bands, , are similarly represented.
Measurements for Hjorth parameters [137] and fractal dimensions [140]
are other measures used in analyzing EEG signals. Hjorth parameters are time-
based characteristics of an EEG signal and the three Hjorth parameters are the
Activity, Mobility and Complexity parameters. Suppose x is an EEG signal with
values for N equally spaced timestamps. Then the Activity parameter is the
variance for an EEG signal and is defined by
(10)
The Mobility parameter is a measure of the signal mean frequency. Given that
x’ is the derivate for x, then the Mobility parameter is defined by
(11)
The Complexity parameter is a measure of the deviation of the EEG signal from
the shape of the sine signal and is defined by
(12)

2.6 Physiological Stress Measures
41
Fractal dimension measures of an EEG signal provides information of the space
filling and self-similarity and can be approximated using the following
definition:
(13)
where
(14)
and
(15)
Neurofeedback training has been developed to induce stress
management by training the brain to reduce symptoms of stress e.g. Interactive
Productline Mindball, a competitive game system. Mindball uses EEG
information to assess stress and provide feedback over a period of time, and the
player with lower stress levels win the game [75].
EEG signals may have more information about stress levels than blood
pressure and heart rate. EEG has been claimed to show differences in relaxation
(opposite of stress) levels that blood pressure and heart rate information cannot
illustrate [75]. Sum of alpha and theta, and the sum of alpha, beta and theta are
good measures [75] for relaxation. It is not yet known whether EEG gives more
details of stress than GSR.
Stress states have been classified using EEG data and a decision tree
model [129]. Other work has used EEG to classify states that are not directly
related to stress but could be used as a basis for further EEG-based stress
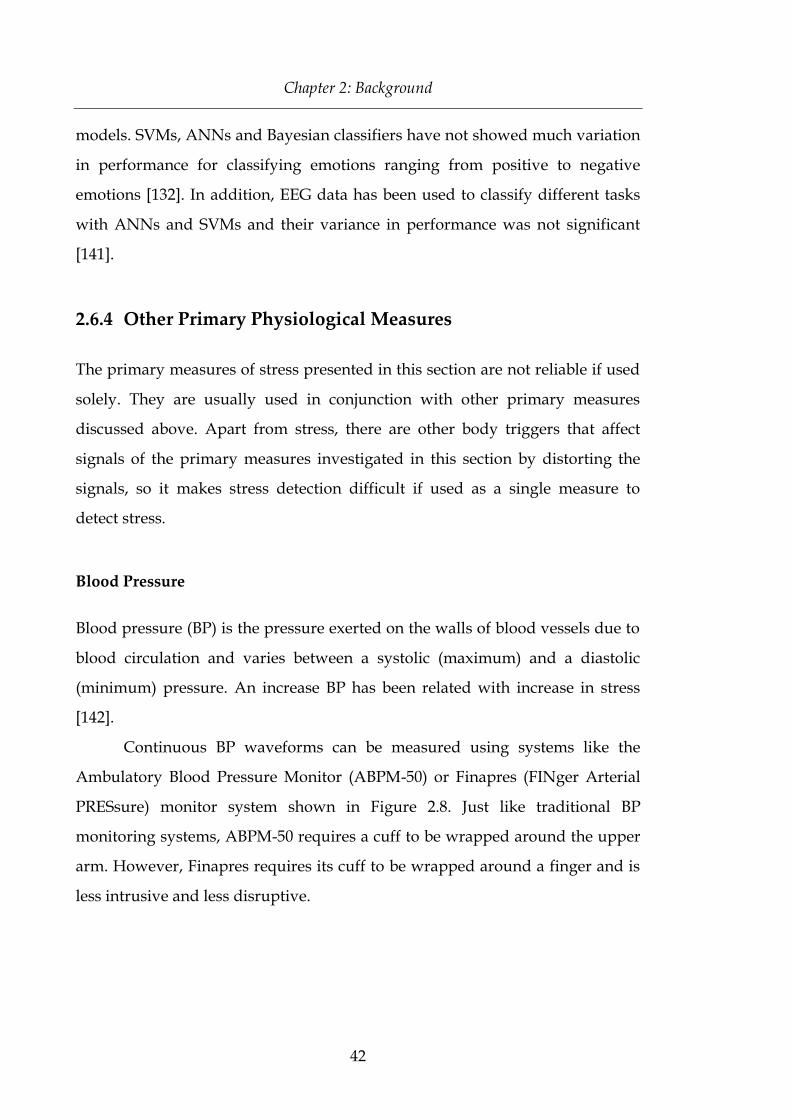
Chapter 2: Background
42
models. SVMs, ANNs and Bayesian classifiers have not showed much variation
in performance for classifying emotions ranging from positive to negative
emotions [132]. In addition, EEG data has been used to classify different tasks
with ANNs and SVMs and their variance in performance was not significant
[141].
2.6.4 Other Primary Physiological Measures
The primary measures of stress presented in this section are not reliable if used
solely. They are usually used in conjunction with other primary measures
discussed above. Apart from stress, there are other body triggers that affect
signals of the primary measures investigated in this section by distorting the
signals, so it makes stress detection difficult if used as a single measure to
detect stress.
Blood Pressure
Blood pressure (BP) is the pressure exerted on the walls of blood vessels due to
blood circulation and varies between a systolic (maximum) and a diastolic
(minimum) pressure. An increase BP has been related with increase in stress
[142].
Continuous BP waveforms can be measured using systems like the
Ambulatory Blood Pressure Monitor (ABPM-50) or Finapres (FINger Arterial
PRESsure) monitor system shown in Figure 2.8. Just like traditional BP
monitoring systems, ABPM-50 requires a cuff to be wrapped around the upper
arm. However, Finapres requires its cuff to be wrapped around a finger and is
less intrusive and less disruptive.
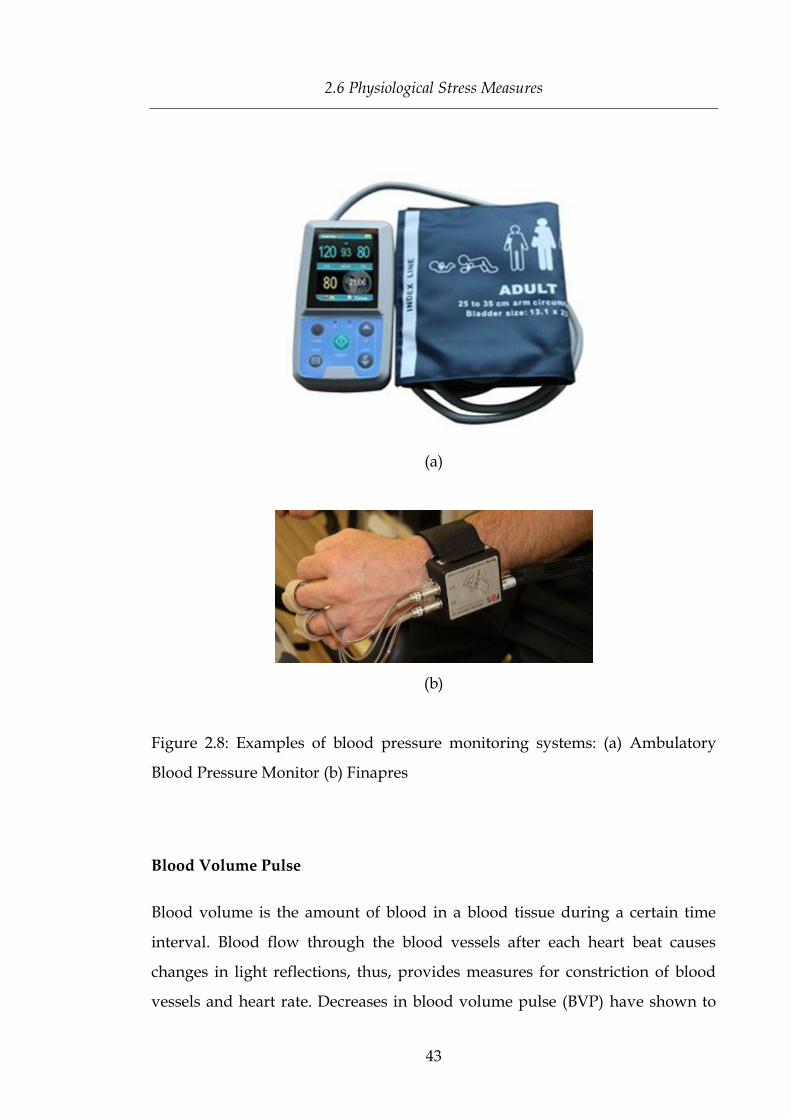
2.6 Physiological Stress Measures
43
(a)
(b)
Figure 2.8: Examples of blood pressure monitoring systems: (a) Ambulatory
Blood Pressure Monitor (b) Finapres
Blood Volume Pulse
Blood volume is the amount of blood in a blood tissue during a certain time
interval. Blood flow through the blood vessels after each heart beat causes
changes in light reflections, thus, provides measures for constriction of blood
vessels and heart rate. Decreases in blood volume pulse (BVP) have shown to

Chapter 2: Background
44
be correlated with increases in stress and lower stress levels have illustrated
increases in BVP [143]. Measurements of BVP can be taken using a
Photoplethysmography (PPG) from the skin capillary bed of a finger. A PPG
bounces infra-red light on the skin and the amount of light reflected provides a
measurement of the amount of blood present in the region. It has been used by
commercial (HRV-based) stress monitoring systems [144, 145]. BVP has been
used with other physiological measures to detect stress more reliably [81].
Muscle Activity
Electromyography (EMG) shows electrical activity produced by active muscles
i.e. muscle action potentials. For stress detection, EMG electrodes have been
placed on the trapezius muscle [17], which is located in the shoulder. Other
measurements, such as, GSR and ECG, have been found to be better indicators
of stress [17].
Skin Temperature
Skin temperature (ST) has been used to measure stress in conjunction with
other primary measures [18]. Investigations show that ST is negatively
correlated with stress i.e. ST increases when stress levels decrease and ST
decreases when stress increases [143]. ST has been measured using LM34 IC by
placing the sensor on the distal phalanx of the left thumb [81].
Respiration
The rate and volume of respiration has been used to measure levels of stress but
generally in conjunction with other physiological measures [35]. Most
respiration monitoring systems require individuals to wear a belt around their
chest [17]. This type of a system is intrusive and may restrict individuals from
performing their regular activities. In addition, it has been claimed that other

2.7 Physical Measures
45
physiological measures, such as HRV and GSR, reflect stress levels to a greater
extent than respiration, particularly in driver stress [17].
2.7 Physical Measures
In this thesis, a physical feature or characteristic is defined as a property that
humans can see changes in without the need for equipment and tools, unlike
physiological features, which require the use of tools to detect general
fluctuations. Physical signals that are sensitive to stress are behaviour, gesture,
body movement, facial expression, eye gaze, blinks, pupil dilation, and voice.
2.7.1 Behaviour, Gesture and Interaction
Body language can express stress states and humans are generally good
assessors at finding these relationships. Body language is defined by body pose
and/or body motion. Recognition of body language requires complex
techniques that consider degrees of freedom for body configurations and vast
variations in motion. Behaviour can be determined by examining body
language. Behavioural recognition and analysis requires computer vision
techniques with the purpose of understanding a visual environment. However,
the common method for determining stress through behaviour is by human
experts. Stress levels in car drivers have been assessed by humans who used
their judgement to examine driver behaviour on recorded videos [17]. Future
research could include developing techniques for automated stress detection
from behaviour data. Due to the time-varying nature of stress, HMM, Markov
chains, Bayesian classifiers [146], Hidden Semi-Markov Models, ANN,
Temporal Scenario Recognition and Petri Nets are some types of techniques
that can be investigated for interpreting and analysing behaviour associated
with stress.

Chapter 2: Background
46
Stress models based on gesture and interaction features have been quite
simplistic. Driving scenarios are rich in stress stimuli that induce drivers to
react by gestures, which is an area where stress has been modelled. Gesture
recognition has been used to determine stress in car drivers [17]. Approaches
for predicting driver behaviour have also been developed through vision based
techniques and dynamic Markov models [147, 148]. Haptic cues have been used
in stress experiments which induces interaction with environments.
Investigations with mouse movement show that individuals click mouse
buttons harder as their stress decreases [107].
2.7.2 Facial Features
Facial features can provide insight to feelings and mental states for individuals
including stress. When conversing with an individual, a person can get
feedback from facial features which they can act accordingly e.g. the person
might cut a long story short when they observe and realise that the individual
is showing signs of frustration, agitation or preoccupation by less nodding,
reduced facial muscle movements or frequent eye movements to other objects
in the surroundings.
There are systems (e.g. FaceLAB, NEVEN Vision [149]) that automatically
determine facial features (e.g. points on face, head movements, levels of mouth
openness) from cameras or videos. FaceLAB, a product by Seeing Machines, is a
system for head and face tracking and allows obtaining measurements at a
sampling rate of 60 Hz for facial features including eye gaze, pupil dilation and
blinking signals non-invasively and non-intrusively. The equipment consists of
a pair of cameras, with infrared lighting. It does not require any form of contact
during signal acquisition. The FaceLAB system is shown in Figure 2.9.

2.7 Physical Measures
47
Figure 2.9: The FaceLAB system for face, eye and pupil tracking
Facial Expressions
Stress classification models have been developed from facial feature data and
results show that facial expressions can be used to show stress [150]. When
responding to stressors, facial expressions indicate biological responses reliably
[28], which are commonly used to assess stress. Online analysis of facial
expressions can be used to predict behaviour and events, e.g. car accidents, in
real-time [151]. Facial muscle movements have been used to determine stress.
Increase in head and mouth movements indicate increase in stress [107].
Human observers are good at assessing individuals’ stress. The human
brain of a healthy individual has facial expression recognition detectors to
determine emotions that show symptoms of stress of a person but
unfortunately the process by which the brain deduces such conclusions is yet to
be understood. Machine learning techniques [152], including SVM, principal
component analysis [153], and decision tree-based classifiers [153] have been
used for facial expression recognition.
Chapter 2: Background
48
Eye Gaze
Eyes can provide information in social interaction. Eye gaze provides
information on an individual’s attention source, and enables deducing the
individual’s mental states and intentions. Using eyes to focus on a particular
object on a computer screen for a greater period of time and frequent focuses on
the object are characteristics that correlate with stress levels [107]. The types of
measures obtained from eye gaze for measuring stress include gaze spatial
distribution and percentage of saccadic eye movement [107].
Pupil Dilation
Pupil dilation has been examined for stress detection [80]. If an individual’s
pupil dilation increases [154, 155], the pupil dilates at a higher frequency, then
it suggests that the individual is possibly in a stressed state [107]. However,
both negative and positive stimuli can cause an increase in pupil dilation.
Results of a research experiment suggested that pupil dilation increased
significantly when experiment participants were exposed to negative and
positive arousing sounds [33].
A common characteristic used in stress detection is the mean value for
pupil dilation over time. An increase in stress has been shown by increasing
mean values over a time period [81]. Interpolation techniques have been used
to determine pupil dilation during blinks [81], but simple techniques such as
replacing the blink with the last valid pupil dilation measurement value
suffices [33].
Some eye tracking systems used to determine pupil dilation are the
FaceLAB 4.5 [156] and ASL-504 eye gaze tracking system [81] with sampling
rates of 60 Hz, and Applied Science Laboratories series 4000 eye tracking
system with a sampling rate of 50 Hz [33]. The eye monitored for pupil dilation
does not seem to be significant but individuals’ left eyes are commonly used to
monitor pupil dilation [33, 80].

2.7 Physical Measures
49
Eye Blink
Eye blinks are sensitive to stress but conflicting characteristics have been
suggested for stress detection. Some literatures state that higher frequency of
blinks are detected when an individual is under stressful conditions [157]
whereas others seem to suggest the opposite [107]. These conflicting
conclusions could have been caused by analysing data obtained from different
experiment environments. The results of the literature that suggested a
correlation between higher frequency of blinks and stress were acquired from
real driving experiments whereas the results analysed from solving
mathematical tasks on a computer suggested the opposite. In addition, faster
eye closure has been suggested as a characteristic for higher stress levels [107].
2.7.3 Voice
Stress in voice is defined as “observable variability in certain speech features
due to a response to stressors” [39]. Presently, ‘certain’ is not well defined and
the ‘features’ may include lexical, phonological or prosodic features. Detecting
stress in voice is a dynamic process. It is the nonverbal components of voice
that reflect stress. Key features claimed to show increases in stress are increases
in range and rapid fluctuations in fundamental frequency [158-160], increases in
energy for high frequency voice components [161], and greater proportions of
high frequency components [37].
Determining stress levels through speech is non-invasive, less obtrusive
and less expensive [19] compared to other methods for measuring stress. Such
stress monitoring systems are common and have been developed for users
including army officers [19], and video game players [95]. Air Force Research
Lab (USA) claims that a voice based stress detection system can efficiently
measure officers’ stress, with the aim to reduce their workload, improve their
effectiveness and, as a result, save lives [19]. Stress is part of everyday life and
can change the characteristics of speech. Intelligent speech recognition and

Chapter 2: Background
50
speaker identification systems use stress models to consider changes in speech
characteristics due to stress [162].
Speeches of drivers under stress have been modelled using signal
processing techniques, Teager energy operator (TEO) and multiresolution
analysis. Dynamic Bayesian networks and hidden Markov models were used to
classify the features within utterances. A SVM and an ANN were used to model
the features across utterances. [163]
Voice features for stress models include loudness, fundamental
frequency, zero-crossing rate, jitter and energy frequency ratios [37]. Stress
related emotions have been measured in speech by extracting features
including voice quality, pitch, duration, intensity, formants, vocal tract cross-
section areas, frequency, Teager energy features, glottal characteristics, duration
of silence, and speech rate [160, 164-166]. A system that detects frustration and
annoyance (symptoms of stress) in voice has been developed for flight
telephone booking through a prosodic model [165]. Frustration was detected by
longer speech durations, slower speech and pitch rates.
Acoustic components in voice that can be used to show stress are caused
by physiological changes that depict signs that the human body is responding
to stress [37]. This is an example where physiological and physical
characteristics of stress are related. Micro-muscle tremors (MMT), caused by
muscle tension, and voice stress analysis (VSA) reflect stress. MMT is caused by
the muscles in the vocal tract and is transmitted through speech. MMT and
VSA have been used in lie detector systems [167].
2.8 Fusion of Measures
Combinations of sensors have been used to give a better measure of stress.
Facial expressions, eye movements, head movements, GSR, RTD and BVP data
have been fused to develop a stress model [107]. Physiological sensor data have
also been fused to determine stress. GSR, BVP and HR have been used to

2.9 Evaluation of Primary Stress Measures
51
determine stress in video game players [76]. Computer users have had their
GSR, EMG, ECG and respiration data used for stress classification [80]. Car
drivers have had their relative stress levels monitored by ECG, GSR, EMG and
respiration recordings, but ECG and GSR mirrored stress more reliably [17]. In
addition, drivers have had facial expressions and road conditions recorded and
synchronised to the physiological measures to support results [17]. Computer
users have had their HRV, GSR, pupil dilation and skin temperature recordings
monitored to detect stress [81].
Other work has involved using physiological measures to model
symptoms of stress e.g. agitation, anger, fear and frustration. HR, GSR and skin
temperature have been used to recognised agitation in dementia patients [70].
Emotions of anger, fear and frustration have been classified using GSR, HR and
skin temperature [78]. An emotional recognition system has been developed
based on EEG, GSR, HRV, BVP and respiration [168].
Some measures in a combination of measures may be redundant with
other measures and this may cause collection of unnecessarily large volumes of
data and unnecessary processing time. This motivates using an optimal
combination of measures for measuring stress. Techniques used that can be
used to determine an optimal measure combination include mutual information
measure [107] and principal component analysis [129].
2.9 Evaluation of Primary Stress Measures
Table 2.7 provides an empirical ranking of primary measures for stress based
on discussion in this chapter, their correlation with stress claimed in the
literature, equipment intrusiveness, techniques developed for mapping to stress
scales, and extent of usage in the literature. The ranking has been established in
[24].
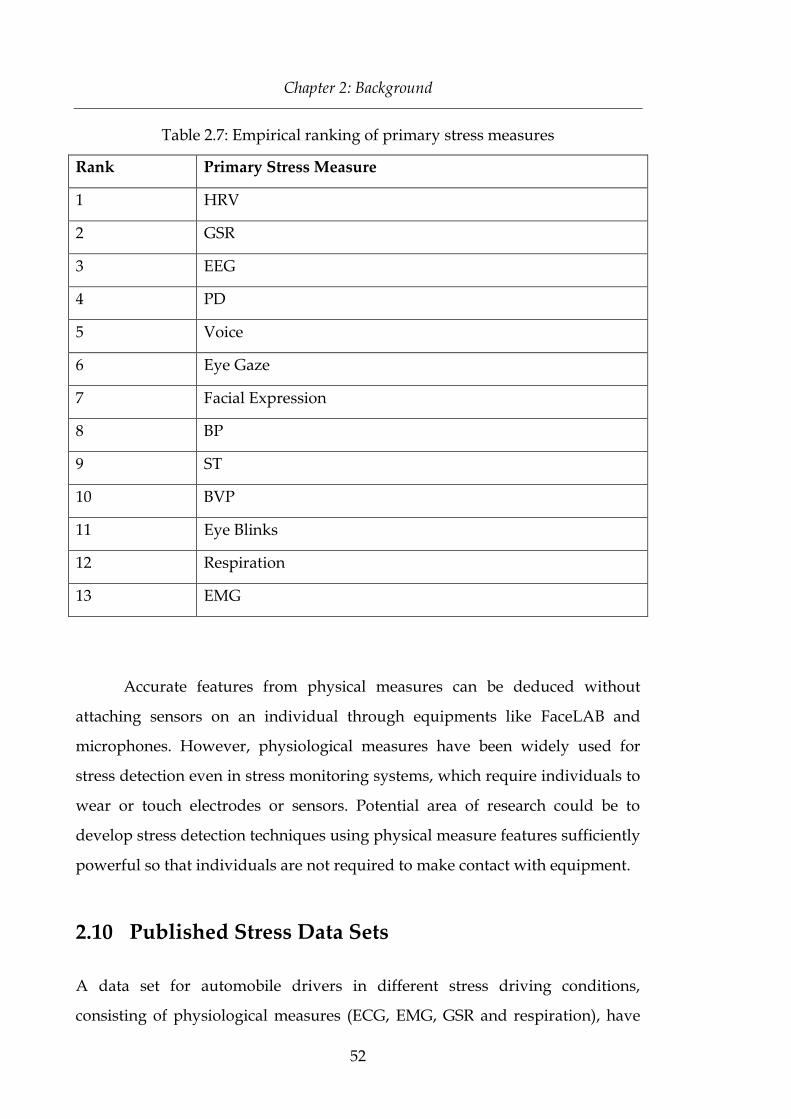
Chapter 2: Background
52
Table 2.7: Empirical ranking of primary stress measures
Rank Primary Stress Measure
1 HRV
2 GSR
3 EEG
4 PD
5 Voice
6 Eye Gaze
7 Facial Expression
8 BP
9 ST
10 BVP
11 Eye Blinks
12 Respiration
13 EMG
Accurate features from physical measures can be deduced without
attaching sensors on an individual through equipments like FaceLAB and
microphones. However, physiological measures have been widely used for
stress detection even in stress monitoring systems, which require individuals to
wear or touch electrodes or sensors. Potential area of research could be to
develop stress detection techniques using physical measure features sufficiently
powerful so that individuals are not required to make contact with equipment.
2.10 Published Stress Data Sets
A data set for automobile drivers in different stress driving conditions,
consisting of physiological measures (ECG, EMG, GSR and respiration), have
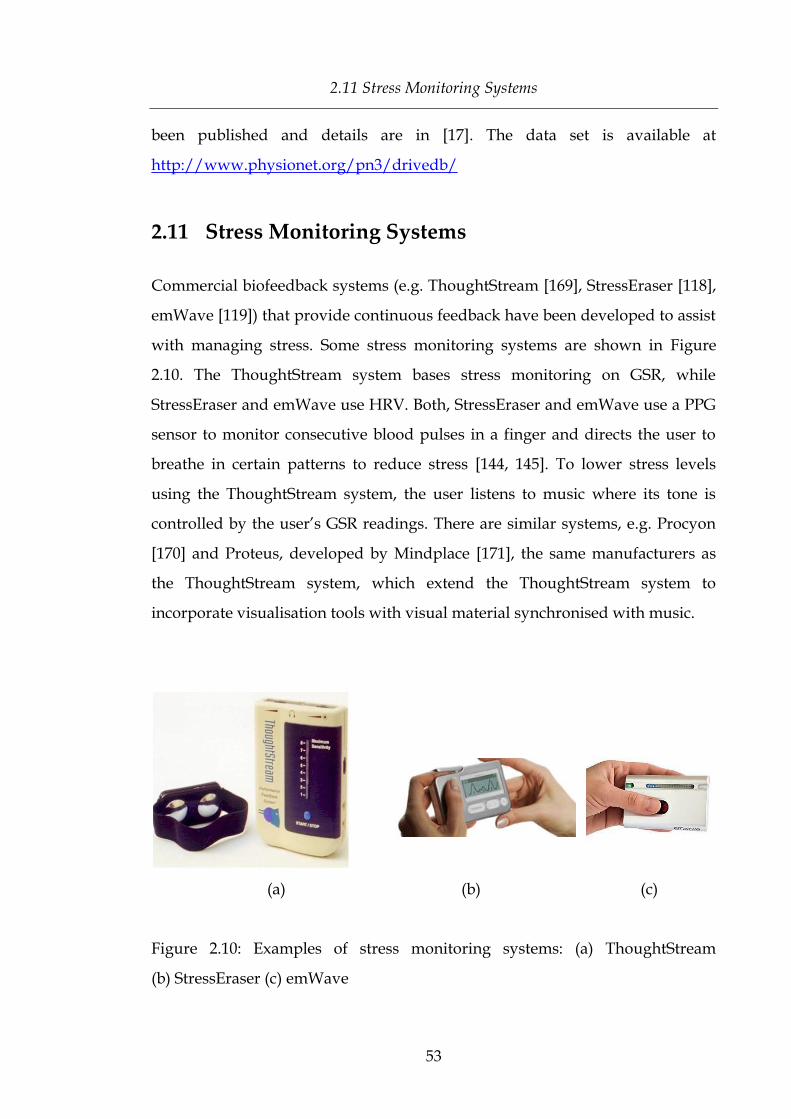
2.11 Stress Monitoring Systems
53
been published and details are in [17]. The data set is available at
http://www.physionet.org/pn3/drivedb/
2.11 Stress Monitoring Systems
Commercial biofeedback systems (e.g. ThoughtStream [169], StressEraser [118],
emWave [119]) that provide continuous feedback have been developed to assist
with managing stress. Some stress monitoring systems are shown in Figure
2.10. The ThoughtStream system bases stress monitoring on GSR, while
StressEraser and emWave use HRV. Both, StressEraser and emWave use a PPG
sensor to monitor consecutive blood pulses in a finger and directs the user to
breathe in certain patterns to reduce stress [144, 145]. To lower stress levels
using the ThoughtStream system, the user listens to music where its tone is
controlled by the user’s GSR readings. There are similar systems, e.g. Procyon
[170] and Proteus, developed by Mindplace [171], the same manufacturers as
the ThoughtStream system, which extend the ThoughtStream system to
incorporate visualisation tools with visual material synchronised with music.
(a) (b) (c)
Figure 2.10: Examples of stress monitoring systems: (a) ThoughtStream
(b) StressEraser (c) emWave
Chapter 2: Background
54
2.12 Computational Techniques for Modelling Stress
Various software programs, tools and packages (e.g. Matlab [172],
AcqKnowledge [173] and Biosignal Analysis Software [116]) are available for
analysing physiological and physical signals. Most of the tools and applications
are not specifically designed for primary measures of stress but they suffice for
general data exploration. Exploring signal data is beneficial because it enables
selection of appropriate computational techniques to model stress. It also
allows detection of noisy, corrupted or missing signal data, which is useful in
the process of preparing data before computational stress models are
developed. This section focuses on computational modelling techniques used
for stress.
2.12.1 Data Preparation
In order to remove individual differences and provide a more robust base for
comparisons, measurements for features can be standardised before analysis or
provided as model input. Let X represent a data point for some measure then X
can be standardised using equation (16).
(16)
Usually, standardised running average signals for primary measures
over time have been portrayed in graphs to illustrate the responses affected by
stress. Correlation analysis has been performed to determine relationships
between the primary signals and symptoms of stress at each of the time steps
[107].
Primary stress signals may have signal corruption when obtained from
sensors. These corruptions will generally be due to noise and other corruption
sources such as, transmission distortion. Techniques based on correlation

2.12 Computational Techniques for Modelling Stress
55
methods and evolutionary algorithms could be used to optimally remove signal
corruptions for modelling stress.
2.12.2 Feature Extraction Techniques
Various signal processing techniques have been used to extract features from
primary nonstationary signals of stress. Popular techniques include Fourier
transformations (FT) and wavelet transformations (WT). They can be used to
remove noise in time series or feature extraction [157, 174]. It is common to
transform physiological signals (e.g. EEG [157], GSR [17] and HRV [120]) from
time to frequency domain in order to extract features that are more apparent in
the frequency domain for analysis using FTs. WT is another technique that
allows signals to be transformed from time to frequency domains, but allows
data to be divided into different frequency components. Unlike FT, WT
performs well when approximating data that has sharp spikes and
discontinuities.
Principal Component Analysis (PCA) and Independent Component
Analysis (ICA) have mainly been used to extract features from EEG data and
can be used for reducing the feature set or removing unwanted features from
the set of primary measures for stress models. PCA was used to reduce features
in EEG signals to model stress [129]. ICA has been used to remove eye
movement and other muscular movement information, which is generally
considered to be noise, from EEG signals [141].
2.12.3 Feature Selection Techniques
Large numbers, in the order of thousands, of stress features can be derived
from primary stress signals to analyse stress. This set of features may include
redundant and irrelevant features which may outweigh the more effective
features showing stress patterns. For sensor data, some features may suffer

Chapter 2: Background
56
from corruption as well if minimal feature extraction processing is done. This
could cause a model to capture patterns in the data that are not central to stress
and cause the model to produce lower quality classifications. The number of
features could also affect the classification performance for instance, if a large
number of features were to be provided as input to an ANN then it would
result in quite a large network. This can lead to the issue where the ratio for
number of samples to the number of connections and weights in an ANN could
be relatively small and result in poor classification performance. Selecting
effective features by reducing redundant and irrelevant features have been
known to improve the quality of pattern recognition [175] because it can help
the model better capture necessary patterns in the data and in turn, this can
improve the quality for recognition.
In order to achieve a good model, it should be robust to input tuples and
features that are redundant, irrelevant or suffer from corruption. A genetic
algorithm (GA) could help solve these problems by selecting salient subsets of
features for optimising stress recognition. GAs have been successfully used to
select features from large numbers of features (e.g. features from microarray
data [176]) and features derived from physiological signals [177, 178]. A GA is
based on the concept of natural evolution and has been commonly used to solve
optimization problems [179]. It evolves a population of candidate solutions,
represented by chromosomes, in search for better quality chromosomes. The
quality for each chromosome in the population is defined by some fitness
function. A GA search evolves a population of chromosomes using crossover,
mutation and selection operations. Crossover and mutation operations are
applied to chromosomes to achieve diversity in the population and reduce the
risk of the search being stuck with a local optimal population. After each
generation during the search, the GA selects chromosomes, mostly made up of
better quality chromosomes, for the population in the next generation to direct
the search to more favourable chromosomes.

2.12 Computational Techniques for Modelling Stress
57
Correlation analysis is another method that has been used to select
features appropriate for modelling. It has been mainly used to deal with
redundant features and reduce their effect on models. Correlation analysis
using correlation coefficients has been reported to detect some redundancies in
time-varying data [180].
2.12.4 Artificial Neural Networks
Artificial Neural Networks (ANNs) are inspired by biological neural networks
with characteristics for learning and reacting, making them a popular technique
in classification problems in health systems and an emerging approach for
stress research. Stress models based on ANN are at the early stages of research
and have produced promising results. It has been claimed that an ANN is
better at recognising stress than humans from voice recordings [95] and this
result contributes to motivation for further stress research using ANN.
An ANN has the capability to learn patterns to recognise characteristics
in input tuples by classes. It is made up of interconnected processing elements,
known as artificial neurons, which are connected by weighted links that pass
signals between neurons. A group of neurons form a layer in an ANN. The
layers and neurons in each layer define the topology of a feed-forward ANN.
An ANN has an input layer, may have multiple hidden layers and an output
layer. Input tuples for the ANN are passed through the input layer. Then the
weighted links pass the weighted signals to the neurons in the hidden layers
which process the signals further and then in a similar fashion the signals
progress through the following layers. The processed signals are propagated
through the ANN in this fashion for the signals to reach neurons in the output
layer which causes the ANN to produce the output for the ANN. Essentially, a
signal is propagated through the ANN layer after layer. In addition, the
topology of the ANN can be designed to include a time-delay to exploit the
time-varying nature of the stress features. Choosing the appropriate number of

Chapter 2: Background
58
points in time for stress classification is another task that forms part of the
process for designing the topology. The topology is usually designed by a trial
and error process. Further, the topology may have an impact on the
performance for classification.
Choosing the number of hidden neurons and layers is a critical aspect in
defining the structure of an ANN. With a small number of hidden neurons, an
ANN will not be able to differentiate between complex patterns, which will
result in an underestimation of the actual trend. On the other hand, a large
number of hidden neurons could lead to a poor generalisation because of over-
parameterisation. The number of hidden neurons is usually obtained
empirically. In some situations the accuracy may be similar for different
topologies, for instance, the accuracy for the one and two hidden layers were
similar when classifying fatigue [181].
Multi-layered perceptrons, a type of ANN with multiple hidden layers,
have been used for stress classification [182]. Features from physiological
measures were used in the classification. Recurrent ANNs (RANN) have been
used to measure stress. A RANN is an ANN that contains feedback
connections. It has been claimed to be useful for retaining information of how
the previous sample was processed to process the current sample effectively. A
RANN based on labelled voice data for experiment participants playing a video
game has been developed [95]. Utterances were recorded when participants
answered questions while playing the video game.
2.12.5 Support Vector Machines
Stress models have also been developed using Support Vector Machines
(SVMs). SVMs can be used to classify linear and non-linear primary measures.
Provided a set of training samples, a SVM transforms the data samples to a
higher dimension with the aim to determine a separating hyper-plane that
partitions data by class or labels. An appropriate non-linear mapping can

2.12 Computational Techniques for Modelling Stress
59
separate two classes of data with a hyper-plane provided that the data has been
transformed to a satisfactorily high dimension. A hyper-plane is chosen based
on support vectors, which are training data samples that define maximum
margins from the support vectors to the hyper-plane to form the best decision
boundary. SVMs have been used to predict stress states using BVP, GSR, pupil
dilation and skin temperature data [18, 81]. Other research that has used SVMs
to model human states include agitation detection in dementia patients using
heart activity, GSR and skin temperature data [70] and emotion recognition
based on EEG data [132].
2.12.6 Bayesian Classification
Bayesian classifiers can predict class membership probabilities for given
samples. Such classifiers are based on Bayes’ theorem and have been used to
calculate posterior probabilities for stress states. Naive Bayesian classifiers have
been used to classify stress [80, 81], which assumes classes are independent. A
maximum posterior decision rule was used to classify features from physical
measures to stress classes: “Stress” and “Normal” [81]. Alternatively, Bayesian
belief networks or Bayesian Networks (BN) can be used when classes have
dependencies. A BN can be represented by a directed acyclic graph or
conditional probability tables to show joint conditional probabilities for
attributes or variables. Nodes in the graph depict variables and arcs portray
causality. A Dynamic Bayesian Network (DBN) has been used to model stress
[107]. Unlike a traditional BN, a DBN can show how properties of stress vary
over time.
2.12.7 Decision Trees
Decision tree classifiers, based on a divide-and-conquer approach, have been used
in stress classification. The structure of a decision tree is like a flowchart. Each

Chapter 2: Background
60
internal node represents some criteria or test to divide the input space into
regions, each branch denotes an outcome of the test, and each terminal node or
leaf represents a target class. Algorithms have been established to generate
decision trees [183]. Unknown samples are classified by starting at the root of
the tree and moving the sample towards the leaf after testing the sample against
the criteria at the internal nodes in the path.
Decision trees have been used to classify stress based on characteristics
in physiological measures (e.g. EEG [129]) and combinations of primary
measures (e.g. combination of BVP, GSR, pupil dilation and skin temperature
[81]). A potential problem with using decision trees to model stress is the crisp
splits for prediction. Future research could investigate softening the decision
process with the use of fuzzy techniques or some probabilistic framework.
2.12.8 Markov Chains and Hidden Markov Models
The Markov property is a time-domain process with conditional probability
density of the current event depending on the ith most recent event, given all
the past and present events. A Markov chain is the simplest form of a Markov
model. It models the state of a system with a random variable, which varies
with time, where a state is dependent on prior states. The system of a Markov
chain is fully observable. On the other hand, a hidden Markov model (HMM) is
a type of a Markov chain but, as its name suggests, it is partially observable.
Only the sequence of observations can be seen in HMMs. HMMs are a double
stochastic process with a Markov chain that has a finite number of states and a
set of functions that corresponds to each state. The process is in one state in the
system at a time and produces a symbol that is dependent upon a random
function for that state. The generalised topology of a HMM is a fully connected
structure where a state can be reached from any state.
In stress research, HMMs have been mainly used in recognising stressed
speech [162, 163, 166, 184]. HMMs have been used for modelling emotions from

2.13 Fusion of Computational Techniques
61
voice data as well [185]. Markov models, including dynamic-based and HMM,
have been used for behavioural recognition and prediction [148].
2.12.9 Fuzzy Techniques
Fuzzy-based techniques, in particular fuzzy clustering has been used to
measure stress. A fuzzy technique has used HR to model workload [186], which
is somewhat related to stress. In addition, fuzzy filters could be used to filter
out uncertainties in physiological measures of stress. A nonlinear fuzzy filter
for reducing random variations has been developed for heart rate signals [187].
Fuzzy clustering, a hybrid of fuzzy and clustering techniques, has been
used to determine stress based on HRV as a primary measure [26]. Unlike
traditional clustering where data elements belong to at most one cluster, fuzzy
clustering generates data clusters such that data elements can belong to more
than one cluster with different membership degrees. Each data element has a
set of membership level values giving the membership degrees.
2.13 Fusion of Computational Techniques
Hybrid techniques for stress models include an adaptive neuro-fuzzy inference
system [36], a fuzzy clustering technique [26], and a technique combining WT
and ANN [174]. However, the number of hybrid techniques developed for
stress models are few and, in relation to the previous sections in this chapter,
there is scope for more hybrids. On the other hand, primary measures have
been modelled using many more types of hybrid techniques but not directed to
stress. These include modelling behaviour [146] and emotions [188]. A BN and
a HMM was fused for behavioural analysis and recognition [146]. They used
behavioural analysis to discover criminal activities by using scenes around the
airport especially for baggage handling. A possible extension of this research

Chapter 2: Background
62
could include determining whether an individual is stressed by analysing their
behaviour for example, modelling interviewee jitteriness during an interview.
2.14 Evaluation of Computational Techniques for
Modelling Stress
Not many comparisons have been done to evaluate stress models. In an
investigation for performance of stress models based on supervised learning,
SVM was claimed to be a superior technique to Naive Bayes and Decision Tree
classifiers [81]. To resolve the need for an evaluation of computational
techniques suited for modelling stress, this thesis presents an empirical ranking
of techniques used for modelling stress in Table 2.8 based on the discussions in
this chapter, comparisons and usage in the literature. The ranking has been
adopted in the literature [24].
Models of stress in the literature have used their own methods for
measuring stress and determining performance in stress detection. They do not
result in models for managing stress in typical real life situations. Despite the
differences in metrics, the models reported in the literature have performed
much better than chance, which suggest that stress can be successfully
modelled and that further research in this area will benefit the area on
modelling stress. This motivates the proposed research to objectively model
stress in the direction towards motivating the development of an objective
stress management system for use in real life situations. The problem
investigated in this research is on observer stress which is an instance of the
stress domain.

2.15 Summary
63
Table 2.8: Rankings of computational techniques used for modelling stress
Rank Modelling Technique Reported
Accuracy
Inputs for Model
1 SVM 90.10% [81]
79.3% [36]
GSR, HR, PD, ST
EMG, ECG, Respiration,
GSR
2 Recurrent ANN MSE = 0.084 [95] Voice
3 Adaptive Neuro-Fuzzy
System
76.7% [36] EMG, ECG, Respiration,
GSR
4 ANN 82.7% [168]
Not provided
EEG
ECG
5 HMM Not provided Voice
6 Decision Tree 88.02% [81] GSR, HR, PD, ST
7 Naive Bayesian
Network
78.65% [81] GSR, HR, PD, ST
8 Fuzzy Clustering Not provided HRV
2.15 Summary
This chapter presented a survey for stress research particularly focussing on
computational stress and highlighted some of the gaps. It discussed and
evaluated the primary stress measures and computational techniques to model
stress, which are quite simplistic. The next chapter will use the primary stress
measures to propose a definition of computational stress, which will be used to
define computational observer stress, a focus of this thesis. The primary stress
measures and the computational techniques discussed in this chapter are used
in Chapters 4-6 to develop objective models of observer stress.

Chapter 2: Background
64

65
Chapter 3 Computational Observer Stress
This chapter* defines computational stress, which is based on the primary stress
measures defined in Chapter 2. It also provides the architecture of a
computational model of observer stress.
3.1 Background: Stress Scales
The literature has reported stress values on some ordinal scales to describe
different stress states. Stress in computer users has been classified as “Stressed”
or “Relaxed” [81]. Similar labels have been used for stress in computer game
players e.g. “No-Stress”, “Average” and “High-Stress” [129]. Stress levels in car
drivers have been classified into three different categories – low, medium and
high [17]. Data segments for low-stress were taken from rest periods, medium-
stress segments were taken from uninterrupted highway driving, and high-
stress segments were taken from busy main street city driving. Due to the
uncertainties, the categories could be defined in terms of fuzzy sets. Future
research could propose standard categorical labels for stress that following
research can adopt.
Stress values have also been defined on a continuous scale. A continuous
scale for mental stress has been defined as 0-100, where higher values represent
increase in stress levels [26]. Further, stress values could be represented on a
time-varying scale where each time step has an associated stress value, which
could be used to summarise stress characteristics over time.
* Portions of this chapter have been published in [24].

Chapter 3: Computational Observer Stress
66
3.2 Definition of Computational Stress
This thesis coins the term computed stress and defines it as the stress
computationally derived from instantaneous measures of stress symptoms
obtained by non-invasive methods. A computational model of stress will take
some combination of stress symptom measures as inputs to produce a
computed stress measure as an instantaneous measure of stress at that point in
time.
The literature suggests stress is defined as a self-reported measure (e.g.
self-assessment [189, 190]) or observer-reported measure (e.g. human behaviour
coder [17]). These reported measures are used to support stress measures
drawn from directly measuring stress symptoms, but do not give an
instantaneous stress measure.
The key difference is the assumption that our computed stress assumes
there is an underlying property called stress for which both the symptom
measurements and the reported measures are approximations. This allows us to
use both these sources of information in AI models to learn the underlying
model of true stress. Henceforth, we use our term, computed stress, and
distinguish it from the traditional overall stress measure. With the definition of
computed stress, stress can not only be compared across time but also across
multiple individuals. A consequence of such models is that the computed stress
will be statistically more reliable than individual reporting or symptom
measures.
3.3 Definition of Computational Observer Stress
There are various forms of stressors as defined in Section 2.3. Some situations
where stressors emerge are when playing video (action) games [75, 76], solving
difficult mathematical or logical problems [77], listening to energetic music [75],
conducting a surgical operation [22], driving cars [15-17] and flying airplanes

3.3 Definition of Computational Observer Stress
67
[20, 21]. Under all these circumstances, the literature has reported the effect of
stressors on individuals who interacted with stressors directly or were directly
involved in the situation and were in the environment. The stress of an
individual in such a context may influence the environment they are in because
they “interact” with a stressor. This thesis will investigate the effect of an
environment on an observer who observes the environment that has a stressor
stimulated by actors in the environment and where their stress does not
influence the environment – a novel area for stress research. The observer is
likely to engage emotionally and intellectually with the events in which they
are present albeit passively. This thesis coins the term observer stress to mean the
stress of an observer of such an environment that stimulates stress and the term
computed observer stress to mean computed stress of an observer.
An average person spends a significant amount of time observing
environments investigated by this thesis. According to a statistical report
published by the Australian Bureau of Statistics in 2011 [191], approximately
87% of Australians spend about three hours per day on average watching the
television. The report also stated that approximately 44% of Australians read
for about 1.25 hours a day. The activity times were recorded outside paid work,
study, housework and unpaid community work periods. The average number
of hours spent on watching television per day by the people in the United
States of America and Canada were 4.75 [192] and 3.5 [193] respectively in 2012.

Chapter 3: Computational Observer Stress
68
3.4 A Computational Model of Observer Stress
Before computational models can be implemented for observer stress, it is
necessary to define an architecture for the models. The architecture proposed
for a computational model of observer stress is presented in Figure 3.1. The
model captures the environment that a human observer sees, uses the human
response signals and their stress assessment of the environment to develop a
computational system to evaluate observer stress. Data processors and
optimisers in the model aim to make the architecture effective and scalable for
modelling stress. Details of the components in the architecture of the
computational model are provided below.

3.4 A Computational Model of Observer Stress
69
Figure 3.1: Architecture of the computational observer stress model

Chapter 3: Computational Observer Stress
70
Observer
A human observer will see events in an environment and show responses that
will be captured by physiological and physical sensors.
Environments
The thesis will investigate modelling observer stress for three different types of
environments, which are abstract virtual environments (text), virtual
environments (films) and real environments (i.e. environments with real life
humans interacting with one another).
Primary Measures
Human responses will be captured from observers while they see an
environment. The responses will include physiological signals (e.g. EEG, ECG
and GSR), physical signals (e.g. eye gaze and pupil dilation signals) and human
assessment for stress of the environment. The physiological and physical
signals will be sourced by sensors. Responses from surveys will be analysed to
determine the human assessment for stress of the environment.
Processors
The human responses captured will be processed using signal processing and
statistical techniques to develop stress features. The functions of the processors
include data alignment and synchronisation, data cleaning, data transformation
and feature extraction.

3.4 A Computational Model of Observer Stress
71
Optimiser
Features will be normalized and optimised with an aim for the computational
model to capture general stress patterns in the stress data. Normalized features
will reduce the effect of individual bias for individual-independent observer
stress models. Further, large numbers, in the order of thousands, of stress
features can be derived from primary signals to model stress. This set of
features may include redundant and irrelevant features which may outweigh
the more effective features showing stress patterns. Therefore, a stress optimiser
will make the observer stress model architecture more robust and scalable. The
stress feature optimiser system could be based on correlation based or
evolutionary algorithm based techniques.
Stress Model
A computational stress model will have a knowledge base of the stress patterns
in the stress data for observer stress recognition. The model could be based on a
classification technique such as a support vector machine. The ground truth
will be defined from the processed and optimised human assessment response
and will be used to determine the quality of the model.
Stress Evaluator
Observer stress will be recognised or evaluated using a stress model based on
the stress data.

Chapter 3: Computational Observer Stress
72
3.5 Stress Data
The objective stress data derived from primary stress signals will be used to
model observer stress. The primary signals are the physiological and physical
signals that are known in the literature to show symptoms of stress. An
observer will have stress feature values derived from their primary stress
signals for every environment they encounter. The signals will be sourced from
the observer while they see the environment over some period of time. The data
will be used to develop computational observer stress models.
Stress data for an observer is defined by stress features calculated from
primary stress signals over the time of an environment seen by the observer.
The features include statistic and measure values of the signal over certain time
segments. These statistic values include the mean, standard deviation, kurtosis,
skewness, interquartile range, minimum and maximum. Measures such as the
number of peaks for periodic signals, the distance an eye covered and the
proportion of the time the eye fixated on different regions of the environment
for eye gaze signals, and values from the power spectrum for HRV, BP and
EEG signals are also examples of stress features. Figure 3.2 shows a
visualisation of the stress data for an observer.

3.5 Stress Data
73
Figure 3.2: A visualisation of the stress data for one person. Each cell represents
a stress data value. For a particular type of environment, the person has stress
feature values for each time segment for every environment.
e
nv
iro
nm
ents
stress features

Chapter 3: Computational Observer Stress
74
The individual-independent observer stress models proposed in this
thesis take a concatenation of multiple observer stress data cuboids. The stress
data can be visualised as a cuboid in Figure 3.3.
Figure 3.3: A visualisation of the stress data for multiple observers. The stress
data can be provided as input to individual-independent stress modelling
systems. The stress data cuboid is a concatenation of the cuboids of stress data
for one observer as shown in Figure 3.2.
{
environment
o
bse
rver
s
observer stress features

3.6 Summary
75
3.6 Summary
This chapter proposed the definitions of computational stress and
computational observer stress (see especially Figure 3.1). This chapter defines a
foundation for Chapters 4-6. Chapter 4, Chapter 5 and Chapter 6 will present
models of computational observer stress for AVE, VE and RE using the
architecture of the model system and stress data defined in this chapter.

Chapter 3: Computational Observer Stress
76
77
Chapter 4 Modelling Computational
Observer Stress for Abstract Virtual
Environments
This chapter* presents computational models of observer stress for abstract
virtual environments (AVEs). Chapter 1 established that stress is a part of
everyday life and should be controlled and managed. However before these
can be defined and measured objectively, research needs to develop an
objective understanding of how average individuals respond to stress in typical
activities like reading, which is a focus of this chapter. According to our
understanding, the literature has not reported stress analysis for reading, which
further motivates the research in the area. This chapter details a data collection
procedure for conducting a reading experiment for observer stress.
Computational models of observer stress for AVEs are proposed and
developed using the collected observer stress data.
4.1 Data Collection
A reading experiment was conducted to acquire primary stress measures that
consisted of physiological and physical sensor data and human reported data.
The physiological signals obtained comprised of ECG, GSR and BP signals, and
the physical signals were the eye gaze and pupil dilation signals.
Thirty-five undergraduate students were recruited as experiment
participants. The participant cohort was made up of 25 males and 10 females
over the age of 18 years old. The mean age was 19.8 years old with a standard
deviation of 1.6.
* Portions of this chapter have been published in [194-197].

Chapter 4: Modelling Computational Observer Stress for Abstract Virtual
Environments
78
Data was collected from participants in a lab room, which was made up
of two smaller rooms – Acquisition and Inquisition rooms. Each participant sat
in the Inquisition room to have their signals captured during set tasks while the
experiment instructor controlled the data collection and task settings from the
Acquisition room. Before the start of each experiment i.e. data collection
process from one participant, the lab room was set up with the temperature set
at 22°C, Acquisition and Inquisition computers with required applications
started, consent forms and assessment sheets placed at appropriate locations in
the room, and all sensor equipment initialized and ready to be attached to a
participant. The experiment instructor controlled the data acquisition, text that
participants had to read and the room settings of the Inquisition room from the
Acquisition room. The participant read text while their measurements were
recorded in the Inquisition room. A photo of the Inquisition room is presented
in Figure 4.1.
Figure 4.1: The Inquisition room for the reading experiment where experiment
participants did the experiment
LCD
monitor
displaying
text
Eye
tracking
cameras
Blood
pressure
cuff
Disposable
ECG & GSR
electrodes

4.1 Data Collection
79
Each participant had to understand the requirements of the experiment
from a written set of experiment instructions with the guidance of the
experiment instructor before they provided their consent to take part in the
experiment. The experiment information sheet and the consent form are
provided in Appendix A. Afterwards, physiological stress sensors were
attached to the participant and physical stress sensors were calibrated. The
instructor notified the participant to start reading, which triggered a sequence
of text paragraphs. After finishing the reading, participants did an assessment
based on the reading. The assessment questions are provided in Appendix A.
An outline of the process that a participant followed for the experiment is
shown in Figure 4.2.
Figure 4.2: Process followed by participants during the reading experiment for
data collection
1. Study Experiment Requirements
2. Provide Consent
3. Attach Sensors
4. Read Text
5. Do Survey

Chapter 4: Modelling Computational Observer Stress for Abstract Virtual
Environments
80
Each participant had physiological and physical measurements taken
over the 12 minutes reading time period. During the reading period, a
participant read stressed and non-stressed types of text validated by participants.
Stressed text had stressful content in the direction towards distress, fear or
tension. Each participant read three stressed and three non-stressed text. Each
text had approximately 360 words and was displayed on a computer monitor
for participants to read. For consistency, each text was displayed on a
1050 × 1680 pixel Dell monitor, displayed for 60 seconds and positioned at the
same location of the computer screen for each participant. Each line of the
paragraph had 70 characters including spaces. A schematic diagram of the
computer screen is given in Figure 4.3.
Physiological and physical sensor signals were captured from each
participant over the experiment time. The signals captured were GSR, ECG, BP,
eye gaze and pupil dilation signals. Biopac ECG100C, Biopac GSR100C and
Finapres Finger Cuff systems were used to take ECG, GSR and blood pressure
recordings at a sampling rate of 1000 Hz. The Biopac GSR100C system sourced
GSR data through disposable EL507 GSR electrodes, which were placed on the
first (or index) and fourth (ring) fingers of the participant’s left hand. The
sensors had to be attached to the participant 5 minutes before data acquisition
so that appropriate signals could be recorded. For acquiring ECG signals, the
Biopac ECG100C system was connected with disposable EL503 ECG electrodes,
which were placed on the participant’s left and right wrists. Further, the
Finapres Finger Cuff system was attached to the participant’s third (or middle)
finger of the left hand to acquire BP signals. Eye gaze and pupil dilation signals
were obtained using Seeing Machines FaceLAB system with a pair of infrared
cameras at 60 Hz. Unlike the method for capturing physiological signals,
acquisition of eye gaze and pupil dilation signals were not obtrusive because it
captured the signals through visual sensors. A schematic diagram of the
equipment setup for experiment is given in Figure 4.4.

4.1 Data Collection
81
Figure 4.3: The bounding rectangles defined the different regions of the
computer screen to determine a subset of eye gaze features. The bounding
rectangles show regions A (text), B (window), C (screen) and D (controls).
Region A contained the text area where text was displayed to a participant.
Region B is the region without A and regions C and D are defined similarly.
Region D had the application menu-bar and the tool-bar. Note that the diagram
is not drawn to scale.
C
A
B C
D

Chapter 4: Modelling Computational Observer Stress for Abstract Virtual
Environments
82
Figure 4.4: A schematic diagram of the equipment setup for the reading
experiment

4.2 Evaluation of the Environments for Observer Stress
83
4.2 Evaluation of the Environments for Observer Stress
Results from the experiment survey done by participants validated the text
types or classes. This is a common method used in the literature to validate
stress classes for tasks [198]. Participants found the text labelled stressed as more
stressful and text labelled non-stressed not as stressful. This is shown by the
distribution of responses to the survey question on stress provided in Figure 4.5
and with a statistical significance of p < 0.001 according to the Wilcoxon test.
Figure 4.5: A box plot for the distributions of experiment participant responses
to the survey question on “In terms of stress, how would you rate the text?” for
the different types of text
Very Calm
Calm
Somewhat Calm
Neutral
Somewhat Stressful
Stressful
Very Stressful
Stressed Non-StressedText Type
(e)
Re
sp
on
se

Chapter 4: Modelling Computational Observer Stress for Abstract Virtual
Environments
84
4.3 Observer Stress Feature Set
Other stress response signals were derived from the primary stress signals for
stress modelling. These derived signals included the heart rate variability
signal, which is another common signal used for stress detection [31, 106]. HRV
was calculated from consecutive ECG peaks. Other stress response signals that
were derived included the peak voltage difference signals for periodic primary
stress signals (- ECG and pupil dilation), gradient signals of the primary stress
signals and the derived signals.
Features were derived from the primary stress signals as follows. The
signals were segmented into 5 second intervals with an overlap of 50%. Statistic
and measure values of the segments formed the stress feature set. These
statistic values included the mean, standard deviation, kurtosis, skewness,
interquartile range, minimum and maximum. Measures such as the number of
peaks for periodic signals, the distance an eye covered, the number of forward
and backward tracking fixations, and the proportion of the time the eye fixated
on different regions of the computer screen over 5 second intervals were also
obtained. The regions of the computer screen are shown in Figure 4.3. The
feature values were normalized by individual to reduce the effect of individual
bias in generating an individual-independent observer stress recognition
model. There were 215 stress features in total.
4.4 Stress Models for an Observer
The aim for the work in this section is to determine whether an ANN based
model can be developed for an observer to recognise their stress in reading text
with stressful content. This section proposes and tests a variety of ANNs that to
classify stress in reading using a novel set of stress response signals. It also
proposes methods for ANNs to deal with large numbers of features derived

4.4 Stress Models for an Observer
85
from the response signals using a GA based approach. The three different types
of classification models were ANN-AllInputs, ANN-GAInputs and ANN-3Seg-
GAInputs. Each model made use of a different facet of stress feature signals,
from determining features that produced better stress classifications to
exploiting time-varying characteristics for signals.
4.4.1 Computational Stress Classifiers
Three topologies were used to classify stress in reading. For two ANNs, a GA
was used to select stress features, which formed inputs to the ANNs. As a
consequence, the three ANNs differed only on the number of inputs used. The
ANNs were:
ANN-AllInputs: A feed-forward ANN was generated for each
participant. The ANN had 215 inputs, which mirrored the number of
features derived from the primary signals for stress.
ANN-GAInputs: This ANN was similar to ANN-AllInputs but the
number of inputs was based on the features selected by a GA. The GA
selected features to improve the classification rate for stressed and non-
stressed states.
ANN-3Seg-GAInputs: An ANN was generated for each participant with
at most 10 features with 3 sequential time segments for each feature as
inputs to the ANN. Like ANN-GAInputs, the GA selected features to
improve the classification rate for stressed and non-stressed states.
GAs were used to improve stress classification by selecting relevant
features and to leave out corrupted features. For instance, ECG sensors
malfunctioned when acquiring ECG signals for participant with index 19, and
this corrupted corresponding features. This information was recorded during
data acquisition and can also be seen by viewing graphs of raw signals. With a

Chapter 4: Modelling Computational Observer Stress for Abstract Virtual
Environments
86
GA, there is a better chance that the ANN classifiers will not use corrupted
features for developing relationships from features for stress classification.
A reason for selecting fewer features than the total number of features
for ANN-3Seg-GAInputs was to determine whether fewer features can be used
to successfully represent the feature space with a smaller network. In addition,
if all the features were used as inputs then, in total, the number of inputs would
have been 3-fold greater than ANN-AllInputs. Results from ANN-GAInputs
show that all 215 features were not needed for an ANN classification. Using
ANN-GAInputs, it was found that a smaller subset of features can produce a
classification with a better accuracy. This provided another motivation to use
fewer features as inputs in ANN-3Seg-GAInputs.
The data sets for each participant was divided into 3 subsets – training,
validation and test sets – where 50% of the data samples were used for training
the ANN and the rest of the data set was divided equally for validating and
testing the ANN.
MATLAB was used to implement and test the ANNs. The MATLAB
adapt function was used for training the ANN on an incremental basis. Each
network was trained for 1000 epochs using the Levenberg-Marquardt
algorithm. The network had 7 hidden neurons and one neuron in the output
layer. Future work could investigate optimizing the topology of the ANN for
stress classification on the reading data set. The correct classification rates and
the F-Score values were calculated to determine the quality of the classification.
GAs were used to select features in ANN-GAInputs and ANN-3Seg-
GAInputs based on quality measures for stress classification from ANNs. A GA
is a global search technique and has been shown to be useful for optimization
problems. Given a population of subsets of features, the GAs evolved the
feature sets by applying crossover, mutation and selecting feature sets during
each iteration of the search to determine sets of features that produced better
quality ANN classifications based on classification accuracy values using 10-

4.4 Stress Models for an Observer
87
fold cross-validation. The initial population for the GAs was set up to have all
the features. The number of features in the chromosomes varied but the
chromosome length was fixed. The length of a chromosome was equal to the
number of features in the feature space. A chromosome was a binary string
where the index for a bit represented a feature and the bit value indicated
whether the feature was used in the ANN. For ANN-GAInputs, the initial
population had features varying in numbers equally distributed from 1 to 215
features. On the other hand for ANN-3Seg-GAInputs, each chromosome in the
initial population had 5 features with feature values for 3 consecutive time
segments. The other parameters for the GA were set experimentally and are
provided in Table 4.1.
Table 4.1: Implementation settings for the genetic algorithm component in
observer stress modelling systems
GA Parameter Value/Setting
population size 100
number of generations 2000
crossover rate 0.8
mutation rate 1/(length of the chromosome)
crossover type scattered crossover
mutation type uniform mutation
selection type stochastic uniform selection
4.4.2 Performance of the Classifiers
Stressed and non-stressed states for participants were classified using ANN-
AllInputs, ANN-GAInputs and ANN-3Seg-GAInputs. The accuracy values for
the classification were calculated using 10-fold cross validation [183]. The

Chapter 4: Modelling Computational Observer Stress for Abstract Virtual
Environments
88
values are provided in Figure 4.6 for each experiment participant. The best
accuracy values were obtained from ANN-3Seg-GAInputs. The accuracy values
were significantly different for the three ANNs based on the statistical
Student’s T-test (p < 0.01).
Figure 4.6: Observer stress classification performance values obtained for the
stress classifiers using 10-fold cross-validation
ANN-AllInputs performed the worst compared to the other two ANNs.
This shows that the ANN is susceptible to features that were irrelevant and
redundant for stress classification. The performance for ANN-GAInputs, which
was better than ANN-AllInputs, confirmed this. It used features that were
optimised for stress classification. The ANN that exploited the time-varying
nature associated with stress features gave the best stress classification. Results
were significantly better for ANN-3Seg-GAInputs according to the statistical T-
test (p < 0.01). This showed that feature values for stress had information in the
patterns over time. It is a significant observation derived directly from the
ANN result.
0.75
0.8
0.85
0.9
0.95
1
1 2 3 4 5 6 7 8 9 10 11 12 13 14 15 16 17 18 19 20 21 22 23 24 25 26 27 28 29 30 31 32 33 34 35
Acc
ura
cy
Participant Index
ANN-AllInputs ANN-GAInputs ANN-3Seg-GAInputs

4.5 Individual-Independent Stress Models
89
4.5 Individual-Independent Stress Models
The aim for this section is to determine whether stress of observers reading
stressful content can be recognised using individual-independent
computational models. This section proposes ANN and SVM based models for
observer stress recognition. It also investigates the performance of the model
with a GA as a feature selection method and a novel feature selection method,
PISA, which is based on pseudo-independence of features. An analysis of the
classification performances for the proposed classifiers is also presented.
4.5.1 Feature Selection Methods
The large number of features derived from the stress primary signals may have
had redundant data so a feature selection approach based on correlation
coefficients for features was developed to reduce the use of redundant features
to model observer stress. Correlation analysis using correlation coefficients has
been reported to detect some data redundancies as stated in Section 2.12.3.
A correlation coefficient is a measure for the strength of the linear
relationship between features. Consider two features, X and Y, with and
values at time-step t in X and Y respectively, and the means and and
are the standard deviations for X and Y, then the correlation coefficient is
defined by
(17)
The values for fulfill the following equation:
(18)

Chapter 4: Modelling Computational Observer Stress for Abstract Virtual
Environments
90
If = 0, then features X and Y are independent otherwise the features
are correlated. However, stress features may have noise originating from data
collection and the human body. In addition, the definition for independence of
features for stress classification may be too strict. This motivated the use of
different degrees for feature independence. In order to distinguish from
independence defined by the strict criteria, we coin the term pseudo-
independence to mean independence at a certain degree. Suppose the degree of
independence is set at ≤ 0.1 and is found to be 0.05, then features X and
Y are pseudo-independent. On the other hand if is found to be 0.25, then
features X and Y are not pseudo-independent.
The pseudo-independent based feature selection method, pseudo-
independent feature selection algorithm (PISA), was used to select stress features
that was provided as input to a classifier to detect stress patterns. Given a set of
features, each feature was compared with each of the other features to
determine whether they were not pseudo-independent features. Features and
their not pseudo-independent features were found and used to generate a set of
pseudo-independent features for classification. The process by which a set of
pseudo-independent features were obtained was by PISA. PISA is defined in
Figure 4.7.
Given a set of features and a set of features that are not pseudo-
independent to each feature, PISA firstly finds features that are pseudo-
independent to every other feature. Then it selects one feature from a cluster of
not pseudo-independent features. The feature selected from a cluster is based
on its not pseudo-independent features – the number of features and whether
the features have been already selected. Features with a higher number of not
pseudo-independent features have a greater chance of being selected. This
characteristic of PISA minimizes the impact of highly correlated noisy features
on classification.
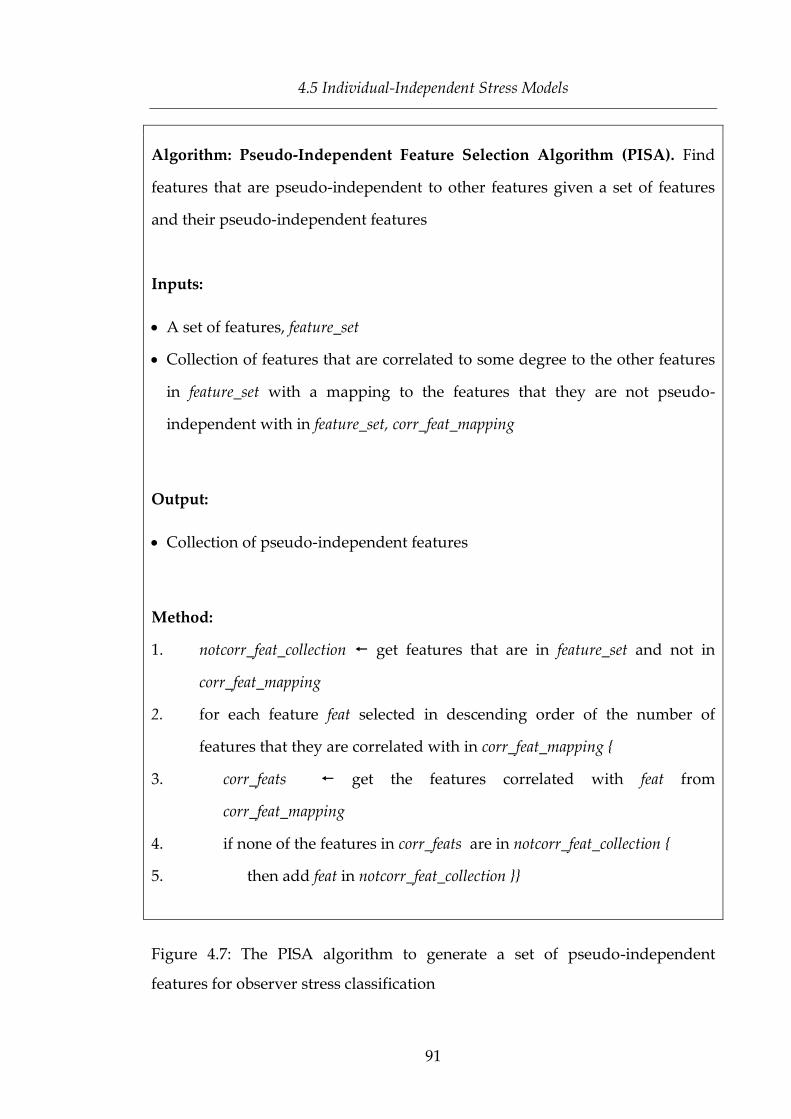
4.5 Individual-Independent Stress Models
91
Algorithm: Pseudo-Independent Feature Selection Algorithm (PISA). Find
features that are pseudo-independent to other features given a set of features
and their pseudo-independent features
Inputs:
A set of features, feature_set
Collection of features that are correlated to some degree to the other features
in feature_set with a mapping to the features that they are not pseudo-
independent with in feature_set, corr_feat_mapping
Output:
Collection of pseudo-independent features
Method:
1. notcorr_feat_collection get features that are in feature_set and not in
corr_feat_mapping
2. for each feature feat selected in descending order of the number of
features that they are correlated with in corr_feat_mapping {
3. corr_feats get the features correlated with feat from
corr_feat_mapping
4. if none of the features in corr_feats are in notcorr_feat_collection {
5. then add feat in notcorr_feat_collection }}
Figure 4.7: The PISA algorithm to generate a set of pseudo-independent
features for observer stress classification

Chapter 4: Modelling Computational Observer Stress for Abstract Virtual
Environments
92
To illustrate PISA, consider an example input set comprising features and
the features that are not pseudo-independent to the features presented in
Figure 4.8. Firstly, PISA determines features that do not have any not pseudo-
independent features. A set {f4} is the result at this point. Now, the rest of the
pseudo-independent features need to be appended to the set. There are
multiple possibilities and they are {f1, f3, f4} and {f2, f4}. After applying the
algorithm the result will be {f2, f4}, which is the smaller feature set of the
multiple feature sets with pseudo-independent features. This approach reduces
the risk of selecting features that were derived from corrupted sensor data and
negatively affect the performance for stress classification. Suppose the feature
set {f1, f2, f3} were derived from corrupted sensor data and if {f1, f3, f4} was
selected as a set of features for classification, then intuitively the possibility of a
classification model to capture better stress patterns would be lower than if {f2,
f4} was chosen instead.
Inputs:
feature_set: {f1, f2, f3, f4}
corr_feat_mapping:
Feature Feature(s) not pseudo-independent to associated feature
f1 {f2}
f2 {f1, f3}
f3 {f2}
Output: {f2, f4}
Figure 4.8: An example to illustrate the inputs and corresponding output for the
PI algorithm presented in Figure 4.7 using a simple set of features

4.5 Individual-Independent Stress Models
93
Another feature selection method used for observer stress classification
was based on a GA. A GA is a global search algorithm that was used to select
features to improve the quality of stress classifications. The GA search evolved
a population of subsets of features using crossover, mutation and selection
operators in search for a population of subsets of features that produced a
better quality stress classification model. A subset of features is referred to as an
individual or chromosome. The quality for each chromosome in the population
was defined by the quality of classifications produced when a classifier was
provided with the features in the chromosome.
The initial population for the GAs had all the features. The number of
features selected in the chromosomes varied but the chromosome length was
fixed. The length of a chromosome was equal to the number of features in the
feature space. A chromosome was a binary string where the index for a bit
represented a feature and the bit value indicated whether the feature was used
in the classification. The parameter settings for the GAs were the same as in
Section 4.4.1 and the implementation settings provided in Table 4.1.
4.5.2 Computational Stress Classifiers
Classification models developed for stress pattern recognition from primary
stress signals were based on an ANN and a SVM. The models were extended to
incorporate feature selection phases either using the PISA or GA methods. Each
classification model was defined to capture individual-independent stress
patterns. The accuracy and F-Score values were calculated for each model to
determine the quality of the classifications.
The stress reading data set was divided into 3 subsets – training,
validation and test sets – where 50% of the data samples were used for training
a classification model and the rest of the data set was divided equally for
validating and testing the model. MATLAB was used to implement and test the
models.

Chapter 4: Modelling Computational Observer Stress for Abstract Virtual
Environments
94
For the ANN based classifier, three topologies were used to classify
observer stress for reading. Each of the ANNs was provided stress features as
inputs based on a selection method. Therefore, the ANNs differed only on the
number of inputs. The ANN based stress classification models were:
ANN: an artificial neural network classification model that was
provided with all the features in the stress feature set as input to
recognize stress patterns
PISA-ANN: ANN with inputs as features produced by PISA
GA-ANN: ANN with inputs as features produced by a GA
The MATLAB adapt function was used for training the ANNs on an
incremental basis. Each network was trained for 1000 epochs using the
Levenberg-Marquardt algorithm. The network had 7 hidden neurons and one
neuron in the output layer.
Hybrids of SVM with PISA or GA were used to deal with ineffective
features for stress modelling and investigate whether the hybrids with feature
selection methods improved the quality of the observer stress classification. The
SVM based observer stress classification models developed were:
SVM: a support vector machine classification model that was provided
with all the features in the stress feature set as input similar to the ANN
PISA-SVM: SVM with inputs as features produced by PISA
GA-SVM: SVM with inputs as features produced by a GA
The architectures for GA-ANN and GA-SVM are shown in Figure 4.9.

4.5 Individual-Independent Stress Models
95
Start
End
Generate the initial population of chromosomes encoding features
by randomly allocating bit values to indices in each chromosome
Calculate the fitness for each chromosome using the features
represented by the chromosome to obtain the classifier’s performance
value for stress classification
Has the generation limit of1000 generations been reached or has the
search converged where the change in fitness of the chromosomes in the populations after each of
the last 10 consecutive generations isbounded by 10-6?
yes
Select the chromosome with the highest fitness
Select parent chromosomes and apply recombination using
scattered crossover
Apply mutation to the offspring chromosomes
Select chromosomes using a stochastic uniform strategy to generate a new population for
the next generation
Calculate the fitness for the offspring chromosomes using
the features represented by the chromosome to obtain the
classifier’s performance value for stress classification
no
Generate features from the primary stress response signals
and assign class labels to training input samples using experiment
survey data
Figure 4.9: The architecture of a hybrid observer stress classification system
defined by a GA and a classifier which was either an ANN or SVM

Chapter 4: Modelling Computational Observer Stress for Abstract Virtual
Environments
96
4.5.3 Performance of the Classifiers
The six ANN and SVM based techniques were implemented and tested on the
data set obtained from the reading experiment for observer stress recognition.
Classification results were obtained using 10-fold cross-validation. The results
are presented in Table 4.2. Classifiers with feature selection methods performed
better than classifiers that used all stress features to model stress patterns. The
hybrid classifiers had correct classification rates and F-score values that were at
least 8% and 12% better respectively. Classifiers with a GA as the feature
selection method produced the highest accuracy with GA-SVM as the best
performing technique.
Table 4.2: Performance measures for observer stress models produced by the
different individual-independent computational models using 10-fold cross-
validation
Classification
Performance
Measure
Type of Stress Classification Model
ANN PISA-
ANN
GA-
ANN SVM
PISA-
SVM
GA-
SVM
Accuracy 0.68 0.76 0.82* 0.67 0.80 0.98
F-score 0.67 0.79 0.82* 0.67 0.79 0.98
Performance measures for the classification techniques show that it was
beneficial to use the feature selection methods to model stress patterns in
reading. The stress features would have had redundant features and PISA
would have reduced it. PISA compared every feature to every other feature in a
pair-wise fashion and took a greedy approach in selecting features. Unlike

4.5 Individual-Independent Stress Models
97
PISA, the GA took a global view of the features and would have managed to
exclude more redundant, irrelevant and corrupted features.
In terms of execution time, the GA based approaches, GA-ANN and GA-
SVM, took longer times than the other techniques to produce solutions. It took
PISA less than one second to select the features for the classification models
whereas the execution times for the GA based approaches were in the order of
hours. Classification without a feature selection method or with PISA took
quite a similar amount of time. Empirical execution times for the different
approaches are shown in Table 4.3.
The execution times for GA based approaches were recorded after the
search reached convergence except for GA-ANN, which took substantially
longer to execute. GA-ANN took at least 3 days and it took the other techniques
not more than a few hours to produce a solution. Therefore, it was not practical
to let the GA-ANN search execute for longer. Table 4.2 and Table 4.3 have a *
with the values to show results at the point when the GA-ANN search was
terminated.
Table 4.3: Relative execution times for the different classification techniques
ANN PISA-
ANN
GA-
ANN SVM
PISA-
SVM
GA-
SVM
Execution time
(minutes) 5.1 5.1 4582* 0.5 0.5 275
Due to the relative long execution times for the GA based approaches to
search for a better stress classification result, other feature selection approaches
should be investigated in the future. With shorter execution times and good
classification performance results for classifiers using PISA, PISA has the
potential to increase the performance for classifications. In future, PISA based

Chapter 4: Modelling Computational Observer Stress for Abstract Virtual
Environments
98
classifiers could be extended to have a more complex definition for pseudo-
independence.
ANN and SVM based classification results using PISA over a range of
degrees of pseudo-independence were also obtained to determine the effect of
the different degrees of pseudo-independence on the classification results. The
results are displayed in graphs shown in Figure 4.10. The graphs show the
accuracy and F-score values along with the number of features for the different
degrees of pseudo-independence. For both, ANN and SVM, the plot for the
classification results show a positive overall rate of change and then it becomes
negative after 0.5 degree of pseudo-independence. The best classification
results are produced when the degree of pseudo-independence is 0.5. At this
degree, every feature is pseudo-independent at the degree of 0.5 to every other
feature in the set of features used as input to develop the ANN and SVM
classification models.

4.5 Individual-Independent Stress Models
99
(a)
(b)
Figure 4.10: Performances for PISA based observer stress classification for
different degrees of pseudo-independence (a) ANN based classification (b)
SVM based classification

Chapter 4: Modelling Computational Observer Stress for Abstract Virtual
Environments
100
4.6 A Stress Model System with Feature and Model
Selection
Large numbers of stress features can be derived from primary stress signals
and it is important to select an appropriate subset of features to model stress
that provides higher quality observer stress recognition results as evident in
Section 4.5. In addition, it is a challenge to select an appropriate computational
classification model with optimal parameters to capture general stress patterns.
The aim of this section is to determine whether stress can be detected from
individual-independent computational classification models with a GA based
optimisation scheme. The GA is used to select appropriate stress features, select
a type of classifier and optimise the classifier’s parameters for observer stress
recognition. The different types of classifiers used are an ANN and a SVM.
4.6.1 A Hybrid Genetic Algorithm Stress Model
The performance of classification models depends on the inputs provided, as
investigated in Sections 2.12.3, 4.4 and 4.5, and also on model parameter
settings. Hybrid GAs have been presented in the literature that selected
features for SVM based classification and optimized SVM parameters for
various applications such as bankruptcy prediction [199], microarray analysis
[200], intrusion detection [201]. GA and ANN hybrid methods with feature
selection and parameter optimization has also been developed (e.g. weight
optimization [202]) including applications in gear fault detection [203] and
retail credit risk assessment [204]. The methods used in the literature used
different applications, different parameters for optimisation and different
features for selection from the ones presented in this thesis.
The type of stress models and parameters for the stress models in the
literature as stated in Section 2.12, were chosen using trial-and-error processes.
4.6 A Stress Model System with Feature and Model Selection
101
In this section, a GA method is proposed that selects a better model for stress
classification and optimises parameters for the models. For reference,
conventional GAs were described in Section 2.12.3. The quality of a
chromosome in the GA in this section was defined by the accuracy, sensitivity,
specificity and the F-score values of the stress classifications derived from the
classifier, its parameters and a subset of stress features encoded by the
chromosome.
A description for an ANN was given in Section 2.12.4. The layers and
neurons in each layer define the topology of a feed-forward ANN. An ANN has
an input layer, may have multiple hidden layers and an output layer. Input
tuples for the ANN are passed through the input layer. Then the weighted links
pass the weighted signals to the neurons in the hidden layers which process the
signals further and then in a similar fashion the signals progress through the
following layers. The processed signals are propagated through the ANN in
this fashion for the signals to reach neurons in the output layer which causes
the ANN to produce the output for the ANN. Essentially, a signal is
propagated through the ANN layer after layer. In addition, the topology of the
ANN can be designed to include a time-delay to exploit the time-varying nature
of the stress features. Choosing the appropriate number of points in time for
stress classification is another task that forms part of the process for designing
the topology. The topology is usually designed by a trial and error process, as it
will in general have an impact on the classification performance. The approach
proposed in this section aims to optimise the topology for stress classification.
Conventional SVMs were described in Section 2.12.5. There are a range of
parameters that need to be chosen to define a SVM. The GA hybrid in this
section focuses on selecting and tuning the kernel function for selecting an
optimal hyper-plane.
With the hundreds of stress features and the numerous options for
settings for the stress classification models, a GA was used to find an optimal
subset of features and search for a classifier that could best capture stress

Chapter 4: Modelling Computational Observer Stress for Abstract Virtual
Environments
102
patterns from the features. Three different GAs, GA-ANN, GA-SVM and GA-
ANN-SVM, were developed for stress classification. They differed in the type
of classification model used to define stress recognition in the search and the
type of chromosome. The chromosomes had components for features and
parameters for classification models. Each type of chromosome was a binary
string and represented the features and the parameters for the classification
model. In the component of the chromosome that encoded the features, the
index for a bit represented a feature and the bit value indicated whether the
feature was used in the classification. For the components that encoded the
parameter value, the binary string was treated as a binary number which was
converted to its equivalent decimal number to extract the value for the
component. The hybrid GAs are defined as follows:
GA-ANN. The GA used an ANN for stress classification. The
chromosome encoded the following components:
Stress features
Number of hidden layers (ANN)
Number of neurons in the first hidden layer (ANN)
Number of neurons in the second hidden layer (ANN)
Number of neurons in the third hidden layer (ANN)
Time-delay (ANN)
GA-SVM. The GA used a SVM for stress classification. The chromosome
encoded the following components:
Stress features
Type of kernel function: The bit value represented polynomial or
Gaussian radial basis function. (SVM)
Type of method: The bit value represented quadratic programming
or sequential minimal optimization method. (SVM)

4.6 A Stress Model System with Feature and Model Selection
103
Degree for the polynomial kernel function (SVM)
Sigma value for the Gaussian radial basis function (SVM)
GA-ANN-SVM. The GA used an ANN or a SVM for stress classification
depending on the value for chromosome component that encoded the
type of classification model. The chromosome in this search is essentially a
chromosome combination made up of the chromosomes in GA-ANN and
GA-SVM and encoded the following components:
Stress features
Type of classification model: the bit value represented ANN or
SVM
Number of hidden layers (ANN)
Number of neurons in the first hidden layer (ANN)
Number of neurons in the second hidden layer (ANN)
Number of neurons in the third hidden layer (ANN)
Time-delay (ANN)
Type of kernel function: The bit value represented polynomial or
Gaussian radial basis function. (SVM)
Type of method: The bit value represented quadratic programming
or sequential minimal optimization method. (SVM)
Degree for the polynomial kernel function (SVM)
Sigma value for the Gaussian radial basis function (SVM)
Some components in the chromosomes for the GA hybrids are analogous
to recessive genes in the biological domain. For GA-ANN, the chromosome
component that provided the value for the number of hidden layers was used
to determine whether the chromosome components that encoded the number
of hidden neurons for each of the hidden layers were needed to be interpreted.
For instance, if the number of hidden layers was interpreted to be 2, then the
components that encoded the number of neurons in the first and second hidden
layers were interpreted to define the ANN for classification and the component
Chapter 4: Modelling Computational Observer Stress for Abstract Virtual
Environments
104
that encoded the number of neurons for the third hidden layer was not used.
Likewise for GA-SVM, the component for the degree for the polynomial
function was interpreted only if the polynomial function was selected as the
kernel function i.e. the value for component that encoded the type of the kernel
function was the polynomial function. Alternatively if the Gaussian radial basis
function was selected, the sigma value for the Gaussian radial basis function
was interpreted to define the SVM. GA-ANN-SVM was implemented in a
similar fashion with the addition of the chromosome component that provided
which type of classifier to use. If ANN was selected, then only the components
that encoded the settings for ANN were interpreted and the components for
SVM settings were not interpreted and similarly if SVM was selected then the
SVM setting components were interpreted and ANN setting components were
not interpreted.
The architecture for the GA hybrid algorithms is shown in Figure 4.11.
The parameter settings in Table 4.1 were used to implement the GA to select an
optimised model and features for observer stress classification.

4.6 A Stress Model System with Feature and Model Selection
105
Start
End
Generate the initial population of chromosomes encoding features
and computational model parameters by randomly
allocating bit values to indices in each chromosome component
Calculate the fitness for each chromosome using the features and the definition for the stress
computational model represented by the chromosome
Generation limit of1000 generations reached or
search converged where the change in quality of the chromosomes in
populations after each of the last 10 consecutive generations is
bounded by 10-6
yes
Select the chromosome with the highest fitness
Select parent chromosomes and apply recombination using
scattered crossover
Apply mutation to the offspring chromosomes
Select chromosomes using a stochastic uniform strategy to
generate a new population for the next generation
Calculate the fitness for the offspring chromosomes using the features and the definition for the
stress computational model represented by the chromosome
no
Figure 4.11: The architecture for the GA hybrid algorithm for observer stress
classification that was used for feature and model selection

Chapter 4: Modelling Computational Observer Stress for Abstract Virtual
Environments
106
4.6.2 Performance of the Hybrid Genetic Algorithm Stress Model
Hybrid GAs were developed and tested on the reading data set for observer
stress classification. The stress classification results achieved by an ANN, SVM
(from Section 4.5) and the different GA hybrids based on ANNs and SVMs are
presented in Table 4.4. For convenience, the results for ANN and SVM were
copied from Table 4.2 to Table 4.4. Ten-fold cross-validation was used to
calculate the performance for the classifications. Overall, the GA hybrids
produced better classification results than methods that did not use a GA to
select appropriate stress features and optimize parameter settings for
classification models to capture stress patterns. GA-SVM and GA-ANN-SVM
produced the best classification results with accuracy values of 98%. It suggests
that this accuracy is the best result achievable for stress classification in reading
based on an ANN or SVM. The accuracy values for GA hybrids were at least
21% greater than the rates produced by classification methods without a GA.
Table 4.4: Performance for observer stress classification models of abstract
virtual environments using 10-fold cross-validation
Classification
Performance
Measure
Type of Stress Classification Model
ANN SVM GA-ANN GA-SVM GA-ANN-
SVM
Accuracy 0.68 0.67 0.89 0.98 0.98
F-score 0.67 0.67 0.87 0.98 0.98
Performance measures for the classification methods show that it was
beneficial to use the feature selection and classifier parameter optimisation
methods in order to develop a classification model that captured observer

4.7 Optimal Time Segments for Stress Detection
107
stress patterns for reading. Using all the features for stress classification, like for
the ANN and the SVM methods, would have included redundant and
irrelevant features which may have outweighed the important features for
observer stress recognition. The GA hybrids reduced the redundant and
irrelevant features to develop stress classifiers.
Execution times were recorded for the methods while they were tested
on the reading data set. The execution times for each method are shown in
Table 4.5. GA-ANN and GA-ANN-SVM took several days to produce a result,
which was a lot longer than the other methods. The execution time for GA-SVM
was in the order of hours.
Table 4.5: Execution times for the stress classification methods
Type of Stress Classification Model
ANN SVM GA-ANN GA-SVM GA-ANN-
SVM
Execution
time (hours) 0.05 0.01 96.03 4.58 45.82
In terms of quality of stress classifications produced and the amount of
time taken to produce a result, GA-SVM performed the best out of all the other
classification methods with the highest accuracy and was not the worst in terms
of the execution time.
4.7 Optimal Time Segments for Stress Detection
Some stress response signals over some time segments may not be relevant for
analysis and modelling due to the lack of data patterns they offer. These signals
could contribute to lower quality stress classification results, inefficient

Chapter 4: Modelling Computational Observer Stress for Abstract Virtual
Environments
108
processing and may impose large demands on storage resources. The work in
this section proposes an approach to search for relevant time segments from
human response signals, particularly physiological and physical signals to
recognise observer stress. This section proposes an approach to determine time
segments that were critical to differentiate the types of text based on stress. A
SVM is used to classify the different types of text based on the features of the
response signals. Further, a SVM and GA hybrid approach is developed to
determine optimal time segments for stress detection (OTSSD). As well as
optimising time segments, the GA also deals with hundreds of stress features
that may have included redundant and irrelevant features.
4.7.1 Motivation for Optimal Time Segment Selection
To determine the state of a person in a given circumstance, human response
signals are captured over some time period. However, the signals over the total
time period may not be necessary for processing to extract patterns for
detecting the state and it may be possible that a smaller segment of the total
time period may contain the data sufficient for analysis and modelling.
Analysis of the smaller segment could result in significant improvement in
efficiency because the effect of irrelevant or redundant data on the analysis will
be reduced.
Several computational techniques already reported in the literature can be
used to select relevant and optimal time segments, but they are not useful for
cases when relationships between the characteristics of signals and their
features characterizing the human state that needs to be identified are not
known. Visual inspection could be used to support selection of a more optimal
time segment as reported in the literature [205]. The visual analysis may be
difficult and could be prone to errors. For a problem like stress recognition,
several response signals need sourcing and analysis. This poses a major

4.7 Optimal Time Segments for Stress Detection
109
technical challenge as little information is available on how the various signal
combinations can be decoded and how the features affect stress recognition.
Feature extraction methods including cluster analysis provide amenable
methods to extract and use optimal patterns from time segments. These time
segments should be optimally selected, and some human intervention may still
be required.
4.7.2 A Genetic Algorithm Based System for Feature and Time
Segment Selection
GAs have been widely used for optimisation problems [206]. Details of a GA
were provided in Section 2.12.3. This work used a GA for stress feature
selection and proposes a GA based approach to find stress episodes in the
reading data set.
A chromosome either represented time segments as candidate stress
episodes, a subset of features from the set of all stress features or a combination
of both. Conventionally, a chromosome has encoding for one type of a solution
e.g. features [168]. For this section, the goal was to find stress episodes and
features over the stress episodes that produced better stress recognition results.
Hybrid chromosomes have been developed and used in the literature as
discussed in Section 4.6. Reportedly, this approach has not been particularly
used for encoding signals and time segment data.
Each chromosome in the hybrid GA was a binary string of fixed length.
For the chromosome that encoded features only, which is denoted by CF, the
chromosome contained information for all the features in the space of all stress
features. The index of the chromosome represented a feature and its value
indicated whether the feature was used in the classification to define the
corresponding model. The length of the chromosome was equal to the number
of stress features. There were three different ways in which time segments were
encoded. A time segment chromosome had one of the following definitions:
Chapter 4: Modelling Computational Observer Stress for Abstract Virtual
Environments
110
CTS. An index of the chromosome represented a time segment of the
total reading time. The value for the index represented whether the
feature values over the corresponding time segment was used in the
classification.
COTS. A chromosome that had overlapping time segments where an
index of the chromosome represented a time segment of the total
reading time. Similar to C-TS, the value for the index represented
whether the feature values over the time segment was used in the
classification.
CTTS. A chromosome that had the start and end times of a time segment.
Stress feature values over the time segment were used in the
classification.
Another type of chromosome was developed that had encodings for
both features and time segments. The classification model was defined by the
feature values during the time segments depicted in the time segment encoding
component of the chromosome. There were three variations for this type of
chromosome and they differed on the time segment encoding component:
CF-TS. A composite structure with encodings for features and time
segments of the total reading time. An index of time segment encoding
component of the chromosome represented a time segment in the total
reading time and its value represented whether the feature values in the
feature encoding component was used in the classification.
CF-OTS. A composite structure with encodings for features and
overlapping time segments of the total reading time. An index of time
segment encoding component of the chromosome represented a time
segment in the total reading time and its value represented whether the

4.7 Optimal Time Segments for Stress Detection
111
feature values in the feature encoding component was used in the
classification.
CF-TTS. A composite structure with encodings for features and start and
end times of a time segment. The definition for time segment encoding
component was based on CTTS. Feature values depicted by the feature
encoding component over the time segment was used in the
classification.
A stress recognition approach consisting of a hybrid of a GA and SVM
was used to determine OTSSD. The GA searched for stress episodes based on
the quality of the stress classifications produced by the SVM given subsets of
stress features and time segments over the reading time. The GA provided a set
of features over GA selected time segments to the SVM to determine the quality
of stress classifications and evolved the set of features and time segments in
search for stress episodes.
To obtain stress classification results from a SVM, the stress reading data
set was divided into 3 subsets – training, validation and test sets – where 50%
of the data samples were used for training the SVM model and the rest of the
data set was divided equally to validate and test the model. MATLAB was used
to implement and test the models. The parameters for the GA implemented
were set as provided in Table 4.1.
4.7.3 Critical Time Segments from the Genetic Algorithm System
The GA-SVM hybrid approach was implemented using each of the different
chromosomes to search for stress episodes in reading. GA-SVMs with CTS, COTS,
CF-TS and CF-OTS were implemented with different time segment intervals. The
interval sizes were chosen based on the time segment size for feature extraction,
which was 5 seconds and detailed earlier in Section 4.3. The GA provided
multiple time segments at the end of the GA search from which the longest

Chapter 4: Modelling Computational Observer Stress for Abstract Virtual
Environments
112
time segment that was defined by the multiple consecutive time segment
intervals was chosen as a stress episode. Results of the GA and SVM approach
using the different types of chromosomes to search for OTSSD are presented in
Table 4.6. The interval length for a time segment in each of the chromosomes
CTS, COTS, CF-TS and CF-OTS is depicted by i seconds in CTS_i, COTS_i, CF-TS_i and CF-
OTS_i respectively.
Table 4.6: Summary of the results obtained for different types of chromosomes
used to find stress episodes in the reading data set. The table shows stress
episodes obtained from the different types of chromosomes and their
performances in stress recognition based on 10-fold cross-validation.
Chromosome
Stress episode
interval
(seconds)
Accuracy F-score
CTS
CTS_60 0-60 0.67 0.67
CTS_30 0-30 0.75 0.72
CTS_20 0-20 0.85 0.86
CTS_15 15-30 0.89 0.88
CTS_10 10-20 0.90 0.89
CTS_5 15-30 0.92 0.90
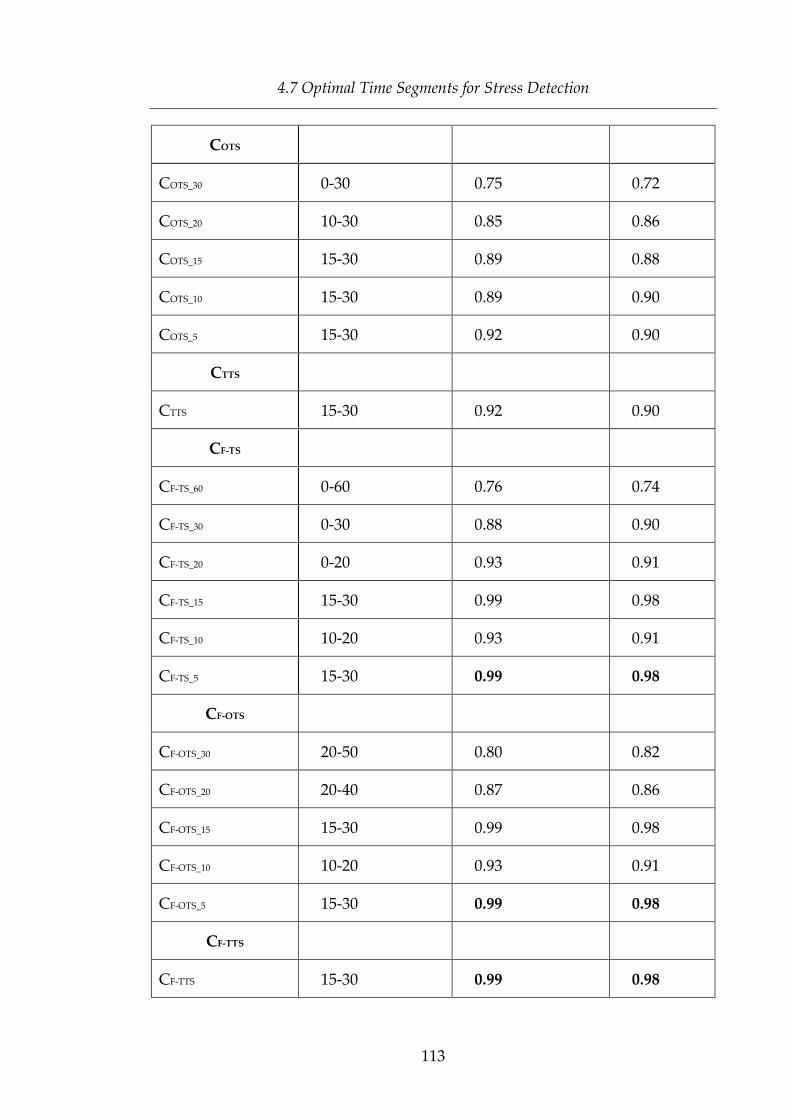
4.7 Optimal Time Segments for Stress Detection
113
COTS
COTS_30 0-30 0.75 0.72
COTS_20 10-30 0.85 0.86
COTS_15 15-30 0.89 0.88
COTS_10 15-30 0.89 0.90
COTS_5 15-30 0.92 0.90
CTTS
CTTS 15-30 0.92 0.90
CF-TS
CF-TS_60 0-60 0.76 0.74
CF-TS_30 0-30 0.88 0.90
CF-TS_20 0-20 0.93 0.91
CF-TS_15 15-30 0.99 0.98
CF-TS_10 10-20 0.93 0.91
CF-TS_5 15-30 0.99 0.98
CF-OTS
CF-OTS_30 20-50 0.80 0.82
CF-OTS_20 20-40 0.87 0.86
CF-OTS_15 15-30 0.99 0.98
CF-OTS_10 10-20 0.93 0.91
CF-OTS_5 15-30 0.99 0.98
CF-TTS
CF-TTS 15-30 0.99 0.98

Chapter 4: Modelling Computational Observer Stress for Abstract Virtual
Environments
114
Participants of the reading experiment were given 60 seconds to read a
text excerpt. Results in Table 4.6 show that stress episodes in the reading data
appeared within a smaller segment of the total reading time in particular, they
appeared around 15-30 seconds. During this time interval, the SVM produced
the highest accuracy values. Figure 4.12 shows the number OTSSD searches
that produced stress episodes during various time intervals of the total reading
time. Each OTSSD search used one type of chromosome listed in Table 4.6. The
distribution of the number of OTSSD searches show that most of the searches
produced stress episodes between 15-30 seconds.
Searches for OTSSD that optimized features produced better accuracy
values than searches with chromosomes that only optimized time segments.
The searches that optimized features had chromosomes that had a feature
encoding component. The average accuracy value for the searches that
optimized features was 0.92 whereas the average accuracy value for the
searches without feature optimization was 0.85. Without feature optimization,
redundant features and features irrelevant to SVM based stress recognition
may have existed. These features were reduced with the use of a GA in search
for OTSSD, which produced a better accuracy. The best accuracy was 99% and
it was produced by the OTSSD search that optimized features and found a
stress episode during the 15-30 reading time interval.
OTSSD searches with chromosomes with time segment intervals that
evolved the start and end times of the time segment interval and time segments
with relatively short time intervals, in particular 5 seconds, found stress
episodes with higher accuracy. Using chromosomes CTTS and CF-TTS in the
search that evolved the start and end times for candidate stress episodes
provided more flexibility in the search for OTSSD because the search space was
less constrained. Chromosomes with time segments that had 5 second intervals
also had similar characteristics. On the other hand, the design for other
chromosomes made it difficult or impossible for the OTSSD search to find
stress episodes with higher accuracy.

4.7 Optimal Time Segments for Stress Detection
115
(a)
(b) (c)
Figure 4.12: Distribution for the stress episodes produced by OTSSD searches
where each search used one type of chromosome in Table 4.6 over the reading
time. Frequency of the OTSSD searches that produced stress episodes within
various time intervals: (a) 5 seconds (b) 10 seconds starting from 0 seconds and
(c) 10 seconds starting from 5 second.

Chapter 4: Modelling Computational Observer Stress for Abstract Virtual
Environments
116
To relate the time interval for stress episodes found by the OTSSD
searches to an average reading excerpt in the experiment, average eye fixations
of participants in relation to the reading display during the reading time are
presented in Figure 4.13. According to the stress episode for reading,
participants read approximately a third of the text before the start of the stress
episode. They read over half of the text in total by the end of the stress episode.
Investigation of the content of a text excerpt with division of text by content
and its relationship with stress was beyond the scope for this work. Future
research could investigate what divisions of a text excerpt caused stress
episodes.
Figure 4.13: Average eye fixation coordinates of experiment participants
reading a text excerpt over different time intervals of the total reading time
0-15 seconds
15-30 seconds
30-60 seconds
4.8 Summary
117
4.8 Summary
In this chapter, details were presented for the experiment that was conducted to
collect a real-life observer stress data set for AVE and the various
computational models developed for observer stress in AVE. Models proposed
were successfully developed for individual observers and models that captured
stress patterns across the observers were also developed. The modelling
systems that had a feature selection component produced better quality
observer stress classification results. Classification results were obtained from
SVM and ANN based classifiers and features were selected using a GA based
approach. Results show that model using features optimised by GAs helped to
select salient features for stress classification, dealt with irrelevant, redundant
and corrupted features, and provided better classifications than the models that
did not use feature selection. A GA based modelling system that selected an
appropriate set of features and a classifier with optimised parameter settings
was successfully developed as well.
A feature selection method based on correlation analysis was developed
and compared with the GA based feature selection method on classification
results. The correlation analysis based feature selection method produced better
quality classification results than models without feature selection, but
produced worse results than GA based models. On the other hand, the GA
based models required longer execution times but the correlation based feature
selection method hardly had any impact on the execution time.
A computational approach for optimal time segments for stress detection
(OTSSD) was developed to determine optimal time segments, or stress
episodes, with the aim of obtaining better stress classification results. The
corresponding model also optimised stress features. A GA and SVM based
hybrid technique was developed where the GA searched for stress episodes
and optimised stress features based on the classification results produced by
the SVM.

Chapter 4: Modelling Computational Observer Stress for Abstract Virtual
Environments
118
From the different types of models developed in this chapter, the GA
and SVM hybrid model produced the best stress classification results. In
particular, the model that optimised stress features and time segments
produced the best results. As a consequence, the GA and SVM hybrid model
will be used to model observer stress for virtual environments and real
environments.
In summary, the research contributions of this chapter are:
A real-world stress data set for observer stress for AVE;
Stress analysis from a novel set of primary stress signals;
Computational models for an observer stress for AVE;
Individual-independent computational models for observer stress for
AVE; and
A novel method for optimising time segments for stress detection.

119
Chapter 5 Modelling Computational
Observer Stress for Virtual Environments
This chapter* proposes computational models of observer stress for virtual
environments (VEs). The models for VEs use the definition of observer stress
and the architecture of the observer stress model presented in Chapter 3. This
chapter details the experiments designed and conducted to obtain observer
stress data sets for VEs for the computational models. It also presents an
investigation for modelling stress with primary stress signals sourced by
contact sensors and non-obtrusive sensors and provides an analysis of the
results.
5.1 Data Collection
Two experiments were conducted to collect primary stress signals of observers
of virtual environments. One of the experiments was similar to the experiment
for stress data collection for AVE presented in Section 4.1 because it acquired
ECG, GSR, BP, eye gaze and pupil dilation signals. The experiment for VE also
acquired EEG signals. The other experiment conducted for VE captured videos
in visible and thermal spectrums, EEG, GSR, eye gaze and pupil dilation signals
using non-obtrusive methods, unlike the experiment that used contact sensors
for data acquisition. These sensors need to be attached to an individual at
particular regions of the body and the person has to minimise their movement
during data acquisition. The contact sensors had a higher sampling rate than
the non-obtrusive sensors. The two experiments were similar in that they both
had the same virtual environments and that EEG, eye gaze and pupil dilation
signals were acquired using the same equipment.
* Portions of this chapter have been published in [207, 208].

Chapter 5: Modelling Computational Observer Stress for Virtual Environments
120
5.1.1 Data Collection Using Contact Sensors
Twenty five undergraduate students were recruited as experiment participants.
The participant cohort was made up of 15 males and 10 females between the
ages of 18 and 30 years. The mean age was 24.3 years old with a standard
deviation of 2.2.
Similar to the experiment detailed in Section 4.1, before the start of each
experiment, the lab room was set up with the temperature set at 22°C,
Acquisition and Inquisition computers with required applications started,
consent forms and assessment sheets placed at appropriate locations in the
room, and all sensor equipment initialized and ready to be attached to a
participant. The lab room is made up of two smaller rooms – Acquisition and
Inquisition rooms. The experiment instructor controlled the data acquisition,
films that participants watched and the room settings of the Inquisition room
from the Acquisition room. The participant watched the film clips and had their
measurements recorded in the Inquisition room.
The process of the experiment followed by the participant was also similar
to the experiment in Section 4.1. Each participant had to understand the
requirements of the experiment from a written set of experiment instructions
and what was involved in the experiment with the guidance of the experiment
instructor. The experiment information sheet and the consent form are
provided in Appendix B. After providing their consent to participate in the
experiment, the experiment instructor attached ECG, GSR, BP and EEG sensors
to the participant and calibrated the eye tracking sensors. The participant was
seated in front of a TFT-LCD display screen, which was placed between two
speakers of the surround sound system. The distance between the screen and
subject was in the range between 70 and 90 cm. The instructor started the films,
which triggered a blank screen with a countdown of the numbers “3”, “2” and
“1” transitioning in and out slowly, one after the other. The reason for the
countdown display and the blank screen was for participants to move away

5.1 Data Collection
121
from their thoughts at the time and get ready to pay attention to the films that
were about to start. This approach was used in experiments for similar work
done in the literature [209]. Subsequent to the countdown display, a blank
screen was shown for 15 seconds, which was followed by a sequence of film
clips with 5 second blank screens in between. The film clips were made up of
stressed and non-stressed films and each film was approximately one minute in
length. After the films finished, the participant was asked to do an assessment
on the films to validate the film labels. The assessment questions are given in
Appendix B. In total, the experiment took approximately thirty minutes.
Film clips were categorized by the type of environment they created.
Stressed films had stressful content in the direction towards distress, fear and
tension whereas the non-stressed films had content that created an illusion of
meditation or soothing environments. There were three stressed films and three
non-stressed films. For consistency, the films were displayed on a 1050 x 1680
pixel LCD Dell monitor and positioned at the same location of the computer
screen with a surround sound system for each participant.
Primary stress signals were captured using the same method and
equipment detailed in Section 4.1. Additionally, EEG signals from the Emotiv
EPOC device was obtained as well. The signals were captured at a sampling
rate of 128 Hz.
A schematic diagram of the equipment setup for the film experiment is
provided in Figure 5.1. The experiment instructor controlled the film clips that
the experiment participant watched from the Acquisition computer. The
computer was also used to control the participant’s response signal acquisition
and synchronize the signals while the films were shown to the participant.
Acquisition software applications for eye tracking and EEG signals required
relatively greater amounts of computer memory and processing. In order to
ensure that it did not affect the acquisition of the other signals, there was a
computer designated for eye tracking signal acquisition and another computer
for EEG signals.
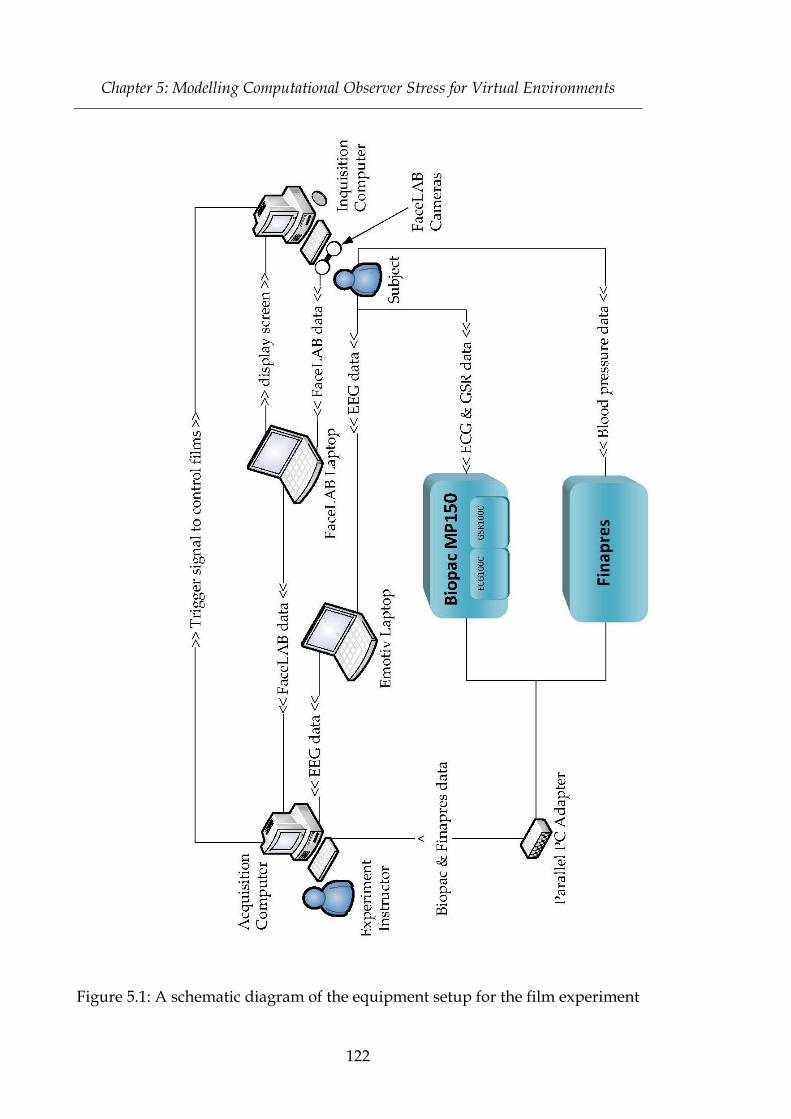
Chapter 5: Modelling Computational Observer Stress for Virtual Environments
122
Figure 5.1: A schematic diagram of the equipment setup for the film experiment
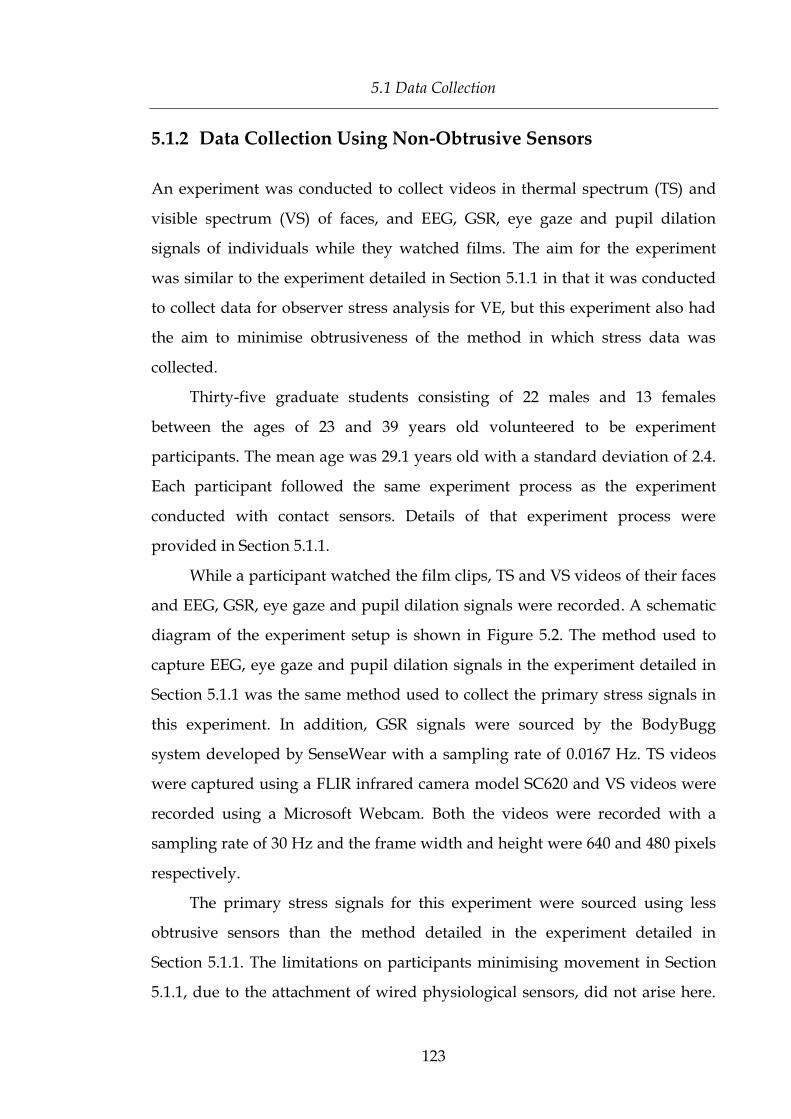
5.1 Data Collection
123
5.1.2 Data Collection Using Non-Obtrusive Sensors
An experiment was conducted to collect videos in thermal spectrum (TS) and
visible spectrum (VS) of faces, and EEG, GSR, eye gaze and pupil dilation
signals of individuals while they watched films. The aim for the experiment
was similar to the experiment detailed in Section 5.1.1 in that it was conducted
to collect data for observer stress analysis for VE, but this experiment also had
the aim to minimise obtrusiveness of the method in which stress data was
collected.
Thirty-five graduate students consisting of 22 males and 13 females
between the ages of 23 and 39 years old volunteered to be experiment
participants. The mean age was 29.1 years old with a standard deviation of 2.4.
Each participant followed the same experiment process as the experiment
conducted with contact sensors. Details of that experiment process were
provided in Section 5.1.1.
While a participant watched the film clips, TS and VS videos of their faces
and EEG, GSR, eye gaze and pupil dilation signals were recorded. A schematic
diagram of the experiment setup is shown in Figure 5.2. The method used to
capture EEG, eye gaze and pupil dilation signals in the experiment detailed in
Section 5.1.1 was the same method used to collect the primary stress signals in
this experiment. In addition, GSR signals were sourced by the BodyBugg
system developed by SenseWear with a sampling rate of 0.0167 Hz. TS videos
were captured using a FLIR infrared camera model SC620 and VS videos were
recorded using a Microsoft Webcam. Both the videos were recorded with a
sampling rate of 30 Hz and the frame width and height were 640 and 480 pixels
respectively.
The primary stress signals for this experiment were sourced using less
obtrusive sensors than the method detailed in the experiment detailed in
Section 5.1.1. The limitations on participants minimising movement in Section
5.1.1, due to the attachment of wired physiological sensors, did not arise here.

Chapter 5: Modelling Computational Observer Stress for Virtual Environments
124
In this experiment, the only sensors that needed to be attached to the
participant were the Emotiv EPOC headset, which is a headband, and the
BodyBugg armband. These systems were wireless.
Figure 5.2: Setup for the film experiment to collect facial video data in thermal
and visible spectrums, and EEG, GSR, eye gaze and pupil dilation signals
For each participant, a TS and VS video was recorded for each film they
watched. As a consequence, a participant had six video clips made up of three
stressed videos and three not-stressed videos. Note the usage of the terms film
and video. The term, film, is used to refer to a virtual environment or video
showing some content, colloquially called a “film” or “movie”, which a
participant watched during the experiment. The term, video, is used to refer to a
visual recording of a participant’s face and its movement during the time
period while they watched a film. Thus in this thesis, a film is a virtual
environment which is watched, whereas a video is a recording of the observer
participating in an experiment, who may be watching a film.
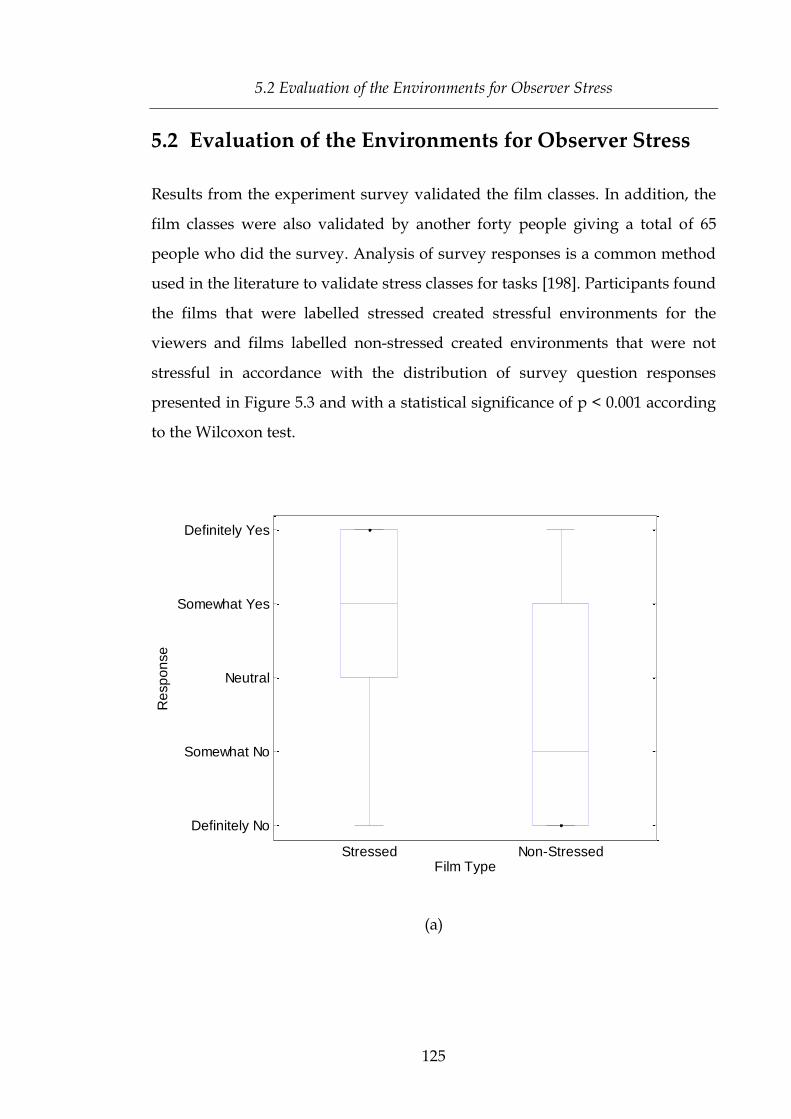
5.2 Evaluation of the Environments for Observer Stress
125
5.2 Evaluation of the Environments for Observer Stress
Results from the experiment survey validated the film classes. In addition, the
film classes were also validated by another forty people giving a total of 65
people who did the survey. Analysis of survey responses is a common method
used in the literature to validate stress classes for tasks [198]. Participants found
the films that were labelled stressed created stressful environments for the
viewers and films labelled non-stressed created environments that were not
stressful in accordance with the distribution of survey question responses
presented in Figure 5.3 and with a statistical significance of p < 0.001 according
to the Wilcoxon test.
(a)
Definitely No
Somewhat No
Neutral
Somewhat Yes
Definitely Yes
Stressed Non-StressedFilm Type
(a)
Re
sp
on
se

Chapter 5: Modelling Computational Observer Stress for Virtual Environments
126
(b)
(c)
Definitely No
Somewhat No
Neutral
Somewhat Yes
Definitely Yes
Stressed Non-StressedFilm Type
(b)
Re
sp
on
se
Very Relaxed
Relaxed
Somewhat Relaxed
Neutral
Somewhat Tensed
Tensed
Stressed Non-StressedFilm Type
(c)
Re
sp
on
se

5.2 Evaluation of the Environments for Observer Stress
127
(d)
Figure 5.3: Box plots for distributions of experiment participant responses to the
survey questions for the different types of films. The box plots show responses
to questions: (a) Do you want to watch more of the film? (b) Can the film help
you unwind after a busy day? (c) How did you feel while watching the film? (d)
In terms of stress, how would you rate the film?
A breakdown of the results from the Wilcoxon statistical test for the difference
in survey responses for stressed and non-stressed types of films for each survey
question is presented in Table 5.1. Participants provided responses to survey
questions for stressed and non-stressed types of films and the responses
showed that the different types of films were statistically significantly on all
questions apart from question (b) can the film help you unwind after a busy
day? Several participants wrote comments in the Other Comments section of
Very Calm
Calm
Somewhat Calm
Neutral
Somewhat Stressful
Stressful
Stressed Non-StressedFilm Type
(d)R
esp
on
se

Chapter 5: Modelling Computational Observer Stress for Virtual Environments
128
the survey mentioning that the non-stressed films were boring and such films
would not help them unwind after a busy day. These participants indicated in
their responses that the stressed films would help them unwind after a busy
day. It may have been that they usually watched stressed films to submerge
their emotions and intellect in the events of stressed virtual environments to
unwind after their busy day. In addition, the definition of a busy day for a
participant may vary across participants. For some participants, a busy day
may mean an emotional and intellectually draining day but for others it could
mean a physical draining day. Since this question was ambiguous for validating
the film labels it was not considered further.
Table 5.1: Results from the Wilcoxon statistical test on experiment survey
responses for stressed and non-stressed types of films
Survey Question p-value Statistic derived from the
Wilcoxon Statistical Test for Stressed
and Non-Stressed Film Types
(a) Do you want to watch more of the
film?
p < 0.001
(b) Can the film help you unwind after
a busy day?
0.05 < p < 0.1
(c) How did you feel while watching
the film?
p < 0.001
(d) In terms of stress, how would you
rate the film?
p < 0.001

5.3 Observer Stress Feature Set
129
5.3 Observer Stress Feature Set
A feature set was developed from the primary stress signals obtained from the
experiments. Features from ECG, GSR, BP, eye gaze and pupil dilation signals
were obtained using the method that was implemented to extract features from
the primary stress signals for observers in AVE. Refer to Section 4.3 for details
for the feature extraction from the primary stress signals. Features derived from
EEG signals included statistic features of signals in different frequency bands
and measurements for Hjorth parameters and fractal dimensions. Definitions
for EEG frequency bands, Hjorth parameters and fractal dimensions were
provided in Section 2.6.3.
Facial regions in VS videos were detected using the Viola-Jones face
detector. Due to the different nature of TS videos from VS videos, the Viola-
Jones algorithm was not appropriate for extracting facial regions, so a face
detection method based on eye coordinates [210, 211] and a template matching
algorithm was used. A template of a facial region was developed from the first
frame of a TS video. The facial region was extracted using the Pretty Helpful
Development Functions toolbox for Face Recognition [210-212], which
calculated the intraocular displacement to detect a facial region in an image.
This facial region formed a template for facial regions in each video frame of the
TS videos, which were extracted using MATLAB’s Template Matcher system
[213]. The Template Matcher was set to search the minimum difference pixel by
pixel to find the area of the frame that best matched the template. Examples of
facial regions that were detected in the VS and TS videos for a participant are
presented in Figure 5.5.

Chapter 5: Modelling Computational Observer Stress for Virtual Environments
130
(a)(i) (b)(i)
(a)(ii) (b)(ii)
Figure 5.4: Examples of facial regions extracted from VS and TS videos. The
facial regions are of an experiment participant watching the different types of
film clips. (a) The participant was watching a not-stressed film clip. (b) The
participant was watching a stressed film clip. (i) A frame in the visual spectrum.
(ii) The corresponding frame in the thermal spectrum. The crosshairs in the
thermal frame were added by the recording software and represents the camera
auto-focus.
Facial regions were extracted from each frame of a VS video and its
corresponding TS video. Grouped and arranged in order of time of appearance
in a video, the facial regions formed volumes of the facial region frames.
Examples of facial blocks in TS and VS are shown in Figure 5.5.
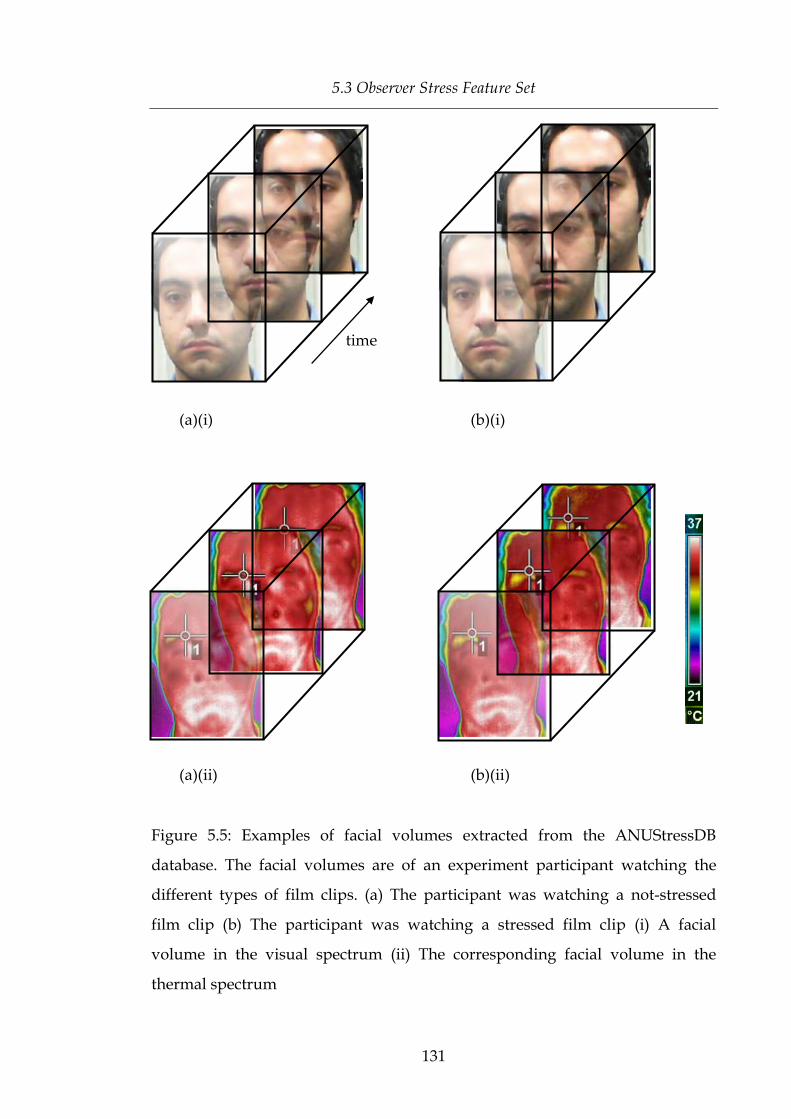
5.3 Observer Stress Feature Set
131
(a)(i) (b)(i)
(a)(ii) (b)(ii)
Figure 5.5: Examples of facial volumes extracted from the ANUStressDB
database. The facial volumes are of an experiment participant watching the
different types of film clips. (a) The participant was watching a not-stressed
film clip (b) The participant was watching a stressed film clip (i) A facial
volume in the visual spectrum (ii) The corresponding facial volume in the
thermal spectrum
time

Chapter 5: Modelling Computational Observer Stress for Virtual Environments
132
The literature claims that features from segmented image blocks of a
facial image region can provide more information than features directly
extracted from an image of a full facial region in VS [214]. Examples of full
facial regions are shown in Figure 5.5 and blocks of a full facial region are
presented in Figure 5.6. To illustrate the claim, features from each of the blocks
used in conjunction with features from the other blocks in Figure 5.6(i) can offer
more information than features obtained from Figure 5.5(a)(i). The claim aligns
with the results from classifying stress based on facial thermal characteristics
[215]. As a consequence, the facial regions in this work were segmented into a
grid of 3 × 3 blocks for each video segment, or facial volume, forming 3 × 3
blocks. A block has X, Y and T components where X, Y and T represent the
width, height and time components of an image sequence, respectively. Each
block represented a division of a full facial block region or facial volume. LBP-
TOP features were calculated for each block.
(i)
(ii)
Figure 5.6: The facial region in Figure 5.5(a) segmented into 3 × 3 blocks
(i) Blocks of the frame in the visual spectrum (ii) Blocks of the corresponding
frame in the thermal spectrum

5.3 Observer Stress Feature Set
133
LBP-TOP is the temporal variant of local binary patterns (LBP). In LBP-
TOP, LBP is applied to three planes, XY, XT and YT planes to describe the
appearance of an image, horizontal motion and vertical motion respectively.
For a centre pixel Op of an orthogonal plane O and its neighbouring pixels Ni, a
decimal value is assigned to it:
(19)
According to a study that investigated facial expression recognition
using LBP-TOP features, VS and near-infrared images produced similar facial
expression recognition rates, provided that VS images had strong illumination
[216]. LBP-TOP features have been mainly extracted from image sequences of
people told to show some facial expression, which is not like the image
sequences obtained from our film experiment. In our film experiment,
participants watched films and involuntary facial expressions were captured.
The recordings may have more subtle facial expressions of the kind of facial
expressions analysed in the literature using LBP-TOP. In addition, it is not
known in the literature whether LBP-TOP is able to capture necessary patterns
as effectively from TS images as VS images [217]. With the subtleness in facial
movement and the different nature of TS images to VS images, it is possible that
LBP-TOP may not be able to offer as much information for stress analysis.
These points motivate the development of a new set of features that exploits
thermal patterns in TS videos for stress recognition. This thesis proposes a new
type of feature for TS videos that captures dynamic thermal patterns in
histograms (HDTP). This feature makes use of thermal data in each frame of a
TS video of a face over the course of the video.
HDTP captures normalized dynamic thermal patterns, which enables
individual-independent stress analysis. Some people may be more tolerant to
some stressors than others [218, 219]. This could mean that some people may

Chapter 5: Modelling Computational Observer Stress for Virtual Environments
134
show higher degree responses to stress than others. Additionally in general, the
baseline for human response can vary from person to person. To consider these
characteristics in features used for individual-independent stress analysis, ways
have been developed to normalize data for each participant for their type of
data [17]. HDTP is defined in terms of a participant’s overall thermal state to
minimize individual bias in stress analysis.
A HDTP feature is calculated for each facial block region. Firstly, a
statistic (consider the standard deviation) is calculated for each facial region
frame for a participant for a particular block (e.g. facial block region situated at
the top right corner of the facial region in the XY plane) for all the videos. The
statistic values from all these frames are partitioned to define empty bins. A bin
has a continuous value range with a location defined from the statistic values.
The bins are used to partition statistic values for each facial block region where
the value for each bin is the frequency of statistic values in the block that falls
within the bounds of the bin range. Consequently, a histogram for each block
can be formed from the frequencies. An algorithm presenting the approach for
developing histograms of dynamic thermal patterns in thermal videos for a
participant who has a set of facial videos is provided in Figure 5.7.
Algorithm: HDTP. Find histograms that capture normalized dynamic thermal
patterns in thermal videos for a participant
Inputs:
p, a participant video data set that represents a set of all videos watched by
the participant
F, a function that calculates a statistic for a two dimensional matrix
Output:
H, a set of histograms for p based on values obtained by F

5.3 Observer Stress Feature Set
135
Method:
1. for each video v(p)
2. for each block location loc(p)
3. for each facial block region b(v,loc)
4. for each frame f(b)
5. svbf F(f(b))
6. end for
7. end for
8. end for
9. end for
10. for each block location loc(p)
11. for each facial block region b(loc)
12. bin_width(b) calculate_bin_width(b)
13. bin_locs(b) calculate_bin_locations(bin_width(b))
14. end for
15. end for
16. for each video v(p)
17. for each block location loc(p)
18. for each facial block region b(v,loc)
19. h partition_data(b, bin_locs(b))
20. end for
21. end for
22. end for
Figure 5.7: The HDTP algorithm captures dynamic thermal patterns in
histograms from thermal image sequences

Chapter 5: Modelling Computational Observer Stress for Virtual Environments
136
As an illustration, consider that the statistic used is the standard deviation
and the facial block region for which we want to develop a histogram is
situated at the top right corner of the facial region in the XY plane (FBR1) for
video V1 when a participant Pi was watching film F1. In order to create a
histogram, the bin locations and sizes need to be calculated. To do this, the
standard deviation needs to be calculated for all frames in FBR1 in all videos
(V1-12) for Pi. This will give standard deviation values from which the global
minimum and maximum can be obtained and used to calculate the bin location
and sizes. Then, the histogram for FBR1, for V1, for Pi, is calculated by filling the
bins with the standard deviation values for each frame in FBR1. This method
then provides normalised features that also take into account the image and
motion, and can be used as inputs to a classifier.
5.4 Observer Stress Models Using Stress Response
Signals Sourced by Contact Sensors
The main aim for the work in this section is to determine whether observer
stress for VE could be recognised using individual-independent computational
models from sensor based stress response signals. ECG, EEG, GSR, BP, eye gaze
and pupil dilation signals are used. EEG signals were acquired using a
consumer sensor device, so another aim is to determine whether the consumer
sensor device can be used to source EEG signals for stress recognition.
EEG signals are generally captured by equipment that is obtrusive and
requires a relatively higher degree of intrusion (e.g. EEG sensors with electrical
conductivity gel needs to be attached to particular positions of a subject’s head),
relatively long set up time and experimenters that are experienced with the use
of the equipment. These factors contribute to lower number of participants in
experiments recording EEG signals in Human Centered Computing
experiments and motivated us to use the Emotiv EPOC consumer device.
Emotiv is portable, nonintrusive, easier to use and cheaper – the Emotiv

5.4 Observer Stress Models Using Stress Response Signals Sourced by Contact Sensors
137
headset with EEG sensors (and costs approximately $300 USD). Unlike
conventional EEG recording equipment, which has multiple wires that needs to
be managed, Emotiv is wireless. However, Emotiv has fewer sensors (14
channels) and a lower sampling rate (128 Hz) than the conventional EEG
recording equipment which can have from 32 to 256 sensors and a sampling
rate of at least 240 Hz to 16,000 Hz [220, 221].
5.4.1 Stress Classification Systems
The stress classification models were based on a SVM and an ANN. A GA and
SVM hybrid (GA-SVM) and a GA and ANN hybrid (GA-ANN) models were
also developed with the aim to use features, which were more relevant for
stress recognition and reduce feature redundancy to optimise stress
classification. The GA based models were motivated from the performance of
the models with optimisation for abstract virtual environments in Chapter 4,
which reported that GA based models produced more superior stress models
compared to stress models based on correlation methods. The architecture for
the SVM, ANN, GA-SVM and GA-ANN systems were defined as in Section
4.5.2. Feature values derived from ECG, EEG, GSR, BP, eye gaze and pupil
dilation signals were provided as input to the classification systems.
5.4.2 Performance of the Classification Systems
The computational classification models were tested on the stress data obtained
from the experiment that used contact sensors to collect primary stress signals.
Feature values derived from the primary stress signals were provided to the
SVM, ANN, GA-SVM and GA-ANN classification systems. The feature values
were normalized by participant to reduce the effect of individual bias.
Performances of the classifications produced the classification systems were

Chapter 5: Modelling Computational Observer Stress for Virtual Environments
138
calculated using 10-fold cross validation. The classification results are provided
in Table 5.2.
Table 5.2: Performance measures for observer stress models for virtual
environments defined from primary stress signals using 10-fold cross
validation
Classification
Performance
Measure
Type of Stress Classification Model
SVM ANN GA-SVM GA-ANN
Accuracy 0.67 0.68 0.94 0.95
F-score 0.66 0.70 0.94 0.94
Stress patterns in the film data set were best recognized with the GA
hybrids according to the measures for stress classification. When the
classification model systems were provided all the features derived from the
primary stress signals, the correct classification rates and the F-score were at
least 0.24 lower than systems with the GA feature selection. Classification
results show that the performances of SVM and ANN were similar. Similarly,
the performances of GA-SVM and GA-ANN in stress classification were
similar.
The stress feature values provided to SVM and ANN included
redundant and irrelevant features which outweighed the more effective
features showing stress patterns. However, the GA based models optimised the
features and produced models that captured more general stress patterns. Thus,
the GA based methods produced higher accuracy values.
The GA in the GA hybrid classification systems selected ECG features for
measurements of the LF and HF frequency bands, gradients, rate of change,
mean and variance for GSR, ECG and BP, rate of change of the distance covered

5.4 Observer Stress Models Using Stress Response Signals Sourced by Contact Sensors
139
by eye gazes calculated by eye fixations, and the rate of change of the diameter
size of the eye pupil. This feature subset had stress data on how the experiment
participants reacted to the different films and provided improved capability for
the classification systems to capture better stress patterns in the film experiment
data set and recognize stress better.
Further, EEG features were provided as input to the SVM, ANN, GA-
SVM and GA-ANN classification systems as well. The classification results
based on 10-fold cross validation are shown in Table 5.3.
Table 5.3: Performance measures for stress classification models defined from
EEG signals of observers of virtual environments using 10-fold cross validation
Classification
Performance
Measure
Type of Stress Classification Model
SVM ANN GA-SVM GA-ANN
Accuracy 0.64 0.70 0.89 0.91
F-score 0.63 0.73 0.91 0.90
Like the performance of the classification systems on the primary stress
signals, GA hybrids produced better accuracy and F-score values than the
systems that used all features to develop a model. This shows that the GA
hybrids captured stronger stress patterns in their models. The accuracy values
for the systems without the GA was at least 0.16 lower than the GA hybrid
systems. In addition, SVM and ANN produced similar accuracy values and the
GA hybrids produced classifications with similar accuracy values.
The GAs selected measures for EEG fractal dimensions, and variance,
mean and skewness features of the EEG signals and signals in the Beta and
Alpha frequency bands for stress classification. The features selected by the
GAs had stronger relationship with stress and enabled the classifiers in the

Chapter 5: Modelling Computational Observer Stress for Virtual Environments
140
classification system to better capture stress patterns in the film experiment
EEG data set.
Statistical analyses were conducted on the results and in accordance with
the Student’s T-test the GA hybrid systems produced significantly better
accuracy values than the systems without the GA with p < 0.01. Analysis of the
accuracy values produced by systems on the feature sets derived from primary
stress signals and the EEG signals showed no statistical difference for the two
feature sets (p > 0.1). This suggests that the EEG Emotiv system has the
capability to capture stress signals and has the potential to be used for stress
recognition in environments where intrusion needs to be minimized for easier
stress data acquisition.
5.5 Observer Stress Models Using Thermal Facial
Patterns
This section investigates whether signals sourced by non-obtrusive sensors can
be used to model stress. As an initial step in computer vision based stress
detection, the work in this section aims to determine whether a stress
classification system for an observer of VE can be developed using data from
VS and TS videos.
5.5.1 Stress Classification Systems
The stress classification systems developed were based on either a SVM only or
a hybrid of a GA and a SVM (GA-SVM). SVMs have been widely used in the
literature to develop models for facial expression recognition [216, 222, 223].
Details of conventional SVMs were provided in Section 2.12.5.
It has been reported in the literature that thermal patterns for certain
regions of a face provide more information for stress than other regions [215].
The performance of the stress classifier can degrade if irrelevant features are

5.5 Observer Stress Models Using Thermal Facial Patterns
141
provided as inputs. As a consequence and due to its benefits noted in the
literature, the classification system was extended to include a feature selection
component, which used a GA to select facial block regions appropriate for the
stress classification. GAs are inspired by biological evolution and the concept of
survival of the fittest. A GA is a global search technique and has been shown to
be useful for optimization problems and problems concerning optimal feature
selection for classification [224].
Given a population of subsets of facial block regions with corresponding
features, a GA was defined to evolve sets of blocks by applying crossover and
mutation operations for diversity in the search, and selecting block sets during
each iteration of the search to determine sets of blocks that produce better
quality SVM classifications. Each block set was represented by a binary fixed-
length chromosome where an index or locus symbolized a facial block region,
its value or allele depicted whether or not the block was used in the
classification and the length of the chromosome matched the number of blocks
for a video. The search space had 3 × 3 blocks (as shown in Figure 5.6) with an
addition of blocks that overlapped each other by 50%. The parameter settings
for the GA implemented for facial block region selection was the same as the
GA settings used for the GA hybrid system in 4.4. The GA parameter settings
were provided in Table 4.1.
In summary, various stress classification systems using a SVM were
developed which differed in terms of the following input characteristics:
VSLBP-TOP: LBP-TOP features for VS videos
TSLBP-TOP: LBP-TOP features for TS videos
TSHDTP: dynamic thermal patterns captured in histograms using
statistics for TS videos
VSLBP-TOP + TSLBP-TOP: VSLBP-TOP and TSLBP-TOP
VSLBP-TOP + TSHDTP: VSLBP-TOP and TSHDTP

Chapter 5: Modelling Computational Observer Stress for Virtual Environments
142
TSLBP-TOP + TSHDTP: TSLBP-TOP and TSHDTP
VSLBP-TOP + TSLBP-TOP + TSHDTP
These inputs were also provided as inputs to the GA-SVM classification
systems to determine whether the system produced better accuracy values.
5.5.2 Performance of the Stress Classification Systems
Each of the different features derived from VS and TS facial videos using LBP-
TOP and HDTP facial descriptors were provided as inputs to a SVM for stress
classification. Facial videos of participants watching stressed films were
assigned to the stressed class and videos associated with not-stressed films
were assigned to the not-stressed class. Furthermore, their corresponding
features were assigned to corresponding classes. Recognition rates and F-scores
for the classifications were obtained using 10-fold cross-validation for each type
of input. The results are shown in Figure 5.8.

5.5 Observer Stress Models Using Thermal Facial Patterns
143
(a)
(b)
VS-L TS-L TS-H VS-L+TS-L VS-L+TS-H TS-L+TS-H VS-L+TS-L+TS-H0.5
0.55
0.6
0.65
0.7
0.75
0.8
0.85
0.9
Input to the Stress Recognition System
Re
co
gn
itio
n R
ate
SVM
GA-SVM
VS-L TS-L TS-H VS-L+TS-L VS-L+TS-H TS-L+TS-H VS-L+TS-L+TS-H0.5
0.55
0.6
0.65
0.7
0.75
0.8
0.85
0.9
0.95
Input to the Stress Recognition System
F-S
co
re
SVM
GA-SVM
Input to the stress classification system
Acc
ura
cy
Input to the stress classification system
Acc
ura
cy

Chapter 5: Modelling Computational Observer Stress for Virtual Environments
144
Figure 5.8: Performance measures for SVM and GA-SVM stress classification
systems. The measures were obtained for various input features based on 10-
fold cross-validation. The labels on the horizontal axes are shortened to
improve readability. L and H stand for LBP-TOP and HDTP respectively. (a)
Accuracy for the systems (b) F-score measure for the systems
Results show that when TSHDTP was provided as input to the SVM
classifier there were improvements in the stress recognition measures. The best
recognition measures for the SVM were obtained when VSLBP-TOP + TSHDTP was
provided as input. It produced a recognition rate that was at least 0.10 greater
than the recognition rate for inputs without TSHDTP where the range for
recognition rates was 0.13. This provides evidence that TSHDTP had a significant
contribution towards the better classification performance and suggests that
TSHDTP captured more patterns associated with stress than VSLBP-TOP and TSLBP-
TOP. The performance for the classification was the lowest when TSLBP-TOP was
provided as input.
The features were also provided as inputs to a GA which selected facial
block regions with a goal to disregard irrelevant facial block regions for stress
recognition and to improve the SVM based recognition measures. Performances
of the classifications using 10-fold cross-validation on the different inputs are
provided in Figure 5.8. For all types of inputs, GA-SVM produced significantly
better stress recognition measures. According to the Wilcoxon non-parametric
statistical test, the statistical significance was p < 0.01. Similar to the trend
observed for stress recognition measures produced by the SVM, TSHDTP also
contributed to the improved results in GA-SVM. The best recognition measures
were obtained when VSLBP-TOP + TSLBP-TOP + TSHDTP was provided as input to the
GA-SVM classifier. The performance of the classifier was highly similar when it
5.6 Summary
145
received VSLBP-TOP + TSHDTP as inputs with a difference of 0.01 in the recognition
rate. Results show that when a combination of at least two of VSLBP-TOP, TSLBP-
TOP and TSHDTP was provided as input, then it performed better than when only
one of VSLBP-TOP, TSLBP-TOP or TSHDTP was used.
Further, stress recognition systems provided with TSHDTP as input
produced significantly better stress recognition measures than inputs with
TSHDTP replaced by TSLBP-TOP (p < 0.01). This suggests that stress patterns were
better captured by TSHDTP features than TSLBP-TOP features.
In addition, blocks selected by the GA in the GA-SVM classifier for the
different inputs were recorded. When VSLBP-TOP was given as inputs to a GA,
the blocks that produced better recognition results were the blocks that
corresponded to the cheeks and mouth regions on the XY plane. For VSLBP-TOP,
fewer blocks were selected and they were situated around the nose. On the
other hand for TSHDTP, more blocks were used in the classification - nose, mouth
and cheek regions, and regions on the forehead were selected by the GA. Future
work could extend the investigation by more complex block definitions to find
and use more precise regions showing symptoms for stress for classification.
5.6 Summary
This chapter proposed computational models of observer stress for VE based on
real-world data sets. The models were based on SVMs and ANNs and
developed from primary stress signals captured either by contact sensors or
non-obtrusive sensors. Stress patterns in the data were successfully captured by
the SVM and ANN models. The hybrids of GA with SVM and GA with ANN
performed significantly better than the stress recognition systems without a GA
with higher stress recognition results.
Analysis of the results produced by the stress recognition systems on the
data sourced by the consumer EEG device shows potential for the device as a
tool for stress analysis for the type of work presented in this chapter.

Chapter 5: Modelling Computational Observer Stress for Virtual Environments
146
Additionally, a new method for capturing patterns in thermal videos
was defined – HDTP. The approach reduced individual bias in the
computational models and enhanced individual-independent recognition of
symptoms for stress. For computing the baseline for stress classification, a SVM
was used. Facial block regions selected informed by a genetic algorithm
improved the rates of the classifications regardless of the type of video – videos
in TS or VS. The best recognition rates, however, were obtained when features
from TS and VS videos were provided as inputs to the GA-SVM classifier. In
addition, stress recognition rates were significantly better for classifiers
provided with HDTP features instead of LBP-TOP features for TS.
In summary, the research contributions of this chapter are:
A real-world stress data set for observer stress for VE;
Stress analysis from a novel set of primary stress signals;
Computational models for observer stress for VE;
Computational model architectures that can be successfully used to
model observer stress for both AVE and VE;
A comparison of primary stress signals sourced by contact sensors and
non-obtrusive sensors gave no significant difference on the performance
to model stress between signals sourced by the two sources; and
A novel method to capture stress features from videos in the thermal
spectrum.

147
Chapter 6 Modelling Computational
Observer Stress for Real Environments
This chapter* proposes computational models of observer stress for
environments with real life settings. It details an experiment which was
conducted to collect a novel set of primary stress signals sourced by non-
obtrusive sensors suited to observers of a real environment. The primary stress
signals and sensors were chosen based on the performance of models for
observer stress classification, as tested on the data sets in Chapter 4 and
Chapter 5. Observer stress classification models for real environments are
developed and tested on the collected real world data sets. Additionally, this
chapter proposes a computational stress signal predictor system that provides an
objective stress measure that varies with time.
6.1 Data Collection
Two experiments were conducted to collect real-world observer data sets for
RE. The experiments differed on the type of real-life setting for the observer,
who was the experiment subject. One experiment had an interview setting
(Interview experiment) and the other experiment had a meditation setting
(Meditation experiment). Each experiment had a scripted role-play to create a
consistent real world environment that an observer viewed while they had their
EEG signals, GSR signals and thermal videos recorded. EEG signals were
sourced using the Emotiv system, GSR signals were sourced by the BodyBugg
system developed by SenseWear and thermal videos were captured using the
FLIR infrared camera model SC620. EEG signals were sourced at a sampling
rate of 128 Hz, thermal videos were sampled at 32 Hz with the frame width and
* Portions of this chapter have been published in [225, 226].
Chapter 6: Modelling Computational Observer Stress for Real Environments
148
height of 640 and 480 pixels respectively and GSR signals were sourced with a
sampling rate of 0.0167 Hz.
Each experiment took approximately 30 minutes which included a role-
play that took 15 minutes. A role-play was acted out by six people. There were
one or more viewers of the environment who took notes of the environment and
watched the role-play just like the observer. The viewers’ reports, which are
provided in Appendix C, validated the stress classes for the environments.
Before the start of each experiment, the observer and viewer(s) had to
understand the requirements of the experiment from a written set of
experiment instructions and what was involved in the experiment with the
guidance of the experiment instructor. The experiment information sheet and
the consent form are provided in Appendix C. After providing their consent to
participate in the experiment, the experiment instructor attached EEG and GSR
sensors to the observer and calibrated the thermal camera. The viewer was
provided with a questionnaire that they filled in during the experiment to
validate the stress state during the different stages of the role-play. The
experiment instructor signalled the actors to start the role-play.
In total, there were 25 observers who had their stress signals recorded
and 40 viewers. The observer cohort was made up of 10 males and 15 females
between the ages of 16 and 25 years. The mean age was 18.6 years old with a
standard deviation of 2.1. There were 12 observers for the Interview experiment
and 13 observers for the Meditation experiment.
6.1.1 Data Collection for the Interview Environment
The Interview experiment had an interview setting with the aim of stimulating
a stressful environment. The interview role-play had five Interviewers who
interviewed one Interviewee for a hypothetical job position. The Interview
Observer and the Interview Viewer watched the interview with the aim to
determine which Interviewer was more confrontational towards the
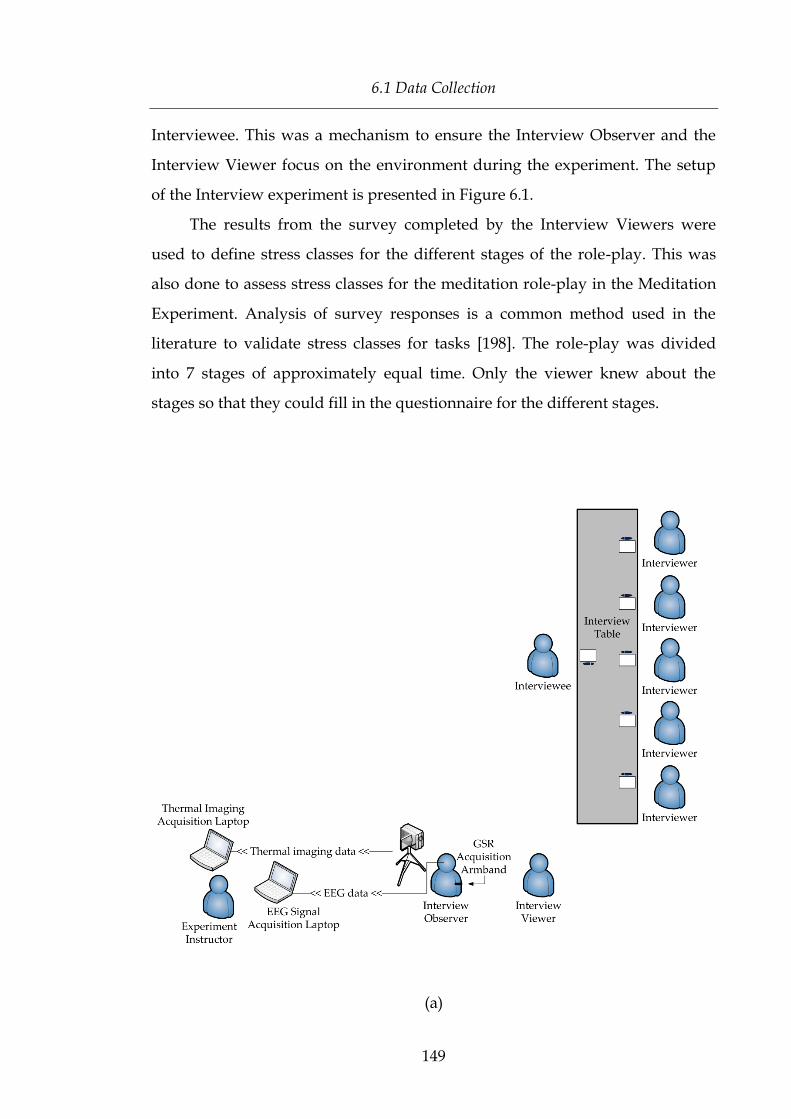
6.1 Data Collection
149
Interviewee. This was a mechanism to ensure the Interview Observer and the
Interview Viewer focus on the environment during the experiment. The setup
of the Interview experiment is presented in Figure 6.1.
The results from the survey completed by the Interview Viewers were
used to define stress classes for the different stages of the role-play. This was
also done to assess stress classes for the meditation role-play in the Meditation
Experiment. Analysis of survey responses is a common method used in the
literature to validate stress classes for tasks [198]. The role-play was divided
into 7 stages of approximately equal time. Only the viewer knew about the
stages so that they could fill in the questionnaire for the different stages.
(a)

Chapter 6: Modelling Computational Observer Stress for Real Environments
150
(b)
(c)
Figure 6.1: Setup for the Interview environment. The interview environment
had Interviewers and an Interviewee. The Interview Observer and Interview
Viewer watched the interview. The observer had their physiological and
physical signals recorded and the viewer took notes of the interview. (a) A
schematic diagram of the interview experiment setup. (b) A photograph of the
data acquisition system. (c) A photograph of the interview setting setup.
Interviewee position Interviewer positions
Experiment Instructor
position
Interview
Observer
position Interview
Viewer
position
GSR
Armband
EEG
Sensors
Thermal
Camera
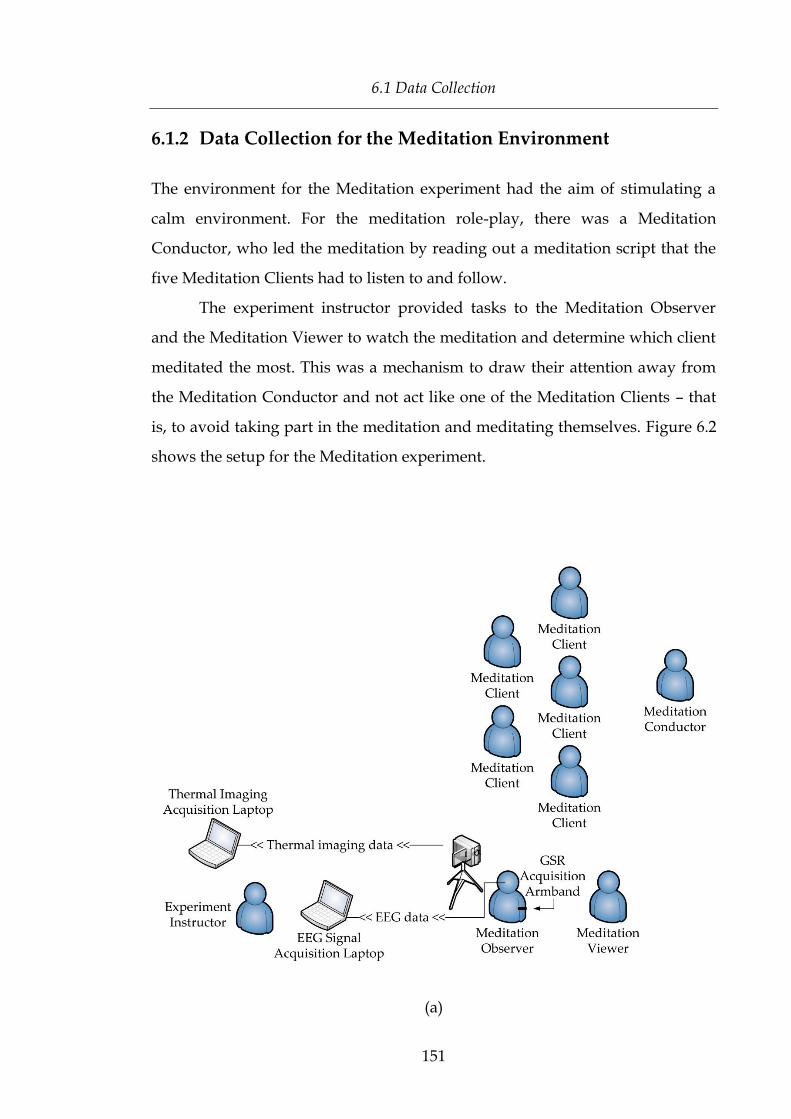
6.1 Data Collection
151
6.1.2 Data Collection for the Meditation Environment
The environment for the Meditation experiment had the aim of stimulating a
calm environment. For the meditation role-play, there was a Meditation
Conductor, who led the meditation by reading out a meditation script that the
five Meditation Clients had to listen to and follow.
The experiment instructor provided tasks to the Meditation Observer
and the Meditation Viewer to watch the meditation and determine which client
meditated the most. This was a mechanism to draw their attention away from
the Meditation Conductor and not act like one of the Meditation Clients – that
is, to avoid taking part in the meditation and meditating themselves. Figure 6.2
shows the setup for the Meditation experiment.
(a)
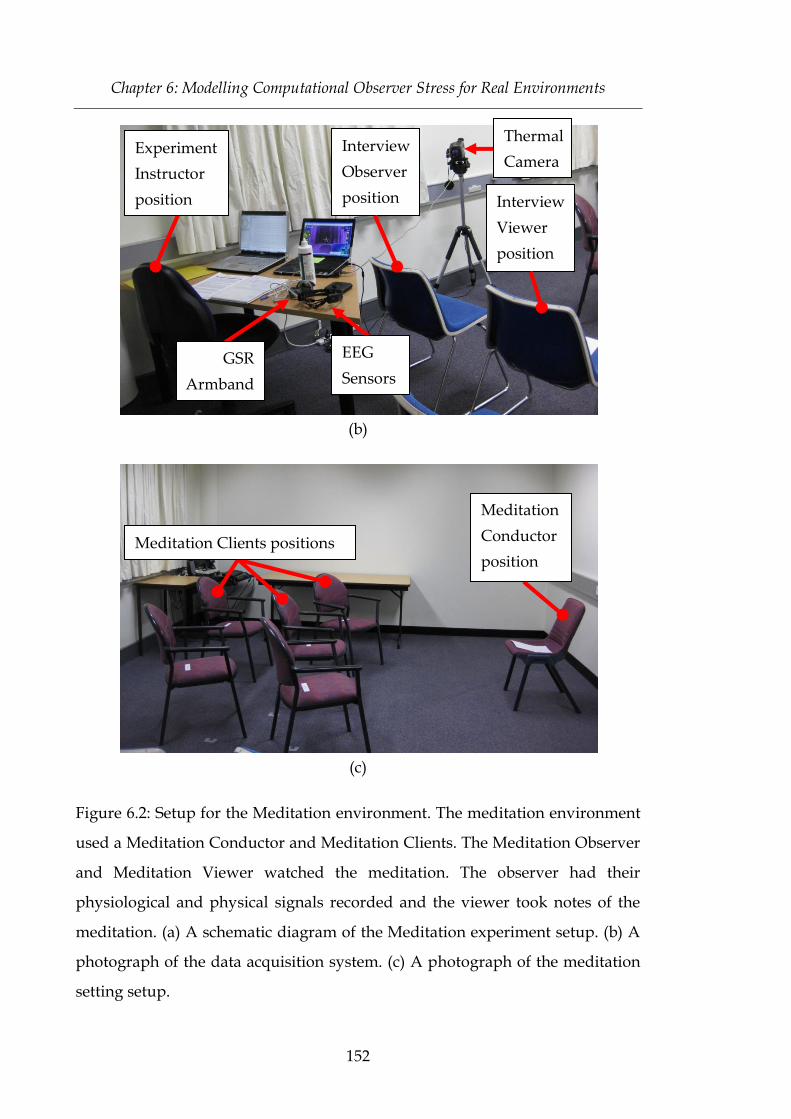
Chapter 6: Modelling Computational Observer Stress for Real Environments
152
(b)
(c)
Figure 6.2: Setup for the Meditation environment. The meditation environment
used a Meditation Conductor and Meditation Clients. The Meditation Observer
and Meditation Viewer watched the meditation. The observer had their
physiological and physical signals recorded and the viewer took notes of the
meditation. (a) A schematic diagram of the Meditation experiment setup. (b) A
photograph of the data acquisition system. (c) A photograph of the meditation
setting setup.
Experiment
Instructor
position
Interview
Observer
position Interview
Viewer
position
Meditation Clients positions
Meditation
Conductor
position
GSR
Armband
EEG
Sensors
Thermal
Camera

6.2 Evaluation of the Environments for Observer Stress
153
6.2 Evaluation of the Environments for Observer Stress
Survey results showed that earlier stages of the interview were more tense or
stressful and as the interview progressed through the later stages, the interview
environment became less stressful. The first stage was the most stressful and
the last stage was the least stressful with p < 0.01 according to the Wilcoxon
statistical test.
Results from the survey on the meditation environment were used to
define stress classes for the different stages of the role-play. The approach for
obtaining the results was the same as the approach taken to analyse the survey
responses from the Interview experiment. Viewers found that the level of stress
that the meditation created reduced as the meditation went into the later stages.
The results showed that observing the last stage of the meditation was the least
stressful. According to the Wilcoxon statistical test, the viewers found the first
two stages of the meditation more stressful compared to all the other stages and
they found the last two stages as not stressful with p < 0.01.
6.3 Observer Stress Feature Set
Features were derived from the stress sensor signals, which formed inputs to an
observer stress classification model. The feature set included temporal features
of the physiological signals and spatio-temporal features of faces captured by
thermal video. Thermal videos of observers’ faces were divided into salient
volumes where each volume had some section of facial regions (e.g. mid-
forehead) in time series, which formed signals for feature extraction. The
signals were segmented into 5 second intervals with an overlap of 50%. Statistic
and measure values of the segments formed the stress feature set. These statistic
values included the mean, standard deviation, kurtosis, skewness, interquartile
range, minimum and maximum. Features derived from EEG signals also
included statistics of signals in different frequency bands and measurements for

Chapter 6: Modelling Computational Observer Stress for Real Environments
154
Hjorth parameters and fractal dimensions. The EEG features were detailed in
Section 2.6.3. There were 1379 features in total.
For a thermal video of an observer’s face during the course of the
experiment, facial regions in the video were extracted and divided into sections
as in Figure 6.3. A face detection method based on eye coordinates [210, 211]
and a template matching algorithm was used to extract a face region. The
method was the same as in Section 5.3. A template of a facial region was
developed from the first frame of a thermal video of the observer’s face. The
facial region was extracted using the Pretty Helpful Development Functions
toolbox for Face Recognition [210-212], which calculated the intraocular
displacement to detect a facial region in an image. This facial region formed a
template for facial regions in each video frame of the thermal videos. Facial
regions in each frame was extracted using MATLAB’s Template Matcher
system [213]. The Template Matcher was set to search for the minimum
difference pixel by pixel to find the area of the frame that best matched the
template.
The facial regions extracted from a video were split into different sections.
Grouped and arranged in order of time of appearance in a video, the sectioned
face regions of video frames formed volumes. Statistics were calculated for each
volume segmented into 5 second intervals like the other stress signals. An
example of a thermal facial volume with a volume of a section of the facial
region is shown in Figure 6.3.

6.4 Observer Stress Models
155
Figure 6.3: A thermal face volume of an observer
6.4 Observer Stress Models
The stress classification models were built using features derived from the
stress response signals of observers during the experiment. There were two
types of classification models – a SVM model and a hybrid of a GA and SVM
(GA-SVM). The GA based model was motivated from the performance of the
models with optimisation for abstract virtual environments in Chapter 4, which
reported that GA based models produced more superior stress models
compared to stress models based on other optimisation methods. The GA in
GA-SVM optimised stress features for the SVM classification. Details of a SVM
time
volume of a
sectioned
facial region
a sectioned
facial region

Chapter 6: Modelling Computational Observer Stress for Real Environments
156
were provided in Section 2.12.5. A description of a GA and its role as a feature
selection component in modelling systems were presented in Section 2.12.3. The
parameter settings for the GAs were the same as Section 4.4.1 and the
implementation settings were provided in Table 4.1.
Features were provided as inputs to each of the classification models for
stress recognition. The feature values were normalised by individual to reduce
the effect of individual bias in generating an individual-independent observer
stress recognition model.
6.5 Performance of the Stress Models
SVM and GA-SVM were implemented and tested on the data sets obtained
from the Interview and Meditation experiments. The primary stress signals for
observers were provided as input to the classification systems. A classification
system generated a feature set and built a classification model using the feature
set. The performance of the model was evaluated using the correct classification
rate and F-score based on 10-fold cross-validation in recognizing two stress
classes – stressed and not-stressed classes – from the test input data. The first two
stages of the environments were labelled as stressed and the last two stages were
labelled as not-stressed in accordance with the results of the survey responses.
Stress classification results produced by the SVM and GA-SVM systems are
presented in Table 6.1.
Table 6.1: Performance measures for observer stress computational models for
real environments using 10-fold cross validation
Classification
Performance Measure
Type of Stress Classification Model
SVM SVM with Optimized Stress
Features
Accuracy 0.87 0.98

6.5 Performance of the Stress Models
157
F-score 0.89 0.96
Recognition rates were significantly better when feature selection was
incorporated in stress classification system according to the Student’s T-test
(p < 0.01). In addition, results for the classification systems show that observers
showed characteristics in their physiological and physical response signals that
were different during the different times of the environment. The patterns in
the response signals in the earlier stages of the environments were different to
the patterns in the later stages.
The classification systems were provided stress response signals
categorized by the type of environment setting – interview or meditation
setting. Classification results for the environment setting based on the response
signals of observers are provided in Table 6.2.
Table 6.2: Performance measures for stress computational models for
classifying real environments using observer stress response signals based on
10-fold cross validation
Classification
Performance Measure
Type of Stress Classification Model
SVM SVM with Optimized Stress
Features
Accuracy 0.79 0.95
F-score 0.82 0.96
The classification systems captured better observer stress patterns to
distinguish whether the observer was stressed during a particular stage of an
environment (the performance results are summarised in Table 6.1) than
classification systems that distinguished whether the observer was viewing an
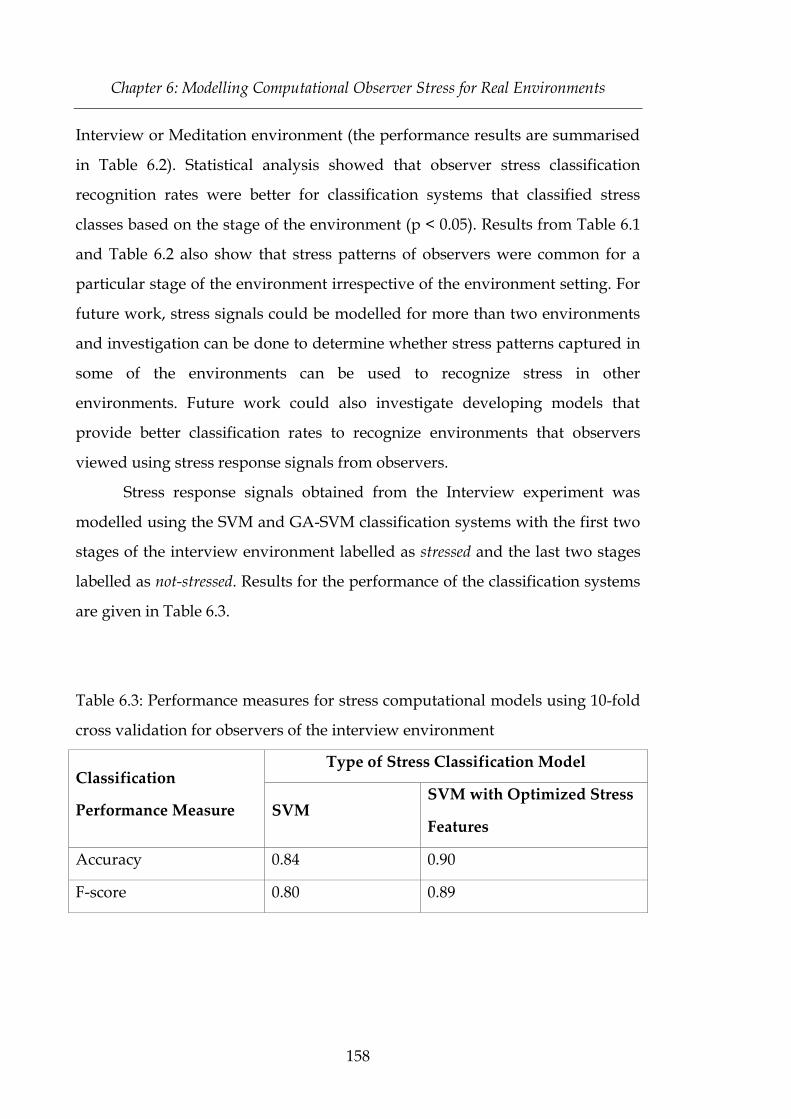
Chapter 6: Modelling Computational Observer Stress for Real Environments
158
Interview or Meditation environment (the performance results are summarised
in Table 6.2). Statistical analysis showed that observer stress classification
recognition rates were better for classification systems that classified stress
classes based on the stage of the environment (p < 0.05). Results from Table 6.1
and Table 6.2 also show that stress patterns of observers were common for a
particular stage of the environment irrespective of the environment setting. For
future work, stress signals could be modelled for more than two environments
and investigation can be done to determine whether stress patterns captured in
some of the environments can be used to recognize stress in other
environments. Future work could also investigate developing models that
provide better classification rates to recognize environments that observers
viewed using stress response signals from observers.
Stress response signals obtained from the Interview experiment was
modelled using the SVM and GA-SVM classification systems with the first two
stages of the interview environment labelled as stressed and the last two stages
labelled as not-stressed. Results for the performance of the classification systems
are given in Table 6.3.
Table 6.3: Performance measures for stress computational models using 10-fold
cross validation for observers of the interview environment
Classification
Performance Measure
Type of Stress Classification Model
SVM SVM with Optimized Stress
Features
Accuracy 0.84 0.90
F-score 0.80 0.89

6.5 Performance of the Stress Models
159
Similarly, the stress response signals for the observers of the Meditation
experiment were modelled using the SVM and GA-SVM classification systems.
Stress recognition results for the systems are presented in Table 6.4.
Table 6.4: Performance measures for stress computational models using 10-fold
cross validation for observers of the meditation environment
Classification
Performance Measure
Type of Stress Classification Model
SVM SVM with Optimized Stress
Features
Accuracy 0.92 0.99
F-score 0.92 0.98
For the different environment stages, the classification systems captured
better stress patterns for the meditation environment than the interview
environment (p < 0.01). This is the case because the meditation environment
might have influenced the stress levels for observers more over the course of
the environment than the interview environment. The results correlate with the
experiment survey responses, which show that the change in stress for the
meditation environment was greater than the interview environment.
Feature sets selected by the GAs in the GA-SVM classification systems
showed that the EEG band power feature was common to all the feature sets.
This suggests that the band power feature had a stronger relationship with
stress classes than other types of features used in this section. SVM and GA-
SVM were modelled with the EEG band power features only and their
performance results for observer stress recognition are given in Table 7. The
stress recognition results could not be differentiated from the results obtained
from the GA-SVM classification systems for the investigations done to report
results in Tables 3-6 (p > 0.1).

Chapter 6: Modelling Computational Observer Stress for Real Environments
160
Table 6.5: Performance measures for stress computational models for observers
of real environments using 10-fold cross validation using EEG band power
features as input
Classification
Performance
Measure
Type of Stress Classification Model
Stress
Classification
by Stages
Stress
Classification
by
Environments
Stress
Classification
by Stages for
Interview
Environment
Stress
Classification
by Stages for
Meditation
Environment
Accuracy 0.96 0.92 0.86 0.95
F-score 0.95 0.90 0.88 0.95
6.6 Observer Stress Signal Predictor
In this section, a computational stress signal predictor system is proposed to
predict the stress signal for observers of the meditation environment. The
individual-independent system is based on a SVM, a hybrid of GA and SVM
model (GA-SVM) and an ANN. It used physiological and physical sensor
response signals for stress of observers over the time of the meditation activity.
SVM based classification models were developed to determine the overall trend
of the stress signal i.e. whether stress was increased or decreased over time for
individuals. The GA-SVM model system was used to optimize features for
stress classification. An ANN based modelling method is proposed to model a
stress signal informed by the overall trend given by the stress classification
models and using the optimised features as input.
6.6 Observer Stress Signal Predictor
161
6.6.1 Computational Classification Models to Determine the
Trend of the Stress Signals
Stress classification models were built using stress features to provide
information on the overall trend of the stress signal for observers. The features
were defined in Section 6.3. There were two types of classification models – a
SVM model and a hybrid of a GA and SVM (GA-SVM). Features were provided
as inputs to each of the classification models. The classification models were
built to classify stress in two classes – most-stressed and least-stressed classes.
Details of a SVM were provided in Section 2.12.5. From the analysis of the
results in Section 6.5 of using a GA for feature selection in stress classification
systems, the GA-SVM model was used to reduce the redundant and irrelevant
features in the input feature set for classification using the SVM model. A
description of a GA and its role as a feature selection component in modelling
systems were presented in Section 2.12.3 and its architecture was given in
Figure 4.9. The GA-SVM model was also used to obtain optimised stress
features for predicting a stress signal. The parameter settings for the GA in GA-
SVM were the same as Section 4.4.1 and the implementation settings were
provided in Table 4.1.
6.6.2 A Computational Model for Estimating a Stress Signal
This section proposes an ANN feed-forward based computational system to
estimate a stress signal for observers of the meditation environment. A
description of the ANNs was provided in Section 2.12.4. A feed-forward ANN
has an input layer, may have multiple hidden layers and an output layer where
each layer is made up of neurons. Input tuples for the ANN are passed through
the neurons in the input layer. Then the weighted links pass the signals to the
neurons in the hidden layers which apply a nonlinear activation or transfer
function to process the signals further and then in a similar fashion the signals
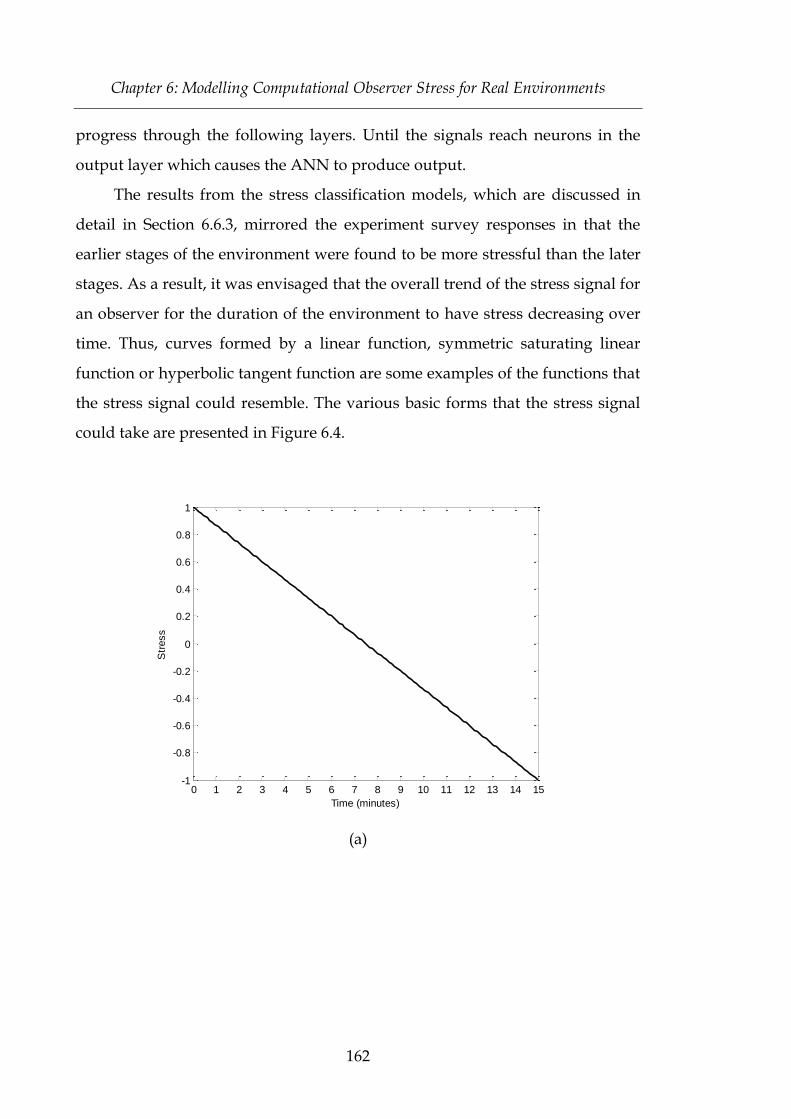
Chapter 6: Modelling Computational Observer Stress for Real Environments
162
progress through the following layers. Until the signals reach neurons in the
output layer which causes the ANN to produce output.
The results from the stress classification models, which are discussed in
detail in Section 6.6.3, mirrored the experiment survey responses in that the
earlier stages of the environment were found to be more stressful than the later
stages. As a result, it was envisaged that the overall trend of the stress signal for
an observer for the duration of the environment to have stress decreasing over
time. Thus, curves formed by a linear function, symmetric saturating linear
function or hyperbolic tangent function are some examples of the functions that
the stress signal could resemble. The various basic forms that the stress signal
could take are presented in Figure 6.4.
(a)
0 1 2 3 4 5 6 7 8 9 10 11 12 13 14 15-1
-0.8
-0.6
-0.4
-0.2
0
0.2
0.4
0.6
0.8
1
Time (minutes)
Str
ess

6.6 Observer Stress Signal Predictor
163
(b)
(c)
Figure 6.4: Forms of the stress signal (a) linear (b) symmetric saturating linear
(c) hyperbolic tangent
0 1 2 3 4 5 6 7 8 9 10 11 12 13 14 15-1
-0.8
-0.6
-0.4
-0.2
0
0.2
0.4
0.6
0.8
1
Time (minutes)
Str
ess
0 1 2 3 4 5 6 7 8 9 10 11 12 13 14 15-1
-0.8
-0.6
-0.4
-0.2
0
0.2
0.4
0.6
0.8
1
Time (minutes)
Str
ess

Chapter 6: Modelling Computational Observer Stress for Real Environments
164
ANNs were developed that took the optimised stress features found from the
GA-SVM model in Section 6.6.1 as input with the aim to produce a signal that
took the form of either a linear function, symmetric saturating linear function or
a hyperbolic tangent function. Three different types of ANNs were developed
and they differed on the type of desired output estimator function as provided
below:
ANN_Linear: the ANN had a linear desired output estimator function
ANN_SLin: the ANN had a symmetric saturating linear desired output
estimator function
ANN_Tanh: the ANN had a hyperbolic tangent desired output
estimator function
The MATLAB adapt function was used to train the ANNs on an
incremental basis. Each network was trained using the Levenberg-Marquardt
algorithm for 1000 epochs or until the magnitude of the gradient for the mean
squared error (MSE) was less than 10-5 during the validation phase. The MSE is
the average squared error determined from the actual output of the network
and the expected output. The number of neurons in the input layer for each
ANN was equal to the number of optimized features obtained from the GA-
SVM system and each ANN had 7 hidden neurons and one neuron in the
output layer. If all the stress features had been provided as input to the ANN,
then the network would have become unnecessarily large requiring longer
times for executing ANN training and testing phases and contribute to
capturing poorer stress patterns to predict a stress signal. During the training
phase, an ANN was presented with a data sample which had stress feature
values as input and an estimate value on the curve of the function for a
particular time segment. The point of training using this desired output
estimator is that the ‘time’ values of instantaneous stress were not known as
only a few human provided labels which related to many stress feature values.

6.6 Observer Stress Signal Predictor
165
Training to the different curves enabled determining whether a representation
could be formed which well relates the data to the curve.
6.6.3 Performance of the Stress Signal Predictor
SVM and GA-SVM systems were implemented and tested on the data sets
obtained from the meditation experiment. The primary stress signals for
observers were provided as input to the classification systems. A classification
system generated a feature set and used it to build a classification model for
stress. The performance of the model was evaluated using the correct
classification rates and F-score values based on 10-fold cross-validation in
recognizing two stress classes – most-stressed and least-stressed classes – from the
test input data. The first two stages of the environments were labeled as most-
stressed and the last two stages were labeled as least-stressed in accordance with
the results of the survey responses. Stress classification results produced by the
SVM and GA-SVM systems are presented in Table 6.4.
Table 6.6: Performance measures for the stress computational classification
models using 10-fold cross validation for observers of the meditation
environment
Classification
Performance
Measure
Type of Stress Classification Model
SVM SVM with Optimized
Stress Features
SVM with EEG Band Power
Features Only as Input
Accuracy 0.92 0.99 0.95
F-score 0.92 0.98 0.95

Chapter 6: Modelling Computational Observer Stress for Real Environments
166
Feature sets selected by the GA in the GA-SVM classification systems
showed that the EEG band power features made up most of the optimized
feature set. This suggests that the band power feature had a stronger
relationship with stress classes than other types of features used in this section.
The SVM system was modeled with the EEG band power features only and its
performance results for observer stress classification are given in Table 6.4. The
stress classification results of the SVM that had EEG band power features
provided as input could not be differentiated from the results obtained from the
GA-SVM classification system on all stress features i.e. SVM with stress features
optimized by a GA (p > 0.1).
EEG band power features were used to predict the stress signal for
observers of the meditation environment. The features were provided as input
to the three ANN stress signal predictors - ANN_Linear, ANN_SLin and
ANN_Tanh. Each type of ANN was trained and tested on experiment subject
data on a leave-one-out basis so the ANN would predict a stress signal for one
subject after being trained on data for the other subjects. The average MSE
calculated for each of the ANNs based on the values on the corresponding
curve, which was provided in Figure 6.4, is presented in Figure 6.5.

6.6 Observer Stress Signal Predictor
167
Figure 6.5: Average mean square error of the outputs produced by the stress
signal predictors in relation to their corresponding curve forms presented in
Figure 6.4
ANN_Tanh produced the best estimation of the stress signal as shown
by the lowest MSE value compared to ANN_Linear and ANN_SLin and
statistical analysis of the MSE values using the Student’s T-test with p < 0.01.
According to the MSE values for ANN_Linear and ANN_SLin, ANN_SLin
produced a better estimate of the stress signal compared to ANN_Linear with
0.01 < p < 0.01. Examples of the outputs from the three ANNs in relation to the
form of the curve of the corresponding functions are shown in Figure 6.6. The
curves produced by the ANNs show that the overall rate of change in stress is
negative, which is consistent with the results produced by the classification
systems, but there were certain times in the meditation experiment when the
curves had a positive rate of change as shown by slight increases in stress
values over the time periods. This observation could not be deduced by the
survey responses from the experiment. Future work could extend the ANN
stress signal predictor with desired output estimator functions that could form
0
0.1
0.2
0.3
0.4
0.5
0.6
ANN_Linear ANN_SLin ANN_Tanh
Av
erag
e M
ean
Sq
uar
e E
rro
r
Type of Stress Signal Predictor

Chapter 6: Modelling Computational Observer Stress for Real Environments
168
curves with rates of change that has a positive rate of change for certain time
periods and survey responses could be captured at a higher level of granularity
to validate the slight increases in the stress signal.
(a)
(b)
0 1 2 3 4 5 6 7 8 9 10 11 12 13 14 15-1
-0.5
0
0.5
1
1.5
Time (minutes)
Str
ess
target stress signal
ANN predicted stress signal
0 1 2 3 4 5 6 7 8 9 10 11 12 13 14 15-1
-0.8
-0.6
-0.4
-0.2
0
0.2
0.4
0.6
0.8
1
Time (minutes)
Str
ess
target stress signal
ANN predicted stress signal
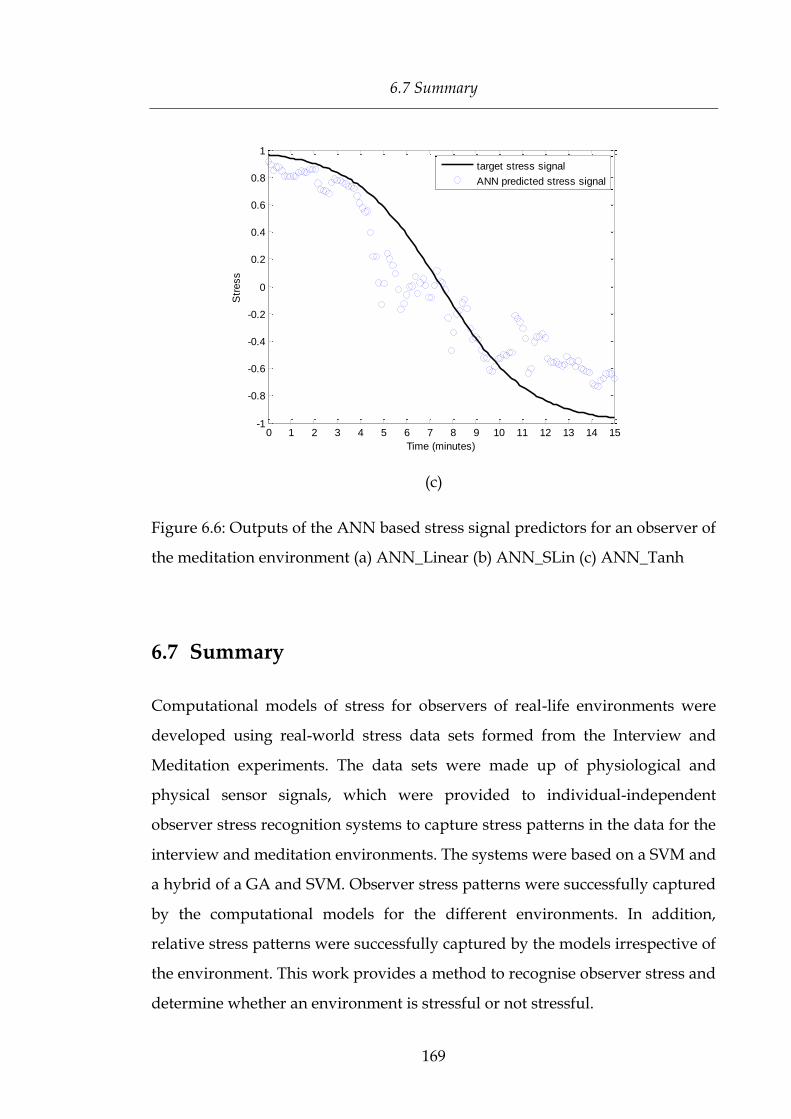
6.7 Summary
169
(c)
Figure 6.6: Outputs of the ANN based stress signal predictors for an observer of
the meditation environment (a) ANN_Linear (b) ANN_SLin (c) ANN_Tanh
6.7 Summary
Computational models of stress for observers of real-life environments were
developed using real-world stress data sets formed from the Interview and
Meditation experiments. The data sets were made up of physiological and
physical sensor signals, which were provided to individual-independent
observer stress recognition systems to capture stress patterns in the data for the
interview and meditation environments. The systems were based on a SVM and
a hybrid of a GA and SVM. Observer stress patterns were successfully captured
by the computational models for the different environments. In addition,
relative stress patterns were successfully captured by the models irrespective of
the environment. This work provides a method to recognise observer stress and
determine whether an environment is stressful or not stressful.
0 1 2 3 4 5 6 7 8 9 10 11 12 13 14 15-1
-0.8
-0.6
-0.4
-0.2
0
0.2
0.4
0.6
0.8
1
Time (minutes)
Str
ess
target stress signal
ANN predicted stress signal

Chapter 6: Modelling Computational Observer Stress for Real Environments
170
Further, a computational method to model a stress signal of an observer
for meditation setting was successfully developed using stress response signals.
The architecture of the model is presented in Figure 6.7. The survey was
designed to capture experiment participant responses over the period of the
environment. In addition, the responses across the participants were
statistically positively correlated. These two aspects of the survey provided the
ground truth to estimate a stress signal. The stress sensor signals and survey
responses were provided to an individual-independent observer stress
classification system based on an SVM to determine the overall profile of the
stress signal. A hybrid model of a GA and an SVM was developed to determine
which type of stress feature was more relevant for stress detection. The
optimised features were used to estimate a stress signal using the proposed
stress signal predictor, which is based on an ANN. Results showed that the
stress signal for observers was best represented using a curve that resembled to
a hyperbolic tangent function rather than being similar to a linear function or a
symmetric saturating linear function.
In summary, the research contributions of this chapter are:
A real-world stress data set for observer stress for RE;
Stress analysis from a novel set of primary stress signals;
Computational models for observer stress for RE;
Computational model architectures that can be successfully used to
model observer stress for all AVE, VE and RE; and
A computational stress signal predictor system.

6.7 Summary
171
Figure 6.7: Architecture of the stress signal predictor system

Chapter 6: Modelling Computational Observer Stress for Real Environments
172
173
Chapter 7 Conclusions and Future Work
This chapter concludes the thesis by summarising the major outcomes from the
research and contributions to computational stress research against the research
questions identified in Chapter 1. It also proposes some future directions for
research arising from the thesis.
7.1 Conclusions
Computational models were developed for observer stress for abstract virtual
environments, virtual environments and real environments using real-world
data sets which were collected for each type of environment. The research
established a context through an analysis of relevant work and identified gaps
in the literature. The survey of the literature included discussions of human
response signals that show symptoms of stress used previously in research for
stress detection. The term primary stress signals was coined in this thesis and
was used to capture the interpretation of human response signals showing the
stress symptoms and these comprised physiological and/or physical signals
sourced by sensors. An analysis was presented of the computational methods
used by other researchers to detect stress using primary stress signals for
situations eliciting stress. The majority of the models developed for stress have
used supervised learning techniques with ground truth based on human
reported stress [24].
An objective definition of stress coined computed stress, based on
characteristics of primary stress signals derived from non-invasive methods,
was proposed to differentiate its meaning from the traditional stress term. The
traditional stress term encompasses the definition of stress from human reports
and human response measures derived from even invasive methods such as

Chapter 7: Conclusions and Future Work
174
extracting blood samples. The term computed observer stress was proposed to
refer to a more specific type of computed stress to mean computed stress for
observers of environments. The terms and their definitions were used to define
the proposed computational models of observer stress for abstract virtual
environments [194-197] virtual environments [207, 208] and real environments
[225, 226]. These models were successfully developed for individuals and
models that captured individual-independent observer stress patterns.
Experimental designs were presented for real-world observer stress data
collection from the different environments. Observer stress data sets were
developed from the data collected from the experiments and used to investigate
and model observer stress for the different environments.
In addition, this research investigated modelling stress with primary
stress signals sourced by non-obtrusive sensors to make data acquisition less
obstructive for observers so that they are more comfortable during the process.
From the statistical analysis, there was no significant difference between the
observer stress classification results produced by the models using primary
stress signals sourced by contact sensors and non-obtrusive sensors [207]. This
suggests that interfaces for stress data acquisition have the potential to be
embedded in a person’s environment for monitoring stress and reducing the
risk of impeding the person’s usual behaviour and activities. Due to this
reduction in obstruction to enhance the capturing of natural behaviours and
activities, accurate recordings of primary stress signals can be made and used
to produce stress models that recognise stress more robustly.
Furthermore, a stress signal predictor system was proposed combining
the results of the various earlier investigations undertaken. The computational
system shows that observer stress can be modelled on a continuous time
domain for a meditation environment [226]. The structure of the experiment
survey and the statistical correlation of the responses of the survey across the
experiment participants enabled the development of the stress signal predictor
system for the environment. The experiment surveys for the other

7.1 Conclusions
175
environments did not have the essential structure to determine stress levels for
particular stages of the environment and this resulted in insufficient
information to define the ground truth for the model systems. As a
consequence, this thesis did not investigate developing stress signal predictor
systems for those environments. However, this thesis showed that it is possible
to develop a stress signal predictor system for an environment and if future
work could involve better methods to determine ground truth for the other
environments, developing stress signal predictor systems for the environments
could be investigated. A stress signal predictor system can help a person
understand their levels of stress at particular times while they see events in an
environment. As a result, this can allow a person to pinpoint which events in
the environment greatly influence their stress levels and levels of influence of
other events.
The research presented in this thesis has helped to develop an objective
understanding of stress and how average individuals respond to events they
observe in environments they encounter. It provides research findings that
have the potential to help individuals manage their stress, which is a major
cause for health, social and economic concern in our society. Further, this
research contributes in developing better and more objective approaches in
dealing with stress.
In summary, the main contributions to research of this thesis include:
1. Objective definition for observer stress;
2. Computational models of observer stress for observer stress recognition
using real-world data sets with sensor signals;
3. Real-world observer stress data sets for abstract virtual environments,
virtual environments and real environments;
4. Computational techniques for sensor fusion for observer stress
recognition; and
Chapter 7: Conclusions and Future Work
176
5. Computational methods to predict observer stress including a
computational system to estimate a stress signal i.e. stress varying with
time.
7.2 Future Work
Further research directions have emerged from the work in this thesis, which
provides a rich base for further research in computational stress. The major
research questions for future work are summarised below. Implementations of
the research outcomes are also identified and could benefit stress detection and
management in real-world situations.
A Stress Signal Predictor System with Optimisation
The stress signal predictor system proposed in this thesis could be extended to
include optimisation of the derivative or rate of change of the transfer functions
of the ANN to further generalise the process for estimating a stress signal. The
experiment done to collect human assessed responses during the activities in
the environments over time was at a more abstract level of granularity so the
small increases in stress levels in the stress signals could be not validated.
Future work in this area would require stress to be assessed at a more detailed
level of granularity than the assessment method in this thesis.
A Stress Signal Predictor System for an Observer for Different Types of
Environments
An investigation can be done on the effect different types of environments have
on the stress signal of an observer. A stress signal for an observer for each type
of environment could be estimated by the stress signal predictor using the
architecture proposed in this thesis and the stress signals for the environments

7.2 Future Work
177
can be compared. The research will also require developing methods to define
ground truth for the system.
Continuous Stress Measure Varying with Time for an Individual Interacting
with a Stressor
Future work could include estimating a stress signal for an individual
interacting with particular stress stimuli as opposed to estimating a stress
signal of an observer who was not actively engaged in the environment, which
was the focus of this work.
Optimising Time Segments for Primary Stress Signals for Stress Detection
Certain primary stress signals may show stress symptoms earlier than others
due to different physiological response times. For efficiency and better quality
stress classification, a stress classification model system can be developed to
make use of the signals that best show stress at particular time segments of an
environment. A computational model that detects stress by optimising signals
for particular time segments to improve stress classification can be investigated.
Computational Models with Capturing Time-Varying Stress Patterns
A more sophisticated model could be developed that captures time-varying
stress patterns by exploiting the time-varying nature of features for stress
classification. When stress feature values across time periods were provided as
input to the time-delay ANN stress classification models for individual
observers in Section 4.4, the quality of the stress classifications were better than
the classification models that did not incorporate values for features across
multiple time segments. It also formed a more robust stress classification
model. Future work could investigate the performance of individual-

Chapter 7: Conclusions and Future Work
178
independent models that capture time-varying stress patterns for stress
classification.
Unsupervised Learning Models for Modelling Stress
This work developed supervised modelling techniques for stress. Future work
could include an investigation of whether stress can be modelled using
unsupervised learning techniques. For these types of techniques, it will be
important to use optimised primary stress signals and optimised stress features
for stress detection. Feature optimisation methods proposed in this work could
be used e.g. GA and PISA based approaches.
Relationship between Computational Observer Stress and Environments
Research can be done to determine the relationship between computational
observer stress and the observer’s comprehension of the events presented in the
environment at particular times. A research question in this area of research
could be “is there a relationship between stress and reading to acquire
knowledge and if so how do the events in the reading influence computed
stress?”
How Much Rest is Enough After Seeing a Stressful Environment?
It was pointed out in the literature that ‘enough’ rest [34] should be taken after
being exposed to a stimulus or demand that causes stress. However, ‘enough’ is
not well quantified. Future research could investigate a quantifiable definition
for ‘enough’ rest. Another perspective that research could consider is to
determine and plan daily activity routine schedules to minimise the effects of
stress quantifiably.

7.2 Future Work
179
How do Computational Stress Models Compare for Individuals from
Different Social Backgrounds?
The research in this thesis reduced the effect of individual bias in
computational stress models by using stress data normalized by individuals.
Investigations of the effects of individuals from different cultural and ethnic
backgrounds on the proposed stress models were beyond the scope of this
thesis. This research could be extended to develop stress models for individuals
from different social backgrounds.
Modelling Observer Stress for Multiple Concurrent Primary Environments
This thesis investigated primary environments. An example of a composite
environment for an observer is when an observer watches an argument
between two people and also listens to non-stressful music on their
headphones. Future work could develop a computational stress model to
investigate how events in a composite environment, defined by multiple
primary environments, influence observer stress.
Scheduling Environments for Observers to Minimise their Overall Stress
A computational system can be developed to determine how different
environments influence observer stress and how the order of the environments
affects an observer’s stress. The system can be extended to propose an order of
environments for an observer to minimise their overall stress.
A Mobile Stress Management System with Online Stress Analysis and
Human-Centred Stress Acquisition Interface
The literature has reported the risk for health and social problems for
individuals when stress is left unmanaged, as discussed in Chapter 1. The

Chapter 7: Conclusions and Future Work
180
research reported in this thesis provides a basis for such a system. Algorithms
proposed in this thesis need an interface with users including a mobile
interface. Future work could develop a computational stress management
system (CSMS) that uses a non-obtrusive stress data acquisition interface and
provides online stress analysis in a mobile setting. CSMS will require
developing a non-obtrusive stress monitoring system interface that sources
data from a person encountering environments from their daily activities to
model stress, evaluate stress levels, provide a future prediction of their stress
levels, and suggest activities they should adopt to decrease or maintain their
stress levels in different environments.
181
Appendix A Experiment Material for
Acquiring Observer Stress Data for Abstract
Virtual Environments
Relevant material used in the experiment to obtain stress data for observers of
abstract virtual environments is provided in this section. The material includes
the experiment procedure that the experiment instructor followed to collect
stress data, experiment information sheet for an experiment participant, a
consent form that the participant had to fill in to participate in the experiment
and a survey that the participant had to do as a task in the experiment.
Note that ethics approval was sought from the Australian National
University Research Ethics Committee before stress data was collected and
used for the work in this thesis.

Appendix A Experiment Material for Acquiring Observer Stress Data for Abstract
Virtual Environments
182
Experiment Procedure to Acquire Stress Data
1. Set the temperature for both the rooms at 22oC
2. Both the lights should be on in the lab room, but no lights must be on in
the Inquisition room
3. Start up the Reading application, fill in the paragraph ordering and click
next to show the ‘Personal Details’ page
4. Start up FaceLAB
a. Bring up all 3 screens:
i. Main Window
ii. Control Window
iii. Video Window
b. Ensure that the following are checked for logging:
i. All fields are selected in “Select Fields”
ii. Network Address: research8238.anupsychology.local
c. Put the FaceLAB screen on Inquisition monitor
5. Biopac equipment
a. Ensure Biopac is on
b. Ensure settings in the ECG100C are
i. Gain = 500
ii. R Wave

Appendix A Experiment Material for Acquiring Observer Stress Data for Abstract
Virtual Environments
183
iii. On
iv. 0.05 Hz
c. Ensure settings in the GSR100C are
i. Gain = 5μmho/v
ii. 10 Hz
iii. DC
iv. DC
A participant comes into the experiment room
6. Give consent forms and request participants fill out their details (5 mins)
7. Ask the participant “what is your dominant hand or what hand will you
use to write today?”
8. Put sensors on the participant (5 - 10 mins)
a. Damp a lint-free cloth (Gauze Swabs - Sterile) with water and
wipe the index finger and ring finger in the non-dominant, left
wrist, right wrist, and left ankle, where the adhesives will be
placed to clean up dead skin and grease
b. GSR - Put on EL507 (Isotonic Gel) adhesives on the top joints of
index finger and ring finger in the non-dominant, left hand. The
adhesives should curl towards the fingernails.
c. ECG - Put on EL503 adhesives on the left wrist, right wrist, and
left ankle
d. Check and record time

Appendix A Experiment Material for Acquiring Observer Stress Data for Abstract
Virtual Environments
184
e. Give the participant a chair to sit in front of the Inquisition
computer so that the participant is 50-70cm distance away from
the camera
f. Calibrate FaceLAB
i. Run through the calibration screen
g. Put Finapres Blood Pressure Monitor (1 Finger Cuff)
i. Align the cuff with the tube and cable on the palm side of
the hand toward the wrist
ii. Put the cuff on the middle finger on the middle joint so that
the cuff won’t slide over the middle joint but will slip off
the finger tip
iii. Strap the Velcro around the thumb and the last finger so
that the pump is placed firmly on the top of the hand
iv. Connect the cable and the tube to the pump
v. Switch the Finapres system on
a. Attach the GSR cables to each of the two EL507 adhesives in the
fingers with the cables coming down towards palm.
a. Put a tape around the fingers to hold the cable in place to
minimise noise generation
b. Attach the ECG cables and put tape to hold the cables in place to
minimise noise:
a. Red cable on the left wrist of the subject

Appendix A Experiment Material for Acquiring Observer Stress Data for Abstract
Virtual Environments
185
b. White on the right wrist
c. Black on the left ankle
GSR (2 electrodes) (5 mins required by GSR100C before measurements can be
taken)
9. Change the Inquisition display to the Experiment display
10. Ask participants to fill out the online form with their dominant hand
a. “Please complete all sections of the form. If you have problems
typing, let me know and I will help you. Make sure that you give
your age in English years. Click the continue button when you
have filled in the form.”
11. Just as a trial run (do not tell the participant that this is a trial run), show
them the experiment instructions page to read
a. “Read the content on the screen. Once you are ready to start the
test, let me know and I will tell you when to click the continue
button”
b. Check whether all data can be obtained on the Acquisition
computer
c. Check and record time
d. “When you reach the end of the reading let me know before
proceeding. Click continue when you are ready to start the test”
12. Show text on the monitor one at a time to a participant for silent reading
by following one of the permutations of stressed and non-stressed. Each
participant will read text different text excerpts for each type plus the

Appendix A Experiment Material for Acquiring Observer Stress Data for Abstract
Virtual Environments
186
three text excerpts for the neutral type. (15 mins)
13. Check and record time
14. Click ‘stop logging’ on FaceLAB
15. After the participant has finished reading the paragraphs, ask them
which paragraphs were easy, calm, hard and stressful to read. Ask them
to describe each paragraph in one sentence. All the answers will be
written by participants on a sheet of paper. (10 mins)
16. After the participant has finished click ‘stop recording’ data on
AcqKnowledge and then remove sensors.
a. Switch the Finapres system off
i. Remove the cable and tube
ii. Remove the Velcro and pump and put away
iii. Wipe the cuff with a alcohol wipe and put it away in the
cabinet
b. Remove ECG cables
i. Remove tape, cables and adhesives
ii. Coil the cables, put tape to hold the coil and put them away
c. Remove GSR cables
i. Remove tape, cables and adhesives
ii. Coil the cables, put tape to hold the coil and put them away
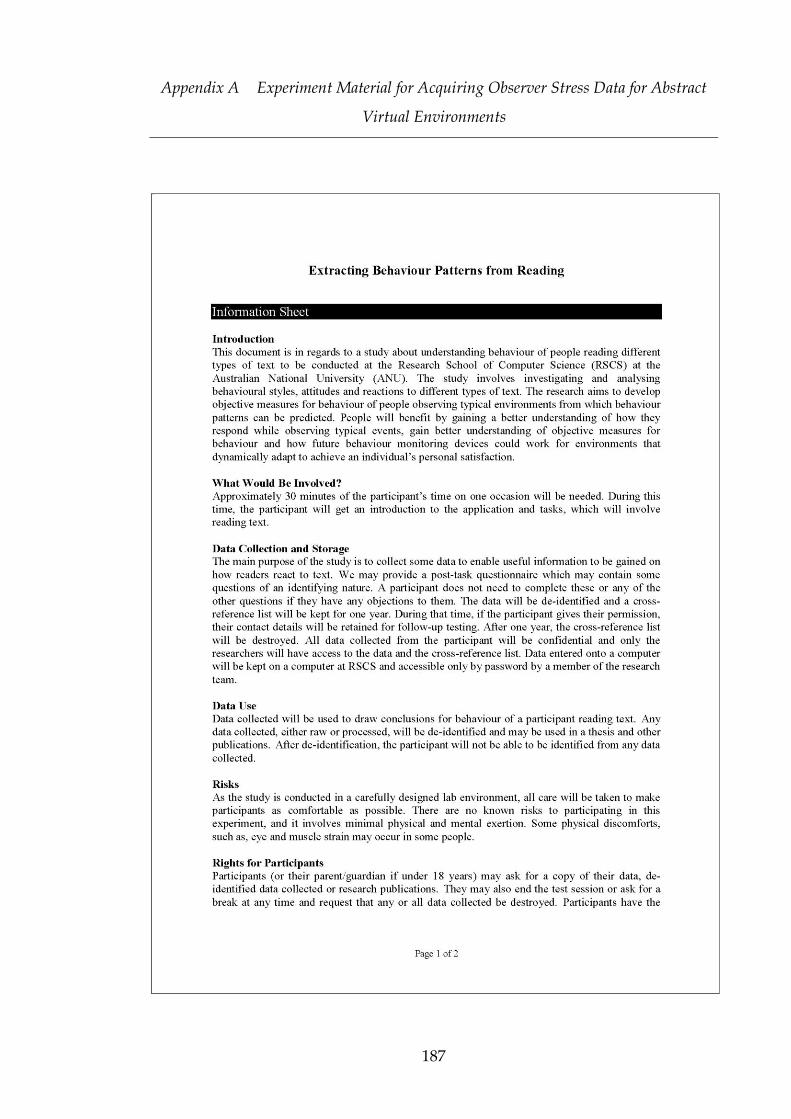
Appendix A Experiment Material for Acquiring Observer Stress Data for Abstract
Virtual Environments
187

Appendix A Experiment Material for Acquiring Observer Stress Data for Abstract
Virtual Environments
188

Appendix A Experiment Material for Acquiring Observer Stress Data for Abstract
Virtual Environments
189

Appendix A Experiment Material for Acquiring Observer Stress Data for Abstract
Virtual Environments
190

Appendix A Experiment Material for Acquiring Observer Stress Data for Abstract
Virtual Environments
191

Appendix A Experiment Material for Acquiring Observer Stress Data for Abstract
Virtual Environments
192

193
Appendix B Experiment Material for
Acquiring Observer Stress Data for Virtual
Environments
Relevant material used in the experiment to obtain stress data for observers of
virtual environments is provided in this section. The material includes the
experiment information sheet for an experiment participant, a consent form
that the participant had to fill in to participate in the experiment and a survey
that the participant had to do as a task in the experiment.
Note that ethics approval was sought from the Australian National
University Research Ethics Committee before stress data was collected and
used for the work in this thesis.

Appendix B Experiment Material for Acquiring Observer Stress Data for Virtual
Environments
194

Appendix B Experiment Material for Acquiring Observer Stress Data for Virtual
Environments
195

Appendix B Experiment Material for Acquiring Observer Stress Data for Virtual
Environments
196

Appendix B Experiment Material for Acquiring Observer Stress Data for Virtual
Environments
197

Appendix B Experiment Material for Acquiring Observer Stress Data for Virtual
Environments
198

199
Appendix C Experiment Material for
Acquiring Observer Stress Data for Real
Environments
Relevant material used in the experiment to obtain stress data for observers of
real environments is provided in this section. The material includes the
experiment information sheet for an experiment participant, a consent form
that the participant had to fill in to participate in the experiment and a survey
that the participant had to do as a task in the experiment.
Note that ethics approval was sought from the Australian National
University Research Ethics Committee before stress data was collected and
used for the work in this thesis.

Appendix C Experiment Material for Acquiring Observer Stress Data for Real
Environments
200

Appendix C Experiment Material for Acquiring Observer Stress Data for Real
Environments
201

Appendix C Experiment Material for Acquiring Observer Stress Data for Real
Environments
202

Appendix C Experiment Material for Acquiring Observer Stress Data for Real
Environments
203

Appendix C Experiment Material for Acquiring Observer Stress Data for Real
Environments
204

Appendix C Experiment Material for Acquiring Observer Stress Data for Real
Environments
205

Appendix C Experiment Material for Acquiring Observer Stress Data for Real
Environments
206

207
References
[1] M. Feuerstein, E. E. Labbé, and A. R. Kuczmierczyk, Health psychology: A
psychobiological perspective: Springer, 1986.
[2] T. Steckler, N. Kalin, and J. Reul, Handbook of Stress and the Brain.
Amsterdam: Elsevier Science, 2005.
[3] S. C. Segerstrom and G. E. Miller, "Psychological stress and the human
immune system: a meta-analytic study of 30 years of inquiry,"
Psychological bulletin, vol. 130, 2004, p. 601.
[4] D. Goleman, Emotional Intelligence. New York: Bantam Books, 1996.
[5] S. J. Torres and C. A. Nowson, "Relationship between stress, eating
behavior, and obesity," Nutrition, vol. 23, 2007, pp. 887-894.
[6] Lifeline-Australia. (2009, 15/03/2013). Stress Costs Taxpayer $300K
Every Day. Available: www.lifeline.org.au
[7] The-American-Institute-of-Stress. (05/03/2012). America's No. 1 Health
Problem - Why is there more stress today? Available:
http://www.stress.org/americas.htm
[8] B. C. Sachs, "Coping with stress," Stress Medicine, vol. 7, 1991, pp. 61-63.
[9] International-Stress-Management-Association-UK. (2010). International
Stress Management Association UK. Available: http://www.isma.org.uk/
[10] SupportLine-UK. (2010). Stress. Available:
http://www.supportline.org.uk/problems/stress.php

References
208
[11] Lifeline-Australia. (2010). Stress Down Day. Available:
http://www.lifeline.org.au/About-Lifeline/Lifeline-Locations/Central-
Australia-NT/News-Articles/Stress-Down-Day/blog.aspx
[12] E. H. Chi, G. Borriello, G. Hunt, and N. Davies, "Guest Editors'
Introduction: Pervasive Computing in Sports Technologies," Pervasive
Computing, IEEE, vol. 4, 2005, pp. 22-25.
[13] M. Kompier and C. L. Cooper, Preventing stress, improving productivity:
European case studies in the workplace: Routledge, 1999.
[14] C. W. Sem-Jacobsen, "Electroencephalographic study of pilot stresses in
flight," Gaustad Hospital - EEG Research Lab, Oslo Norway 1961.
[15] D. A. Hennessy and D. L. Wiesenthal, "Traffic congestion, driver stress,
and driver aggression," Aggressive Behavior, vol. 25, 1999, pp. 409-423.
[16] J. Healey and R. Picard, "Smartcar: Detecting driver stress," in
International Conference on Pattern Recognition, 2000, pp. 218-221.
[17] J. A. Healey and R. W. Picard, "Detecting Stress During Real-World
Driving Tasks Using Physiological Sensors," IEEE Transactions on
Intelligent Transportation Systems, vol. 6, 2005, pp. 156-166.
[18] J. Zhai and A. Barreto, "Stress Detection in Computer Users Based on
Digital Signal Processing of Noninvasive Physiological Variables,"
Proceedings of the 28th IEEE EMBS Annual International Conference, 2006,
pp. 1355-1358.
[19] C. S. Hopkins, R. J. Ratley, D. S. Benincasa, and J. J. Grieco, "Evaluation
of voice stress analysis technology," in Proceedings of the 38th Annual
Hawaii International Conference on System Sciences (HICSS '05), 2005, p.
20b.

References
209
[20] D. Haddad, S. Walter, R. Ratley, and M. Smith, "Investigation and
evaluation of voice stress analysis technology," ed: Air Force Research
Lab Rome NY Information Directorate, 2001.
[21] A. Roscoe, "Assessing pilot workload. Why measure heart rate, HRV and
respiration?," Biological Psychology, vol. 34, 1992, pp. 259-287.
[22] J. B. Sexton, E. J. Thomas, and R. L. Helmreich, "Error, stress, and
teamwork in medicine and aviation: cross sectional surveys," BMJ, vol.
320, 2000, p. 745.
[23] K. J. Kemper and S. C. Danhauer, "Music as therapy," Southern medical
journal, vol. 98, 2005, p. 282.
[24] N. Sharma and T. Gedeon, "Objective measures, sensors and
computational techniques for stress recognition and classification: A
survey," Computer methods and programs in biomedicine, vol. 108, 2012, pp.
1287-1301.
[25] R. S. Lazarus and S. Folkman, Stress, appraisal, and coping: Springer
Publishing Company, 1984.
[26] M. Kumar, M. Weippert, R. Vilbrandt, S. Kreuzfeld, and R. Stoll, "Fuzzy
evaluation of heart rate signals for mental stress assessment," Fuzzy
Systems, IEEE Transactions on, vol. 15, 2007, pp. 791-808.
[27] P. Jin, "Efficacy of tai chi, brisk walking, meditation, and reading in
reducing mental and emotional stress," Journal of Psychosomatic Research,
vol. 36, 1992, pp. 361-370.
[28] J. S. Lerner, R. E. Dahl, A. R. Hariri, and S. E. Taylor, "Facial expressions
of emotion reveal neuroendocrine and cardiovascular stress responses,"
Biological Psychiatry, vol. 61, 2007, pp. 253-260.

References
210
[29] F. E. Ritter, R. Ceballos, A. L. Reifers, and L. C. Klein, "Measuring the
effect of dental work as a stressor on cognition (Tech. Report No. 2005-1):
Applied Cognitive Science Lab," School of Information Sciences and
Technology, 2005,
[30] U. Lundberg, R. Kadefors, B. Melin, G. Palmerud, P. Hassmén, M.
Engström, and I. Elfsberg Dohns, "Psychophysiological stress and EMG
activity of the trapezius muscle," International Journal of behavioral
medicine, vol. 1, 1994, pp. 354-370.
[31] R. K. Dishman, Y. Nakamura, M. E. Garcia, R. W. Thompson, A. L.
Dunn, and S. N. Blair, "Heart rate variability, trait anxiety, and perceived
stress among physically fit men and women," International Journal of
Psychophysiology, vol. 37, 2000, pp. 121-133.
[32] A. Steptoe and M. Marmot, "Impaired cardiovascular recovery following
stress predicts 3-year increases in blood pressure," Journal of hypertension,
vol. 23, 2005, p. 529.
[33] T. Partala and V. Surakka, "Pupil size variation as an indication of
affective processing," International Journal of Human-Computer Studies, vol.
59, 2003, pp. 185-198.
[34] U. Lundberg, "Stress, subjective and objective health," International
Journal of Social Welfare, vol. 15, 2006, pp. 41-48.
[35] E. Labbé, N. Schmidt, J. Babin, and M. Pharr, "Coping with stress: the
effectiveness of different types of music," Applied Psychophysiology and
Biofeedback, vol. 32, 2007, pp. 163-168.
[36] C. D. Katsis, N. Katertsidis, G. Ganiatsas, and D. I. Fotiadis, "Toward
emotion recognition in car-racing drivers: A biosignal processing

References
211
approach," Systems, Man and Cybernetics, Part A: Systems and Humans,
IEEE Transactions on, vol. 38, 2008, pp. 502-512.
[37] L. J. M. Rothkrantz, P. Wiggers, J. W. A. van Wees, and R. J. van Vark,
"Voice stress analysis," Lecture Notes in Computer Science, vol. 3206, 2004,
pp. 449-456.
[38] K. Schindler, L. Van Gool, and B. de Gelder, "Recognizing emotions
expressed by body pose: A biologically inspired neural model," Neural
Networks, vol. 21, 2008, pp. 1238-1246.
[39] I. R. Murray, C. Baber, and A. South, "Towards a definition and working
model of stress and its effects on speech," Speech Communication, vol. 20,
1996, pp. 3-12.
[40] L. Hoffman-Goetz and B. K. Pedersen, "Exercise and the immune system:
a model of the stress response?," Immunology Today, vol. 15, 1994, pp.
382-387.
[41] H. Selye, "Stress and the general adaptation syndrome," British Medical
Journal, vol. 1, 1950, p. 1383.
[42] H. Selye, Selye's Guide to Stress Research vol. 1. New York: Van Nostrand
Reinhold Company, 1980.
[43] B. L. Simmons and D. L. Nelson, "Eustress at work: The relationship
between hope and health in hospital nurses," Health Care Management
Review, vol. 26, 2001, p. 7.
[44] G. O’Sullivan, "The Relationship Between Hope, Eustress, Self-Efficacy,
and Life Satisfaction Among Undergraduates," Social Indicators Research,
2010, pp. 1-18.

References
212
[45] B. L. Simmons and D. L. Nelson, "Eustress at work: extending the holistic
stress model," Positive organizational behavior, 2007, pp. 40-53.
[46] W. H. Gmelch. (1992). Strategies for Dealing with Stress: Taking Care of
Yourself.
[47] T. Vieru. (2010, 20/02/11). Stress, Anxiety Impair Driving Skills.
Softpedia. Available: http://news.softpedia.com/news/Stress-Anxiety-
Impair-Driving-Skills-143554.shtml
[48] F. Nasoz, K. Alvarez, C. L. Lisetti, and N. Finkelstein, "Emotion
recognition from physiological signals using wireless sensors for
presence technologies," Cognition, Technology & Work, vol. 6, 2004, pp. 4-
14.
[49] G. Keinan, "Decision making under stress: Scanning of alternatives
under controllable and uncontrollable threats," Journal of personality and
social psychology, vol. 52, 1987, p. 639.
[50] J. W. Newcomer, G. Selke, A. K. Melson, T. Hershey, S. Craft, K.
Richards, and A. L. Alderson, "Decreased memory performance in
healthy humans induced by stress-level cortisol treatment," Archives of
General Psychiatry, 1999,
[51] E. B. Ansell, K. Rando, K. Tuit, J. Guarnaccia, and R. Sinha, "Cumulative
Adversity and Smaller Gray Matter Volume in Medial Prefrontal,
Anterior Cingulate, and Insula Regions," Biological Psychiatry, 2012, pp.
57-64.
[52] N. Plotnikoff, A. Murgo, R. Faith, and J. Wybran, Stress and Immunity.
Florida: CRC Press, 1991.
References
213
[53] G. E. Miller, S. Cohen, and A. K. Ritchey, "Chronic psychological stress
and the regulation of pro-inflammatory cytokines: a glucocorticoid-
resistance model," Health Psychology Hillsdale, vol. 21, 2002, pp. 531-541.
[54] Black-Dog-Institute. (2013, 20/03/2013). Stress. Available:
http://www.blackdoginstitute.org.au/public/depression/causesofdepr
ession/stress.cfm
[55] L. Vitetta, B. Anton, F. Cortizo, and A. Sali, "Mind Body Medicine: Stress
and Its Impact on Overall Health and Longevity," Annals of the New York
Academy of Sciences, vol. 1057, 2005, pp. 492-505.
[56] S. Hassan, Y. Karpova, D. Baiz, D. Yancey, A. Pullikuth, A. Flores, T.
Register, J. M. Cline, R. D’Agostino Jr, and N. Danial, "Behavioral stress
accelerates prostate cancer development in mice," The Journal of clinical
investigation, vol. 123, 2013, p. 874.
[57] H. Ursin, E. Baade, and S. Levine, Psychobiology of Stress. New York:
Academic Press, 1978.
[58] B. B. C. News. (04/10/2006, 10/09/2010). Black tea 'soothes away stress'.
Available: http://news.bbc.co.uk/2/hi/5405686.stm
[59] P. C. Sakellaris and J. Vernikos-Danellis, "Increased rate of response of
the pituitary-adrenal system in rats adapted to chronic stress,"
Endocrinology, vol. 97, 1975, p. 597.
[60] V. A. Barnes, H. Davis, and F. A. Treiber, "Perceived stress, heart rate,
and blood pressure among adolescents with family members deployed
in Operation Iraqi Freedom," Military medicine, vol. 172, 2007, pp. 40-43.
[61] S. Haugebrook, K. M. Zgoba, T. Maschi, K. Morgen, and D. Brown,
"Trauma, stress, health, and mental health issues among ethnically

References
214
diverse older adult prisoners," Journal of Correctional Health Care, vol. 16,
2010, pp. 220-229.
[62] P. A. Thoits, "Self, identity, stress, and mental health," in Handbook of the
sociology of mental health, ed: Springer, 2013, pp. 357-377.
[63] S. E. Taylor, "Mechanisms linking early life stress to adult health
outcomes," Proceedings of the National Academy of Sciences, vol. 107, 2010,
pp. 8507-8512.
[64] B. von Dawans, U. Fischbacher, C. Kirschbaum, E. Fehr, and M.
Heinrichs, "The Social Dimension of Stress Reactivity Acute Stress
Increases Prosocial Behavior in Humans," Psychological science, vol. 23,
2012, pp. 651-660.
[65] S. S. Inslicht, C. Otte, S. E. McCaslin, B. A. Apfel, C. Henn-Haase, T.
Metzler, R. Yehuda, T. C. Neylan, and C. R. Marmar, "Cortisol
awakening response prospectively predicts peritraumatic and acute
stress reactions in police officers," Biological Psychiatry, vol. 70, 2011, pp.
1055-1062.
[66] T. G. O'Connor, K. Bergman, P. Sarkar, and V. Glover, "Prenatal cortisol
exposure predicts infant cortisol response to acute stress," Developmental
psychobiology, 2012,
[67] L. Lemyre and R. Tessier, "Measuring psychological stress: Concept,
model, and measurement instrument in primary care research," Canadian
family physician, vol. 49, 2003, p. 1159.
[68] Helpguide. (2013, 20/03/2013). Stress Symptoms, Signs and Causes.
Available: http://www.helpguide.org/mental/stress_signs.htm
[69] The-American-Institute-of-Stress. (2013, 20/03/2013). 50 common signs
and symptoms of stress. Available: http://www.stress.org/stress-effects/
References
215
[70] G. E. Sakr, I. H. Elhajj, and U. C. Wejinya, "Multi level SVM for subject
independent agitation detection," in IEEE/ASME International Conference
on Advanced Intelligent Mechatronics, Singapore, 2009, pp. 538-543.
[71] F. Fook, P. V. Thang, T. M. Htwe, Q. Qiang, A. A. P. Wai, M.
Jayachandran, J. Biswas, and P. Yap, "Automated recognition of complex
agitation behavior of dementia patients using video camera," 2007, pp.
68-73.
[72] P. Lo and S. Wu, "Effect of Zen Meditation Practice on Perceived Stress
in College Students: A Survey Study," Biomedical Engineering Applications
Basis Communications, vol. 19, 2007, p. 409.
[73] D. Bersak, G. McDarby, N. Augenblick, P. McDarby, D. McDonnell, B.
McDonald, and R. Karkun, "Intelligent biofeedback using an immersive
competitive environment," presented at the Designing Ubiquitous
Computing Games Workshop at UbiComp 2001, Atlanta, GA, USA, 2001.
[74] N. Sudheesh and K. Joseph, "Investigation into the effects of music and
meditation on galvanic skin response," ITBM-RBM, vol. 21, 2000, pp.
158-163.
[75] T. Lin and L. John, "Quantifying mental relaxation with EEG for use in
computer games," in International Conference on Internet Computing, Las
Vegas, Nevada, USA, 2006, pp. 409–415.
[76] T. Lin, M. Omata, W. Hu, and A. Imamiya, "Do physiological data relate
to traditional usability indexes?," Proceedings of the 17th Australia
conference on Computer-Human Interaction: Citizens Online: Considerations
for Today and the Future, 2005, pp. 1-10.
[77] W. R. Lovallo, Stress & health: Biological and psychological interactions: Sage
Publications, Inc, 2005.
References
216
[78] C. L. Lisetti and F. Nasoz, "Using noninvasive wearable computers to
recognize human emotions from physiological signals," EURASIP Journal
on Applied Signal Processing, vol. 2004, 2004, pp. 1672-1687.
[79] U. Rimmele, B. C. Zellweger, B. Marti, R. Seiler, C. Mohiyeddini, U.
Ehlert, and M. Heinrichs, "Trained men show lower cortisol, heart rate
and psychological responses to psychosocial stress compared with
untrained men," Psychoneuroendocrinology, vol. 32, 2007, pp. 627-635.
[80] A. Barreto, J. Zhai, and M. Adjouadi, "Non-intrusive physiological
monitoring for automated stress detection in human-computer
interaction," Human–Computer Interaction, 2007, pp. 29-38.
[81] J. Zhai and A. Barreto, "Stress recognition using non-invasive
technology," in Proceedings of the 19th International Florida Artificial
Intelligence Research Society Conference FLAIRS, 2006, pp. 395–400.
[82] J. W. Hughes and C. M. Stoney, "Depressed mood is related to high-
frequency heart rate variability during stressors," Psychosomatic Medicine,
vol. 62, 2000, p. 796.
[83] A. C. Hackney, "Exercise as a stressor to the human neuroendocrine
system," Medicina (Kaunas), vol. 42, 2006, pp. 788-97.
[84] M. Hamer, A. Taylor, and A. Steptoe, "The effect of acute aerobic
exercise on stress related blood pressure responses: a systematic review
and meta-analysis," Biological Psychology, vol. 71, 2006, pp. 183-190.
[85] B. L. Alderman, S. M. Arent, D. M. Landers, and T. J. Rogers, "Aerobic
exercise intensity and time of stressor administration influence
cardiovascular responses to psychological stress," Psychophysiology, vol.
44, 2007, pp. 759-766.

References
217
[86] T. McMorris, K. Collard, J. Corbett, M. Dicks, and J. Swain, "A test of the
catecholamines hypothesis for an acute exercise-cognition interaction,"
Pharmacology Biochemistry and Behavior, vol. 89, 2008, pp. 106-115.
[87] A. Winzer, C. Ring, D. Carroll, G. Willemsen, M. Drayson, and M.
Kendall, "Secretory immunoglobulin A and cardiovascular reactions to
mental arithmetic, cold pressor, and exercise: Effects of beta adrenergic
blockade," Psychophysiology, vol. 36, 1999, pp. 591-601.
[88] C. France and B. Ditto, "Cardiovascular responses to the combination of
caffeine and mental arithmetic, cold pressor, and static exercise
stressors," Psychophysiology, vol. 29, 1992, pp. 272-282.
[89] I. Ulstein, T. B. Wyller, and K. Engedal, "High score on the Relative
Stress Scale, a marker of possible psychiatric disorder in family carers of
patients with dementia," International journal of geriatric psychiatry, vol.
22, 2007, pp. 195-202.
[90] J. J. Miller, K. Fletcher, and J. Kabat-Zinn, "Three-year follow-up and
clinical implications of a mindfulness meditation-based stress reduction
intervention in the treatment of anxiety disorders* 1," General Hospital
Psychiatry, vol. 17, 1995, pp. 192-200.
[91] G. Weidner, R. Friend, T. J. Ficarrotto, and N. R. Mendell, "Hostility and
cardiovascular reactivity to stress in women and men," Psychosomatic
Medicine, vol. 51, 1989, p. 36.
[92] J. E. Wartella, S. M. Auerbach, and K. R. Ward, "Emotional distress,
coping and adjustment in family members of neuroscience intensive care
unit patients," Journal of Psychosomatic Research, vol. 66, 2009, pp. 503-509.

References
218
[93] K. Vedhara, J. Hyde, I. Gilchrist, M. Tytherleigh, and S. Plummer, "Acute
stress, memory, attention and cortisol," Psychoneuroendocrinology, vol. 25,
2000, pp. 535-549.
[94] I. BIOPAC Systems. MP System Hardware Guide. Available:
www.biopac.com
[95] S. Scherer, H. Hofmann, M. Lampmann, M. Pfeil, S. Rhinow, F.
Schwenker, and G. Palm, "Emotion recognition from speech: Stress
experiment," in Proceedings of the 6th International Language Resources and
Evaluation (LREC 2008), Marrakech, Morocco, 2008.
[96] T. French, L. Weiss, M. Waters, J. Tesoriero, R. Finkelstein, and B. Agins,
"Correlation of a brief perceived stress measure with nonadherence to
antiretroviral therapy over time," JAIDS Journal of Acquired Immune
Deficiency Syndromes, vol. 38, 2005, p. 590.
[97] J. Siegrist, N. Wege, F. Pühlhofer, and M. Wahrendorf, "A short generic
measure of work stress in the era of globalization: effort–reward
imbalance," International archives of occupational and environmental health,
vol. 82, 2009, pp. 1005-1013.
[98] C. E. Cooper, S. S. McLanahan, S. O. Meadows, and J. Brooks Gunn,
"Family structure transitions and maternal parenting stress," Journal of
Marriage and Family, vol. 71, 2009, pp. 558-574.
[99] C. Tennant and G. Andrews, "A scale to measure the stress of life
events," Australasian Psychiatry, vol. 10, 1976, pp. 27-32.
[100] G. M. Wilson and M. A. Sasse, "Do users always know what’s good for
them? Utilising physiological responses to assess media quality," in
People and Computers XIV—Usability or Else!, ed: Springer, 2000, pp. 327-
339.
References
219
[101] M. Kellmann and K. W. Kallus, Recovery-stress questionnaire for athletes:
user manual: Human Kinetics Europe Ltd, 2001.
[102] J. A. Harris, R. Saltstone, and M. Fraboni, "An evaluation of the job stress
questionnaire with a sample of entrepreneurs," Journal of Business and
Psychology, vol. 13, 1999, pp. 447-455.
[103] W. Jänig and E. M. McLachlan, "Characteristics of function-specific
pathways in the sympathetic nervous system," Trends in neurosciences,
vol. 15, 1992, pp. 475-481.
[104] P. J. Lang, M. K. Greenwald, M. M. Bradley, and A. O. Hamm, "Looking
at pictures: Affective, facial, visceral, and behavioral reactions,"
Psychophysiology, vol. 30, 1993, pp. 261-273.
[105] H. Seyle, The stress of life. New York: McGraw-Hill, 1956.
[106] P. Ferreira, P. Sanches, K. Höök, and T. Jaensson, "License to chill!: how
to empower users to cope with stress," Proceedings of the 5th Nordic
conference on Human-computer interaction: building bridges, 2008, pp. 123-
132.
[107] W. Liao, W. Zhang, Z. Zhu, and Q. Ji, "A real-time human stress
monitoring system using dynamic bayesian network," Computer Vision
and Pattern Recognition - Workshops, 2005, p. 70.
[108] S. C. Jacobs, R. Friedman, J. D. Parker, G. H. Tofler, A. H. Jimenez, J. E.
Muller, H. Benson, and P. H. Stone, "Use of skin conductance changes
during mental stress testing as an index of autonomic arousal in
cardiovascular research," American Heart Journal, vol. 128, 1994, pp. 1170-
1177.
[109] Y. Shi, N. Ruiz, R. Taib, E. Choi, and F. Chen, "Galvanic skin response
(GSR) as an index of cognitive load," in CHI '07 extended abstracts on

References
220
Human factors in computing systems, San Jose, CA, USA, 2007, pp. 2651-
2656.
[110] L. H. Miller and B. M. Shmavonian, "Replicability of two GSR indices as
a function of stress and cognitive activity," Journal of Personality and Social
Psychology, 1965, pp. 753-756.
[111] B. S. McEwen and R. M. Sapolsky, "Stress and cognitive function,"
Journal of Current Opinion in Neurobiology, vol. 5, 1995, pp. 205–216.
[112] Affectiva. (2012). Q Sensor. Available: http://www.affectiva.com/q-
sensor/
[113] Apex-Fitness. BodyBugg. Available: http://www.bodybugg.com/
[114] J. A. Healey, "Wearable and automotive systems for affect recognition
from physiology," Media Arts and Sciences. Cambridge, Massachusetts
Institute of Technology. Doctor of Philosophy, 2000,
[115] U. Rajendra Acharya, K. Paul Joseph, N. Kannathal, C. M. Lim, and J. S.
Suri, "Heart rate variability: a review," Medical and Biological Engineering
and Computing, vol. 44, 2006, pp. 1031-1051.
[116] J. P. Niskanen, M. P. Tarvainen, P. O. Ranta-aho, and P. A. Karjalainen,
"Software for advanced HRV analysis," Computer methods and programs in
biomedicine, vol. 76, 2004, pp. 73-82.
[117] D. W. Rowe, J. Sibert, and D. Irwin, "Heart rate variability: indicator of
user state as an aid to human-computer interaction," in Proceedings of the
SIGCHI conference on Human factors in computing systems, Los Angeles,
California, United States, 1998, pp. 480-487.
[118] Western Cape Direct. (2010). StressEraser. Available:
http://stresseraser.com/
References
221
[119] HeartMath Australasia. (2010). emWave. Available:
http://www.emwave.com.au/
[120] G. D. Clifford, "Signal processing methods for heart rate variability,"
Doctor of Philosophy, Engineering Science, University of Oxford, 2002.
[121] D. Bansal, M. Khan, and A. Salhan, "A Review of Measurement and
Analysis of Heart Rate Variability," in International Conference on
Computer and Automation Engineering (ICCAE '09), Bangkok, Thailand,
2009, pp. 243-246.
[122] R. B. Devereux, M. J. Roman, V. Palmieri, P. M. Okin, K. Boman, E.
Gerdts, M. S. Nieminen, V. Papademetriou, K. Wachtell, and B. Dahlöf,
"Left ventricular wall stresses and wall stress-mass-heart rate products in
hypertensive patients with electrocardiographic left ventricular
hypertrophy: the LIFE study," Journal of hypertension, vol. 18, 2000, pp.
1129-1138.
[123] P. E. Bonoris, P. S. Greenberg, M. J. Castellanet, and M. H. Ellestad,
"Significance of changes in R wave amplitude during treadmill stress
testing: Angiographic correlation," The American Journal of Cardiology, vol.
41, 1978, pp. 846-851.
[124] B. F. Robinson, S. E. Epstein, G. D. Beiser, and E. Braunwald, "Control of
Heart Rate by the Autonomic Nervous System: Studies in Man on the
Interrelation Between Baroreceptor Mechanisms and Exercise,"
Circulation Research, vol. 19, August 1, 1966 1966, pp. 400-411.
[125] L. Salahuddin and D. Kim, "Detection of acute stress by heart rate
variability using a prototype mobile ECG sensor," Hybrid Information
Technology, ICHIT, vol. 6, 2006, pp. 453-459.

References
222
[126] R. Bailón, P. Laguna, L. Mainardi, and L. Sornmo, "Analysis of heart rate
variability using time-varying frequency bands based on respiratory
frequency," in 29th Annual International Conference of the IEEE Engineering
in Medicine and Biology Society (EMBS 2007), Lyon, 2007, pp. 6674-6677.
[127] T. Force, "Heart rate variability: standards of measurement,
physiological interpretation and clinical use. Task Force of the European
Society of Cardiology and the North American Society of Pacing and
Electrophysiology," Circulation, vol. 93, 1996, pp. 1043-65.
[128] N. Hjortskov, D. Rissén, A. Blangsted, N. Fallentin, U. Lundberg, and K.
Søgaard, "The effect of mental stress on heart rate variability and blood
pressure during computer work," European journal of applied physiology,
vol. 92, 2004, pp. 84-89.
[129] Z. Dharmawan, "Analysis of Computer Games Player Stress Level Using
EEG Data," Master of Science Thesis Report, Faculty of Electrical
Engineering, Mathematics and Computer Science, Delft University of
Technology, Netherlands, 2007.
[130] Interactive-Productline. (2013, 10/02/2013). Interactive Productline IP AB -
Mindball. Available: http://www.mindball.se/index.html
[131] D. Novák, L. Lhotská, V. Eck, and M. Sorf, "EEG and VEP signal
processing," Technical Report. Czech Technical University in Prague,
Department of Cybernetics, 2004,
[132] R. Horlings, D. Datcu, and L. J. M. Rothkrantz, "Emotion recognition
using brain activity," in Proceedings of the 9th International Conference on
Computer Systems and Technologies and Workshop for PhD Students in
Computing, Gabrovo, Bulgaria, 2008, pp. II. 1-6.
References
223
[133] D. A. Morilak, G. Barrera, D. J. Echevarria, A. S. Garcia, A. Hernandez, S.
Ma, and C. O. Petre, "Role of brain norepinephrine in the behavioral
response to stress," Progress in Neuro-Psychopharmacology and Biological
Psychiatry, vol. 29, 2005, pp. 1214-1224.
[134] P. Cipresso, S. Serino, D. Villani, C. Repetto, L. Sellitti, G. Albani, A.
Mauro, A. Gaggioli, and G. Riva, "Is your phone so smart to affect your
state? An exploratory study based on psychophysiological measures,"
Neurocomputing, vol. 84, 2012, p. 23.
[135] E. Hoffmann, "Brain Training Against Stress: Theory, Methods and
Results from an Outcome Study," Stress Report, vol. 4, 2005, p. 24.
[136] A. N. Simmons, M. P. Paulus, S. R. Thorp, S. C. Matthews, S. B. Norman,
and M. B. Stein, "Functional activation and neural networks in women
with posttraumatic stress disorder related to intimate partner violence,"
Biological Psychiatry, vol. 64, 2008, pp. 681-690.
[137] B. Hjorth, "EEG analysis based on time domain properties,"
Electroencephalography and Clinical Neurophysiology, vol. 29, 1970, pp. 306-
310.
[138] N. Sulaiman, N. H. A. Hamid, Z. H. Murat, and M. N. Taib, "Initial
investigation of human physical stress level using brainwaves," in IEEE
Student Conference on Research and Development (SCOReD), UPM Serdang,
2009, pp. 230-233.
[139] N. H. A. Hamid, N. Sulaiman, S. A. M. Aris, Z. H. Murat, and M. N.
Taib, "Evaluation of human stress using EEG Power Spectrum," in 6th
International Colloquium on Signal Processing and Its Applications (CSPA),
Mallaca City, 2010, pp. 1-4.

References
224
[140] M. J. Katz, "Fractals and the analysis of waveforms," Computers in biology
and medicine, vol. 18, 1988, pp. 145-156.
[141] M. Honal and T. Schultz, "Identifying user state using
electroencephalographic data," presented at the Workshop on Multimodal
Multipary Meeting, Trento, Italy, 2005.
[142] T. Pickering, R. Devereux, G. James, W. Gerin, P. Landsbergis, P. Schnall,
and J. Schwartz, "Environmental influences on blood pressure and the
role of job strain," Journal of hypertension. Supplement: official journal of the
International Society of Hypertension, vol. 14, 1996, pp. 179-185.
[143] S. Reisman, "Measurement of physiological stress," in Bioengineering
Conference, 1997, pp. 21-23.
[144] K. J. Heilman, M. Handelman, G. Lewis, and S. W. Porges, "Accuracy of
the StressEraser® in the Detection of Cardiac Rhythms," Applied
Psychophysiology and Biofeedback, vol. 33, 2008, pp. 83-89.
[145] HeartMath. (2010). The Science Behind the emWave® Desktop & emWave2
Products. Available: http://www.heartmathstore.com/cgi-
bin/category.cgi?category=sciencebehind
[146] N. Carter, D. Young, and J. Ferryman, "A combined bayesian markovian
approach for behaviour recognition," Pattern Recognition, vol. 1, 2006, pp.
761-764.
[147] A. Liu and D. Salvucci, "Modeling and prediction of human driver
behavior," in 9th International Conference on Human Computer Interaction,
New Orleans, USA, 2001, pp. 235-244.
[148] A. Pentland and A. Liu, "Modeling and prediction of human behavior,"
Neural Computation, vol. 11, 1999, pp. 229-242.

References
225
[149] Google. (2010). NEVEN Vision. Available:
http://www.nevenvision.com/
[150] D. F. Dinges, R. L. Rider, J. Dorrian, E. L. McGlinchey, N. L. Rogers, Z.
Cizman, S. K. Goldenstein, C. Vogler, S. Venkataraman, and D. N.
Metaxas, "Optical computer recognition of facial expressions associated
with stress induced by performance demands," Aviation, space, and
environmental medicine, vol. 76, 2005, pp. B172-B182.
[151] M. Jabon, J. Bailenson, E. Pontikakis, L. Takayama, and C. Nass, "Facial
Expression Analysis for Predicting Unsafe Driving Behavior," IEEE
Pervasive Computing, vol. 10, 2010, pp. 84-95.
[152] J. Susskind, G. Littlewort, M. Bartlett, J. Movellan, and A. Anderson,
"Human and computer recognition of facial expressions of emotion,"
Neuropsychologia, vol. 45, 2007, pp. 152-162.
[153] S. Dubuisson, F. Davoine, and M. Masson, "A solution for facial
expression representation and recognition," Signal Processing: Image
Communication, vol. 17, 2002, pp. 657-673.
[154] W. S. Peavler, "Pupil size, information overload, and performance
differences," Psychophysiology, vol. 11, 1974, pp. 559-566.
[155] A. Barreto, Y. Gao, and M. Adjouadi, "Pupil diameter measurements:
untapped potential to enhance computer interaction for eye tracker
users?," in Proceedings of the 10th international ACM SIGACCESS
conference on Computers and accessibility, Halifax, Nova Scotia, Canada,
2008, pp. 269-270.
[156] S. Machines. (2010). FaceLAB. Available:
http://www.seeingmachines.com/product/facelab/

References
226
[157] M. Haak, S. Bos, S. Panic, and L. J. M. Rothkrantz, "Detecting Stress
Using Eye Blinks and Brain Activity From EEG Signals," in Proceeding of
the 1st Driver Car Interaction and Interface (DCII 2008), Chez Technical
University, Prague, 2008, p. 10.
[158] P. Wittels, B. Johannes, R. Enne, K. Kirsch, and H. C. Gunga, "Voice
monitoring to measure emotional load during short-term stress,"
European journal of applied physiology, vol. 87, 2002, pp. 278-282.
[159] C. E. Williams and K. N. Stevens, "On determining the emotional state of
pilots during flight: An exploratory study," Aerospace Medicine, vol. 40,
1969, pp. 1369-1372.
[160] T. L. Nwe, S. W. Foo, and L. C. De Silva, "Speech emotion recognition
using hidden Markov models," Speech Communication, vol. 41, 2003, pp.
603-623.
[161] K. Gopalan, "On the effect of stress on certain modulation parameters of
speech," in IEEE International Conference on Acoustics, Speech, and Signal
Processing (ICASSP '01), Salt Lake City, 2001, pp. 101-104.
[162] J. Hansen and S. Patil, "Speech under stress: Analysis, modeling and
recognition," Speaker Classification I, 2007, pp. 108-137.
[163] R. Fernandez and R. W. Picard, "Modeling drivers' speech under stress,"
Speech Communication, vol. 40, 2003, pp. 145-159.
[164] D. Ververidis and C. Kotropoulos, "Emotional speech recognition:
Resources, features, and methods," Speech Communication, vol. 48, 2006,
pp. 1162-1181.
[165] J. Ang, R. Dhillon, A. Krupski, E. Shriberg, and A. Stolcke, "Prosody-
based automatic detection of annoyance and frustration in human-

References
227
computer dialog," in 7th International Conference on Spoken Language
Processing, Denver, Colorado, USA, 2002, pp. 2037-2040.
[166] M. Rahurkar, J. Hansen, J. Meyerhoff, G. Saviolakis, and M. Koenig,
"Frequency band analysis for stress detection using a Teager energy
operator based feature," in 7th International Conference on Spoken Language
Processing, Denver, Colorado, USA, 2002, pp. 2021-2024.
[167] X. Liu, "Voice stress analysis: Detection of deception," Master's Thesis at
the University of Sheffield, Department of Computer Science, 2005,
[168] S. A. Hosseini and M. A. Khalilzadeh, "Emotional stress recognition
system using EEG and psychophysiological signals: Using new labelling
process of EEG signals in emotional stress state," in International
Conference of Biomedical Engineering and Computer Science (ICBECS), 2010,
pp. 1-6.
[169] Mindplace. ThoughtStream. Available:
http://www.mindplace.com/Mindplace-Thoughtstream-USB-Personal-
Biofeedback/dp/B005NDGPLC
[170] Mindplace. Procyon. Available:
http://www.mindplace.com/Mindplace-Procyon-System-Meditation-
Machine/dp/B005NDHWWI
[171] Mindplace. (2012). Proteus. Available:
http://www.mindplace.com/MindPlace-Proteus-Light-Meditation-
Machine/dp/B005NDED02
[172] Mathworks. (12/03/2013). Matlab. Available:
http://www.mathworks.com.au/products/matlab/

References
228
[173] I. BIOPAC Systems. AcqKnowledge Software. Available:
http://www.biopac.com/acqknowledge-data-acquisition-analysis-
software-win
[174] O. Fukuda, Y. Nagata, K. Homma, and T. Tsuji, "Evaluation of heart rate
variability by using wavelet transform and a recurrent neural network,"
in Proceedings of the 23rd Annual International Conference of the IEEE
Engineering in Medicine and Biology Society, 2001, pp. 1769-1772 vol. 2.
[175] W. Siedlecki and J. Sklansky, "A note on genetic algorithms for large-
scale feature selection," Pattern Recognition Letters, vol. 10, 1989, pp. 335-
347.
[176] P. Yacci, "Feature selection of microarray data using genetic algorithms
and artificial neural networks," Rochester Institute of Technology, 2009.
[177] B. J. Park, E. H. Jang, S. H. Kim, C. Huh, and J. H. Sohn, "Feature
selection on multi-physiological signals for emotion recognition," in 2011
International Conference on Engineering and Industries (ICEI), Korea, 2011,
pp. 1-6.
[178] X. Niu, L. Chen, and Q. Chen, "Research on genetic algorithm based on
emotion recognition using physiological signals," in International
Conference on Computational Problem-Solving, 2011, pp. 614-618.
[179] D. E. Goldberg, Genetic algorithms in search, optimization, and machine
learning: Addison-Wesley, 1989.
[180] L. Yu and H. Liu, "Feature selection for high-dimensional data: A fast
correlation-based filter solution," in 12th International Conference on
Machine Learning, 2003, pp. 856-863.
[181] M. M. Bundele and R. Banerjee, "Detection of fatigue of vehicular driver
using skin conductance and oximetry pulse: a neural network approach,"

References
229
in Proceedings of the 11th International Conference on Information Integration
and Web-based Applications and Services, Kuala Lumpur, Malaysia, 2009,
pp. 739-744.
[182] Y. Fukuoka and A. Ishida, "Chronic stress evaluation using neural
networks," Engineering in Medicine and Biology Magazine, IEEE, vol. 19,
2000, pp. 34-38.
[183] J. Han, M. Kamber, and J. Pei, Data Mining: Concepts and Techniques, 3 ed.
San Francisco: Morgan Kaufmann, 2012.
[184] G. Zhou, J. Hansen, and J. Kaiser, "Nonlinear feature based classification
of speech under stress," Speech and Audio Processing, IEEE Transactions on,
vol. 9, 2002, pp. 201-216.
[185] B. Schuller, G. Rigoll, and M. Lang, "Hidden Markov model-based
speech emotion recognition," in IEEE International Conference on
Acoustics, Speech, and Signal Processing (ICASSP '03), 2003, pp. II-1-4.
[186] M. Kumar, D. Arndt, S. Kreuzfeld, K. Thurow, N. Stoll, and R. Stoll,
"Fuzzy Techniques for Subjective Workload-Score Modeling Under
Uncertainties," Systems, Man, and Cybernetics, Part B: Cybernetics, IEEE
Transactions on, vol. 38, 2008, pp. 1449-1464.
[187] M. Kumar, M. Weippert, D. Arndt, S. Kreuzfeld, K. Thurow, N. Stoll,
and R. Stoll, "Fuzzy filtering for physiological signal analysis," Fuzzy
Systems, IEEE Transactions on, vol. 18, 2010, pp. 208-216.
[188] H. Kurose, K. Ito, and S. Nishida, "A Method for Selecting Facial
Expression based on Emotions and Its Application for Text Reading," in
IEEE International Conference on Systems, Man and Cybernetics (SMC '06),
Taipei, 2006, pp. 4028-4033.

References
230
[189] A. Niculescu, Y. Cao, and A. Nijholt, "Manipulating Stress and Cognitive
Load in Conversational Interactions with a Multimodal System for Crisis
Management Support," Development of Multimodal Interfaces: Active
Listening and Synchrony, 2010, pp. 134-147.
[190] L. M. Vizer, L. Zhou, and A. Sears, "Automated stress detection using
keystroke and linguistic features: An exploratory study," International
Journal of Human-Computer Studies, vol. 67, 2009, pp. 870-886.
[191] Australian-Bureau-of-Statistics. (2011, 03/12/2012). Arts and Culture in
Australia: A Statistical Overview, 2011. Available:
http://www.abs.gov.au/Ausstats/[email protected]/0/32049C1F6913E595CA2
57968000CB4B2?opendocument
[192] D. Hinckley. (2012, 12/06/2013). Americans spend 34 hours a week watching
TV, according to Nielsen numbers. Available:
http://www.nydailynews.com/entertainment/tv-movies/americans-
spend-34-hours-week-watching-tv-nielsen-numbers-article-
1.1162285#ixzz2VypVJgCo
[193] Television-Bureau-of-Canada, "TV Basics 2012-2013," Toronto2013.
[194] N. Sharma and T. Gedeon, "Artificial Neural Network Classification
Models for Stress in Reading," in International Conference on Neural
Information Processing, Doha, Qatar, 2012, pp. 388-395.
[195] N. Sharma and T. Gedeon, "Computational Models of Stress in Reading
Using Physiological and Physical Sensor Data," in Pacific-Asia Conference
in Knowledge Discovery and Data Mining, Gold Coast, Australia, 2013, pp.
111-122.
[196] N. Sharma and T. Gedeon, "Hybrid Genetic Algorithms for Stress
Recognition in Reading," in Evolutionary Computation, Machine Learning

References
231
and Data Mining in Bioinfomatics, L. Vanneschi, W. Bush, and M.
Giacobini, Eds., ed Vienna, Austria: Springer Berlin Heidelberg, 2013,
pp. 117-128.
[197] N. Sharma and T. Gedeon, "Optimal Time Segments for Stress
Detection," in International Conference on Machine Learning and Data
Mining, New York, 2013, pp. 421-433.
[198] J. D. Hill and L. N. Boyle, "Driver stress as influenced by driving
maneuvers and roadway conditions," Transportation Research Part F:
Traffic Psychology and Behaviour, vol. 10, 2007, pp. 177-186.
[199] S. H. Min, J. Lee, and I. Han, "Hybrid genetic algorithms and support
vector machines for bankruptcy prediction," Expert Systems with
Applications, vol. 31, 2006, pp. 652-660.
[200] M. S. Mohamad, S. Deris, and R. M. Illias, "A hybrid of genetic algorithm
and support vector machine for features selection and classification of
gene expression microarray," International Journal of Computational
Intelligence and Applications, vol. 5, 2005, pp. 91-107.
[201] D. S. Kim, H. N. Nguyen, and J. S. Park, "Genetic algorithm to improve
SVM based network intrusion detection system," in International
Conference on Advanced Information Networking and Applications, 2005, pp.
155-158.
[202] K. Jadav and M. Panchal, "Optimizing Weights of Artificial Neural
Networks using Genetic Algorithms," International Journal of Advanced
Research in Computer Science and Electronics Engineering (IJARCSEE), vol.
1, 2012, pp. pp: 47-51.
[203] B. Samanta, K. Al-Balushi, and S. Al-Araimi, "Artificial neural networks
and support vector machines with genetic algorithm for bearing fault
References
232
detection," Engineering Applications of Artificial Intelligence, vol. 16, 2003,
pp. 657-665.
[204] S. Oreski, D. Oreski, and G. Oreski, "Hybrid system with genetic
algorithm and artificial neural networks and its application to retail
credit risk assessment," Expert Systems with Applications, vol. 39, 2012, pp.
12605-12617.
[205] J. Bakker, M. Pechenizkiy, and N. Sidorova, "What's your current stress
level? detection of stress patterns from gsr sensor data," in International
Conference on Data Mining Workshops (ICDMW), Vancouver, BC, 2011, pp.
573-580.
[206] N. Sharma, T. Gedeon, and S. Mendis, "Evolutionary algorithms using
cluster patterns for timetabling," Intelligent Decision Technologies Journal,
2013, pp. 137-150.
[207] N. Sharma and T. Gedeon, "Modelling Stress Recognition in Typical
Virtual Environments," in International Conference on Pervasive Computing
Technologies for Healthcare, Venice, Italy, 2013, pp. 441-448.
[208] N. Sharma, A. Dhall, T. Gedeon, and R. Goeke, "Thermal Facial Pattern
Recognition for Stress Using a Spatio-Temporal Approach," 2013, p. 15.
[209] J. J. Gross and R. W. Levenson, "Emotion elicitation using films,"
Cognition & Emotion, vol. 9, 1995, pp. 87-108.
[210] V. Struc and N. Pavesic, "The Complete Gabor-Fisher Classifier for
Robust Face Recognition," EURASIP Advances in Signal Processing, 2010,
p. 26.
[211] V. Struc and N. Pavesic, "Gabor-Based Kernel Partial-Least-Squares
Discrimination Features for Face Recognition," Informatica (Vilnius), vol.
20, 2009, pp. 115–138.

References
233
[212] V. Struc. (2012, 08/09/2012). The PhD Toolbox: Pretty Helpful Development
Functions for Face Recognition. Available: http://luks.fe.uni-
lj.si/sl/osebje/vitomir/face_tools/PhDface/
[213] Mathworks. (2012, 08/09/2012). Vision TemplateMatcher System Object
R2012a. Available:
http://www.mathworks.com.au/help/vision/ref/vision.templatematc
herclass.html
[214] G. Zhao and M. Pietikainen, "Dynamic texture recognition using local
binary patterns with an application to facial expressions," IEEE
Transactions on Pattern Analysis and Machine Intelligence, vol. 29, 2007, pp.
915-928.
[215] P. Yuen, K. Hong, T. Chen, A. Tsitiridis, F. Kam, J. Jackman, D. James, M.
Richardson, L. Williams, and W. Oxford, "Emotional & Physical Stress
Detection and Classification Using Thermal Imaging Technique," in 3rd
International Conference on Crime Detection and Prevention (ICDP 2009),
London, 2009, pp. 1-6.
[216] M. Taini, G. Zhao, S. Z. Li, and M. Pietikainen, "Facial expression
recognition from near-infrared video sequences," in 19th International
Conference on Pattern Recognition (ICPR), Tampa, 2008, pp. 1-4.
[217] T. Ahonen, A. Hadid, and M. Pietikainen, "Face description with local
binary patterns: Application to face recognition," IEEE Transactions on
Pattern Analysis and Machine Intelligence, vol. 28, 2006, pp. 2037-2041.
[218] American-Psychological-Association, "Stress in America," A. P.
Association, Ed., ed. Washington, DC, 2012.
[219] C. J. Holahan and R. H. Moos, "Life stressors, resistance factors, and
improved psychological functioning: An extension of the stress

References
234
resistance paradigm," Journal of personality and social psychology, vol. 58,
1990, p. 909.
[220] EGI. (2013). Geodesic EEG System 300. Available:
http://www.egi.com/research-division-research-products/eeg-systems
[221] BioSemi. (2013, 20/01/2013). BioSemi. Available:
http://www.biosemi.com/
[222] L. Trujillo, G. Olague, R. Hammoud, and B. Hernandez, "Automatic
feature localization in thermal images for facial expression recognition,"
in IEEE Computer Society Conference on Computer Vision and Pattern
Recognition - Workshops, 2005. CVPR Workshops., San Diego, CA, USA,
2005, p. 14.
[223] P. Michel and R. E. Kaliouby, "Real time facial expression recognition in
video using support vector machines," in 5th International Conference on
Multimodal Interfaces, Vancouver, British Columbia, Canada, 2003, pp.
258-264.
[224] H. Frohlich, O. Chapelle, and B. Scholkopf, "Feature selection for support
vector machines by means of genetic algorithm," in 15th IEEE
International Conference on Tools with Artificial Intelligence, 2003, pp. 142-
148.
[225] N. Sharma and T. Gedeon, "Modelling Observer Stress for Typical Real
Environments," Expert Systems and Applications: An International Journal,
2013, p. 15.
[226] N. Sharma and T. Gedeon, "Modelling a Stress Signal," Applied Soft
Computing - Hybrid Intelligent Methods for Health Technologies, 2013, p. 12.