Embed Size (px)
Citation preview
A Computational Model of Phosphene Appearancefor Epiretinal Prostheses
Jacob Granley1 and Michael Beyeler2
Abstract— Retinal neuroprostheses are the only FDA-approved treatment option for blinding degenerative diseases.A major outstanding challenge is to develop a computationalmodel that can accurately predict the elicited visual percepts(phosphenes) across a wide range of electrical stimuli. Herewe present a phenomenological model that predicts phospheneappearance as a function of stimulus amplitude, frequency, andpulse duration. The model uses a simulated map of nerve fiberbundles in the retina to produce phosphenes with accuratebrightness, size, orientation, and elongation. We validate themodel on psychophysical data from two independent studies,showing that it generalizes well to new data, even with differentstimuli and on different electrodes. Whereas previous modelsfocused on either spatial or temporal aspects of the elicitedphosphenes in isolation, we describe a more comprehensiveapproach that is able to account for many reported visualeffects. The model is designed to be flexible and extensible,and can be fit to data from a specific user. Overall this work isan important first step towards predicting visual outcomes inretinal prosthesis users across a wide range of stimuli.
I. INTRODUCTION
Retinitis pigmentosa (RP) and age-related macular degen-eration (AMD) are degenerative retinal diseases that leadto irreversible vision loss in more than 15 million peopleworldwide. As one promising treatment technology, retinalneuroprostheses [2], [14], [15], [18] aim to restore visionto these individuals by electrically stimulating the remainingretinal cells to evoke neural responses that are interpreted bythe brain as visual percepts (“phosphenes”; see [1]).
However, a growing body of evidence suggests that thevision provided by these devices differs substantially fromnatural eyesight [5], [6], [8]. Retinal implant users oftenreport seeing distorted percepts and require extensive rehabil-itative training to make use of their new vision [6]. Althoughsingle-electrode phosphenes are consistent from trial to trial,they vary across electrodes and users [5], [16]. Therefore,a deeper understanding of how electrical stimulation of theretina affects the quality of the generated artificial vision iscrucial to designing more effective retinal implants.
A major outstanding challenge is to develop a compu-tational model that can accurately predict visual outcomesfor retinal implant users. Modeling the retinal response toelectrical stimulation at a biophysical level (“bottom-up”) ischallenging due to the complexity and variability of retinalcircuitry in the presence of degeneration [13]. Even if an
1Jacob Granley is with the Department of Computer Science, Universityof California, Santa Barbara, CA 93106, USA [email protected]
2Michael Beyeler is with the Departments of Computer Science andPsychological & Brain Sciences, University of California, Santa Barbara,CA 93106, USA [email protected]
superior
inferiortem
pora
l nasal
t
Stimulation Phosphene Brightest Frame
Model
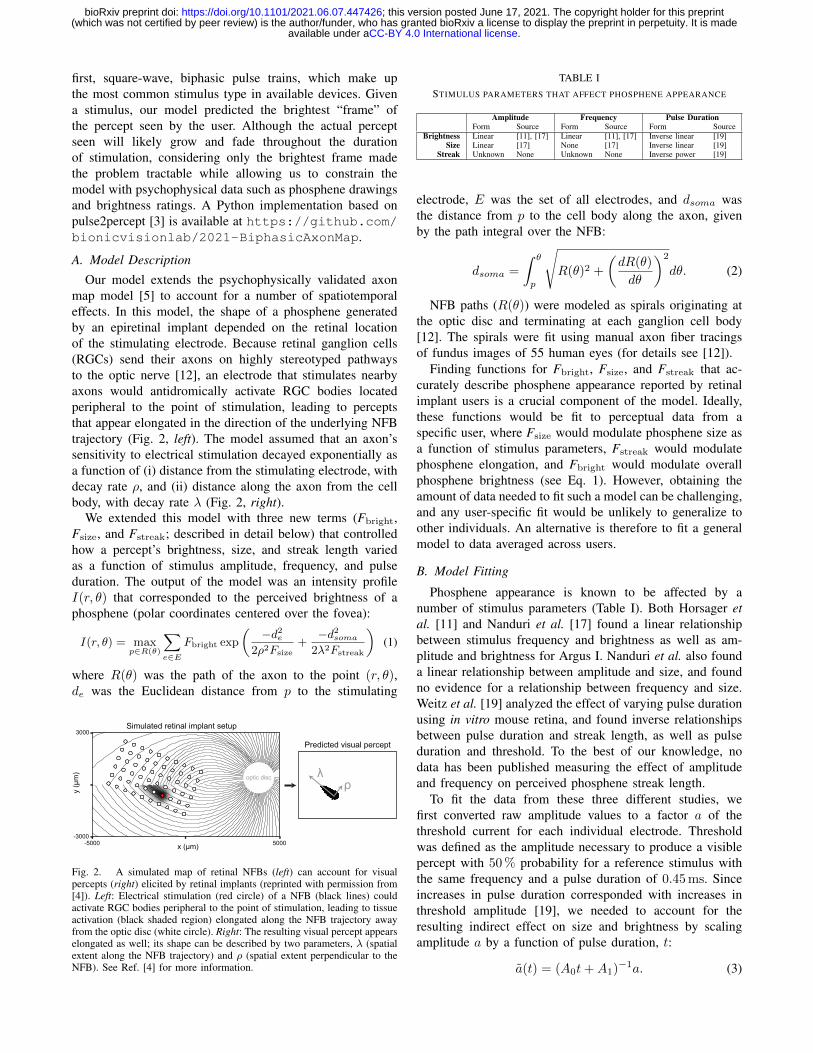
Fig. 1. Phosphene model. A simulated biphasic pulse train is appliedto a simulated epiretinal implant (left; for details see [3]), which evokesthe percept of a flash of light whose brightness and shape evolve over time(middle). Rather than predicting the spatiotemporal properties of the elicitedphosphene, the model directly predicts the brightest frame (right), whichcan be empirically validated using psychophysical data such as phosphenedrawings and brightness ratings.
accurate user-specific biophysical model can be obtained,the detail required for simulation makes these methods toocomputationally expensive for many use cases [9].
In contrast, phosphene models are phenomenological(“top-down”) models constrained by behavioral data thatpredict visual perception directly from electrical stimuli [3].To this end, Horsager et al. [11] predicted perceptual thresh-olds by convolving simulated pulse trains with a cascadeof linear filters and nonlinear processing steps. Nanduri etal. [17] extended this model to generalize to suprathresholdstimulation. However, due to the number of free parametersand lack of an independent test set, these models should beviewed as descriptive rather than predictive models [17]. Inaddition, these models are unable to explain many reportedspatial effects, such as phosphene elongation. To this end,Beyeler et al. [5] demonstrated that the phosphene shapeelicited by epiretinal implants could be predicted by the spa-tial activation pattern of retinal nerve fiber bundles (NFBs).However, this cannot explain many reported temporal effects.
To address these challenges, we propose a phenomeno-logical model constrained by both psychophysical [11], [17]and electrophysiological data [19] that predicts phospheneshape as a function of stimulus properties, such as amplitude,frequency, and pulse duration. The model is designed to beflexible and extensible so that it provides good predictionson average but can also be fit to data from a specific user.
II. METHODS
An overview of our model is given in Fig. 1. We assumedthe subject is implanted with an epiretinal implant, such asArgus II [15] or POLYRETINA [7]. We focused on cathodic-
.CC-BY 4.0 International licenseavailable under a(which was not certified by peer review) is the author/funder, who has granted bioRxiv a license to display the preprint in perpetuity. It is made
The copyright holder for this preprintthis version posted June 17, 2021. ; https://doi.org/10.1101/2021.06.07.447426doi: bioRxiv preprint
first, square-wave, biphasic pulse trains, which make upthe most common stimulus type in available devices. Givena stimulus, our model predicted the brightest “frame” ofthe percept seen by the user. Although the actual perceptseen will likely grow and fade throughout the durationof stimulation, considering only the brightest frame madethe problem tractable while allowing us to constrain themodel with psychophysical data such as phosphene drawingsand brightness ratings. A Python implementation based onpulse2percept [3] is available at https://github.com/bionicvisionlab/2021-BiphasicAxonMap.
A. Model DescriptionOur model extends the psychophysically validated axon
map model [5] to account for a number of spatiotemporaleffects. In this model, the shape of a phosphene generatedby an epiretinal implant depended on the retinal locationof the stimulating electrode. Because retinal ganglion cells(RGCs) send their axons on highly stereotyped pathwaysto the optic nerve [12], an electrode that stimulates nearbyaxons would antidromically activate RGC bodies locatedperipheral to the point of stimulation, leading to perceptsthat appear elongated in the direction of the underlying NFBtrajectory (Fig. 2, left). The model assumed that an axon’ssensitivity to electrical stimulation decayed exponentially asa function of (i) distance from the stimulating electrode, withdecay rate ρ, and (ii) distance along the axon from the cellbody, with decay rate λ (Fig. 2, right).
We extended this model with three new terms (Fbright,Fsize, and Fstreak; described in detail below) that controlledhow a percept’s brightness, size, and streak length variedas a function of stimulus amplitude, frequency, and pulseduration. The output of the model was an intensity profileI(r, θ) that corresponded to the perceived brightness of aphosphene (polar coordinates centered over the fovea):
I(r, θ) = maxp∈R(θ)
∑e∈E
Fbright exp
(−d2e
2ρ2Fsize+
−d2soma2λ2Fstreak
)(1)
where R(θ) was the path of the axon to the point (r, θ),de was the Euclidean distance from p to the stimulating
ρλ
-5000 5000
3000
-3000
x (µm)
y (µm)
Simulated retinal implant setup
Predicted visual percept
optic disc
Fig. 2. A simulated map of retinal NFBs (left) can account for visualpercepts (right) elicited by retinal implants (reprinted with permission from[4]). Left: Electrical stimulation (red circle) of a NFB (black lines) couldactivate RGC bodies peripheral to the point of stimulation, leading to tissueactivation (black shaded region) elongated along the NFB trajectory awayfrom the optic disc (white circle). Right: The resulting visual percept appearselongated as well; its shape can be described by two parameters, λ (spatialextent along the NFB trajectory) and ρ (spatial extent perpendicular to theNFB). See Ref. [4] for more information.
TABLE ISTIMULUS PARAMETERS THAT AFFECT PHOSPHENE APPEARANCE
Amplitude Frequency Pulse DurationForm Source Form Source Form Source
Brightness Linear [11], [17] Linear [11], [17] Inverse linear [19]Size Linear [17] None [17] Inverse linear [19]
Streak Unknown None Unknown None Inverse power [19]
electrode, E was the set of all electrodes, and dsoma wasthe distance from p to the cell body along the axon, givenby the path integral over the NFB:
dsoma =
∫ θ
p
√R(θ)2 +
(dR(θ)
dθ
)2
dθ. (2)
NFB paths (R(θ)) were modeled as spirals originating atthe optic disc and terminating at each ganglion cell body[12]. The spirals were fit using manual axon fiber tracingsof fundus images of 55 human eyes (for details see [12]).
Finding functions for Fbright, Fsize, and Fstreak that ac-curately describe phosphene appearance reported by retinalimplant users is a crucial component of the model. Ideally,these functions would be fit to perceptual data from aspecific user, where Fsize would modulate phosphene size asa function of stimulus parameters, Fstreak would modulatephosphene elongation, and Fbright would modulate overallphosphene brightness (see Eq. 1). However, obtaining theamount of data needed to fit such a model can be challenging,and any user-specific fit would be unlikely to generalize toother individuals. An alternative is therefore to fit a generalmodel to data averaged across users.
B. Model Fitting
Phosphene appearance is known to be affected by anumber of stimulus parameters (Table I). Both Horsager etal. [11] and Nanduri et al. [17] found a linear relationshipbetween stimulus frequency and brightness as well as am-plitude and brightness for Argus I. Nanduri et al. also founda linear relationship between amplitude and size, and foundno evidence for a relationship between frequency and size.Weitz et al. [19] analyzed the effect of varying pulse durationusing in vitro mouse retina, and found inverse relationshipsbetween pulse duration and streak length, as well as pulseduration and threshold. To the best of our knowledge, nodata has been published measuring the effect of amplitudeand frequency on perceived phosphene streak length.
To fit the data from these three different studies, wefirst converted raw amplitude values to a factor a of thethreshold current for each individual electrode. Thresholdwas defined as the amplitude necessary to produce a visiblepercept with 50% probability for a reference stimulus withthe same frequency and a pulse duration of 0.45ms. Sinceincreases in pulse duration corresponded with increases inthreshold amplitude [19], we needed to account for theresulting indirect effect on size and brightness by scalingamplitude a by a function of pulse duration, t:
a(t) = (A0t+A1)−1a. (3)
.CC-BY 4.0 International licenseavailable under a(which was not certified by peer review) is the author/funder, who has granted bioRxiv a license to display the preprint in perpetuity. It is made
The copyright holder for this preprintthis version posted June 17, 2021. ; https://doi.org/10.1101/2021.06.07.447426doi: bioRxiv preprint
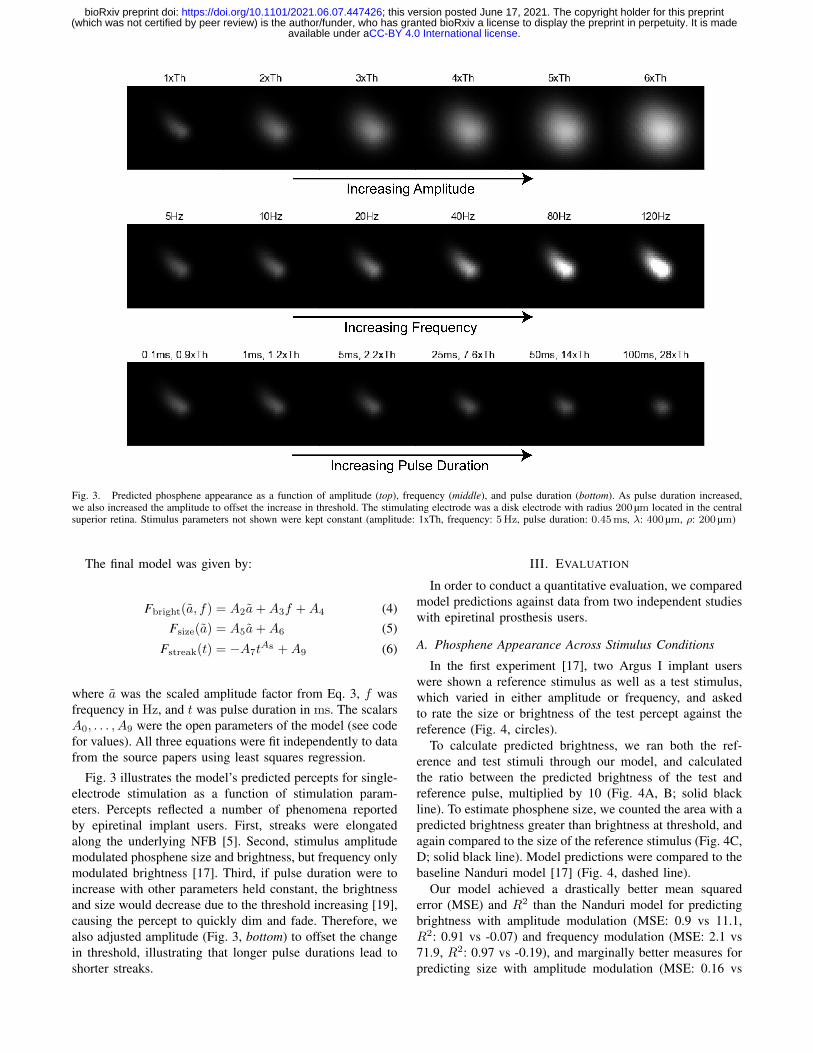
Fig. 3. Predicted phosphene appearance as a function of amplitude (top), frequency (middle), and pulse duration (bottom). As pulse duration increased,we also increased the amplitude to offset the increase in threshold. The stimulating electrode was a disk electrode with radius 200 µm located in the centralsuperior retina. Stimulus parameters not shown were kept constant (amplitude: 1xTh, frequency: 5Hz, pulse duration: 0.45ms, λ: 400 µm, ρ: 200 µm)
The final model was given by:
Fbright(a, f) = A2a+A3f +A4 (4)Fsize(a) = A5a+A6 (5)
Fstreak(t) = −A7tA8 +A9 (6)
where a was the scaled amplitude factor from Eq. 3, f wasfrequency in Hz, and t was pulse duration in ms. The scalarsA0, . . . , A9 were the open parameters of the model (see codefor values). All three equations were fit independently to datafrom the source papers using least squares regression.
Fig. 3 illustrates the model’s predicted percepts for single-electrode stimulation as a function of stimulation param-eters. Percepts reflected a number of phenomena reportedby epiretinal implant users. First, streaks were elongatedalong the underlying NFB [5]. Second, stimulus amplitudemodulated phosphene size and brightness, but frequency onlymodulated brightness [17]. Third, if pulse duration were toincrease with other parameters held constant, the brightnessand size would decrease due to the threshold increasing [19],causing the percept to quickly dim and fade. Therefore, wealso adjusted amplitude (Fig. 3, bottom) to offset the changein threshold, illustrating that longer pulse durations lead toshorter streaks.
III. EVALUATION
In order to conduct a quantitative evaluation, we comparedmodel predictions against data from two independent studieswith epiretinal prosthesis users.
A. Phosphene Appearance Across Stimulus Conditions
In the first experiment [17], two Argus I implant userswere shown a reference stimulus as well as a test stimulus,which varied in either amplitude or frequency, and askedto rate the size or brightness of the test percept against thereference (Fig. 4, circles).
To calculate predicted brightness, we ran both the ref-erence and test stimuli through our model, and calculatedthe ratio between the predicted brightness of the test andreference pulse, multiplied by 10 (Fig. 4A, B; solid blackline). To estimate phosphene size, we counted the area with apredicted brightness greater than brightness at threshold, andagain compared to the size of the reference stimulus (Fig. 4C,D; solid black line). Model predictions were compared to thebaseline Nanduri model [17] (Fig. 4, dashed line).
Our model achieved a drastically better mean squarederror (MSE) and R2 than the Nanduri model for predictingbrightness with amplitude modulation (MSE: 0.9 vs 11.1,R2: 0.91 vs -0.07) and frequency modulation (MSE: 2.1 vs71.9, R2: 0.97 vs -0.19), and marginally better measures forpredicting size with amplitude modulation (MSE: 0.16 vs
.CC-BY 4.0 International licenseavailable under a(which was not certified by peer review) is the author/funder, who has granted bioRxiv a license to display the preprint in perpetuity. It is made
The copyright holder for this preprintthis version posted June 17, 2021. ; https://doi.org/10.1101/2021.06.07.447426doi: bioRxiv preprint
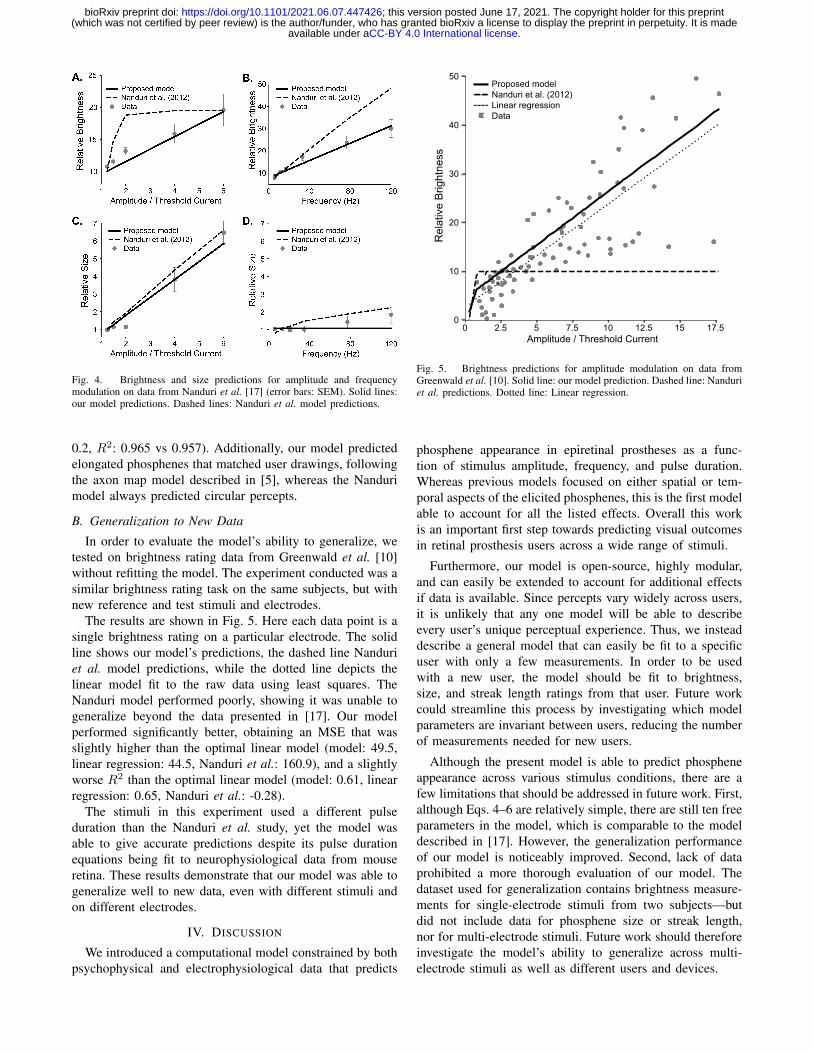
Fig. 4. Brightness and size predictions for amplitude and frequencymodulation on data from Nanduri et al. [17] (error bars: SEM). Solid lines:our model predictions. Dashed lines: Nanduri et al. model predictions.
0.2, R2: 0.965 vs 0.957). Additionally, our model predictedelongated phosphenes that matched user drawings, followingthe axon map model described in [5], whereas the Nandurimodel always predicted circular percepts.
B. Generalization to New Data
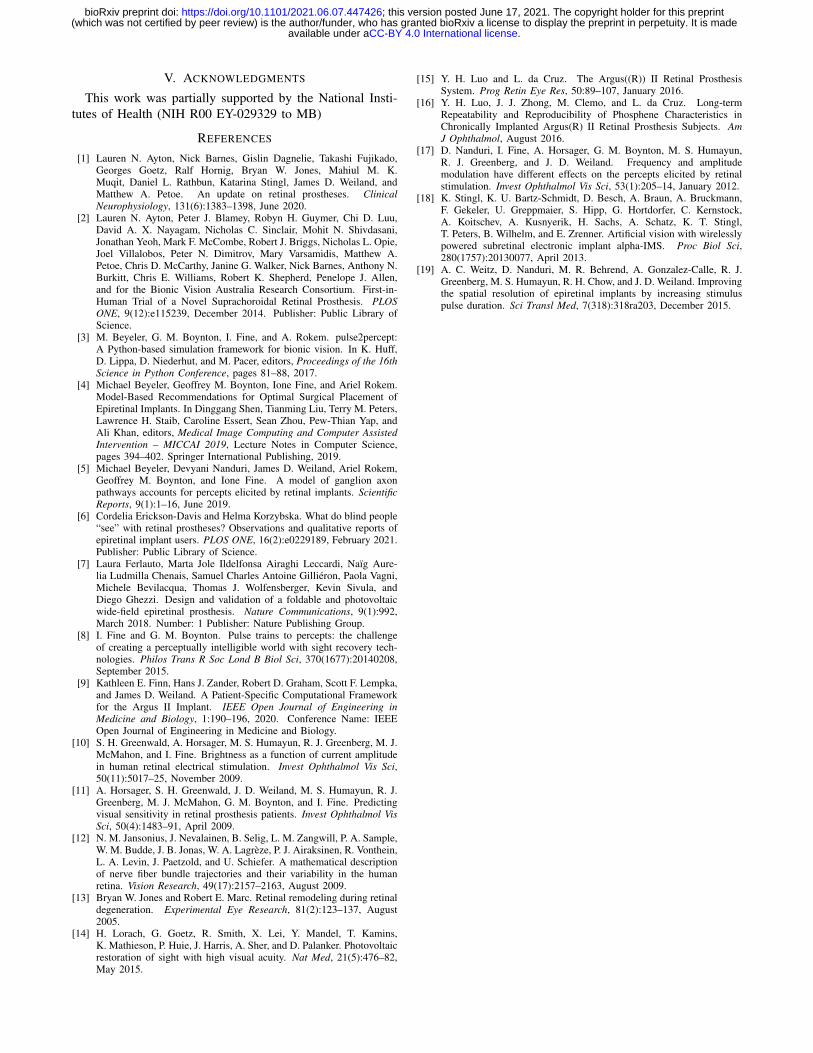
In order to evaluate the model’s ability to generalize, wetested on brightness rating data from Greenwald et al. [10]without refitting the model. The experiment conducted was asimilar brightness rating task on the same subjects, but withnew reference and test stimuli and electrodes.
The results are shown in Fig. 5. Here each data point is asingle brightness rating on a particular electrode. The solidline shows our model’s predictions, the dashed line Nanduriet al. model predictions, while the dotted line depicts thelinear model fit to the raw data using least squares. TheNanduri model performed poorly, showing it was unable togeneralize beyond the data presented in [17]. Our modelperformed significantly better, obtaining an MSE that wasslightly higher than the optimal linear model (model: 49.5,linear regression: 44.5, Nanduri et al.: 160.9), and a slightlyworse R2 than the optimal linear model (model: 0.61, linearregression: 0.65, Nanduri et al.: -0.28).
The stimuli in this experiment used a different pulseduration than the Nanduri et al. study, yet the model wasable to give accurate predictions despite its pulse durationequations being fit to neurophysiological data from mouseretina. These results demonstrate that our model was able togeneralize well to new data, even with different stimuli andon different electrodes.
IV. DISCUSSION
We introduced a computational model constrained by bothpsychophysical and electrophysiological data that predicts
Proposed modelNanduri et al. (2012)
DataLinear regression
0
Rel
ativ
e Br
ight
ness
17.51512.5107.552.50
50
10
20
30
40
Amplitude / Threshold Current
Fig. 5. Brightness predictions for amplitude modulation on data fromGreenwald et al. [10]. Solid line: our model prediction. Dashed line: Nanduriet al. predictions. Dotted line: Linear regression.
phosphene appearance in epiretinal prostheses as a func-tion of stimulus amplitude, frequency, and pulse duration.Whereas previous models focused on either spatial or tem-poral aspects of the elicited phosphenes, this is the first modelable to account for all the listed effects. Overall this workis an important first step towards predicting visual outcomesin retinal prosthesis users across a wide range of stimuli.
Furthermore, our model is open-source, highly modular,and can easily be extended to account for additional effectsif data is available. Since percepts vary widely across users,it is unlikely that any one model will be able to describeevery user’s unique perceptual experience. Thus, we insteaddescribe a general model that can easily be fit to a specificuser with only a few measurements. In order to be usedwith a new user, the model should be fit to brightness,size, and streak length ratings from that user. Future workcould streamline this process by investigating which modelparameters are invariant between users, reducing the numberof measurements needed for new users.
Although the present model is able to predict phospheneappearance across various stimulus conditions, there are afew limitations that should be addressed in future work. First,although Eqs. 4–6 are relatively simple, there are still ten freeparameters in the model, which is comparable to the modeldescribed in [17]. However, the generalization performanceof our model is noticeably improved. Second, lack of dataprohibited a more thorough evaluation of our model. Thedataset used for generalization contains brightness measure-ments for single-electrode stimuli from two subjects—butdid not include data for phosphene size or streak length,nor for multi-electrode stimuli. Future work should thereforeinvestigate the model’s ability to generalize across multi-electrode stimuli as well as different users and devices.
.CC-BY 4.0 International licenseavailable under a(which was not certified by peer review) is the author/funder, who has granted bioRxiv a license to display the preprint in perpetuity. It is made
The copyright holder for this preprintthis version posted June 17, 2021. ; https://doi.org/10.1101/2021.06.07.447426doi: bioRxiv preprint
V. ACKNOWLEDGMENTS
This work was partially supported by the National Insti-tutes of Health (NIH R00 EY-029329 to MB)
REFERENCES
[1] Lauren N. Ayton, Nick Barnes, Gislin Dagnelie, Takashi Fujikado,Georges Goetz, Ralf Hornig, Bryan W. Jones, Mahiul M. K.Muqit, Daniel L. Rathbun, Katarina Stingl, James D. Weiland, andMatthew A. Petoe. An update on retinal prostheses. ClinicalNeurophysiology, 131(6):1383–1398, June 2020.
[2] Lauren N. Ayton, Peter J. Blamey, Robyn H. Guymer, Chi D. Luu,David A. X. Nayagam, Nicholas C. Sinclair, Mohit N. Shivdasani,Jonathan Yeoh, Mark F. McCombe, Robert J. Briggs, Nicholas L. Opie,Joel Villalobos, Peter N. Dimitrov, Mary Varsamidis, Matthew A.Petoe, Chris D. McCarthy, Janine G. Walker, Nick Barnes, Anthony N.Burkitt, Chris E. Williams, Robert K. Shepherd, Penelope J. Allen,and for the Bionic Vision Australia Research Consortium. First-in-Human Trial of a Novel Suprachoroidal Retinal Prosthesis. PLOSONE, 9(12):e115239, December 2014. Publisher: Public Library ofScience.
[3] M. Beyeler, G. M. Boynton, I. Fine, and A. Rokem. pulse2percept:A Python-based simulation framework for bionic vision. In K. Huff,D. Lippa, D. Niederhut, and M. Pacer, editors, Proceedings of the 16thScience in Python Conference, pages 81–88, 2017.
[4] Michael Beyeler, Geoffrey M. Boynton, Ione Fine, and Ariel Rokem.Model-Based Recommendations for Optimal Surgical Placement ofEpiretinal Implants. In Dinggang Shen, Tianming Liu, Terry M. Peters,Lawrence H. Staib, Caroline Essert, Sean Zhou, Pew-Thian Yap, andAli Khan, editors, Medical Image Computing and Computer AssistedIntervention – MICCAI 2019, Lecture Notes in Computer Science,pages 394–402. Springer International Publishing, 2019.
[5] Michael Beyeler, Devyani Nanduri, James D. Weiland, Ariel Rokem,Geoffrey M. Boynton, and Ione Fine. A model of ganglion axonpathways accounts for percepts elicited by retinal implants. ScientificReports, 9(1):1–16, June 2019.
[6] Cordelia Erickson-Davis and Helma Korzybska. What do blind people“see” with retinal prostheses? Observations and qualitative reports ofepiretinal implant users. PLOS ONE, 16(2):e0229189, February 2021.Publisher: Public Library of Science.
[7] Laura Ferlauto, Marta Jole Ildelfonsa Airaghi Leccardi, Naıg Aure-lia Ludmilla Chenais, Samuel Charles Antoine Gillieron, Paola Vagni,Michele Bevilacqua, Thomas J. Wolfensberger, Kevin Sivula, andDiego Ghezzi. Design and validation of a foldable and photovoltaicwide-field epiretinal prosthesis. Nature Communications, 9(1):992,March 2018. Number: 1 Publisher: Nature Publishing Group.
[8] I. Fine and G. M. Boynton. Pulse trains to percepts: the challengeof creating a perceptually intelligible world with sight recovery tech-nologies. Philos Trans R Soc Lond B Biol Sci, 370(1677):20140208,September 2015.
[9] Kathleen E. Finn, Hans J. Zander, Robert D. Graham, Scott F. Lempka,and James D. Weiland. A Patient-Specific Computational Frameworkfor the Argus II Implant. IEEE Open Journal of Engineering inMedicine and Biology, 1:190–196, 2020. Conference Name: IEEEOpen Journal of Engineering in Medicine and Biology.
[10] S. H. Greenwald, A. Horsager, M. S. Humayun, R. J. Greenberg, M. J.McMahon, and I. Fine. Brightness as a function of current amplitudein human retinal electrical stimulation. Invest Ophthalmol Vis Sci,50(11):5017–25, November 2009.
[11] A. Horsager, S. H. Greenwald, J. D. Weiland, M. S. Humayun, R. J.Greenberg, M. J. McMahon, G. M. Boynton, and I. Fine. Predictingvisual sensitivity in retinal prosthesis patients. Invest Ophthalmol VisSci, 50(4):1483–91, April 2009.
[12] N. M. Jansonius, J. Nevalainen, B. Selig, L. M. Zangwill, P. A. Sample,W. M. Budde, J. B. Jonas, W. A. Lagreze, P. J. Airaksinen, R. Vonthein,L. A. Levin, J. Paetzold, and U. Schiefer. A mathematical descriptionof nerve fiber bundle trajectories and their variability in the humanretina. Vision Research, 49(17):2157–2163, August 2009.
[13] Bryan W. Jones and Robert E. Marc. Retinal remodeling during retinaldegeneration. Experimental Eye Research, 81(2):123–137, August2005.
[14] H. Lorach, G. Goetz, R. Smith, X. Lei, Y. Mandel, T. Kamins,K. Mathieson, P. Huie, J. Harris, A. Sher, and D. Palanker. Photovoltaicrestoration of sight with high visual acuity. Nat Med, 21(5):476–82,May 2015.
[15] Y. H. Luo and L. da Cruz. The Argus((R)) II Retinal ProsthesisSystem. Prog Retin Eye Res, 50:89–107, January 2016.
[16] Y. H. Luo, J. J. Zhong, M. Clemo, and L. da Cruz. Long-termRepeatability and Reproducibility of Phosphene Characteristics inChronically Implanted Argus(R) II Retinal Prosthesis Subjects. AmJ Ophthalmol, August 2016.
[17] D. Nanduri, I. Fine, A. Horsager, G. M. Boynton, M. S. Humayun,R. J. Greenberg, and J. D. Weiland. Frequency and amplitudemodulation have different effects on the percepts elicited by retinalstimulation. Invest Ophthalmol Vis Sci, 53(1):205–14, January 2012.
[18] K. Stingl, K. U. Bartz-Schmidt, D. Besch, A. Braun, A. Bruckmann,F. Gekeler, U. Greppmaier, S. Hipp, G. Hortdorfer, C. Kernstock,A. Koitschev, A. Kusnyerik, H. Sachs, A. Schatz, K. T. Stingl,T. Peters, B. Wilhelm, and E. Zrenner. Artificial vision with wirelesslypowered subretinal electronic implant alpha-IMS. Proc Biol Sci,280(1757):20130077, April 2013.
[19] A. C. Weitz, D. Nanduri, M. R. Behrend, A. Gonzalez-Calle, R. J.Greenberg, M. S. Humayun, R. H. Chow, and J. D. Weiland. Improvingthe spatial resolution of epiretinal implants by increasing stimuluspulse duration. Sci Transl Med, 7(318):318ra203, December 2015.
.CC-BY 4.0 International licenseavailable under a(which was not certified by peer review) is the author/funder, who has granted bioRxiv a license to display the preprint in perpetuity. It is made
The copyright holder for this preprintthis version posted June 17, 2021. ; https://doi.org/10.1101/2021.06.07.447426doi: bioRxiv preprint