Embed Size (px)
Citation preview

GEOTHERMAL TRAINING PROGRAMME Reports 2006 Orkustofnun, Grensásvegur 9, Number 18 IS-108 Reykjavík, Iceland
391
A CONCEPTUAL DESIGN OF A GEOTHERMAL COMBINED CYCLE AND COMPARISON WITH A SINGLE-FLASH POWER PLANT
FOR WELL NWS-4, SABALAN, IRAN
Ali Rakhshani Moghaddam MOSHANIR - Power Engineering Consultant
No 37, Shahid Khodami St., Vanak Sq. P.O. Box 19395-4691
Tehran IRAN
ABSTRACT
The Sabalan geothermal area in NW-Iran is a water-dominated field. The calculated parameters indicate that the potential capacity of the NW-Sabalan resource has a mean value of 209 MWe. The average calculated energy density for the whole area is 11 MW/km2. Five exploration wells have been drilled. The Ministry of Energy in Iran is planning to build a pilot power plant in order to confirm that a geothermal power plant can be operated in Iran. Simultaneously, there will be drilled fourteen production wells, one exploration well and one injection well. In this report, a model is presented for a single-flash power plant, using well NWS-4 as a production well and optimizing the separator pressure with respect to net power output. In addition, a new power generation cycle is proposed which is a combination of a geothermal power plant and a conventional gas turbine power plant. In Iran, gas turbine power plants produce 20% of the electricity. The exhaust from these power plants is, in many cases, not used but could be used to enhance fluid temperatures in the many medium-temperature geothermal fields in Iran. Model is presented for this new cycle using the EES program and calculations done for two scenarios in the model. Finally, some suggestions are made for optimizing the geothermal combined cycle.
1. INTRODUCTION 1.1 General problem description Iran’s Ministry of Energy has decided to test the actual viability of a geothermal power plant in Iran by building a pilot power plant using well NWS-4 in the NW-Sabalan geothermal field as a production well. Here different possibilities for the pilot plant are presented. A model is presented for checking the maximum production capacity for a single-flash power plant, using well NWS-4 as a production

Rakhshani Moghaddam 392 Report 18
well. The model is written in EES (Engineering Equation Solver). However, the main objective of the study is suggesting a new power generation cycle, a combined geothermal power plant and a conventional gas power plant, where exhaust gas from a gas turbine is used to enhance the production from a medium-temperature geothermal field, and its possible application for a pilot plant using well NWS-4. For this purpose, the NW-Sabalan geothermal field is first introduced and afterwards the fundamental rules in power plant design. The Engineering Equation Solver (EES) is used to model both a single-flash power plant and the new geothermal combined-cycle power plant, using well NWS-4 as the production well for both. Finally, the two different power plants are compared. 1.2 Literature review Following is a summary of conclusions obtained by previous investigations into geothermal power plants, related matters and problems: Radmehr (2005) modelled an Organic Rankine Cycle (ORC) power plant for 5 wells with similar characteristics as well NWS-4, located in well pad B in the Sabalan area in Iran. Siregar (2004) studied how to optimize electrical power production with a single-flash power plant for Sibayak geothermal field in Indonesia. Valdimarsson (2003) concluded from analyses that the Carnot efficiency is not valid as a reference for electrical power generation from low-temperature sources. The energy and exergy contained in the stream has to be considered waste, if they cannot be sold as heat. The only valid reference for the efficiency of a pure electricity plant is, therefore, the maximum according to the first law of efficiency when electricity is the sole output of the plant. If the heat in the stream can be sold, the whole mass flow is a by-product of the power plant, and irrelevant to the power plant itself. The maximum electrical production efficiency in this case is presented as combined heat and power production. Kanoglu (2001) shows that when using low-temperature resources, geothermal power plants generally have low first law’s efficiencies. This means that more than 90% of the energy of the geothermal water is discarded as waste heat. There is a strong argument here for the use of geothermal resources for direct applications such as district heating instead of power generation, when economically feasible. When considering binary geothermal power plants using air as the cooling medium, the condenser temperature varies as the ambient air temperature fluctuates throughout the year and even throughout the day. As a result, the power output decreases by up to 50% from winter to summer. Gudmundsson (1983) indicates that quartz and amorphous silica are of interest in deposition studies. In liquid-dominated high-temperature geothermal reservoirs, the amount of silica dissolved in the geothermal water depends on the solubility of quartz. However, amorphous silica is the form which precipitates from geothermal fluids upon concentration and cooling. Silica deposition and scaling will occur in geothermal wells and surface facilities when the concentration of silica exceeds the solubility of amorphous silica. 1.3 General information about the Mt. Sabalan geothermal field The Mt. Sabalan geothermal field is located in the Moil Valley on the northwest flank of Mt.Sabalan, close to the Meshkin Shahr town (Khiyav) of Azerbaijan, Iran. The field is located between 38° 11' 55'' and 38° 22' 00'' North and 47° 38' 30'' and 47° 48' 20'' (Yousefi, 2004).The resource area has been previously identified by geo-scientific studies as an approximately quadrangular shaped area that covers approximately 75 km2.

Report 18 393 Rakhshani Moghaddam
The geothermal field is located in an environmentally sensitive area of elevated valley terraces set within the outer caldera rim of the greater Mt. Sabalan complex. Mt. Sabalan is a Quaternary volcanic complex that rises to a height of 4811 m, some 3800 m above the Ahar Chai valley to the north. Volcanism within the Sabalan caldera has formed three major volcanic peaks which rise to elevations of around 4700 m. The climate in the area is relatively dry, especially during the summer months. The site is exposed to severe winter weather, including very high wind speeds of up to 180 km/hr. Temperatures over the past 4 years have been measured as low as - 30°C (SKM, 2005). The temperature fluctuations in the study area are large ranging from -35°C in January to +30°C in June and July. This temperature variation forces the sheep grazers to move during the winter to a warmer area near the Caspian Sea and the Aras River by the Azerbaijan border. The average monthly temperature in the study area from 2000 to 2003 is shown in Figure 1 (Yousefi et al., 2002). The humidity in the area is not very high because of high elevation and cold climate. The annual mean humidity in the study area is 59.5% according to data from the geothermal project meteorological station in the area. The monthly average humidity in the study area from 2000 to 2003 is shown in Figure 2 (Noorollahi and Yousefi, 2003). The maximum humidity is observed in May, 85%, and the minimum in June and July, 13%. 2. EXPLORATION OF THE MT. SABALAN GEOTHERMAL AREA
2.1 Geology Mt. Sabalan lies on the South Caspian plate, which is underthrust by the Eurasian plate to the north. It is in turn underthrust by the Iranian plate, which produces compression in a northwest direction. This is complicated by a dextral rotational movement caused by northward underthrusting of the nearby Arabian plate beneath the Iranian plate. There is no Benioff-Wadati zone to indicate any present day
FIGURE 2: Monthly average humidity in the project area in 2002 (Noorollahi and Yousefi, 2003)
FIGURE 1: Monthly average temperature in the project area (Yousefi et al., 2002)

Rakhshani Moghaddam 394 Report 18
subduction. The current project area is located within the Moil Valley, which on satellite and aerial photographic imagery can be seen to be a major structural zone. Exposed at the surface in the valley are altered Pliocene volcanics, an unaltered Pleistocene trachydacite dome (Ar-Ar dated at 0.9 Ma) and Quaternary terrace deposits (Bogie et al., 2000). These units have been divided into four major stratigraphic units which, in order of increasing age, are (SKM, 2005):
• Quaternary alluvium, fan and terrace deposits • Pleistocene post-caldera trachy andesitic flows, domes and lahars • Pleistocene syn-caldera trachy dacitic to trachy andesitic domes, flows and lahars • Pliocene pre-caldera trachy andesitic lavas, tuffs and pyroclastics.
2.2 Geochemistry Warm and hot springs with Cl-SO4 and acid-SO4 waters are found within the Moil valley (Bogie et al., 2000). These plot in the immature area of the Na-K-Mg plot giving geothermometer temperatures of approximately 150°C (SKM, 2005). One of these, the Gheynarge (Qeynerce) spring has a Cl concentration of 1800 mg/kg. Tritium analyses of this spring water indicate no recent interaction with the atmosphere. The isotopic composition of the spring waters and their seasonal variation in flow with little change in temperature or chemistry suggested that a large regional groundwater aquifer overlies the potential geothermal reservoir. 2.3 Geophysics A magnetotelluric survey (Bromley et al., 2000) established the existence of a very large zone of low resistivity (≈70 km2) in the project area. Satellite imagery interpretation identified a large area (≈10 km2) of surficial hydrothermal alteration in lower elevation parts of the project area, with much of the low resistivity area in the valley covered by Quaternary terrace deposits. The presence of surficial hydrothermal alteration was confirmed by fieldwork. XRD analyses of the alteration revealed the presence of interlayered illite-smectite clays (which are conductive and will have formed at depth) indicating that at least some of the alteration and the resistivity anomaly is relict. At higher elevations unaltered rocks cover the zone of low resistivity. To define a target area for drilling, an area of very low resistivity (< 4 Ωm) associated with the thermal features was initially selected. The early interpretation of the MT work (Bromley et al., 2000) shows low resistivities persisting to depth. However, once the relatively shallow occurrence of the conductive smectitic clays was established from the exploration geothermal wells, the MT data was reinterpreted in terms of the elevation of the base of the conductor. A conductive zone, increasing in elevation to the south, can be partially distinguished from the much larger and deeper resistivity anomaly to the west. This new interpretation is indicative of the current system’s upflow occurring south of the drilled wells (Talebi et al., 2005). 2.4 Exploration drilling programme On the basis of the results of the MT survey and the presence of hot springs with significant Cl concentrations, a three well exploration programme was undertaken. The topography of the valley limits the location of drill pads to inter connected terraces requiring two of the wells to be directionally drilled to access an extensive anomaly at depth. The drilling and testing programme was carried out

Report 18 395 Rakhshani Moghaddam
between November 2002 and December 2004. The location of the project, with a detailed map of the drilled area, is given in Figure 3. The 3 deep exploration wells drilled are referred to as NWS-1, NWS-3 and NWS-4 on well pads A, C and B, respectively. The wells vary in depth from 2265 to 3197 m MD. Well NWS-1 was drilled vertically while NWS-3 and NWS-4 are directional wells with throws of 1503 and 818 m, respectively. Additionally, two shallow injection wells were drilled to 600 m depth: NWS2R, located on pad A alongside well NWS-1, and NWS-5R on pad B alongside well NWS-4. The basic well completion data are summarised in Table 1.
TABLE 1: Basic completion information of NWS wells (SKM, 2005)
2.5 Well testing and reservoir results Well NWS-4 was discharged by airlift stimulation in September 2004 and was flow tested for the next 4 months with re-injection of waste brine into shallow well NWS-5R. Output curves for well NWS-4 are shown in Figure 4 with output data from well NWS-1 also included for comparison. These show variations in total mass and enthalpy with flowing wellhead pressure. Both wells discharged with enthalpies in the range of 950-1000 kJ/kg, which is consistent with production from liquid-only feed zones with temperatures of 230°C (for NWS-1) and 220°C (for NW-3). These are both lower than the maximum temperatures measured in the two wells of 245 and 230°C, respectively.
Product. casing Product. liner Well Spud date Completion
date
Depth (mMD / mVD)
Size (in)
Depth (mMD)
Size (in)
Depth (mMD)
NWS-1 22 Nov 02 1 Jun 03 3197 9⅝ 1586 7 3197 NWS-3 2 Jul 03 27 Nov 03 3166 / 2603 13⅜ 1589 9⅝ 3160 NWS-4 17 Dec 03 27 Mar 04 2255 / 1980 9⅝ 1166 7 2255 NWS-2R 7 Jun 03 25 Jun 03 638 13⅜ 360 9⅝, 5 638 NWS-5R 7 Apr 04 2 May 04 538 20 139 9⅝ 482
FIGURE 3: Topographic map of NW-Sabalan geothermal project area
PAD-CEL 2277
PAD-BEL 2487
PAD-AEL 2637
WAREHOUSEEL 2530
PAD-DEL 2750
PAD-CEL 2277PAD-CEL 2277
PAD-BEL 2487PAD-BEL 2487
PAD-AEL 2637PAD-AEL 2637
WAREHOUSEEL 2530
WAREHOUSEEL 2530
PAD-DEL 2750PAD-DEL 2750
Rakhshani Moghaddam 396 Report 18
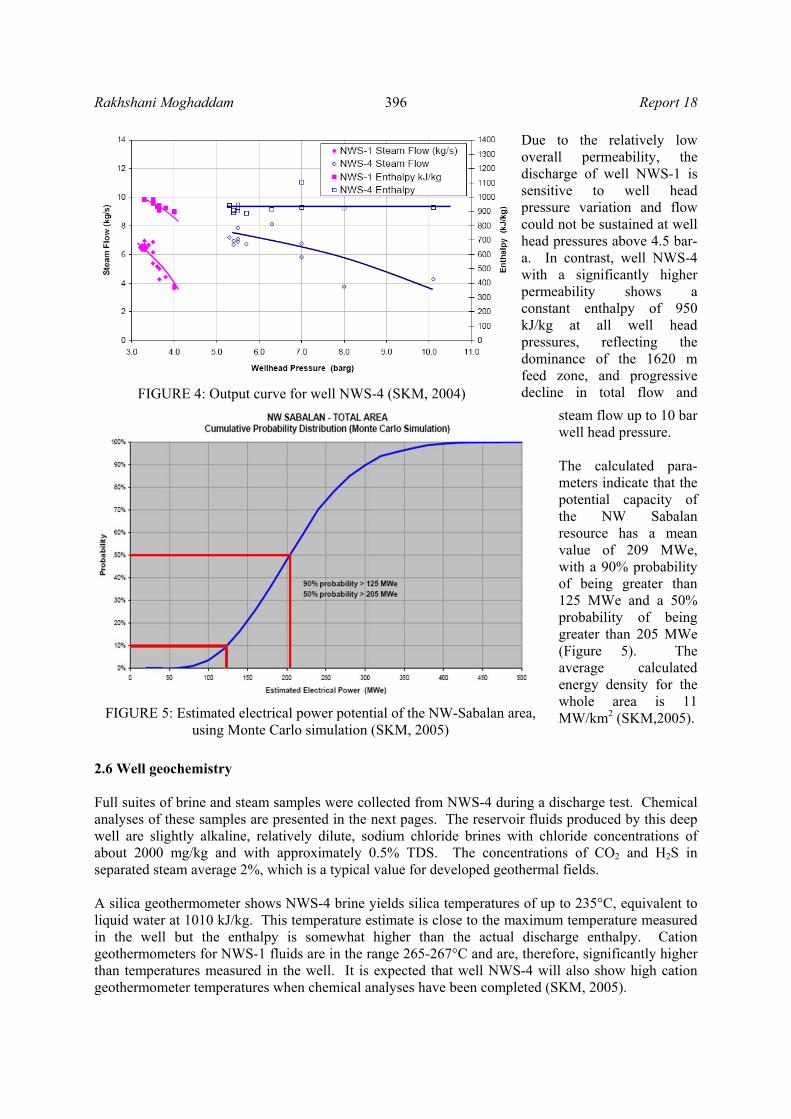
Due to the relatively low overall permeability, the discharge of well NWS-1 is sensitive to well head pressure variation and flow could not be sustained at well head pressures above 4.5 bar-a. In contrast, well NWS-4 with a significantly higher permeability shows a constant enthalpy of 950 kJ/kg at all well head pressures, reflecting the dominance of the 1620 m feed zone, and progressive decline in total flow and
steam flow up to 10 bar well head pressure. The calculated para-meters indicate that the potential capacity of the NW Sabalan resource has a mean value of 209 MWe, with a 90% probability of being greater than 125 MWe and a 50% probability of being greater than 205 MWe (Figure 5). The average calculated energy density for the whole area is 11 MW/km2 (SKM,2005).
2.6 Well geochemistry Full suites of brine and steam samples were collected from NWS-4 during a discharge test. Chemical analyses of these samples are presented in the next pages. The reservoir fluids produced by this deep well are slightly alkaline, relatively dilute, sodium chloride brines with chloride concentrations of about 2000 mg/kg and with approximately 0.5% TDS. The concentrations of CO2 and H2S in separated steam average 2%, which is a typical value for developed geothermal fields. A silica geothermometer shows NWS-4 brine yields silica temperatures of up to 235°C, equivalent to liquid water at 1010 kJ/kg. This temperature estimate is close to the maximum temperature measured in the well but the enthalpy is somewhat higher than the actual discharge enthalpy. Cation geothermometers for NWS-1 fluids are in the range 265-267°C and are, therefore, significantly higher than temperatures measured in the well. It is expected that well NWS-4 will also show high cation geothermometer temperatures when chemical analyses have been completed (SKM, 2005).
FIGURE 5: Estimated electrical power potential of the NW-Sabalan area, using Monte Carlo simulation (SKM, 2005)
FIGURE 4: Output curve for well NWS-4 (SKM, 2004)

Report 18 397 Rakhshani Moghaddam
3. MT. SABALAN DEVELOPMENT OPTIONS The Sabalan project was divided into two phases. The first phase was to build drilling pads (Sites A, B, C), roads, a pump station, water reservoir, pipe lines to each site and to drill five exploratory wells. In the second phase, the Ministry of Energy has decided to build a pilot power plant for observing the actual viability of a geothermal power plant in Iran and simultaneously drill 14 production wells, including preparations of well pads D and E, 1 exploration well and 1 injection well. The aim is to reach a 55 MWe capacity. 3.1 Available wells Well pads A, B and C are now ready and well-pads D and E will be ready soon. Each well-pad, except well pad C, was assumed to be able to accommodate up to six wellheads:
• Well pad A includes existing wells NWS-1 and NWS-2R. With the scheduled deep-cellar construction, pad A will accommodate additional four wells.
• Well pad B includes wells NWS-4 and NWS-5R and will also accommodate additional four production wells. Developed platforms just above this site, currently used for drilling material and warehousing, are capable of accommodating a power plant of up to a capacity of 100 MWe (Radmehr, 2005).
• Well pad C is at the lowest elevation and is regarded as being on the outer edge of the reservoir. Well NWS-3 was drilled from well pad C and is currently reserved for brine re-injection and can readily accommodate additional brine re-injection wells. There is more than adequate space available in the immediate vicinity of well-pad C for a binary power plant (Radmehr, 2005).
The maximum injection rate for a new injection well is assumed to be 75 kg/s (SKM, 2005). The number of injection wells required for each of the development options could be obtained by rounding up the total excess condensate divided by the estimated maximum injection rate (75 kg/s). 3.2 Well NWS-4 NWS-4 is the third deep exploration geothermal well to be drilled in Iran. The well is located about 1.2 km north of NWS-1, the only other well which has been output tested. The well locations are shown in Figure 6 and basic well data is given in Table 2 (SKM, 2004). The objective of the well was to test geothermal conditions at depth in the middle part of the initially interpreted geophysical anomaly, in particular the structure, tempera-ture and fluid chemistry. The well was spudded on 17 December
FIGURE 6: Well locations in the NW-Sabalan field

Rakhshani Moghaddam 398 Report 18
2003 and completed 106 days later on March 30th 2004 (SKM, 2004). The original pro-gramme was to drill this well directionally to a measured depth of 3000 m. The well was terminated at 2265.5 m because the well had veered off the target line and there was a need to preserve permeability gains in the upper part of the 8½” hole. The well was tested during the period September 7-20, 2004. NWS-4 has a maximum mass flow of about 56 kg/s at a WHP of 5.5 bar-a, total discharge enthalpy of 940-950 kJ/kg, and a generating capacity of about 3.9 MWe (SKM, 2004). The well produces from a major zone at about 1400 m VD, which has a temperature of about 223°C. Summary on well NWS-4 (SKM, 2004):
• Well measurements show that NWS-4 produces predominantly from a single-phase, reservoir liquid at 1400 m VD, with a temperature of 223°C. Discharge chemistry indicates that this water has a near-neutral pH, sodium chloride brine with total dissolved solids of 5000 mg/kg and a dissolved gas content of about 0.4 wt%. The dissolved gas comprises more than 99% CO2.
• The NWS-4 feed chemistry and temperature are very similar to that of NWS-1, which produces from 1000 m deeper. This indicates that the reservoir between NWS-1 and NWS-4 is chemically uniform over a considerable distance and depth.
• A slight decline in calcium concentration was observed at high flowrates, caused either by calcite scaling or a change in the relative flow from different zones. Upon discharge, the NWS-4 reservoir water becomes significantly over-saturated with respect to calcite and appears to have a high propensity to scale. However, there is no direct evidence that scaling actually occurred.
• Cation geothermometry gives temperatures of 260-280°C, significantly higher than measured temperatures (223°C) and possibly reflecting higher upstream temperatures. Gas geothermometry indicates low to moderate temperatures but the validity of low TH2Ar values needs to be investigated further.
• NWS-4 reservoir water has a δ18O shift of about 3‰ from local meteoric water. The isotopic composition lies on a dilution trend with chloride spring waters at Gheynarge and Ilando, indicating a common source.
• The local atmospheric pressure at NWS-4 is about 748 mb. At this pressure the steam flash to the atmospheric silencer is about 5% greater than at sea level. This causes a slight increase in solute concentrations in the weirbox water and a ~1°C increase in the weirbox quartz geothermometer.
3.2.1 NWS-4 discharge water chemistry Discharge water analyses are presented in Table 3. Results for pH, HCO3, Cl, B and SO4 are from the site laboratory. The remainder is from GNS. Ion balances are reasonable, although there is a consistent 5% excess of anion charge, similar to that seen for the NWS-1 analyses. The NWS-4 discharge water can be classed as an alkaline-pH, medium salinity, sodium-chloride water with total dissolved solids of about 5000 mg/kg. The water has moderate bicarbonate (60-80 ppm) reflecting the moderate gas content of the reservoir waters. The calcium concentration of 25-30 ppm is, in turn,
TABLE 2: Basic NWS-4 well data
Parameter Location Locality Northwest Sabalan Pad / cellar Pad B / Cellar 1 (west)
738712 mE UTM Cellar coordinates 4239833 mN UTM
Top of cellar elevation 2487 m a.s.l. Deviated at 35° / Planned orientation
on azimuth of 250° Total depth 2265.5 m
Casing programme Depth (m MD) Conductor (30") 26 Surface casing (20") 105 Anchor casing (13⅜") 541 Production casing (9⅝") 1195 Liner (7") To 2265

Report 18 399 Rakhshani Moghaddam
controlled by calcite solubility. The water composition is similar to reservoir waters found in the Taupo Volcanic Zone of New Zealand, but has somewhat higher chloride and higher sulphate. The calculated reservoir chloride concentration in NWS-4 is about 2000 ppm. By comparison, the Gheynarge spring has a concentration of 1500 mg/kg which is not much diluted, although the temperature is only 85°C. On the basis of the chloride-enthalpy relationship of the waters (Figure 7), boiling is necessary to derive the Gheynarge spring composition. The chloride-boron ratio of the water is about 36. This ratio is broadly determined by the predominant host rock type at depth. A value of 36 is at the high end of values seen for andesitic reservoirs and is more representative of rhyolitic systems. However, the higher ratios may also be the result of absorption into alteration clays along the geothermal outflow. The discharge water chemistry was close to stability within a day of opening the well, with only a slight increase in salinity during the first 24 hours. The only significant change in chemistry during
FIGURE 7: Chloride-enthalpy relationship of reservoir and spring water
TABLE 3: Summary of geochemistry of wells NWS-1 and NWS-4 (SKM, 2005)

Rakhshani Moghaddam 400 Report 18
the test was a small but consistent change in the Cl/Ca ratio during periods of high flow (Sept. 11 and 16) (i.e.: relatively less calcium). There are two possible reasons for this, either multizone effect or loss of calcium at high flow through scaling. The discharge water is significantly over-saturated with respect to calcite and it is possible that scaling was initiated at high flows by the increased pressure drop within the wellbore. The increase in Cl/Ca ratio may also have been produced by an increase in the relative flow of a second, lower-calcium zone, probably deeper in the well. Discharge silica concentrations are in the range 520-540 ppm in the weirbox, and correspond to the quartz geothermometer temperatures of 230-235°C. This is somewhat above temperatures in the flowing survey which were recorded at only 223°C. Cation temperatures are significantly higher than quartz temperatures, ranging from 260 (TNaKCa) to 280°C (TNaK, Fournier, 1979). This suggests that higher temperatures exist at Sabalan, closer to the upflow. The high cation temperatures are evident on the trilinear plot of Giggenbach (1988) where the reservoir water lies close to the full equilibrium line at a temperature of about 280°C. The calculated chemical speciation of the reservoir water at 230°C is shown in the SKM report (2004). With all gas dissolved, the water has a pH of about 5.6, which is neutral at this temperature. The water calculates to be slightly under-saturated with respect to calcite (CaCO3) and anhydrite (CaSO4). 3.2.2 NWS-4 discharge gas chemistry (SKM, 2005) Gas chemistry is presented in Table 3. About ten gas samples were collected from NWS-4 during the discharge test. On-site analyses were done for CO2 and H2S and four samples were sent to GNS in New Zealand for complete analysis. CO2 constitutes about 98% by volume of the total gases, with H2S and N2 making up about 2%. Ar, H2 and CH4 are all in very low proportions. The helium content is higher than what would be expected for gas of andesitic magmatic origin and there may be a fraction of radiogenic crustal helium (4He). This is reasonable since there is considerable crustal thickening associated with plate tectonics in the Sabalan area. Measurement of the 4He/3He ratio in steam would be needed to confirm this. The total gas concentration in NWS-4 steam, separated at about 5 bar-g, is 3.0% based on a steam mass percentage of about 20%. This equates to a reasonably low 0.4% in the deep reservoir. Overall, the gas chemistry for NWS-4 is very similar to that for NWS-1, both in terms of the total gas content and the relative proportions of the gases. The gas chemistry was reasonably stable throughout the discharge test with no significant changes in response to WHP changes or mass flow. The NWS-4 gas chemistry is notable for the low H2 concentration (0.02% by volume of the total gas), particularly with respect to argon. The hydrogen-argon geothermometer of Giggenbach (1991) gives a temperature of only 180°C, considerably less than the actual measured temperature (223°C). On the H2/Ar versus CO2/Ar plot, the NWS-4 gas lies well below the liquid equilibrium line, and it is clear that the hydrogen is not in equilibrium with the Fe(II) – Fe(III) redox buffer on which this hydrogen geothermometer is based. It is possible the H2 reflects relict deep magmatic conditions (controlled by the SO2 – H2S buffer), and that concentrations have not re-equilibrated to a neutral, liquid-dominated environment. Another possible explanation for the low TH2Ar values is that the argon is mainly of radiogenic rather than atmospheric origin and this is depressing the TH2/Ar temperatures. There is some support for this in the relatively high helium (most likely of crustal radiogenic origin) and the fact that the H2-H2S geothermometer (Giggenbach, 1980) gives the more reasonable temperatures of about 265°C. This geothermometer is based on equilibrium with magnetite and pyrite:
3FeS2 + 2H2 + 4H2O = Fe3O4 + 6H2S The Fisher-Tropsch geothermometer gives temperatures of around 250°C.

Report 18 401 Rakhshani Moghaddam
4. THEORY AND METHOD OVERVIEW 4.1 The steam field Exploration data of the NW-Sabalan geothermal field show that this field is a liquid-dominated system. The known resources show that water is available at a temperature of around 230°C. Because the wells are non-artesian they must be stimulated to initiate flow. When discharged, the water flows naturally under its own pressure. The drop in pressure causes it to partially flash into steam and arrive at the wellhead as a two-phase mixture. The geothermal fluid is flashed into steam as the hydrostatic column is reduced to a sustained wellhead pressure. Steam will be supplied from well NWS-4 on pad-B to the power plant. The well’s pressure, temperature, enthalpy, mass flow and chemical characteristics of its fluid have been identified through testing. When wellhead pressure is 5.5 bar-a, the two-phase mass flow from the well is 56 kg/s with an enthalpy of 940 kJ/kg. A typical process schematic is presented in Figure 8 for geothermal power generation. Develop-ment of a conventional geothermal power plant would require at least the following systems:
• Main steam inlet piping with control valves, emergency stop valves, steam strainer etc.; • Steam turbine/generator complete with lube oil and control systems, gland steam systems,
turbine drains etc.; • Main condenser (direct contact); • Non-condensable gas extraction systems (for single flash but not for the combined-cycle
presented in this project); • Circulating water system with cooling towers, pumps and control valves; • Auxiliary cooling water system (and possibly a second clean water system); • Plant services including heating, ventilation and air conditioning systems, compressed air,
potable and process water, fire fighting system etc.; • Turbine hall crane (possibly by extending the tracks from an existing system); • Electrical systems including excitation, switchgear, circuit breakers, step up transformers (from
stator to grid voltage), plant bus with a low and medium voltage reticulation system (for large motor loads) etc.; and
• Emergency power supply, including battery banks and chargers. 4.2 Separator The geothermal fluid is separated into vapour and liquid in a steam separator. Because the Sabalan field is a wet steam field, steam field separators are required. It is assumed that the separator station is located adjacent to the production well pad to reduce pressure losses. Separators can be both vertical and horizontal. In older conventional designs of steam supply systems in geothermal fields throughout the world, the separators have been of the vertical centrifugal type, but recently the horizontal type has
FIGURE 8: Steam condensing system and process schematic

Rakhshani Moghaddam 402 Report 18
also been used. With some 30 years of experience behind it, the Weber-type bottom-outlet separator (Figure 9) has evolved into a highly efficient steam-field component. This design is capable of being adapted to steam capacities of between 10 and 100 MWe capacity and, with appropriate attention to pressure control, will deliver separation efficiencies (measured as residual moisture in steam) of better than 99.9% (SKM, 2005). It is assumed that the new geothermal plant based on a wet-steam resource will be operated as a base-load plant. Although this implies a constant steam demand, the steam-field and separator station will require pressure control and a
steam venting system therefore required. Pressure control by means of steam venting to rock mufflers is proposed, using pressure-controlled vent valves. Pressure protection will be required by means of pressure relief valves, bursting discs or both. The separator station includes the level control valves, rupture discs, steam vent valves and emergency brine dump valves. Pressure protection uses rupture discs as used in several other developments (SKM, 2005). The characteristics of the two-phase fluid are known. For calculations, pressure in the steam separator needs to be known (Psep). This depends on wellhead pressure and demand steam turbine pressure. The necessary equations are: Steam fraction in the separator (x1):
( )( )32
311 hh
hhx−−
= (1)
Steam mass flow (•
2m ):
totmxm••
= 12 (2)
Brine mass flow ( 3
•m ):
totmxm••
−= )1( 13 (3)
where ••
= 1mmtot = Total mass flow from the production wells (kg/s). Mass conservation for the separator is shown in Figure 10 (Siregar, 2004). Vertical and horizontal types: The advantages of horizontal separators over the vertical types have been listed (Karlsson and May, 1987):
a. In horizontal types separated water drops fall down at right angles to the direction of steam flow, whereas in vertical types they fall against the direction of steam flow. This results in a more effective separation in horizontal types, and even more so in view of the higher steam velocity in vertical type separators.
FIGURE 9: Horizontal steam separator as modified by Reykjavik Energy Co. (2006)

Report 18 403 Rakhshani Moghaddam
b. Steam bubbles entrained in the separated water are more likely to escape in the horizontal type than the vertical type due to the larger liquid surface area.
c. Measuring equipment is easier to access and service on horizontal separators. Vertical separators must be equipped with special ladders and platforms for this purpose.
d. The initial cost of horizontal separators as well as their maintenance is lower than that of vertical separators, especially where high vapour/liquid ratios are encountered.
e. The horizontal type, running approximately half full of water, makes exterior equalizing water tanks unnecessary, while often being required for vertical separators.
Properly designed and adjusted, separation efficiency can easily be more than 99.9%. The water/liquid is separated from the steam and falls down and flows out the separator to the injection well or, in additional cases, it can be used for a binary cycle plant. In our new cycle in this project, steam will go to the boiler and brine will go to the pre-heater. The vapour that exits the separator contains very small droplets. Due to condensation and transport time, droplet sizes increase. Part of this will fall to the bottom of the pipe on the way and the water can then be drained. The remainder is removed in the moisture separator or demister. Figure 10 shows the mass conservation for a steam separator. 4.3 Steam turbine The steam turbine is the most important part of a geothermal power plant. For the conceptual design of a steam power plant, we consider the quality of the steam as well as the input and output enthalpy. The detailed design for a steam turbine is the responsibility of the steam turbine manufacturer. Steam flowing from the separators enters the steam turbine in a single-flash cycle. In the new cycle, steam that exits the super heater enters the steam turbine. The steam is supplied to the turbine rotor via nozzles in a tangential direction at higher velocity. The turbine rotor is subjected to an axial thrust as a result of pressure drops across the moving blades and changes in the axial momentum of the steam between the entrance and the exit, and then passed through the rotor shaft as useful power output of the turbine. The capacity of the turbine is a fundamental factor in the design of a geothermal power plant. Some factors that influence the selection of a steam turbine are: available steam, thermodynamic and chemical characteristics of the steam, type of turbine, effects of natural decline in the flowrate and pressure of the wells, decrease or increase of the non-condensable gases, and financial factors at present and in the future. The turbine material is carefully selected for resistance to corrosion due to the presence of hydrogen sulphide and salt (chloride), and scale components such as silica oxide, aluminium oxide, and sulphur oxide in a single-flash cycle. In the combined cycle, pure water is used as a medium and thus these problems are avoided. The blade material is also resistive to erosion due to the presence of condensate or brine and solid particles such as corrosion products. However, the best way to avoid the appearance of corrosion and erosion is to keep steam impurities out of the turbine (Mitsubishi, 1993). It is assumed that turbine efficiency is 85%. Since dry expansion is more efficient than wet expansion, it is
FIGURE 10: Mass conservation for a steam separator

Rakhshani Moghaddam 404 Report 18
proposed to maintain high efficiency by installing an inter-stage drain catcher. Reducing the wetness of the steam also decreases the effects of water erosion. The output power of the turbine is calculated as:
sTur hhmW η)( 422 −=••
(4)
where 2•m = Steam mass flow (kg/s); ηs = Isentropic efficiency of the turbine; and h2 and h4 = Inlet and outlet enthalpies (kJ/kg), respectively.
An impulse turbine has fixed nozzles that orient the steam flow into high speed jets. These jets contain significant kinetic energy, which the rotor blades, shaped like buckets, convert into shaft rotation as the steam jets change direction. A pressure drop occurs across only the stationary blades, with a net increase in steam velocity across the stage. In the reaction turbine, the rotor blades themselves are arranged to form convergent nozzles. This type of turbine makes use of the reaction force produced as the steam accelerates through the nozzles formed by the rotor. Steam is directed onto the rotor by the fixed vanes of the stator. It leaves the stator as a jet that fills the entire circumference of the rotor. The steam then changes direction and increases its speed relative to the speed of the blades. A pressure drop occurs across both the stator and the rotor, with steam accelerating through the stator and decelerating through the rotor, with no net change in steam velocity across the stage but with a decrease in both pressure and temperature, reflecting the work performed in the driving of the rotor. To maximize turbine efficiency, the steam is expanded, generating work, in a number of stages. These stages are characterized by how the energy is extracted from them and are known as impulse or reaction turbines. Most modern steam turbines are a combination of the reaction and impulse design. Typically, higher pressure sections are impulse type and lower pressure stages are reaction type (Wikipedia, 2006a). 4.4 Condenser The primary purpose of the condenser is to condense the exhaust steam from the turbine. The circulating-water system supplies cooling water to the turbine condensers and thus acts as the unit by which heat is rejected from the steam cycle to the environment. The circulating system is efficient but also has to conform to thermal-discharge regulations. Its performance is vital to the efficiency of the power plant itself because a condenser operating at the lowest temperature possible results in maximum turbine work and cycle efficiency and in minimum heat rejection. The heat transfer process is governed by different temperatures and a mass transfer process of exhaust steam and cooling water. The condensation process occurs when the latent heat of the steam is absorbed as sensible heat by cold water. In order to generate maximum useful energy in the turbine, the condenser pressure stays in vacuum conditions. Theoretically, the more vacuum created, the more useful energy is gained. The condenser vacuum attainable in practice is, however, restricted by the thermodynamic properties of steam, the type of condenser and evacuation process selected, and the amount of non-condensable gas present in the steam in a single-flash cycle. But in a geothermal combined cycle we do not need any NCG removal system. The typical condensate temperature attained in practice is 45-50°C, corresponding to a condenser pressure of 0.0959-0.1234 bar-a (El-Wakil, 1984).

Report 18 405 Rakhshani Moghaddam
Figure 11 shows the temperature distribution in the condenser. The circulating water inlet temperature should be sufficiently lower than the steam saturation temperature to result in reasonable values of ∆To. It is usually recommended that ∆Ti be between about 11 and 17°C and that ∆To, the TTD, should not be less than 2.8°C. The enthalpy drop and turbine work per unit pressure drop is much greater at the low-pressure end than the high-pressure end of a turbine (El-Wakil, 1984). A condenser with a low back pressure of only a few Pascals, increases the work of the turbine, increases plant efficiency, and reduces the steam flow for a given plant output. A condenser is a major component in a power plant and a very important piece of equipment. There are two types of condensers, direct contact and surface condensers. The most common type used in power plants is the surface condenser. The heat transfer over the condenser is calculated as:
( )542 hhmQ −=•
(5)
where h4 and h5 = Enthalpies into and out of the condenser (kJ/kg), respectively. The circulating water flow and the pressure drop through the condenser are determined according to the following equations. The water mass flowrate is:
)( 67 TTcQm
pw −=
•
(6)
where cp = Specific heat of the water (kJ/kg °C); and
T6 and T7 = The inlet and exit temperatures (°C), respectively. The pressure drop is given in term of head, H, which is related to the pressure loss, ∆p by:
cggHp ρ∆ = (7)
where: ρ = Density (kg/m3), g = Gravitational constant (m/s2), gc = Conversion factor, 1.
Water inlet velocities in condenser tubes are usually limited to a maximum 2.5 m/s to minimize erosion, and a minimum of 1.5-1.8 m/s for good heat transfer. Values between 2.1 and 2.5 m/s are most common (El-Wakil, 1984).
FIGURE 11: Condenser temperature distribution

Rakhshani Moghaddam 406 Report 18
4.5 Gas removal system Geothermal steam contains non-condensable gases in large amounts compared with that of conventional thermal power plants. It is well known that gases in geothermal steam influence the design of the main part of the power plant equipment such as the turbine, condenser, cooling tower, and gas extraction system. This is due not only to corrosion problems but also to the high volume of gases in the turbine and condenser. As a rule of thumb, if the amount of gases is more than 10%, it is more economic to expand the steam in the back pressure turbine; otherwise an expensive gas extraction system has to be installed. In steam and other vapour cycles, it is important to remove the non-condensable gases that otherwise accumulate in the system. The presence of non-condensable gases in large quantities has undesirable effects on equipment operation for several reasons:
a. It raises the total pressure of the system because the total pressure is the sum of the partial pressures of the constituents. An increase in condenser pressure makes plant efficiency lower;
b. It blankets the heat-transfer surfaces such as the outside surface of the condenser tube and makes the condenser less effective;
c. The presence of some non-condensable gases results in various chemical activities. Some geothermal power plants use steam-jet ejectors to extract non-condensable gases. For high performance, non-condensable gas extraction will be achieved by using an electrically driven vacuum pump. The power of the vacuum pump is calculated by the following equation (Siregar, 2004):
−
−
=
−
11
11γ
ηγγ
cond
atm
gasVpump
condugVpump P
PMTRm
P (8)
where: PVpump = The power of the pump (kW);
γ = Cp,gas / Cv,gas; mg = Mass flowrate of the gas (kg/s); Ru = 8.314 kJ/(kmol K), the universal gas constant; Tcond = Temperature of the condensate (K); ηVpump = Efficiency of the pump; Mgas = Molar mass of the gas; Patm and Pcond = Atmospheric and condenser pressures (bar-a), respectively.
It is possible to use the combination of a steam ejector and liquid ring vacuum pump as a gas exhaust system when the motor driving the vacuum pump needs more power. 4.6 Cooling system For choosing the best cooling system we have to consider five important parameters:
• Access to fresh water As fresh water cooling system can provide the lowest pressure and it is also the cheapest cooling system. This kind of cooling has to be checked as the first choice. Therefore, access to fresh water is important. In a dry countryside finding fresh water is difficult.

Report 18 407 Rakhshani Moghaddam
• Location of power plant If the power plant can be built in a location that is near a sea, a lake or a big river, water cooling system can be used with lower capital cost.
• Relative humidity Relative humidity has two different affects on wet cooling and dry cooling systems. In a wet cooling system increasing the relative humidity causes the efficiency to decrease. However, increased relative humidity results in better performances for both direct and indirect dry cooling systems.
• Ambient temperature The ambient temperature affects both cooling system design and cooling system selection.
• Wind velocity High wind velocity reduces the performance of a dry cooling system.
Effects of a cooling system on power production include:
• Removed heat from cycle Removed heat from a cycle is the one of most important factors for heat efficiency of a power plant.
• Pressure after turbine Cooling system pressure dictates the back pressure of the turbine. As can be seen in Figure 12, a fresh water cooling system can provide the lowest pressure which results in more production.
In general, geothermal resources are located in remote areas, often in mountainous regions. Cold groundwater is usually not found in enough volume to be economical for cooling. That is why geothermal power plants are usually equipped with cooling towers, either wet or dry. The function of a cooling tower is to decrease temperature from the inlet to outlet of the tower based on the temperature difference between the warm water inlet and ambient temperature. An efficient cooling tower will give a high temperature difference between the inlet water and the outlet water with a low temperature difference between the inlet water and ambient temperature. Wet cooling tower. A cooling tower is an evaporative heat transfer device in which atmospheric air cools warm water, with direct contact between the water and the air, by evaporating part of the water. Wet cooling towers have a hot water distribution system that showers or sprays the water evenly over a latticework of closely set horizontal slats or bars called fill or packing. The fill thoroughly mixes the falling water with air moving through the fill as the water splashes down from one fill level to the next due to gravity. Outside air enters the tower via louvers in the form of horizontal slats on the side of the tower. The slats usually slope downward to keep the water in. The intimate mix between water and air enhances heat and mass transfer (evaporation) which cools the water. The cold water is then collected in a concrete basin at the bottom of the tower where it is pumped back to the condenser. The now hot, moist air leaves the tower at the top (Siregar, 2004). In mechanical-draft cooling towers, the air is moved by one or more mechanically driven fans. The majority of mechanical-draft cooling towers for utility application are, therefore, of the induced-draft
FIGURE 12: Types of cooling systems and the pressure (bar-a) that they can produce
0.02 0.04 0.06 0.08 0.1 0.12 0.15 0.2
Freshwater cooling
Evaporation cooling
Dry cooling direct
Indirect dry cooling
Condenser Pressure (bar-a)

Rakhshani Moghaddam 408 Report 18
type. With this type, air enters the sides of the tower through large openings at low velocity and passes through the fill. The fan is located at the top of the tower, where the hot, humid air exhausts to the atmosphere. The fans are usually multi-bladed and large, ranging from 6-10 m (20-33 ft) in diameter. They are driven by electric motors, as large as 250 hp, at relatively low speeds through reduction gearing. The fans used are of the propeller type, which move large volumetric flowrates at relatively low static pressure. They have adjustable-pitch blades for minimum power consumption, depending on system head load and climatic conditions (Radmehr, 2005). Additional (makeup) water. In the cooling-water system, water will be lost because of evaporation, drift and bleeding or blow down. Makeup water required by a cooling tower is the sum of that which would compensate for the water loss. This water, in addition to compensating for evaporation and drift, keeps the concentration of salts and other impurities down. Otherwise, these concentrations would continuously build up as the water continues to evaporate. The evaporation loss rate is 1-1.5% of the total circulating water flow rate. Blow down is normally 20% of evaporation loss but sometimes the value is similar to evaporation loss, depending upon the content of chemicals, content of various minerals, and the size of the plant. Water droplet size will vary with exchanger type, condition of the media, air velocity through the unit, and other factors. The drift loss is perhaps 0.03% of the total circulating water flow rate. A large quantity of drift cannot be tolerated, as it can cause water and ice deposition problems at and near the plant side (Siregar, 2004). Wet cooling tower calculations. To find and calculate the energy balance, mass balance, and power consumption for the fan of the cooling tower, the following parameters must be known (El-Wakil, 1984):
• Dry-bulb temperature (Tdb) is the temperature of the air as commonly measured and used. • Wet-bulb temperature (Twb) is the temperature of the air as measured by a psychrometer (Perry,
1950); if the air is saturated, i.e. φ = 100%, the wet-bulb temperature equals the dry-bulb temperature.
• Approach is the difference between the cold-water temperature and the wet-bulb temperature of the outside air.
• Range is the difference between the hot-water temperature and the cold-water temperature. • Relative humidity (φ) is the partial pressure of water vapour in the air, (Pv), divided by the
partial pressure of water vapour that would saturate the air at its temperature (Psat):
sat
v
PP
=ϕ (9)
• Humidity ratio(ω) is the air per unit mass of dry air,
v
v
a
v
PPP
PP
−==
622.07.853.53ω (10)
where 53.3 and 85.7 are the gas constants for dry air and water, respectively. The energy balance The energy balance between hot water and cold air entered, and cold water and hot air exiting the cooling tower is shown in Figure 13. Changes in potential and kinetic energies and heat transfer are all negligible. No mechanical work is done. Thus, only enthalpies of the three fluids appear. The subscripts 1 and 2 refer to air inlet and exit, the subscripts a and b refer to circulating water inlet and exit, respectively.

Report 18 409 Rakhshani Moghaddam
For the water: Wa = Mass of hot water entering the
cooling tower (kg/s); hfa = Enthalpy for liquid entering the cooling tower (kJ/kg);
Wb = Mass of cold water exiting the cooling tower (kg/s); hfb = Enthalpy for the liquid exiting
the cooling tower (kJ/kg).
For the air: ha1 = Enthalpy for the cold dry air (20°C) (kJ/kg) (psychrometric
chart (Perry, 1950)); ω1 = Humidity ratio for the cold air; hg1 = Enthalpy of the cold water vapour (kJ/kg) (steam table); ha2 = Enthalpy of the hot dry air (40°C) (kJ/kg) (Perry, 1950); ω2 = Humidity ratio for the hot air; hg2 = Enthalpy of the hot water vapour (kJ/kg) (from steam table). Following psychrometric practices, the equation for a unit mass of dry air is written as:
fbbgafaaga hWhhhWhh ++=++ 222111 ωω (11) The mass balance The dry air goes through the tower unchanged. The circulating water loses mass by evaporation. The water vapour in the air gains mass due to the evaporated water. Thus, based on a unit mass of dry air,
ba WW −=− 12 ωω (12) ( ) fbagpfaag hWhTTchWh )()( 12221211 ωωωω −−++−=+ (13)
where cp = Specific heat of air (kJ/kg°C); and
T2-T1 = Temperature difference between inlet and exit air temperature through the cooling tower (°C). 4.7 Power of fan To calculate the power of the fan Pfan (W) at the cooling tower, the equation is:
fan
airfan
pVPη
ƥ
= (14)
and,
outair
airair
mV,ρ
••
= (15)
Hot air out
ha2 , w2,hg2
2a
Hot water in
Wa , hfa
1Cold air in
ha1,w1,hg1,mair
b
Cold water out
Wb , hfb
FIGURE 13 : Energy balance in a cooling tower

Rakhshani Moghaddam 410 Report 18
Thus,
fanmotor
fanfanmotor
PP
,, η
= (16)
where ∆p = Pressure drop (Pa);
airV•
= Volume flowrate of air (m3/s);
airm•
= Mass flow of the air (kg/s); ρair, out = Density of the air out of the cooling tower (kg/m3); and ηfan and ηmotor, fan = Efficiency of the fan and the motor of the fan.
4.8 Power of the pump The following equations are used to calculate the power of the pump:
pump
waterpump
pVPη
ƥ
= (17)
water
waterwater
mVρ
••
= (18)
pumpmotor
pumppumpmotor
PP
,, η
= (19)
where:
∆p = Pressure drop (Pa);
waterV•
= Volume flowrate of water (m3/s);
waterm•
= Mass flowrate of the water (kg/s); ρwater = Density of the water (kg/m3); and ηpump and ηmotor, pump = Efficiency of the pump and the motor of the pump.
4.9 Heat exchangers Heat exchangers are devices that facilitate heat transfer from hot fluid to cold fluid. The heat exchange process between hot fluid and cold stream is shown in Section 5.2.1. The point at which the two curves come closest is called the Pinch Point, and the corresponding temperature is called the Pinch temperature. The pinch point divides the process into two thermodynamically separate regions. The Pinch temperature is the lowest temperature difference between the hot and cold fluids during the heat exchanger. Below the pinch, there is a heat surplus and only utility cooling is required. Any utility heating supplied to the process below the pinch temperature cannot be absorbed and will be rejected by the process to the cooling utility, increasing the amount of cooling utility required. Similarly, the area above the pinch requires only utility heating and no utility cooling. Any utility cooling above the pinch temperature has to be made up by additional utility heating (Mineral Processing Research Institute, 2001). The following energy balance equations are used for heat exchangers:

Report 18 411 Rakhshani Moghaddam
( ) )( ,,,,, inCoutCCoutHinHinH hhmhhmQ −=−=•••
(20)
( ) )()()( ,,,, inCoutCCpoutHinHHp TTcmTTcmQ −=−=•••
(21)
LMTDUAQ ×=•
(22) where U = Overall heat transfer coefficient (W/m2°C);
A = Heat transferring area (m2); and LMTD = Logarithmic Mean Temperature Difference (°C), which is abbreviated as LMTD
and calculated by:
( ) ( )
−−
−−−=
incoldouthot
outcoldinhot
incoldouthotoutcoldinhot
TTTT
TTTTLMTD
,,
,,
.,,,
ln (23)
5. CHOOSING THE POWER PLANT TYPE FOR AVAILABLE WELLS Well NWS-4 is scheduled to be used as a production well for a pilot single-flash geothermal power plant. Consequently, an EES model was made for a single-flash pilot power plant. A new cycle was also checked, a geothermal combined cycle which would use geothermal water from NWS-4 well and heat from the exhaust of a gas turbine. 5.1 Single-flash power plant First, the maximum electrical output from a single-flash power plant utilizing steam from well NWS-4 needs to be found. Wellhead production is throttled to increase the vapour fraction prior to entry into the flash separator which separates the vapour from the remaining liquid fraction. For simplicity, the pressure drop between separator and turbine inlet is neglected since it is largely dependent on detailed plant design. A substantial fraction of the available energy is discarded with the separated liquid. Overall plant thermal efficiencies are generally around 10% for a single-flash system. Greater utilization of the fluid, however, can be achieved with multiple flashing. Calculations indicate that a two-stage flash system can increase net power output by about 30% for 170°C reservoirs to about 23% for 300°C reservoir (Austin, 1975). Figure 14 describes the single-flash system. The accompanying temperature-entropy charts illustrate the basic thermodynamic process involved. To calculate the electrical power output of the generator, the following needs to be known:
FIGURE 14: Schematic diagram of a single-flash cycle

Rakhshani Moghaddam 412 Report 18
- Temperature and the enthalpy of the geothermal fluid in the reservoir (h1, t1); if there is more than one well, temperature and the enthalpy of each well are needed;
- Mass flow of the well (mwell); for many wells, the total of mass flow is found by adding the mass flow from each well (mtot);
- Pressure in the steam separator (its relationship to the inlet pressure turbine) (psep); - Pressure in the condenser (pcond); - Isentropic efficiency of the turbine (ηs); - Generator and shaft efficiency (ηtot); - Steam fraction in the separator (x3), where:
( ) 4,32,33 1 fg hxhxh −+= (24)
- Total steam mass flow (ms):
tots mxm 3= (25)
In this project only well NWS-4 is considered as a production well, hence the electrical power output is:
( ) stotsturbine ηηhhmW /32 −=•
(26) 5.2 EES model for a single-flash power plant The Engineering Equations Solver (EES) program was used to run the calculations. Design pressure The curves in Figure 4 can be used to determine whether the wells can sustain production at the proposed wellhead pressure. Figure 4 shows the wellhead pressure range to be 5-10 bar-a which allows maximum mass flow from the wells. The pressure in the separator is 5.5 bar-a. For this calculation the turbine outlet pressure was kept constant at 0.1 bar, isentropic efficiency of the turbine 0.78 and the total efficiency of the turbine-generator 0.77. The inlet pressure of the turbine is 5.5 bar-a. For the separator, 5.5 bar-a were chosen and from the SKM report (2004) it is known that the mass flow in this pressure is 56 kg/s. Power output of turbine generator A fundamental factor in the design of a geothermal power plant is the capacity of the turbine. The steam flowing from the separator and entering the turbine is 7.585 kg/s. Steam enters the turbine at approximately 155.5°C and at 5.5 bar-a. The steam expands in the turbine, converting the thermal and pressure energy of the steam to mechanical energy, which is converted to electrical energy in the generator. The steam exhaust from the turbine is at 0.1 bar pressure and 46°C saturation temperature and it is condensed in the surface condenser. From Equation 26 the power output of the turbine generator is calculated to be 3.52 MWe, but the value of the power output is actually less due to the power required for plant operation (pumps, cooling tower fan and so on). Power required for plant operation Condenser. The temperature of exhaust steam from the turbine is 46°C. The steam flows through the condenser where it is condensed by the cold water passing through the condenser. The temperature of the cold water entering the condenser is 30°C. It is heated in the condenser. The rejected water takes the heat from the condenser. The hot water is cooled again in the cooling tower. Mass flow of the

Report 18 413 Rakhshani Moghaddam
cold water is calculated, using Equation 6, to be 296 kg/s. Equation 19 is used to calculate the power requirement of the cooling water circulation pump, and it is 99.94 kW. The geothermal steam contains non-condensable gases (NCGs). Table 2 shows the gas analysis of the fluid from the wells. The NCGs are taken as 3% in the model. From Table 2 it can be seen that the non-condensable gases are 99% carbon dioxide. The NCGs are continuously removed from the condenser by ejectors or vacuum pumps. Using Equation 8 to calculate the power required for the vacuum pumps gives 120.8 kW. Cooling tower. As is common in geothermal plants, a cooling tower of an induced draft type will be used. The calculation of the cooling tower involves energy and mass balance. The energy balance here will be based on the first law: steady-state steady-flow (El-Wakil, 1984). There are, however, three fluids entering and leaving the system: cooling water, dry air, and the water vapour associated with it. The mass balance should also take into account these three fluids. The hot water entering the cooling tower is cooled through heat exchange with the cold air inside the cooling tower. The temperature of the water after cooling is 30°C. The cold air temperature inside the cooling tower is 25°C, which is the same as the wet-bulb temperature (Twb). The temperature difference between the steam entering the condenser and the hot water leaving the condenser is 3°C. The temperature difference between the hot water temperature entering the cooling tower and the hot air temperature exiting the cooling tower is 7°C. The approach is 5°C. From energy and mass balance calculations the power of the cooling tower fan is found to be 58.74 kW. The makeup water needed to replace water loss through evaporation, drift and blow down is 35.11 kg/s. The water is pumped from a nearby river to the cooling tower. The power of the pump required to supply makeup water from the river to the cooling tower is calculated to be 1.605 kW. The exhaust steam from the turbine will condense through the cooling process in the condenser. The condensate from the condenser will be pumped to the injection wells. Mass flow of the evaporated water is 6.347 kg/s. Hence, the power of the pump needed is 1.159 kW. Output of the power plant The output of the power plant is found by taking the the power from the generator and deducting from it the power required for plant operation, or:
)( ,3.2,1,, fanmotorpumpmotorpumpmotorpumpmotorVpumpmotorturbineplantpower PPPPPPP ++++−=− (27) The power plant output calculated from this equation is 3.237 MWe (Figure 1 in Appendix I). 5.3 Optimum pressure of the separator The optimum pressure of the steam separator is defined as the pressure at which the output from the power plant is maximized. To find it, the pressure in the condenser is kept constant and the output of the power plant is calculated for different pressures in the separator, for example at 1 to 7 bar-a. The results of these calculations are shown in Figures 15. The maximum output is 3.87 MWe at 2.33 bar-a pressure in the FIGURE 15: Separator pressure (bar-a)
vs. net power output (kW)
(bar-a)
(KW
)

Rakhshani Moghaddam 414 Report 18
separator. In the EES model, an equation was used that shows the relationship between mass flow and wellhead pressure. 5.4 Geothermal combined-cycle power plant Here, a new idea is suggested. The basic assumption in renewable energy development is using only renewable energy. However, here it is suggested to use a mixture of renewable energy (geothermal) with other kinds of energy, for example exhaust gas from a gas turbine. The aim for all engineers is to produce more electricity with less damage to nature. For example, geothermal energy could be used in combination with exhaust gas from a gas turbine, thus using less fuel than in a situation in which we only use geothermal resources or only a gas turbine. This idea is good at locations that only have low- or intermediate-temperature geothermal fields but also have other resources available. In Iran, gas turbine power plant usage has increased over the past years and these now provide up to 20% of the total electricity production. Still, not all the energy is used from the exhaust of these gas turbine power plants. Iran also has considerable medium-temperature geothermal resources. Therefore, the idea of a geothermal combined cycle is explored. This new cycle has benefits. Less fuel is used because the geothermal fluid is used as the first source for producing steam and the electrical production from the medium-temperature geothermal resources can be increased. For this new idea, two main questions have to be considered:
• Where is the best place to put the extra heat source in a geothermal power plant cycle? • What can be used as an extra source for the geothermal power plant?
To answer the first question, it is suggested to use the extra heat source in a super heater in a Rankine cycle where water is used as the working medium. This arrangement is shown in Figure 16. Both geothermal energy and the extra heat source are used to produce steam for the turbine. This new cycle has another benefit. If there are problems with wells, the electrical production from the cycle can be continued by switching over to the extra heat source. With this new cycle more reliability can be
4
5
9
8
Preheater
Boiler
Super heater
Injection wellProduction well
Separator
3
17
6
11
10 12
2
FIGURE 16: Schematic diagram of a geothermal combined-cycle power plant

Report 18 415 Rakhshani Moghaddam
expected in geothermal power plant production because the extra heat can be adjusted as can the pressure of the working media in the cycle and the mass flow. Production can also be maintained in emergency cases, such as:
• When the extra heat source cannot be used, with some changes production can be sustained by using the geothermal heat source alone;
• When there are problems with the wells then, by using the super heater as a boiler, it is possible to maintain production (in the second scenario); and
• In response to the second question, there are several options already in use in combined cycle power plants all over the world, for example, gas turbines, fuel burners, etc.
5.4.1 Conceptual model The Rankine cycle can be used as the basis for the new cycle. But both the geothermal and an extra heat source will be used to increase production. The Rankine cycle is a closed cycle. Therefore, the mass flow of the cycle and the pressure of the working medium can be decided. This helps in selecting the optimum pressure and mass flow in order to maximize electrical production. In this cycle there are three heat exchangers, i.e. the pre-heater, the boiler and the super heater. As can be seen in Figure 16 this is a new arrangement for a geothermal power plant. It is based on a Rankine cycle but with some changes that result in higher production and higher efficiency in a geothermal power plant. The schematic of this new arrangement is shown in Figure 16. The heat source in both the pre-heater and the boiler are constant if the mass flow and enthalpy of the well and Psep do not change. There are some limitations to this new arrangement. When selecting the pressure of the cycle, the temperature that is dictated by the separator pressure as to be considered. The cycle pressure has to be selected in such a way that the water temperature in the pre-heater and boiler remains less than the temperature of the geothermal steam and the geothermal brine. In the model, this pressure is an input. It can be changed by changing the pinch temperature in the heat exchanger. Another limitation is the heat that can be added in the super heater. The more heat the steam has that exits the boiler and enters the turbine, the dryer the exhaust steam from the turbine becomes. If the steam is heated too much, the exhaust steam becomes superheated. From a practical point of view, this is considered unacceptable. In the model, the maximum heat added in the super heater is given as Qsuperheater, max. This value is found by assuming the wetness after turbine equal to zero. Care has to be taken that the steam that goes into the turbine is completely dry. This gives the minimum heat needed in the super heater. In the model, that heat is Qsuperheater,_min and can be calculated by having the quality of steam entering the turbine as 1. The most important part of this new cycle is in determining the mass flow of the water for our cycle. For this propose, two scenarios were tested. 5.4.2 Different scenarios and additional components First scenario In the first scenario, the steam that exits the boiler should be dry steam, quality equal to one. Therefore, the mass flow in the model is calculated by having the mass flow and pressure equal to one. It is obvious in Figure 17 that the quality of the water that comes out of the pre-heater must be equal to zero because if the water starts to boil in the pre-heater, there would be a negative pinch, which is impossible. The water that comes out of the pre-heater and into the injection well is variable. By selecting the pressure and mass flow, it is not possible to use all the heat from the brine of the separator and the condensate that comes from the boiler.

Rakhshani Moghaddam 416 Report 18
Second scenario In this scenario, all the heat that is available in the pre-heater should be used, and the mass flow of the cycle is determined in that way. But it is obvious that the steam’s heat that comes from the separator is not enough to boil the water in the cycle (Figure 18). Therefore, the super heater has to be divided into two heat exchangers. The first one is like an extra boiler and the second one is a super heater. The second scenario is good as it makes a large amount of heat available as extra heat for the cycle. Pre-heater The brine from the separator and the condensate from the boiler enter the heat exchanger, called a pre-heater in this cycle, to warm up the water that comes from the main pump at high pressure and low temperature. Figure 19 presents the amorphous silica saturation curve for NWS-4. This curve shows that the brine from the pre-heater is not saturated with respect to amorphous silica until it reaches a temperature of about 100°C. This result indicates that silica deposition will start when brine cools down below 100°C (Radmehr, 2005). It means that the temperature of the pre-
heater outlet brine to the re-injection well should be higher than 100°C. Two scenarios were suggested with different mass flows for the cycle. In the first scenario mass flow was calculated in such a way that the quality of steam in point 2 is equal to 1. Only a part of the heat that is available could be used for the pre-heater because boiling is not allowed in it. Therefore, the brine could only be used to temperature TP , as shown in Figure 17. In the second scenario, the mass flow for the cycle was increased so all the energy that could be taken from the brine could be used in the pre-heater. This scenario is only possible in the case of an extra high heat source, as shown in Figure
NWS4
-0.6
-0.5
-0.4
-0.3
-0.2
-0.1
0
0.1
0.2
0.3
0.4
60 80 100 120 140 160 180 200 220Temperature (°C)
SI a
mor
phou
s sili
ca
FIGURE 19: Calculated state of amorphous silica saturation upon adiabatic boiling
FIGURE18: T-H diagram for second scenario
100
150155
T[3]
T_inT
H
T[1]
Pre he
ater
Boiler
Super heater
T_out
Q_super heaterQ_boilerQ_pre heater
(°C)
FIGURE 17: T-H diagram for first scenario

Report 18 417 Rakhshani Moghaddam
18. The equations are:
( ) )( ,,,,, inCoutCCoutHinHinH hhmhhmQ −=−=•••
(28)
( ) )( 11271010 hhmhhmQ Cyclepreheater −=−=•••
(29)
where 10•m = Total mass flow from separator brine and boiler (kg/s);
Cyclem•
= Mass flow that we chose for new cycle (kg/s); h10 = Enthalpy for the brine of separator and boiler entering the pre-heater heat
exchanger (kJ/kg); h7 = Enthalpy for the brine that goes from the pre-heater to the injection well (kJ/kg); h12 = Enthalpy for the medium (water) that exits the pre-heater (kJ/kg); h1 = Enthalpy for the medium that goes from the main pump to the pre-heater (kJ/kg).
Boiler A boiler is a closed vessel in which water or other fluid is heated under pressure. The steam from the separator comes to the boiler to warm up the water that exits the pre-heater. The boiler in this new cycle is a heat exchanger that uses the steam from the separator to boil the water that comes from the pre-heater. In an ordinary boiler in a commercial power plant, sources of heat for the boiler can be the combustion of fuels such as wood, coal, oil or natural gas. Heat recovery steam generators (HRSG) use the heat rejected from other processes such as gas turbines. Boilers can also be classified as fire-tube, water-tube boilers or cast iron sectional boilers, depending on whether the heat source is inside or outside the tubes or in the case of the cast iron sectional, the design and manufacture of the boiler. The goal in all cases is to maximize the heat transfer between the water and the hot gases heating it. (Wikipedia, 2006b). But in this new cycle, the boiler is a heat exchanger that uses steam to boil the water. The equations are:
( ) )( ,,,,, inCoutCCoutHinHinH hhmhhmQ −=−=•••
(30)
( ) )( 1221166 hhmhhmQ Cycleboiler −=−=•••
(31)
where 6
•
m = Mass flow of steam that comes from separator to boiler (kg/s);
Cyclem•
= Mass flow that chosen for new cycle (kg/s); h6 = Enthalpy of steam that comes from separator to boiler (kJ/kg); h11 = Enthalpy for the brine goes from boiler to pre-heater (kJ/kg); h2 = Enthalpy for the medium (steam) that exits the boiler (kJ/kg); h12 = Enthalpy for the medium going from pre-heater to boiler (kJ/kg).
Super heater In the super heater the extra heat source is used to increase the enthalpy of the steam that goes into the turbine. Of the two scenarios being looking at, the extra heat source in the first scenario is less than what can be used in the second. By having an available heat source for the super heater, the best scenario can be decided for designing the geothermal combined cycle. It is clear that if there is more access to a heat source in the super heater, then the second scenario is better, but then the geothermal source also becomes less important. Some optimization has to be done to find the best pressure and temperature for this new cycle.

Rakhshani Moghaddam 418 Report 18
In a commercial power plant, superheated steam boilers boil the water and then further heat the steam in a super heater. This provides steam at a much higher pressure, and increases the overall thermal efficiency of the steam plant due to the fact that all of the added heat can be extracted to perform useful work. Superheated steam presents unique safety concerns, however. Since the steam is at such high pressure, if there is a leak in the steam piping, water at such high pressure/temperature can cause serious, instantaneous harm to anyone entering its flow. Since the escaping steam will initially be completely superheated vapour, it is not easy to see the leak, although the intense heat and sound from such a leak clearly indicates its presence (Wikipedia, 2006b). But in the cycle presented here, the super heater is a heat exchanger that uses the extra heat source to heat up the steam to super heated steam. As the steam passes through the super heater tubes, it is heated by the hot gases from combustion, which flow around the tubes. The equations are:
( ) )( ,,,,, inCoutCCoutHinHinH hhmhhmQ −=−=•••
(32)
)( 23sup hhmQ Cycleerheater −=••
(33)
where erheaterQsup
•= Extra heat source for the new cycle (W);
Cyclem•
= Mass flow chosen for new cycle (kg/s); h3 = Enthalpy of steam that goes from super heater to turbine (kJ(kg); h2 = Enthalpy for the medium (steam) going from the boiler to the super heater (kJ/kg).
Non-condensable gases separation One of the important factors that must be considered is the non-condensable gases in geothermal water. In this cycle, it is suggested that the NCG are separated after leaving the boiler. In the boiler, the steam is condensed (which contains NCG) coming from the separator. A very simple knock-out drum can be used. This drum can separate NCG from liquid before it enters the pre-heater. If the NCG is not separated from the condensate, then the pH of the water declines, affecting the choice of materials for the pre-heater and piping. Once past the pre-heater, when the temperature reaches 100°C, another knock-out drum can be used to separate the NCG before injecting the water into the re-injection well. Rankine cycle Power plants generate electrical power by using fuels like coal, oil or natural gas. A simple power plant consists of a boiler, turbine, condenser and a pump. In an ordinary power plant, fuel is burned in the boiler and super heater, heating the water to generate steam. The steam is then heated to a superheated state in the super heater. This steam is used to rotate the turbine which powers the generator. Electrical energy is generated when the generator windings rotate in a strong magnetic field. After the steam leaves the turbine it is cooled to its liquid state in the condenser. The liquid is pressurized by the pump prior to going back to the boiler. A simple power plant is described by a Rankine cycle. Saturated or superheated steam enters the turbine at point 3, where it expands isentropically to the exit pressure at point 4. The steam is then condensed at constant pressure and temperature to a saturated liquid, point 5. The heat removed from the steam in the condenser is typically transferred to the cooling water. The saturated liquid then flows through the pump which increases the pressure to the cycle pressure (point 1), where the water is first heated to the saturation temperature, boiled and typically superheated to state 3. Then the whole cycle is repeated.

Report 18 419 Rakhshani Moghaddam
5.4.3 The gas turbine One of the options for an extra heat source is to use the exhaust from a gas turbine. The gas turbine (Brayton) cycle is one of the most efficient cycles for the conversion of gas fuels to mechanical power or electricity. The use of distillate liquid fuels, usually diesel, is also common where the cost of a gas pipeline cannot be justified. Gas turbines have long been used in simple cycle mode for peak lopping in the power generation industry, where natural gas or distillate liquid fuels have been used, and where their ability to start and shut down on demand is essential. Gas turbines have also been used in simple cycle mode for base load mechanical power and electricity generation in the oil and gas industries, where natural gas and process gases have been used as fuel. Gas fuels give reduced maintenance costs compared to liquid fuels, but the cost of natural gas supply pipelines is generally only justified for base load operation. More recently, as simple cycle efficiencies have improved and as natural gas prices have fallen, gas turbines have been more widely adopted for base load power generation, especially in combined cycle mode, where waste heat is recovered in waste heat boilers, and the steam is then used to produce additional electricity. The operating efficiency of a gas turbine depends on the operating mode, with full load operation giving the highest efficiency, with efficiency deteriorating rapidly with declining power output (Robles, 2006). In combined-cycle or cogeneration power plants, turbine exhaust waste heat can be economically used to generate additional power and thermal energy for process or space heating. In a commercial combined-cycle power plant (CCPP), or combined-cycle gas turbine (CCGT) plant, a gas turbine generator generates electricity and the waste heat from the gas turbine is used to make steam to generate additional electricity via a steam turbine; this last step enhances the efficiency of electricity generation. Most new gas power plants are of this type. In a thermal power plant, high-temperature heat used as input to the power plant, usually from burning fuel, is converted to electricity or low-temperature heat. As a rule, in order to achieve high efficiency, the temperature of the input heat should be as high as possible and the temperature of the output heat as low as possible (according to the Carnot efficiency). This is achieved by combining the Rankine (steam) and Brayton (gas) thermodynamic cycles. Such an arrangement used for marine propulsion is called combined gas and steam turbine (COGAS). In a steam power plant, water is the working medium. Here, high pressure is employed which leads to a bulky component. The high costs of special alloys that can endure high temperatures limit the practical steam temperature to 655°C. For compact gas turbines this limitation does not apply, and gas cycle firing temperatures in excess of 1,200°C are practicable. In the combined cycle plant, the thermodynamic working cycle is operated between the high firing temperature and the ambient temperature at which low temperature waste heat can be disposed. In a gas turbine set, composed primarily of a compressor, burner and the gas turbine proper, the input temperature to the gas turbine is relatively high (900-1,350°C) but the output temperature of the flue gas is also relatively high (450-650°C). Flue gas temperature is sufficient for the production of steam in the second steam cycle (Rankine cycle), with live steam temperature in the range of 420-580°C. The lowest temperature of the steam cycle depends on the ambient temperature and the method of waste heat disposal, either by direct cooling by lake, river or sea water, or using a cooling tower. Therefore, by combining both processes, high input temperatures and low output temperatures can be achieved and the power plant efficiency can be increased. The output heat of the gas turbine flue gas is utilized to generate steam by passing it through a heat recovery steam generator (HRSG) and therefore is used as input heat to the steam turbine power plant (Wikipedia, 2006a). For the combined cycle, one of the options for an extra heat source was using the exhaust gas from a gas turbine (with temperatures 450-650°C). This can be used as an extra heat

Rakhshani Moghaddam 420 Report 18
source to heat the output of the boiler to a superheated point. This promotes more efficiency and more production. In the EES model the effects of this extra heat source on the efficiency of the new cycle are checked. 5.4.4 Benefits of the combined cycle The following summarises the benefits of the combined cycle:
1. More thermal efficiency for the geothermal power plant; 2. Water access provided for the combined cycle by drilling a geothermal well; 3. Greater reliability for the geothermal power plant; 4. No scaling problem in the turbine in this new geothermal cycle; 5. Stable input in the steam turbine; 6. Increased raw efficiency of power plant; 7. All types of well water in this cycle are useable as it goes only into the heat exchanger; 8. Longer life time/span for the steam turbine; 9. No vacuum pump in condenser; 10. Ability to adjust the pressure and mass flow for the cycle; 11. Ability to adjust the wetness of steam that comes out of turbine; 12. More production than if only using a geothermal source.
5.4.5 EES model for geothermal combined cycle The Engineering Equations Solver (EES) program was used to run the calculations, based on necessary assumptions and design considerations. Assumptions
1. Pressure drop in pre-heater, boiler and super heater equals zero; 2. Heat loss in heat exchanger equals zero; 3. Pressure drop from well to separator is 1 bar but the pressure drop from separator to boiler and
pre-heater equals zero; 4. Effect of non-condensable gases in boiler and pre-heater is negligible; 5. Mass flow for cycle is selected such that the medium that exits the boiler is steam with x=1 in
the first scenario, but can be increased with access to an extra heat source in a super heater in the second scenario;
6. Pressure of the cycle is selected such that the temperature in the boiler and the pre-heater is less than the temperature of the steam and brine that comes from the separator; the minimum pinch point is 3°C;
7. The minimum heat required for the super heater is the heat needed to insure that the steam flowing to the turbine is completely dry;
8. The maximum heat for the super heater is limited by the requirement that the exhaust steam from the turbine must not be superheated.
Design pressure In order to select the design pressure for a geothermal combined cycle and the pressure for separator, the temperature for boiling water is first looked for in steam tables. Then by selecting the pinch point for the pre-heater and the boiler, the boiling temperature inside the boiler is found. With this temperature the pressure for the geothermal combined cycle can be found. It is obvious in both scenarios that the temperature of the water in the cycle will be less than the steam temperature and brine in the boiler and pre-heater. The pressure of the geothermal combined cycle is dictated by the pressure of the separator and the pinch temperature that we select for the heat exchanger. By selecting 5.5 bar-a for the separator, 56

Report 18 421 Rakhshani Moghaddam
kg/s mass flow from the well, and a pinch temperature equal to 3°C, then the pressure for the cycle is equal to 5 bar with a mass flow equal to 7.63 kg/s in the first scenario and 28.1 kg/s in the second. A fundamental factor in the design of a geothermal power plant is the capacity of the turbine. The steam flowing from the separator and entering the boiler is 7.585 kg/s. Steam enters the boiler at approximately 155.5°C and at 5.5 bar-a. The steam expands in the turbine, converting the thermal and pressure energy of the steam to mechanical energy, which is converted to electrical energy in the generator. The steam exhaust from the turbine is at 0.1 bar-a pressure and 46°C saturation temperature and it is condensed in a condenser. Output of the power plant The output of the power plant is found by deducting from the power generated by the generator the power required for plant operation, or:
)( ,3.2,1, fanmotorpumpmotorpumpmotorpumpmotorturbineplantpower PPPPPP +++−=− (34) 5.4.6 Calculations for different scenarios First scenario - no heat in the super heater
Power output of turbine generator. The pressure 5.5 bar-a was selected for the separator, 56 kg/s mass flow from the well, and a pinch temperature equal to 3°C. From Equation 4 the power output of the turbine generator is calculated as 3.48 MWe, but the value of the power output is actually less due to the power required for plant operation (pumps, cooling tower fan and so on). Calculations based on Equation 34 give the net power plant output as 3.3 MWe (see scheme in Figure 2 in Appendix I).
Power required for plant operation.
Condenser. The conditions are the same as shown for the condenser in Section 5.2. Hence, mass flow of the cold water is calculated, using Equation 6, to be 298.5 kg/s. Equation 19 is used to calculate the power requirement of the cooling water circulation pump, and it is 100.8 kW. Cooling tower. The conditions are again the same as shown for the cooling tower in Section 5.2. From energy and mass balance calculations the power of the cooling tower fan is found to be 59.23 kW. The makeup water needed to replace water loss through evaporation, drift and blow down is 6.4 kg/s. The water is pumped from a nearby river to the cooling tower. The power of the pump required to supply makeup water from the river to the cooling tower is calculated to be 1.61 kW.
The power needed for the main pump is 6.45 kW.
First scenario - maximum heat in super heater
Power output of turbine generator By selecting 5.5 bar-a for separator and 56 kg/s mass flow from well and pinch temperature equal 3°C. The Qsuperheater,_max can be calculated as equal to 3.2 MWth. From Equation 4 the power output of the turbine generator is calculated to be 4.4 MWe, without considering the power required for plant operation (pumps, cooling tower fan and so on). Calculations based on Equation 34 give the net power plant output as 4.2 MWe (see scheme in Figure 3 in Appendix I).
Power required for plant operation Condenser. The conditions for the condenser are still the same. Mass flow of the cold water is calculated, using Equation 6, to be 340.5 kg/s. Equation 19 is used to calculate the power requirement of the cooling water circulation pump, and it is 114.9 kW.

Rakhshani Moghaddam 422 Report 18
Cooling tower. Similarly, from energy and mass balance calculations the power of the cooling tower fan is found to be 67.56 kW. The makeup water needed to replace water loss through evaporation, drift and blow down is 7.3 kg/s. The water is pumped from a nearby river to the cooling tower. The power of the pump required to supply makeup water from the river to the cooling tower is calculated to be 1.81 kW. The power needed for the main pump is 6.45 kW.
Second scenario - minimum heat in super heater
Power output of turbine generator By selecting 5.5 bar-a for separator and 56 kg/s mass flow from well and pinch temperature equal to 3°C, Qsuperheater,_min is calculated to equal 42.7 MWth. From Equation 4 the power output of the turbine generator is calculated to be 12.8 MWe, without considering the power required for plant operation (pumps, cooling tower fan, etc.). Calculations based on Equation 34 give the net power plant output as 12.2 MWe (see Figure 4 in Appendix I).
Power required for plant operation
Condenser. Similarly to above, the mass flow of the cold water is calculated, using Equation 6, to be 1100 kg/s. Equation 19 is used to calculate the power requirement of the cooling water circulation pump, and it is 371.3 kW. Cooling tower. Similarly to above, from energy and mass balance calculations the power of the cooling tower fan is found to be 218.2 kW. The makeup water needed to replace water loss through evaporation, drift and blow down is 23.5 kg/s. The water is pumped from a nearby river to the cooling tower. The power of the pump required to supply makeup water from the river to the cooling tower is calculated to be 5.9 kW. The power needed for the main pump is 23.8 kW.
Second scenario - maximum heat in super heater
Power output of turbine generator With the same selection, 5.5 bar-a for separator and 56 kg/s mass flow from well and pinch temperature equal 3°C, Qsuperheater,_max can be calculated to equal 54.5 MWth. From Equation 4 the power output of the turbine generator is calculated to be 16.3 MWe, without considering the power required for plant operation (pumps, cooling tower fan, etc.). Calculations based on Equation 34 give the net power plant output as 15.6 MWe (see Figure 5 in Appendix I).
Power required for plant operation
Condenser. Based on the same conditions as before, mass flow of the cold water is calculated, using Equation 6, to be 1255 kg/s. And Equation 19 is used to calculate the power requirement of the cooling water circulation pump, and it is 423.5 kW. Cooling tower. Similarly to above, from energy and mass balance calculations the power of the cooling tower fan is found to be 249 kW. The makeup water needed to replace water loss through evaporation, drift and blowdown is 26.9 kg/s. The water is pumped from a nearby river to the cooling tower. The power of the pump required to supply makeup water from the river to the cooling tower is calculated to be 6.8 kW. The power of the main pump is 23.8 kW.

Report 18 423 Rakhshani Moghaddam
5.4.7 Power output optimization for the geothermal combined cycle First scenario - no heat in the super heater By changing the pressure in the separator, the pressure for the cycle can be changed. Different heat available for the boiler means different mass flow for the cycle. Without any heat for the super heater, the maximum net power output for the combined cycle using the same well as for the single-flash cycle is 3.95 MWe, as shown in Figure 20, with a pressure of 2.3 bar-a for separator. First scenario - extra heat in super heater By selecting the best pressure for the first scenario, it is possible to test how much more production can be attained with extra heat in the super heater. Then, the heat in the super heater is increased from zero to Qsuperheater,_max. Figure 21 shows that a production of 4.82 MWe can be reached with 3.7 MWth heat in the super heater. With this extra heat source the raw efficiency can be increased from 7.7% to 8.8% by using a super heater. Second scenario - extra heat in super heater In the second scenario, by changing the pressure of the separator the mass flow of the cycle could be changed. With higher pressure, more brine was available and more mass flow could be selected for the cycle. But with more mass flow and less heat for the boiler, more heat is needed for the super heater. By optimizing the maximum net power output for the second scenario (Figure 22), it is possible to produce 17.1 MWe using 58.4 MWth heat in the super heater. On the other hand, as is shown in Figure 23, by having higher pressure in the separator, the role of geothermal becomes less important.
FIGURE 22: Psep vs. net power output in second scenario
(kW
)
FIGURE 23: Psep vs. role of geothermal in second scenario
(kW
)
FIGURE 21: Best pressure for separator in first scenario
FIGURE 20: The effect of extra heat in superheater in first scenario on the power
(kW
)

Rakhshani Moghaddam 424 Report 18
5.4.8 Comparison between single-flash cycle and geothermal combined cycle Using two EES models and the optimization results, it has been shown that the geothermal combined cycle, without any heat in the super heater, can produce 3.95 MWe with 2.3 bar-a in the separator, while the single-flash cycle can produce 3.87 MWe in first scenario. Also, 3.2 MWth can be utilized in the first scenario with 5.5 bar-a separator pressure and production increased from 3.3 to 4.2 MWe. In the second scenario, more heat can be utilized by using the geothermal combined cycle. The geothermal combined cycle has some benefits. During operation, one of the most important benefits is that only pure water is used in the system, thus there are no scaling problems in the turbine. By using the super heater, wetness equal zero can be attained past the turbine which results in higher efficiency for the turbine. This new arrangement for a geothermal power plant gives more reliability in production. 6. CONCLUSIONS AND RECOMMENDATIONS A single-flash power plant is probably not the best choice for a pilot power plant using well NWS-4 in the Sabalan geothermal field because of the high capital cost. It is suggested that using a simple back-pressure turbine for NWS-4 is a better choice because of lower costs. After development and building of a larger power plant, this turbine can be moved to another place and the well connected to the new power plant. The geothermal combined cycle presented here is a new idea that needs more research, e.g. by comparing the net power output in utilizing an extra heat source in a commercial combined cycle to using the available geothermal heat in a separate power plant. It is necessary to consider the cost for these two different cases, using the geothermal combined cycle, or two separate power plants using two steam turbines. Furthermore, it would also be interesting to check the extra capital cost needed for this new arrangement vs. its benefits and the change in operating costs for the power plant. An exergy analysis would be very useful for finding the optimum pressure and mass flow for this new cycle.
ACKNOWLEDGEMENTS First of all, I am grateful to God for his protection throughout my stay in Iceland and for keeping my beloved family safe. I would like to express my gratitude to Dr. Ingvar B. Fridleifsson, director, and Mr. Lúdvík S. Georgsson, deputy director, of the UNU Geothermal Training Programme and Mr. Mohammad Bagher Kiaei for giving me the opportunity to participate in this special course. I am sincerely thankful to my supervisors, Mr. Kristinn Ingason and Professor Páll Valdimarsson for their help and advice throughout the project. Thanks to all UNU-GTP lecturers and staff members at Orkustofnun. My deepest thanks go to my dear family Mohammad Reza Rakhshani Moghaddam, Homa Razavi, Hossein, Maryam for their moral and emotional support during the six months. This project is dedicated to my wife Fariba Mohammad Bagheri for her support, prayers and encouragement throughout my stay in Iceland. I will be grateful forever. Finally, I want to name my grandfather Dr. Mohammad Hossein Razavi and Dr. Fatemeh Khatami who have always been an inspiration to me.

Report 18 425 Rakhshani Moghaddam
REFERENCES
Austin, A.L., 1975: Prospects for advances in energy conversion technologies for geothermal energy development. Proceedings of the 2nd United Nations Symposium on the Development and Use of Geothermal Resources, San Francisco, Ca, USA, 3, 1925-1935.
Bogie, I., Cartwright, A.J., Khosrawi, K., Talebi, B. and Sahabi, F., 2000: The Meshkin Shahr geothermal prospect, Iran. Proceedings of the World Geothermal Congress 2000, Kyushu-Tohoku, Japan, 997-1002.
Bromley, C., Khosrawi, K., and Talebi, B., 2000: Geophysical exploration of Sabalan geothermal prospect in Iran. Proceedings of the World Geothermal Congress, Kyushu-Tohoku, Japan, 1009-1014.
El-Wakil, M.M., 1984: Power plant technology. McGraw-Hill, Inc, USA, 859 pp.
Fournier, R.O., 1979: Geochemical and hydrologic considerations and the use of enthalpy-chloride diagrams in the prediction of underground conditions in hot spring systems. J. Volc. & Geoth. Res., 5, 1-16.
Giggenbach, W.F., 1980: Geothermal gas equilibria. Geochim. Cosmochim. Acta, 44, 2021-2032.
Giggenbach, W.F., 1988: Geothermal solute equilibria. Derivation of Na-K-Mg-Ca geoindicators. Geochim. Cosmochim. Acta, 52, 2749-2765.
Giggenbach, W.F., 1991: Chemical techniques in geothermal exploration. In: D’Amore, F. (coordinator), Application of geochemistry in geothermal reservoir development. UNITAR/UNDP publication, Rome, 119-142.
Gudmundsson, J.S., 1983: Silica deposition from geothermal brine at Svartsengi, Iceland. Proc. Symp. Solving Corrosion-Scaling Problems in Geothermal Systems. San Francisco, California, 72-87.
Kanoglu, M., 2001: Exergy analysis of a dual-level binary geothermal power plant. MTA, Turkey, webpage, www.mta.gov.tr/yayin/geothermics.htm.
Karlsson, Th., and May, D.A., 1987: Selection of separators for the first phase of the Nesjavellir geothermal project. VGK Consulting Engineers, Ltd., report (in Icelandic) prepared for the Reykjavik Municipal District Heating Service.
Mineral Processing Research Institute, 2001: The heat exchanger network (THEN), user’s manual and tutorial. MPRI, website, www.mpri.lsu.edu/Manuals%5CThenManual.PDF.
Mitsubishi, 1993: Geothermal power generation. Mitsubishi Heavy Industries, Ltd., website, www.mhi.co.jp/power/e_power/index_f.htm.
Noorollahi, Y., and Yousefi, H., 2003: Preliminary Environmental Impact Assessment of a geothermal project in Meshkin Shahr, NW-Iran. Proceedings of the International Geothermal Conference IGC 2003, Reykjavik, S12. 1-11.
Perry, J.H. (editor), 1950: Chemical engineers’ handbook. McGraw-Hill Book Company, Inc., NY, 1942 pp.
Reykjavik Energy Co., 2006: Horizontal steam separator. Reykjavik Energy, web page, www.or.is.
Robles, J., 2006: Simulation of a gas power plant. NTUT, Trondheim, website, www.nt.ntnu.no/users/skoge/diplom/prosjekt02/Robles-Pujals/gaspowerplant.pdf.
SKM, 2004: Well NWS-4, discharge evaluation report. SUNA and Sinclair Knight Merz, draft report, 43 pp.

Rakhshani Moghaddam 426 Report 18
SKM, 2005: NW Sabalan, geothermal feasibility study. SUNA and Sinclair Knight Merz, draft report, 92 pp.
Siregar, P.H.H., 2004: Optimization of electrical power production process for the Sibayak geothermal field, Indonesia. Report 16 in: Geothermal Training in Iceland 2004. UNU-GTP, Iceland, 349-376.
Radmehr, B., 2005: Preliminary design of a proposed geothermal power plant in NW-Sabalan area, Iran. Report 15 in: Geothermal Training in Iceland 2005. UNU-GTP, Iceland, 265-296.
Talebi, B., Khosrawi, K., and Ussher, G., 2005: Review of resistivity survey from the NW Sabalan geothermal field, Iran. Proceedings of the World Geothermal Congress 2005, Antalya, Turkey, CD, 7 pp.
Valdimarsson, P., 2003: Production of electricity from geothermal heat – efficiency calculation and ideal cycles. Proceedings of the International Geothermal Conference, IGC 2003, Reykjavík, S01 40-47.
Yousefi, H., 2004: Application of GIS in the environmental impact assessment of Sabalan geothermal field,NW-Iran. Report 19 in: Geothermal Training in Iceland 2004. UNU-GTP, Iceland, 439-474.
Yousefi, H., Jabbarian, B., Sohrab., T., and Azari, F., 2002: Environmental Impact Assessment of Meshkinshahr geothermal power plant. Iran Energy Efficiency Organization, report SABA/9/2002, 584 pp.
Wikipedia, 2006a: Combined cycle. Wikipedia, website: http://en.wikipedia.org/wiki/ Combined_cycle#Design_principle.
Wikipedia, 2006b: Boiler. Wikipedia, website: http://en.wikipedia.org/wiki/Boiler#Overview.
APPENDIX I: Schematics of a single-flash cycle and combined-cycle power plants using different scenarios
FIGURE 1: Single flash cycle power plant with 5.5 bar-a pressure in separator
SINGLE FLASH CYCLE WITH 5.5 bar-a pressure in
separator

Report 18 427 Rakhshani Moghaddam
FIGURE 2: Combined-cycle power plant with 5.5 bar-a pressure in separator, first scenario with no heat in super heater
FIGURE 3: Combined-cycle power plant with 5.5 bar-a pressure in separator, first scenario with maximum heat in the super heater
FIRST SCENARIOWITHOUT ANY HEAT IN
SUPER HEATER
FIRST SCENARIOWITH MAXIMUM HEAT IN
SUPER HEATER

Rakhshani Moghaddam 428 Report 18
FIGURE 4: Combined-cycle power plant with 5.5 bar-a pressure in separator, second scenario with minimum heat in super heater
FIGURE 5: Combined-cycle power plant with 5.5 bar-a pressure in separator, second scenario with maximum heat in super heater
SECOND SCENARIOWITH MAXIMUM HEAT IN
SUPER HEATER
SECOND SCENARIOWITH MINIMUM HEAT IN
SUPER HEATER