Embed Size (px)
Citation preview
GALAXY International Interdisciplinary Research Journal_______________________ ISSN 2347-6915 GIIRJ, Vol.2 (3), MARCH (2014)
12
A CONJOINT ANALYSIS OF CONSUMER PREFERENCES FOR
FAIRNESS CREAMS AMONG SMALL TOWNS LOCATED NEAR
AHMEDABAD CITY
DR. RITESH K. PATEL
ASSISTANT PROFESSOR,
PG RESEARCH CENTRE FOR GOVERNANCE SYSTEMS (CGS), GUJARAT TECHNOLOGICAL UNIVERSITY (GTU),
AHMEDABAD.
ABSTRACT
India‟s FMCG market is evolving at rapid speed, fuelled by growth of Indian economy,
increased disposable income of consumers, and rapidly changing lifestyles. This market has
seen a significant growth in the cosmetic market in last two decades and fairness cream
accounts for the major part of the cosmetic market with an average growth rate of 20% per
annum.
In addition to the analysis of consumer survey, conjoint analysis was done on different
attributes with specific attribute levels to get the utility values of different attribute levels
within an attribute. This was done to analyze overall utility of a product with certain
attributes, which can be further used to launch and position any new or existing product.
Conclusions were derived from the analysis - Fair & Lovely was ranked as the best brand on
specific factors attributed to Fair & Lovely like awareness, promotion and advertisements.
However, on the utility factor of a brand Olay was ranked the highest. There seemed to be a
perceptual bias in Indian consumers. Friends seemed to influence the Indian fairness cream
consumers the most based on the survey. Quality of a new brand and the current fashion
motivates the consumers to switch to a new brand of fairness cream.
There were other conclusions as well as certain limitations identified for the conducted
analysis and survey. Addressing these limitations would help in further improving the
analysis and results.
KEY WORDS: Rural Marketing, Indian Fairness Cream Market, Consumer Preferences,
Conjoint Analysis, etc.
Introduction
Fairness creams constitute a consistent proportion of income for the FMCG companies in
India. The fairness creams enjoy very good market growth rate when compared with other
related product categories. Fairness creams have become a vital product for the Indian FMCG
companies in increasing their overall sales due to the importance given by Indian consumers
towards fairness.
Penetration of most fairness creams is still quite low in India. Current consumption of many
products is well below that of many countries in Asia. The low market penetration of the
fairness cream products offers room for growth. The urban population with increasing
purchasing power is the major force driving demand for fairness cream. India is a very price-
sensitive market and mass-market products constitute the major part of the fairness cream
products.
GALAXY International Interdisciplinary Research Journal_______________________ ISSN 2347-6915 GIIRJ, Vol.2 (3), MARCH (2014)
13
HUL, 70%
CavinKare,10%
Garnier, 7%
Others, 13%
Market Share
HUL CavinKare Garnier
Consumption of fairness creams centres on young women, with the age group 15-44 years
accounting for about 70% of the market. Consumption begins in the teens and tapers off after
45, and declines substantially after 55 (refer Table 1).
Table 1 Consumption of Fairness Creams among Women in India, Source:
Extrapolated from assorted secondary sources
Age Group Share of Population % Share of Make-up Product Sales
Under 15 years 33% 10%
15 – 34 years 34% 50%
35 – 44 years 12% 20%
45 – 54 years 11% 15%
Over 55 years 10% 5%
The market size for fairness cream in India
is estimated to be Rs.800 crore. The
market growth rate ranges between 15 –
20% on a year-to-year basis. The leading
players in the market include Hindustan
Lever Ltd., (HLL's) 'Fair & Lovely' with 76
percent of the market share and
CavinKare's 'Fairever' with 15 percent of
the market share. Other important players
like Godrej's 'Fairglow', Emami's 'Fair and
Handsome', Vicco and Himalaya share the
rest of the market share. It has been
estimated that males constitute 20 percent
of the total sales for fairness creams in
India. The existing players are focusing
upon improving the quality and ingredients
and new players are invading the Indian
market.
The sector is highly dispersed, as a result of
extensive monitoring and licensing
restrictions imposed by the government
over thirty years: there are close to 100
organized players, including several
multinational players, besides hundreds of small-scale units that are exempt from formally
reporting their details.
Types of Companies
There are three principal types of companies in the organized sector:
• Foreign-owned/International companies: Unilever, P&G, Colgate-Palmolive, L‟Oreal,
Revlon, Oriflame, Avon, Amway, Gillette, Wella AG, Shisaido, Schwarzkopf, and several
Italian companies.
• Large indigenous companies: Ayur herbal, Dabur, Marico, Godrej, CavinKare, Emami,
Biotique, and Paras.
Figure 1 Market Share of Fairness Cream Brands

GALAXY International Interdisciplinary Research Journal_______________________ ISSN 2347-6915 GIIRJ, Vol.2 (3), MARCH (2014)
14
• Small/medium companies: About 100 players. In addition to the organized sector, there is
a very large unorganized sector comprising of hundreds of micro/cottage scale enterprises,
spread across the country, thriving on products based on traditional and local recipes.
Fairness Cream - Principal Market Segment
The fairness cream products form a part of the skin & body care segment of the cosmetic
products portfolio. Skin-care, a crowded market, estimated at Rs 21 billion, has been growing
at a 16%. Besides Lakme, Ponds and L‟Oreal, others significant players in this category
include VLCC, Biotique, Revlon, Amway, Avon and Marico‟s Kaya. Procter & Gamble is
the latest entrant to the category, having launched its Olay brand in July 2007.
The skin care market is hotly contested, with more than 170 companies and 350brands in
close to 1500 SKUs reported to be on the market shelves. The market size of the skin-care
segment is estimated at Rs 21 billion. Fairness creams, with a market of around Rs 11.75
billion, account for around 56 per cent by value.
Table 2 Market Segmentation of Skin Care Products by Volume & Value
Category % Volume % Value
Antiseptic Creams 14 13
Astringents 1 1
Calamines/Foundations 2 6
Cold Creams 13 8
Fairness Creams 48 56
Moisturizing Creams 17 11
Snows 1 0
Vanishing Creams 4 5
The premium skin care products have a market size worth Rs. 4.5 billion - approx. 22% of the
total skin care market. The market for premium cosmetics products in general and skin care
products in particular has been growing faster than the overall market, driven by the changing
lifestyles and increasing disposable incomes.
Fairness creams are the popular categories in the skin-care segment and account for
approximately 60 percent of the skin-care segment. However, the distribution of premium
skin-care products is still restricted to metro and mini-metro cities - about 30 cities all over
India.
Over 90 per cent of women in India cite skin lightening as a high-need area. Indeed fairness,
by itself, stands for a bundle of skincare benefits (like oil-control, blemish reduction, sun
protection, etc.). Also, most women in India tend to use only one cream (usually fairness
cream) for all these benefits as an economical alternative. As a result, India is a huge market
for fairness creams.
In 2006, fairness products accounted for nearly Rs. 12 billion, and annual growth rate ranging
from 10 to 15 per cent in the past five years. Media blitz, especially on TV, has added to the
light skin mania. An interesting new trend is that men account for about 25 per cent of
fairness cream use across the country and the figure is growing. This has seen launch of nine
new fairness products in the market since 2005.

GALAXY International Interdisciplinary Research Journal_______________________ ISSN 2347-6915 GIIRJ, Vol.2 (3), MARCH (2014)
15
Growth Drivers for Fairness Cream Market
The sector has seen impressive growth since the 1990s, following a series of economic
reforms reduced import tariffs and lower excise duties, principally- resulting in lower
manufacturing costs and improved affordability by the consuming class that has also seen a
rise in disposable incomes in recent times.
Driven by rising penetration, the sector has grown by an average of 7-8% per annum since
1992, and more than 15% per annum in the last 3-5 years. Meanwhile, several new sub
categories and niches are emerging in each segment. The industry foresees a steady 15%
growth rate for the next five years, driven by increased product usage intensity and wider
market coverage, with increasing penetration in rural areas.
The market for fairness creams has been growing and will continue to grow in the coming
years. Some of the key factors driving the market growth in the sector are:
• Higher disposable incomes per household in purchasing power parity (PPP) terms.
• The consumer confidence index is high, which is converting the traditional
savings oriented mindset to greater consumption and spending on leisure, lifestyle
and even luxury - experiment, try new things, spending more on “feeling and
looking good”-entertainment, durables, apparels, appliances, home improvement
products, lifestyle accessories, beauty products etc.
• India is a young nation, with majority of its population in the age group that is
most likely to use fairness creams and other personal care products.
• The present low per capita consumption leaves tremendous potential for increase
in consumption in the coming years.
• Indian consumers, particularly in the metros and tier I cities (young, wealthy,
increasingly internationally exposed and well educated) are demanding products
and services of international standard and quality.
• Availability of specialty products addressing specific consumer needs are further
driving the demand for niche products, thereby expanding the market.
• The rapid demographic transition, burgeoning demand, rising affluence and more
workingwomen force are key drivers for rapid growth in the fairness cream
segment in India. With per capita cosmetics spend of $0.68 per year, the Indian
market offers a huge opportunity to international beauty cosmetics companies, for
whom markets around the world are saturating.
Sampling Plan
Target Population: The survey was floated through the internet through various media, by
the researcher or through friends and social networking channels. The targeted number was
around 100-120, and a number of 51 were reached (of which 20 were incomplete response).
The target area was small towns (Vehelal, Adalaj, Jetalput, Satej, Uwarsad, Dabhoda, Kanij,
Sasandra, Sanand, Dehgam, Badarpur, Ghodasar, etc.) located near Ahmedabad city of
Gujarat state in India. Looking at nature of research, Non probability based convenience
sampling method was employed to collect samples from targeted population
Survey Population: Sampling population included female college students and working
class of age groups less than 35.
GALAXY International Interdisciplinary Research Journal_______________________ ISSN 2347-6915 GIIRJ, Vol.2 (3), MARCH (2014)
16
Sampling Design: For sample design, data was transferred from Qualtrics survey software
directly in the form of SPSS datasets for analysis. Data was refined through consistency
checks and manual removal of imperfect responses.
Eligibility Criteria: Both users and non-users of fairness cream were eligible for sampling.
Proposed Sample Size: 31 (Usable responses)
Response Rate: The response rate was total number of completed responses of the total
responses recorded. Hence it was 62% (=31/50).
Response Bias: The survey questions were objective enough so as to not provide any leading
opinion. This was intended to reduce response bias.
Data Preparation
A codebook was created containing an exhaustive list of all variables that are expected to be
used in the quantitative analysis. The questions which generated these variables and the scale
type for each of these variables are also mentioned in the Code Book (Table 3).
Table 3 Code Book for Survey Variable Number Description Question No. Scale Type
1 User of Fairness Cream 1.1 Nominal
2 Frequency of Usage 2.1 Nominal
3-7 Influencing Factors in Purchase Decision 2.2, 3.1 Ordinal
8-12 Brand Ranking on basis of Awareness 2.3, 3.2 Ordinal
13-17 Brand Ranking on basis of Promotional
Offers
2.4, 3.3 Ordinal
18-22 Brand Ranking on basis of Advertisements 2.5, 3.4 Ordinal
23-27 Brand Ranking on basis of Range/Variety 2.6, 3.5 Ordinal
28 Intention to switch to New Brand 2.7 Nominal
29-33 Factors Considered while Looking for New
Brand
2.8, 3.6 Ordinal
34-40 Important Features for Purchase of Brand 2.9, 3.7 Ordinal
41-43 Evaluation Factors for Brand 2.10, 3.8 Nominal
44-46 Similarity in Brand Used by family, friends,
peers
2.11 Nominal
47 Age 4.1 Interval
48 Income 4.2 Interval
49 Marital Status 4.3 Nominal
50 Occupation 4.4 Nominal
Reliability Test for the Survey
The survey questionnaire was tested for reliability and internal consistency using Cronbach‟s
alpha. Cronbach alpha is a statistic used when the survey/questionnaire consists of a lot of
questions that form a scale.

GALAXY International Interdisciplinary Research Journal_______________________ ISSN 2347-6915 GIIRJ, Vol.2 (3), MARCH (2014)
17
Table 4 gives the output of SPSS. A value of 0.899 for Cronbach’s alpha in Reliability
statistics shows that the internal consistency of the survey is good, and thus the survey was
not changed any further.
Table 4 SPSS Output: Cronbach’s Alpha Reliability Statistics
Cronbach's Alpha Cronbach's Alpha Based on Standardized Items N of Items
.833 .899 48
Data Analysis & Interpretation
The survey was aimed at collecting responses to questions that would help in identification of
the consumer buying behaviour characteristics and preferences for fairness cream. The
questions in the survey were designed to provide answers to the following:
The popular brand of fairness cream among the major existing brands
The reason of choosing a particular brand of fairness cream
The factors influencing choice of a particular brand of fairness cream
The value for a brand of fairness cream
The attractive features of a fairness cream
1) Brand Preference
There were four factors that were identified to be the determinants in individual‟s preference
for a brand. The factors - Brand awareness, promotion, advertisements and range, were
decided on the basis of exploratory analysis – literature survey and interviews with users. The
5 major brands in the Indian fairness market - Fair ever, Fair & lovely, Pond‟s, Lakme and
Olay, were considered for this analysis.
Rank-Based Analysis
The analysis required the respondents to rank the 5 brands against each of the four factors
identified to understand the consumer‟s preference for any of the existing brands.
Table 5 was obtained on the basis of the responses gathered from the respondents giving the
preference for the brands on the basis of the four factors.
Table 5 Brand Preferences
Brand Fairever Fair & Lovely Ponds Lakme Olay
Company CavinKare HUL HUL HUL P&G
Factors Rank
Awareness 5 1 2 4 3
Promotion 4 1 2 5 3
Advertisement 5 1 2 5 3
Range/Variety 5 1 2 3 4
In order to understand if the consumers perceive any relation between the different factors,
pair-wise Pearson‟s correlation coefficient was calculated. The same is shown in Table 6.

GALAXY International Interdisciplinary Research Journal_______________________ ISSN 2347-6915 GIIRJ, Vol.2 (3), MARCH (2014)
18
Table 6 Correlation between Factors for Brand Preference
Factors Awareness Promotion Advertisement Range/Variety
Awareness - 0.54 0.66 0.53
Promotion 0.54 - 0.53 0.55
Advertisement 0.66 0.53 - 0.60
Range/Variety 0.53 0.55 0.60 -
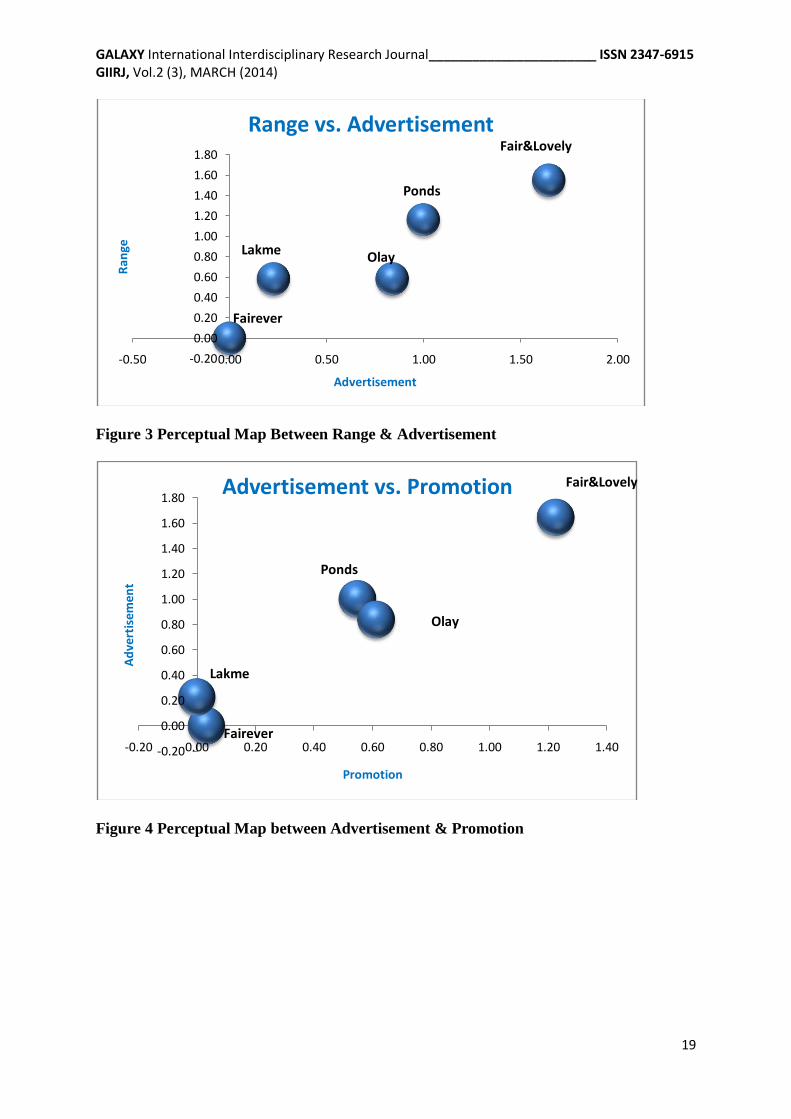
Perceptual Mapping Based Analysis
Perceptual mapping is a diagrammatic technique that is used to visually display the
perceptions of consumers or potential consumers of the product. Typically the position of a
product, product line, brand, or company is displayed relative to their competition against
different dimensions/factors. The number of dimensions most commonly used for perceptual
mapping is two.
The perceptual map was made for each of the 6 pairs possible from the four factors. Each of
the five brands was positioned on the map based on the ranks given by the respondents. The 6
perceptual maps obtained are shown below (Fig.:2-7).
Figure 2 Perceptual Map Between Promotion & Awareness
-0.20
0.00
0.20
0.40
0.60
0.80
1.00
1.20
1.40
-0.50 0.00 0.50 1.00 1.50 2.00 2.50
Pro
mo
tio
n
Awareness
Promotion vs. Awareness
Ponds
Fairever
Lakme
Fair&Lovely
Olay
GALAXY International Interdisciplinary Research Journal_______________________ ISSN 2347-6915 GIIRJ, Vol.2 (3), MARCH (2014)
19
Figure 3 Perceptual Map Between Range & Advertisement
Figure 4 Perceptual Map between Advertisement & Promotion
-0.20
0.00
0.20
0.40
0.60
0.80
1.00
1.20
1.40
1.60
1.80
-0.50 0.00 0.50 1.00 1.50 2.00
Ran
ge
Advertisement
Range vs. Advertisement
Ponds
OlayLakme
Fairever
Fair&Lovely
-0.20
0.00
0.20
0.40
0.60
0.80
1.00
1.20
1.40
1.60
1.80
-0.20 0.00 0.20 0.40 0.60 0.80 1.00 1.20 1.40
Ad
vert
isem
ent
Promotion
Advertisement vs. Promotion
Ponds
Lakme
Fair&Lovely
Olay
Fairever

GALAXY International Interdisciplinary Research Journal_______________________ ISSN 2347-6915 GIIRJ, Vol.2 (3), MARCH (2014)
20
Figure 5 Perceptual Map for Advertisement & Awareness
Figure 6 Perceptual Map for Range & Awareness
-0.20
0.00
0.20
0.40
0.60
0.80
1.00
1.20
1.40
1.60
1.80
-0.50 0.00 0.50 1.00 1.50 2.00 2.50
Ad
vert
ise
me
nt
Awareness
Advertisement vs. Awareness Fair&Lovely
Ponds
Lakme
Olay
Fairever
-0.20
0.00
0.20
0.40
0.60
0.80
1.00
1.20
1.40
1.60
1.80
-0.50 0.00 0.50 1.00 1.50 2.00 2.50
Ran
ge
Awareness
Range vs. AwarenessFair&Lovely
Ponds
OlayLakme
Fairever

GALAXY International Interdisciplinary Research Journal_______________________ ISSN 2347-6915 GIIRJ, Vol.2 (3), MARCH (2014)
21
Figure 7 Perceptual Map for Range & Promotion
Interpretation
From the rank-based analysis as well as perceptual map, it is observed that Fair & Lovely is
ranked as the best brand with respect to all the four factors considered, followed by Pond‟s.
The analysis shows that Fair & Lovely and Pond‟s have built an excellent brand image in the
Indian market. Fairever is the least preferred brand across all the factors.
The pair-wise correlation coefficients from Table 6 do not show a very high value. This
means that the identified factors are not highly correlated. However, a correlation value in the
range of 0.50 to 0.70seems to indicate that all the factors are perceived similarly by the
consumers, and do not influence consumers independently. Fair & Lovely which is ranked
the highest in brand awareness by the consumers is also the highest preferred in terms of
range of products, promotions and advertisements. The same hold true for Pond‟s which is
ranked second. The analysis suggests a potential perceptual bias among the consumers
towards a brand irrespective of the criteria for comparison.
2) Reason for Looking for a Different Brand
One of the reasons for increase in market share of a brand could be the switching of an
existing consumer from a different brand to the concerned brand. Thus, it becomes
imperative to consider not only the buying behaviour of a new customer, but also the reasons
that may influence a consumer to shift to a new brand.
From the exploratory analysis through secondary research, the reasons for looking for a new
brand of fairness cream were found to be highly dependent on the quality of new brand, price,
current fashion and new brand in the market. The analysis is aimed at finding if the identified
variables are significant in predicting the intent for purchase of a different brand. Linear
regression was performed on the factors mentioned as independent variables with the intent
to purchase as a dependent variable. The regression was done using the software, Minitab.
-0.20
0.00
0.20
0.40
0.60
0.80
1.00
1.20
1.40
1.60
1.80
-0.20 0.00 0.20 0.40 0.60 0.80 1.00 1.20 1.40
Ran
ge
Promotion
Range vs. PromotionFair&Lovely
Ponds
OlayLakme
Fairever
GALAXY International Interdisciplinary Research Journal_______________________ ISSN 2347-6915 GIIRJ, Vol.2 (3), MARCH (2014)
22
The dependent as well as the independent variable could take only discrete values, integers
from 1 to 5 (Likert Scale).
The response variable was taken as percentage looking for a brand (Y). Independent variables
used for regression were as follows:
New_in_market (New brand in market)
Current fashion (Current fashion)
Price
Quality new (Quality of new brand)
Regression was done using Minitab, and the regression output & equation is as follows:
Y = - 1.45 + 0.158 New_in_market + 0.504 Current_fashion + 0.659 Price + 1.003
Quality_new
Predictor Coef. SE
Coef.
T P VIF
Constant -1.4460 1.3150 -1.1000 0.2950
New_in_market 0.1580 0.1448 1.0900 0.2980 1.5360
Current_fashion 0.5040 0.1678 3.0000 0.0120 1.3910
Price 0.6591 0.1654 3.9900 0.0020 1.8470
Quality_new 1.0030 0.2315 4.3300 0.0010 1.2640
S = 0.501708 R-Sq = 70.7% R-Sq(adj) = 60.0%
For a variable to be significant, p-value needs to be less than 0.01. Since p-value for
New_in_market is more than this critical value, the variable is not significant and is dropped
to obtain the following linear regression with the remaining three factors affecting ranking of
brands.
The new regression equation, thus obtained, is:
Y = - 0.366 + 0.430 Current fashion + 0.562 Price + 0.987 Quality_new
Predictor Coef. SE
Coef.
Standardized
Beta
T P VIF
Constant -0.3661 0.8724 -0.4200 0.6820
Current_fashion 0.4295 0.1545 0.405 2.7800 0.0170 1.1610
Price 0.5625 0.1408 0.356 4.0000 0.0020 1.3170
Quality_new 0.9870 0.2329 0.540 4.2400 0.0010 1.2590
S = 0.505681 R-Sq = 67.5% R-Sq(adj) = 59.4%
Interpretation
The three factors considered are able to explain almost 60% of the consumer‟s decision to
look for a new brand. These are Current fashion, price and Quality new.
The square root of the variance inflation factor, VIF tells how much larger the standard error
is, compared with what it would be if that variable were uncorrelated with the other predictor
variables in the model. Since VIF for all factors is below 4, the standard error of the
coefficient of the variable is acceptable.

GALAXY International Interdisciplinary Research Journal_______________________ ISSN 2347-6915 GIIRJ, Vol.2 (3), MARCH (2014)
23
The standardized beta indicates the contribution of each of the significant variables to the
regression model. The decision to look for new brand fairness cream is influenced mostly by
quality of a new brand in the market, which contributes more than 40% to the model.
3) Factors influencing Purchase of a Brand
Exploratory analysis had yielded insights that the purchase of fairness cream is often
influenced by the peer group, family, friends and advertisements. However, the influence of
each of these factors is different due to the different roles played by each of the factors for an
individual.
Secondary research has provided the basis for this analysis, and suggests that advice, opinion,
and the values of reference group are an effective determinant of an individual‟s
behavior.Table-7 shows the ranks for the factors based on the information collected from the
survey respondents.
Table 7 Ranking of Factors Influential Factors Rank Rank Sum (SR) Rank Sum (SR) ^ 2
Family 4 82 6724
Friends 1 52 2704
Word of Mouth 3 77 5929
Neighbours 5 117 13689
Advertisements 2 62 3844
The ranks to the different factors were assigned on relative comparison of sum of ranks given
by each individual respondent for the different brands. However, there is a possibility that the
responses by individuals may not converge to the overall rank assigned based on total sum.
Hypothesis test was performed to check whether the different respondents are in agreement
or not.
Ho: Respondents have disagreement in ranking
H1: Respondents do not have disagreement in ranking
Test Statistic: For the hypothesis test, Kendall‟s coefficient of concordance was taken as test
statistic (referred from a paper).
𝑊 =𝑆
112
𝑘2 𝑛3 − 𝑛
n = No. of attributes ranked = 5, k = No. of respondents = 31
Where, 𝑆 = 𝑆𝑅 2 − 𝑛 𝑆𝑅 2
From Kendall‟s coefficient, 𝜒2 can be derived as 𝜒2 = 𝑘 𝑛 − 1 𝑊 with (n-1) degrees of
freedom,
𝝌𝟐(cal) = 38 >𝝌𝟐 (from distribution table, 4 degrees of freedom & at 5% level of
significance) = 9.48733
From the above calculations, H0 is rejected and H1 is accepted. Thus, we can conclude that
the respondents do not have disagreement over ranking.
Interpretation
Friends are the most influential factor when it comes to purchasing a brand of fairness cream.
Advertisements and word of mouth occupy the 2nd
and 3rd
places respectively, with family
and neighbours being the least influential factors.
Family was expected to play an influential role in the purchase decision of an individual.
However, as determined from the exploratory analysis (interviews with individuals) the
young users of fairness cream (who form major chunk of our sample survey) often discuss

GALAXY International Interdisciplinary Research Journal_______________________ ISSN 2347-6915 GIIRJ, Vol.2 (3), MARCH (2014)
24
about the skincare products etc. with their peer group and friends rather than family, the
analysis of rankings obtained in Table 7 also indicates the same.
The hypothesis test using Kendall‟s coefficient reinforced the fact that the respondents‟
individual rankings converge to the same ranking as indicated by the overall ranking of the
influential factors.
4) Value of the Brand
As all of us understand, brand plays an important role in the purchase decision of a consumer.
And, the brand is created in the minds of the people if, as a consumer of the product, they are
able to derive value from the brand‟s product. This helps in creating brand image in the
minds of the consumer while purchasing the product. The value, as found from secondary
research, may be derived in terms of social acceptability, value for money and self-
satisfaction.
The respondents were required to indicate their preference as Yes or No, for the 3 factors as
being the means of deriving value from the brand. The same factors would also be important
for customers to make the purchase decision.
Table 8 Value of the brand
Value of Brand
Value for
Money
Social
Acceptability
Self-
Satisfaction Total
Response Yes 28 17 28 73
No 2 13 2 17
Total 30 30 30 90
Value of Brand
Like the Hypothesis test performed in Sub-Section (2), a similar hypothesis test was
performed – a chi-square test to check the association between the value of the brand and the
purchase decision.
Null Hypothesis, Ho: Value of the brand is not associated with the purchase decision making
process.
Using the process as mentioned in Sub-Section (2),
𝝌𝟐(cal) = 16.27<𝝌𝟐 (distribution table, 3 degrees of freedom & at 5% level of
significance) = 4.541
As𝜒2(cal) >𝜒2(table) => Ho is rejected, that is, value of the brand is associated with the
purchase decision making process for a fairness cream.
Interpretation
As found from the 𝜒2test, the value of brand is associated with the purchase decision making
process. It is also observed that the value of the branded fairness cream for the people is
mostly „self-satisfaction‟ and the „value for money‟. Respondents have given the least
preference to „social acceptability‟ for the value of the brand.
5) Basis of Selecting the Brand
Brands have both tangible and non-tangible features which may be considered significant by
consumers while purchasing fairness cream. Most of the associations for fairness cream are
derived from current trend, popularity and recommendation. The perceived quality in terms
of fragrance, sunscreen, fairness and packaging are considered to be important for a fairness
cream product. The following table collates the responses of individuals and provide an
overall score and ranking to the attributes in order of their importance.

GALAXY International Interdisciplinary Research Journal_______________________ ISSN 2347-6915 GIIRJ, Vol.2 (3), MARCH (2014)
25
Table 9 Features of the Brand Features
Popularity Trend Availability Fairness Recognition Additional
features
like
Fragrance
Packaging
Total Score 36 48 40 25 31 35 44
Rank 4 7 5 1 2 3 6
Interpretation
The individual scores (on a scale of 5) were totalled to obtain the score of different features
like popularity, packaging etc. Accordingly these features were then ranked with least score
being the one with minimum score. Thus, brand attribute fairness is ranked highest, meaning
it is viewed as the most important attribute of a fairness cream, followed by recognition
second. Packaging and trend are on the lower ranks and hence are not put into much
consideration while selecting a brand.
6) Quantitative Analysis - Conjoint Analysis
In view of the current study, conjoint analysis was done to identify and attach utility value to
the attribute levels of each attribute. This would indicate consumer‟s preference for a
particular attribute level within an attribute independent of any other factor/attribute. The
factors assumed to be important for a consumer while making a purchasing decision for
fairness cream were listed and the attribute levels were identified by looking through the
product range available in the Indian market for fairness cream.
The attributes and the attribute levels were fed into Qualtrics online survey which has an
inbuilt feature for designing survey questions for Conjoint Analysis and providing the utility
values from the responses collected for each attribute level within an attribute. Based on the
responses received for each of the questions, utility values were generated. The within-
attribute utility values are depicted in Fig. 08-12.
Average Utility Values – Brand
Figure 8 Conjoint Analysis – Brand
0%
5%
10%
15%
20%
25%
30%
FaireverFair & Lovely
PondsLakme
Olay
GALAXY International Interdisciplinary Research Journal_______________________ ISSN 2347-6915 GIIRJ, Vol.2 (3), MARCH (2014)
26
Average Utility Values – Additional Features
Figure 9 Conjoint Analysis - Additional Features
Average Utility Values – Price (Rs/100 gm)
Figure 10 Conjoint Analysis– Price
0%
20%
40%
FairnessSunscreen
Fragrance
Composition - Herbal, Vitamins, Natural
0%
5%
10%
15%
20%
25%
30%
150250
300350
600
GALAXY International Interdisciplinary Research Journal_______________________ ISSN 2347-6915 GIIRJ, Vol.2 (3), MARCH (2014)
27
Average Utility Values – Packaging
Figure 11 Conjoint Analysis - Packaging
Average Utility Values – SKUs
Figure 12 Conjoint Analysis– SKUs
Interpretation
The average utility values for each of the attribute levels of an attribute were understood.
For brand, Olay was the highest on utility of consumers whereas Fairever was identified as
the brand with least utility. All the other 3 brands that have been considered had almost
similar utilities.
0%
5%
10%
15%
20%
25%
30%
35%
40%
45%
Plastic Squeeze-Out Tube Plastic Bottle
Sachet
0%
5%
10%
15%
20%
25%
25 gm50 gm
80 gm100 gm

GALAXY International Interdisciplinary Research Journal_______________________ ISSN 2347-6915 GIIRJ, Vol.2 (3), MARCH (2014)
28
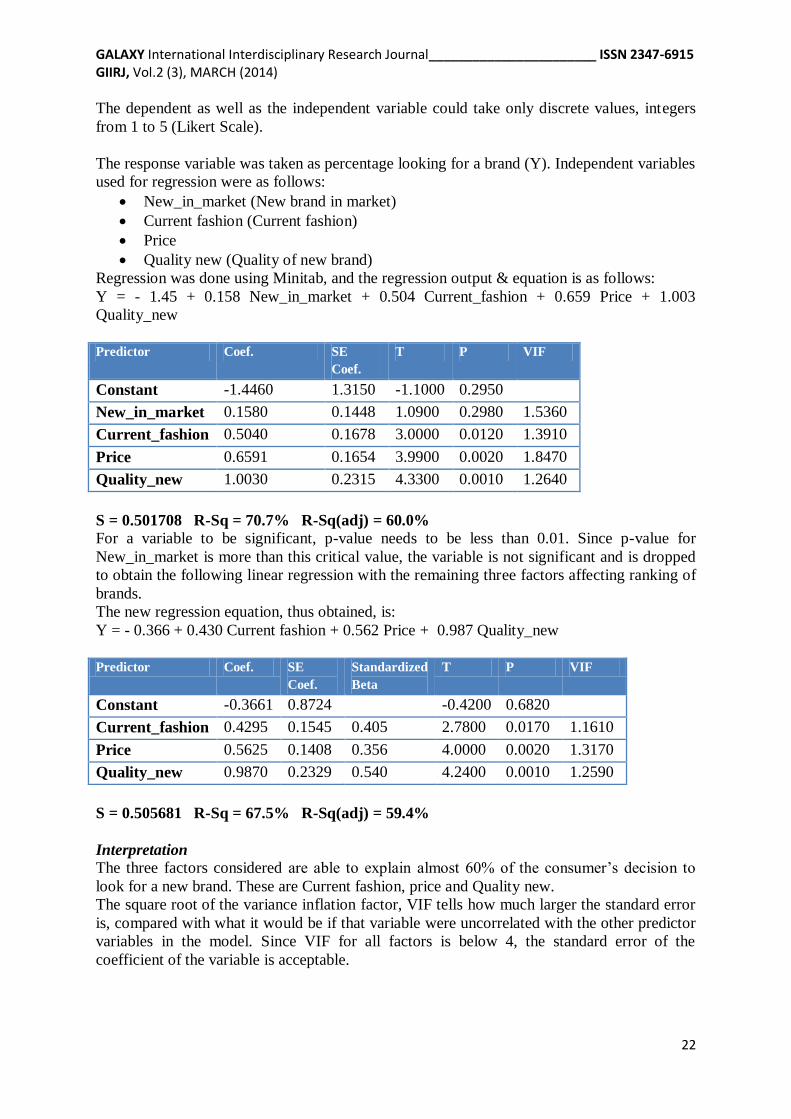
For additional features in a product, fairness and composition (herbal, natural, and
vitamins) were the highest on utility. Fragrance was considered to be of least utility among
the additional features considered.
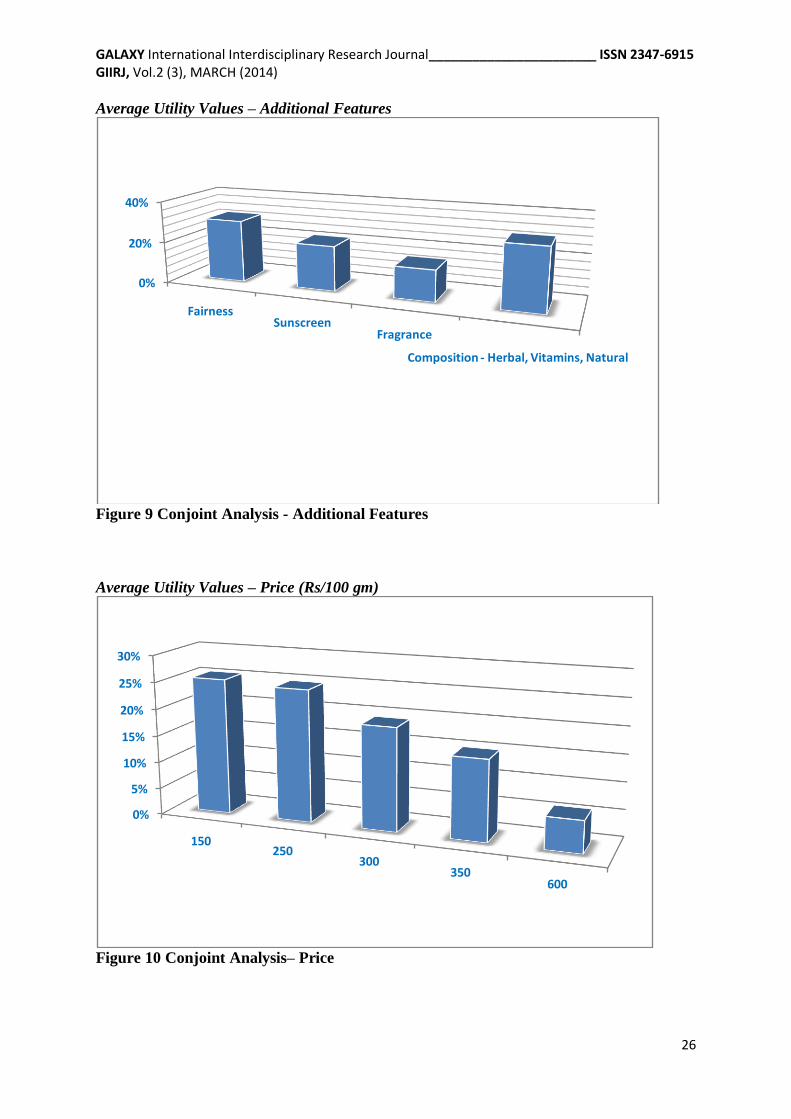
For packaging, as could be seen in the market and is possibly evident, the highest utility
packaging was from the plastic squeeze-out tube. Sachets with an 8% utility compared to
41% of plastic tube seemed to have negligible utility for the consumers.
For pricing, Rs. 150/100gm and Rs. 250/100gm priced products held equal utility. This
showed that the consumers are not very price-sensitive at lower prices. However, the utility
decreased from 25% to 6% as the price increased to Rs. 600. From the utility values, it may
be inferred that consumers would be less interested in buying a cream with higher price.
For SKU size, all 50gm, 80gm and 100gm held similar utility values. It indicated that
consumers do not perceive much difference when it comes to SKU sizes and are willing to
purchase fairness creams irrespective of the size they come in. However, very small size
SKUs like 25gms showed lower utility values.
Based on these utility values, product attributes‟ combination can be decided that would lead
to maximum utilization.
Findings & Conclusions
The growth in India has led to an increase in Indian consumerism. The gradual increase in the
purchasing power has opened up new opportunities for Indian retail to expand. The Indian
market is a great potential market for fairness cream with a growing young population,
looking to change lifestyles.
In context of this, it becomes extremely important for industries to understand the consumer
buying behaviour. The study was an attempt to understand consumer purchase decision
process for fairness cream. The following conclusions can be made from the analysis carried
out:
1. Fair & Lovely is ranked as the best brand.
2. Potential perceptual bias among the consumers: Brands which are ranked the highest for
one factor are also the highest preferred in terms of other factors.
3. The choice of a new brand gives maximum weightage to quality of new brand and current
fashion and lesser importance to current price.
4. Friends are the most influential factor when it comes to purchasing a brand of fairness
cream. Advertisements and word of mouth occupy the 2nd and 3rd places respectively,
with family and neighbors being the least influential factors.
5. Value of the branded fairness cream for the people is mostly „social acceptability‟ and the
„value for money‟. Respondents have given the least preference to „satisfaction‟ for the
value of the brand.
6. Fairness and recognition are the most important attributes for a fairness cream, the least
attractive being “packaging‟ and “trend”.
7. The best fairness cream to be in the market on the basis of utility: Olay‟sNatural Fairness
cream at a price of Rs. 250, packaged in a plastic tube of 100 gm.

GALAXY International Interdisciplinary Research Journal_______________________ ISSN 2347-6915 GIIRJ, Vol.2 (3), MARCH (2014)
29
Limitations
Time constraint: Due to the limited time available, in-depth end-to-end process was not
efficient. Data gathering and plan could not be well implemented, and most of the data
gathered was through convenient sampling.
Low response and sample population: Low response rate was observed when the survey
was floated. The limited sample responses collected may not present a fair representation of
the population at large.
Limited Segments of Population: As the females with less than 35 years of age were easily
accessible, who are also consumers of the fairness cream, the population never included male
population (that was initially intended), nor the older female population. Due to this, the
results of this report cannot be generalized for the entire customer base.
Bias: There is generally a bias in an individual‟s response; however the same is neutralized if
the sample population is large. As the survey was conducted on a limited population, the bias
may not be neutralized. Due to limited number of samples, validation was not possible. And,
hence the accuracy of the interpretations may not be accurate.
References
Consumer Behavior on Fairness Cream -
http://www.slideshare.net/soorajdms/consumer-behaviour-on-fairness-creams
RM Fairness Cream - http://www.scribd.com/doc/27599586/RM-Fairness-Cream
Product Market Analysis of Fairness Creams -
http://www.scribd.com/doc/34999913/Fairness-Cream
Fair war: A case study on fairness cream, By Dr. SangeetaMohanty, International
Journal of Contemporary Business Studies Vol: 3, No: 1. January, 2012 ISSN 2156-
7506
All‟s Fair in India‟s Cosmetics Market, Written by Lovejeet Alexander, Special
Correspondent.
The Cosmetic & Personal Care Sector in India Market Research 2008 – Italian Trade
Commission.


![Preference Elicitation [Conjoint Analysis]. Conjoint Analysis Market research: assess consumer’s preferences on homogenous class of products Approach:](https://img.pdfslide.net/doc/110x75/56649d1f5503460f949f25d8/preference-elicitation-conjoint-analysis-conjoint-analysis-market-research.jpg)