Embed Size (px)
Citation preview

A connectionist approach to processing dimensional interaction
ADRIAAN G TIJSSELING and MARK A GLUCK
Cognitive Neuroinformatics Group National Institute of AdvancedIndustrial Science and Technology AIST Tsukuba Central 2 1-1-1Umezono Tsukuba 305-8568 Japanemail adriaantijsselingaistgojp
Abstract The difference between integral and separable interaction of dimensionsis a classic problem in cognitive psychology (Garner 1970 American Psychologist 25350ndash358 Shepard 1964 Journal of Mathematical Psychology 1 54ndash87) and remainsan essential component of most current experimental and theoretical analyses ofcategory learning (eg Ashby and Maddox 1994 Journal of Mathematical Psychology38 423ndash466 Goldstone 1994 Journal of Experimental Psychology General 123178ndash200 Kruschke 1993 Connection Science 5 3ndash36 Melara et al 1993 Journal of Experimental Psychology Human Perception amp Performance 19 1082ndash1104Nosofsky 1992 Multidimensional Models of Perception and Cognition Hillsdale NJLawrence Erlbaum) So far the problem has been addressed through post hoc analysisin which empirical evidence of integral and separable processing is used to t humandata showing how the impact of a pair of dimensions interacting in an integral or aseparable manner enters into later learning processes In this paper we argue that a mechanistic connectionist explanation for variations in dimensional interactionscan provide a new perspective through exploration of how similarities between stimuliare transformed from physical to psychological space when learning to identifydiscriminate and categorize them We substantiate this claim by demonstrating howeven a standard backpropagation network combined with a simple image-processingGabor lter component provides limited but clear potential to process monochromaticstimuli that are composed of integral pairs of dimensions differently from mono-chromatic stimuli that are composed of separable pairs of dimensions Interestinglythe responses from Gabor lters are shown already to capture most of the dimensionalinteraction which in turn can be operated upon by the neural network during a given learning task In addition we introduce a basic attention mechanism to back-propagation that gives it the ability to attend selectively to relevant dimensions andillustrate how this serves the model in solving a ltration versus condensation task(Kruschke 1993 Connection Science 5 3ndash36) The model may serve as a starting pointin characterizing the general properties of the human perceptual system that causessome pairs of physical dimensions to be treated as integrally interacting and otherpairs as separable An improved understanding of these properties will aid studies inperceptual and category learning selective attention effects and inuences of highercognitive processes on initial perceptual representations
Keywords integral and separable dimensions connectionism Gabor lters
Connection Science Vol 14 No 1 2002 1ndash48
Connection Science ISSN 0954-0091 printISSN 1360-0494 online copy 2002 Taylor amp Francis Ltdhttpwwwtandfcoukjournals
DOI 1010800954009021013859 4
1 General introductionOne of the basic tasks humans have to do continuously is to sort things objects orevents into distinctive groups based on the similarities between the various instancesThis process of categorization involves finding or constructing the feature(s) thatdistinguish the members of each category Since these features may vary in severaldimensions a successful theory of categorization needs to explain how these differentdimensions interact Previous studies suggest that there are at least two different typesof interaction (Garner 1970) The interaction of a pair of dimensions can be integralmeaning that they are perceived holistically Goldstone (1999 2002) refers to theunderlying dimensions as being psychologically fused A standard example is thebrightness and saturation of a colour When one of these features changes the effectis perceived as a change in overall colour rather than as a change in one attribute of that colour More commonly a pair of dimensions is perceived analytically asseparable For example the size of a square and the brightness of its colour areseparable dimensions if the brightness is changed we do not normally perceive adifference in size
The problem of integrality versus separability has been an important aspect oftheories of categorization Researchers have been approaching the problem by testinghuman categorization performance (eg Garner and Felfoldy 1970) devisingstatistical models to t experimental data (eg Nosofsky 1986 Kruschke 1993) orapplying direct similarity scaling (eg Carroll and Arabie 1980) A typical experimentconsists of presenting stimuli that are composed of a pair of dimensions such asbrightness and saturation of a colour to human subjects with the instruction to sortthem identify them or discriminate between them The performance of the subjectsis analysed usually by measuring the amount of time it takes them to sort a set ofstimuli or by observing the errors in discrimination and identification A generalfinding is that performance significantly differs between integral and separabledimensional interaction (eg Garner and Felfoldy 1970)
An example of a statistical model is the Generalized Context Model (GCM)proposed by Nosofsky (1986) which uses psychological similarity ratings as inputAccording to the GCM a stimulus belongs to a category if the summed similarity ofthis stimulus to all stored category exemplars exceeds a certain probability estimateStimuli are represented as points in a multidimensional space with the similaritybetween any two stimulus representations described as a decreasing function of theirdistance in that space These interstimulus distances are derived from multidimen-sional scaling results from human subjectsrsquo similarity ratings of pairs of actual stimuli(see also Shepard 1987) The difference between integral and separable interaction isthen incorporated into how distances between stimulus representations are calculated
Although the above approaches to the problem of dimensional interaction haveproduced relevant data they remain descriptive and post hoc Models such as theGCM do not explain how stimulus representations are formed They are used to tbehavioural categorization data based on acquired human similarity ratings Thequestion remains What mechanism underlies the transformation from a raw stimulusto an internal representation and how does this transformation affect the interactionbetween dimensions After several decennia of analysis it is still not clear how andwhy integral pairs of dimensions are processed differently from separable pairs It might be the case that the behavioural data are simply insufficient to constrain or guide appropriate theories of dimensional interaction without the benefit ofcomputational modelling
A G Tijsseling and M A Gluck2
A different approach might be needed to nd an explanation for the differentialprocessing of integral and separable dimensions one that provides insights into themechanism involved in the differential impact of separable and integral interactionof dimensions on category learning Within this approach the focus would be onexploring how distances between stimuli are transformed from physical to psycho-logical space when learning to identify discriminate and categorize them In thispaper we provide theoretical arguments for our hypothesis that connectionist modelsare a possible candidate for a mechanism of differential processing of dimensionsAlthough connectionist models are not yet as powerful as human categorizers weshall show that combining a neural network with a suitable sensory-preprocessinginput layer will create a basic capacity to process differentially stimulus dimensionsAn analysis of the way these models categorize can in turn illuminate the way in whichit might be done in the human cognitive system and provide a new perspective on human subject data An advantage of a mechanistic approach to dimensionalinteraction is that it takes the same spatially organized stimuli that are presented tosubjects rather than ad hoc inputs
The idea of attaching a sensory preprocessing component in a connectionist model finds support in a movement within the cognitive sciences that emphasizes the important bidirectional relation between perception and cognition Goldstone(1998a) argues that perception contains an initial source of structured informationthat can be operated upon subsequently by higher cognitive processes (Tijsseling1998) yet these cognitive processes can in some cases also modify percepts (Goldstone1995 Goldstone et al 1997 Schyns et al 1998) In particular perceptual learning andcategorization are constrained by the existing structure of the sensorimotor apparatusof an organism These constraints allow for adaptation to the environment and serveas a starting point for the development of more sophisticated percepts because theydetermine what can and cannot be perceived and consequently learned (Grossberg1982 1987 Karmiloff-Smith 1992 Murre et al 1992 Goldstone 1998a)
Given this bootstrapping of perception by the sensorimotor system we shall argue that if the encoding of an input to a neural network is motivated by the wayhuman-like perception encodes the physical structure of the stimuli then the questionwhether the dimensions that compose the stimulus in question are interacting in an integral or separable manner can be determined without any ad hoc or post hoctting by an external observer The interaction between a pair of dimensions thatmake up a stimulus is not determined by the physical structure of the stimulus inquestion but is based on how the human perceptual system processes the physicalstimuli A Martian might have a different kind of perceptual apparatus and perceivethe same stimulus in a radically different way In other words the physical structureof the stimulus is the same but the way it is reconstructed within a cognitive systemor which aspects of information are extracted from it by the system might differ acrossspecies
The potential of connectionist models for explaining the differential processing ofintegral and separable dimensions is demonstrated in this paper by simulations witha backpropagation network combined with an image-ltering input layer composedof Gabor lters (Gabor 1946 Daugman 1988) Backpropagation networks have beenused extensively in categorization models (eg Kruschke 1993 Gluck and Myers 1993Cangelosi et al 2000) We are using backpropagation only as an illustration of ourtheoretical arguments showing how a simple neural network may already employ a crude mechanism for differential processing of dimensional interaction As a
Processing dimensional interaction 3
candidate for raw stimulus processing we have opted for a Gabor filter model ofsensory processing in the primary visual cortex (Marcelja 1980) By using bothbackpropagation and Gabor lters (hereafter simply referred to as the model) we tryto combine a mechanism for transforming a raw stimulus into a psychologicalrepresentation together with a feature ltering mechanism for category learning Forthe purpose of explanation we have tried to keep the model intelligible while stillgoing a long way toward explaining the basis of dimensional interaction
We shall begin by reviewing empirical evidence for a distinction between integraland separable pairs of dimensions and then we shall discuss how these two kinds of interaction can be interpreted in the context of physical versus psychological space For this we refer to a seminal paper by Shepard (1964) that deals with thetransformation of distances between stimuli from physical to psychological space and how multiple dimensions interact in similarity judgements We shall describe our demonstrative model and apply it to experimental studies concerning differ-ential processing of dimensions It will be shown that the modelrsquos performance isqualitatively similar to human subjects We shall explain how the model addressesthe problem of dimensional interaction and argue that this may suggest a generalunderlying mechanism in which distances between representations of stimuli in psy-chological space are derived from the corresponding physical distances In particularwe shall single out the crucial role Gabor lter encoding plays in the processing ofdimensional interaction Finally we shall discuss the lack of an attention mechanismin the model which prevents it from explicitly attending to one single separabledimension We offer a solution to this problem by injecting a crude selective attentionmechanism to the model based on previous work by Kruschke (1996) With anattention mechanism in place the model processes the paradigm task of condensationversus ltration in a manner qualitatively similar to human subjects
2 Integral versus separable dimensions and their relation to isosimilarity contours
In typical categorization studies stimuli are often employed that vary in severalcontinuous dimensions To complicate matters a subjectrsquos perception of how dimen-sions interact may vary for each different pair of dimensions At the one extreme wehave integral pairs of dimensions (Garner 1970) such as for example brightness andsaturation of a colour which tend to be holistically perceived Subjects who have toevaluate the brightness of a stimulus suffer interference (ie speed and accuracydeciencies) if saturation is varied at the same time (Torgerson 1958 Garner andFelfoldy 1970 Handel and Imai 1972) At the other extreme there are separable pairsof dimensions (Garner 1970) such as brightness and size subjects who have to focuson one of these two dimensions can do so even when the other irrelevant dimensionis varied (Attneave 1963 Handel and Imai 1972 Garner 1974 Gottwald and Garner1975) In short subjects can attend to each of the separable pair of dimensionsseparately while integral pairs of dimensions appear to be perceived as if they arelsquopsychologically fusedrsquo1 (Goldstone 2002) Integral and separable pairs of dimensionshave been found in the visual auditory and vibrotactile modalities (Garner 1970)Hence the distinction between integral and separable pairs of dimensions isfundamental for models of human categorization and continues to generate activeresearch interest (eg Melara et al 1993 Ashby and Maddox 1994)
More accurate judgements of the interaction between dimensions can be made
A G Tijsseling and M A Gluck4
using psychological distances Several studies have shown that there is a relationshipbetween the type of interaction between dimensions and the metric that ts thesepsychological distances Shepard (1964) focused on the question of how differencesin two dimensions combine psychologically into an assessment of the overall similaritybetween two stimuli This cannot be answered by just looking at the relation betweenthe physical stimuli themselves because psychological similarity is not just dependenton physical similarity For example in the case of colour the similarity between onegreen colour and another and between the same green colour and a blue one is verydifferent psychologically even though the physical distance between the wavelengthsmight be identical (Berlin and Kay 1969 Bornstein 1987) The only property thatseems to be invariant is that when two stimuli approach each other in physical spacethen their psychological representations will be more similar (Shepard 1964) In thisrespect the issue of assessing overall similarity is to nd the transformation that willconvert physical interstimulus distances into psychological distances between thecorresponding representations
Discovering this transformation is complicated when more than one dimension isinvolved because one can construct a separate psychological scale for each of theunderlying physical dimensions but this will not capture the similarity between twostimuli that vary on several dimensions In a one-dimensional case the similaritybetween any two points on the dimension is symmetrical but this symmetry is notpresent when stimuli vary in more dimensions Consider for example gure 1 whichshows a point S in a plane spanned by two dimensions A and B Given S we can createa series of stimuli on some imaginary straight line that passes S at a specied distancein physical space (for example stimuli D H and L as shown on the left-hand side ofthe gure) We assume that points D and L have the same amount of physical andpsychological similarity to S but each of which varies from S in just one dimension atsome distance respectively d(SD) and d(SL) Point H on the other hand also variesfrom S but along both dimensions and at a given distance of kd(SD) + kd(SL) Wecannot tell how large this factor k must be in order for the psychological similaritybetween S cent and H cent to be the same as the similarity between S cent and either Dcent or L cent thisremains a function of how the two dimensions A and B interact
Shepard (1964 56) argues that knowing the rules that produce an overall similaritybetween stimuli that vary in more than one dimension is equivalent to nding thecharacteristics of the corresponding isosimilarity contour which is defined as lsquotheshape of the locus of all stimuli that have any prescribed degree of similarity to anyprescribed standard stimulusrsquo For example what are all the stimuli that have thesame xed similarity to S in gure 1 In other words if we know all the stimuli withthe same given amount of similarity to S then what shape or locus would these stimuliform The form of this shape is strongly related to the kind of interaction between thetwo dimensions that make up the physical space
According to Shepard (1964) determining the shape of the isosimilarity contouris equivalent to determining the form of that particular Minkowski metric that seemsto be appropriate for the psychological space Minkowski metrics are dened as
in which d(ij) is the distance between stimuli i and j xik is the location of the stimulus
Processing dimensional interaction 5
d i j x x rik jkr
k
n r
( ) = -aelig
egraveccedilccedil
ouml
oslashdividedivide sup3
=aring
1
1
1
i on the kth dimension n is the number of dimensions and r is the Minkowski para-meter A value of 1 for r corresponds to the city-block metric and a value of 2 denotesthe Euclidean metric Metrics also obey the following principles the triangle inequality(dij pound dih + dhj for those stimuli i j and h where h lies between i and j on a shortestconnecting path) positivity (dij gt dii = 0 for i THORN j) and symmetry (dij = dji) Based onthese metrics one can produce several possible isosimilarity shapes
Figure 1 shows that the curve consisting of all stimuli with a specic amount ofsimilarity to S can have different shapes depending on the nature of interactionbetween the constituent dimensions A and B All of these curves form continuous
A G Tijsseling and M A Gluck6
Figure 1 Possible transformations from physical space to psychological space The gure onthe left-hand side displays physical stimuli that vary in two dimensions A and B S is a prescribedstimulus and D H and L are stimuli that lie on an imaginary straight line passing S at a givendistance If stimuli D and L have the same similarity to S it does not provide any informationon the similarity of H Based on how the dimensions A and B interact three resultingisosimilarity contours are shown on the right-hand side Euclidean city-block or concave Scent
D cent H cent and L cent are the psychological space representations of the corresponding stimuli
centrally symmetric closed curves as they rotate around S Based on subjectsrsquojudgements of the similarities of these stimuli to S one can construct the isosimilaritycontour for the corresponding psychological space and consequently infer the natureof interaction between the dimensions A and B
If subjects judge H to be more similar to S than D and L are (gure 1 top) thenthe isosimilarity contour is elliptical with the latter two stimuli falling outside thecontour for H In this case the psychological space conforms to a Euclidean metric(Hyman and Well 1967) and the dimensions A and B can be considered to interact inan integral manner (Lockhead 1972 Garner 1974) Stimuli composed of an integralpair of dimensions are initially perceived holistically which means that the individualdimensions constituting the stimuli are in effect not perceived Note that in the casethat r is equal to 2 rotation of the dimensional axes A and B as a consequence doesnot change the psychological space
On the other hand if subjects judge that D H L are equally similar to S (gure 1middle) then the isosimilarity contour is a straight line and we can conclude that thepsychological space obeys a city-block metric which in turn implies that the pair ofdimensions A and B is separable In this case the dimensional axes cannot be rotatedbecause each dimension can be attended to separately and a rotation would signi-cantly disturb the similarity space of the stimuli
As mentioned earlier there are also cases in which the pattern of interaction doesnot seem to match either integrality or separability but rather lie in between these twoendpoints (Pomerantz and Garner 1973) For these interactions the appropriateMinkowski metric would be dened by an r between 1 and 2 (For a discussion wherer approaches innity see Johannesson (2001)) It is also possible that subjects judgeH to be less similar to S than D and L are (gure 1 bottom) This indicates that theisosimilarity contour is concave which in turn informs us that there is no metricrepresentation of the similarity space because concave contours violate the triangleinequality rule for metrics
Given the different metrics depending on the perceptual distinctiveness of thedimensions of the stimulus Shepard (1964 59) argues the necessity of a lsquomorethorough investigation into the relations of similarity among a set of stimuli that differin a small number of perceptually distinct and salient dimensionsrsquo In the next sectionwe shall describe the stimuli used in Shepardrsquos experiment (1964) and a correspondingexperiment Based on this a series of simulations will be described The main reasonfor using data from Shepard (1964) is that Shepard used a well-dened set of stimuliorganized in a well-defined two-dimensional stimulus space In this set of stimuliadjacent pairs are physically equally distant from each other so we can make validinferences about possible isosimilarity contours In addition the analyses Shepardprovided for the human subject data are extensive and thorough which makes it mucheasier to compare with and relate to simulation results To our knowledge there areno new data superseding or refuting Shepardrsquos seminal work
3 Description of an experiment from Shepard (1964)Shepardrsquos experiment measured the number of confusions made by subjects whenlearning to respond with a unique identifying label for each stimulus object Thismethod would possibly resolve the question of whether the isosimilarity contour ofthe psychological space is concave and as a consequence whether there is a metricrepresentation of psychological space The stimuli used by Shepard (1964) in his
Processing dimensional interaction 7
experiments were all circles containing a radial line Series of stimuli could vary in thesize of the circle the angle (tilt) of the radial line or both The experiment describedbelow is the final experiment described in Shepardrsquos paper all details regardingexperimental set-up and procedure can be found in Shepard (1964)
Eight stimuli were constructed with reference to a prescribed stimulus S which is a circle with a diameter of 1905 cm containing a radial line at an angle of 450deg The location of these stimuli in physical space formed the corners of an imaginaryoctagon as shown in gure 2 The horizontal axis corresponds to the diameter of thecircle (size) and the vertical axis corresponds to the tilt of the radial line Sheparddesigned the training stimuli in such a way that each adjacent pair of stimuli varied ineither one or both dimensions For example stimuli 8 and 1 varied in the dimensionof diameter (2299 cm versus 2875 cm) but had the same angle (80deg) On the otherhand stimuli 1 and 2 varied in both dimensions of size and tilt This alternating pattern of one-dimensional variance and two-dimensional variance in an octagonalconguration has been shown to be effective for discriminating between elliptical andfour-cornered isosimilarity contours and therefore reliably indicates whether the pairof dimensions that dene the stimuli is either integral or separable (Shepard 1964)
The task of subjects in this experiment was to identify each of the eight stimuliusing a paired-associate method of correction with a unique letter but they never sawthe reference stimulus S itself The errors subjects made during identication wereused to calculate a confusion score We focus on adjacent pairwise confusions (ie thenumber of times subjects identied a stimulus as its neighbour for example when 1is identied as 2 in gure 2) as these were shown to be the signicant data (Shepard1964) It can be hypothesized that the amount of confusion for stimuli varying in bothdimensions should be signicantly different from the amount of confusion for stimulivarying in one dimension only as previously illustrated with gure 1
In figure 3 the graph of the errors made during identification learning (lsquocon-fusionsrsquo) averaged over 200 stimulus presentations and 20 subjects is recreated from Shepard (1964) The points in the graph correspond to the average number ofconfusions for the eight pairs of adjacent stimuli with the mean number of confusionsmarked by the horizontal dashed line The curve shows that subjects tend to confuseadjacent pairs of stimuli that differ in one dimension more often than those stimulithat vary in both dimensions In particular this curve shows an alternating repetitionof high confusion for stimuli varying in one dimension and low confusion for stimulivarying in both dimensions an alternation that seems to go through four completecycles (of one u and one e ) This is a strong indication that the dimensions areinteracting in a separable manner because as we argued an integral pair of dimensionswould be processed holistically and therefore would not produce this pattern ofresults The alternating character of single dimension variation versus two-dimensionvariation moreover suggests that the psychological representation of similarities to Sdoes not match an elliptical isosimilarity contour because the two dimensions thatmade up the stimuli appear to have an additive character stimuli that varied in bothdimensions proved to be easier to identify since subjects were able to use informationfrom both single dimensions
In addition gure 3 shows another remarkable feature With each pair of adjacentpositions around the octagon (starting at the 2ndash3 pairwise similarity comparison) thenumber of confusions seems to increase for stimuli that vary in a single dimension anddecrease for stimuli that vary in both dimensions in a linear fashion This observationis not mentioned in Shepard (1964) but we feel that this may reveal additional
A G Tijsseling and M A Gluck8
properties of the underlying psychological space Since subjects did not have to ratethe similarity between the stimuli and the standard stimulus S there is no possibilityof determining psychological distances to S from these experimental data Usingneural network simulations however we might be able to combine evidence to inferthe nature of the psychological space and suggest explanations for the observed linearchange in error possibly by exploring the warping of internal representations duringlearning (Tijsseling and Harnad 1997) In the next section we shall describe thedemonstration model and the simulations
4 Description of the demonstrative modelThe model consists of a neural network combined with a Gabor filter input layer(gure 4) We used standard backpropagation with units in the range [00 10] sigmoidactivation rules and a mean-squared error rule The network is set up to accommodateShepardrsquos experiment in which subjects had to identify stimuli by a unique letter Thenetwork had to produce an identifying response as well ie there was a unique outputunit which was to become active for each individual stimulus object For examplestimulus 1 would produce an output vector of lt10000000gt and stimulus 2 wouldproduce lt01000000gt etc We shall refer to this procedure as lsquoidenticationrsquo and
Processing dimensional interaction 9
Figure 2 The stimuli in the second experiment were constructed in such a way that theirphysical similarity to the given standard stimulus S forms an octagon of which S is the centreThe horizontal axis displays the diameter of the circle and the vertical axis displays the tilt of
its radial line (After Shepard 1964)
we intend to embody two crucial processes of category learning using this method(Gluck and Myers 1993 Myers and Gluck 1994) rst stimuli that lead to differentresponses are separated through predictive differentiation and second stimulusfeatures that tend to co-occur are grouped through redundancy compression
Images of experimental stimuli are processed by several Gabor lters each tunedto a specic orientation (Gabor 1946 Daugman 1988) Gabor lters have been usedsuccessfully for simulations of human face recognition (Padgett and Cottrell 1998Kalocsai et al 1998) other pattern recognition behaviours (Buse et al 1996) and alsocategorical perception (Goldstone et al 1996) They are a simplied approximationof human visual processing of non-moving monochromatic sensory stimuli Theselters are similar in shape to the receptive elds of simple cells in the primary visualcortex (V1) which are restricted to small regions of space and are highly structured(Marcelja 1980) Several researchers have described these cells as edge detectors(Hubel and Wiesel 1962 1965) but their responses can be more accurately describedas local measurements of frequencies (Jones and Palmer 1987) Appendix A providesa mathematical description of a Gabor lter and how it has been used in the model topreprocess a monochromatic image The responses of one or more Gabor filters
A G Tijsseling and M A Gluck10
Figure 3 Frequencies with which pairs of adjacent stimuli were confused after learning Theicons on top of the gure correspond to the octagonal conguration of the stimuli as shown ingure 1 The bold line in each icon indicate which pair of adjacent stimuli from the octagonalconguration corresponds to the amount of confusion shown In addition confusion scoresfrom stimuli varying in one dimension are marked with a square whereas confusions fromstimuli varying in both dimensions are marked with a diamond Finally the error bars indicate
the variance over the number of subjects (Figure recreated from Shepard 1964)
centred at the full image measure frequencies at various locations of the image Gaborlters therefore reect the physical properties of the stimulus as well as the similaritygradient between stimuli (Goldstone et al 1996 Tijsseling and Harnad 1997) Theencoding process constructs a representation of the stimulus by reproducing theintrinsic structure of the stimulus space in a rough approximation of the early stagesof human vision
The responses from the Gabor lters are propagated to the backpropagation identi-cation network which has to map the sensory representation to a localist encodingof its symbolic label Stimuli were presented in permuted order The architecture ofthe network conformed to an IndashHndashO hierarchical feedforward structure in which thesize of the input layer I was equal to the length of the normalized responses of theGabor lters used to process the image (ranging from eight to 72 see Appendix A)
Processing dimensional interaction 11
Raw stimulus image
Gabor filter input layer
Ofrac14 1 3 5frac14 9Ofrac14 4 5 frac14
Identification network
Figure 4 The simple model of dimensional processing and identication and category learningused in this paper A raw stimulus image is rst presented to a Gabor lter layer This consistsof a set of Gabor lters that are tuned to specic orientations The responses from this Gaborlter layer are presented as inputs to a backpropagation identication network for redundancy
compression and predictive differentiation
the size of the output layer O was equal to the number of stimuli and the size of the single hidden layer H was initially set at three unless mentioned otherwise The performance for more hidden units was not statistically different Laakso andCottrell (1998) show that networks with different numbers of hidden units all achieveessentially identical representational structures given a common stimulus domain Inaddition using three units greatly facilitates analysis of the hidden unit space whichbenets the purpose of this demonstrative connectionist model In most connectionistapproaches the hidden representation is seen as corresponding to psychologicalspace In our case we also used hidden unit activations for analyses
5 Simulations of the experiment from Shepard (1964)In order to nd out whether the results of the combined model are specic to thestimuli employed by Shepard or whether they exhibit some general property of ourmodel we also trained it on three other sets of stimuli shown in gure 5 These stimuliwere composed of a separable pair of dimensions of height of a rectangle and positionof an embedded vertical line (Kruschke 1993 figure 5(B)) an integral pair ofdimensions of height and width of a rectangle (Monahan and Lockhead 1977 gure5(C)) and an integral pair of dimensions of the length of two parallel vertical lines(Monahan and Lockhead 1977 gure 5(D)) The physical specications of the stimuliare based on those described in the corresponding papers but we picked the stimuliin such a way that they formed an octagonal conguration similar to the congurationof the stimuli of gure 1 The stimuli from Kruschke (1993) were already in octagonal
A G Tijsseling and M A Gluck12
Figure 5 On the left-hand side the four stimulus sets are shown constructed in such a way thattheir physical similarity to a given standard stimulus S forms an octagon (A) The stimuli usedby Shepard (B) Stimuli composed of the separable pair of dimensions of height of a rectangleand the position of an embedded vertical line (Kruschke 1993) The stimuli in (C) and (D) arederived from Monahan and Lockhead (1977) and have integral interacting dimensions widthand height of a rectangle and the length of two parallel vertical lines respectively On the right-hand side the organization of the eight stimuli in psychological space of the model is shown(explained in the text) The dimensions of (A) and (B) interact separably those of (C) and (D)integrally The network graphs are obtained from distances between representations in
activation space from simulations with two hidden unit networks
(A)
continued
Processing dimensional interaction 13
(B)
(C)
(D)
conguration and have been kept exactly the same for comparison purposes and alsowith reference to the ltrationcondensation task described in a later section
These various sets of stimuli will provide us with a view of the kinds of repre-sentationsmdashand corresponding psychological spacesmdashthat the network can formThe model is hypothesized to process differentially the various kinds of interactionbetween dimensions Hence the stimuli composed of a separable pair of dimensionsas determined by human performance should lead to a similar distribution of inter-stimulus distances as for the Shepard stimuli but the stimuli with integral pairs ofdimensions should result in a different kind of distribution
The raw stimulus image is first processed by the Gabor filter component of the model and the normalized responses from the Gabor filters are presented to the backpropagation network (Appendix A) Five repetitions were done each with a different set of uniformly distributed random initial weights from the range [00 10] The learning rate b of the backpropagation network was set to 07 and themomentum a was held at 00 We chose these values as they force the network tolearn at a relatively slow rate which helps it to nd the best solution to the task Othercombination of learning rate values (we did tests with values from 01 to 08 for thelearning rate and 00 to 04 for the momentum in steps of 01) did not signicantlychange the results but did lead to two networks that had a higher mean-squared error(MSE) because they ended up in a local minimum On average a low MSE wasreached after about 1000 epochs (one epoch is one presentation of the entire stimulusset) but to get an accurate view of the organization of representations in hidden unitspace we overtrained the network until 10 000 epochs were completed after which theMSE was below a criterion of 001 The number of epochs used is not psychologicallyplausible but our purpose with this model is qualitative analysis not quantitativeanalysis
We ran one additional simulation to show the signicance of applying a Gaborlter encoding that preserves the physical properties of stimuli and mimics humanperceptual processes In this simulation stimuli were ad hoc encoded by using valuesthat describe the magnitude of size and tilt of the circle (for example 80deg would be08 and size 3251 cm simply converts to 003251) because one might argue that it isalso possible to just represent the stimuli by their absolute size and tilt valuesHowever we shall show that the transformation of physical to psychological space isa relevant factor in the differential processing of dimensional interaction The modelhas to remain close to what subjects perceive and just as humans do it has to extractactively the features from a visual representation of the stimuli preserving thesimilarity gradient over stimuli Dimensional interaction might be embedded in howphysical stimuli are processed by a perceptual system which means that ad hocencoding the stimulus structure to a two-element input vector with values for size andtilt might very well change the nature of the underlying dimensions and trivializesimulation results because they bypass the effects the processing by the perceptualsystem has on the psychological space In fact we shall show that the Gabor ltercomponent has already captured most of the dimensional interaction
Finally we assume that there is a direct negative correlation between the identi-cation error (number of confusions) exhibited by the human subjects and the distancebetween the representations in hidden unit space That is if the distance between tworepresentations increases then the probability they will be confused with each otherdecreases Therefore we calculated the distances between representations in thenetworkrsquos hidden unit activation space as a measure of comparison with the average
A G Tijsseling and M A Gluck14
mean number of confusions from Shepardrsquos data2 The results of the simulations using the separable stimuli the integral stimuli and the direct encoding are shown ingure 6 in which error bars denote the minimum and maximum distances betweenrepresentations in hidden unit activation space over the ve networks trained on eachstimulus set
Both graphs for the separable pairs of dimensions show a high confusion score forstimuli that vary in one dimension combined with a low confusion score for stimulivarying in both dimensions Comparing the pairwise distances between the represen-tations of the network with a set of carefully recovered values from the confusion dataof Shepardrsquos experiment for pairs of adjacent stimuli produces a signicant Pearson
Processing dimensional interaction 15
Figure 6 Distances between the representations for adjacent pairs of stimuli after training themodel on stimuli composed of the pair of dimensions (A) size of circle and tilt of its radial line(B) height of a rectangle and position of embedded vertical line (C) height and width of arectangle (D) length of two parallel vertical lines and (E) arbitrarily encoded stimuli Thedimensions of (A) and (B) interact separably those of (C) and (D) integrally The values on
the vertical axis are plotted in reverse order to ease comparison with gure 1
continued
A G Tijsseling and M A Gluck16
correlation coefcient of r = ndash085 It is negative since the values of the network areinterstimulus distances and we postulated that distance and confusion are negativelycorrelated
A two-way analysis of variance (ANOVA) was calculated on the distances betweenhidden unit representations over simulations and stimulus sets which showed asignicant effect of one-dimensional changes versus two-dimensional change F(1150)= 66 p lt 001 r = 021 and of integral versus separable pairs of dimensions (A and B versus C and D) F(1150) = 174 p lt 0001 r = 032 We excluded data from gure6(E) from the analysis since it is based on a different encoding scheme A Pearsoncorrelation analysis of hidden unit activation levels for each of the ve different runsfor each stimulus set separately showed a signicant value of r gt 085 meaning thatover ve runs the network has found a similar solution to the problem domain ierelative distances between stimulus representations are highly similar
Shepard (1964) argued that the four-cycle pattern of high one-dimensionalconfusion and low two-dimensional confusion which has been observed in gure 6(AB) as well as in the human data cannot be explained with a Euclidean metric Rathera four-cornered isosimilarity contour is deemed more appropriate In both casesmdashhuman and networkmdashthose stimuli that vary in only one dimension seem overallto be more difcult to separate than stimuli that vary in size and tilt The dimensionsof size and tilt must therefore be separable A different picture is visible in gure 6(CD) which contains the pairwise distances between representations of stimuli con-structed from an integral pair of dimensions In this case there is no four-cycle patternseparating two-dimensional variation from one-dimensional variation Instead thereis a two-cycle pattern which matches an underlying elliptic contour This contour iselongated with the endpoints corresponding to the two largest distances Evidence fora difference between one-dimensional and two-dimensional variation is not availablebecause there is no consistent alternation of distances for these variations that matcheswhat has been observed with separable pairs of dimensions What seems to havehappened is that the integral pair of dimensions is processed holistically with thepsychological dimensions out of alignment with the physical dimensions a variationin one physical dimension will psychologically lead to a variation along both psy-chological dimensions
There is however an artifact in Kruschkersquos stimuli Scaling the two physicaldimensions should not consistently place the diagonal pairs further apart in Euclideandistance in the scaled space than the aligned pairs If we scale the rectangle height byeither 23 or 32 then the distances between adjacent pairs of stimuli (starting with 2ndash3diagonal pairs in cursive) change as shown in table 1
When scaling with 23 the adjacent pairs 2ndash3 and 6ndash7 move closer together thanthe diagonal pairs 3ndash4 and 5ndash6 This is not uniform since the diagonal pairs are actuallymoving closer with respect to 4ndash5 and 8ndash1 Scaling with 32 shows the reverse patternGiven this artifact it may not be reliable to use four-cycle oscillation as evidence for
Processing dimensional interaction 17
Table 1 Changes in interstimulus distances after scaling
Pairs 2ndash3 3ndash4 4ndash5 5ndash6 6ndash7 7ndash8 8ndash1 1ndash2
23 ndash015 ndash01 00 ndash01 ndash015 ndash013 00 ndash013
32 +022 +017 00 +017 +022 +022 00 +022
separable dimensional interaction although an analysis of the topography of internalrepresentation space of the model can reveal the separateness of dimensions
An effect similar to integral interaction can be observed in the results from the simulations with the direct encoding (figure 6(E)) This can be explained byconsidering the properties of backpropagation which are directed to extract a set of optimal representations from the stimulus space that compresses all redundantinformation and highlights information with important consequences The task of thenetwork is to produce efcient and informative stimulus representations and as suchit is biased to build the representation that most accurately reects the correlationsbetween stimuli and responses In generating a set of representations no restrictionsare placed on the network that preclude rotating the psychological space This seemsto have occurred with the directly encoded stimuli suggesting that the performanceof the model resembles those of human subjects confronted with stimuli constructedfrom integral dimensions With the inclusion of a Gabor lter input layer howeveran additional set of restrictions has been placed on the network that prevents it fromimposing a new dimension on the stimuli and instead forces it to use the extrainformation embedded in the encoded stimuli Because we have direct access to thenetworkrsquos interstimulus distances we can observe if the obtained data provideinformation about the isosimilarity contour of the standard stimulus S The right-handsides of gure 5 show for each set of stimuli the locus formed by the representationsof the eight stimuli obtained from simulations with only two hidden unitsmdashalthoughthis made the task more difcult for the network providing a success ratio of just10 To obtain these distances we determined the networkrsquos representation forstimulus S (by presenting a trained network with the given stimulus) and calculatedthe distances between S and the other stimuli in addition to the already availablepairwise distances between the trained stimuli We veried the distances obtainedwith two hidden units for similarity with the above data for three hidden unitsCorrelation analysis between distances for two hidden versus three hidden unitsproved signicant (r gt 085) plotting these distances for the Shepard stimuli shows a similar shape but uniformly reduced in magnitude due to the constricted activationspace (figure 7) The training with one fewer hidden unit in effect implementsdimensionality reduction since the network is forced to use the largest variances tomap input to output (see also Bishop 1995) Although the interstimulus distances for the two hidden unit networks are scaled with respect to three hidden unit networksthe approximation of the psychological space is accurate given the signicant corre-lation
It can be observed that the psychological space of the network has been warpedrelative to the physical stimulus space For the separable pairs of dimensions (gure6(A B)) we observe that representations of stimuli which vary in only one dimensionhave moved closer together in psychological space and that representations of stimulivarying in both dimensions have separated In both cases the psychological spaceseems to be a warped representation of physical space although the relative positionsof the stimuli are preservedmdashthe clockwise ordering of the eight stimuli persists inpsychological spacemdashthe distances between the representations have been altered asa result of learning Critically if we align only the primary and secondary axes of thecontours with the psychological dimension axes it directly shows that for the separabledimensions changes involving a single physical dimension produce changes alongone psychological dimension The magnitude of such changes in psychological spaceremains relatively independent of other physical feature values
A G Tijsseling and M A Gluck18
This warping of the physical configuration of stimuli is different for dimen-sions that interact in an integral manner as shown in gure 5(C D) Alignment withpsychological dimensions shows changes in one physical dimension affecting bothpsychological dimensions There is also a difference in the two ellipses of both integralpairs of dimensions exhibited by the direction of the primary axis of the ellipse Thenature and direction of this axis probably reects the salience of one psychologicaldimension over the other This salience may be verbalized in the case of the integralpair of height and width of a rectangle as the salience of a dimension correspondingwith the area of a rectangle
The differences between integral and separable interaction between dimensionscan be further revealed by running a hierarchical clustering algorithm (Johnson 1967Hanson and Burr 1990) which we can use to see whether the distances between hiddenunit activations contain information about the similarity structure of the representedstimulus space Figure 8 displays the dendrograms for the hidden unit representationsof the stimuli of gure 5(B C) The similarity structure revealed in these trees indicatesa remarkable difference between the two dimensional interactions The clustering forthe Kruschke stimuli show two main clusters that correspond to distances betweenrepresentations of those stimuli that vary in one dimension (1 + 8 and 4 + 5) versusdistances for stimuli that vary in both dimensions (2 + 3 and 6 + 7) These clusters arefurther subdivided into the adjacent pairwise distances For the stimuli built fromintegrally interacting dimensions no such clustering is observable Instead the twomain clusters separate the representations of the first three stimuli from the restregardless of one-dimensional or two-dimensional variation This clustering indicatesthat the psychological dimensions are out of alignment with the physical dimensions
There are at least three factors that cause warping of psychological space Firstattention effects can help the subjects focus on one or more relevant dimensions
Processing dimensional interaction 19
Figure 7 Interstimulus distances of hidden unit representations of adjacent pairs of Shepardstimuli for networks with two (dashed line) versus three (continuous line) hidden units Theshape of both lines is similar to the magnitude of distances for two hidden units uniformly lower
than those for three hidden units (cf Kruschke (1993))
(Goldstone 1998a) We shall visit the issue of attention in a later section Secondthere is the nature of interaction between the dimensions that compose the stimulias shown with the above simulation The differences in confusion scores based onvariations in either one or in both dimensions only occur with separable dimensionssince an integral pair of dimensions is perceived holistically and as such a variationin one physical dimension reduces to a variation in both psychological dimensions Inthe case of a separable interaction being able to attend to one dimension over theother might warp the psychological space even more increasing distances betweenstimuli that vary in the dimension that receives attention (Nosofsky 1986)
Finally one dimension can also be more salient than another one which means that differences in this dimension are easier to discriminate than differences in theother one In Tijsseling et al (2002) both human subjects and neural nets trained todiscriminate and categorize imaginary animals which varied in the dimensions oftorso radius and limb length showed a preference for using limb differences overtorso radius differences A similar effect can be observed here If we sum the averageof opposite difference scores for all simulations of the Shepard stimuli ie stimuli 5with 8 and 1 with 4 (variations between them are variations in a single dimension ofsize) as well as the distances from 2 to 7 and 3 to 6 (which varied in tilt only) then thetilt dimension provides the largest interstimulus distances (see gure 9)
In Shepard (1964) a similar analysis was performed which showed that the amountof confusion for stimuli varying in the tilt dimension is likewise lower than for stimulivarying in the diameter dimension We cannot say for certain if the salience of the tilt dimension is an intrinsic characteristic of human visual perception or a side effectof the way the stimuli are created Since Gabor lters are based on processing angledifferences this effect can be argued to be an artifact However the similarity of Gabor filters to simple cells in the primary visual cortex (Marcelja 1980 Jones and Palmer 1987) may be an indication that the same cause underlies human subject data In the next section we shall show that this observation matches anasymmetric interaction between the dimensions of size and tilt as reported in Potts et al (1998)
We have shown that a basic connectionist model contains a potential for a simplemechanism that differentially processes integral from separable interaction between
A G Tijsseling and M A Gluck20
Figure 8 Hierarchical clustering tree diagrams for the hidden unit representations of the stimuliof gure 5(B) (left) and those of gure 5(C) (right) Whereas the former indicates clusteringcorresponding to one-dimensional versus two-dimensional variation of the physical stimuli
the latter diagram reveals lack of sensitivity to such dimensional variation
dimensions But why does this work The Gabor lter component measures certainlocal frequencies of the stimulus and the output of this component provides a stimulusencoding that reects the physical properties of the stimulus It also preserves thesimilarity gradient between stimuli because the encodings are not orthogonal ratherthey reect changes in orientation location and angle between the various stimuli(Goldstone et al 1996) Figure 10 captures this similarity gradient It is an illustrationof how for the stimuli that vary in separable dimensions of size and tilt and for thestimuli that vary in integral dimensions of height and width of a rectangle the Gaborlter model processes the physical information and produces an output that shows therelational changes between the stimuli For example figure 10(A) shows how theresponse for an angle orientation of 90deg gradually increases from stimulus 1 to 4 andthen gradually decreases again Based on this orientation information stimulus 1would be more similar to stimulus 2 than to stimulus 3
The relevance of preserving the similarity gradient has been shown by Harnad et al (1995) and Tijsseling and Harnad (1997) Using a backpropagation networkthey showed that stimulus encodings that preserve the similarity gradient (also callediconicity) are a necessary property of categorical perception models (Harnad 1987a)It is however not enough just to encode the similarity gradient of any set of stimulisince this fails to capture the differences between sets of stimuli that have a com-parable similarity gradient but a different physical structure Three line segments of3 4 and 5 cm can be encoded in a way that captures their iconicity by using a ther-mometer coding converting the stimuli to three eight-bit vectors 11100000 1111000011111000 This encoding captures the fact that a line segment 3 cm long is more similarto that which is 4 cm long than to a line 5 cm long but it does not reect the physicalstructure of the set characterized by the relative position and angle of the lines
To explore further the relative contribution of the Gabor filter we performedmultidimensional scaling of the Gabor lter responses The results are displayed infigure 11 and show that the Gabor space topography has captured the relativesimilarities between the stimuli Stimuli with a separable pair of dimensions areobserved to be closer in Gabor space if they differ in only one dimension (gure 11(AB)) This is not as strong with integral pairs of dimensions (gure 11(D)) or evenabsent (figure 11(C)) This suggests that the perceived integration or separation
Processing dimensional interaction 21
Figure 9 Sum of diametrically opposed difference scores of the network in identifying Shepardstimuli which shows that the tilt dimension seems to be more salient Error bars indicate
minimum and maximum over ve simulations (cf Kruschke (1993))
A G Tijsseling and M A Gluck22
Figure 10 Three-dimensional display of the Gabor responses at eight orientations for a spatialfrequency of 35 and at the centre of the image for the stimuli with (A) separable dimensions
of size and tilt and (B) integral dimensions of height and width of a rectangle
of stimulus dimensions may be primarily a natural result of Gabor-like sensoryprocessing in the primary visual cortex (Marcelja 1980)
The richness of information that Gabor lter processing of the stimuli producesindicates that basic properties of the visual system (in this case modelled with crudeGabor lters) may already capture most of the relevant differences between integraland separable interaction between dimensions It is a widely held view (Gibson 1991Goldstone 1998a) that dimensional integration in perception naturally precedes thelearning of labels for stimuli Indeed dimensional integration effects arise early inperceptual processing before substantial cognitive experience with stimuli is built upa view consistent with development of perceptual learning in children (Kemler andSmith 1978 Smith and Kemler 1978) and effects of expertise with stimuli (Burns andShepp 1988)
Given the topography of the sensory information provided by Gabor lters the roleof the identication network is to reduce identication discrimination and catego-rization error by applying redundancy compression and predictive differentiation onthe responses of the Gabor lter component (Gluck and Myers 1993) The preservedsimilarity gradient provides the model with sufcient information to enhance relevant
Processing dimensional interaction 23
Figure 11 Multidimensional scaling of the Gabor space topography for the four stimulus sets
features and suppress irrelevant information This process of compression anddifferentiation causes the observed warping of internal representations Although theGabor lter component captures dimensional interaction it may not be sufcient toproduce correct identication of stimuli The effect of warping may be an explanationfor the linear change in confusion scores with every other adjacent pair of stimulishown in figure 3 The identification learning process by the human subjects may have separated representations further in order to reduce potential identificationmistakes
A Gabor lter as a crude sensory processing component in combination with abackpropagation network for redundancy compression and predictive differentiationprovides a mechanism that is basic and simplified but powerful enough not onlydifferentially to process the interaction between dimensions but also to use thisperceptual information for cognitive processes of identication discrimination andcategorization In the next section the model is applied to Garner classication tasksto explore further the capacities of the model in explaining dimensional interactionand its possible implications
6 Applying the model to Garner classication tasks61 Introduction to Garner classication tasksWe have shown that the Shepard paradigm which consists of identifying stimuli thatare organized in an octagonal conguration provides a method for determining theinteraction between the two dimensions that make up these stimuli The distributionin psychological space of representations of stimuli composed of a separable pair ofdimensions retained the octagonal conguration of its physical counterpart althoughit may be warped differently for stimuli composed of different separable pairs ofdimensions With integral pairs of dimensions this distribution of representationscorresponded to an elliptic locus a transformation from physical space that indicatedthat the two dimensions were perceived holistically
To show that these results are generalizable and consistent we employed the samestimuli but using a different classication task which is described in Potts et al (1998)In this task subjects had to classify stimuli into two categories For each condition onlyone dimension was relevant to the sorting task subjects were asked to pay attentionto the relevant dimension and sort the stimuli according to the value on that dimen-sion Garner and Felfoldy (1970) found that for integral pairs of dimensions the easewith which subjects could complete this task as measured by the time it took them tocomplete it was critically dependent on the values taken by the irrelevant dimensionFor separable pairs of dimensions reaction times were unaffected by manipulationsto the irrelevant dimension
Although Garner and Felfoldy (1970) gave a good indication of how subjectsprocess separable versus integral pairs of dimensions several researchers (egPomerantz and Garner 1973 Ward 1982 Potts et al 1998) conducted experimentswhere their own data were less conclusive about a strict dichotomy between integraland separable For example Potts et al (1998) showed how for dimensions of circle-diameter and radial line-angle variations in the location of the stimuli in the two-dimensional physical space can produce different forms of interaction between thedimensions They argue that since the radial line of a circle provides information aboutthe size of its circle but size itself does not provide information about the tilt thereis an asymmetric integrality between these two dimensions In other words since a
A G Tijsseling and M A Gluck24
radial line indicates the size of a circle (a longer radius means a bigger circle) thereis a weak form of integral interaction between size and tilt which can become evidentunder certain conditions (Potts et al 1998) These conditions are illustrated below
Potts et al (1998) had subjects classify stimuli into two categories The stimulussets varied in the difculty of discrimination between the two sizes and angles andwhether the radial line touched the perimeter of the circle Three examples are illus-trated in gure 12 In gure 12(A) stimuli were circles with a diameter of 41 mm and63 mm with a tilt of 12deg clockwise or counterclockwise In gure 12(B) discriminationwas decreased by reducing the tilt to 11deg and the diameter to either 45 or 55 mmFinally in gure 12(C) the weak interaction between tilt and size was removed byxing the length of the radial line at 32 mm and therefore preventing it from touchingthe perimeter of the circle
There were five different classification tasks two single dimension tasks twocorrelated dimension tasks and one orthogonal dimension task In Single Dimension1 either the size varied and tilt was kept at a clockwise position or tilt varied and sizewas large Single Dimension 2 had either size varying and tilt counterclockwise or tiltvarying with small circles providing two conditions Correlated dimensions wereeither positive or negative large and clockwise versus small and counterclockwise or large and counterclockwise versus small and clockwise respectively Finally in the orthogonal task both dimensions varied orthogonally with either size or tiltdesignated as the relevant dimension
The reaction times illustrated in gure 13 reveal a striking variation across stimulussets and across dimensions For example in gure 13(A) an asymmetric interactioncan be observed correlating both dimensions did not produce any facilitationcompared to a single dimension variation However varying size did interfere withtilt when the latter was the relevant dimension A different pattern of results shownin gure 13(B) was obtained when size was made less discriminable (see gure 12(B))variation in size produced slower reaction times Decreasing discriminability of thesize dimension therefore weakened the asymmetric interaction although thisasymmetry was not reversed Potts et al (1998) observed that subjects still found itmore difcult to process tilt when size was small than when size was large They suggestthat the systemrsquos preference for one dimension over the other may reflect more than a preference for superior discriminability (Potts et al 1998 108) ie it could be
Processing dimensional interaction 25
Figure 12 Stimulus sets for experiments by Potts et al (1998) (A) Circle sizes were 41 or 63mm with tilt being 15deg clockwise or counterclockwise (easy discrimination) (B) Circle sizeswere made less discriminating by reducing them to 45 and 55 mm Tilt was decreased to 11deg(hard discrimination) (C) Stimuli were as in (B) but the length of the radial line was xed at
32 mm (increased separability)
factors determined by the nature of the sensory system In the previous simulationswe showed that there was a preference for the tilt dimension an observation alsoindicated by Shepard (1964) It was suggested that this preference might be a naturalartifact of the Gabor lters
If this asymmetric interaction is removed by keeping the length of the radial lineconstant at a certain value (see gure 13(C)) then the reaction times indicate completeseparability of dimensions because the radial line does not supply information aboutthe size of the circle anymore Although the dimension of tilt produced faster reactiontimes in gure 13 there was a lack of reaction time differences as a function of taskwithin each dimension (Potts et al 1998)
62 Simulations with the demonstrative modelSince our focus is not on replicating the results from Potts et al (1998) but on exploringthe correlation of data from this Garner paradigm with data from the Shepardparadigm we did a simulation of the above procedures using four stimuli in the range of dimensional values used in our Shepard simulation (see gure 14(A)) Wemeasured the number of epochs it took the model to reach a pre-specied criterion(MSE of 01) as a substitute for reaction time3 We assume that the relative ease withwhich the network separates the representations of stimuli correlates with the speedwith which a network identies a stimulus Since the model does not have the abilityto attend specically to one dimension we were not able to implement both versionsof the correlated task In other words when sorting a large circle with a clockwise tiltfrom a small circle with a counterclockwise tilt it is not possible to instruct the modelto sort these two stimuli according to either size or tilt The model was instead taughtjust to sort the stimuli
The architecture of the model differed from the previous simulation in that theoutput layer had one extra unit to encode category membership (set as zero for therst category and one for the second category) The networkrsquos task therefore is tolearn both to identify the stimulus item with a unique label as well as to categorize itWe ran 10 simulations for each task using different initial random weights from therange [ndash10 10] using the same weight set for all tasks The reason for this is to ensurethat differences in the modelrsquos performance for each task cannot be attributed to adifference in initial weights As such differences in performance reect the difcultyof the task not the conguration of weights
A G Tijsseling and M A Gluck26
Figure 13 Mean reaction times for tilt and size dimensions as a function of task Theclassification tasks are explained in the text (A)ndash(C) show the reaction times for thecorresponding gures of gure 13 Figure reproduced from Potts et al (1998) Error bars were
not provided in the original gure
The results illustrated in gure 15(A) show the same kind of asymmetric inter-action as in gure 13(A) Variations in the tilt dimension required more epochs to sortand there was interference from the size dimension when this was varied orthogonallyWhen the dimension of size was relevant there was no interference from the tiltdimension in all tasks When both dimensions varied performance on the correlationtask was dependent on the respective values stimuli took along their dimensionswhich is also evident in data from Potts et al (1998) This asymmetry of the interactionbetween the dimensions of size and tilt conrms what we observed in the results ofthe Shepard task In this task both the confusion scores and the interstimulus distancesvaried with each adjacent pair of stimuli In particular the confusion scores werehigher (and the interstimulus distances lower) for adjacent stimuli that had small circlesizes than adjacent stimuli that had large circle sizes
Figures 15(BndashD) display the results of simulating the above task with the otherkinds of stimuli used with the Shepard task These stimuli are illustrated in gure14(B C) Figure 14(D) shows an additional set of stimuli that were employed inexperiments by Redding and Tharp (1981) The dimensions that compose these
Processing dimensional interaction 27
Figure 14 Stimuli used in the simulations of the Garner speed sorting task The values on eachdimension are in the range of the values used for the Shepard task in order to be able to relatethe results obtained here with those obtained with the Shepard task In each gure stimuli arecomposed of (A) separable pair of dimensions of diameter of circle and angle of radial line(Shepard 1964) (B) separable pair of dimensions of height of a rectangle and position of anembedded vertical line (Kruschke 1993) (C) integral pair of dimensions of height and widthof a rectangle (Monahan and Lockhead 1977) and (D) integral pair of dimensions of location
and angle of a straight line (Redding and Tharp 1981)
A G Tijsseling and M A Gluck28
Figure 15 Results of the speeded sorting tasks with the stimuli of gure 13 (A)ndash(D) correspondwith gure 14(A)ndash(D) and so forth (E) The number of epochs it took a plain feedforwardnetwork to sort straight lines that vary in orientation and location (Redding and Tharp 1981)The results for the correlated task are displayed in a separate graph because although themodel is capable of perceiving the dimensions that compose a stimulus it cannot be instructedto attend to a specific dimension Since both dimensions varied for the two stimuli of thecorrelated task we cannot infer which dimension was used by the network to learn the task or
whether both were relevant
continued
stimuli are location and orientation of a single straight line and they have proven tobe integrally interacting (Redding and Tharp 1981) In gure 15(B) it can be observedthat the dimensions of height of a rectangle and position of an embedded vertical linewhich were used as interacting dimensions by Kruschke (1993) show asymmetricinteraction irrelevant variation of position had no effect on sorting time of heightdifferences but variation in height affected sorting stimuli on position As for theintegral interacting dimensions shown in gure 15(C D) in both cases there is a cleareffect of interference from the irrelevant dimension in the orthogonal sorting taskswith the dimensions of Redding and Tharp (1981) showing a near perfect symmetryof interaction
We argued in the previous section that the Gabor filter component captures most of the relevant difference between integrated and separated dimensions theperceptual representations of which are further separated by the backpropagationcomponent under task constraints such as identication learning In this second setof simulations categorization task performance is shown to be dependent on thestructure of the perceptual representations from the Gabor lter component TheGabor responses for separable pairs of dimensions allow categorization based on asingle dimension to be learned with relatively little interference from the other varyingdimension but with integral pairs interference from irrelevant dimensions is relativelystronger
Processing dimensional interaction 29
The magnitude of this cross-dimensional interference however arises only whenthe networks are required to identify the individual stimulus items at the output layerWhen the task of the network is only to categorize (ie there is no identificationprocess) there is no evidence of dimensional interference Figure 15(E) shows theresults from simulations with a lsquocategorization onlyrsquo backpropagation network (egwith only one output node) When this network was presented with Gabor lteredresponses from the Redding and Tharp stimuli the number of epochs it took to sortthe stimuli for each task did not correspond with an integral interaction betweendimensions Rather the lsquocategorization onlyrsquo network quickly attended to only therelevant dimension The reason for this pattern of results is that in the absence ofidentication training the network does not have to separate individual stimuli tolower an identification error since there is no such error signal It is only given acategorization task and the stimulus representations are consequently clusteredaccording to the categories they belong to ignoring any interstimulus variations exceptthose that are relevant for placing a reliable category boundary (see gure 16)
This pattern of results implies that human participants covertly identify presentedstimulus items a process that forces attention to be directed to both dimensions whenboth are needed to discriminate the stimuli This in turn has a profound effect on thecategorization performance The tendency to identify stimuli may have been a resultof verbally provided information on the experiment by the controller asking thesubject to focus on a dimension It is also possible that sorting a set of stimuli impliesthe requirement to discriminate More interestingly it suggests that categorization andidentication are intrinsically linked in the cognitive system Such notions are basicto categorization theories such as exemplar models which assume the automaticretrieval of exemplars in response to stimulus presentation (Medin and Smith 1984Nosofsky 1992)
In one important aspect the described model failed to t the behavioural data oncategory learning Human subjects can be instructed to attend to one single dimensionin a category-learning task For example when sorting stimuli in which variation in size correlated with variation in tilt subjects can be asked to sort the stimuliaccording to size and ignoring variance on the other dimension The model does nothave such an attention mechanism and will therefore use variance on both dimensionsin successfully sorting the stimuli The next section describes a possible mechanismto introduce attention in a backpropagation model
7 Providing a mechanism for selective attention71 IntroductionThe modelrsquos lack of employment of any kind of attention in processing multi-dimensional stimuli might make it appear inferior to models that capture dimensionalinteractions only through the tting of experimental data For example in ALCOVEeach input node encodes a dimension or feature and the activation of all these nodesis gated by multiplicative attention strengths (Kruschke 1992) The advantage ofALCOVE is that one dimension can be ignored by reducing the attentional strengthof the corresponding input node Successful theories of categorization need a notionof selective attention because adaptation often occurs through the increase of atten-tion to dimensions and features that are important for the categorization task andorthe decrease of attention to irrelevant dimensions and features (Nosofsky 1986Goldstone 1998b) A well-known paradigm used to show how human subjects learn
A G Tijsseling and M A Gluck30
to pay attention to a particular dimension of a presented stimulus is a ltration versuscondensation task (Posner 1964 Garner 1974 Gottwald and Garner 1975 Potts et al1998)
In a variation by Kruschke (1991 1992) subjects had to learn to categorize eightstimuli that varied along two dimensions The stimuli were rectangles that had avertical line embedded in them The height of the rectangles and the position of thevertical line varied (gure 17(A) see also gure 5(B)) There were four groups ofsubjects and each of these groups had to learn a different task (gure 17(B)) two
Processing dimensional interaction 31
Figure 16 Location of representations of the Redding and Tharpe (1981) stimuli in hidden unitactivation space of the identication + categorization network (left) and the categorization-onlynetwork (right) The three axes measure the corresponding activation level of each of the threehidden units 1 to 3 and each category space is indicated by the letters A and B Training thenetwork on identication has increased the within-category distances as well compared withthe categorization-only network Note the closeness of the category A instances in thecategorization-only hidden unit activation space identifying and discriminating each of these
two instances would consequently be nearly impossible
tasks involved sorting the stimuli into two equal-sized categories along one dimensiononly and two tasks involved sorting along both dimensions Human subjects consis-tently learned tasks that involved one relevant dimension only (ltration) statisticallybetter than tasks that involved both dimensions (condensation) See gure 18(A) foran illustration of this difference in learning performance
This aspect of human categorization is difficult to explain using the standardbackpropagation neural network (Rumelhart et al 1986) In backpropagation theweights being adapted create hyperplanes that carve up the activation space of thenetwork The orientation of an arbitrary hyperplane can be in any direction in thisspace In this respect category boundaries can be placed between any two groups ofinputs which means that there would be no performance benet for a ltration taskover a condensation task Learning condensation tasks would actually be faster for astandard backpropagation network because the extra information available fromvariance along the other dimension would make it easier to separate hidden unitrepresentations (Kruschke 1993)
Kruschke (1991 1992 1993) provided a neural network model that can simulatehuman behaviour in a ltration versus condensation task His model ALCOVE is afeedforward network with three layers of nodes The input nodes encode the stimuluswith one node per psychological dimension such as colour or shape Every singleinput node has an attention strength associated with it which reects the relevance
A G Tijsseling and M A Gluck32
Figure 17 (A) Illustration of the stimuli used by Kruschke (1991) This gure shows thesuperimposition of all four possible heights of the rectangle and all four possible positions ofthe embedded vertical line (After Kruschke 1991) (B) The four category structures used inKruschkersquos (1991) experiment The horizontal axis corresponds to the dimension of height ofthe rectangle in gure 13(B) and the vertical axis to the dimension of position of embeddedvertical line The top panel displays two ltration tasks and the bottom one condensation tasks
of the corresponding dimension for the categorization task Each node in the hiddenlayer represents a training exemplar The activation of a hidden node reflects thesimilarity of the presented input to the exemplar that is represented by it The outputlayer itself consists of nodes that correspond to categories to be learned Figure 18(B)shows that this model shows ltration advantage over condensation
Although ALCOVE models human learning data well it has its limitations Oneneeds to specify the psychological dimensions of inputs which makes the model dif-cult to apply to real inputs such as images Tijsseling and Harnad (1997) and Tijsseling(1998) argue that categorization models should develop their own psychologicalrepresentation of the input space in order to explain categorical perception (Harnad1987b) and as a solution for symbol grounding (Harnad et al 1995) ALCOVEhowever is a psychological learning model devised to t and explain specic humanexperimental data In this paper on the other hand we want to do away with the posthoc determination of relevant dimensions and the need to incorporate data fromsubjectsrsquo similarity ratings in order to determine if dimensions interact separably orintegrally Instead our approach argues for models that aim to provide a mechanismfor both the perceptual and associative processes in category learning A successfulcategory model should try to solve the question of how the psychological space isrelated to physical space and subsequently how this psychological space is carved upinto the necessary categories based on environmental feedback
Therefore what is needed is to incorporate selective attention in the model Weshall derive this mechanism from Kruschkersquos single-layer learning model called ADIT(Kruschke 1996) This model is similar to ALCOVE as it also uses dimension valuesas inputs and attaches an attention strength to each of these dimension values Thedifference is that ADIT is based mainly on Mackintoshrsquos well-founded theory ofselective attention (Mackintosh 1975) We applied the principles underlying theattention mechanism of ADIT to backpropagation In the next section we shalldescribe this attention mechanism and its performance in simulating human behaviourin a ltration versus condensation task
Processing dimensional interaction 33
09
08
07
06
050 1 2 3 4 5 6 7 8
epoch
Pr
(co
rrec
t)
09
08
07
06
050 1 2 3 4 5 6 7 8
epoch
Pr
(co
rrec
t)
Figure 18 Panel A shows human learning data and panel B shows the simulation results withALCOVE (Kruschke 1991) Each datum shows the percentage of correct responses for onelearning block () Filtration position relevant ( j ) Filtration height relevant ( n )Condensation category boundary along the left diagonal (e ) Condensation right diagonal
boundary (Reprinted from Kruschke 1991)
72 Implementing an attention mechanism in backpropagationThe backpropagation network is modied such that each input node and hidden unitis supplied with an attention strength a which determines the importance of aparticular stimulus feature for the corresponding response Clearly output nodes donot have attention strengths associated with them Figure 19 displays a graphicalrepresentation of an attention-enhanced backpropagation network In addition toassociating attention strengths with units the learning procedure of backpropaga-tion is modied as well before the weights are updated attention is rst shifted torelevant information in the current input based on the errors calculated at the outputlayer
Derivation of the attention shifting algorithm is described in Appendix B Similarto the weight adaptation in backpropagation attention shifting is also a gradientdescent method attention should be shifted to those input values that reduce theerror at the output layer the most On presentation of an input all input nodes andhidden units are assigned similar normalized attention strengths according to
in which s is a freely estimated parameter ( s gt 0) and N is the number of nodes Thisnormalization causes the length of the attention vector to equal 10 when measuredusing a Minkowski r metric where r = s
After activation is propagated from the input to output layer the errors are calculatedand used to adapt the attention strengths of hidden units and input nodes respectivelyIf a new attention value is negative it is set to 00 The new attention strengths arenormalized again according to
A G Tijsseling and M A Gluck34
Figure 19 Illustration of an attention-enhanced backpropagation network The bottom layerof nodes is the input layer the middle is the hidden layer and the top layer contains the outputnodes Each input node and hidden layer has an attention strength of a i Connections between
nodes i and j have a weight wij
as
i N= - 1
a s
s
ii
aringaeligegraveccedil ouml
oslashdivide =
1
1 0
After adaptation activation is repropagated from the input layer to the output layerusing the new attention strengths The errors are then recalculated and weights arechanged accordingly This procedure repeats for every input pattern
73 Simulating Kruschkersquos ltration versus condensation taskThe attention-enhanced network was tested with Kruschkersquos filtration versuscondensation task (Kruschke 1991) In a ltration task only one dimension is relevantwhereas in a condensation task both dimensions are relevant It has been found thatsubjects nd ltration tasks easier to learn because they can attend to one dimensiononly (Kruschke 1991) As argued earlier standard backpropagation does not show thisperformance discrepancy because the nature of its weight adaptation algorithm allowscategory boundaries to be placed along arbitrary directions
The experimental set-up of the model was identical to the previous simulationsImages were preprocessed with Gabor lters tuned to several different angles Theoutput layer carried one extra unit to encode category membership (the target waszero for one category and one for the other) and the hidden layer contained fiveinstead of three hidden units because addition of attention weights made learningrelatively more complicated Simulations with both the previous and attention-enhanced model were run until the mean-squared error dropped below a criterion of 01 The learning rate h was set at 05 and the attention parameters l a and s wereset to 150 and 005 respectively The range for the random initial learning weightswas between ndash10 and 10
The learning curves for standard and attention-enhanced backpropagation areshown in gure 20 Attention-enhanced backpropagation (panel B) not only processesltration tasks more accurately than standard backpropagation (panel A) but alsolearns faster overall A one-way ANOVA to compare condensation with ltrationperformance revealed a signicant interaction (F(114) = 301 p lt 00001 r = 083)The benet of selective attention is that irrelevant information in the input stream isignored during weight adaptation In this sense learning a ltration task becomeseasier for the network since the lack of irrelevant information does not hindercategory boundary placement anymore
Figure 20(B) also shows an improvement on Kruschkersquos own simulation resultsThe human data of figure 18(A) show that during the first training block there isalready improved ltration advantage over condensation This initial difference is notcaptured in Kruschkersquos results (figure 18(B)) but it is exhibited by the attention-enhanced backpropagation model The latter displays a quick attention shiftingpotential which benefits from adaptability to changing information in the inputstreams The cause of this advantage is the implementation of an attention-changemechanism which provides novelty-based learning in the rst block of training every-thing is novel which causes relatively faster learning compared to learning in laterblocks when information has already been presented This mechanism might reectwhat is happening psychologically but it needs more evidence to suggest a criticalfactor in early-block learning
Processing dimensional interaction 35
aa
s a si
i
jj
=aring
8 Discussion and conclusionWe have presented a mechanistic cognitive explanation of the problem of dimensionalinteraction Prior approaches to the issue of separable versus integral pairs of dimen-sions have been concerned with conducting experiments with human subjects anddevising statistical models to t experimental data Although these approaches yielduseful data they do not clarify what mechanism underlies the transformation from
A G Tijsseling and M A Gluck36
Figure 20 Category learning data from the ltration versus condensation task for standardbackpropagation (panel A) and attention-enhanced backpropagation (panel B) The verticalaxis corresponds to the mean-squared error and the horizontal axis correspond to the numberof epochs Not only does attention-enhanced backpropagation nd ltration tasks easier to
learn it learns all tasks roughly twice as fast as standard backpropagation
a raw stimulus to an internal representation and how this transformation affects theinteraction between a pair of dimensions We argue that connectionist modelssupplemented with a sensory-preprocessing component naturally possess the capacityto differentiate between the various interactions between dimensions As such theanalysis of the way these models process sensory stimuli can aid researchers not only with determining how it might be done in the human cognitive system but alsoin interpreting human subject data
We have supported our hypothesis using demonstrative simulations with a simple backpropagation lsquoidentication networkrsquo combined with a Gabor lter inputlayer to lter the sensory input The use of Gabor lters (Gabor 1946 Daugman 1988)to encode monochromatic stimulus images provided a way to preserve not only the similarity gradient of the stimuli but also their physical properties Indeed by analysing the Gabor lter responses we observed that this component capturedmost of the relevant difference between integrated and separable pairs of dimensionfrom which we inferred that the perceived dimensional interaction could already be embedded in the Gabor-like sensory processing of the primary visual cortexConsequently the Gabor lter component can predict the dimensional interaction ofa given set of stimuli by examining the results of multidimensional scaling Similarlyin Tijsseling et al (2002) both human subjects and self-organizing competitive neuralnets were trained to discriminate and categorize two-dimensional images of three-dimensional shaped imaginary animals which varied in the dimensions of torso radiusand limb length For the networks these images were preprocessed with 100 over-lapping Gabor lters spread over the entire image A multivariate analysis of theresponses from these lters revealed dimensional differences and a salience of thelimb dimension This preference for limb differences was proven to be persistent forboth networks and human subjects and over several identication and categorizationtasks
The initial perceptual representation or the structure of the Gabor space can befurther lsquowarpedrsquo by cognitive processing such as for example category training(Tijsseling and Harnad 1997) This warping effect is a consequence of the restrictednumber of hidden units and hence the necessity of the network to compressredundant information and highlight distinctions with important consequences Aninteresting observation is the effect of the identification network on the Garnerparadigm tasks Cross-dimensional interference did not appear when the networkperformed only categorization not identication even in the case where dimensionswere integral An implication of this result is that human subjects in classificationtasks may still perhaps covertly identify and discriminate stimuli during the acqui-sition of categories This is an observation that corresponds with a core principle ofexemplar theories (see eg Nosofsky 1992)
We have also suggested a possible mechanism for modelling the established abilityof humans to attend selectively to dimensions The suggested mechanism was derivedfrom Kruschkersquos ADIT model (1996) The attention-enhanced model was applied toa standard ltration versus condensation task (Kruschke 1991) In a ltration taskonly one dimension is relevant whereas in a condensation task both dimensions arerelevant It has been found that subjects nd ltration tasks easier to learn becausethey can attend to one dimension only (Kruschke 1991) We have shown that theattention-enhanced model not only processes ltration tasks more accurately thanstandard backpropagation but it also demonstrates an early-block ltration advan-tage unlike ALCOVE
Processing dimensional interaction 37
In the Introduction we discussed that perception contains an initial source ofstructured information that can be operated upon subsequently by higher cognitiveprocesses Goldstone (1998a) but that these cognitive processes can also modifypercepts (eg Schyns et al 1998) Several researchers have shown how psychologicaldistances between stimuli further change under the inuence of cognitive processes(Goldstone 1994 Goldstone et al 1999) Our simulations with the model are sup-portive of this bidirectionality we have shown the richness of perceptual informationcaptured by the Gabor lter component and how this similarity gradient-preservingencoding already captures most of the dimensional interaction Given these percep-tually constrained sensory stimuli the neural network can develop a psychologicalspace during identication discrimination and category learning in which represen-tations for stimuli may become warped under task constraints in order correctly toidentify discriminate and categorize the physical stimuli (Tijsseling and Harnad 1997)Given more complex neural networks these learned representations may furtherdevelop with additional learning and we suggest that this may provide a solution tosymbol grounding (Harnad 1995 Tijsseling 1998)
The work presented in this paper may have potential relevance to several issues inpsychology For example by providing a mechanistic explanation of differentialprocessing of dimensions we try to supplement the amount of experimental datacollected in the eld of cognitive psychology over the last few decennia This mayhelp point to new directions for experimental research because the accumulatedexperimental data might simply be insufficient to constrain or guide appropriatetheories of dimensional interaction The simple model of perceptual processingpresented here could easily be incorporated into models of other cognitive systemsproviding those models with a way to explore interactions between the formation ofperceptual representations and other aspects of cognition For example in Gluck andMyersrsquo (1993) cortico-hippocampal model the hippocampal component is modelledwith a similar backpropagation network which also employs predictive differentiationand redundancy compression argued to be crucial properties of the hippocampalregion for learning new information This model would as such benefit from theincorporation of our model of perception as this would allow for investigations intophenomena at the intersection of memory and perception providing predictions forthe perceptual and associative processes in category learning
The model described in the paper supports our claim that connectionist modelsprovide insights into the mechanism of differential processing of dimensions byhumans but it remains a demonstrative model We adhered to the simplicity principle(Chater 1999) in keeping the model relatively small for purposes of explanation andanalysis The model is also more of a qualitative model in that speed of learning andperformance data cannot be quantitatively compared with humans Studies of simpleidealized models are naturally not without drawbacks One cannot make specificquantitative predictions as would be expected from more realistic and complexmodels but that was not the intent in the rst place Simple idealized models are ameans for conceptual clarications In this case the principles and ideology behindthe model support our hypothesis that connectionist models can provide a mechanisticapproach to dimensional interaction
There are however various directions for future work For example we did notapply the model to the standard dimensions of saturation and brightness of a colour(Goldstone 1994) which can be tested with encodings of colour texture usingunichrome and opponent features computed from Gabor filter outputs (Jain and
A G Tijsseling and M A Gluck38
Healey 1997) The effect of increasing stimulus size (eg introduce a correlationbetween a horizontal and a vertical line by widening the lines and therefore increasethe number of pixels) and complexity also needs to be researched We also plan toinvestigate the role of development in perceptual processing of dimensionalinteraction Kovaacutecs (2000) showed developmental effects in the visual processing oforientation information across the visual eld Can these developmental character-istics be modelled by systematically adjusting the parameters of the Gabor filtercomponent For example manipulating the spatial frequency and reducing the rangeof the Gabor filter may at some point affect how the interaction between dimen-sions is captured Indeed Kemler and Smith (1978) showed that dimensions that are easily separated by adults are perceived holistically in 4-year-old children It may be hypothesized that by gradually expanding Gabor filters over images suchdevelopmental changes in dimensional interaction can be modelled To this extentthe properties and structure of Gabor space need to be further systematicallyexplored
In concluding we note how Shepard (1964) stressed the importance of nding thetransformation that will convert physical interstimulus distances into psychologicaldistances between the corresponding representations In a similar vein Potts et al(1998) argue that the traditional distinction between integral and separable should bereplaced by models that elucidate the rules that are employed to transform and usemultidimensional stimulus variation These rules are embodied in the sensoryprocessing lter in combination with the processes for redundancy compression andpredictive differentiation and we consequently propose that connectionist modelsprovide this transformation and that analysing their performance will benefit theunderstanding of human subject performance concerning which there is abundantbehavioural data
Notes1 Although lsquofusedrsquo is a commonly used term to describe integral interaction it may be deceptive
sincemdashas we shall illustrate latermdashthe psychological dimensions are in fact out of alignment with thephysical dimensions and just not reduced to a single dimension
2 One may suggest injecting random noise in the hidden layer and measuring the resulting outputidentication error The probability that adding a specied amount of noise may lead to confusing arepresentation with another is also a function of the distance between these representations in hiddenunit space However using noise adds a level of randomness that can make the data less reliable thancalculating interstimulus distances directly
3 Reaction time could also be modelled by training the network for a xed number of epochs andmeasuring the residual error Since the slope of the error curve can vary strongly in steepness for eachinput such a method can produce different results for different numbers of epochs Terminatinglearning when the error is at the bottom of the slope provides more accurate comparisons
ReferencesAshby F G and Maddox W T 1994 A response time theory of separability and integrality in speeded
classication Journal of Mathematical Psychology 38 423ndash466 Attneave F 1963 Dimensions of similarity American Journal of Psychology 63 516ndash556 Berlin B and Kay P 1969 Basic Color Terms Their Universality and Evolution (Berkeley University
of California Press)Bishop C M 1995 Neural Networks for Pattern Recognition (Oxford Oxford University Press)Bornstein M H 1987 Perceptual categories in vision and audition In S Harnad (ed) Categorical
Perception The Groundwork of Cognition (New York Cambridge University Press)Burns B and Shepp B E 1988 Dimensional interactions and the structure of psychological space the
representation of hue saturation and brightness Perception and Psychophysics 43 494ndash507
Processing dimensional interaction 39
Buse R Liu Z Q and Caelli T 1996 Using Gabor lter to measure pattern part features andrelations Pattern Recognition 29 615ndash625
Cangelosi A Greco A and Harnad S 2000 From robotic toil to symbolic theft grounding transferfrom entry-level to higher-level categories Connection Science 12 (2) 143ndash162
Carroll J D and Arabie P 1980 Multidimensional scaling Annual Review of Psychology 31 607ndash649Chater N 1999 The search for simplicity A fundamental cognitive principle Quarterly Journal of
Experimental Psychology 52A 273ndash302Daugman J D 1988 Complete discrete 2D Gabor transforms by neural networks for image analysis
and compression IEEE Transactions Acoustics Speech and Signal Processing 36 1169ndash1179Gabor D 1946 Theory of communications Journal of the Institute of Electrical Engineering 93
429ndash457Garner W R 1970 The stimulus in information processing American Psychologist 25 350ndash358 Garner W R 1974 The Processing of Information and Structure (Hillsdale NJ Erlbaum) Garner W R and Felfoldy G L 1970 Integrality of stimulus dimensions in various types of
information processing Cognitive Psychology 1 225ndash241Gibson E J 1991 An Odyssey in Learning and Perception (Cambridge MA MIT Press)Gluck M A and Myers C E 1993 Hippocampal mediation of stimulus representation a
computational theory Hippocampus 3 491ndash516 Gluck M A Oliver L M and Myers C E 1996 Late-training amnesic decits in probabilistic
category learning a neurocomputational analysis Learning amp Memory 3 326ndash340Goldstone R L 1994 Inuences of categorization on perceptual discrimination Journal of
Experimental Psychology General 123 178ndash200Goldstone R L 1995 Mainstream and avant-garde similarity Psychologica Belgica 35 145ndash165Goldstone R L 1998a Perceptual learning Annual Review of Psychology 49 585ndash612 Goldstone R L 1998b Hanging together a connectionist model of similarity In J Grainger and A M
Jacobs (eds) Localist Connectionist Approaches to Human Cognition (Mahwah NJ LawrenceErlbaum Associates) pp 283ndash325
Goldstone R L 1999 Similarity In R A Wilson and F C Keil (eds) MIT Encyclopedia of theCognitive Sciences (Cambridge MA MIT Press) pp 763ndash765
Goldstone R L 2002 Learning to perceive while perceiving to learn In R Kimchi M Behrmann andC Olson (eds) Perceptual Organization in Vision Behavioral and Neural Perspectives (MahwahNJ Lawrence Erlbaum)
Goldstone R L Lippa Y and Shiffrin R M 2001 Altering object representations through categorylearning Cognition 78 27ndash43
Goldstone R L Schyns P G and Medin D L (eds) 1997 Psychology of Learning and MotivationPerceptual Learning Vol 36 (San Diego CA Academic Press)
Goldstone R L Steyvers M and Larimer K 1996 Categorical perception of novel dimensions In Proceedings of the Eighteenth Annual Conference of the Cognitive Science Society (Hillsdale NJLawrence Erlbaum) pp 243ndash248
Goldstone R L Steyvers M Spencer-Smith J and Kersten A 1999 Interactions between perceptualand conceptual learning In E Diettrich and A Markman (eds) Cognitive Dynamics ConceptualChange in Humans and Machines (Cambridge MA MIT Press)
Gottwald R L and Garner W R 1975 Filtering and condensation tasks with integral and separabledimensions Perception amp Psychophysics 18 (1) 26ndash28
Grossberg S 1982 Studies of Mind and Brain Neural Principles of Learning Perception DevelopmentCognition and Motor Control (Boston MA Reidel Press)
Grossberg S 1987 Competitive learning from interactive activation to adaptive resonance CognitiveScience 11 23ndash63
Handel S and Imai S 1972 The free classication of analyzable and unanalyzable stimuli Perceptionand Psychophysics 12 108ndash116
Hanson S J and Burr D J 1990 What connectionist models learn toward a theory of representationin connectionist networks Behavioral and Brain Sciences 13 471ndash518
Harnad S 1987a Category induction and representation In S Harnad (ed) Categorical Perception TheGroundwork of Cognition (New York Cambridge University Press)
Harnad S (ed) 1987b Categorical Perception The Groundwork of Cognition (New York CambridgeUniversity Press)
Harnad S 1995 Grounding symbols in sensorimotor categories with neural networks In IEEColloquium lsquoGrounding Representations Integration of Sensory Information in Natural LanguageProcessing Articial Intelligence and Neural Networksrsquo (Digest No1995103)
Harnad S Hanson S J and Lubin J 1995 Learned categorical perception in neural nets implicationsfor symbol grounding In V Honavar and L Uhr (eds) Symbol Processors and ConnectionistNetwork Models in Articial Intelligence and Cognitive Modelling Steps Toward PrincipledIntegration (New York Academic Press)
Hock H Tromley C and Polmann L 1988 Perceptual units in the acquisition of visual categoriesJournal of Experimental Psychology Learning Memory and Cognition 14 75ndash84
A G Tijsseling and M A Gluck40
Hubel D H and Wiesel T N 1962 Receptive elds binocular interaction and functional architecturein the catrsquos visual cortex Journal of Physiology 160 106ndash154
Hubel D H and Wiesel T N 1965 Receptive elds and functional architecture in two nonstriatevisual areas (18 and 19) of the cat Journal of Neurophysiology 28 229ndash289
Hyman R and Well A 1967 Judgments of similarity and spatial models Perception andPsychophysics 2 233ndash248
Jain A and Healey G 1997 Evaluating multiscale opponent color features using Gabor lters InProceedings of the 1997 International Conference on Image Processing (ICIP lsquo97) Institute ofElectrical and Electronics Engineers Inc
Johannesson M 2001 Combining integral and separable subspaces In Proceedings of the 23rd AnnualConference of the Cognitive Science Society Edinburgh 1ndash4 August
Johnson S C 1967 Hierarchical clustering schemes Psychometrika 2 241ndash254 Jones J P and Palmer L A 1987 An evaluation of the two-dimensional Gabor lter model of simple
receptive elds in cat striate cortex Journal of Neurophysiology 58 (6) 1233ndash1258Kalocsai P Zhao W and Elagin E 1998 Face similarity space as perceived by humans and articial
systems In Proceedings of the Third IEEE International Conference on Automatic Face andGesture Recognition Nara Japan pp 177ndash180
Karmiloff-Smith A 1992 Beyond Modularity A Developmental Perspective on Cognitive Science(Cambridge MA Bradford MIT Press)
Kemler D G and Smith L B 1978 Is there a developmental trend from integrality to separability inperception Journal of Experimental Child Psychology 26 498ndash507
Kovaacutecs I 2000 Human development of perceptual organization Vision Research 40 1301ndash1310Kruschke J K 1991 Dimensional attention learning in models of human categorization In Proceedings
of the Thirteenth Annual Conference of the Cognitive Science Society (Hillsdale NJ Erlbaum) Kruschke J K 1992 ALCOVE an exemplar-based connectionist model of category learning
Psychological Review 99 22ndash44 Kruschke J K 1993 Human category learning Implications for backpropagation models Connection
Science 5 3ndash36Kruschke J K 1996 Base rates in category learning Journal of Experimental Psychology Learning
Memory and Cognition 22 3ndash26Laakso A and Cottrell G W 1998 How can I know what you think Assessing representational
similarity in neural systems In Proceedings of the Twentieth Annual Cognitive Science Conference(Madison WI Mahwah Lawrence Erlbaum)
Lockhead G R 1972 Processing dimensional stimuli a note Psychological Review 79 410ndash419Mackintosh N J 1975 A theory of attention variation in the associability of stimuli with reinforcement
Psychological Review 82 276ndash298Marcelja S 1980 Mathematical description of the response of simple cortical cells Journal of The
Optical Society of America A70 (11) 1297ndash1300Medin D L and Smith E E 1984 Concepts and concept formation Annual Review of Psychology 35
113ndash138Melara R D Marks L E and Potts B C 1993 Primacy of dimensions in color perception Journal of
Experimental Psychology Human Perception amp Performance 19 1082ndash1104Monahan J S and Lockhead G R 1977 Identication of integral stimuli Journal of Experimental
Psychology General 106 94ndash110Murre J M J Phaf R H and Wolters G 1992 CALM categorizing and learning module Neural
Networks 5 55ndash82Myers C E and Gluck M A 1994 Context conditioning and hippocampal representation in animal
learning Behavioral Neuroscience 49 (4) 221ndash227 Nosofsky R M 1986 Attention similarity and the identication-categorisation relationship Journal of
Experimental Psychology General 115 39ndash57Nosofsky R M 1992 Exemplar-based approach to relating categorization identication and
recognition In F G Ashby (ed) Multidimensional Models of Perception and Cognition (HillsdaleNJ Lawrence Erlbaum)
Padgett C and Cottrell G W 1998 A simple neural network models categorical perception of facialexpressions In Proceedings of the Twentieth Annual Cognitive Science Conference (Madison WIMahwah Lawrence Erlbaum)
Pomerantz J R and Garner W R 1973 Stimulus conguration in selective attention tasks Perceptionamp Psychophysics 14 565ndash569
Posner M I 1964 Information reduction in the analysis of sequential tasks Psychological Review 71491ndash504
Potts B C Melara R D and Marks L E 1998 Circle size and diameter tilt a new look at integralityand separability Perception amp Psychophysics 60 (1) 101ndash112
Redding G M and Tharp D A 1981 Processing line location and orientation Journal ofExperimental Psychology Human Perception and Performance 7 115ndash129
Rumelhart D E Hinton G E and Williams R J 1986 Learning internal representations by error
Processing dimensional interaction 41
backpropagation In D E Rumelhart and J L McClelland (eds) Parallel Distributed ProcessingExplorations in the Microstructure of Cognition (Cambridge MA MIT Press)
Schyns P G Goldstone R L and Thibaut J 1998 Development of features in object conceptsBehavioral and Brain Sciences 21 1ndash54
Shepard R N 1964 Attention and the metric structure of the stimulus space Journal of MathematicalPsychology 1 54ndash87
Shepard R N 1987 Toward a universal law of generalization for psychological science Science 2371317ndash1323
Smith L B and Kemler D G 1978 Levels of experienced dimensionality in children and adultsCognitive Psychology 10 502ndash532
Tijsseling A G 1998 Connectionist Models of Categorization A Dynamical View of Cognition PhDthesis Southampton University
Tijsseling A G and Harnad S 1997 Warping similarity space in category learning by backprop netsIn Proceedings of the Interdisciplinary Workshop on Similarity and Categorization University ofEdinburgh pp 263ndash269
Tijsseling A G Pevtzow R and Harnad H 2002 Dimensional attention effects in humans and neuralnets (in preparation)
Torgerson W S 1958 Theory and Methods of Scaling (New York Wiley) Ward L M 1982 Determinants of attention to local and global features of visual forms Journal of
Experimental Psychology Human Perception amp Performance 8 562ndash581
A G Tijsseling and M A Gluck42
Appendix A Gabor ltersA Gabor function is a complex exponential with a Gaussian modulation Suppose wehave the set of angles a 1 a 2 a h then we can create for each angle a i a lter Fcomposed of real and imaginary parts
in which a = (angle p )180deg p ~ = b p is the spatial frequency of the lter ( b gt 0) (x y) is the current pixel (x0y0) is the origin or centre of the lter and s is a constant
For a given angle we obtain the response of a particular Gabor lter by calculatingthe following formula
The nal input vector to be presented to the network is then the normalized vectorof the responses of all Gabor lters for all specied angles
In simple words this means that the region surrounding a given pixel in the imageis described by the responses of a set of Gabor lters at different frequencies andorientations all centred at the pixel position That is we generate a local descriptionof the image by taking a set of features which are in fact the responses of a set ofGabor lters distributed over the entire image This response measures a certain localfrequency of the image property at the considered location
In the simulations we use eight Gabor filters each tuned to a different angleorientation (00deg 225deg 450deg 675deg 900deg 1125deg 135deg 1575deg) centred at and coveringthe area of the stimulus with a s between 300 and 400 in steps of ve and a spatialfrequency between 25 and 35 in steps of 05 depending on the size of the image which was exactly as specied in the corresponding papers providing a total numberof lters in the range of eight to 72 The output of all lters was normalized so thateach image would produce a real-valued input vector the length of which is 10 andthe number of elements equal to the number of used Gabor lters The motivationbehind these parameters was to restrict the size of the input vectors while at the sametime assuring that no information about the visual stimuli is lost For the explanativepurpose of our demonstrative model we kept the Gabor filter component rela-tively simple in order to determine how it affects stimulus encoding although we also ran simulations with a 6 6 grid of overlapping Gabor lters for four different
Processing dimensional interaction 43
-- + -( )
=-aelig
egraveccedil
ouml
oslashdivide -
-aelig
egraveccedil
ouml
oslashdivide
aelig
egraveccedil
ouml
oslashdivide
aelig
egraveccedil
ouml
oslashdivide
-- + -( )
=-
Acirc
Aacute
( ) ( )
( ) sin ˜ cos sin
( ) ( )
( ) cos ˜
x x y y
F x y ex x
xy y
y
x x y y
F x y ex x
x
02
02
2
0
0
0
0
02
02
2
0
0
2
2
s
p a a
s
paeligaelig
egraveccedil
ouml
oslashdivide -
-aelig
egraveccedil
ouml
oslashdivide
aelig
egraveccedil
ouml
oslashdivide
aelig
egraveccedil
ouml
oslashdividecos sina a
y yy
0
0
F x y F x yx y
Acirc Aacute+aring ( ) ( )
2 2
orientations (0deg 45deg 90deg 135deg) and varying spatial frequencies which showedconsistent similar results
The stimuli from Redding and Tharp (1981) had to be encoded with a second setof Gabor lters (one set centred at the left and the other set at the right of the image)to encode variation in the location of the straight line since using one centred Gaborlter would not capture location differences and produce identical responses for thoseimages varying only in location To keep the input vector length equal to the otherencoded stimulus sets we used four orientations for this stimulus set
Appendix B Mathematical description of attention-enhanced backpropagationDerivation of attention shifting in backpropagationAs in standard backpropagation the measure of error is given by
in which E is the measure of the error on a particular stimulus ti is the target valueand oi is the actual output value of output node i The total activation arriving at a nodej is the sum of all incoming activations oi multiplied by their attention strengths a i andthe weight on the connection from node i to node j wij
The activation of node j is then the result of the activation function applied to the netinput to node j (the activation function f usually is the sigmoid function dened as f(x) = 11 + endashx)
We are looking for an algorithm that adapts the attention strengths for each inputnode and each hidden unit The attention strength of a node i is adjusted in theopposite direction of the gradient of the error by some constant l a the attention rateparameter
To nd this gradient we need to use recursive backwards projections from the out-put layer We derive this gradient of the error with respect to attention by viewing itas a product of two parts One part reects the change in error as a function of thechange in net input to the nodes in the next layer and the other part represents the effect that changing attention has on the net input In other words to calculate a change in attention of a node j we use the net input of the nodes to which node j issending activation to
A G Tijsseling and M A Gluck44
E t oi i
i
= -aring12
2( ) (B 1)
net w oj ij i i
i
= aring a (B 2)
o f netj j= ( ) (B 3)
D a l
aaii
E= -
parapara
(B 4)
There are two cases for nodes j it is either an output node or a hidden unit So wedene
We apply the chain rule on equation (6) to obtain a product of two factors with onefactor reecting the change in error as a function of the output of a unit and the otherone reecting the change in the output as a function of changes in the input
Using equation (B 3) in the second part of equation (7) gives us
and using equation (B 1) in the rst part of equation (B 7) obtains
from which we further derive
However when j is a hidden unit we need to use a different derivation as we cannotaccess the output values directly The following derivation shows how we canrecursively propagate error values back from output to input
Substituting equation (B 11) in equation (B 7) then gives
Processing dimensional interaction 45
parapara
=para
para
para
para
aelig
egraveccedil
ouml
oslashdividearing
E Enet
net
i j
j
ija a (B 5)
d j
j
Enet
= -para
para (B 6)
d j
j j
j
j
Enet
Eo
o
net= -
parapara
= -parapara
para
para (B 7)
para
para=
o
netf netj
jjrsquo( ) (B 8)
(B 9)
parapara
= - -Eo
t oj
j j( )
d j j j jf net t o= -rsquo( )( ) (B 10)
parapara
=para
paraparapara
aelig
egraveccedil
ouml
oslashdivide
=para
parapara
para
aelig
egraveccedil
ouml
oslashdivide
= -
aring
aringaring
aring
Eo
Enet
neto
Enet o
w o
w
j k
k
jk
k jlk l l
lk
k jk jk
a
d a
(B 11)
Derivation of the second part of equation (B 5) is as follows We dene the gradientas the effect of a change in attention of a node i on the change in net input of all nodesit sends activation to When node i is an input unit oi just represents the input value
Hence the change in attention strength is calculated according to
Attention rate is dependent on novelty of stimulusIn addition the attention rate l a can be made dependent on the novelty of a stimulusWhen a stimulus is new attention to it should be high enough to enhance learningbut when a stimulus has been presented several times the novelty wears off and assuch attention to it will decrease We dene novelty to be related to the amount oferror at the output layer With each presentation of an input the initial attention rateconstant is multiplied by the error produced at the output layer
in which N is the number of output nodes
Derivation of weight adaptation in attention-enhanced backpropagationThe change of weights is slightly different compared with standard backpropagationin order to incorporate attention strengths The weight from node i to node j isadjusted in the opposite direction of the gradient of the error with the speed ofadjustment dependent on the learning rate h
which can be rewritten as
A G Tijsseling and M A Gluck46
d d aj j k jk j
k
f net w= aringrsquo( ) (B 12)
para
para=
para
para
=para
para
=para
para
=
aringaring
aringaring
aringaring
aring
net net
w o
w o
w o
j
i
j
ijj
ilj l l
lj
ilj l l
lj
ij jj
a a
aa
aa
(B 13)
D a l dai j ij j
j
w o= aring (B 14)
l la a= -
aelig
egraveccedil
ouml
oslashdividearing t oi i
i
N
(B 15)
D w
Ewij
ij
= -parapara
h (B 16)
The second factor of equation (B 17) reduces to
Note that in equation (B 18) attention enters the factor Now dene
We apply the chain rule to obtain a product of two factors with one factor reectingthe change in error as a function of the output of a unit and the other one reectingthe change in the output as a function of changes in the input
Using equation (B 3) in the second part of equation (B 16)
Using equation (B 1) in the rst part of equation (B 16)
from which we derive
When j is a hidden unit we need to use a different derivation as we cannot access theoutput values directly Note that since outputs do not have attention strengths thesedrop out of the equation (which is similar to assuming that the attention of an outputnode is equal to 10)
Processing dimensional interaction 47
parapara
=para
para
para
paraEw
Enet
net
wij j
j
ij
(B 17)
para
para=
parapara
=aringaringaringnet
w ww o oj
ij ijkj k k i i
kjj
a a (B 18)
d j
j
Enet
= -para
para (B 19)
d j
j j
j
j
Enet
Eo
o
net= -
parapara
= -parapara
para
para (B 20)
para
para=
o
netf netj
jjrsquo( ) (B 21)
parapara
= - -Eo
t oj
j j( ) (B 22)
d j j j jf net t o= -rsquo( )( ) (B 23)
parapara
=para
paraparapara
aelig
egraveccedil
ouml
oslashdividearing
Eo
Enet
netoj k
k
jk continued
Substituting equation (B 24) in equation (B 20) then gives
Hence the change in weight is calculated according to
A G Tijsseling and M A Gluck48
=para
parapara
para
aelig
egraveccedil
ouml
oslashdivide
= -
aringaring
aring
Enet o
w o
w
k jlk l l
lk
k jkk
a
d
(B 24)
d dj j k jk
k
f net w= aringrsquo( ) (B 25)
D w oij j i i= h d a (B 26)
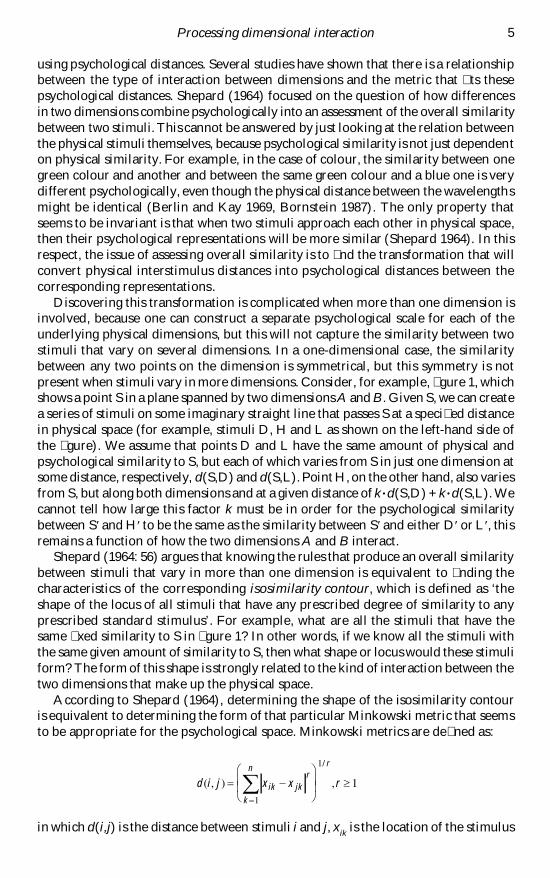
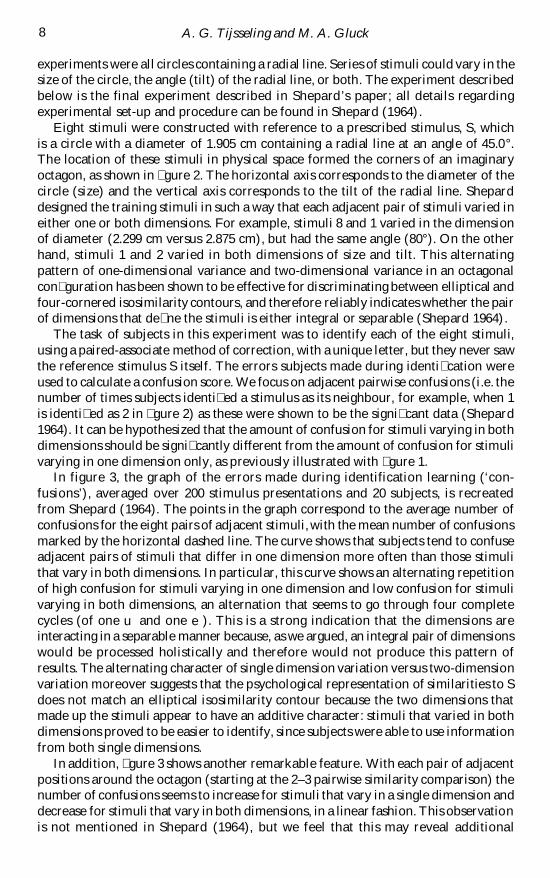
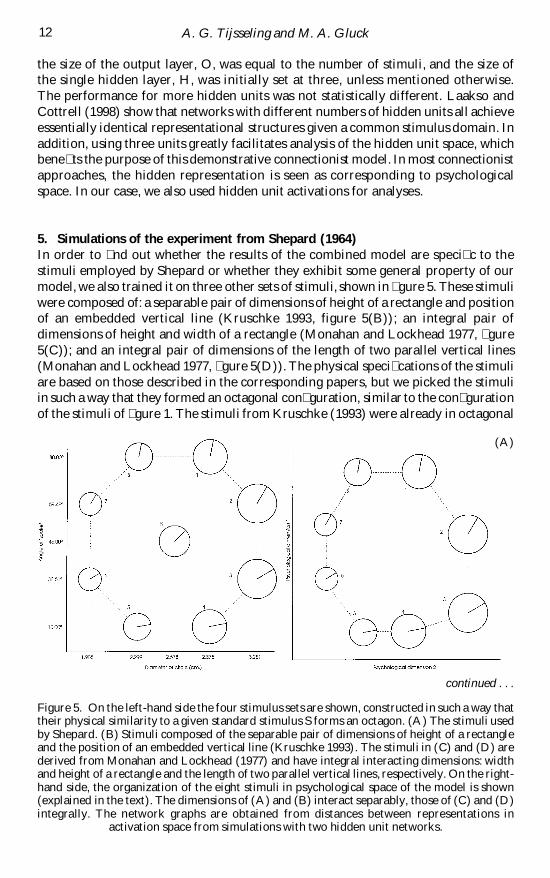
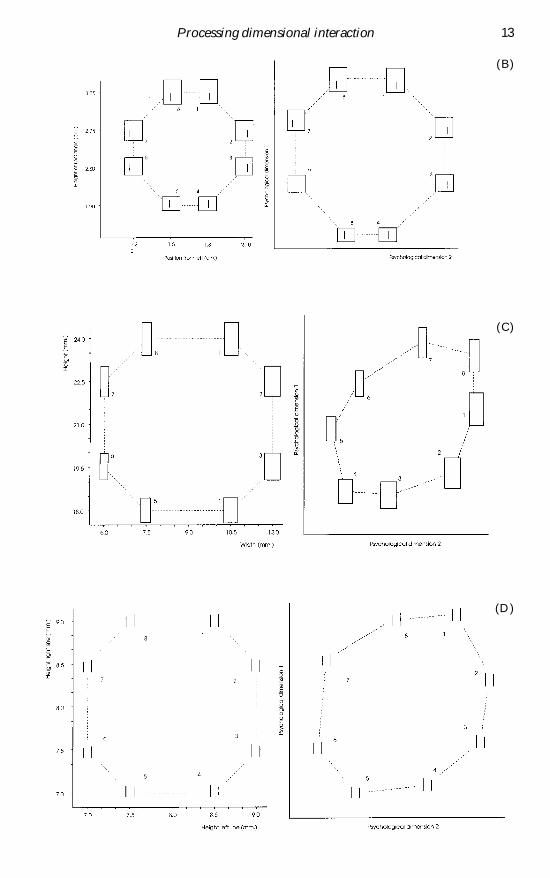
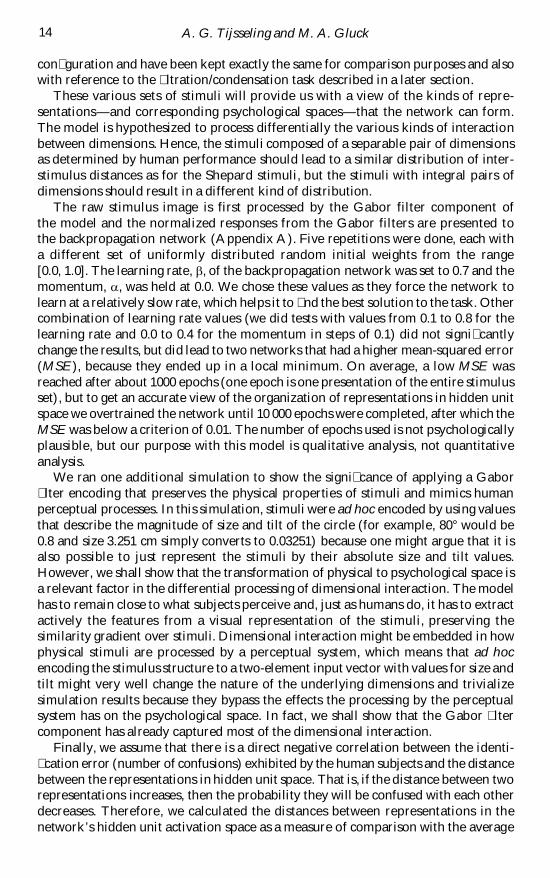
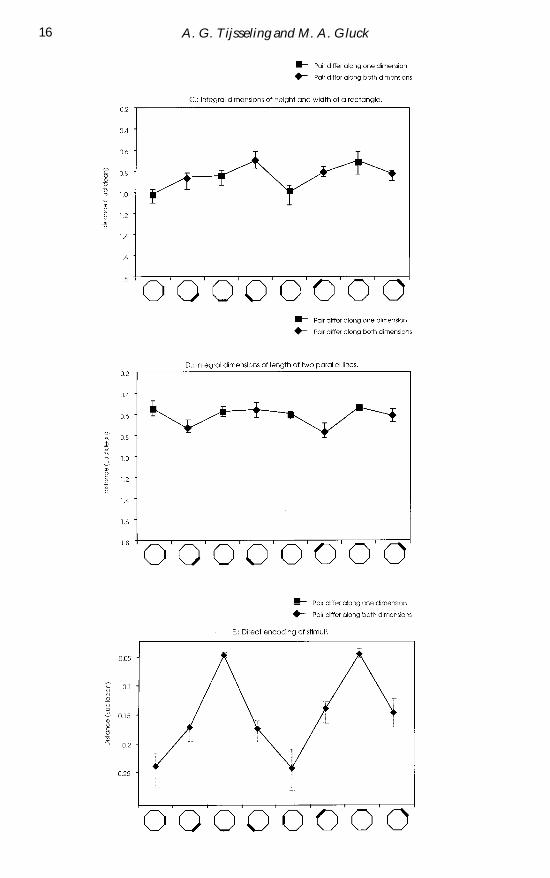
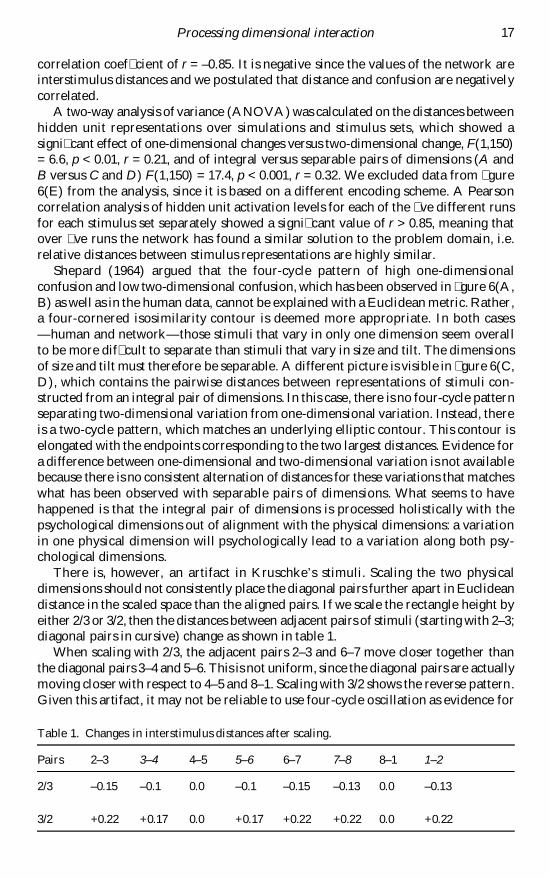
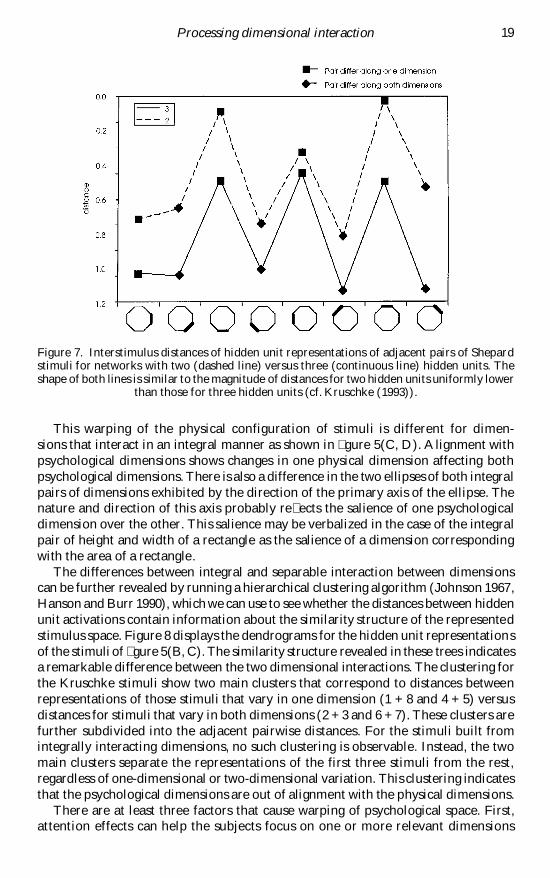
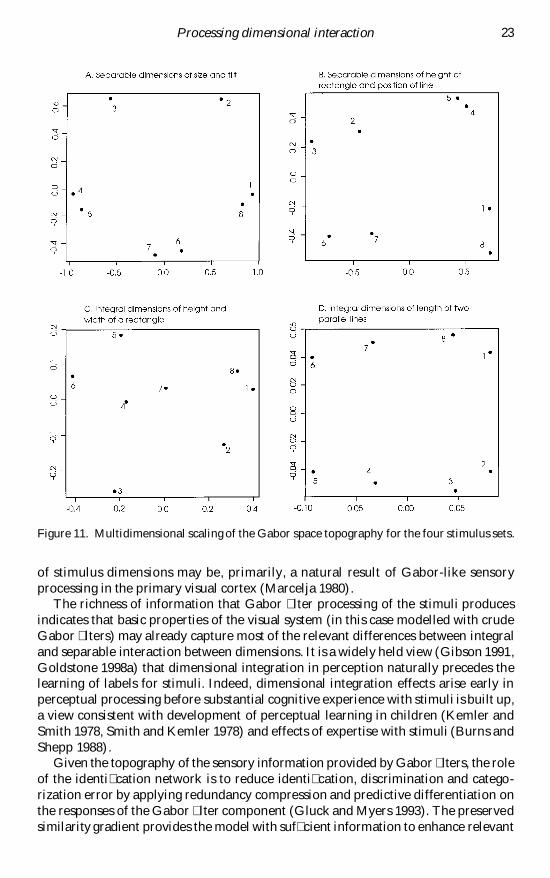
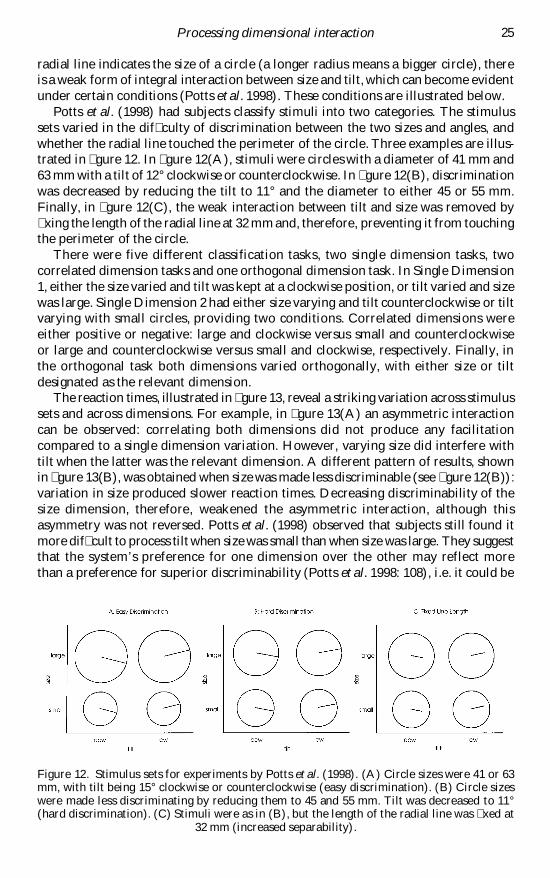
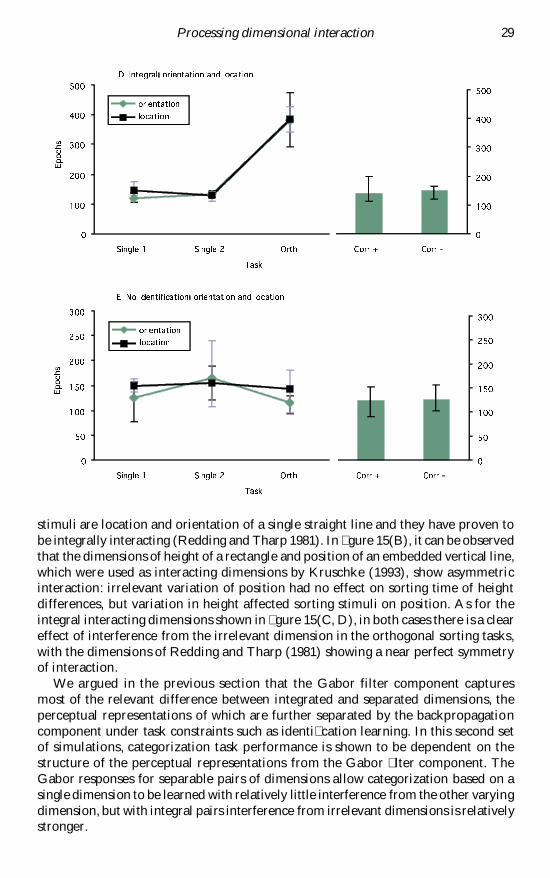
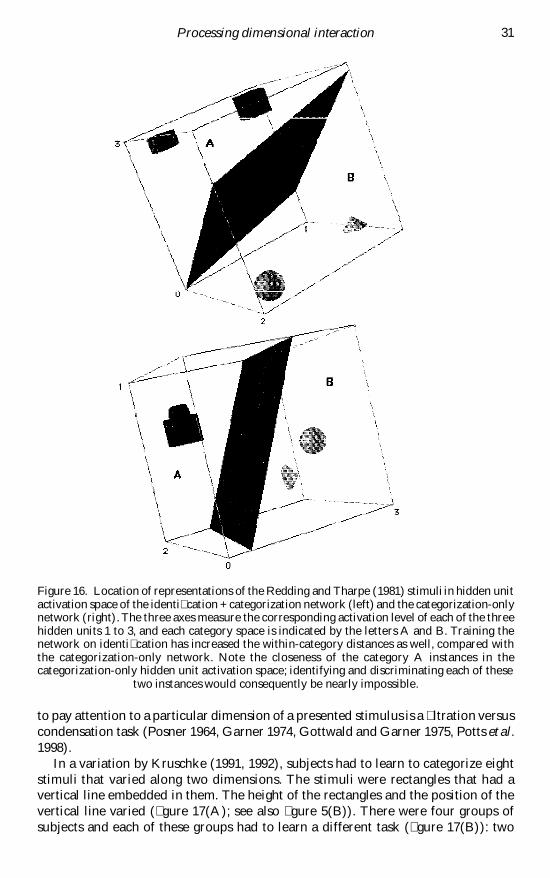
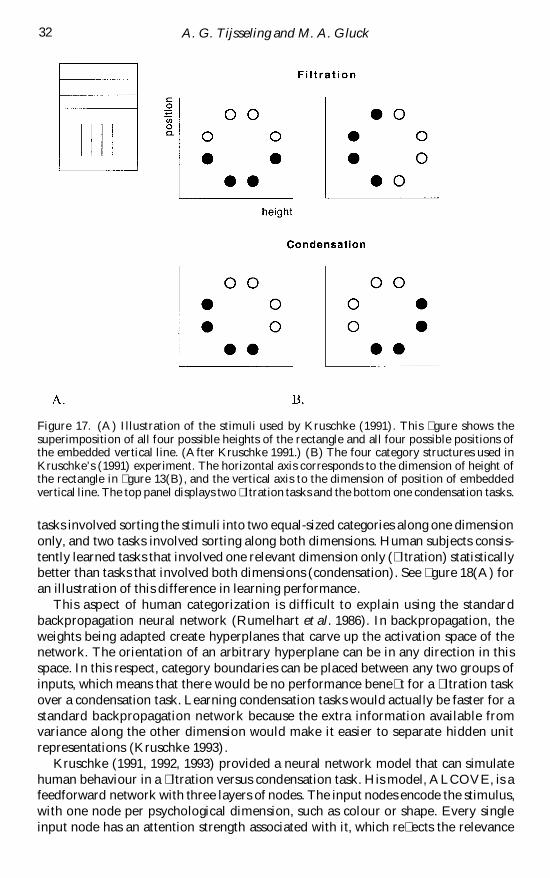
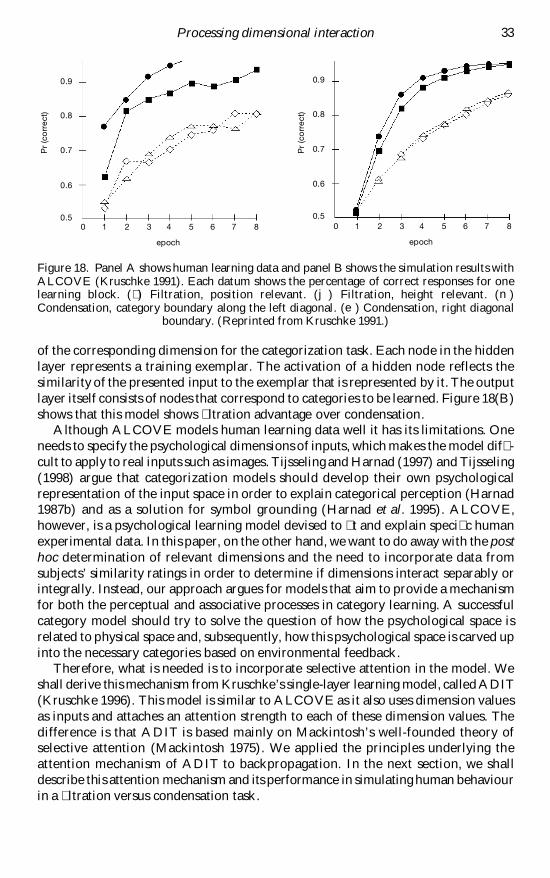
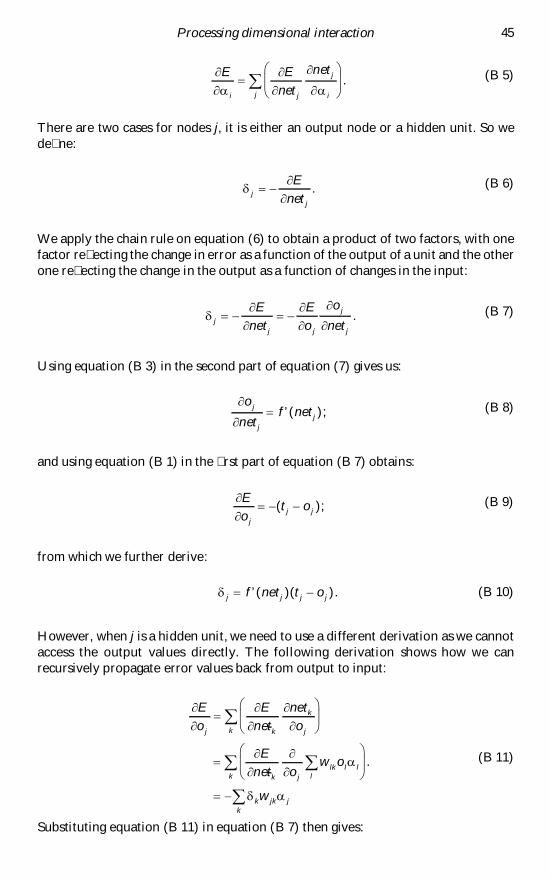