Embed Size (px)
Citation preview
A Constant-Feed Direct-Current Arc
GEOLOGICAL SURVEY BULLETIN 1084-J

A Constant-Feed Direct-Current ArcBy C. S. ANNELL and A. W. HELZ
CONTRIBUTIONS TO GEOCHEMISTRY
GEOLOGICAL SURVEY BULLETIN 1084-J
A study of methods for introducing samples into a d-c arc, accompanied by low fractional distillation
UNITED STATES GOVERNMENT PRINTING OFFICE, WASHINGTON : 1961
UNITED STATES DEPARTMENT OF THE INTERIOR
STEWART L. UDALL, Secretary
GEOLOGICAL SURVEY
Thomas B. Nolan, Director
For rale by the Superintendent of Documents, U.S. Government Printing Office Washington 25, D.G. - Price 15 cents (paper cover)
CONTENTS
PageAbstract__-..--_-_-_-_.---__-_-.-.___._._______._.____..___.__.. 231Introduction..-._--_.._-_.__._..--___........_._.____....._.._..._ 231Electrode design_________________________________________________ 232Sample admixtures._____.---__---__-___.__._.________._-____.___-_ 233
Untreated samples..____-_-__--._...__-_________.-...__.-_-..._ 233Sample-graphite mixtures._____________________________________ 234Addition of buffers and fluxes.---____--._.__......._....__.._... 235
Controlled atmospheres.___.--_-_-_-_.-_-____.__._._...-.__.______- 236Excitation...__.__..._....._._._.__..__._.__.____.___......_...... 245Tests of matrix influences on line intensity.... ________________________ 245
Spectrographic conditions and apparatus.____________---__--_____ 248Results................-.....-................-......._...._-. 250
References..._-_-_-_____________________--__-_______________-----. 250
ILLUSTRATIONS
PageFIGURE 32. Time-intensity plots of Si, Ge, Ti II, and Cu lines using 0.1-
inch-diameter deep-bore electrodes. A, bore depth 0.75 inch; B, bore depth 1.50 inches._._--_---_-_--___-_---- 234
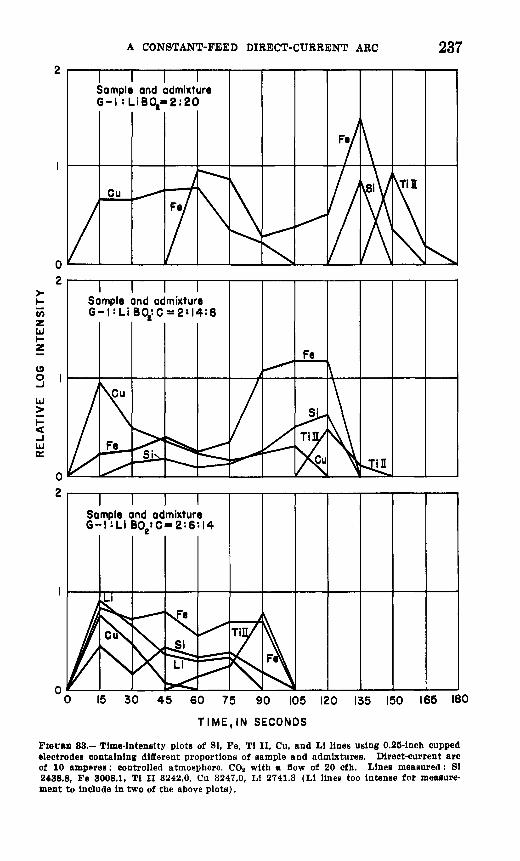
33. Time-intensity plots of Si, Fe, Ti II, Cu, and Li lines using 0.25-inch cupped electrodes containing different proportions of sample and admixtures.____._-_____-____--___-___-- 237
34. Time-intensity plots of Si, Fe, Ti II, Cu, and Li lines using deep-bore electrode No. 2 (bore depth 0.75 inch) containing different proportions of sample and admixtures._________ 238
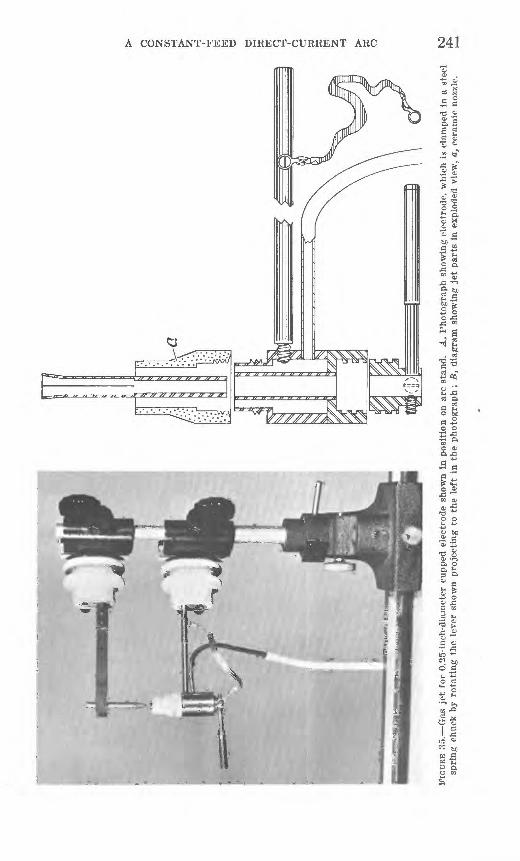
35. Gas jet for 0.25-inch-diameter cupped electrode. A, Photo graph showing electrode; B, diagram showing jet parts in exploded view._______._._._.____.____.__.__..._____-_ 241
36. Photograph of gas jet for 0.125-inch-diameter deep-bore con stant-feed electrode shown in position on arc stand. ______ 242
37. Diagram of gas jet shown in figure 36 mounted directly onoptical bench_______________________________________ 243
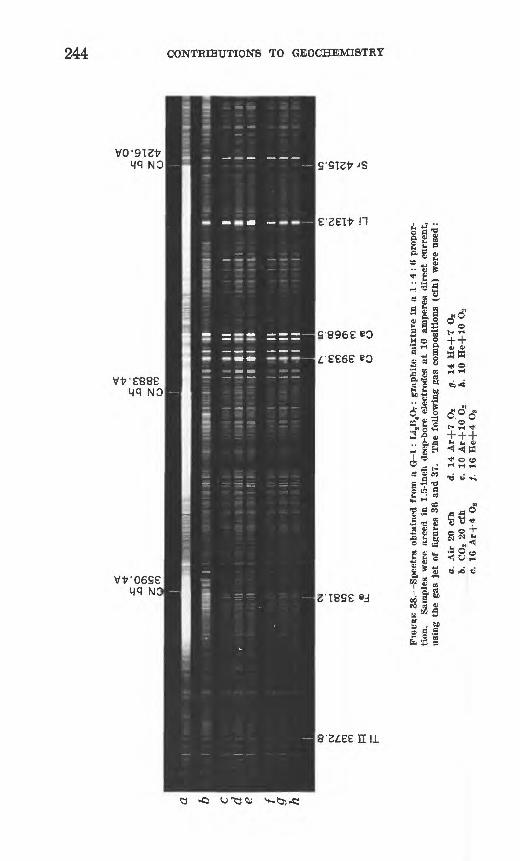
38. Spectra obtained from a G-1:LUB4 Of. graphite mixture arced in atmospheres of COg, Ar-Og, and He-Og gases using deep- bore electrodes-______________________________________ 244
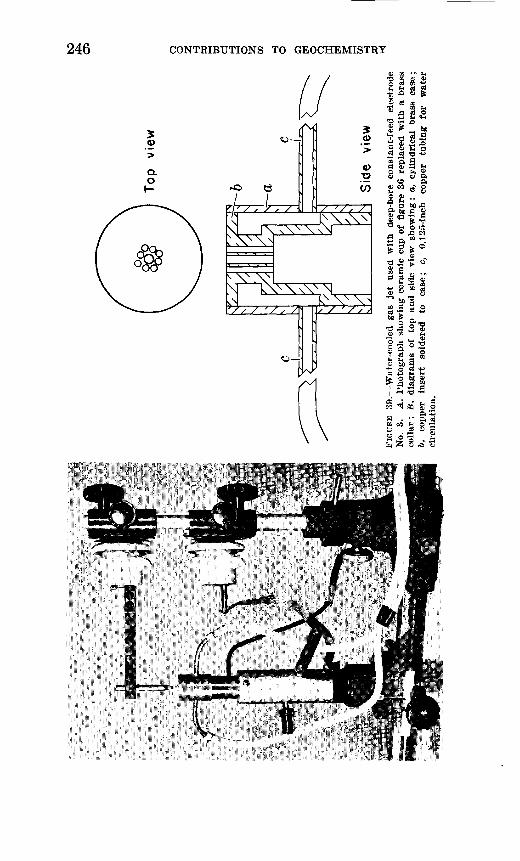
39. Water-cooled gas jet used with deep-bore constant-feed elec trode No. 3. A, Photograph showing ceramic cup of figure 36 replaced by brass collar; B, diagrams of top and side views. 246
40. Time-intensity plots of several elements using a gas-cooled and water-cooled jet with deep-bore constant-feed electrode No. 3._____________.________________________________ 247
ni
IV CONTENTS
TABLES
Page TABLE 1. Comparison of line intensities obtained with deep-bore electrode
and cupped electrode using various admixtures-___________ 2362. Precision test with d-c constant current and d-c constant voltage
power source._____.______-___--__-__-_-__--_-__-_--___. 2483. Matrix effects on Si, Al, Fe, Mg, Ti, and Ca in NaCl and ZrO2
matrices. ______________________________________________ 249
CONTRIBUTIONS TO GEOCHEMISTRY
A CONSTANT-FEED DIRECT-CURRENT ARC
By C. S. ANNELL and A. W. HELZ
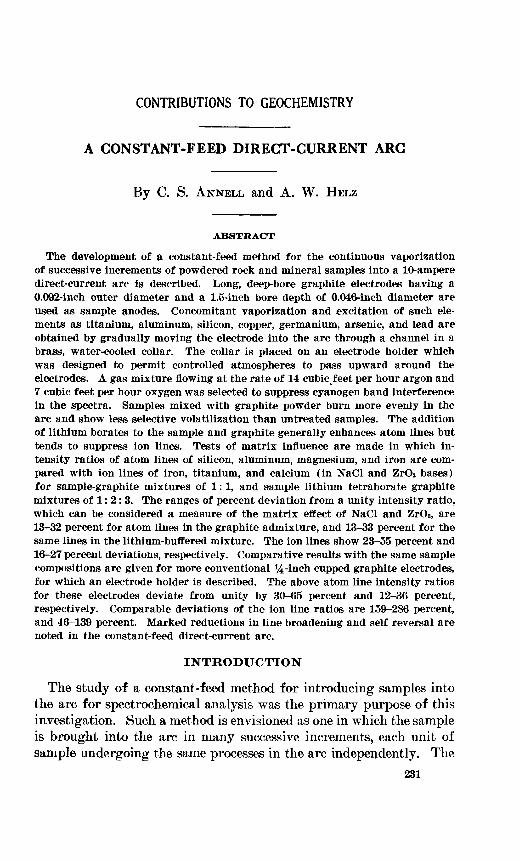
ABSTRACT
The development of a constant-feed method for the continuous vaporization of successive increments of powdered rock and mineral samples into a 10-ampere direct-current arc is described. Long, deep-bore graphite electrodes having a 0.092-inch outer diameter and a 1.5-inch bore depth of 0.046-inch diameter are used as sample anodes. Concomitant vaporization and excitation of such ele ments as titanium, aluminum, silicon, copper, germanium, arsenic, and lead are obtained by gradually moving the electrode into the arc through a channel in a brass, water-cooled collar. The collar is placed on an electrode holder which was designed to permit controlled atmospheres to pass upward around the electrodes. A gas mixture flowing at the rate of 14 cubic feet per hour argon and 7 cubic feet per hour oxygen was selected to suppress cyanogen band interference in the spectra. Samples mixed with graphite powder burn more evenly in the arc and show less selective volatilization than untreated samples. The addition of lithium borates to the sample and graphite generally enhances atom lines but tends to suppress ion lines. Tests of matrix influence are made in which in tensity ratios of atom lines of silicon, aluminum, magnesium, and iron are com pared with ion lines of iron, titanium, and calcium (in NaCl and ZrO2 bases) for sample-graphite mixtures of 1:1, and sample lithium tetraborate graphite mixtures of 1: 2: 3. The ranges of percent deviation from a unity intensity ratio, which can be considered a measure of the matrix effect of NaCl and ZrO2, are 13-32 percent for atom lines in the graphite admixture, and 13-33 percent for the same lines in the lithium-buffered mixture. The ion lines show 23-55 percent and 16-27 percent deviations, respectively. Comparative results with the same sample compositions are given for more conventional %-inch cupped graphite electrodes, for which an electrode holder is described. The above atom line intensity ratios for these electrodes deviate from unity by 30-65 percent and 12-36 percent, respectively. Comparable deviations of the ion line ratios are 159-286 percent, and 46-139 percent. Marked reductions in line broadening and self reversal are noted in the constant-feed direct-current arc.
INTRODUCTION
The study of a constant-feed method for introducing samples into the arc for spectrochemical analysis was the primary purpose of this investigation. Such a method is envisioned as one in which the sample is brought into the arc in many successive increments, each unit of sample undergoing the same processes in the arc independently. The
231
232 CONTRIBUTIONS TO GEOCHEMISTRY
attendant decrease in selective volatilization would possess several advantages (Ahrens, 1950, p. 68,85,115) :
1. The variations in average electron energies during the course of an exposure would be diminished.
2. Fewer internal standards would be suitable for a greater number of elements to be determined.
3. A proper buffer could be added to the sample and be present at arelatively constant rate throughout the arcing period.In the spectrochemical analysis of rocks and minerals large diversi
ties of chemical compositions and physical forms are handled. Ac curate analyses require standards similar to the samples analyzed. The work reported here is directed towards reducing the number of standards required and generalizing procedures to handle a larger variety of materials.
Methods directed toward accomplishing the above objectives and applicable to d-c arc excitation have been reported. Semenov (1956) describes the use of a "carbonized straw" of 0.9 mm outside diameter, 0.8 mm inside diameter, and 80 mm length, which contains the sample. This "straw" is fed into the arc through a hollow, water-cooled anode by a motor-driven "mechanism, the speed of which can be varied depending on the nature of the sample. A modification of this method is described by Noar (1957). A pellet is made from a mixture of sample, Li2CO8 , and cellulose powder. This pellet is fed into the arc by a motor-driven push rod, through a hollow carbon anode. Heat is conducted away from the electrodes by brass finned collars.
A method for introducing powdered ore samples between two carbon electrodes inclined 45° from the horizontal is described by Toishi (1940). Another method for introducing powdered samples directly into an a-c arc is described by Rusanov and Khitrov (1958). The work of Danielsson and Sundkvist (1959) illustrates the excellent precision obtainable when dissolution of the sample is combined with a constant-feed principle. In this report our investigations were confined to the use of powdered rock samples.
ELECTRODE DESIGN
Semenov's idea for introducing the sample into the arc seemed attractive but too complex for the routine handling of a large variety of samples. It was attempted in this study to determine whether an effective constant-feed action could be obtained with a long, thin electrode that would be relatively easy to load. Electrodes of the following dimensions (in inches) wefe cut from graphite rods 0.125 inch in diameter:
A CONSTANT-FEED DIRECT-CURRENT ARC 233
Dimensions of electrodes tested, in inchesElectrodes
No. 1 No. i No. SOutside diameter._...._......_....... 0.120 0.092 0.092Inside diameter......_.._........... .046 .046 .046Bore depth._______________________ .75 .75 1.50
Burning-behavior and moving-plate tests of different rock samples with and without admixtures were made with these electrodes and compared with conventional 0.25-inch-diameter, shallow-crater elec trodes similar to ASTM, S-8 (Am. Soc. Testing Materials, 1957, p. 38), herein designated as "cupped."
Electrode No. 1 showed progress toward the constant-feed prin ciple, but selective volatilization was still very apparent. The thinner walls of electrode No. 2 provided further improvement. The deeper bore electrode No. 3, as may be seen from figure 32, provided a longer period of uniform volatilization than electrode No. 2. Lines of a few elements having dissimilar excitation and vaporization properties are illustrated in figure 32.
Self reversal and line broadening (for example, Mg 2852.1) have been significantly reduced with the use of the deep-bore electrode. This gives further evidence of the benefit of the constant-feed process, whereby the concentration of any one atom species is more uniformly distributed throughout the arcing period.
SAMPLE ADMIXTURES
A few admixed buffers and (or) fluxes were tested with different samples to observe their effect on volatility, line intensity, and gen eral burning qualities. The choice of an admixture was guided by its (a) ability to maintain steadier excitation energies, (b) properties of reducing differences in the physical and chemical forms of mate rials, (c) convenience in handling, and (d) availability. A d-c arc of 9-10 amperes was used throughout these tests.
UNTREATED SAMPLES
When the sample was arced in either the cupped or the deep-bore electrodes, without any additive, the behavior of the arc appeared steady with most silicate rocks. When a sample of limestone (NBS standard sample la) was arced in a deep-bore electrode, diffusion of calcium through the electrode walls was noted. The anode burn ing spot would extend, periodically, a few millimeters below the crater tip along the side of the electrode.
If samples were arced in the electrodes without any additives, their moving-plate spectra showed extensive fractional distillation. This would occur with both erratically and smoothly burning samples.

CONTRIBUTIONS TO GEOCHEMISTRY
10 20 30 40 50 60
TIME, IN SECONDS
70 80 90
FIGURE 32. Time intensity plots of Si, Ge, Ti II, and Cu lines using 0.1-inch-diameter deep-bore electrodes. A, With electrode No. 2, bore depth 0.75 inch; B, with electrode No. 3, bore depth 1.50 inches. Electrodes contain a sample of W-l, LiBO2 +2 percent Ge (added as GeOJ, and graphite=l : 4 : 6. Direct-current arc of 10 amperes; controlled at
mosphere, argon-oxygen mixture with a rate of flow of 14 cfh Ar and 7 cfh O2. Lines measured: Si 2435.2, Ge 2533.2, Ti II 3251.0, Cu 3247.0.
SAMPLE-GRAPHITE MIXTURES
The addition of powdered graphite to a sample generally improves its burning properties in the arc (Kicard, 1954; Ahrens, 1950, p. 40). The silicate and limestone samples burned smoothly with a 1:1 sample- graphite mixture, although diffusion of the charge through the elec trode walls was still apparent. The diffusion problem was remedied when a gas jet was used in the arcing procedure, discussed below. The graphite aided in a more concomitant distillation of elements such as copper, titanium, sodium, aluminum, and silicon; but zirconium ap peared only toward the end of the period. Graphs illustrating the im provement of uniform volatilization with the addition of graphite are given in figure 33. The graphite powder, in addition to altering the physical characteristics of the sample charge, is responsible for a host of other chemical reactions during the arcing period (Leuchs, 1950).
A CONSTANT-FEED DIRECT-CURRENT ARC 235
Moving-plate spectra of the granite standard G-l (Fairbairn and others, 1951) with powdered graphite in a 1:1 mixture showed more fractional distillation when the cupped electrodes were used than when the deep-bore electrodes were used. However, the differences in the fractional distillation observed with the two types of electrodes decreased when larger proportions of graphite (G-l :graphite= 1:1Q) were mixed with the G-l.
ADDITION OF BUFFERS AND FLUXES
Compound tested ReferencesLi2CO3____________. Harvey, 1947, p. 22; Weaver and Brattain, 1949LiBO2_____________ Hasler, 1953Li2B4O7____________ Tingle and Matocha, 1958LisGeOa___________. NoneGeO2______________. Frisque, 1957 ; Jaycox, 1958B2O3 ____________- Gillette and others, 1954
The above materials were tested for effectiveness as buffers by mix ing in various concentrations with powdered rock samples both with and without graphite. The d-c arc was used in a controlled atmosphere of carbon dioxide flowing at the rate of 20 cfh (cubic feet per hour). References show their use in other analytical methods.
The Li2CO3 gave unsteady burning with occasional bursts of par ticles into the arc, which was caused by the carbon dioxide generated from its decomposition. The GeO2 and LiaGeOs1, in mixtures with the sample and powdered graphite, generally gave enhancement of spectral lines as compared to sample-graphite mixtures. The last two columns of table 1 give the results for a mixture of G-l: Li2GeO3 : graphite= 2:6:14 relative to a mixture of G-l :graphite=2:4. A G-l :Li2GeO3 : graphite= 2:14:6 mixture, not shown in the table, gave less intense spectra than the 2:6:14 mixture when arced in either type of elec trode. The entire spectrum, in general, was very weak when both deep-bore electrodes and cupped electrodes were used with Li2GeO3 or GeO2 mixtures not containing graphite. An exception was noted in the LiBO2-sample mixtures, where most lines were enhanced when arced with the cupped electrodes.
The Li 2GeO3 mixtures had a tendency to cause spattering of par ticles, possibly due to water inclusions or adsorbed moisture, and the GeO 2 mixtures resulted in rather heavy background. The B2O 3 mixtures burned very steadily, but line enhancement was only slightly greater than with plain graphite mixtures. In addition, a rather heavy background was created, partly caused by BO band emission.
1 Prepared by fusing 1 part Li2CO, and 1.5 parts GeO 2 with an oxygen-natural gas flame in a platinum crucible. The material was crushed and ground in a boron carbide mortar.
236 CONTRIBUTIONS TO GEOCHEMISTRY
The more promising burning and buffering properties of the lithium borates lead to extended testing.2 The relative intensities for some selected lines are listed in table 1, in which results are reported for G-l in lithium borate-graphite mixtures with both the cupped elec trode and 0.75-inch deep-bore electrode No. 2.
TABLE 1. Comparison of line intensities obtained with deep-bore electrode and cupped electrode using various admixtures
[Intensities are relative to that obtained with G-l :C-2:4]
Line
Si 2486.2.............Al 2676.1............Fe II 2698.4..... ..Mg II 2802.7.........Mg 2862.1. ..........Fe 8047.6.. ..........Till 3088.0 .......Call 3179,3... ......Cu 3247.6............Li...................
lonizationpotential,
ev
7.86 7.81
6.81 6.09
6.37
Excitation potential,
ev i
0. 78-6. 86 .01-4.81 .05-4.80
0 -4.40 0 -4.33
. 09-4. 14
. 05-4. 06 3. 14-7. 02 0 -3.80
O-l:LiB08 :C-2:6:14
0.76-ln. deep-bore electrode
1.10 1.30 .93 .60
3.03 1.01 1.08 1.90 1.34
Cupped elec trode
1.30 6.39 .86
(») (") 1.96 .66
1.16 1.17
Q-l:LiBOa:C-2:14:6
0.76-in. deep-bore electrode
2.42 4.28 .89
1.67 8.76 1.28 .65
2.24 2.14
Cupped elec trode
0.936.48 .68
( ) ( ) 3.48
.68
.88 Bands
O-liLijOeOjtC -2:0:14
0.76-ln deep-bore electrode
1.78 2.39 1.12 .86
4.18 1.46 .96
1..66 2.22
Cupped elec trode
0.94 1.43 .84
(") (')
1.89 .86
1.03 1.09
i Moor, 1946, I960,1962. Too dark, slightly denser in graphite.> Too dark, considerably denser in LiBOj.
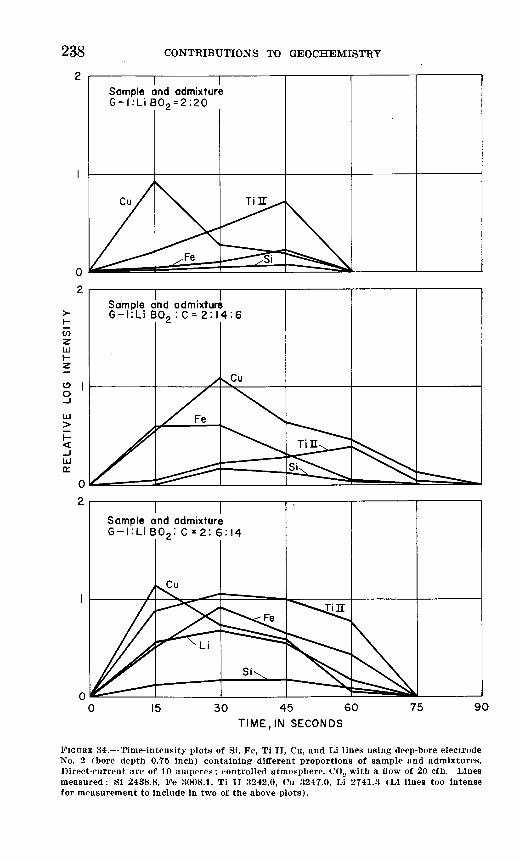
Moving-plate spectrograms of several sample, buffer, and graphite mixtures emphasize the role graphite plays in reducing the tendency for fractional distillation when using the cupped electrode (fig. 33). Similar tests with deep-bore electrode No. 2 showed less differentiation owing to the better control of volatilization (fig. 34). The use of the deep-bore electrode No. 3 with a water-cooled jacket around the elec trode further minimized volatility differences (figs. 38 and 39).
Subsequent tests with commercially available Li2B4O7 gave results similar to LiBO2 and showed less tendency to absorb moisture from the air. This provided greater ease in handling the materials during the weighing and mixing operations.
CONTROLLED ATMOSPHERES
Eeferences to the use of controlled atmospheres have been made in the above tests. The use of an open jet, which directed flowing gases upward along the sides of the long-bore electrodes, had contributed to a stabler arc and reduction in diffusion of the charge through the walls of the electrodes.
Earlier work with controlled atmospheres had led to the use of carbon dioxide with an open-end cylindrical tube. In addition to
* Lithium borate was prepared by fusing 1 part Li8CO8 and 1.7 parts HaBO3 using a platinum crucible In a muffle furnace at 1000°C. The fused material was ground In a boron carbide mortar.
A CONSTANT-FEED DIRECT-CURRENT ARC 237
I I I ISample and admixture 6-1 :LiB02-2:20
enZ UJ
UJ>
i i rSample and admixture G-1 = Li B0e:
Sample and admixture 6-l«LIBOt»C-2:6!l4
15 30 45 60 75 90 105 120 135 150 165 180
TIME,IN SECONDS
FIGURE 83.- Time-Intensity plots of SI, Fe, Tl II, Cu, and LI lines using 0.25-lnch cupped electrodes containing different proportions of sample and admixtures. Direct-current arc of 10 amperes; controlled atmosphere, CO2 with a flow of 20 cf h. Lines measured: SI 2438.8, Fe 3008.1, Tl II 3242.0, Cu 3247.0, LI 2741.3 (LI lines too Intense for measure ment to Include In two of the above plots).
CONTRIBUTIONS TO GEOCHEMISTRY
Sample and admixture -|:Li B0 2 =2:20
Sample and admixture G-t:Li
Sample and admixture G-l:Li B0 2 : C = 2: 6:14
30 45 60
TIME.IN SECONDS
FIGURE 34. Time-intensity plots of Si, Fe, Ti II, Cu, and Li lines using deep-bore electrode No. 2 (bore depth 0.75 inch) containing different proportions of sample and admixtures. Direct-current arc of 10 amperes; controlled atmosphere, CO0 with a flow of 20 cf h. Lines measured: Si 2438.8, Fe 3008.1. Ti II 3242.0, Cu 3247.0, Li 2741.3 (Li lines too Intense for measurement to include in two of the above plots).
A CONSTANT-FEED DIRECT-CURRENT ARC 239
stabilizing the arc and cooling the sides of the electrodes, the exclusion of nitrogen from the arc plasma suppresses cyanogen band interfer ence. The cyanogen region from approximately 3500 A to 4200 A contains numerous sensitive atom and ion lines that could be used for analytical purposes.
The jets used here and described below are different from the Stall- wood design (1954) in that, for the work reported here, the gas is not directed as much against the electrode for cooling. They are not suggested as a substitute for the very promising Stallwood principle. The initial purpose of the jets used in this report was to eliminate the cyanogen band spectra in as simple a way as possible. Subsequent developments indicated, however, that the jet is indispensable for the long electrode.
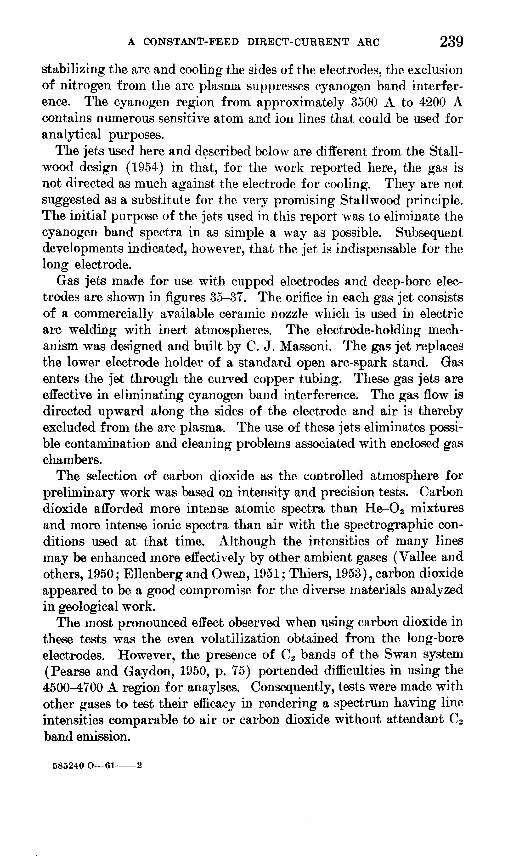
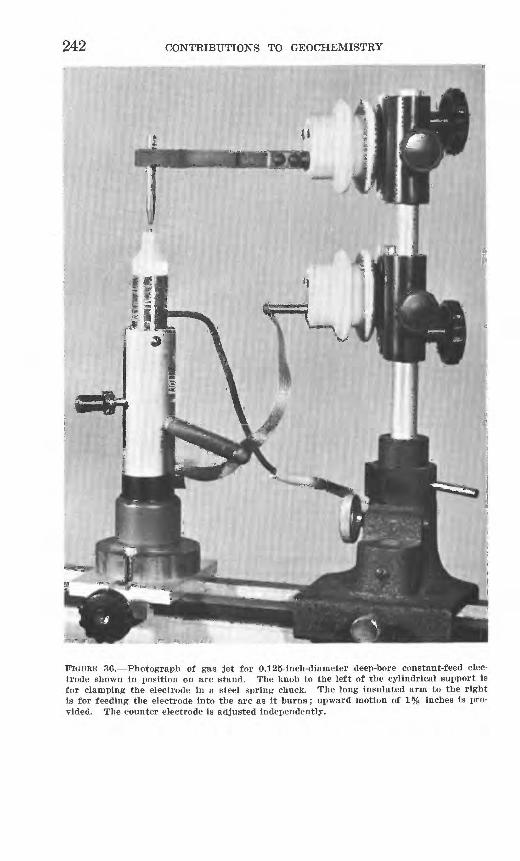
Gas jets made for use with cupped electrodes and deep-bore elec trodes are shown in figures 35-37. The orifice in each gas jet consists of a commercially available ceramic nozzle which is used in electric arc welding with inert atmospheres. The electrode-holding mech anism was designed and built by C. J. Massoni. The gas jet replaces the lower electrode holder of a standard open arc-spark stand. Gas enters the jet through the curved copper tubing. These gas jets are effective in eliminating cyanogen band interference. The gas flow is directed upward along the sides of the electrode and air is thereby excluded from the arc plasma. The use of these jets eliminates possi ble contamination and cleaning problems associated with enclosed gas chambers.
The selection of carbon dioxide as the controlled atmosphere for preliminary work was based on intensity and precision tests. Carbon dioxide afforded more intense atomic spectra than He-O2 mixtures and more intense ionic spectra than air with the spectrographic con ditions used at that time. Although the intensities of many lines may be enhanced more effectively by other ambient gases (Vallee and others, 1950; Ellenberg and Owen, 1951; Thiers, 1953), carbon dioxide appeared to be a good compromise for the diverse materials analyzed in geological work.
The most pronounced effect observed when using carbon dioxide in these tests was the even volatilization obtained from the long-bore electrodes. However, the presence of C2 bands of the Swan system (Pearse and Gay don, 1950, p. 75) portended difficulties in using the 4500-4700 A region for anaylses. Consequently, tests were made with other gases to test their efficacy in rendering a spectrum having line intensities comparable to air or carbon dioxide without attendant C2 band emission.
585240 O 61 2
240 CONTRIBUTIONS TO GEOCHEMISTRY
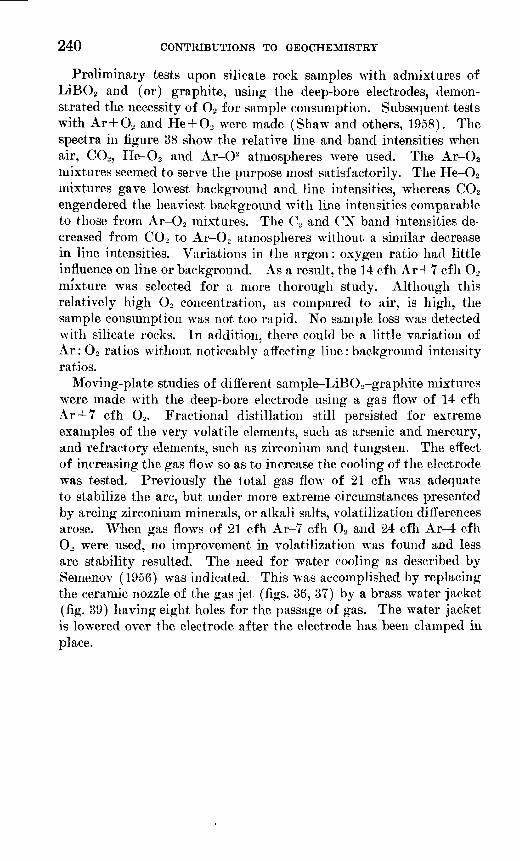
Preliminary tests upon silicate rock samples with admixtures of LiBO2 and (or) graphite, using the deep-bore electrodes, demon strated the necessity of O2 for sample consumption. Subsequent tests with Ar + O2 and He+O2 were made (Shaw and others, 1958). The spectra in figure 38 show the relative line and band intensities when air, CO2, He-O 2 and Ar-O2 atmospheres were used. The Ar-O2 mixtures seemed to serve the purpose most satisfactorily. The He-O2 mixtures gave lowest background and line intensities, whereas CO2 engendered the heaviest background with line intensities comparable to those from Ar-O2 mixtures. The C2 and CN band intensities de creased from CO2 to Ar-O 2 atmospheres without a similar decrease in line intensities. Variations in the argon: oxygen ratio had little influence on line or background. As a result, the 14 cfh Ar+ 7 cfh O2 mixture was selected for a more thorough study. Although this relatively high O2 concentration, as compared to air, is high, the sample consumption was not too rapid. No sample loss was detected with silicate rocks. In addition, there could be a little variation of Ar: 02 ratios without noticeably affecting line: background intensity ratios.
Moving-plate studies of different sample-LiBO2-graphite mixtures were made with the deep-bore electrode using a gas flow of 14 cfh Ar + 7 cfh O2 . Fractional distillation still persisted for extreme examples of the very volatile elements, such as arsenic and mercury, and refractory elements, such as zirconium and tungsten. The effect of increasing the gas flow so as to increase the cooling of the electrode was tested. Previously the total gas flow of 21 cfh was adequate to stabilize the arc, but under more extreme circumstances presented by arcing zirconium minerals, or alkali salts, volatilization differences arose. When gas flows of 21 cfh Ar-7 cfh O2 and 24 cfh Ar-4 cfh O2 were used, no improvement in volatilization was found and less arc stability resulted. The need for water cooling as described by Semenov (1956) was indicated. This was accomplished by replacing the ceramic nozzle of the gas jet (figs. 36, 37) by a brass water jacket (fig. 39) having eight holes for the passage of gas. The water jacket is lowered over the electrode after the electrode has been clamped in place.
A CONSTANT-FEED DIRECT-CURRENT ARC 241
.5 o O V
i. -w -t->O bjo
a) 5
s£ & p§ &. si
H .S
242 CONTRIBUTIONS TO GEOCHEMISTRY
FIGURE 36. Photograph of gas jet for 0.125-inch-diameter deep-bore constant-feed elec trode shown in position on arc stand. The knob to the left of the cylindrical support is for clamping the electrode in a steel spring chuck. The long insulated arm to the right is for feeding the electrode into the arc as it burns; upward motion of 1 % inches is pro vided. The counter electrode is adjusted independently.
A CONSTANT-FEED DIRECT-CURRENT ARC 243
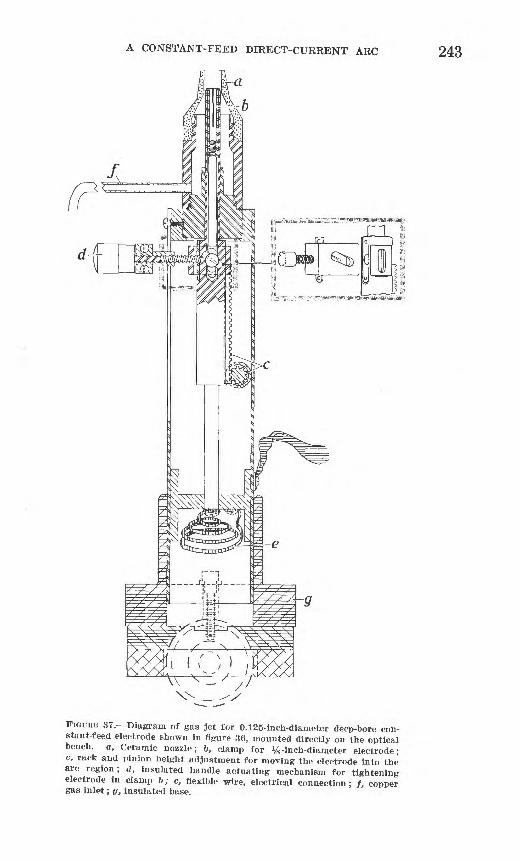
FIGURE 37. Diagram of gas jet for 0.125-inch-diameter deep-bore con stant-feed electrode shown in figure 36, mounted directly on the optical bench, a, Ceramic nozzle; 6, clamp for % -inch-diameter electrode; c, rack and pinion height adjustment for moving the electrode into the arc region; d, insulated handle actuating mechanism for tightening electrode in clamp b; e, flexible wire, electrical connection ; J, copper gas inlet; g, insulated base.
244 CONTRIBUTIONS TO GEOCHEMISTRY
a -o
A CONSTANT-FEED DIRECT-CURRENT ARC 245
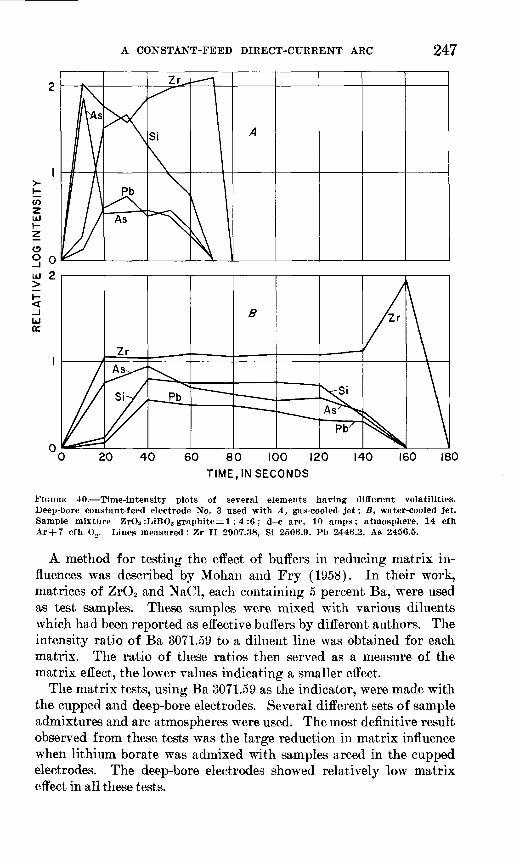
A test sample was prepared in which oxides of silicon, lead, and arsenic were added in minor quantities to a zirconium oxide base. This sample was used to demonstrate the advantage of the water- cooled jet in approaching the desired constant-feed effect (fig. 40).
EXCITATION
In addition to the conventional 10-ampere, resistance-controlled, d-c power source for the arc, a high-voltage a-c arc and a constant-current d-o arc (Green and Kyper, 1940) were tested. The a-c arc was not studied further when moving-plate results indicated volatilization behavior similar to the higher current d-c arc. Complete sample con sumption with the a-c arc also required much longer exposures. It is believed, however, that the potentialities of this type of source have not been fully exploited.
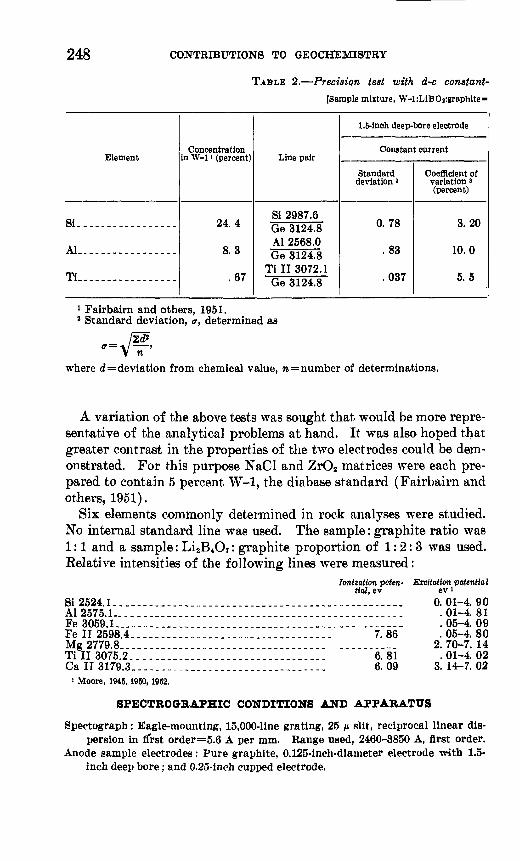
Table 2 is a summary of the precision obtained with the two d-c arc controls, using two kinds of sample electrodes. Twenty replicate ex posures were made with each electrode, using each power source at 10 amperes direct current. Spectrographic, photographic, and densito- metric conditions are the same as given on p. 248. The coefficients of variation and standard deviations for Si, Al, and Ti in diabase W-l (Fairbairn and others, 1951) were determined using germanium as an internal standard. A 2-percent concentration of Ge in LiBO2 was prepared by fusing GeO2 with Li2CO3 and HSBO3 . (See footnote 1, p. 2.35.) No advantage in using either source with the deep-bore electrode was found. However, regardless of the power source used, greater precision for titanium was obtained with the deep-bore electrode than with the cupped electrode. Similar conclusions are in dicated by matrix tests (table 3).
TESTS OF MATRIX INFLUENCE ON LINE INTENSITY
The tests to this point have been attempts to select the best of a few possible spectrographic variables that contribute toward the constant- feed principle. Qualitative studies of volatilization behavior and burning characteristics have been used for selection of the long-bore electrode, L1BO2 buffer (Li 2B407 used later), graphite admixture, and controlled atmosphere. The tests in this section serve to demon strate the extent to which these variables contribute in minimizing the ever-present matrix influences.
246 CONTRIBUTIONS TO GEOCHEMISTRY
A CONSTANT-FEED DIRECT-CURRENT ARC 247
20 40 60 80 100 120 140 160 180
TIME, IN SECONDS
FIGURE 40. Time-intensity plots of several elements having different volatilities. Deep-bore constant-feed electrode No. 3 used with A, gas-cooled jet; B, water-cooled jet. Sample mixture ZrO2 :LiBO2 graphite=l: 4 :6; d-c arc, 10 amps; atmosphere, 14 cfh Ar + 7 cfh O 2. Lines measured: Zr II 2907.38, Si 2506.9, Pb 2446.2, As 2456.5.
A method for testing the effect of buffers in reducing matrix in fluences was described by Mohan and Fry (1958). In their work, matrices of ZrO2 and NaCl, each containing 5 percent Ba, were used as test samples. These samples were mixed with various diluents which had been reported as effective buffers by different authors. The intensity ratio of Ba 3071.59 to a diluent line was obtained for each matrix. The ratio of these ratios then served as a measure of the matrix effect, the lower values indicating a smaller effect.
The matrix tests, using Ba 3071.59 as the indicator, were made with the cupped and deep-bore electrodes. Several different sets of sample admixtures and arc atmospheres were used. The most definitive result observed from these tests was the large reduction in matrix influence when lithium borate was admixed with samples arced in the cupped electrodes. The deep-bore electrodes showed relatively low matrix effect in all these tests.
248 CONTRIBUTIONS TO GEOCHEMISTRY
TABLE 2. Precision test with d-c constant-
[Sample mixture, W-liLiBOjigraphlte-
Element
Q{
Al
Ti.................
Concentration In W-l i (percent)
24. 4
8.3
.67
Line pair
Si 2987.6Ge 3124.8 Al 2568.0Ge 3124.8
Ti II 3072.1Ge 3124.8
1.5-inch deep-bore electrode
Constant current
Standard deviation '
0.78
.83
.037
Coefficient of variation 3 (percent)
3.20
10.0
5.5
1 Fairbairn and others, 1951.2 Standard deviation, y, determined as
where d= deviation from chemical value, n= number of determinations.
A variation of the above tests was sought that would be more repre sentative of the analytical problems at hand. It was also hoped that greater contrast in the properties of the two electrodes could be dem onstrated. For this purpose NaCl and ZrO2 matrices were each pre pared to contain 5 percent W-l, the diabase standard (Fairbairn and others, 1951).
Six elements commonly determined in rock analyses were studied. No internal standard line was used. The sample: graphite ratio was 1:1 and a sample: Li2B4O7 : graphite proportion of 1:2:3 was used. Relative intensities of the following lines were measured:
Si 2524.1. ... Al 2575.1... . Fe 3059.1... . Fe II 2598.4. Mg 2779.8... Ti II 3075.2. Ca II 3179.3.
lonization poten- Excitation potential tial, ev ev'
............ 0.01-4.90
._---.--.-.. .01-4.81 . 05-4. 09 . 05-4. 80
2. 70-7. 14 6.81 6.09
7.86
. 01-4. 02 3. 14-7. 02
Moore, 1945, 1950, 1952.
SPECTEOGBAPHIC CONDITIONS AND APPABATUS
Spectograph: Eagle-mounting, 15,000-line grating, 25 n slit, reciprocal linear dis persion in first order=5.6 A per mm. Range used, 2460-3850 A, first order.
Anode sample electrodes: Pure graphite, 0.125-inch-diameter electrode with 1.5- inch deep bore; and 0.25-inch cupped electrode.
A CONSTANT-FEED DIRECT-CURRENT ARC 249
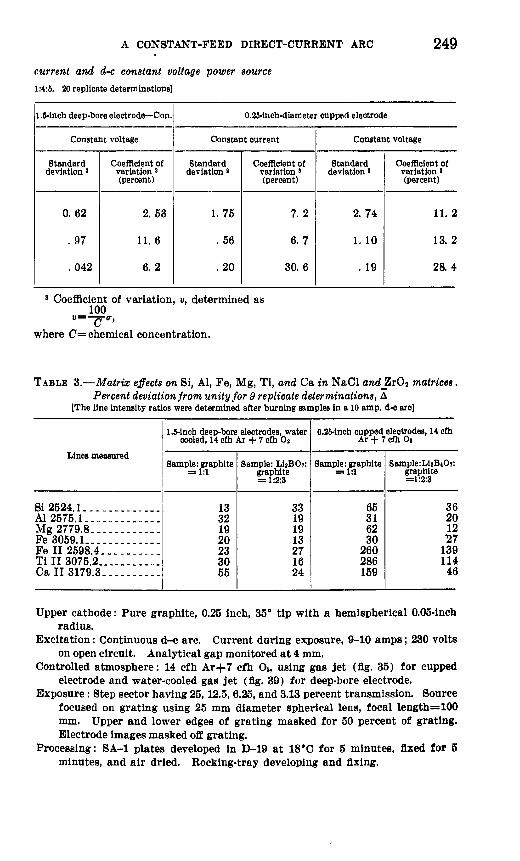
current and d-c constant voltage power source
1:4:5. 20 replicate determinations]
1,5-inch deep-bore electrode Con.
Constant voltage
Standard deviation *
0.62
.97
. 042
Coefficient of variation » (percent)
2. 53
11.6
6.2
0.25-inch-diameter cupped electrode
Constant current
Standard deviation 3
1.75
.56
.20
Coefficient of variation ' (percent)
7.2
6.7
30. 6
Constant voltage
Standard deviation '
2.74
1. 10
. 19
Coefficient of variation ' (percent)
11.2
13. 2
28.4
8 Coefficient of variation, u, determined as100 »=-£-*>
where C= chemical concentration.
TABLE 3. Matrix effects on Si, Al, Fe, Mg, Ti, and Ca in NaCl andZrOz matrices,Percent deviation from unity for 9 replicate determinations, A
[The line Intensity ratios were determined after burning samples in a 10 amp. d-c arc]
Lines measured
Si 2524.1.............Al 2575.1. ............Mg 2779.8. ...........Fe 3059.1. ............Fe II 2598.4.. ........Till 3075.2...........Ca II 3179.3-.-.-.....
1.5-lnch deep-bore electrodes, water cooled, 14 cfh Ar + 7 cfh 03
Sample: graphite
13 32 19 20 23 30 55
Sample: LljBO?: graphite = 1:2:3
33 19 19 13 27 16 24
0.25-inch cupped electrodes, 14 cfh Ar + 7 cfh Oj
Sample: graphite
65 31 62 30
260 286 159
SampleiLljBiO?: graphite =1:2:3
36 20 12 "27
139 114 46
Upper cathode: Pure graphite, 0.25 inch, 35" tip with a hemispherical 0.05-inchradius.
Excitation: Continuous d-c arc. Current during exposure, 9-10 amps; 230 voltson open circuit. Analytical gap monitored at 4 mm.
Controlled atmosphere: 14 cfh Ar+7 cfh O2, using gas jet (flg. 35) for cuppedelectrode and water-cooled gas jet (flg. 39) for deep-bore electrode.
Exposure: Step sector having 25,12.5, 6.25, and 3.13 percent transmission. Sourcefocused on grating using 25 mm diameter spherical lens, focal length=100mm. Upper and lower edges of grating masked for 50 percent of grating.Electrode images masked off grating.
Processing: SA-1 plates developed in D-19 at 18 C C for 5 minutes, fixed for 5minutes, and air dried. Rocking-tray developing and fixing.
250 CONTRIBUTIONS TO GEOCHEMISTRY
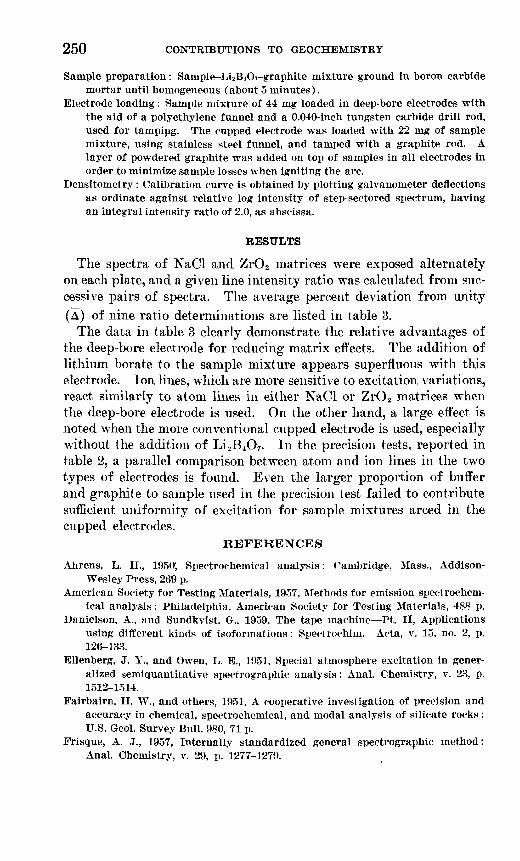
Sample preparation: Sample-LiaB^T-graphite mixture ground in boron carbide mortar until homogeneous (about 5 minutes).
Electrode loading: Sample mixture of 44 mg loaded in deep-bore electrodes with the aid of a polyethylene funnel and a 0.040-inch tungsten carbide drill rod, used for tamping. The cupped electrode was loaded with 22 mg of sample mixture, using stainless steel funnel, and tamped with a graphite rod. A layer of powdered graphite was added on top of samples in all electrodes in order to minimize sample losses when igniting the arc.
Densitometry: Calibration curve is obtained by plotting galvanometer deflections as ordinate against relative log intensity of step-sectored spectrum, having an integral intensity ratio of 2.0, as abscissa.
RESULTS
The spectra of NaCl and ZrO2 matrices were exposed alternately on each plate, and a given line intensity ratio was calculated from suc cessive pairs of spectra. The average percent deviation from unity (A) of nine ratio determinations are listed in table 3.
The data in table 3 clearly demonstrate the relative advantages of the deep-bore electrode for reducing matrix effects. The addition of lithium borate to the sample mixture appears superfluous with this electrode. Ion lines, which are more sensitive to excitation variations, react similarly to atom lines in either NaCl or ZrO 2 matrices when the deep-bore electrode is used. On the other hand, a large effect is noted when the more conventional cupped electrode is used, especially without the addition of Li 2B 4O7 . In the precision tests, reported in table 2, a parallel comparison between atom and ion lines in the two types of electrodes is found. Even the larger proportion of buffer and graphite to sample used in the precision test failed to contribute sufficient uniformity of excitation for sample mixtures arced in the cupped electrodes.
REFERENCES
Ahrens, L. H., 1950; Spectrochemical analysis: Cambridge, Mass., Addison-Wesley Press, 269 p.
American Society for Testing Materials, 1957, Methods for emission spectrochem-ical analysis: Philadelphia, American Society for Testing Materials, 488 p.
Danielson, A., and Sundkvist, G., 1959, The tape machine Pt. II, Applicationsusing different kinds of isoformations: Spectrochim. Acta, v. 15, no. 2, p.126-133.
Ellenberg, J. Y., and Owen, L. E., 1951, Special atmosphere excitation in gener alized semiquantitative spectrographic analysis: Anal. Chemistry, v. 23, p.1512-1514.
Fairbairn, H. W., and others, 1951, A cooperative investigation of precision andaccuracy in chemical, spectrochemical, and modal analysis of silicate rocks:U.S. Geol. Survey Bull. 980, 71 p.
Frisque, A. J., 1957, Internally standardized general spectrographic method:Anal. Chemistry, v. 29, p. 1277-1279.
A CONSTANT-FEED DIRECT-CURRENT ARC 251
Gillette, J. M., Boyd, B. R., and Shurkus, A. A., 1954, Spectrochemical determina tion of metallic elements in nonmetallic samples: Appl. Spectroscopy, v. 8, p. 162-168.
Green, L. C., and Kyper, J. B. H., 1940, Constant current sources: Rev. Sci. Instruments, v. 11, p. 250-256.
Harvey, C. E., 1947, A method of semi-quantitative spectrographic analysis: Glendale, Calif., Applied Research Laboratories, 285 p.
Hasler, M. F., 1953, Quantometry in 1952: Spectrochim. Acta, v. 6, p. 69-79.Jaycox, E. K., 1958, Quantitative Spectrochemical methods of broad applicabil
ity : Appl. Spectroscopy, v. 12, p. 87-89.Leuchs, Ottmar, 1950, Chemische Vorgange in Kohleelektroden: Spectrochim.
Acta, v. 4, p. 237-251.Mohan, P. V., and Fry, D. L., 1958, A semi-quantitative universal method of
Spectrochemical analysis : Appl. Spectroscopy, v. 12, p. 90-95.Moore, C. E., 1945, A multiplet table of astrophysical interest (two parts) :
Princeton, N. J., Princeton Univ. Observatory, pt. 1, 110 p.; pt. 2, 96 p. 1950, An ultraviolet multiplet table: U.S. Natl. Bur. Standards Circ. 488,
sec. 1, 78 p. 1952, An ultraviolet multiplet table: U.S. Natl. Bur. Standards Circ. 488,
sec. 2,115 p. Noar, J., 1957, An apparatus for the excitation of powders in the direct-current
arc: Spectrochim. Acta. v. 9, p. 157-158. Pearse, R. B. W., and Gaydon, A. G., 1950, The identification of molecular spectra :
2d ed., New York, John Wiley and Sons, 276 p.Ricard, Raymond, 1954, The carbon effect in the spectrographic analysis of re
fractory materials : Appl. Spectroscopy, v. 8, p. 75-80. Rusanov, A. K., and Khitrov, V. G., 1958, Spectrographic analysis of ores by
introducing the powder into the arc in a stream of air: Spectrochim. Acta,v. 10, p. 404-418.
Semenov, N. N., 1956, Sposoby vvedeniia poroshkov v dugovoi razriad pri spectral'nom analize (Methods of feeding powders to arc discharge in spectrographicanalysis) : Zavodskaya laboratoriya, no. 4, p. 457-462.
Shaw, D. M., Wickremasinghe, O., and Yip, C., 1958, A simple device for theSpectrochemical analysis of minerals in an inert atmosphere using theStallwood jet: Spectrochim. Acta, v. 13, p. 197-201.
Stallwood, B. J., 1954, Air-cooled electrodes for the Spectrochemical analysis ofpowders : Optical Soc. America Jour., v. 44, p. 171-176.
Thiers, R. E., 1953, The advantages of controlled atmospheres for arc spec-troscopy : Appl. Spectroscopy, v. 7, p. 157-163.
Tingle, W. H., and Matocha, C. K., 1958, Spectrochemical analysis of nonmetallicsamples : Anal. Chemistry, v. 30, p. 494-498.
Toishi, Kenzo, 1940, Some Spectrochemical methods for the assay of minerals,and applications of these to gold ores: lust. Phys. Chem. Research [Tokyo],Sci. Papers, v. 38, p. 87-99.
Vallee, B. L., Reimer, C. B., and Loofbourow, J. R., 1950, The influence of argon,helium, oxygen, and carbon dioxide on emission spectra in the d.-c. arc:Optical Soc. America Jour., v. 40, p. 751-754.
Weaver, J. R., and Brattain, R. R., 1949, A common matrix system of spectre- chemical analysis : Anal. Chemistry, v. 21, p. 1038-1041.
O


![Modelling of Electric Arc Welding: arc-electrode coupling · 2017. 11. 22. · ion ionization energy [eV] h enthalpy [J] h p Planck constant (6:626 10 34)[Js] I electric current [A]](https://img.pdfslide.net/doc/110x75/60e49d7dc02364733d0d44f3/modelling-of-electric-arc-welding-arc-electrode-coupling-2017-11-22-ion-ionization.jpg)