Embed Size (px)
Citation preview

Austenitic and Bi-Metallic Weld Inspection I
A Contribution of Phased Array Ultrasonic Technology (PAUT) to Detection and Sizing Stress
Corrosion Cracks P. Ciorau,* Ontario Power Generation, Canada; C. Chartier, K. Mair, Acuren, Canada;
ABSTRACT
The paper presents technical issues related to stress corrosion cracks (SCC) detected and sized by
PAUT. SCC with height between 3 mm to 15 mm were detected and sized in the following
components: welds with thickness of 9 mm, bolts at depth 21 and 63 mm, Siemens-Parson blade roots,
GEC Alstom rotor steeple hook. A SOHIC (stress oriented hydrogen-induced crack) is also displayed
and height evaluation is estimated. Comparison with fracture mechanics, grinding measurement and
optical is also presented. PAUT is capable to size cracks within ± 1 mm, with an under sizing trend.
Technical recommendations are also made for optimizing the PAUT parameters in sizing the last
significant tip (branch) of SCC.
Keywords: PAUT, SCC, SOHIC, crack height, welds, blade roots, rotor steeple groove, bolt
INTRODUCTION
The development and commissioning of portable phased array ultrasonic instrument by OlympusNDT
(R/D Tech) in 2003[1]
contributed to a new phase in crack detection and sizing in different turbine
components, welds and bolts in petrochemical industry. Now the crack is visualized and sized in
sectorial scan (S-scan), which combines a number of A-scans with a continuous fine-grade sweeping
angles. The crack facets are “hit” by a multitude of angles. Narrow focus beam provide an increased
signal-to-noise ratio of the back-scattering signals. Crack height, location and orientation are unique
displayed in S-scan. Our previous published papers [2-5] concluded the cracks are reliable displayed and
sized within ± 1 mm. New findings in petrochemical, pipe lines and turbine inspections are presented
in this paper. The goal of this paper is to assess the stress corrosion crack (SCC) pattern, crack height
and its location and orientation in parts with complex geometry, or in welds with limited access or
SCC colonies. It is well-known the branches of SCC are random and conventional UT undersized the
cracks by 2-3 mm. Can PAUT do a better job in SCC display and height sizing?
The following topics will be covered:
• Detection and sizing SCC in turbine components
• Detection and sizing SOHIC in pressure vessels shell-retire for cause sample
• Detection and sizing SCC in bolt
• Detection and sizing colonies of cracks in welds
Crack height evaluated by PAUT is compared with optical, fracture mechanics and with grinding
measurements. A PAUT – “actual” correlation graph is also presented.
SCC Sizing on Turbine Components
SCC detection and sizing on turbine components is presented for three events: R10 blade roots-
Siemens – Parson (2 cases) and GEC Alstom rotor steeple – hook 1 – one case.
Side technique in L-waves and shear waves were used for the first two cases (see Figure 1). Cracks
were detected and sized by PAUT and they were confirmed by magnetic particles. Crack depth and
length were evaluated by fracture mechanics (see Figure 2 to Figure 4).

Figure 1 - Detection and sizing of SCC on platform by L-waves of 10 MHz probe.
Figure 2 - Example of length and height sizing of SCC in a blade root by T-waves.

Figure 3 - Data comparison between MP, PAUT and fracture mechanics for SCC on a blade root.
Figure 4 - Example of data comparison for SCC detected by PAUT, confirmed by MP, and
measured by fracture mechanics.
SCC in hook 1 was detected by L-waves of 10 MHz probe. The crack branches were displayed in S-
scan zoomed mode (see Figure 5).
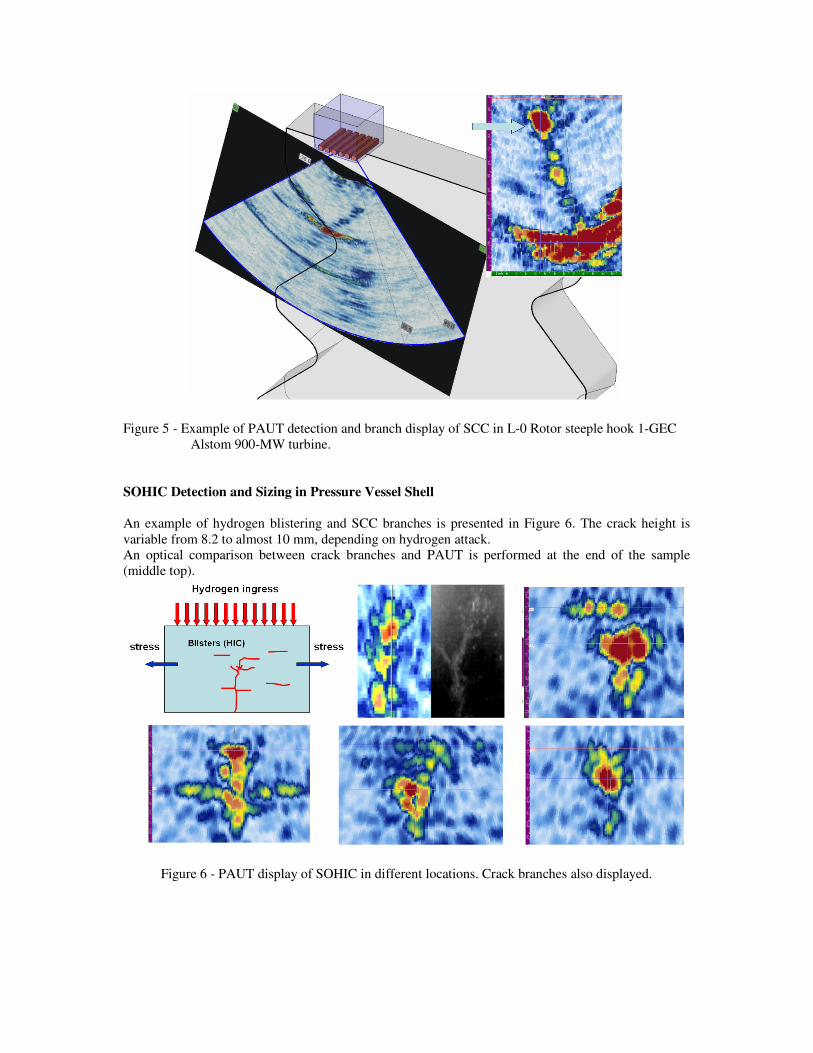
Figure 5 - Example of PAUT detection and branch display of SCC in L-0 Rotor steeple hook 1-GEC
Alstom 900-MW turbine.
SOHIC Detection and Sizing in Pressure Vessel Shell
An example of hydrogen blistering and SCC branches is presented in Figure 6. The crack height is
variable from 8.2 to almost 10 mm, depending on hydrogen attack.
An optical comparison between crack branches and PAUT is performed at the end of the sample
(middle top).
Figure 6 - PAUT display of SOHIC in different locations. Crack branches also displayed.

SCC Sizing in Bolt
SCC height and branches in a bolt with multiple SCC could be displayed as presented in Figure 7 to
Figure 9.
Figure 7 - Detection principle and SCC locations in a bolt.
Figure 8 - Detection, sizing and SCC branches display for shear waves (left) and longitudinal waves;
SCC depth = 22 mm. Crack height = 4.3 mm.
Deeper SCC could be detected and sized only by 10 MHz L-waves probes. The crack height is about 6
mm, as presented in Figure 9.
Figure 9 - Detection and sizing of SCC in a bolt located at depth = 59 mm. SCC height = 5.0 mm

SCC Sizing on Welds
Figure 10 to Figure 12 present the capability of PAUT to size SCC in the welds or in HAZ with height
≥ 3 mm. Shear waves were capable to display the SCC branches (see Figure 13).
Figure 10 - Principle of PAUT detection and sizing (left) and a sample with SCC cut for confirmation.
Figure 11 - Example of shallow SCC detection, location and sizing on sample from Figure 10.
Figure 12 - Example of SCC PAUT display for a stressed corner of a spray nozzle. SCC branches
displayed in a zoomed inset.

Figure 13 - Examples of SCC sizing by PAUT using shear waves. SCC branches are indicated by red
arrows (left and middle) and crack branches after destructive testing (right).
CONCLUDED REMARKS
PAUT proved to be a very powerful tool in detecting, sizing and fine-resolution display of SCC
branches. The resolution of 0.2-0.5 degrees combined with a depth focusing on crack tips provides a
unique image of crack morphology.
For most of applications with t < 40 mm, SCC with height > 2 mm are detected and sized. SCC with
height > 4 mm are characterized for multiple branches. A combination of L- and T-waves is used in
turbine components inspections and for sizing SCC in the bolts, at different depth. The PAUT
capability and overall correlation between SCC height and fracture mechanics is presented in Figure
14.
Figure 14 - PAUT capability for detection, sizing and branches display (left) and height correlation
between PAUT and fracture mechanics for SCC with height 2.5 – 12 mm.
PAUT is undersizing by 0.5 – 0.8 mm SCC with height between 2.5 – 12 mm. PAUT is doing a better
job compared to conventional UT: focusing, pattern, orientation and fine-grading angular height
sizing. If needed, dynamic depth focusing may display crack features all along its height.
Some recommendations: The SCC branches are better displayed by L-waves of 10-12 MHz. Use
depth focusing on crack tips with fine angular resolution (0.1-0.2 degrees). Use angles within -30 to 30
degrees. The best display is between -8 to + 8 degrees. Calibrate the PAUT on a retire-for-cause piece,
so the velocity and attenuation is known. Use a lateral scanning over the crack; for a short crack
length; it will give you the shape and the maximum height. Move slowly the probe over the crack (if
feasible) to optimize the sizing capability. Keep in mind the crack last significant tip is very difficult to
be displayed. Add +1 mm for a conservative ECA in your reporting.
ACKNOWLEDGEMENTS
The authors wish to thank OPG-IM&CS and Acuren Management for granting the publication and
presentation of this paper.
REFERENCES
1) Langlois, P., Ciorau, P., Macgillivray, D. :” Technical Assessment and Field Application of
Portable 16-pulser Phased Array Instrument” – 3-rd EPRI PA Seminar, Seattle, June 2003
2) Ciorau, P.:” A Contribution to Detection and Sizing Linear Defects by Conventional and
Phased Array Ultrasonic Techniques” 16-th WCNDT, Montreal, Aug 30-Sept.03, 2004;
3) Ciorau, P.:”A Practical Proposal for Designing, Testing and Certification Phased Array Probes
Used in Nuclear Applications”. 4-th Int. NDE. Nuclear Conf, London, Dec, 2004
4) Ciorau, P., Daks, W., Gray, D.:” Phased Array Ultrasonic Technology Contribution to
Engineering Critical Assessment (ECA) of Economizer Piping Welds”-ndt.net –vol. 11, no.5
(May 2006) /6th NDE Nucl Conf.-Budapest-Oct.2007
5) Ciorau, P.:” A Contribution to Crack Sizing by Phased Array Ultrasonic Techniques. Part 2:
Comparison with Optical, Magnetic Particles, Fracture Mechanics and Metallography for Last
Significant Crack Tip”.
ndt.net – vol.12,n.2 (Feb 2007) /6th
NDE Nucl. Conf.-Budapest-Oct.2007
6) Ciorau, P., Pullia, L.:” How Reliable is Your Call? OPG Phased Array Ultrasonic Inspection
Experience on Siemens- Parson Turbine Blade Roots 2001-2007”- ndt.net – vol. 12, no. 6
(June 2007) / 10-th EPRI Turbine Workshop-Phoenix-Aug.13-15-2007
* = corresponding author


![Non€¦ · and common NDT techniques. Keywords: Non-intrusive inspection [NII], Phased array ultrasonic testing [PAUT], Fitness – for – service [FFS], Computed radiography [CR],](https://img.pdfslide.net/doc/110x75/6039bfe787aa56292402f29d/non-and-common-ndt-techniques-keywords-non-intrusive-inspection-nii-phased.jpg)