Embed Size (px)
Citation preview

Fisheries Research Division Western Australian Fisheries and Marine Research Laboratories PO Box 20 NORTH BEACH, Western Australia 6920
Fisheries Occasional Publication No. 109, 2012
A correlation study of the potential risk factors associated
with white shark attacks in Western Australian waters
November 2012

ii Fisheries Occasional Publication No. 98, 2012
Department of Fisheries3rd floor SGIO Atrium168-170 St George’s TerracePERTH WA 6000Telephone: (08) 9482 7333Facsimile: (08) 9482 7389Website: www.fish.wa.gov.auABN: 55 689 794 771
Published by Department of Fisheries, Perth, Western Australia. Fisheries Occasional Publication No. 109, November 2012.ISSN: 1447 - 2058 ISBN: 978-1-921845-50-5

Shark Correlation Study i
Contents Executive Summary ................................................................................................................................ 1
White Shark attacks have increased. ................................................................................................... 1
Summary of Outcomes. ...................................................................................................................... 1
Most White Shark attacks occur offshore. .......................................................................................... 1
White Shark attacks aren’t site specific. ............................................................................................. 1
White Sharks prefer cooler water. ....................................................................................................... 2
White Shark attacks can happen at any time of day. ........................................................................... 2
Sharks don’t care about the weather. .................................................................................................. 2
Conclusion. ......................................................................................................................................... 2
Background ............................................................................................................................................. 3
Methods .................................................................................................................................................. 3
Results ..................................................................................................................................................... 4
1. Time (attacks per calendar/ financial and pooled years) ............................................................ 4
2. Time with population effect (per capita attack rate) .................................................................. 4
3. Location ..................................................................................................................................... 4
4. Activity and Distance from Shore .............................................................................................. 5
5. Proximity to Seal and Sea Lion Colonies .................................................................................. 5
7. Season ........................................................................................................................................ 6
8. Day of the Week ........................................................................................................................ 6
9. Time of Day ............................................................................................................................... 6
10. Air Temperature ......................................................................................................................... 7
11. Water Temperatures ................................................................................................................... 7
12. Solar Exposure/Light Conditions ............................................................................................... 7
13. Rain ............................................................................................................................................ 7
14. Wind Speed ................................................................................................................................ 7
15. Wind Direction ........................................................................................................................... 8
16. Wave Height .............................................................................................................................. 8
17. Number of other people in water ............................................................................................... 8
Conclusion .............................................................................................................................................. 9
Next Steps ............................................................................................................................................... 9

ii Fisheries Occasional Publication No. 109, 2012

Shark Correlation Study 1
Executive Summary
White Shark attacks have increased.
The incidence of White Sharks attacks (while still very low) has slowly increased over the past two decades at a rate faster than human population growth. This trend has been exceeded recently with an unprecedented number of attacks (5) occurring within the last year from September 2011. The Department of Fisheries has reviewed all the attacks recorded in Western Australia for the past 20 years and compared these with conditions at the time to identify any common patterns.
Summary of Outcomes.
Factors examined and patterns identified that can help inform ocean users about the relative risks they face when entering the water.
Higher Risk Neutral Lower Risk
Offshore (> 30 m from coastal shore) Time of Day Near Shore (< 30m from coastal shore)
Winter/Spring Air Temperature Summer/Autumn
Cooler Water (< 20o C) Weather – light, rain and wind conditions
Warmer Water (> 22o C)
Deeper Water (> 5 m depth) Shallow Water (< 5m depth)
Near whale carcasses and other potential attractants including seal/sea lion colonies
Most White Shark attacks occur offshore.
Attacks are more likely to occur offshore, in deeper waters. Of the 26 shark attacks in Western Australia, only one has occurred close (< 30 m) to the shore. The highest number of attacks has occurred more than a kilometre offshore with SCUBA divers and snorkelers (44%) having the highest incidence followed by surfers and sea kayakers (37%). Swimmers, despite being the most numerous users of the ocean have comprised the smallest number of attacks.
White Shark attacks aren’t site specific.
Attacks have occurred around most of the southern half of the Western Australian coast with the majority occurring in the greater Perth region down to Margaret River. This pattern is consistent with the distribution of water based activities around this part of the Western Australian coast.
The data do not show a clear increase in incidences of attack near seal and sea lion colonies. However, as White Sharks are known to attack seals and sea lions caution should be exercised in such locations.

2 Fisheries Occasional Publication No. 109, 2012
White Sharks prefer cooler water.
Although overall water usage is highest during the summer and autumn, more shark attacks have occurred in winter and spring. This pattern is consistent with White Sharks being a temperate (cooler water) species. Relatively few attacks have occurred in waters above 22o C, most have occurred in waters below 20o C.
The winter and spring period also corresponds with whale migration season. While this may be coincidental, White Sharks are known to feed on whales so caution should be exercised near a whale carcass or other such attractant.
White Shark attacks can happen at any time of day.
There was no evidence to suggest that the risk of White Shark attack was greatly increased at dawn or dusk. Most attacks occurred in the middle of the day and data from tagged sharks show that they are active at all times.
Sharks don’t care about the weather.
There is no specific pattern of weather conditions coinciding with higher levels of attack. The incidence of attacks is not limited to calm, overcast days.
Conclusion.
The evidence suggests the risk of attack by White Sharks remains very small, but it has increased slowly over the past two decades with an unprecedented number of attacks occurring during the 12 months from September 2011.
The relative risk of White Shark attack appears to be higher for activities undertaken further offshore from the coast, particularly when these are undertaken in cooler waters (< 20o C). Activities undertaken in shallow water close to the mainland, and especially when the water is relatively warm (> 22o C), appear to have the lowest relative risk. There will, however, always be some risk of shark attack when undertaking activities in any marine waters.
These findings will be used to assist future policy decisions on White Shark attacks, including the determination of factors that may constitute an imminent threat of attack. The findings will also form part of the community education campaign.

Shark Correlation Study 3
Background
In November 2011, in response to a number of shark attack fatalities in Western Australia, the State Government announced a series of initiatives designed to help reduce the risk of shark attacks for people undertaking water based activities in the WA marine environment. This included a series of research projects to be undertaken over three years to improve knowledge about white shark behaviour and their interactions with the WA public.
One of the research projects was designed to undertake analyses of the data available on attacks attributed to white sharks within Western Australia to assess if there were any specific factors associated with different types, location, conditions or timing of water based activities that may potentially increase or decrease the risk of such attacks. These correlation based analyses were aimed at determining whether improved guidance could be provided to the WA public for use in evaluating their personal risk profiles when considering undertaking activities in the marine environment
Methods
All the data associated with each of the white shark attacks recorded within Western Australia have been examined in detail. Much of the data on shark attacks within Western Australia was obtained from the Australian Shark Attack File which has been compiled by staff at the Taronga Park Zoo in Sydney for over 30 years.
While the Shark Attack File is recognized as the best source of such information in Australia, the data were not always comprehensive due to the nature of the events. In some cases there was not complete certainty that a white shark was the species involved and for many recorded attacks the shark attack file did not have complete information on variables such as water temperature or wind strength. To facilitate the most complete assessments possible missing data were obtained from other sources such as the Bureau of Meteorology and the Department of Transport.
Using the collated set of data, a series of correlation and/or graphical analyses was undertaken. It must be noted that given the small size of the dataset available, it was difficult in some cases to conclusively examine each of the related factors and generate definitive conclusions. In such cases it was therefore determined whether a particular factor should remain as being plausible. Furthermore, the analyses only covered attacks by white sharks, the study did not extend to the examination of attacks by other species of shark (e.g. tiger or whaler) or where the species could not be identified with a reasonable degree of certainty.

4 Fisheries Occasional Publication No. 109, 2012
Results
1. Time (attacks per calendar/ financial and pooled years)
Statistical Test – Yes
Significance Yes - P < 0.05
Despite the high variability in the numbers of attacks between years there has been a significant increasing trend in the annual incidence of attacks since 1995 (Figure 1a). It is also of note that since 2008, attacks have occurred every year. The highest number of attacks occurred in calendar year 2004 but the highest number in a twelve month period was the period July 2011 – June 2012 (Figure 1b). The increase in incidence during the past 20 years is clearer when data are pooled into two year blocks (Figure 1c).
2. Time with population effect (per capita attack rate)
Statistical Test – Yes
Significance Yes - P < 0.05 (pooled)
There has been an increasing trend (P = 0.07) in the annual rate of attacks (expressed as the number of attacks per 1 million residents of Western Australian) since 1995. When the data are pooled into two year blocks to deal with zero values, the trend becomes statistically significant (P = 0.02). The annual rate has increased from 0.4 per million in 1995/96 to 1 per million 2010/11 with what appear to be runs of two or three years where there are slightly higher or lower rates. The rate for 2011-12 was, however, approximately double the long term trend at 2 per million.
This suggests that the risk of attack has been increasing through this 20 year period beyond that expected from human population growth. Furthermore last year’s rate was well above this trend. Investigations into the long term trend, the cycles and the recent spike in attacks are currently underway.
3. Location
Statistical Test – Graphical only
Significance - Yes
The majority of attacks in WA have occurred in the region extending from the broader Perth area in the north down the lower west coast to approximately Margaret River (Figure 3). Given that white sharks occur along all of the southern WA coast and occasionally at least as far north as Karratha, the distribution of attacks appears strongly related to where the majority of the population resides and therefore where the highest levels of water activities are being undertaken. The pattern also probably reflects differences in where white sharks are more likely to occur along the WA coast.
White sharks are a temperate, cooler water species that occasionally move into warmer waters. The southern coast of WA is therefore presumably closer to the centre of the distribution of the western population of white sharks which is most likely to be in South

Shark Correlation Study 5
Australian waters. The risk of a random encounter with a white shark, and therefore of the potential for an attack by this species, is higher along the south and lower west coasts of Western Australia than off the mid-west and north west coasts.
Differences among years in oceanographic conditions are also expected to be associated with inter-annual variations in white shark abundance in the regions along the WA coast. Any quantification of this, however, would be reliant on the further data being collected through research activities such as the shark monitoring (tagging) program and a more detailed investigation of the oceanographic data across this 20 year period which are both part of the next phase of this study.
4. Activity and Distance from Shore
Statistical Test: Graphical
Significance - Yes
Most attacks have occurred further than 30 m from the mainland shore (i.e. Rottnest Island, the Abrolhos Islands and other islands are considered offshore in this context), with only one attack occurring less than 30 m offshore of the mainland coast (Figure 4). This is opposite to where the majority of water activities (i.e. swimming) generally occurs.
Attacks more commonly involve divers/snorkelers (44%) and surfers/kayakers (37%) with swimmers accounting for the remaining 11% of attacks. These differences among activities are most likely to be strongly related to variations in the distance offshore and the depth of water where these different activities occur rather than the specific activity, with swimming generally occurring much closer to shore in shallow water where the risk of attack appears to be lower (based on relative number of swimmers vs. numbers of divers/surfers).
It is noted that at some locations and times there will be more surfers and divers than swimmers. During winter more people tend to surf than swim and divers are more common in waters further offshore than where swimming and surfing typically occur. Therefore activity and location are not independent variables and there are insufficient data to fully discriminate between these factors.
5. Proximity to Seal and Sea Lion Colonies
Statistical Test – Yes
Significance – Remains Plausible
The number of attacks in close proximity (<5 km) of pinniped colonies was less than the number of attacks that occurred 5-9 km away from colonies with collectively more attacks having occurred > 10 km away (Figure 5).
There has only been one white shark attack in the area of highest seal density (the Recherché Archipelago). However, these results may reflect relatively lower levels of human water activity in these regions. Therefore it remains plausible that there is an increased risk of attack near these colonies.

6 Fisheries Occasional Publication No. 109, 2012
7. Season
Statistical Test- Graphical
Significance - Yes
More attacks have occurred in the winter and spring periods compared to summer and autumn (Figure 6a). This is opposite to the time when the highest level of water usage occurs especially when the highest numbers of people are swimming. More surfers were attacked in winter, but the rates of surfing can be higher during this time due to favourable swell conditions. Of the four attacks on swimmers, three were in spring, and one in autumn but the highest number of swimmers would be in summer.
The distribution and movements of white sharks will lead to seasonal changes in their relative abundance off different regions of the WA coast which may also be a factor in seasonal attack rates. The validated commercial fishery and research data indicate that winter and spring are the times when there is generally a higher abundance of white sharks in south-western Australia (Figure 6 b).
These data, in combination with the time when the highest number of attacks have occurred, do not support the commonly held notion that the shark season is late spring – early summer.
8. Day of the Week
Statistical Test - Yes
Significance – Not when pattern of use is considered
Although attacks have occurred on every day of the week, most of the attacks have occurred on either a Saturday (37%) or a Sunday (22%). This is consistent with the expected pattern of water based activities being greater during the weekend.
9. Time of Day
Statistical Test – Yes
Significance - No
Contrary to popular belief that dawn and dusk are periods of higher risk of shark attack, white shark attacks have occurred at all times of the day (Figure 8a). Only 24% of recorded attacks have occurred near dawn and dusk (12% within 1 hour of both sunrise and sunset). Outside of these two periods, more attacks occurred in the morning (48%) than in the afternoon (28%). This pattern looks to be consistent with the relative levels of human activity across these different time periods.
Therefore, there is no evidence that water activities at dusk and dawn pose a significantly greater risk than at other times of the day. Importantly, there is no time of day that appears to be associated with a materially lower risk of attack than other times of the day.
Data from tagged white sharks indicate they are active during both day and night (Figure 8b). These data do not show a period during the day (except close to midnight) when detection levels are low. That no attacks have been recorded at night is most likely a reflection of human activity patterns as there is relatively minimal night-time water activity.

Shark Correlation Study 7
10. Air Temperature
Statistical Test – Yes
Significance - No
Attacks occurred across the normal range of air temperatures for south-western WA (Figure 9). The higher rates of attack at air temperatures between 12 – 18o C are likely to reflect the fact that more attacks tend to occur in winter/spring and in the mornings, with few attacks to the north of Perth.
11. Water Temperatures
Statistical Test – Yes
Significance – P < 0.05 Yes
The frequency of attacks appears to decrease with increasing water temperature, with 67% of attacks having occurred in waters below 20o C and only one has occurred above 22o C (Figure 10). The observed relationship is consistent with white sharks being a temperate species that are generally distributed in cooler waters but are known to occur in waters with temperatures of 10 – 25o C. An increased abundance of white sharks in cooler waters is supported by other validated research data and the higher incidences of attacks off the southern half of the WA coast (Figure 3) and also in winter (Figure 6).
12. Solar Exposure/Light Conditions
Statistical Test – Yes
Significance - No
The analysis of light conditions when attacks have occurred (Figure 11) did not find strong evidence that the prevalence of attacks was increased on days of lower light levels (overcast). The data does not therefore support the notion that an attack is more likely in overcast conditions.
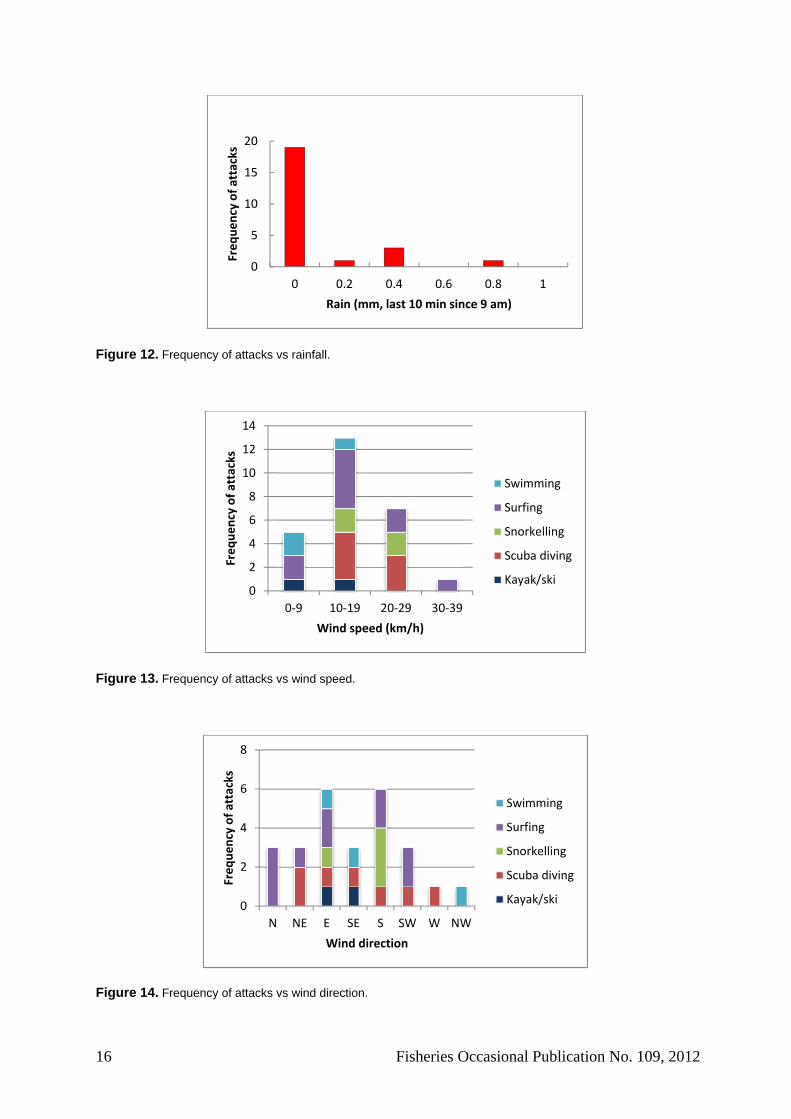
13. Rain
Statistical Test – Graphical
Significance - No
The majority (79%) of attacks occurred when the weather was fine (Figure 12). This does not support the notion that attacks are more prevalent in overcast or “gloomy” conditions. The highest numbers of attacks occurred on days of no rain which is likely to be related to the preference for people to undertake water activities when the weather is fine.
14. Wind Speed
Statistical Test – Yes
Significance - No
Due to the geographic extent over which attacks have occurred throughout southern WA, there is no meaningful way to derive a range of “usual” wind conditions against which to

8 Fisheries Occasional Publication No. 109, 2012
assess the white shark attack data. Attacks appear to occur across the range of wind speeds where water activities would be occurring. The results do not support the concept of more attacks occurring in calm conditions. The decline in attacks at wind speeds > 20 km/hr is likely to reflect less water activities would be occurring in these unfavourable water conditions.
15. Wind Direction
Statistical Test – Yes
Significance – Could not determine
As with wind speed, it is difficult to generate an average pattern of wind direction against which to compare the conditions experienced at times of white shark attacks across the state. Using the wind pattern at Perth for a single year as a proxy for ‘usual’ wind direction, suggests that a higher proportion of attacks than would randomly be expected occurred when the wind was from the east, with a lower proportion when it was from the west and north-west. This pattern may reflect human activity patterns, with more activity expected to occur when conditions are more favourable, which for the lower west coast region often coincides with periods of easterly wind direction.
16. Wave Height
Statistical Test – Yes
Significance – Yes
There was a clear negative relationship between the number of attacks and significant wave height (Figure 15). Attacks were less common when wave heights exceeded 3 m. This is possibly related to fewer water based activities occurring in rough conditions, although this generality may be confounded by surfers preferring larger waves and divers/snorkelers/swimmers preferring calmer conditions.
Most attacks on surfers occurred at more than 2 m wave height, whereas most attacks on SCUBA divers and snorkelers occurred when the wave height was less than 2 m. This indicates susceptibility across a wide range of sea conditions but also that the different activities are relatively more prevalent in different conditions.
17. Number of other people in water
Statistical Test – No
Significance – Uncertain
Reliable values for the numbers of people (other than the victim) that were in the water in the vicinity of shark attacks are only available for 21 of the 27 white shark attacks recorded in Western Australia since 1995. On 14 occasions (67%), there were less than three people in the water.
It is difficult to ascertain from these data whether the risk of being attacked by a shark is higher or lower when there are many or few people in the water. The numbers of people in the water at one time is likely to be influenced by a range of factors and is confounded with the type of water activity being undertaken, i.e. divers will generally only be in small groups

Shark Correlation Study 9
compared to surfers and swimmers. There were too few data to discriminate among the groups.
Conclusion
The evidence suggests that while the risk of attack by White Sharks remains very small, it has increased slowly over the past two decades but with an unprecedented number of attacks occurring during the 12 months from September 2011.
The relative risk of White Shark attack appears to be higher for activities undertaken further offshore from the coast, particularly in cooler waters (< 20o C). Activities undertaken in shallow water close to the mainland, and especially when the water is relatively warm (> 22o C), appear to have the lowest relative risk. There will, however, always be some risk of shark attack when undertaking activities in any marine waters.
Table 1 Summary of Outcomes. Factors examined and patterns identified that can help inform ocean users about the relative risks they face when entering the water.
Higher Risk Neutral Lower Risk
Offshore (> 30 m from coastal shore) Time of Day Near Shore (< 30m from coastal shore)
Winter/Spring Air Temperature Summer/Autumn
Cooler Water (< 20o C) Weather – light, rain and wind conditions
Warmer Water (> 22o C)
Deeper Water (> 5 m depth) Shallow Water (< 5m depth)
Near whale carcasses and other potential attractants including seal/sea lion colonies
These findings will be used to assist future policy decisions on White Shark attacks, including the determination of factors that may constitute an imminent threat of attack. The findings will also form part of a community education campaign.
Next Steps
Studies have been initiated to investigate the factors that may be associated with the upwards trend in the rate of attacks over the past 20 years. This will also examine any factors that may be associated with the cycles observed in the relative number of incidents during this period and especially any factors that may be associated with changes in conditions during the past 12 months.
Any additional information that is found through these studies that may further assist the public update their personal risk assessments for when, where and what water based activities they may be considering will be added to the community education material.

10 Fisheries Occasional Publication No. 109, 2012
(a)
(b)
(c)
Figure 1. a) Frequency of attacks within a calendar year; b) vs financial year (June- July) c) pooled for 2 years.
0
0.5
1
1.5
2
2.5
3
3.5
4
4.5
1995 2000 2005 2010
Frequency of attacks
Year

Shark Correlation Study 11
(a)
(b)
Figure 2. Frequency of attacks per 1,000,000 Western Australian residents by (a) financial year, (b) pooled by two years calendar.

12 Fisheries Occasional Publication No. 109, 2012
Figure 3. Frequency of attacks vs Western Australian population densities (by postal areas). Population densities are indicative only and may not always reflect levels of water activities.
Figure 4. Frequency of attack vs distance offshore and victims’ activities.
0
1
2
3
4
5
6
7
8
9
10
0‐29 30‐59 60‐199 200‐999 >=1000
Frequency of attacks
Approximate distance offshore (m)
Swimming
Surfing
Snorkelling
Scuba diving
Kayak/ski

Shark Correlation Study 13
Figure 5. Frequency of attack vs distance to nearest Australian sea lion or NZ fur seal colony.
A)
Figure 6a. Frequency of attacks vs season and victims’ activities.
B)
Figure 6b. Validated DoF white shark records Jul 1994 – Jul 2012. Records are derived from reported commercial catches (monthly and daily logbook returns, n=75 sharks); metropolitan Shark Monitoring Network/OTN acoustic receivers (n=81 shark days); ASAF white shark attack records (n=27) and aerial surveillance sightings (n=3). NB. Sightings by members of the public have not yet been validated or included.
0
2
4
6
8
0‐4
5‐9
10‐14
15‐19
20‐24
25‐29
30‐34
35‐39
40‐44
45‐49
50‐55
Attack frequency
Distance to nearest colony (km)
0
2
4
6
8
10
Summer Autumn Winter Spring
Frequency of attacks
Season
Swimming
Surfing
Snorkelling
Scuba diving
Kayak/ski
0
5
10
15
20
Jan
Feb
Mar
Apr
May Jun
Jul
Aug
Sep
Oct
Nov
Dec
Number of records
Month
South Coast
South West
Metro
Mid‐west

14 Fisheries Occasional Publication No. 109, 2012
Figure 7. Frequency of attacks vs day of the week.
Figure 8a. Frequency of attacks vs time of day and according to victims’ activities.
Figure 8b. Hourly frequency of tagged white shark detections by metropolitan acoustic receivers 2009-2012 (time indicates start of hourly interval eg 12:00:00 indicates detections between 12 and 1 pm).
0
2
4
6
8
10
12
Sun Mon Tue Wed Thu Fri Sat
Frequency of attacks
Day of week
02468101214
Frequency of attacks
Time of day
Swimming
Surfing
Snorkelling
Scuba diving
Kayak/ski
0
20
40
60
80
100
Frequency of detections
Time (h, min, sec)

Shark Correlation Study 15
Figure 9. Frequency of attacks vs air temperature and according to victims’ activities.
Figure 10. Frequency of attacks vs water temperature.
Figure 11. Frequency of attacks vs solar exposure.
0
2
4
6
8
10
10 12.5 15 17.5 20 22.5 25 27.5
Frequency of attacks
Air temperature (oC)
Swimming
Surfing
Snorkelling
Scuba diving
Kayak/ski
0
1
2
3
4
5
15 20 25
Frequency of attacks
Water temperature (oC)
0
1
2
3
4
5
6
0 10 20 30 40
Frequency of attack
Solar exposure (Global solar energy, MJ/m2)
16 Fisheries Occasional Publication No. 109, 2012
Figure 12. Frequency of attacks vs rainfall.
Figure 13. Frequency of attacks vs wind speed.
Figure 14. Frequency of attacks vs wind direction.
0
5
10
15
20
0 0.2 0.4 0.6 0.8 1
Frequency of attacks
Rain (mm, last 10 min since 9 am)
0
2
4
6
8
10
12
14
0‐9 10‐19 20‐29 30‐39
Frequency of attacks
Wind speed (km/h)
Swimming
Surfing
Snorkelling
Scuba diving
Kayak/ski
0
2
4
6
8
N NE E SE S SW W NW
Frequency of attacks
Wind direction
Swimming
Surfing
Snorkelling
Scuba diving
Kayak/ski

Shark Correlation Study 17
Figure 15. Frequency of attacks vs significant wave height by activity (Data from Dept. of Transport) (Note, trend far less clear using the other data sources on wave height from NCEP/CSIRO)
Figure 16. Frequency of attacks vs number of people in the water in the immediate vicinity (other than the victim).
0
1
2
3
4
5
6
7
8
0‐0.991‐1.992‐2.993‐3.994‐4.995‐5.99
Frequency of attacks
Significant wave height (m)
Swimming
Surfing
Snorkelling
Scuba diving
Kayak/ski
0
1
2
3
4
5
0 1 2 3‐4 5‐10 11‐20
Frequency of attacks
Number of other people in the water
Swimming
Surfing
Snorkelling
Scuba diving
Kayak/ski