Embed Size (px)
Citation preview
1
ACost‐BenefitAnalysisofWasteIncinerationwithAdvancedBottomAshSeparationTechnologyforaChineseMunicipality–
Guanghan
AMaster’sThesissubmittedforthedegreeof"MasterofScience”
Supervisedby
O.Univ.Prof.Dr.Dipl.Natw.PaulH.Brunner
JiaoTang
1025393
Vienna,10September2012
2
Abstract
Waste incineration is a common practice of solid waste management in Europeancountries,foritrendersusefulenergyandreducesmass,volumeandchemicalreactivityof waste components. In contrary, solid waste incineration is by far a less commonpractice of waste treatment in China, mainly due to the unaffordable investment,operationalandmaintenancecostwhencomparedtothebudgetofthesecountries.Anoveltechnologyfortherecoveryofnon‐ferrousmetals(aluminiumandcopper)frombottomashhasbeenrecentlydeveloped.ThegoalofthisthesisistoexploretheimpactthistechnologymayhaveontheoveralleconomicsofwastemanagementbyinvestigatingacasestudyfortheChinesemunicipalityofGuanghanwithapopulationof210,000.Twomethodologieshavebeenappliedtoreachtheobjectives:materialflowanalysis,andcost benefit analysis. Two scenarios were elaborated for the cost benefit analysis:ScenarioIassumesawastemanagementsysteminGuanghanwithsourceseparationandseparate collection of all types of recyclable materials and that the rest waste flowsdirectlytothelandfill;ScenarioIIdiffersfromScenarioIinthatmetalsarenotseparatedat source, but flows with the rest waste to an incinerator before landfilling, whereadvancedtechnologiesareappliedtocontrolairqualityandtorecoveryenergy,ferrousmetalandnonferrousmetals.Dataaboutmunicipalsolidwasteandcostarefromlocalstatistics of Guanghan and literatures on incineration practices in China, Vienna, andZurichwherethenoveltechnologywasdeveloped.ThesoftwareSTANwasusedtomodelthemassflowofwasteaswellasthesubstanceflowofiron,aluminiumandcopperinthewastethroughGuanghan.Thefollowingresulthasbeenobserved:fromthewastemanagementsystemperspective,the benefit outweighs the cost by two million euro when comparing Scenario II toScenario I, indicating a higher efficiency in resource allocation. However, the result ishighlysensitivetovariationsintheborrowingcostandtheinvestmentcostofequipmentandtechnology.Regarding Guanghan, the following conclusions can be drawn: the result of the costbenefitanalysis indicatespotentialeconomicsavingsfor thewastemanagementsystemin Guanghan as a whole; it is therefore worthwhile for the policy makers to consideradding waste incineration to their agenda of improving the city’s waste managementsystemforenvironmentalprotectionandforeconomicefficiency.

3
TableofContent
PartI.ExecutiveSummary.........................................................................................5
1.1.Introduction....................................................................................................5
1.2.ObjectivesandResearchQuestions...................................................10
1.3.MethodologyandProcedure................................................................11
PartII.WasteIncineration......................................................................................12
2.1.WasteTreatment:EUCountriesComparedtoChina.................12
2.2.StateoftheArtWasteIncinerationTechnologies.......................15
2.3.NewTechnologytoSeparateFineBottomAsh–Recoveryof
AluminiumandCopper...................................................................................20
PartIII.WasteManagementSysteminGuanghan........................................26
3.1.DevelopmentofWasteManagementandEnvironmental
Impacts..................................................................................................................26
3.2.MaterialFlowAnalysisofCurrentPractice...................................28
3.3.MaterialFlowAnalysisofTwoScenariosfortheCost‐benefit
Analysis..................................................................................................................33
PartIV.Cost‐BenefitAnalysis.................................................................................39
4.1.Cost‐benefitAnalysis:AssumptionsandScope............................39
4.2.Costs................................................................................................................43
4.2.1.FixedCosts............................................................................................43
4.2.2.VariableCosts......................................................................................45
4.2.3.SummaryofCosts...............................................................................49
4.3.Benefits..........................................................................................................51
4.3.1.FixedBenefits.......................................................................................51
4
4.3.2.VariableBenefits.................................................................................52
4.3.3.SummaryofBenefits.........................................................................60
4.4.Cost‐benefitAnalysisResultandSensitivityAnalysis...............63
PartV.OtherConsiderationsOutoftheScopeoftheCost‐Benefit
Analysis............................................................................................................................68
PartVI.Conclusion......................................................................................................70
Bibliography..................................................................................................................72

5
PartI.ExecutiveSummary
1.1.Introduction
Municipal solid waste (MSW) management in economically developed countries
encompasses fourstagesofactivities:sourceseparation,collection,recycling, treatment
and final disposal. It starts in households, where waste is separately disposed of
accordingtodesignatedcategories:glass,paper,plastics,metals,E‐waste,organicwaste
andresiduals.Incertaincountries,Switzerlandforexample,moredetailedseparationis
applied, such as cardboards from paper, and coloured glass from clear glass. Different
typesof solidwasteare thencollected separatelyandsent to recycling companies, and
the rest waste is sent to an incineration plant, or directly to a landfill. At the waste
incinerationplant,therestwasteisincineratedinordertosignificantlyreducetheirmass,
volumeandchemicalreactivity,meanwhileresourcerecoverycommonlytakesplace:the
recovery of ferrous metal from the bottom ash, the utilization of heat from the
combustionfordistrictheating,andtheproductionofelectricitybythesteamgenerated
fromthecombustionprocess.Eventually,theresidualbottomashiscollectedandsentto
alandfill,thefinalsinkofnon‐recyclablematerials.
Municipalsolidwastecontainsvaluablematerialsthatcouldberecycledandconsiderable
amountofenergythatcouldberecoveredasheatandelectricity.Recycling,accordingto
Lave,etal.(1999),generallyreferstothereuseorremanufacturingofpost‐consumption
productsintothesameuseoralowervalueuse.Recyclingoccurstoasmallextentwithin
consumers’premises(self‐recycling)butmainlyafterthecollectionofmaterialsfromthe
households.Kerbsidepickup,consumerstakingrecyclables toacentralcollectionpoint,
andconsumersreturningthemtoaretailerormanufacturer(inthecaseofE‐wastes)as
partofarefundsystem,arecommonrecyclingcollectionschemes.Materialssuchasglass,
paper, metal and plastics are then recycled by specialised recycling companies. While
waste can also be used as fuel in certain industrial processes, in cement and lime
production for example, recovery of energy happens more commonly at waste
incinerationplants,intheformofelectricityorheatorboth.
6
Notonlycanenergyberecoveredatincinerationplants,butalsovaluablematerialsinthe
residues after combustion could potentially be recovered. In fact, the recovery of raw
materials from secondary sources is a highly promoted strategy in the urban mining
concept.Urbanmining,thesystematicrecoveryandreuseofrawmaterialsattheendof
product lifetime from urban areas (Brunner, 2011), leads to long‐term environmental
protection,resourceconservationandeconomicbenefit.Miningofresources,particularly
duringtheextractionandprocessingstages,produceslargeamountsofpollution:suchas
methane, particulate matters, sulphur dioxide emissions in the air; lead, sulphate,
mercuryemissions inthewater.Atthecurrentrateofextraction,certainresourceswill
soon become scarce. Recovering materials from end‐of‐life products consisting of
substances from primary extraction reduces the need of primary extraction, thus
preserve the resource reserve of our planet. With the soaring price of raw materials,
economicbenefit of recoveringpreciousmetals,making themavailable foruseagain is
becomingapparent.Thequestionliesinthebalancebetweenthecostofrecoveryandthe
benefitfromrecoveringtheresources,whichwillbetheaimofthecostbenefitanalysisin
this study. One of the areas in urban anthroposphere where considerable quantity of
resources can be recovered is municipal solid waste. So far, the focus of recovery is
mainly set on the recycling of municipal solid waste. The European Union (EU) set a
recycling target of 50% by 2020. Some EU countries have already achieved a level of
recyclingofmunicipalsolidwasteabove50%,withtheresidualwastebeingcomposted,
incineratedandlandfilled. It isnoteworthythatthere isalsoaconsiderablepotential to
recover materials from incineration residues, which relies heavily on technological
development.Currentlymostmaterialsinincinerationresiduesarenotbeingrecovered,
duetolackoftechnology.
Generated at different stages during the incineration process, incineration residues
include bottom ash, fly ash and grate siftings, among which bottom ash contains the
majorityofmaterials(15‐20%bymassoftheincineratedwaste)(Grosso,Biganzoliand
Riganmonti, 2011). Themain components of bottom ash are glass, minerals, magnetic
metals,diamagneticmetals,syntheticceramicsandunburnedorganicmatter(Chimenos,
Segarra, Fernandez and Espiell, 1999). According to Chimenos et al. (1999), magnetic
metals in the bottom ash are made up mainly of pieces of steel and iron, and their
oxidisedproductsinthecombustionfurnace,suchasMagnetite(Fe3O4),hematite(Fe2O3)
and wüstite (FeO); while diamagnetic metals are made up mainly of melted drops of
7
aluminium(90%bymass),andsmallamountsofcopperwireandmelteddropsofcopper
alloys.Currentlybestavailablerecoverytechnologiesatwasteincinerationplantsrecover
ferrousmetal(iron)andnon‐ferrousmetals(aluminiumandcopper).Attheincineration
plant inDoel,Belgium, forexample(VanBrecht,WautersandKonings,2012),piecesof
ferrousandnon‐ferrousmetalsare sievedandseparated intodifferent size fractions in
order to be recovered by magnetic force and eddy‐current method respectively. To
increase the recovery efficiency of non‐ferrousmetals in finer fractions of incineration
bottomashisatechnologicalchallenge.Apioneerinthisfield,ZAR(DevelopmentCentre
forSustainableManagementofRecyclableWasteandResources)inSwitzerland,hasbeen
developing first class technologies in the separation and the recovery of non‐ferrous
metalsfromfinebottomash.Bytheendof2011,theyhaddevelopedandputintopractice
a break‐through technology to separate and recover aluminium in fine bottom ash
(particle sizes:0.7‐5mm), reachinga recovery rate ashighas96.8% (ZAR,Böni andDi
Lorenzo,2011).
Inlightofadvancedseparationandrecoverytechnologiesfortherecoveryofhigh‐value
metals, it is time to reassess the economic feasibility of applying waste incineration
treatmentindevelopingcountries.Theobstaclesfordevelopingcountriestobuildwaste
incinerators have been mainly the high cost of investment, and operational and
maintenancecostsassociatedwithwaste incineration.Publicconcernoverairpollution
couldbecounteredbyapplicationofsophisticatedfluegastreatmenttechnologies,which
againishighlycostly.Infact,airpollutioncontrolisthemajordeterminantofincineration
cost, comprising two thirds of initial investment cost in environmental protection
stringentcountries(Schuster,1999).Consequently,thenettreatmentcostpermetricton
ofwaste issignificantlyhigherthanotheralternativessuchas landfilling,evenwiththe
revenue gained from the recovery of electricity and heat. TheWRAPGate Fees Report
2009(WRAP,2009)providedthatthewasteincinerationfeewasonaverageEUR84‐175
per ton,while the landfilling feewas on average EUR50 (Hogg and , 2012).
AlthoughtheWorldHealthOrganization(WHO)recommendstherangeof0.5–1.0%of
Gross Domestic Product (GDP) as affordable for waste management (including public
hygienemaintenance) (Scharff, 2006), countries typically spend 0.2%‐0.4% of GDP on
waste management (Brunner and Fellner, 2006). Brunner and Fellner (2006) further
emphasise that there is a hierarchy of waste management objectives, and therefore
countrieswithalowincomelevelshouldfirstimplementwastemanagementstrategiesto

8
achievetheprimaryobjective:protectinghumanhealth, i.e.waste incinerationisnotso
necessarytobeofprimaryconsideration.Thecostbenefitanalysisofthisstudywillfind
out that lower‐income countries may be able to afford strategies to achieve higher
objectives.
Thisstudy focuseson theapplicationofwaste incineration inChina, takingamid‐sized
municipality as a case for cost benefit analysis. China has been undergoing rapid
economic and population growth, accompanied by a fast growing amount ofmunicipal
solidwaste. In thepast, itwas argued that incinerationofMSWwas technicallynot an
effectivetreatmentbecauseofthehighproportionoforganicwaste(lowheatvalue)and
the lowamountofhighheatvaluematerials likeplastics.Asurbanisationproceeds, the
lifestyle of Chinese has experienced a considerable degree of change. These changes
include a decreased proportion of organic waste and an increased amount of
sophisticated plastic packages in the waste composition. Consequently, the increased
incentive forenergy recovery from the change inwaste compositionaswell as the fast
growingamountofMSWhasstimulatedprivateinvestmentofwasteincinerationplants
inChina.Arecentstudy(Dong,2011)reportedtheincreaseofChinesewasteincineration
capacity from 2.2 million tons/year at the beginning of the century to 23.5 million
tons/yearin2009.By2009,therewere93operatingincinerationplantsinChina[Dong,
2011].Nevertheless,publicdebateover landfillingand incinerationpersistsatdifferent
levelsofsociety:amongpolicymakers,scientists,investorsandthegeneralpublic.Atthe
coreofthedebateisthepotentiallytoxicairpollutionreleasedfromincinerationplants,
due to the lack of advanced flue gas cleaning application and/or the opaque emission
controlpracticeoftheoperator.Theseissuescanbesolvedbyapplyingstate‐of–the‐art
flue gas cleaning technologies and by increasing transparentmonitoring to the public.
These solutions mean further costs in the investment and the operation of the
incineration,adiscouragingfactorforinvestmentconsideration.Thisstudythusaimsto
assesstheimpactofthemetalrecoverytechnologyontheoveralleconomicsofthewaste
management system by conducting a cost‐benefit analysis of a potential waste
incinerationplant inamid‐sizedChinesemunicipality,Guanghan,withenergyrecovery,
advanced flue gas cleaning technology and advanced technology in separation and
recovery ofmetals from the bottom ash, in comparison to a baseline scenariowithout
incineration.Eventually,theresultofthestudyshouldserveasageneraldecisionsupport
9
onincorporatingwasteincinerationinthemunicipalsolidwastemanagementsystemin
Guanghan.
Therehasbeenalimitedamountof literatureonmetalrecoveryandagreatamounton
waste incinerationpractices inChina.Muchova,BakkerandRem’s (2009) studyon the
recoveryofgoldandsilveriteratedtheeconomicviabilityofseparatingpreciousmetals
from bottom ash. Although the study focused specifically on the recovery of gold and
silver in small quantities, it further reiterated the necessity to first classify bottom ash
into different size fractions in order to separatemore types of preciousmetalswith a
higherefficiency.AstudybyGrosso,BiganzoliandRigamonti(2011)providesinsightful
assistancetothematerial flowanalysis, inwhichtheamountofaluminiumandaminor
amount of other non‐ferrous metals recoverable from incineration bottom ash is
quantified. Academic focus has been set on the recovery rate and the factors that
influenceit.ASwissstudyfoundthatinSwitzerlandmorethanhalfoftheferrousscrap
containedinbottomashwasrecoveredandtherecoveryofnon‐ferrousmetalsincreased
to31%(Hügietal.,2008,cited inSpoerri,Lang,StaeubliandScholz,2010).Hu,Bakker
and de Heij (2011) analysed the product life cycle and emphasized the influence of
aluminium packaging on the aluminium recovery rate at waste incineration plants.
BecausewasteincinerationisarelativelynewwastetreatmentoptioninChina,literature
onresourcerecoveryinthisfieldhasbeenprimarilyfocusingonenergyrecovery.Afew
studies,Zhang&He(2009)andHeetal.(2003)forexample,conductedbriefanalysisof
bottomashcompositionandcalledforthedevelopmentoftechnologiesfortherecovery
of ferrous and non‐ferrous metals. A noteworthy study in Chinese bottom ash
composition(SolenthalerandBunge,2003)howeversuggestedthatitwascurrentlynot
economicallyviabletorecovermetalsfromChinesebottomashasthemetalcontentwas
too low (3.3% in China versus 12.6% in Switzerland). There has not been a
comprehensive analysis on the economic impact of awaste incinerationplantwith the
applicationofadvancedresourcerecoverytechnologyinChina.Thisstudyaimstofillin
the literaturegapbetweenthetechnicalstudiesofmetalrecoveryfrombottomashand
theeconomicimpactofitspracticalapplicationinChina,throughacost‐benefitanalysis
ofanadvancedwasteincinerationplanttobebuiltinamunicipalityinGuanghan.
10
1.2.ObjectivesandResearchQuestions
Thegoalof thisstudy is todeliversupport fordecision‐makingon investment inwaste
incineration in China, particularly in the municipality of Guanghan. In an investment
decision‐making process, the decision maker must first define the ultimate goals and
outcome. For themunicipal government of Guanghan, it is important that not only the
cost of waste treatment will be affordable according to its budget, but also that the
efficiencyofresourceallocationofwastemanagementsystemasawholeisincreased,and
that the environmental impact will be minimal. Currently, municipal solid waste is
dumpeddirectlyonasanitarylandfill20kmoutsidethecity,forwhichthegovernment
pays 90 Yuan1per ton ofwaste.Direct landfilling ofwaste takes up large area of land;
additionallytheenvironmentalimpactassociatedwithuntreatedwasteincludepotential
pollution to ground water and soil, emissions of greenhouse gases and odour. The
considerationofthegovernmentwouldbetopaywithintheframeworkofitsbudgetfor
wastemanagement, and at the same time reduce negative environmental impact from
waste.Inthisstudy,acost‐benefitanalysiswillillustratewhethertheinclusionofawaste
incineratorwiththeadvancedbottomashseparationandrecoverytechnologyimproves
theeconomicefficiencyofthewastemanagementsysteminGuanghan.
Inordertoreachthegoalofthestudy,thefollowingmajorresearchquestionshavetobe
answered:Howmuchoftherecoverablesubstancesisthereinthemunicipalsolidwaste
inGuanghan?Since theadvancedseparation technologyappliedhere is testedasbeing
successfulinrecoveringaluminiumandcopperinZurich,thesubstancesoffocusinthis
studywillbealuminiumandcopper, inaddition to thecommonlyrecoveredsubstance:
iron. Secondly, howmuch does it cost to extract the recoverable substances? The cost
includesinvestmentcostoftheequipmentandoperationalandmaintenancecostsofthe
incinerationplant.Finally,whatisthevalueoftherecoverablesubstances?Marketprices
ofaluminium,copperandironwillbeusedtocalculatethereferredvalue.
1Yuan:unitofChinesecurrency(denotedasCNYoncurrencymarket).EUR:CNYis1:7.92,athree‐monthaverageatof10August,2012.

11
1.3.MethodologyandProcedure
To answer the first research question, a material flow analysis (MFA) of the waste
management system in Guanghan will be conducted with the assistance of STAN, a
software for substance flow analysis. TheMFAwill be conducted on themass level of
waste,aswellasonthesubstanceleveloftherecoverablemetals:Al,CuandFe.TheMFA
in the current waste management system is at first analysed, followed by two
hypotheticalscenarios,oneasthebaselinescenarioforthecost‐benefitanalysis,another
as the subject of the cost‐benefit analysis: awastemanagement system that includes a
wasteincineratorwithadvancedairpollutioncontrolandmetalrecoverytechnologies.
A cost‐benefit analysis is then conducted, where the full range of costs and benefits
arisingfromthesubjectscenarioincomparisonwithabaselinescenarioisanalysed.The
Net Present Value as the result of the cost benefit analysiswill be presented, together
with a sensitivityanalysis. Practically, not all costs andbenefits canbeknown,nor can
everyknownimpactbemeasuredreliablyineconomicterms.Therefore,atthebeginning
of chapter IV the assumptions and boundaries of the cost‐benefit analysis are defined,
where impact parameters are also identified, such as cost of land acquisition, cost of
construction, and cost of technology and equipment, operation and maintenance cost,
energysales,revenuefromsellingrecoveredmetalsandthewastetreatmentfeewilling
tobepaidbythemunicipalgovernment.Environmentalandsocialexternalitieswillnot
beincludedinthequantificationbutwillbediscussedbrieflyaftertheanalysis.
This study will begin with an exploration of waste incineration practices in European
countriesandinChina,andadescriptionofthemostadvancedtechnologiessurrounding
waste incineration. The following section describes the current waste management
systeminGuanghan(withMFAcharts),itsenvironmentalimpactandthefutureoutlook
of the debate between landfilling and incineration in China. The core of this study: the
cost‐benefitanalysis,thenfollows.Afterwards,otherconsiderationsoutsidethescopeof
thecost‐benefitanalysiswillbebrieflydiscussed,followedbytheconclusion.

12
PartII.WasteIncineration
2.1.WasteTreatment:EUCountriesComparedtoChina
Due to the difference in economic development and to some extent in lifestyle, waste
compositionandwastetreatmentpracticesvarysignificantlybetweenEUcountriesand
China.Commonwastetreatmentmethodsarerecycling,biologicaltreatment,incineration
and landfilling. Figure 1 depicts the differences in the application of these treatment
methods between EU countries and China. Landfilling is by far the most common
treatment practice in China. This is not only due to its financial affordability but also
indirectlyduetothelackofwasteseparationatsourcethatiscrucialtothepossibilityof
recycling and composting at a later stage. Source separation allows the removal of
hazardousitems,whichcouldbetoxic,flammable,corrosiveorexplosive,includingpaint,
rat poison, plant killer, paint thinner, spray enamels, cleaning fluids and nail polish
remover,etc.(Bass,CalderonandKhan,1990).Inaddition,wasteseparationatsourceis
thekeytoimproverecyclingandcompostingoptions,eventuallyreducingtheamountof
municipalsolidwastetobedisposedofat landfill.Wastecompositionisanothercrucial
factorthatdetermineswhichtypeoftreatmentmethodismostsuitableforacertaintype
of waste in order to achieve sustainability. Organic waste, for example, is best to be
compostedintofertilesoil;glass,paper,cardboards,E‐waste,scrapmetalsandrecyclable
plastics (such as PET bottles) are best to be separated, recovered and recycled; non‐
recyclablematerialswithhighheatvaluelikenon‐recyclableplasticsandtherestarebest
tobe incineratedaltogether so that recoveryof energy is possible and that theweight,
volumeandchemicalreactivityofwastearesubstantiallyreducedforsafelandfilling.

13
Figure1:DifferencesinwastetreatmentbetweenEU27andChina
Source: WangandNie,2001 Zhang,etal.,2011 Eurostat,2012
RecyclingamountsandrecyclingratesinChinaarethemostdifficultstatisticstoobtain.
Current statistics on waste recycling in China are based on a variety of assumptions,
offeringanopaqueviewofthesituation.Toclarifythepicture,firstlytheunderstanding
of the concept “municipal solid waste” has to be differentiated from that in the EU
countries.Thegeneralpublicaswellastherelevantgovernmentagenciesdonotregard
wastematerialswithahigheconomicvaluelikepaper,cardboardsandmetalsas“waste”,
whichareinformallycollectedbyscavengersandhouseholdcollectorsforrecycling.The
proportion of recycled materials in Figure 1 (10%) refers to the amount informally
collected.Secondly, theproportionofrecyclablematerials inthewastecompositionisa
reflectionofconsumptionpatterns,whichcorrelatestolifestyleandlivingstandard.The
proportionoffoodconsumptionintotalconsumptionforinstance,ishigherinChinathan
intheEUcountries,hencethehigherproportionoforganicwasteinwastecomposition.
Thesearesomeoftheimportantunderlyingfactorstohelpunderstandthedifferencesin
wastetreatmentpracticesbetweenEuropeancountriesandChina.
Compostingshouldbeanidealtreatmentforaconsiderableportionofthemunicipalsolid
waste in China, as organicwaste consists of over 50% of totalwaste. The reasonwhy
compostingapplies tomerely2%(Figure1)of thecollectedwaste is largelydue to the
absenceof sourceseparation. Inaddition tootherhazardouswastemixedwithorganic
waste at source, coal ash containing heavy metals from coal burning for heating in
northern parts of the countrymakes composting frommixedwaste unrealistic (Giusti,

14
2009). For incineration, coal ash also makes the burning less efficient. Nevertheless,
wasteincinerationhasbeenrisinginthepastdecadeinChina,mainlydrivenbythelack
oflandinurbanareasforlandfillsitesandtherecoverableenergypotential.Still,itisthe
most expensive treatment method; therefore financial consideration is the key factor
leading to the difference in the application of waste incineration between the EU and
China. The proportion of landfilling practice in China is almost twice of that in EU
countries(Figure1).Thisisinshorttheresultofthreefactors:thelowcostoflandfilling,
thehighcostof incineration,andthelimitedpracticalityofrecyclingandcompostingas
discussed hitherto due to lack of source separation. In fact, there is no optimal waste
managementsystemthatfitsallplacesorsituationsduetodifferencesinenergysources,
availability of disposal options, and differences in waste characteristics. Therefore
environmentalimpactandsustainabilityassessmentsneedtobeconductedaccordingto
aspecificregioninordertodesignacustomisedoptimalsystem.

15
2.2.StateoftheArtWasteIncinerationTechnologies
Incinerationtechnology
There are threemain types of combustion technologies in commercial practice: rotary
kiln, moving grate and fluidised bed. Rotary kilns are commonly used for combusting
industrial and hazardous wastes, but is also used in some municipal solid waste
incinerators.Theprincipledesign(Figure2)consistsoftwothermaltreatmentchambers:
a slightly inclined primary chamber where waste is fed in (together with inlet of hot
exhaustairwithoxygen),rotatedandthermallydecomposedbytheheatradiationfrom
the secondary chamber: the re‐combustion chamber positioned at the rear of the kiln
where thedecompositionairand the restwaste is completelyburntwith thesupplyof
secondary air. Rotary kilns have the advantage of producing a low level of NOx and
thermaldestructionofhazardouschemicals(GEC,2002).
Figure2.Arotarykilnincinerator
Source:PollutionIssues,2012
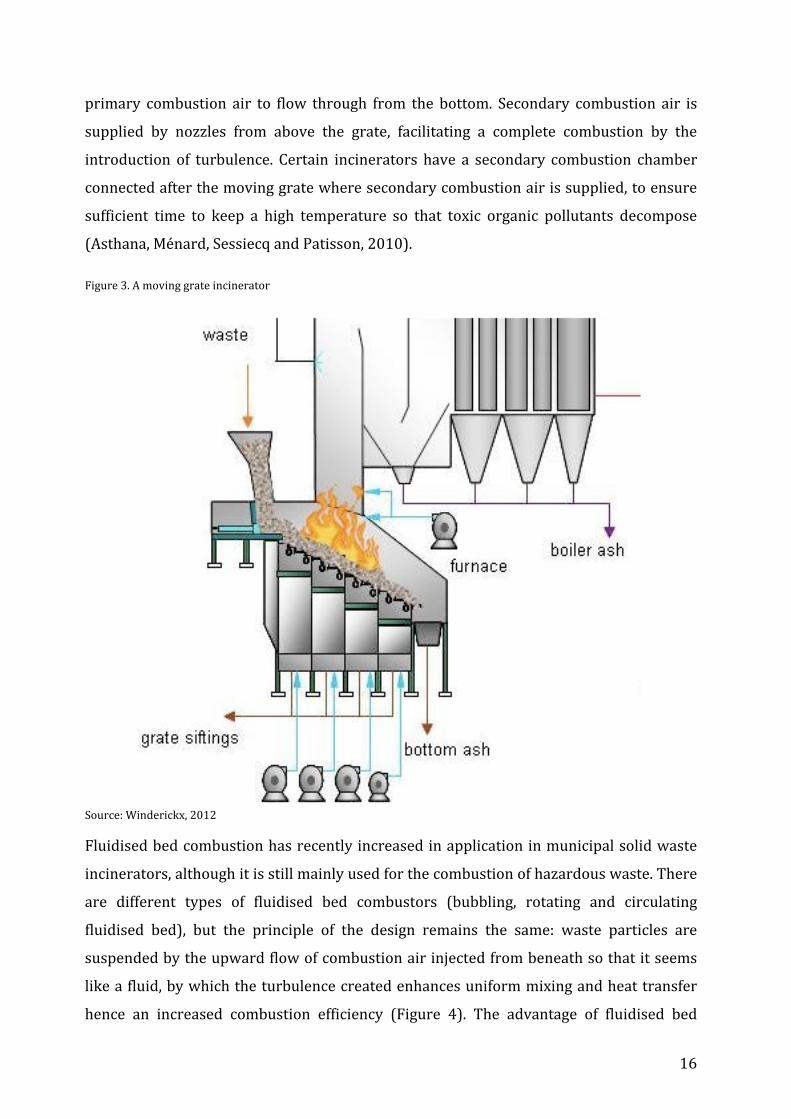
A moving grate is a typical combustion design of a municipal solid waste incinerator.
Wasteisdroppedbyacraneontothedescendinggrate,whichmovesintothecombustion
chamberandeventuallymovesdown todrop theburnt residuals intoanashpit at the
other end of the grate (Figure 3). Themoving grate is ametallic porous bed, allowing
16
primary combustion air to flow through from the bottom. Secondary combustion air is
supplied by nozzles from above the grate, facilitating a complete combustion by the
introduction of turbulence. Certain incinerators have a secondary combustion chamber
connectedafterthemovinggratewheresecondarycombustionairissupplied,toensure
sufficient time to keep a high temperature so that toxic organic pollutants decompose
(Asthana,Ménard,SessiecqandPatisson,2010).
Figure3.Amovinggrateincinerator
Source:Winderickx,2012
Fluidisedbedcombustionhasrecentlyincreasedinapplicationinmunicipalsolidwaste
incinerators,althoughitisstillmainlyusedforthecombustionofhazardouswaste.There
are different types of fluidised bed combustors (bubbling, rotating and circulating
fluidised bed), but the principle of the design remains the same: waste particles are
suspendedbytheupwardflowofcombustionairinjectedfrombeneathsothatitseems
likeafluid,bywhichtheturbulencecreatedenhancesuniformmixingandheattransfer
hence an increased combustion efficiency (Figure 4). The advantage of fluidised bed

17
technology is the enhanced combustion efficiency, however thepre‐conditionof that is
the homogenisation of waste inputs in size as well as in heat value, which requires
extensive pre‐treatment of waste including typically size reduction and mixing (Van
Caneghemetal.,2012).
Figure4.Afluidisedbedincinerator
Source:VanCaneghemetal.,2012
Fluegascleaningtechnology
Mechanicalandchemicalmethodsareusedtocleanfluegasafterincineration,byeither
takingawaythepollutantsorneutralizingthem.Solidparticlesareremovedbycyclones
or multi‐cyclones using gravitational and centrifugal forces. The more expensive
electrostaticprecipitatorisusedtoremovesmallerparticles.Filtrationisusedtoachieve
anevenhigherefficiencyofsolidparticleremoval.Combinedwithcatalysisofpollutants,
pollutantssuchasPCDD/FsandNOxcanalsobefiltered.Inaddition,solidparticlescanbe
washedoutby finewaterdrops, ina combinedsystemofVenturi scrubberandpacked
column. Acidic gaseous pollutants, mainly SO2, NO2, HCl and heavy metals, can be
eliminatedinthiscombinedsystembyaddingreactiveagents,injectingadryorsemi‐dry

18
alkalineagent,andcarbonaceoussorbentscanbeinjectedtoremovePCDD/Fsandheavy
metals. Selective non‐catalytic reduction (SNCR) eliminates NOx by reaction with
ammonia agents added to the flue gas flow, generally achieving a removal efficiencyof
60%.Whileselectivecatalyticreduction(SCR)achievesanefficiencyashighas90%,itis
more costly because of the catalyst required. Such separation and absorption
technologies reduce emissions to a level way below legislative requirements and are
deemedassoundenvironmentalpractices(Tabasová,2012).
Figure5.Schemeofanup‐to‐dateincineratorwithmechanicalandchemicalflue‐gascleaningsystem
Source:Tabasová,2012
Energyrecoverytechnology
Energy recovery in the form of electricity and heat is achieved based on the following
operationalset‐ups:waterpipesarelinedonthewallatthetopinsidethefurnace,sothat
theheatfromcombustioncanbeutilisedbyconvertingwaterintohighpressuresteam,
which is routed into a turbine that drives an electricity generator; in the case of
cogeneration,thesteampassingthroughtheturbinethenarrivesataheatexchangerthat
transferstheheatfromthesteamtodistrictheatingsystem.Therearedesignswhereheat
is extracted before the turbines for district heating, increasing heat utilisation while
reducingelectricitygeneration(Fruergaard,ChristensenandAstrup,2010).
Materialrecoverytechnology
Currentlybestavailablerecoverytechnologiesatwaste incinerationplantsrecover iron
andnon‐ferrousmetals(aluminiumandcopper).Attheincinerationplant,biggerpieces
of ferrous and non‐ferrous metals are at first sieved, allowing smaller particles to be
further separated.Particleswitha larger sizeare then trommeled,withinwhich iron is
19
recoveredagainmagnetically.The finerparticlesare further separated into fractionsof
different sizes. Iron is retrieved magnetically from larger fractions, while non‐ferrous
metals(aluminiumandcopper)areretrievedfromsmallerfractions(6‐50mminthecase
ofaBelgiumincinerator)basedoneddy‐current.Therecoveryofaluminiumandcopper
infinerfractionsbelow2mmyieldssuchalowratebycurrenttechnologythatitdoesnot
usually take place. To increase the yield of non‐ferrous metals in finer fractions of
incinerationbottomashisatechnologicalchallenge.

20
2.3.NewTechnologytoSeparateFineBottomAsh–RecoveryofAluminiumandCopper
Toincreasetheyieldofnon‐ferrousmetalsinfinerfractionsofincinerationbottomashis
a technological challenge. A pioneer in this field, ZAR (Development Centre for
SustainableManagement of RecyclableWaste and Resources) in Switzerland, has been
developing first class technologies in the separation and the recovery of non‐ferrous
metalsfromfinebottomash.Bytheendof2011,theyhaddevelopedandputintopractice
abreak‐throughtechnologytoseparateandrecoveraluminiumin finebottomashwith
particlesizesbetween0.7and5mm,reachingarecoveryrateashighas96.8%(ZAR,Böni
andDiLorenzo,2011).
Withthegoalofoptimisingtherecoveryofpreciousmaterialsfromincinerationresidues,
ZAR has developed technologies for bottom ash discharge, separation and non‐ferrous
metalrecovery,andhasputthemintopractiseatoneoftheincinerationplantsinZurich,
theKEZOincinerationplant.Unlikemostotherincineratorswhichdischargebottomash
afterburninginawater‐filledtrough(wetdischarge),atKEZObottomashisdischarged
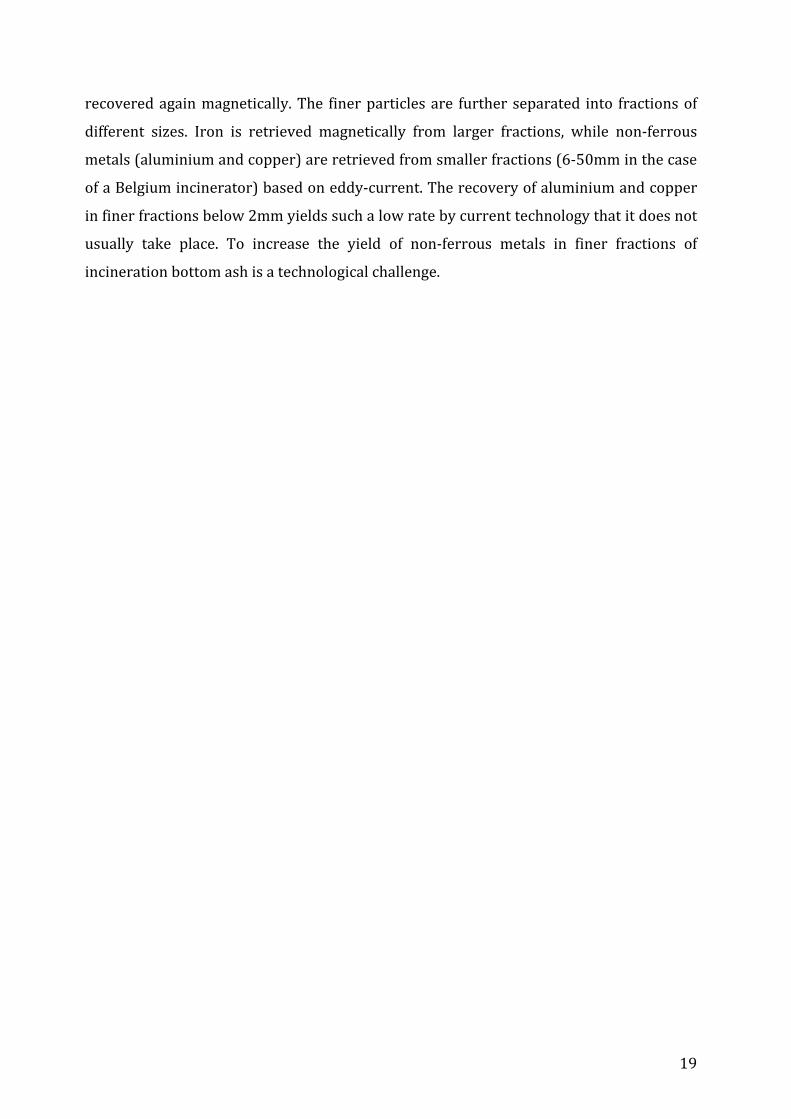
fromtheincinerationchamberdry.Thedrydischargeprocess(Figure6)isaidedbythe
additionoftertiaryair,whichsupportstheincinerationprocess,coolsdownthebottoms
ash,andsupportstheafterburningoforganicpartsandtheairsiftingofthebottomash.
Thedry‐dischargedbottomashhas all substances andparticles in their original shape,
raisingthepossibilitiesfortheseparationofbottomashaccordingtosize,weight,shape,
colourandconductivity.Removalofbiggerparticlesisalsomadesaferandsimpler(ZAR,
2012).
21
Figure6.Drydischargeofbottomash
Source:ZAR,2012
Thebottomashisdischargedcontinuouslyviaanashdrum,fallingdownonspecialbaffle
plates,onwhichthebottomashiscrushedagainandanyglowingembersinagglomerates
are torn apart. The vibration conveyor then transports the ash parts to the screening
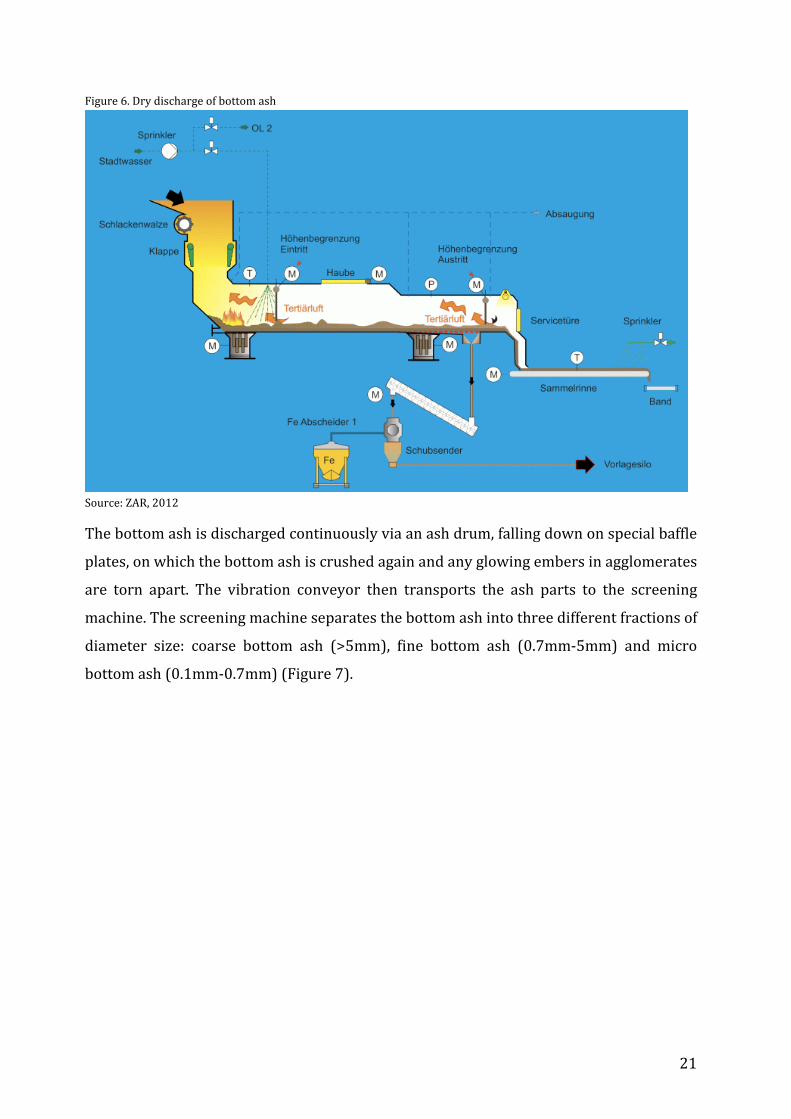
machine.Thescreeningmachineseparatesthebottomashintothreedifferentfractionsof
diameter size: coarse bottom ash (>5mm), fine bottom ash (0.7mm‐5mm) and micro
bottomash(0.1mm‐0.7mm)(Figure7).

22
Figure7.Separationofbottomashintofractionsofdifferentsizes
23
Source:ZAR,2012
The cost benefit analysis of this study applies the technology that separates the fine
bottomash(0.7 ‐5mm).Operationof theplantwasstarted inSeptember2008and its
recoveryefficiencyhasbeenundercontinuousoptimisation.ZARstatesthat“thecentral
part of the conception are two very strong magnets, connected in series and two
following, non ferrous treatment devices, also connected in series. The strongmagnets
remove allmaterial particles thatwill disturb the induction field in thenext treatment
stepandreducetheefficiencyofthenon‐ferrousseparation”(Figure8).Thenon‐ferrous
separatorisapilotplant,reachingarecoveryefficiencyover90%ofmetalsinveryhigh
purityandquality(ZAR,2012).
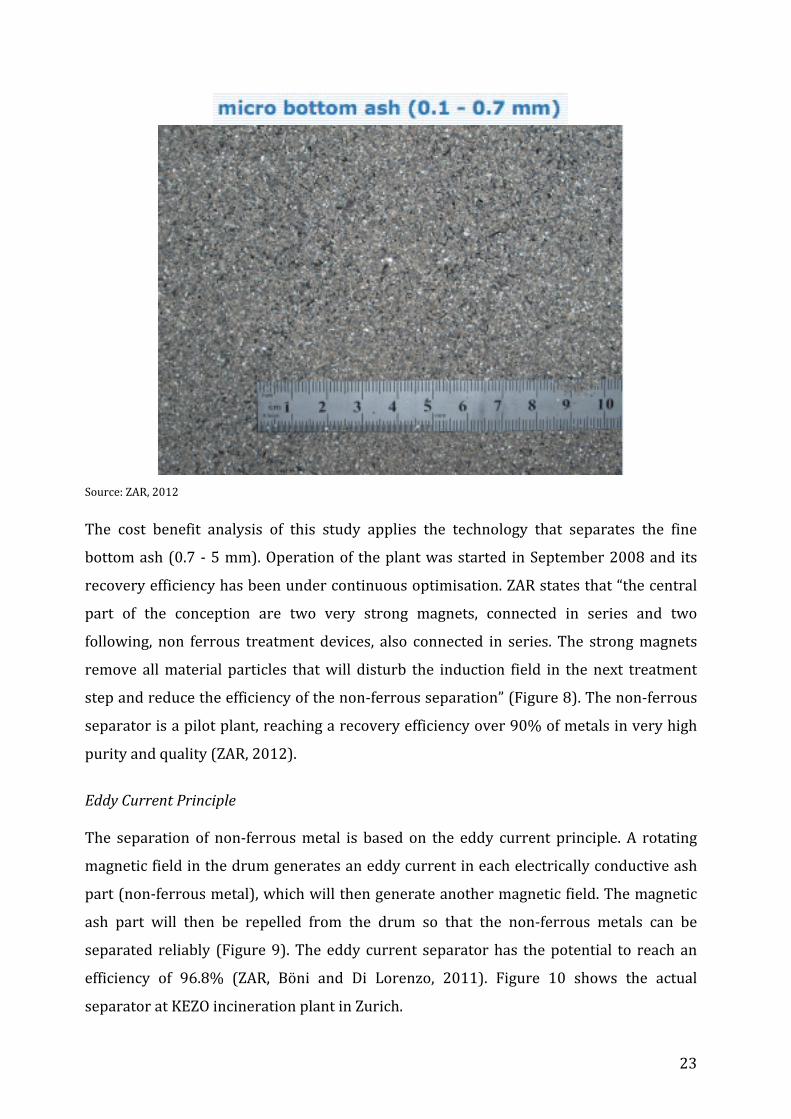
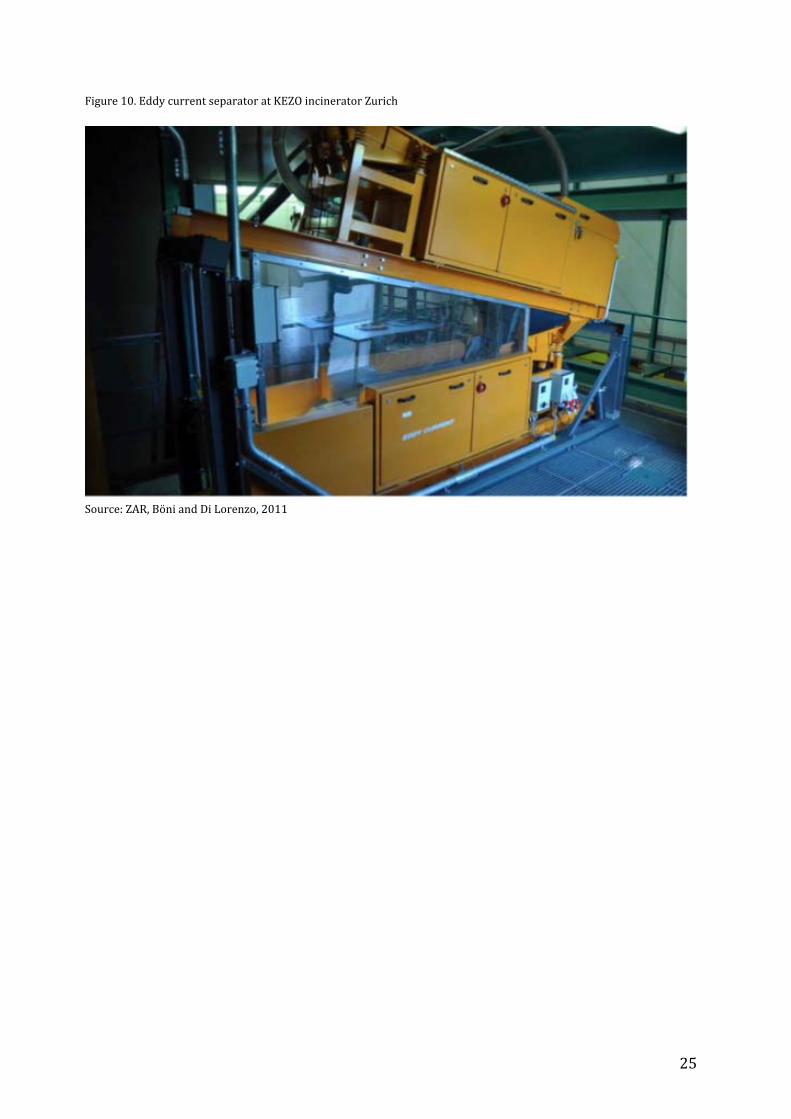
EddyCurrentPrinciple
The separation of non‐ferrousmetal is based on the eddy current principle. A rotating
magneticfieldinthedrumgeneratesaneddycurrentineachelectricallyconductiveash
part(non‐ferrousmetal),whichwillthengenerateanothermagneticfield.Themagnetic
ash part will then be repelled from the drum so that the non‐ferrous metals can be
separated reliably (Figure9).Theeddy current separatorhas thepotential to reachan
efficiency of 96.8% (ZAR, Böni and Di Lorenzo, 2011). Figure 10 shows the actual
separatoratKEZOincinerationplantinZurich.

24
Figure8.Separationoffinebottomash(0.7mm‐5mm)
Source:ZAR,2012
Figure9.Eddycurrentseparator
Source:ZAR,2012
25
Figure10.EddycurrentseparatoratKEZOincineratorZurich
Source:ZAR,BöniandDiLorenzo,2011
26
PartIII.WasteManagementSysteminGuanghan
3.1.DevelopmentofWasteManagementandEnvironmentalImpacts
Guanghan is a second‐tier city in the southwest province of Sichuan, with an urban
population of 210,000 (Qing2, 2012). Like many other second‐tier cities in China,
Guanghanhasnotdevelopedaholisticmunicipalsolidwastemanagementsystem.Firstof
all, thedefinitionofmunicipal solidwaste isunclearas towhether it includes informal
collectionofrecyclablesbyprivateagents.Secondly,thereisnosourceseparationother
than those (newspaper, cardboards, metals and furniture) separated by domestic
households for selling to informal collectors.As a result, thedisposedwaste contains a
recyclableportionmixedwithnon‐recyclablewaste,partofwhichwillthenbecollected
by scavengers at the disposal bins, the waste transfer stations and the final waste
dumpsite.Wastehasbeendumpedon anopendumpsite12kmoutside the city,where
minimumcontrolwasapplied. In the late1990s,apilotwastecompost treatmentplant
went into operation, admitting all municipal solid waste and turning it into organic
fertilizer. Thiswaste treatmentmodelwashighlypraisedby theprovincial and central
government and thereafter was applied in other small to medium cities in Sichuan.
Unfortunately,theprivateoperatoroftheplantwentintoalegaldisputeoverintellectual
rightof thesortingandcomposting technologywithanothercompetitorandeventually
lostthecase,resultingintheclosureoftheplantinordertopaythelegalfees.Afterwards,
wastewasagaindumpedontheopendumpsitewithlittlecontrol,until2010whenfinally
asanitarylandfillconstructionwascompletedandstarteditsoperation.
The current sanitary landfill is built next to the old open dumpsite,which had already
accumulated600,000 tonsofwastes (SichuanEnvironmentalMonitoringCentre, 2011)
andwassealedwithagrassyfieldasthetop layerwhenthesanitary landfillwasbeing
constructed.Theolddumpsite,withnobottomsealing,situatedonahill,haddetrimental
impacts on the agricultural fields and residing population down the slope. In the past,
accidents happened frequently during the stormy season, when the runoff of the rain
transported thewaste on the open dumpsite to the agricultural fields along the slope,
2Qing,G.Z.isanofficialfromtheGuanghanEnvironmentalProtectionBureau,whowasthemaincorrespondenttoprovidethelocalinformationforthisthesis.AninterviewandafieldvisitwithhimwereconductedinFebruary2012;privateemailspursuedthereafterregardingfurtherdataandinformation.
27
causing contamination of the soil as well as skin diseases to the farmers who were
workingonthefield.Theharvestgrownfromthecontaminatedsoilthereaftercouldnot
be consumed. Besides these accidents, severe environmental impacts associated with
opendumpsitepersisteduntil thesanitary landfillwasbuilt.These impacts includesoil
contamination from direct contact with wastes, ground water contamination by the
leachate from the waste, odour and green house gas emissions from the site, and
pathogenicdiseasesbeingcarriedaroundbyanimalsandscavengersthatscavengedfood
andrecyclablematerialsfromthewaste.Thenewsanitarylandfillmitigatestheproblem
ofsoilandgroundwatercontamination,andthecontrolofentrypreventsanimalsfrom
coming to the waste thereby reducing pathogen contagion. Nevertheless, the old
dumpsite without bottom sealing will still pose long‐term threat to the environment
especially to the soil and groundwater. Thenew sanitary landfill has a capacity of 180
tons per day and is already admitting a daily intake of 200 tons (Qing, 2012). At the
current rate of waste generation growth, the landfill will reach its capacity within 15
years,bythenanewlandfillhastobeconstructed.

28
3.2.MaterialFlowAnalysisofCurrentPractice
Toillustratethecurrentflowofwastematerialsinthecity,amaterialflowanalysiswas
conducted using the STAN3software for the year 2011. Through the STAN software, a
graphicalmodelwasbuiltwithprocesses,flowsandasystemboundarywithinputdata
including mass flows, stocks, concentrations and transfer coefficients. Material flow
analysiswasalsoconductedonthesubstancelevel, forthethreesubstancesrelevantto
thecostbenefitanalysis,aluminium(Al),copper(Cu)andiron(Fe),inordertoillustrate
the quantities of their flowswithin the system. Figure 11 shows the flow ofmunicipal
solidwasteinGuanghan,fromitsgenerationthroughvariouschannelsintheurbanarea
untilthefinaldestination.
The official document from the government of Deyang (2009), the upper‐level
administration above Guanghan, defines municipal solid waste to be the solid waste
producedbytheurbanpopulationfromtheirdailyactivitiesandthesolidwasteproduced
byentitiesthatsupplygoodsandservicestourbanlife,andothersolidwastedesignated
by law and regulations, including wastes from households, offices, restaurants, public
facilities such as schools,markets and sport centres, aswell as constructionwaste and
specialwaste,excludingindustrialsolidwaste.Basedonthisdefinition,Deyangreported
84,000tonsofwaste“generated”inGuanghanintheyear2010.Thisfigurehoweverdoes
not include the recyclables separated by the households and collected by informal
collectorsbeforetherestisdisregardedaswaste(Qing,2012).Thisfigurehenceisinfact
formallycollectedwaste.Thereforetheactualamountofgeneratedwasteshouldinclude
the amount of recyclables informally collected, which is estimated at about 10% of
generatedwasteinChina(WangandNie,2010).Thetotalwastegenerationof100,000t
intothesystemisthereforecalculatedas:
Wr2011=W2010/(100%‐10%)*(1+rg)1
whereWr2011is thereal totalwastegenerated intheyear2011,W2010thereportedtotal
waste generation in the year2010 (in fact formally collectedwaste), and rg the rate of
wastegenerationgrowthperyear.rgiscalculatedbasedonthedailywastegenerationof
3STAN(shortforsubSTanceflowANalysis)isafreewarethathelpstoperformmaterialflowanalysisaccordingtotheAustrianstandardÖNormS2096(Materialflowanalysis‐Applicationinwastemanagement).
29
100t inGuanghan in1998 (Hu, et al., 1998) and thedailywaste generationof 230t4in
Guanghanin2010.
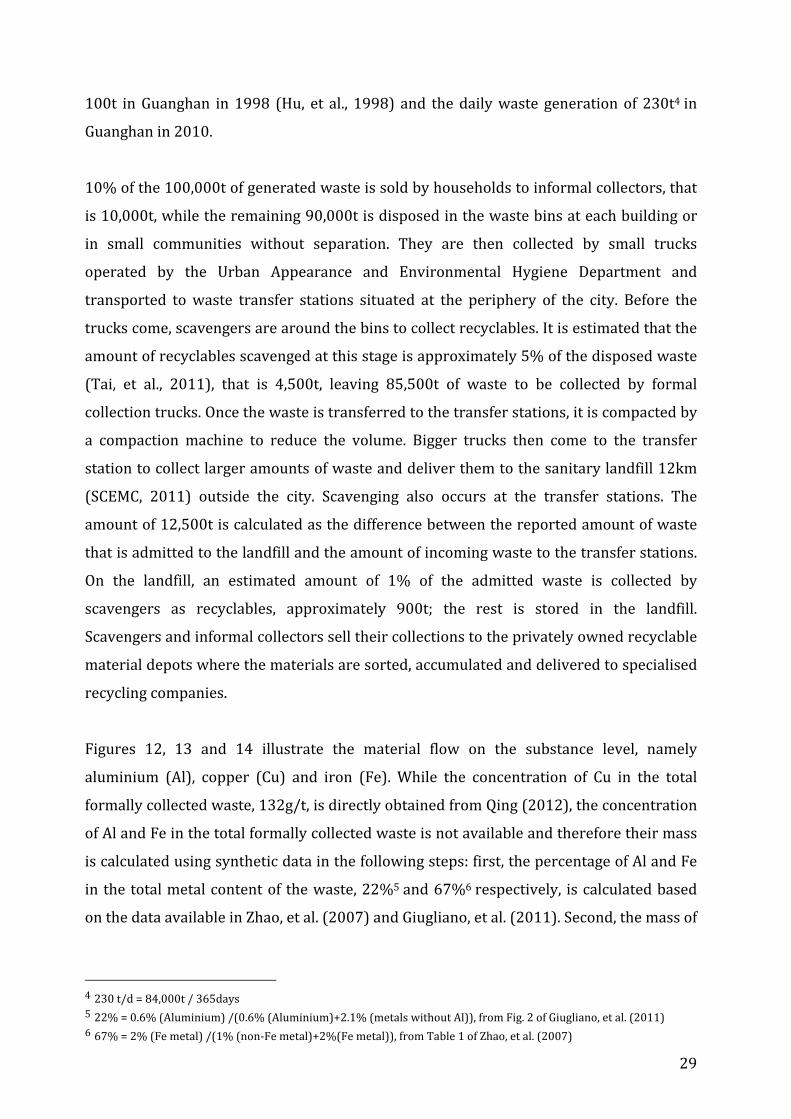
10%ofthe100,000tofgeneratedwasteissoldbyhouseholdstoinformalcollectors,that
is10,000t,whiletheremaining90,000tisdisposedinthewastebinsateachbuildingor
in small communities without separation. They are then collected by small trucks
operated by the Urban Appearance and Environmental Hygiene Department and
transported towaste transfer stations situated at the periphery of the city. Before the
truckscome,scavengersarearoundthebinstocollectrecyclables.Itisestimatedthatthe
amountofrecyclablesscavengedatthisstageisapproximately5%ofthedisposedwaste
(Tai, et al., 2011), that is 4,500t, leaving 85,500t of waste to be collected by formal
collectiontrucks.Oncethewasteistransferredtothetransferstations,itiscompactedby
a compaction machine to reduce the volume. Bigger trucks then come to the transfer
stationtocollectlargeramountsofwasteanddeliverthemtothesanitarylandfill12km
(SCEMC, 2011) outside the city. Scavenging also occurs at the transfer stations. The
amountof12,500tiscalculatedasthedifferencebetweenthereportedamountofwaste
thatisadmittedtothelandfillandtheamountofincomingwastetothetransferstations.
On the landfill, an estimated amount of 1% of the admitted waste is collected by
scavengers as recyclables, approximately 900t; the rest is stored in the landfill.
Scavengersandinformalcollectorsselltheircollectionstotheprivatelyownedrecyclable
materialdepotswherethematerialsaresorted,accumulatedanddeliveredtospecialised
recyclingcompanies.
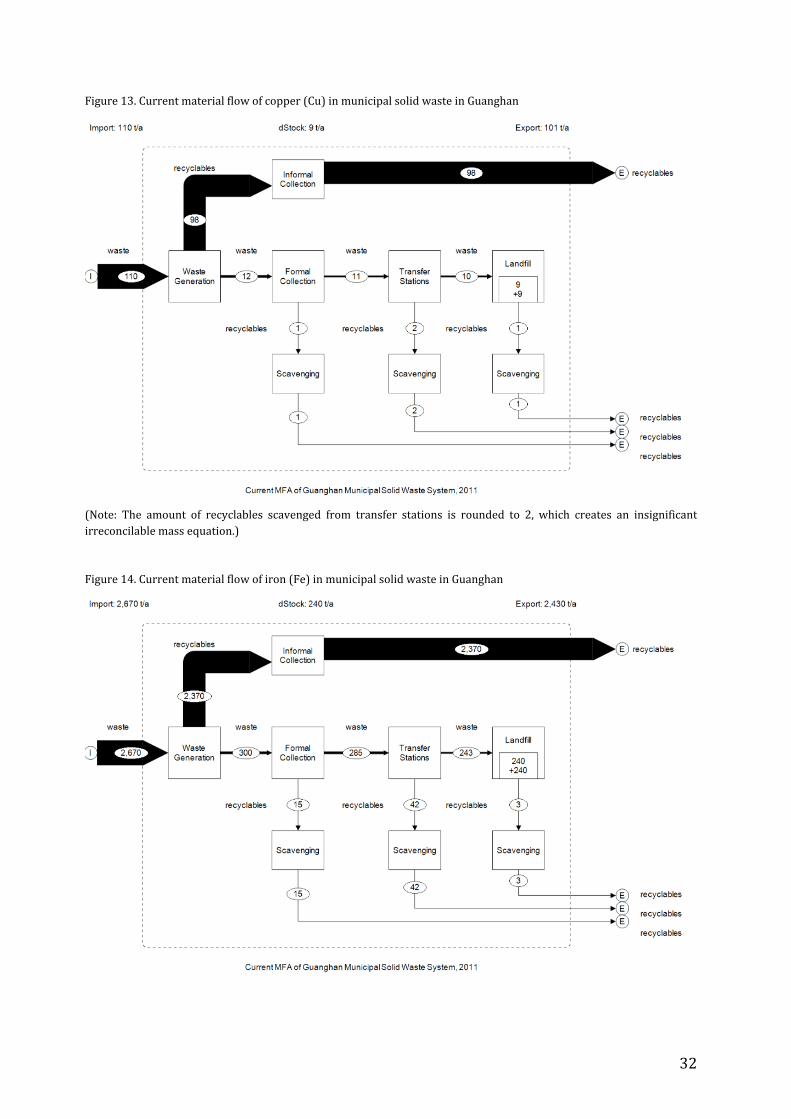
Figures 12, 13 and 14 illustrate the material flow on the substance level, namely
aluminium (Al), copper (Cu) and iron (Fe). While the concentration of Cu in the total
formallycollectedwaste,132g/t,isdirectlyobtainedfromQing(2012),theconcentration
ofAlandFeinthetotalformallycollectedwasteisnotavailableandthereforetheirmass
iscalculatedusingsyntheticdatainthefollowingsteps:first,thepercentageofAlandFe
inthetotalmetalcontentof thewaste,22%5and67%6respectively, iscalculatedbased
onthedataavailableinZhao,etal.(2007)andGiugliano,etal.(2011).Second,themassof
4230t/d=84,000t/365days522%=0.6%(Aluminium)/(0.6%(Aluminium)+2.1%(metalswithoutAl)),fromFig.2ofGiugliano,etal.(2011)667%=2%(Femetal)/(1%(non‐Femetal)+2%(Femetal)),fromTable1ofZhao,etal.(2007)
30
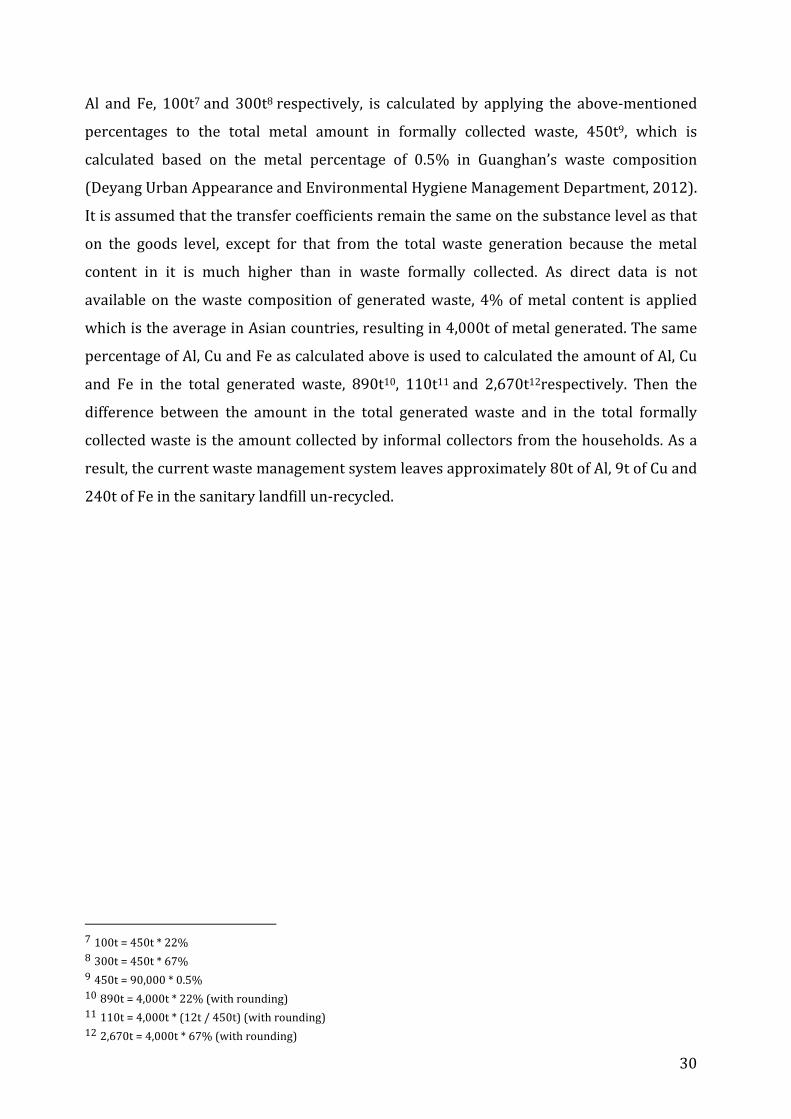
Al and Fe, 100t7and 300t8respectively, is calculated by applying the above‐mentioned
percentages to the total metal amount in formally collected waste, 450t9, which is
calculated based on the metal percentage of 0.5% in Guanghan’s waste composition
(DeyangUrbanAppearanceandEnvironmentalHygieneManagementDepartment,2012).
Itisassumedthatthetransfercoefficientsremainthesameonthesubstancelevelasthat
on the goods level, except for that from the total waste generation because themetal
content in it is much higher than in waste formally collected. As direct data is not
available on thewaste compositionof generatedwaste, 4%ofmetal content is applied
whichistheaverageinAsiancountries,resultingin4,000tofmetalgenerated.Thesame
percentageofAl,CuandFeascalculatedaboveisusedtocalculatedtheamountofAl,Cu
and Fe in the total generated waste, 890t10, 110t11and 2,670t12respectively. Then the
difference between the amount in the total generated waste and in the total formally
collectedwasteistheamountcollectedbyinformalcollectorsfromthehouseholds.Asa
result,thecurrentwastemanagementsystemleavesapproximately80tofAl,9tofCuand
240tofFeinthesanitarylandfillun‐recycled.
7100t=450t*22%8300t=450t*67%9450t=90,000*0.5%10890t=4,000t*22%(withrounding)11110t=4,000t*(12t/450t)(withrounding)122,670t=4,000t*67%(withrounding)

31
Figure11.CurrentmaterialflowofmunicipalsolidwasteinGuanghan
Figure12.Currentmaterialflowofaluminium(Al)inmunicipalsolidwasteinGuanghan
32
Figure13.Currentmaterialflowofcopper(Cu)inmunicipalsolidwasteinGuanghan
(Note: The amount of recyclables scavenged from transfer stations is rounded to 2, which creates an insignificantirreconcilablemassequation.)Figure14.Currentmaterialflowofiron(Fe)inmunicipalsolidwasteinGuanghan
33
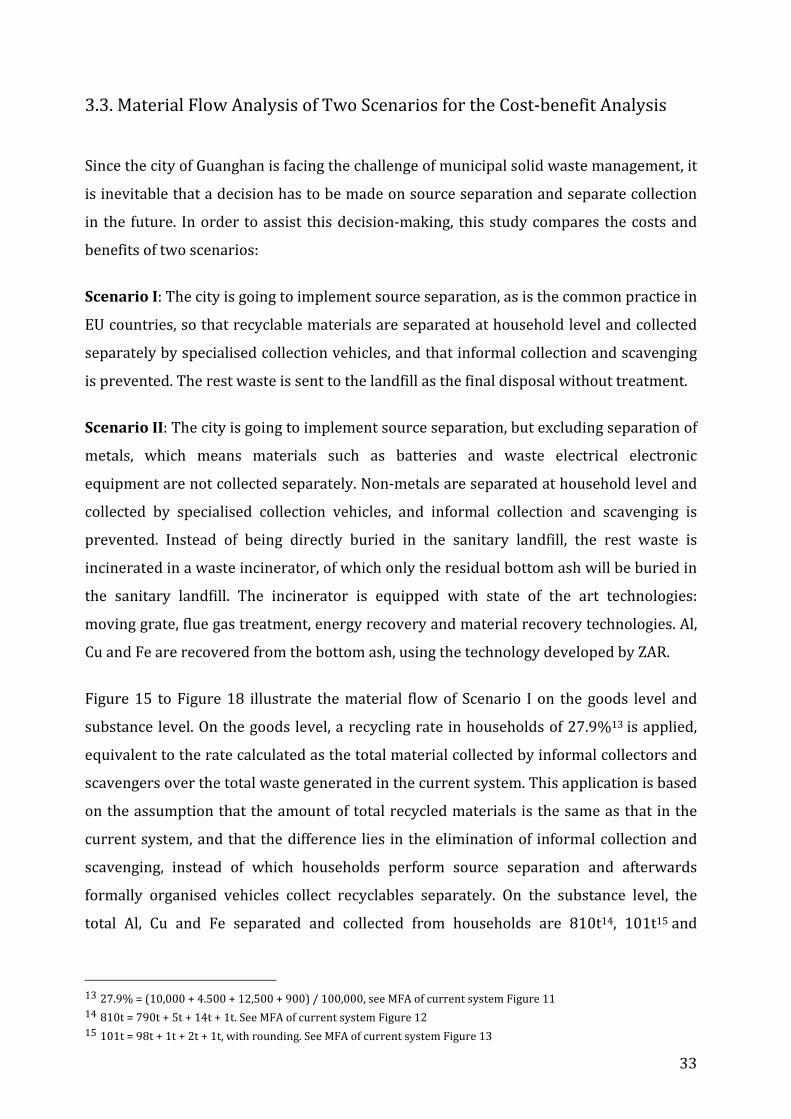
3.3.MaterialFlowAnalysisofTwoScenariosfortheCost‐benefitAnalysis
SincethecityofGuanghanisfacingthechallengeofmunicipalsolidwastemanagement,it
isinevitablethatadecisionhastobemadeonsourceseparationandseparatecollection
in the future. Inordertoassist thisdecision‐making, thisstudycompares thecostsand
benefitsoftwoscenarios:
ScenarioI:Thecityisgoingtoimplementsourceseparation,asisthecommonpracticein
EUcountries,sothatrecyclablematerialsareseparatedathouseholdlevelandcollected
separatelybyspecialisedcollectionvehicles,andthatinformalcollectionandscavenging
isprevented.Therestwasteissenttothelandfillasthefinaldisposalwithouttreatment.
ScenarioII:Thecityisgoingtoimplementsourceseparation,butexcludingseparationof
metals, which means materials such as batteries and waste electrical electronic
equipmentarenotcollectedseparately.Non‐metalsareseparatedathouseholdleveland
collected by specialised collection vehicles, and informal collection and scavenging is
prevented. Instead of being directly buried in the sanitary landfill, the rest waste is
incineratedinawasteincinerator,ofwhichonlytheresidualbottomashwillbeburiedin
the sanitary landfill. The incinerator is equipped with state of the art technologies:
movinggrate,fluegastreatment,energyrecoveryandmaterialrecoverytechnologies.Al,
CuandFearerecoveredfromthebottomash,usingthetechnologydevelopedbyZAR.
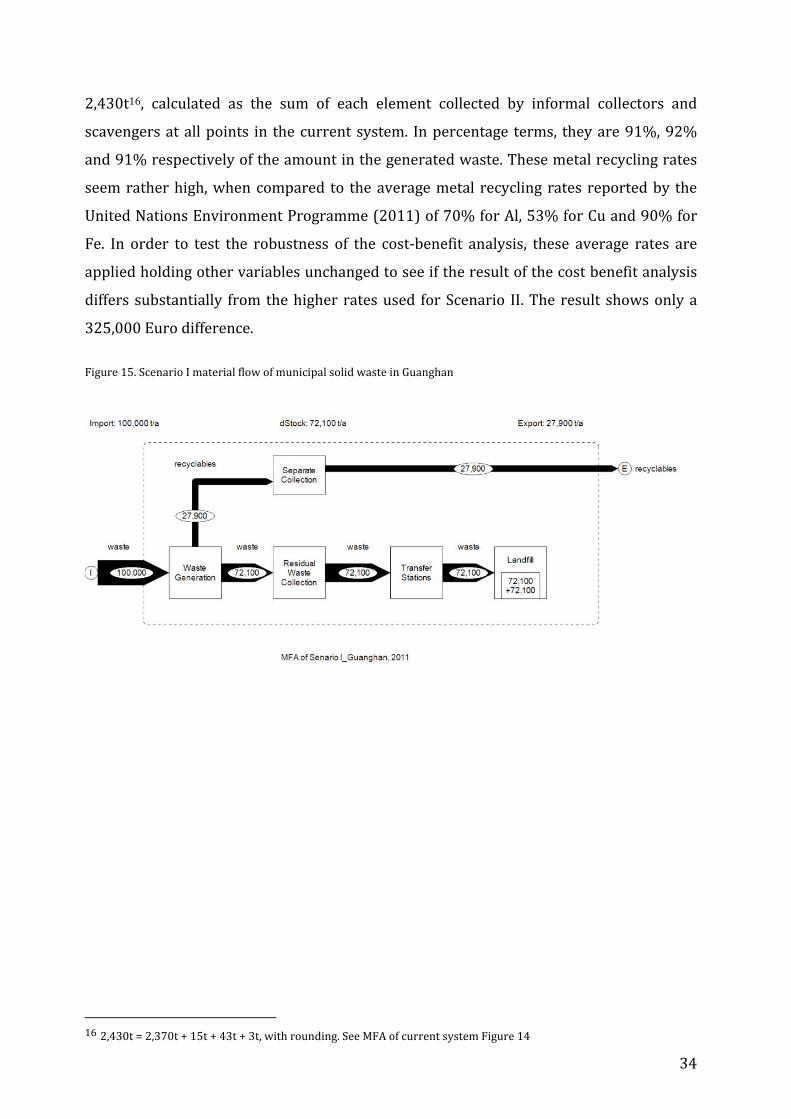
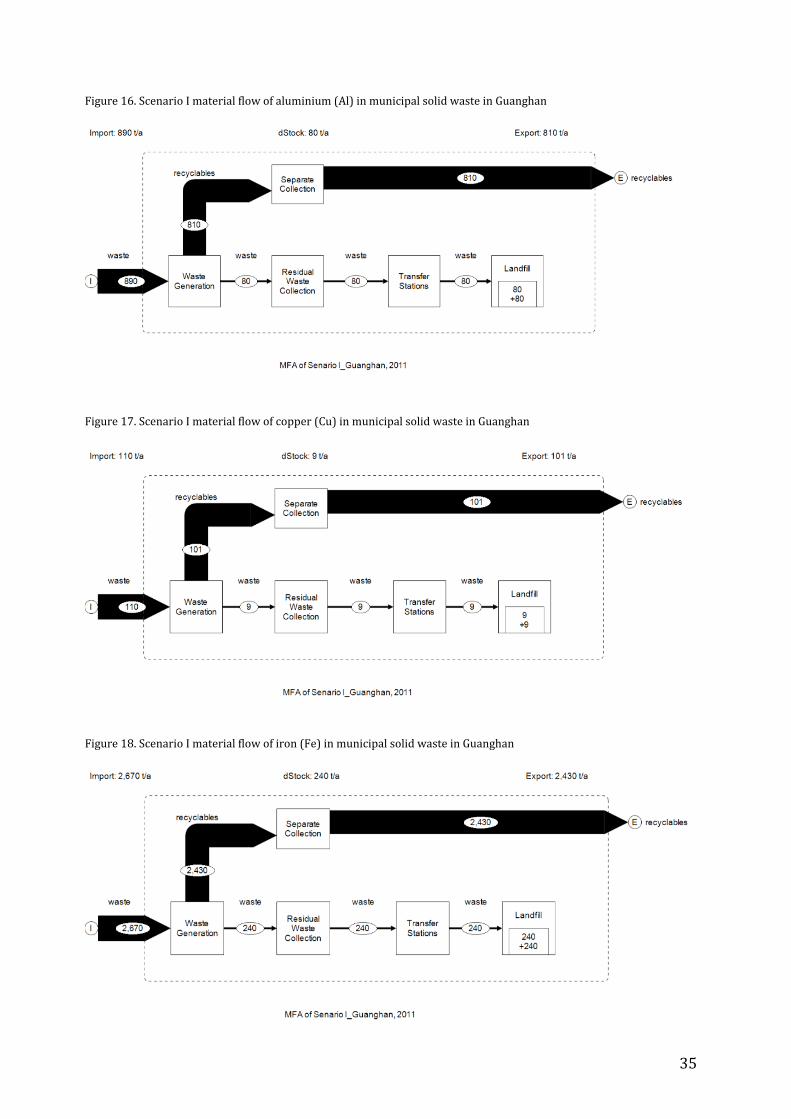
Figure15 toFigure18 illustrate thematerial flowof Scenario I on thegoods level and
substancelevel.Onthegoodslevel,arecyclingrateinhouseholdsof27.9%13isapplied,
equivalenttotheratecalculatedasthetotalmaterialcollectedbyinformalcollectorsand
scavengersoverthetotalwastegeneratedinthecurrentsystem.Thisapplicationisbased
ontheassumptionthattheamountoftotalrecycledmaterialsisthesameasthatinthe
currentsystem,andthatthedifference lies intheeliminationof informalcollectionand
scavenging, instead of which households perform source separation and afterwards
formally organised vehicles collect recyclables separately. On the substance level, the
total Al, Cu and Fe separated and collected from households are 810t14, 101t15and
1327.9%=(10,000+4.500+12,500+900)/100,000,seeMFAofcurrentsystemFigure1114810t=790t+5t+14t+1t.SeeMFAofcurrentsystemFigure1215101t=98t+1t+2t+1t,withrounding.SeeMFAofcurrentsystemFigure13
34
2,430t16, calculated as the sum of each element collected by informal collectors and
scavengersatallpoints in thecurrentsystem. Inpercentage terms, theyare91%,92%
and91%respectivelyoftheamountinthegeneratedwaste.Thesemetalrecyclingrates
seemratherhigh,whencompared to theaveragemetal recycling rates reportedby the
UnitedNationsEnvironmentProgramme(2011)of70%forAl,53%forCuand90%for
Fe. In order to test the robustness of the cost‐benefit analysis, these average rates are
appliedholdingothervariablesunchangedtoseeiftheresultofthecostbenefitanalysis
differs substantially fromthehigher ratesused forScenario II.Theresult showsonlya
325,000Eurodifference.
Figure15.ScenarioImaterialflowofmunicipalsolidwasteinGuanghan
162,430t=2,370t+15t+43t+3t,withrounding.SeeMFAofcurrentsystemFigure14
35
Figure16.ScenarioImaterialflowofaluminium(Al)inmunicipalsolidwasteinGuanghan
Figure17.ScenarioImaterialflowofcopper(Cu)inmunicipalsolidwasteinGuanghan
Figure18.ScenarioImaterialflowofiron(Fe)inmunicipalsolidwasteinGuanghan

36
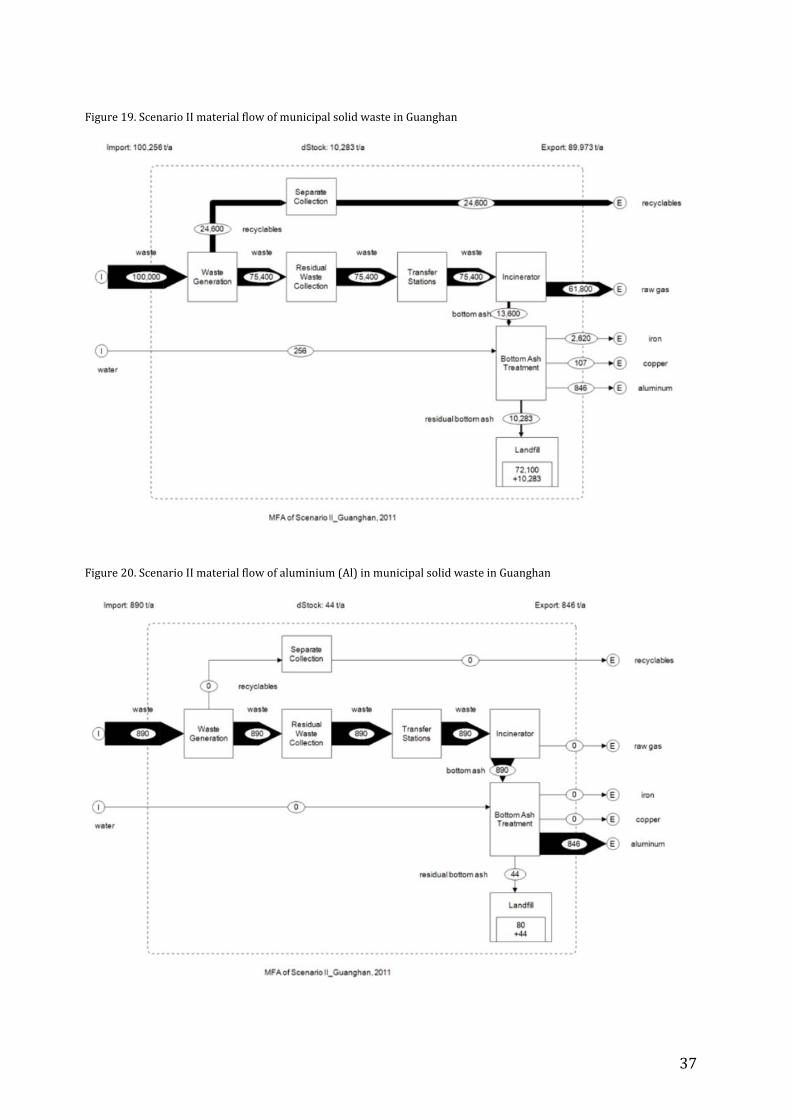
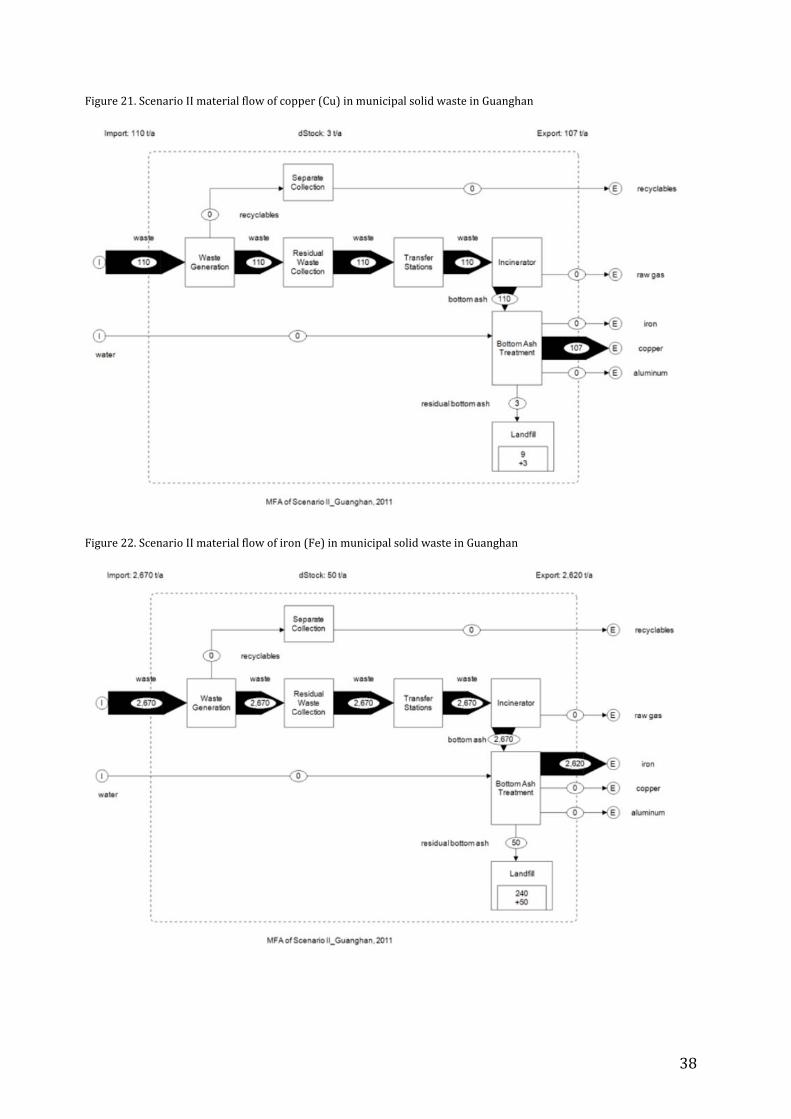
Figure19toFigure22 illustrate thematerial flowofScenario IIonthegoods leveland
substance level. On the goods level, the recycled amount of 24,600t17is calculated by
applying the recycling rate of 27.9% less the amount of Al, Cu and Fe that would
otherwisehavebeenseparatelyrecycledathouseholdlevelinScenarioIandwhichisnot
recycledfromhouseholdsinScenarioII.Theamountofbottomashandrawgasfromthe
incinerator,aswellastheamountofrecoveredAl,CuandFeandtheresidualbottomash,
iscalculatedbasedonthedatafromtheKEZOincineratorinZurichthatisoperatingwith
therecoverytechnology.Thedatashowsthat18%ofincinerationproductisbottomash
whiletherest82%israwgas(includingflyash).Theassumptionofthesamepercentage
in Guanghan’s incineratedwaste leads to 13,600t18of bottom ash and 61,800t19of raw
gas. Inputofwater is0.34%of inputwaste, thus256t20of inputwater is tobeused to
treattheresidualbottomashthatiseventuallygoingtothelandfill.Applyingtherecovery
rateofAl,CuandFefromKEZO,95%,97%and98%respectively, totheamountofthe
metals in the waste input into the incinerator, the amount of recoverable metals is
calculated:846t21,107t22and2,620t23respectively.Consequently,therestoftheamount
ofbottomashisresidualbottomash,calculatedasthedifferencebetweenthebottomash
producedplusthewaterinputandtherecoveredamountofmetals:10,283t24toendup
inthelandfill.
Onthesubstancelevel,themetalsareburntandtheyflowintotheportionofbottomash,
with none in the raw gas. Then they are separated and recovered in the bottom ash
recoveryprocess,resultinginrecoveredamountof846t,107tand2,617trespectively,as
calculatedinthepreviousparagraph,withtheunrecoveredportionendingintheresidual
bottomash,whichisthentreatedtoreduceenvironmentallyharmfulimpactsandsentto
thesanitarylandfillasthefinaldestination.
1724,600t=100,000t*27.9%‐810t–101t–2,430t,withrounding.SeeFigures15,16,17and18.1813,600t=75,400t*18%,withrounding1961,800t=75,400t*82%,withrounding20256t=75,400t*0.34%21846t=890t*95%.SeeFigure16.22107t=110t*97%.SeeFigure17.232,620t=2,670t*98%,withrounding.SeeFigure18.2410,283t=13,600t+256t–846t–107t–2,620t
37
Figure19.ScenarioIImaterialflowofmunicipalsolidwasteinGuanghan
Figure20.ScenarioIImaterialflowofaluminium(Al)inmunicipalsolidwasteinGuanghan
38
Figure21.ScenarioIImaterialflowofcopper(Cu)inmunicipalsolidwasteinGuanghan
Figure22.ScenarioIImaterialflowofiron(Fe)inmunicipalsolidwasteinGuanghan
39
PartIV.Cost‐BenefitAnalysis
4.1.Cost‐benefitAnalysis:AssumptionsandScope
Whenundertakingaproject,goodsandservicesareconsumedaswellasproduced,while
social,economicandenvironmentalimpactsoccur.Economicefficiencyisafundamental
criterionforpublicinvestment,whichmeansthatthebenefitsmustoutweighthecostsof
using scarce resources, benefits being the total positive effects while costs the total
negative effects measured in economic terms. The purpose of cost‐benefit analysis
thereforeistohelpdecision‐makerschoosetheoptionamongalternativesthatisefficient
in itsuseof resources. In thecaseofGuanghan, since thecity is facing thechallengeof
improving itsmunicipalsolidwastemanagementsystem, it is inevitable thatadecision
hastobemadeonsourceseparation,separatecollectionandwastetreatmentoptions.In
ordertoassistthedecision‐making,thisstudyanalysesthecostbenefitofScenarioII in
comparison to the baseline of Scenario I. Note that Scenario I is also a hypothetical
situation, which differs from the current waste management system in that informal
collection and scavenging are replaced by source separation and formal separate
collection of different types of waste. The reason for using Scenario I as the baseline
instead of the current situation is based on the assumption that source separationwill
inevitable happen in the future for the efficient recycling ofmaterials. The cost‐benefit
analysis therefore is to examine whether the exclusion of metal separation at source
togetherwith the implementationof awaste incineratorwithadvancedmetal recovery
technology before landfilling is economically more efficient than separating metals at
source without incineration before landfilling. Based on this result, together with
considerationsofothernon‐economic factors, themunicipalgovernmentwillbeable to
makeaninformeddecisiononwhethertoimplementtheproposedScenarioIIforthecity
ofGuanghan,withthegoalofimprovingresourceuseefficiencyandeventuallymanaging
thecity’smunicipalsolidwastesustainably.
Thesystemunderexaminationincludestheflowofwastefromitsgenerationtoitsfinal
disposal and the processes in between, excluding the processes of recycling after
collectionatsourceandafterrecoveryfromtheincinerator.Itshouldberecognisedthat
notallimpactscanbeknown,andthatnotallknownimpactscanreliablybeassigneda
40
quantitativevalue,evenlessamonetaryvalue.Forthisstudy,theeconomicimpactswill
bequantifiedinthecostbenefitanalysis,whilethesocialandenvironmentalimpactswill
bediscussedinthenextchapterinaqualitativecontext.Itisassumedthatthelifetimeof
theproposed incinerator is20yearswith1yearofconstruction inaddition,andthat it
hastwoindividuallines(oneasbackupforwhentheother’scapacityisexceeded)witha
capacityof400t/d25each.Itisalsoassumedthattheplantislocatedwithin1kmdistance
tothecurrentsanitarylandfill,andthatitisneartotheexistingelectricitygrid,sothatno
extracost is incurred throughacostlynew transmissionsystem.Furthermore, revenue
fromelectricitysaleisassumedtoflowthroughoutthelifetimeoftheplant.Finally,itis
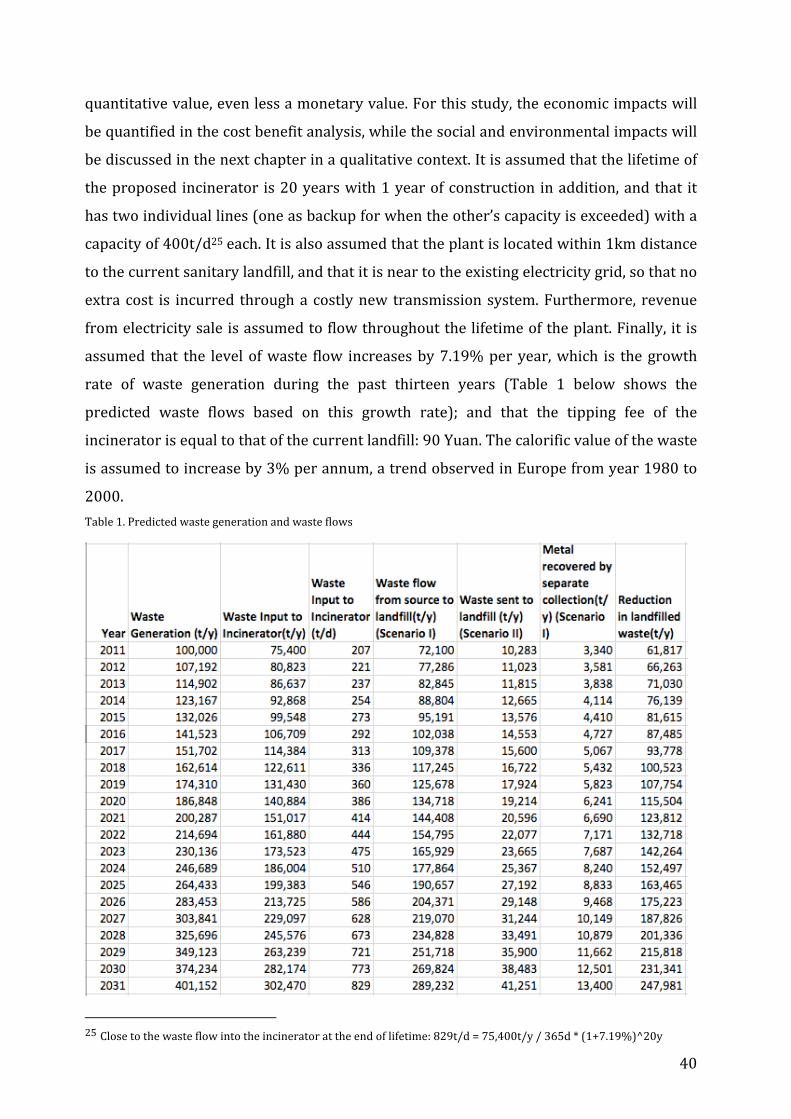
assumed that the levelofwaste flow increasesby7.19%peryear,which is thegrowth
rate of waste generation during the past thirteen years (Table 1 below shows the
predicted waste flows based on this growth rate); and that the tipping fee of the
incineratorisequaltothatofthecurrentlandfill:90Yuan.Thecalorificvalueofthewaste
isassumedtoincreaseby3%perannum,atrendobservedinEuropefromyear1980to
2000.
Table1.Predictedwastegenerationandwasteflows
25Closetothewasteflowintotheincineratorattheendoflifetime:829t/d=75,400t/y/365d*(1+7.19%)^20y

41
Inorder to identify theeconomic impactsof Scenario II, assessmentof thenet changes
compared to the baseline scenario is needed. Firstly, there is additional input ofwater
into the system that is needed in the incinerator; however the amount (256t/y) is so
insignificant that the additional cost (only a few hundred euros per year) will not be
includedinthecost‐benefitanalysis.Secondly,theamountofrecycledmaterialsatsource
is reduced because of the exclusion of metal separation, hence the cost of source
separation is reduced. Thirdly, as a consequence of reduced need to separate metals,
thereisahigheramountofresidualwasteflowingthroughtherestwastecollectionand
transferstations,whichmeanshighercollectioncost.Fourthly,theincineratorinducesa
varietyofeconomicimpacts:fixedcostsoncapitalinvestment,variablecostofoperation
andmaintenance, revenue from thewaste treatment fee, electricity sale and recovered
metal sale. Lastly, the reduced amount of waste that is sent to the landfill means a
reducedcostoflandfilling,andmoresignificantlyitmeansthereisnoneedtoconstructa
newlandfillthatwouldhaveotherwisebeenneededin15yearsunderScenarioI.Table2
belowliststheimpactparametersofthecostbenefitanalysis.
Table2.Economicimpactparametersforthecost‐benefitanalysis
Physicalquantificationoftheseparametersandmonetaryevaluationisdescribedinthe
followingsections.TheresultofthecostbenefitanalysisistheNetPresentValue(NPV),
42
thedifferencebetweenthesumofdiscountedbenefitsandthesumofdiscountedcosts.If
theNPVisgreaterthanzero,theproposedscenariorepresentsanefficientchangeinthe
allocationofresources.TheNPViscalculatedas:
NPV=ΣBt(1+i)‐t‐ΣCt(1+i)‐t
Where B denotes benefit, C denotes cost, i the discount rate, and the summation runs
from t=0 (the first year of the project) to t=T (the last year of theproject). A five‐year
averagedbank‐lending rate from the year 2008 to 2012of 6.73%per annum (Bankof
China,2012)isusedasthediscountrate.
The functional unit of the cost benefit analysis is the Euro. Three‐month averaged
currencyexchangerates (asof10August2012 fromECB)areapplied toconvertother
currencies to Euro.Most data are obtained through currently operating incinerators in
China,particularlythosewithasimilarcapacity.Sincedatausedaresubjecttovariation,
as the future flow of physical impacts and prices are predicted rather than known, a
sensitivityanalysis isconductedat theendto identifywhich factors theoutcomeof the
cost‐benefitanalysisismostsensitiveto.
Itshouldbenotedthatthecost‐benefitanalysisprovidesageneralguidelineonthewaste
management system level. A feasibility study is required for a specific investment to
investigate detailed investment cost and to take consideration of local factors such as
waste transport distance, land use, and environmental and social impacts on the local
population.
43
4.2.Costs
4.2.1.FixedCosts
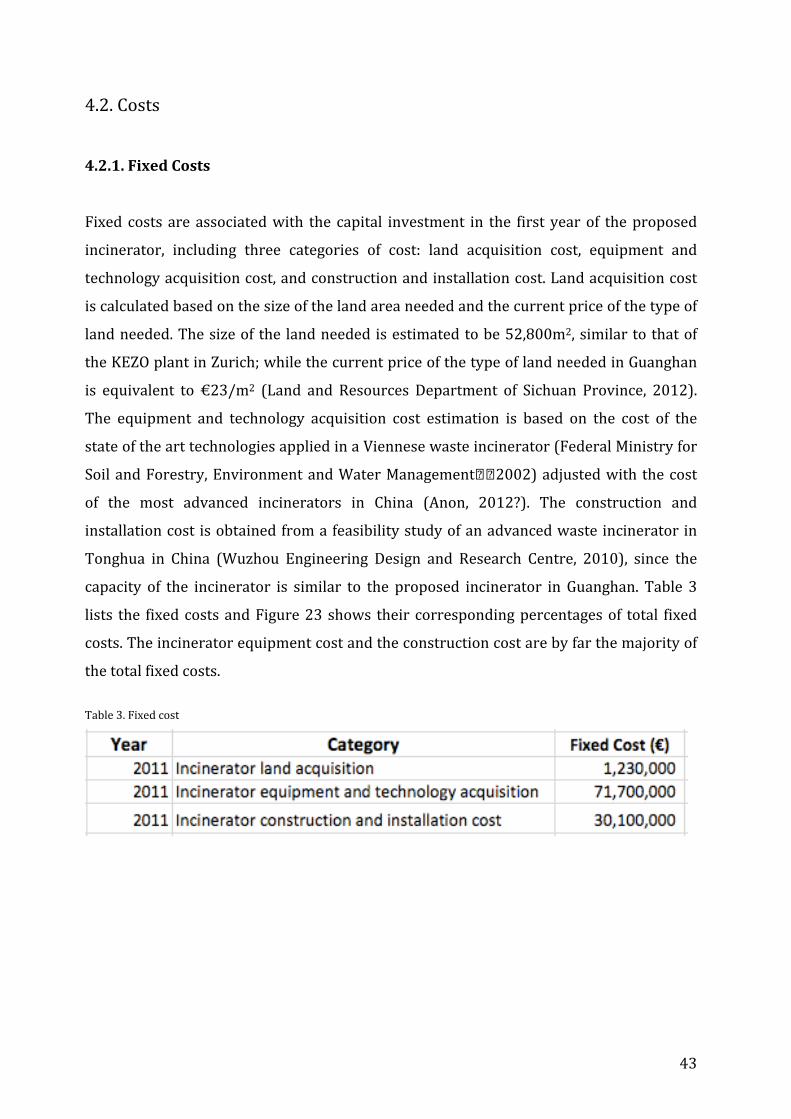
Fixed costs are associatedwith the capital investment in the first yearof theproposed
incinerator, including three categories of cost: land acquisition cost, equipment and
technologyacquisitioncost,andconstructionandinstallationcost.Landacquisitioncost
iscalculatedbasedonthesizeofthelandareaneededandthecurrentpriceofthetypeof
landneeded.Thesizeof the landneededisestimatedtobe52,800m2,similartothatof
theKEZOplantinZurich;whilethecurrentpriceofthetypeoflandneededinGuanghan
is equivalent to €23/m2 (Land and Resources Department of Sichuan Province, 2012).
The equipment and technology acquisition cost estimation is based on the cost of the
stateofthearttechnologiesappliedinaViennesewasteincinerator(FederalMinistryfor
SoilandForestry,EnvironmentandWaterManagement 2002)adjustedwith thecost
of the most advanced incinerators in China (Anon, 2012?). The construction and
installationcost isobtainedfromafeasibilitystudyofanadvancedwasteincineratorin
Tonghua in China (Wuzhou Engineering Design and Research Centre, 2010), since the
capacity of the incinerator is similar to the proposed incinerator in Guanghan. Table 3
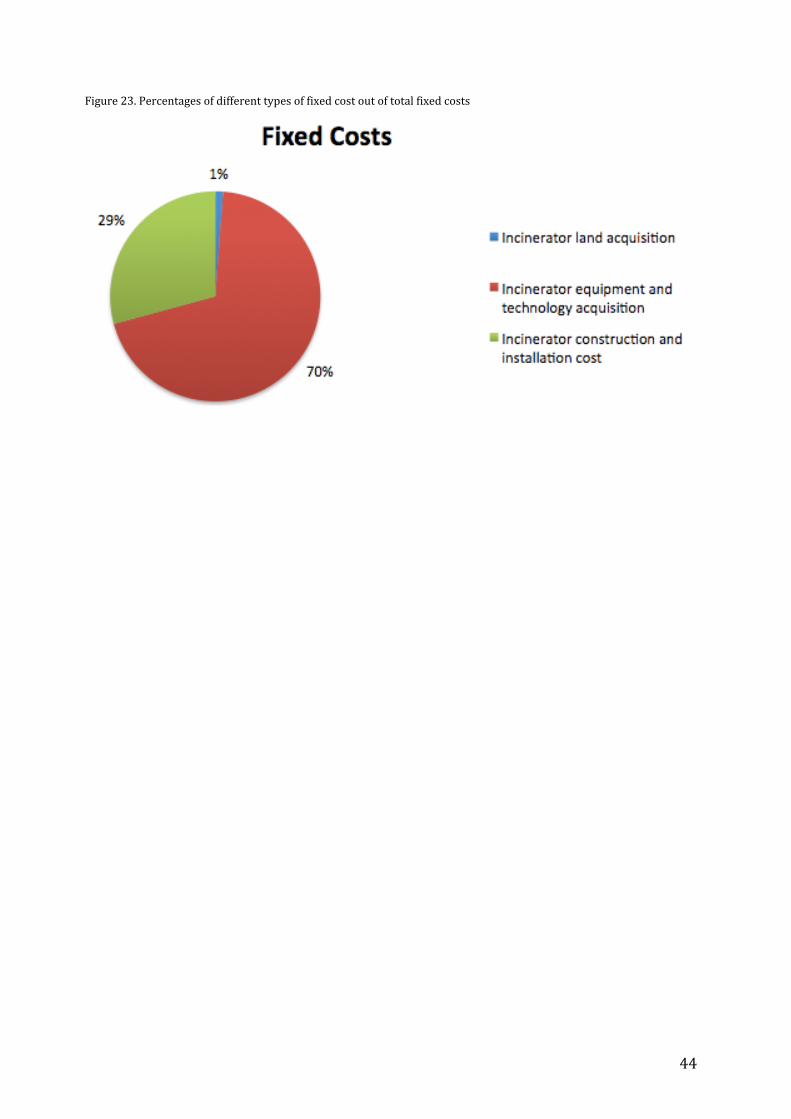
lists the fixedcostsandFigure23shows their correspondingpercentagesof total fixed
costs.Theincineratorequipmentcostandtheconstructioncostarebyfarthemajorityof
thetotalfixedcosts.
Table3.Fixedcost
44
Figure23.Percentagesofdifferenttypesoffixedcostoutoftotalfixedcosts

45
4.2.2.VariableCosts
1).Increasedcollectioncostfromsourcetolandfill
BecausemetalsarenotseparatedfromtherestwasteinScenarioII,andalsobecausethe
incinerator is assumed tobewithin1kmdistance to the current landfill, theamountof
wastetobecollectedfromthesourceandtobetransportedtotheincineratorishigherby
theamountofmetalsthatwouldhavebeenseparatedinScenarioI.Additionally,basedon
theassumptionthatthedistancebetweentheincineratorandthelandfillis1km,thecost
ofcollectingandtransportingtheresidualbottomashfromtheincineratortothelandfill
is accounted for. The increased collection cost from source to landfill every year is
thereforecalculatedas:
Cc=(QwfII‐QwfI)*Pc1+Qwl*Dl*Pc2
whereCcisthetotalincreasedcollectioncostfromsourcetolandfill,QwfIIthequantityof
wasteflowfromsourcetotheincinerationplantinScenarioII,QwfIthequantityofwaste
flowfromsourcetothelandfillinScenarioI,Pc1theunitcostofcollectionpertonofwaste
fromsourcetotheincinerationplant,Qwlthequantityofresidualbottomashthatissent
to the landfill,D1 thedistancebetween the incineratorand the landfill, andPc2 theunit
costofcollectionpertonperkmofbottomashfromtheincineratortothelandfill.
Theunit costper tonofwaste fromsource to the incinerationplant isobtained froma
studydoneforthecityofShenzhenonmunicipalsolidwastecollectioncost(LiandKong,
2011),whiletheunitcostpertonofwasteperkmisobtainedfromastudydoneforthe
municipality of Heping in the city of Tianjin (Research Office of Tianjing City Heping
Municipal People's Government, 2007). Furthermore, the price of collection cost
increaseseveryyearby6.17%perannum,calculatedas:
Rcr=rdn*pd/c+rwn*pw/c
where Rcr is the rate of collection cost increase per year, rdn the rate of diesel price
increaseperyear,pd/cthepercentageofdieselcostasacomponentofcollectioncost,rwn
therateofwageincreaseperyear,andpw/cthepercentageofwagecostasacomponent
ofcollectioncost.

46
rdn iscalculatedbasedonthedieselpriceinChinabetween2000and2012,whilerwn is
calculated based on the average wage level in Guanghan between 2004 and 2011
(StatisticBureauofDeyang,2012).Thepercentageofdiesel cost andwage cost as two
major componentsof collection cost,52.7%and15.5%respectively, isobtained froma
studybyWang (2009).Table4below lists the increasedcollection cost fromsource to
landfill.
Table4.Increasedcollectioncostfromsourcetolandfill

47
2)Incineratormaintenancecost
Incineratormaintenance cost is the costofmaintainingand repairing theequipmentat
theincinerationplant.Accordingtoastudyonwasteincinerationenterpriseinformation
system (Anon, 2011), the annual cost of maintenance is approximately 3% of capital
investmentontheequipment.Therefore3%isappliedtotheincineratortechnologyand
equipmentacquisitioncost(€71.7Mil fromTable3)tocalculatetheyearlymaintenance
cost(seeTable5):€2,146,000perannum.
Table5.Incineratormaintenancecost

48
3)Incineratoroperationalcost
The yearly operational cost of the incineration plant includes utility costs (water,
electricity,gas),humanresourcecosts,costofchemicalmaterialsneededforairpollution
control, cost of auxiliary fuel when needed, cost of materials for amenity and office
maintenance,andotheradministrativecosts,excludingequipmentmaintenancecost.An
averagecostequivalentto€13.9/tonofadmittedwasteiscalculatedasanaveragevalue
basedonthedataavailableinarecentfeasibilitystudyofawasteincineratorinvestment
in the city of Baoji (Anon, 2004?) and the study on waste incineration enterprise
informationsystem(Anon,2011).Theoperationalcosteveryyeariscalculatedas:
Co=Qwi*Po
whereCoistheoperationalcost,Qwithewasteinputintotheincinerator,andPotheunit
costofoperation.Table6belowliststheoperationalcosteveryyear.
Table6.Incineratoroperationalcost

49
4.2.3.SummaryofCosts
Table7belowgivesanoverviewofcostparametersduringthe21‐yearprojectperiodat
nominalvalue.Figure24showsthat the initial investmentcost isveryhigh,while from
the year of operation on annual costs rise steadily because of the increase in waste
volume. To even out cash flow, financing is needed. The financing cost, namely the
borrowing cost, assumed to be the averaged bank‐lending rate, which is used as the
discount rate, affects the result of the cost‐benefit analysis by influencing the present
valueoffuturecashflows.Thehighertheborrowingcost,theloweristhepresentvalueof
futurecashflows.
Table7.Summaryofcosts

50
Figure24.Trendofcost

51
4.3.Benefits
4.3.1.FixedBenefits
One impact parameter is identified as a fixed benefit: the saved cost of acquiring and
constructing additional landfill area. In the baseline Scenario, the current landfill will
reachitscapacityintheyear2025,bythenanewlandfillareaneedstobeacquiredanda
newlandfillconstructed;whileScenarioIIwillsustainthecurrentlandfilluntiltheendof
the 21‐year project. It is assumed that the new landfill to be constructedwill have the
same capacity and technical requirement as the current landfill, hence the cost of the
current landfill is applied, equivalent to€5,680,000 (SCEMC,2011).This is thepresent
valueof the cost. Topresent the valueof the cost in the year2024,which iswhen the
constructionactuallyshouldtakeplace,thefuturevalueofthecostiscalculatedas:
FVl=PV1*(1+i)^(2024‐2011)
whereFV1isthefuturevalueofthecostofacquiringandconstructinganewlandfill,PV1
thepresentvalueofthecostofacquiringandconstructinganewlandfill, i thediscount
rate,and(2024‐2011)thenumberofyearstoaccountfor.
Thefuturevalueisneededtoshowthecorrectyearwhenthecostoccurs,eventhoughat
the end itwill be discounted back to present value to obtain the NPV of the scenario.
Table8showsthecostofacquiringandconstructinganewlandfillin2024:
Table8.Savedcostofacquiringandconstructingadditionallandfillarea

52
4.3.2.VariableBenefits
1).Savedcostonsourceseparationandseparatecollectionofmetals
Source separation and separate collection is costly.According to a studyon the cost of
sourceseparationofhouseholdwasteinChina(Zhuangetal.,2008),itcostsanequivalent
of€10.7pertonofwastematerials forsourceseparation.Applyingthisunitcosttothe
quantity ofmetals that otherwisewouldhavebeen recoveredby separate collection in
the baseline scenario, the saved cost on source separation and separate collection of
metalseveryyeariscalculated(Table9).
Table9.Savedcostonsourceseparationandseparatecollectionofmetals
53
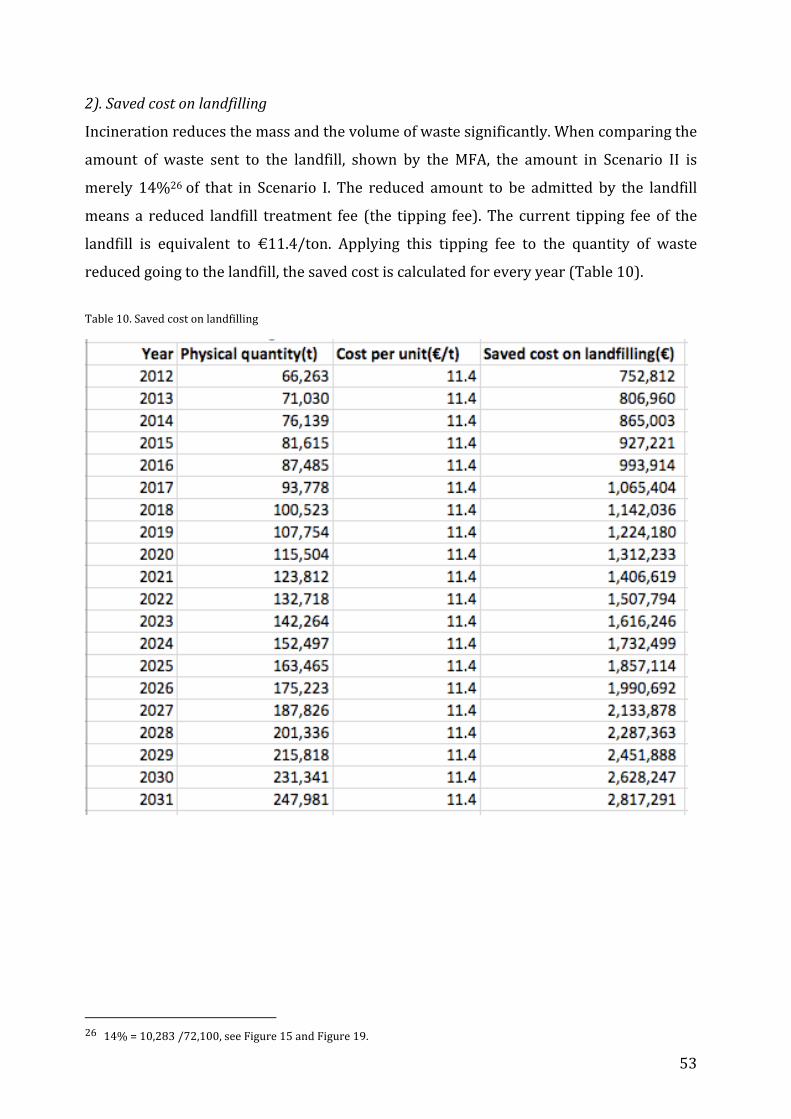
2).Savedcostonlandfilling
Incinerationreducesthemassandthevolumeofwastesignificantly.Whencomparingthe
amount of waste sent to the landfill, shown by the MFA, the amount in Scenario II is
merely 14%26of that in Scenario I. The reduced amount to be admitted by the landfill
means a reduced landfill treatment fee (the tipping fee). The current tipping fee of the
landfill is equivalent to €11.4/ton. Applying this tipping fee to the quantity of waste
reducedgoingtothelandfill,thesavedcostiscalculatedforeveryyear(Table10).
Table10.Savedcostonlandfilling
2614%=10,283/72,100,seeFigure15andFigure19.
54
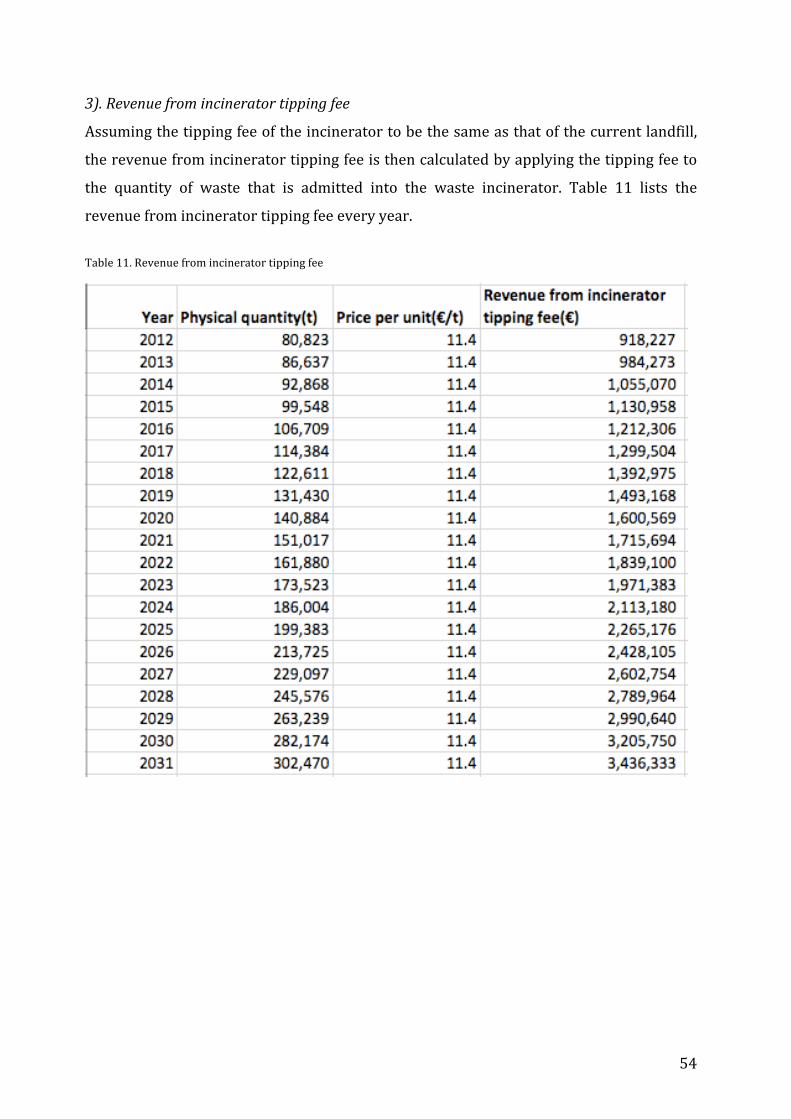
3).Revenuefromincineratortippingfee
Assumingthetippingfeeoftheincineratortobethesameasthatofthecurrentlandfill,
therevenuefromincineratortippingfeeisthencalculatedbyapplyingthetippingfeeto
the quantity of waste that is admitted into the waste incinerator. Table 11 lists the
revenuefromincineratortippingfeeeveryyear.
Table11.Revenuefromincineratortippingfee

55
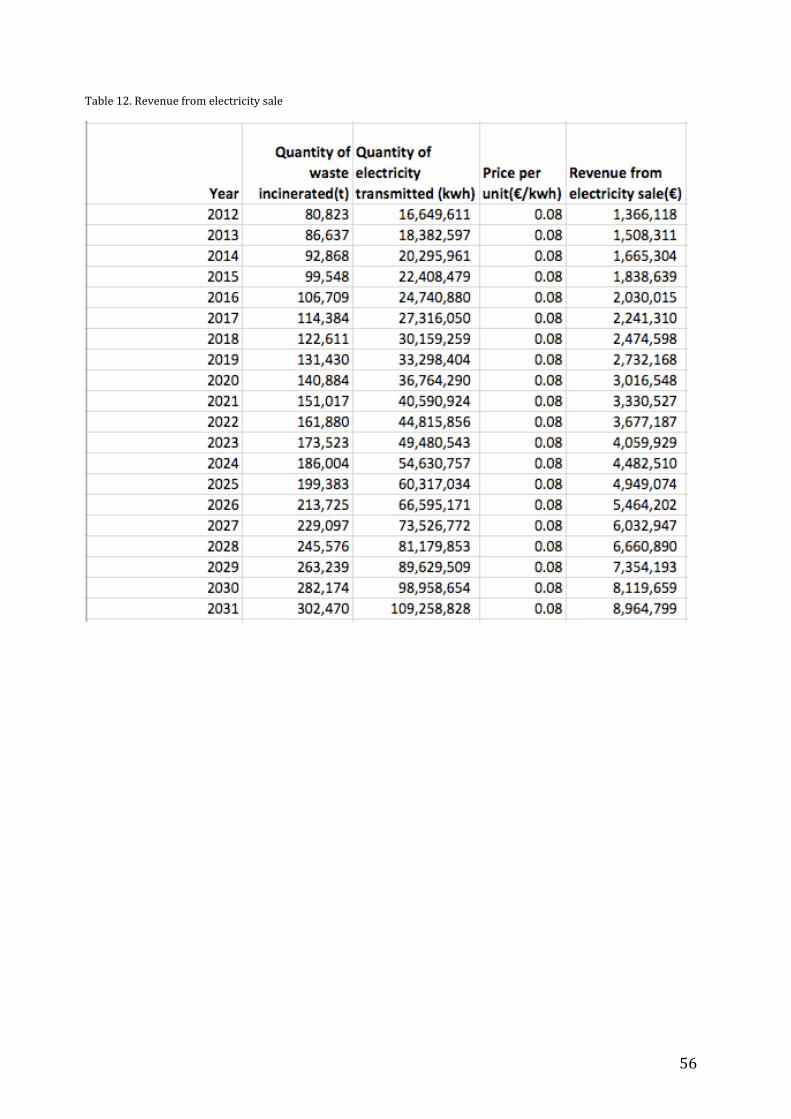
4).Revenuefromelectricitysale
Electricitysale fromwaste incinerators isstrictlyregulatedbytheChinesegovernment.
Theamendedregulationonwastetoenergyprojects(NationalDevelopmentandReform
Commission,2012)mandates thepriceofelectricitysold fromwaste incinerators tobe
0.65yuanperkilowatt‐hour,equivalentto€0.08/kwh(Article1).Article1alsomandates
280kwhofelectricitytransmissiontothepowergridpertonofwasteincineratedforthe
baseline calculation of total electricity transmitted by an incineration plant. Article 3.2
states that,when the total baseline transmission is lower than 50% of the actual total
transmission, the electricity is regarded as conventional electricity that does not fall
under this regulation;when thebaseline transmission ishigher than50%of theactual
total transmissionbut lower than theactual total transmission, thebaselinecalculation
appliesforreceivingtherevenue;andwhenthetotalbaselinetransmissionislowerthan
theactualtotaltransmission,theactualamountisappliedforreceivingtherevenue.The
municipalsolidwasteinGuanghanhasalowheatvalueof1,291kcal/kg,whichaccording
toastatisticalstudyonincineratorsoperatingduring2006‐2010inChina(Anon,2012?)
willbeabletotransmitapproximately200kwhofelectricitytothegridpertonofwaste
incinerated.Sincethis levelof transmissionfallsunderthethirdsituationinArticle3.2,
theactualtotaltransmissionisusedforcalculatingtherevenue.Inaddition,itisassumed
thattheheatingvalueofthewastewillincreaseby3%perannum.Iftheenergycapacity
oftheincinerationplantisassumedtobeplannedattheleveloffullcapacityin21years,
the 3% increase per annum could be reasonably applied to the quantity of electricity
transmittedaswell.Thusthecalculationoftherevenuefromtheelectricitysaleis:
Re=Qwi*200kwh/t*(100%+3%)^(tn–t1)*Pe
WhereReis the revenue from theelectricityproduced at the incinerator,Qwi thewaste
inputintotheincinerator,tnanyreferredyear,t1thefirstyearoftheproject(2011),and
Pe thepriceofelectricity soldby thewaste incinerator.Table12 lists the revenue flow
fromelectricitysaleeveryyear.
56
Table12.Revenuefromelectricitysale
57
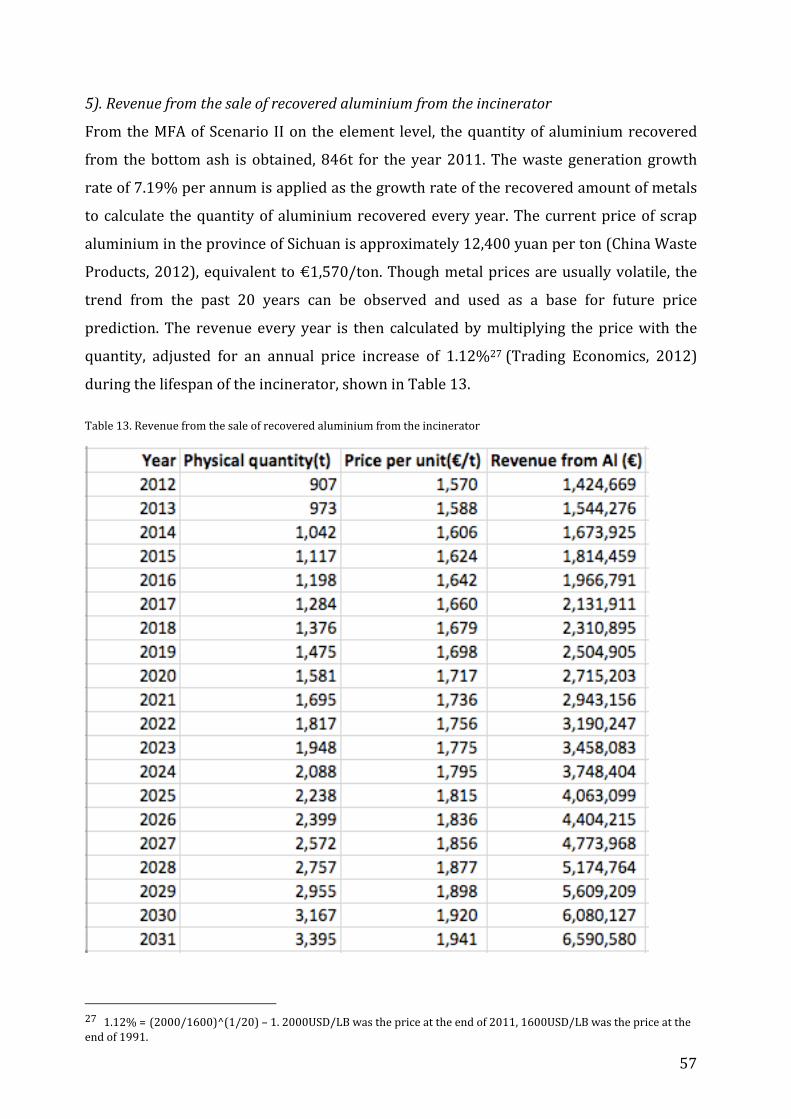
5).Revenuefromthesaleofrecoveredaluminiumfromtheincinerator
FromtheMFAofScenario IIon theelement level, thequantityofaluminiumrecovered
from thebottomash isobtained,846t for theyear2011.Thewastegenerationgrowth
rateof7.19%perannumisappliedasthegrowthrateoftherecoveredamountofmetals
tocalculate thequantityofaluminiumrecoveredeveryyear.Thecurrentpriceof scrap
aluminiumintheprovinceofSichuanisapproximately12,400yuanperton(ChinaWaste
Products,2012),equivalentto€1,570/ton.Thoughmetalpricesareusuallyvolatile, the
trend from the past 20 years can be observed and used as a base for future price
prediction.The revenueeveryyear is then calculatedbymultiplying thepricewith the
quantity, adjusted for an annual price increase of 1.12%27(Trading Economics, 2012)
duringthelifespanoftheincinerator,showninTable13.
Table13.Revenuefromthesaleofrecoveredaluminiumfromtheincinerator
271.12%=(2000/1600)^(1/20)–1.2000USD/LBwasthepriceattheendof2011,1600USD/LBwasthepriceattheendof1991.
58
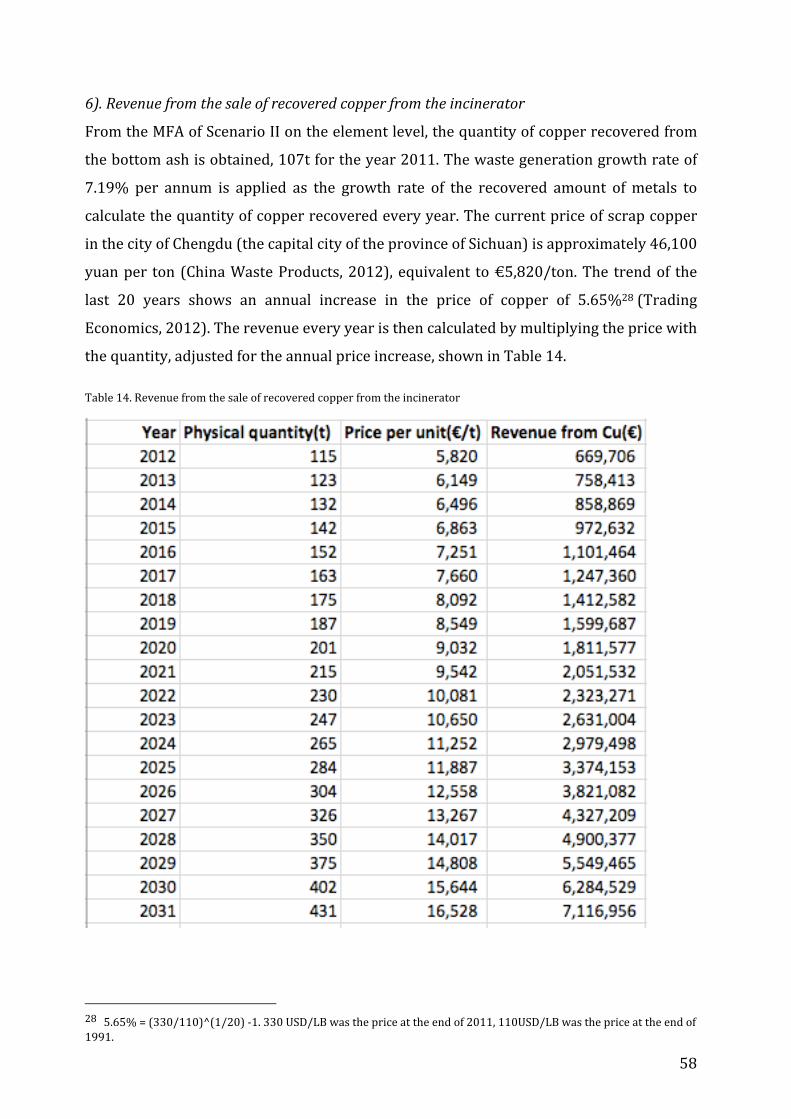
6).Revenuefromthesaleofrecoveredcopperfromtheincinerator
FromtheMFAofScenarioIIontheelementlevel,thequantityofcopperrecoveredfrom
thebottomashisobtained,107tfortheyear2011.Thewastegenerationgrowthrateof
7.19% per annum is applied as the growth rate of the recovered amount ofmetals to
calculatethequantityofcopperrecoveredeveryyear.Thecurrentpriceofscrapcopper
inthecityofChengdu(thecapitalcityoftheprovinceofSichuan)isapproximately46,100
yuanper ton(ChinaWasteProducts,2012),equivalent to€5,820/ton.The trendof the
last 20 years shows an annual increase in the price of copper of 5.65%28(Trading
Economics,2012).Therevenueeveryyearisthencalculatedbymultiplyingthepricewith
thequantity,adjustedfortheannualpriceincrease,showninTable14.
Table14.Revenuefromthesaleofrecoveredcopperfromtheincinerator
285.65%=(330/110)^(1/20)‐1.330USD/LBwasthepriceattheendof2011,110USD/LBwasthepriceattheendof1991.

59
7).Revenuefromthesaleofrecoveredironfromtheincinerator
FromtheMFAofScenarioIIontheelementlevel,thequantityofironrecoveredfromthe
bottomash is obtained, 2,620t for the year2011.Thewaste generation growth rate of
7.19% per annum is applied as the growth rate of the recovered amount ofmetals to
calculatethequantityofironrecoveredeveryyear.Thecurrentpriceofscrapironinthe
provinceofSichuanisapproximately1,820yuanperton(ChinaWasteProducts,2012),
equivalentto€230/ton.Thetrendofthelast20yearsshowsanannualpriceincreaseof
ironof5.66%29(U.S.GeologicalSurvey,2011).Therevenueeveryyearisthencalculated
bymultiplyingthepricewiththequantity,adjustedfortheannualpriceincrease,shown
inTable15.
Table15.Revenuefromthesaleofrecoveredironfromtheincinerator
295.66%=(319/106)^(1/20)‐1.319USD/twastheaveragepriceofscrapironin2010,106USD/twastheaveragepriceofscrapironin1990.

60
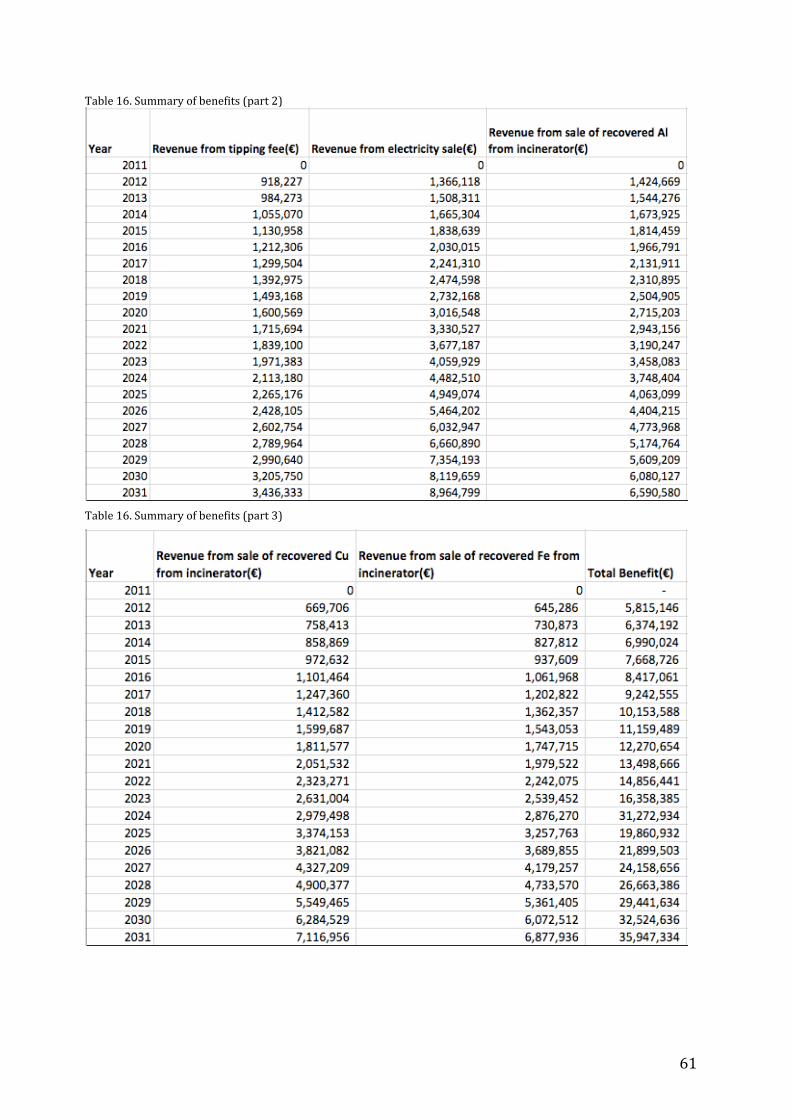
4.3.3.SummaryofBenefits
Table 16 below gives an overview of benefit parameters during the 21‐year period at
nominalvalue.Figure25showsthat fromyear2of theproject,which is theyearwhen
operation starts, benefits flow in steadily throughout the entire project because of the
steadyincreaseofwastegeneratedleadingtoanincreasingamountoftherevenuesource,
exceptforthe14thyear(2024).In2024,thebenefitsrisesteeplybecauseofthesavingof
thecostofconstructingthe landfill thatwouldotherwisehavebeenrequiredunderthe
baselinescenario.
Table16.Summaryofbenefits(part1)
61
Table16.Summaryofbenefits(part2)
Table16.Summaryofbenefits(part3)

62
Figure25.Trendofbenefits
63
4.4.Cost‐benefitAnalysisResultandSensitivityAnalysis
Result
InordertocalculatetheNPV,thedifferencebetweenthesumofdiscountedbenefitsand
thesumofdiscountedcosts,thepresentvalueofeachyear’scostsandbenefitsisatfirst
calculatedthensummedupforcomparison:
NPV=ΣBt(1+i)‐t‐ΣCt(1+i)‐t
Where B denotes benefit, C denotes cost, i the discount rate, and the summation runs
fromt=0(thefirstyearoftheproject:2011)tot=T(thelastyearoftheproject:2031).A
five‐yearaveragedbank‐lendingrateof6.73%isusedasthediscountrate.
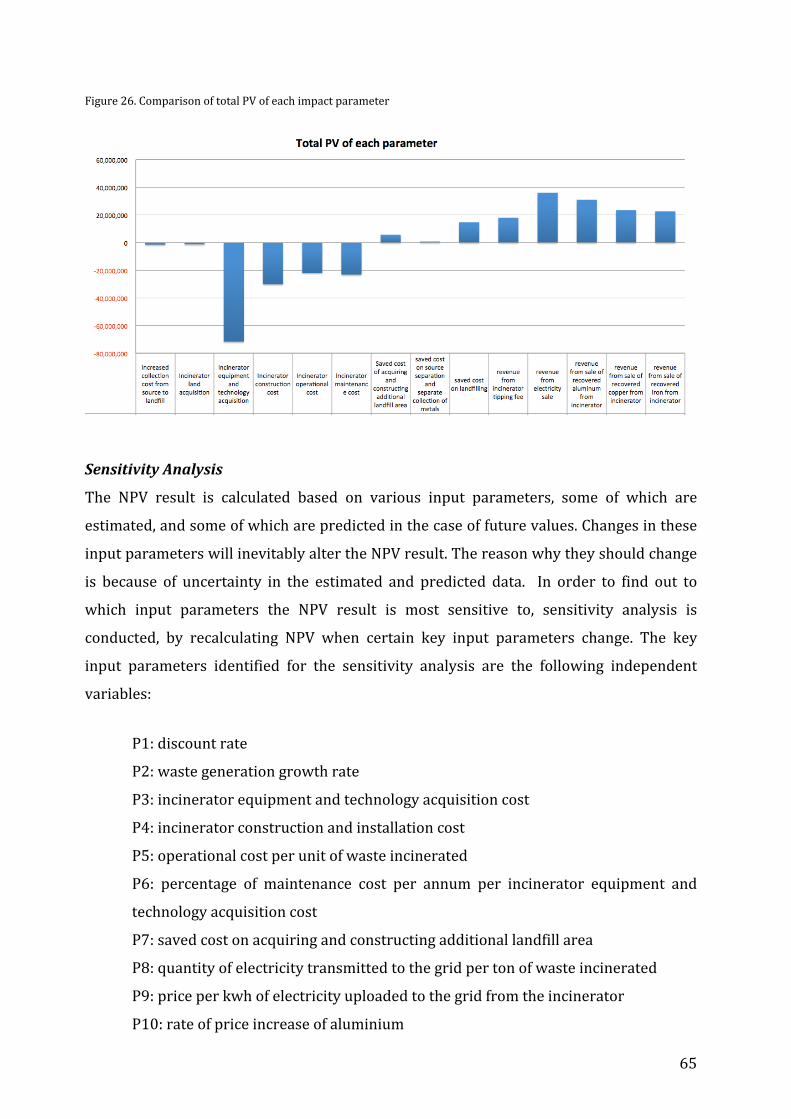
Table17showsthepresentvalueofeachyear’stotalcostsandthepresentvalueofeach
year’stotalbenefits,andattheendtheNPVasthedifferencebetweenthetotalpresent
value of total benefits and the total present value of total costs. An alternativeway of
calculating the NPV is to sum up the total present value of each impact parameter, as
presentedinTable18.Theimpactofeachparameter’stotalpresentvalueisthenclearly
shown in Figure 26: the cost of equipment and technology is the parameter most
influentialonthefinalresult,followedbyrevenuefromelectricitysale,revenuefromthe
saleofaluminiumandtheconstructioncostoftheincinerator.
The resultingNPV is apositive€2.3million,meaning theproposedScenario II ismore
efficient in itsallocationof resources incomparison to thebaselinescenariowithin the
waste management system of Guanghan. Such a positive result shows that waste
incineration is worth being taken into consideration by the municipal government of
Guanghanwhenplanningitsmunicipalsolidwastemanagementinthecomingdecade.

64
Table17.Resultofthecost‐benefitanalysis
Table18.Totalpresentvalueofeachimpactparameter
65
Figure26.ComparisonoftotalPVofeachimpactparameter
SensitivityAnalysis
The NPV result is calculated based on various input parameters, some of which are
estimated,andsomeofwhicharepredictedinthecaseoffuturevalues.Changesinthese
inputparameterswillinevitablyaltertheNPVresult.Thereasonwhytheyshouldchange
is because of uncertainty in the estimated and predicted data. In order to find out to
which input parameters the NPV result is most sensitive to, sensitivity analysis is
conducted, by recalculating NPV when certain key input parameters change. The key
input parameters identified for the sensitivity analysis are the following independent
variables:
P1:discountrate
P2:wastegenerationgrowthrate
P3:incineratorequipmentandtechnologyacquisitioncost
P4:incineratorconstructionandinstallationcost
P5:operationalcostperunitofwasteincinerated
P6: percentage of maintenance cost per annum per incinerator equipment and
technologyacquisitioncost
P7:savedcostonacquiringandconstructingadditionallandfillarea
P8:quantityofelectricitytransmittedtothegridpertonofwasteincinerated
P9:priceperkwhofelectricityuploadedtothegridfromtheincinerator
P10:rateofpriceincreaseofaluminium

66
P11:rateofpriceincreaseofcopper
P12:rateofpriceincreaseofiron
By applying a 3% increase in each of the key input parameters one at a time, the
percentage change of the NPV is observed for each of the 3% increases per input
parameter, holding other input parameters constant. As shown in Figure 27, the NPV
resultismostsensitivetoachangeinP2:wastegenerationgrowthrate;secondlytoP3:
incineratorequipmentandtechnologyacquisitioncost;andthirdlytoP3:discountrate;
followedbyP8:quantityofelectricitytransmittedtothegridpertonofwasteincinerated,
and P9: price per kwh of electricity uploaded to the grid from the incinerator. As
evidenced in reality, the capital cost of incineration plant, i.e. the equipment and
constructioncosts,arecriticaltotheeconomicfeasibilityofsuchproject.Inaddition,the
discount rate is usually an influential parameter for the NPV, and a 3% increase will
alreadybringtheNPVtonegative.Finally,theprojectlifespanispositivelycorrelatedto
theNPV.Tobespecific, theNPVstartstobecomepositiveonlyinthelastyear2031.In
China,alicenseisusuallygiventowasteincinerationprojectsfor25years,inwhichcase
theNPVwouldbeevenhigherthanthecurrentresult.
Figure27.Sensitivityanalysisgraph
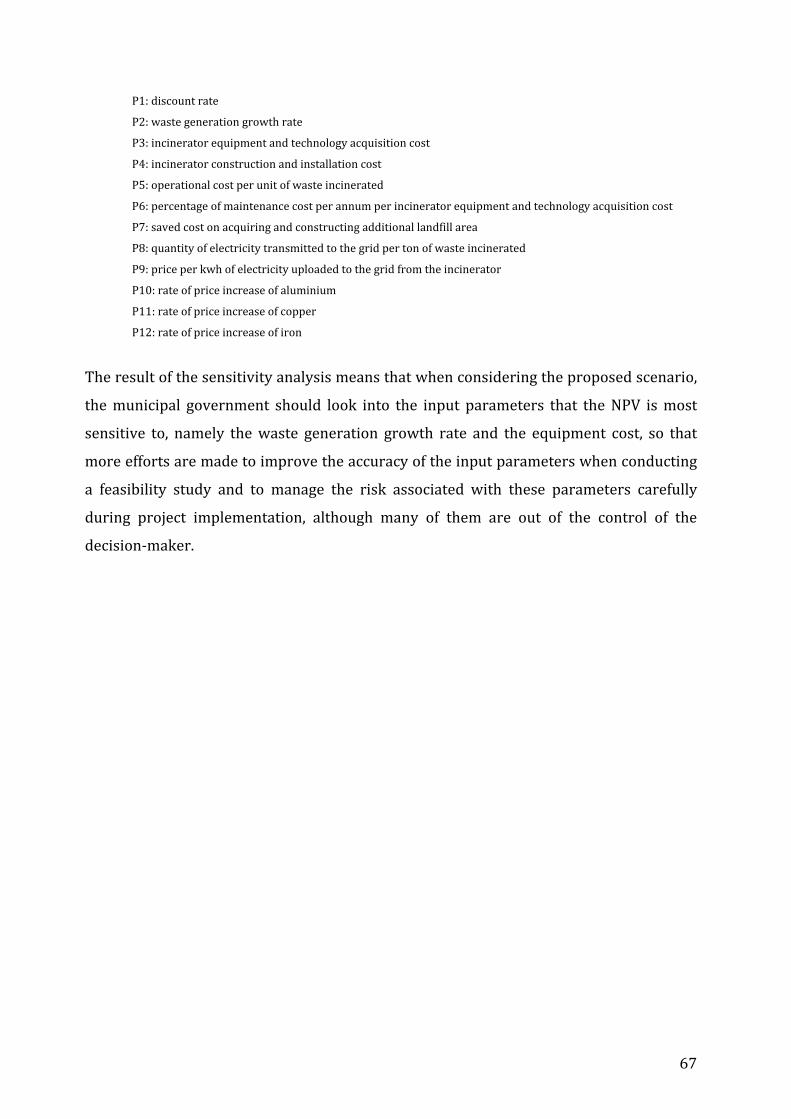
67
P1:discountrate
P2:wastegenerationgrowthrate
P3:incineratorequipmentandtechnologyacquisitioncost
P4:incineratorconstructionandinstallationcost
P5:operationalcostperunitofwasteincinerated
P6:percentageofmaintenancecostperannumperincineratorequipmentandtechnologyacquisitioncost
P7:savedcostonacquiringandconstructingadditionallandfillarea
P8:quantityofelectricitytransmittedtothegridpertonofwasteincinerated
P9:priceperkwhofelectricityuploadedtothegridfromtheincinerator
P10:rateofpriceincreaseofaluminium
P11:rateofpriceincreaseofcopper
P12:rateofpriceincreaseofiron
Theresultofthesensitivityanalysismeansthatwhenconsideringtheproposedscenario,
themunicipal government should look into the input parameters that theNPV ismost
sensitive to, namely thewaste generation growth rate and the equipment cost, so that
moreeffortsaremadetoimprovetheaccuracyoftheinputparameterswhenconducting
a feasibility study and to manage the risk associated with these parameters carefully
during project implementation, although many of them are out of the control of the
decision‐maker.
68
PartV.OtherConsiderationsOutoftheScopeoftheCost‐BenefitAnalysis
ThesocialandenvironmentalcostsandbenefitsthatariseinScenarioIImainlylieinthe
difference in the impactbetween landfillingand incineration. Inaddition to thegeneral
discussion on landfilling and incineration, a specific focus is put on the social impacts
brought by Scenario II in comparison with Scenario I. First of all, the existence of an
incineratorasanadditionalprocessinthesystemboundaryofthewasteflowinthecity
ofGuanghanmeansanadditionaldemand for labour.Employmentopportunitywillnot
only risebecauseof thedemandby the incinerator (estimated tobebetween60 to70
permanentemployees),butalsobecauseofthedemandbytheassociatedservices,such
asseparatecollection,logisticsdesign,etc.Secondly,byreducingtheamountoflandfilled
waste, the living environment of the farmers downstream of the landfill will improve;
additionally, as the farmland becomes less vulnerable to accidents from the landfill,
healthycropsandfewerhealthriskswillfollow.Sincethelandfillwillonlyburytreated
residualbottomash,theproblemofdiseasecontagionandbadsmellwilldisappear.
Ontheotherhand,sincemetalsarenotseparatedatsourceandnoseparatecollectionof
themisneeded, themetalcollectorswillnoteasilyaccept thefactthat theirbusiness is
takenawayandtakenoverbytheincinerationplant.Tosolvethisissue,employmentas
wellasapartnershipopportunitycouldbeofferedinawaythatthebenefitofrecovering
metals at the incinerator is fairly shared. The biggest issue in fact lies in the pollution
controloftheincinerationplant.InChina,asthenumberofwasteincineratorsrises,the
civil environmental movement is also progressing to the extent that community
oppositiontoafewwasteincinerationproposalshaspressuredlocalgovernmentstohalt
theseprojects.Fornewwasteincinerationprojectstoproceed,thegeneralpublicneeds
on one hand objective environmental education and on the other hand certainty over
emissioncontrol.Currentpublicopposition to incineration ispartlydue to ill‐informed
and popular media coverage on the level of toxic emissions from waste incinerators,
particularlyaboutdioxins.Someoftheinformationdoesnotreflecttherealityofstateof
the art pollution control technologies. Nevertheless, the concerns of the population
shouldbeaddressed,bestbyreal‐timeorclosetoreal‐timeemissionmonitoringonsite
andpublicdisplayoftheresultsofon‐goingmonitoring.

69
Socialandenvironmentalimpactsarenotquantifiedbecauseofthelackofempiricaldata
inthisrespectfortheregionunderconsideration.Moreover,theseimpactsarestrongly
influencedby thepoliticaland legalenvironment inChina,entailinghighuncertainty.A
cooperativeeffortwiththelocalandregionalgovernmentisessentialincarryingoutthe
quantificationandthevaluationofsocialandenvironmentalimpacts.
70
PartVI.Conclusion
WasteincinerationisacommonwastetreatmentmethodinlargepartsofEurope,where
the municipal solid waste system is integrated to a high extent, while in China waste
incinerationisstillinitsinfantstageofdevelopment:anaverage22%ofthewasteinEU
countriesisincinerated,comparedto13%inChina.Incinerationreducesthewastemass
andvolumeby70%and90%respectively;italsoreducesthechemicalreactivityofwaste
toa largeextent,reducingtheburdenon landfillssignificantly. Inaddition, incineration
utilises the energy in the waste, turning it into useful heat and electricity during the
incinerationprocess.Recoveryof ironalsocommonly takesplaceatwaste incinerators.
Despitetheseadvantages,Chinastillreliesprimarilyonlandfillingtotreatmunicipalsolid
waste.Themainreasonliesintheeconomicfactor: investmentandoperationalcostsof
wasteincinerationplantsishigh,asanewincineratorneedscapitalinvestmentexceeding
100 million euros. Such a high cost can not be compensated by revenue from energy
recovery.
Abreak‐throughtechnologywasdevelopedbyZARinSwitzerland,DevelopmentCentre
forSustainableManagementofRecyclableWasteandResourcesoftheCantonofZurich,
whichrunsitsoperationintheincinerationplantKEZOinHinwilandwhichisprovento
beconsistentlysuccessful.This technology incorporatesdrybottomashdischarge from
thecombustion furnace,separationofbottomash intodifferentsize fractions,magnetic
devices and eddy current method with smart engineering design, in order to recover
preciousmetalsfromthebottomash,namelyaluminium,copperandiron.Withsoaring
metalprices,thistechnologyshedsnewlightoninvestinginwasteincinerationplantsfor
low‐incomecountries.
Inordertofindoutifthistechnologyprovidessufficienteconomicbenefits,acost‐benefit
analysiswasconducted,basedonthecaseofamid‐sizedChinesemunicipality,Guanghan,
withapopulationof210,000.MaterialFlowAnalysisofthecurrentmunicipalsolidwaste
systeminGuanghanwasconductedtoidentifytheflowofwasteonthemasslevelandthe
metalsonthesubstancelevel.Thenabaselinescenariowasassumedforthepurposeof
thecostbenefitanalysis,whichdiffersfromthecurrentsysteminthatsourceseparation
and separate collection from source is in place instead of informal collectors and
71
scavengerscollectingrecyclablesatallspotswithinthesystem.Theassumptionofsucha
baselinescenarioisbasedonalong‐termviewthatsourceseparationisinevitableinthe
future.Thequestionwith thecostbenefitanalysisofScenario II is thatwhetherbynot
separatingthemetalsatsourceandinsteadrecoveringthemfromthebottomashofthe
incineratorisaneconomicallymoreefficientwaythanthebaselinescenario.
The result of the cost‐benefit analysis, a positiveNPVof 2millionEuros, indicates that
Scenario II ismoreefficient inresourceallocationthanthebaselinescenariowithinthe
wastemanagementsystemofGuanghan.Theresultprovidescritical informationforthe
decision‐makersof themunicipalgovernment inassisting themtoplan thecity’swaste
management system, particularly in considering whether to incorporate a waste
incinerationplantwithresourcerecoverytechnologyandadvancedairpollutioncontrol
equipment,andifso,whethermetalsneedtobeseparatedatsource.Theresultmeans,
even if themetal content in themunicipal solidwaste in Guanghan becomes the same
level as that in Switzerland (three times its the current level), the newmetal recovery
technologywouldnotmaketheinvestment,operationalandmaintenancecostlesscritical
for theeconomic feasibilityofwaste incineration investment. In fact, it is still themost
criticalfactor,andmustbereducedfortheinvestmenttobeeconomicallyfeasible.
Asensitivityanalysis identifiedcertainkeyinputparameters,thevariationofwhichthe
resultofthecost‐benefitanalysisissensitiveto.Amongtheidentifiedinputparameters,
themunicipalgovernmentshouldlookintothoseinputparametersthattheNPVismost
sensitive to: thewaste generation growth rate, the investment cost on equipment and
technologyandthediscountrate,sothatmoreeffortsaremadetoimprovetheaccuracy
of these input parameterswhen conducting a feasibility study and tomanage the risk
associatedwiththeseparameterscarefullyduringprojectimplementation.
72
Bibliography
Anonymous,2004?.FeasibilityReportofAMunicipalSolidWasteIncinerationPlantinBaoji(inChinese).[online]Availableat:http://www.cn‐hw.net/plus/download.php?open=0&aid=29477&cid=3[Accessed15August2012].Anonymous,2011.WasteIncinerationEnterpriseProductionandManagementInformationSystem–ProjectImplementation(inChinese).[online]Availableat:http://www.docin.com/p‐274230144.html[Accessed10August2012].Anonymous,2012?.NationwideConstructedandBeing‐ConstructedMunicipalSolidWasteIncinerationPlantsandtheMajorParameters(inChinese).[online]Availableat:http://www.doc88.com/p‐307515107638.html[Accessed10August2012].Asthana,A.,Ménard,Y.,Sessiecq,P.,Patisson,F.,2010.ModellingOn‐GrateMSWIncinerationwithExperimentalValidationinaBatchIncinerator.Industrial&EngineeringChemistryResearch.[e‐journal]49(16),p.7597–7604.Availablethrough:ACSPublicationsdatabase,at:http://pubs.acs.org/doi/abs/10.1021/ie100175e[Accessed23May2012].BankofChina,2012.RenminbiBorrowingRate(inChinese).[online]Availableat:http://www.boc.cn/finadata/lilv/fd32/[Accessed5August2012].Bass,E.S.,Calderon,R.L.,Khan,M.E.,1990.HouseholdHazardousWaste:Areviewofpublicattitudesanddisposalproblems.JournalofEnvironmentalHealth.[online].Availableat:http://infohouse.p2ric.org/ref/33/32403.pdf[Accessed11May2012].Brunner,P.H.,2011.UrbanMining:AContributiontoReindustrializingtheCity.JournalofIndustrialEcology.[online].Availableat:https://www.kth.se/social/upload/4ea9a52cf27654531a000026/Brunner%202011.pdf[Accessed13May2012].Brunner,P.H.,Fellner,J.,2006.From1to10to100€/PersonandYear–UniformWasteSolutionsforEveryone?In:ISWA/DAKOFAAnnualCongress2006.Copenhagen,Denmark,1‐5October2006.[online]Availableat:http://www.google.com/url?sa=t&rct=j&q=&esrc=s&source=web&cd=19&ved=0CGMQFjAIOAo&url=http%3A%2F%2Fwww.solarwte.org%2Fpub%2FTutzing%2FWebHome%2FPaul_Brunner_1‐10‐100__Person‐Year_waste_solutions_article.pdf&ei=ySOxT‐u9FMfStAaF4pDXBg&usg=AFQjCNHY3WTpWj4ELsB_31NaYCCEWvYRog[Accessed14May2012].Chimenos,J.M.,Segarra,M.,Fernandez,M.A.,Espiell,F.,1999.CharacterisationoftheBottomAshinMunicipalSolidWasteIncinerator.JournalofHazardousMaterials.[e‐journal]64(3),p.211‐222.Availablethrough:SciVersedatabase,at:
73
http://www.sciencedirect.com/science/article/pii/S0304389498002465[Accessed11May2012].ChinaWasteProducts,2012.PriceofScrapAluminiuminSichuanasatthe13thAugust2012(inChinese).[online]Availableat:http://www.zgfp.com/price/View/40/181166.htm[Accessed15August2012].ChinaWasteProducts,2012.PriceofScrapCopperinChengduasatthe13thAugust2012(inChinese).[online]Availableat:http://www.zgfp.com/price/View/61/181140.htm[Accessed15August2012].ChinaWasteProducts,2012.PriceofScrapIroninSichuanasatthe10thAugust2012(inChinese).[online]Availableat:http://www.zgfp.com/price/View/14/180758.htm[Accessed15August2012].DeyangEnvironmentalProtectionBureau,2010.AletterfromDeyangEnvironmentalProtectionBureauaboutregulatingmunicipalsolidwastetreatmentsites(inChinese).[online]27May.Availableat:http://www.dyhb.gov.cn/fggw/UploadFiles_1576/201005/2010052710452363.doc[Accessed29June2012].DeyangUrbanAppearanceandEnvironmentalHygieneDepartment,2012.Municipalsolidwasteanalysis(inChinese).Deyang:DeyangUrbanAppearanceandEnvironmentalHygieneDepartment.Dong,Y.,2011.DevelopmentofWaste‐To‐EnergyinChina;andCaseStudyoftheGuangzhouLikengWTEplant.M.S.ColombiaUniversity.[online]Availableat:http://www.google.com/url?sa=t&rct=j&q=&esrc=s&source=web&cd=1&ved=0CFYQFjAA&url=http%3A%2F%2Fwww.seas.columbia.edu%2Fearth%2Fwtert%2Fsofos%2FDong_thesis.pdf&ei=fTyxT5iDJIPRsgbIqo2wBA&usg=AFQjCNHLKsh2lHLAoO4J‐jxUIGaiwc1kQA[Accessed14May2012].Eurostat,2012.Landfillstillaccountedfornearly40%ofmunicipalwastetreatedintheEU27in2010.[pressrelease],27March2012,Availableat:http://ec.europa.eu/malta/news/28.03.12_landfill_en.htm[Accessed17May2012].FederalMinistryforSoilandForestry,EnvironmentandWaterManagement,2002.StatusoftheTechnologyatWasteIncinerationPlants(inGerman).[online]Availableat:http://www.google.com/url?sa=t&rct=j&q=&esrc=s&source=web&cd=1&ved=0CCEQFjAA&url=http%3A%2F%2Fwww.umweltbundesamt.at%2Ffileadmin%2Fsite%2Fumweltthemen%2Findustrie%2Fpdfs%2Fendversion_deutsch.pdf&ei=PdtJUK‐oCIHf4QSutYDwCg&usg=AFQjCNFEj6AkdtclC‐FCPSLO98H6jsp7dQ&cad=rja[Accessed1September2012].
74
Fruergaard,T.,Christensen,T.H.,Astrup,T.,2010.Energyrecoveryfromwasteincineration:Assessingtheimportanceofdistrictheatingnetworks.WasteManagement.[e‐journal]30(7),p.1264‐1272.Availablethrough:SciVersedatabase,at:http://www.sciencedirect.com/science/article/pii/S0956053X10001959[Accessed11May2012].
Giugliano,M.,Cernuschi,S.,Grosso,M.,Rigamonti,L.,2011.Materialandenergyrecoveryinintegratedwastemanagementsystems:Anevaluationbasedonlifecycleassessment.WasteManagement.[e‐journal]31(9‐10),p.2092‐2101.Availablethrough:SciVersedatabase,at:http://www.sciencedirect.com/science/article/pii/S0956053X11001140[Accessed24July2012].
Giusti,L.,2009.Areviewofwastemanagementpracticesandtheirimpactonhumanhealth.WasteManagement.[e‐journal]29(8),p.2227‐2239.Availablethrough:SciVersedatabase,at:http://www.sciencedirect.com/science/article/pii/S0956053X09001275[Accessed18May2012].
GlobalEnvironmentCentreFoundation(GEC),2002.RotaryKilnFurnace.[online]July,2002.Availableat:http://nett21.gec.jp/jsim_data/waste/waste_3/html/doc_431.html[Accessed22May2012].
Green&BlueGroup,2012.IncineratorforMunicipalSolidWasteinKualaLumpur.[online]10April.Availableat:http://greenbluegroup.blogspot.co.at/2012/04/incinerator‐for‐municipal‐solid‐waste.html[Accessed12June2012].
Grosso,M.,Biganzoli,L.,Riganmonti,L.,2011.Aquantitativeestimateofpotentialaluminiumrecoveryfromincinerationbottomashes.Resources,ConservationandRecycling.[e‐journal]55(12),p.1178‐1184.Availablethrough:SciVersedatabase,at:http://www.sciencedirect.com/science/article/pii/S0921344911001625[Accessed14May2012].
He,P.J.,Song,L.Q.,Zhang,H.,Shi,A.J.,Zhang,P.J.,2003.Characterizationofwasteincinerationbottomashanditsbeneficialuseprospect(inChinese).ChinaEnvironmentalScience.23(4),p.395‐398.[online]Availableat:http://paper.solidwaste.com.cn/upfile/onload/200604131829356657502.pdf[Accessed15May2012].
Hogg,D., ,2012.���������������������������������������������.[pdf]EuropeanCommission.Availableat:http://ec.europa.eu/environment/waste/studies/eucostwaste_management.htm[Accessed7May2012].Hu,D.,Wang,R.S.,Yan,J.S.,Xu,C.,Wang,Y.B.,1998.Apilotecologicalengineeringproject

75
formunicipalsolidwastereduction,disinfection,regenerationandindustrialisationinGuanghanCity,China.EcologicalEngineering.[e‐journal]11(1‐4),p.129‐138.Availablethrough:SciVersedatabasehttp://www.sciencedirect.com/science/article/pii/S0925857498000676[Accessed10June2012].
Hu,Y.,Bakker,M.C.M.,deHeij,P.G.,2011.Recoveryanddistributionofincineratedaluminiumpackagingwaste.WasteManagement.[e‐journal]31(12),p.2422‐2430.Availablethrough:SciVersedatabase,at:http://www.sciencedirect.com/science/article/pii/S0956053X1100328X[Accessed15May2012].
LandandResourcesDepartmentofSichuanProvince,2012.DeyangCityGuanghanMunicipalityLandCategorisationandStandardPrices(inChinese).[online]Availableat:http://www.scdlr.gov.cn/portal/site/site/portal/sc/common_c.portal%5BcontentId=194857%5D%5BcategoryId=4305%5D%5BcategoryCode=001001002040%5D[Accessed10August2012].
Lave,L.B.,Hendrickson,C.T.,Conway‐Schempf,N.M,McMichael,F.C.,1999.MunicipalSolidWasteRecyclingIssues,JournalofEnvironmentalEngineering,[online].Availableat:http://msl1.mit.edu/classes/esd123/2003/bottles/MunicipalSolidWasterRecyclingIssues.pdf[Accessed11May2012].Li,Z.,Kong,L.Y.,2011.MunicipalSolidWasteCollectionModel–ACaseStudyoftheCityofShenzhen(inChinese).[online]Availableat:http://www.cn‐hw.net/html/31/201106/28032_3.html[Accessed11August2012].Muchova,L.,Bakker,E.,Rem,P.,2009.PreciousMetalsinMunicipalSolidWasteIncinerationBottomAsh.Water,Air&SoilPollutions:Focus.[e‐journal]9(1‐2),p.107‐116.Availablethrough:SpringerLinkdatabase[Accessed15May2012].OfficeofthePeople’sGovernmentinDeyang,2009.Announcementaboutchargingmunicipalsolidwastetreatmentfee(Chinese).[online]2June.Availableat:http://www.0838hw.cn/news_list1.asp?pro_id=1187[Accessed29May2012].NationalDevelopmentandReformCommission,2012.AnnouncementfromtheNationalDevelopmentandReformCommissionaboutthePricingofElectricityProducedfromMunicipalSolidWasteIncinerators(inChinese).[online]Availableat:http://www.gov.cn/zwgk/2012‐04/10/content_2109921.htm[Accessed13August2012].
PollutionIssues,2012.Incineration.[online]Availableat:http://www.pollutionissues.com/Ho‐Li/Incineration.html[Accessed25May2012].
76
Qing,G.Z.,2012.InformationonGuanghanMunicipalWaste.[email](Personalcommunication,onthe5th,7thofJune2012andonthe30thofJuly2012).
Rand,T.,Haukohl,J.,Marxen,U.,2000.Municipalsolidwasteincineration:requirementsforasuccessfulproject.[e‐book]WashingtonD.C.:WorldBank.Availableat:http://books.google.at/books?hl=en&lr=&id=A2fBYOFJoJAC&oi=fnd&pg=PR5&dq=cost+of+waste+incineration+plant&ots=sZghznI3B7&sig=zudtZjN1ozHogpT6ZMTzNRteObc&redir_esc=y#v=onepage&q=cost%20of%20waste%20incineration%20plant&f=false[Accessed14May2012].
ResearchOfficeofTianjingCityHepingMunicipalPeople'sGovernment,2007.ThoughtsonReformingMunicipalSolidWasteCollectionMethod(inChinese).[online]Availableat:http://www.tjhp.gov.cn/servlet/ContentServer?cid=1126853433413&pagename=tjhp%2FHPart%2Fxxhcont‐1&c=HPart&p1=1104109915433[Accessed11August2012].
SCEMC(SichuanEnvironmentalMonitoringCentre),2011.Environmentalprotectioncheckandacceptancedisclosurereport,川環檢字(2010)第098號,projectname:Guanghan
municipalsolidwastesanitarylandfill(inChinese).Chengdu:SCEMC.
Scharff,H.,2006.ImplementationoftheLandfillDirective–Dutchexperience.In:2ndIndia–EUEnvironmentForum.NewDehli,India,2006.[online]Availableat:http://www.google.com/url?sa=t&rct=j&q=&esrc=s&source=web&cd=35&ved=0CGEQFjAEOB4&url=http%3A%2F%2Fec.europa.eu%2Fenvironment%2Finternational_issues%2Fpresentations%2Fheisch.pdf&ei=siGxT9qvLYjitQbq‐KmuBg&usg=AFQjCNHEeZ045r3krCRONGv6cDb_q_Tktw[Accessed14May2012].
Schuster,H.,1999.WasteIncinerationPlantsinAustria:WithDataonWasteManagementinVienna.[pdf]Vienna:Greenpeace.Availableat:http://www.google.com/url?sa=t&rct=j&q=&esrc=s&source=web&cd=1&ved=0CHIQFjAA&url=http%3A%2F%2Fwww.gipuzkoa.net%2Fincineradora%2FIncinerationAustria.pdf&ei=nOmwT4_mG8vDswa964yuBg&usg=AFQjCNFE1tRcM2O7amJN8vbKHQp8PT1_1Q[Accessed14May].Solenthaler,B.,Bunge,R.,2003.WasteIncinerationinChina.[pdf]Rapperswil:InstitutfürangewandteUmwelttechnik.Availableat:http://www.umtec.ch/fileadmin/user_upload/umtec.hsr.ch/Dokumente/Doku‐Download/Publikationen/Waste_Incineration_China.pdf[Accessed15May2012].
Spoerri,A.,Lang,D.J.,Staeubli,B.,Scholz,R.W.,2010.TechnologicalchangeinSwissthermalwastetreatment:Anexpert‐basedsocio‐technicalanalysis.WasteManagement.[e‐journal]30(7),p.1382‐1394.Availablethrough:SciVersedatabase,at:http://www.sciencedirect.com/science/article/pii/S0956053X10000942[Accessed15May2012].

77
StatisticBureauofDeyang,2012.StatisticalYearbook(inChinese).[online]Availableat:http://www.dytj.gov.cn/other/tjdata/nianjian/default.htm[Accessed12August2012].
Tabasová,A.,Kropáča,J.,Kermesa,V.,Nemetb,A.,Stehlík,P.,2012.Waste‐to‐energytechnologies:Impactonenvironment.Energy.[e‐journal]http://www.sciencedirect.com/science/article/pii/S0360544212000199Availablethrough:SciVersedatabase[Accessed23May2012].
Tai,J.,Zhang,W.Q.,Che,Y.,Feng,D.,2011.Municipalsolidwastesource‐separatedcollectioninChina:Acomparativeanalysis.WasteManagement.[e‐journal]31(8),p.1673‐1682.Availablethrough:SciVersedatabasehttp://www.sciencedirect.com/science/article/pii/S0956053X11001589[Accessed15June2012].TradingEconomics,2012.Commodity(Aluminium).[online]Availableat:http://www.tradingeconomics.com/commodity/aluminum[Accessed]14August2012].TradingEconomics,2012.Commodity(Copper).[online]Availableat:http://www.tradingeconomics.com/commodity/copper[Accessed14August2012].UnitedNationsEnvironmentProgramme,2011.RecyclingRatesofMetals‐Astatusreport,AReportoftheWorkingGroupontheGlobalMetalFlowstotheInternationalResourcePanel.Graedel,T.E.;Allwood,J.;Birat,J.‐P.;Reck,B.K.;Sibley,S.F.;Sonnemann,G.;Buchert,M.;Hagelüken,C.[pdf]Availableat:http://www.unep.org/resourcepanel/Portals/24102/PDFs/Metals_Recycling_Rates_110412‐1.pdf[Accessed2September2012].U.S.GeologicalSurvey,2011.HistoricalStatisticsforMineralandMaterialCommoditiesintheUnitedStates.[online]Availableat:http://minerals.usgs.gov/ds/2005/140/[Accessed15August2012].VanBrecht,A.,Wauters,G.,Konings,A.,2012.InnovativeandBREFprovenmaterialrecyclingofbottomashes.In:Värmeforsks,AshUtilisation2012:AshesinaSustainableSociety.Stockholm,Sweden,January25‐27,2012.[online]Availableat:http://www.varmeforsk.se/files/program/askor/Andres_van_brecht_utan.pdf[Accessed13May2012].VanCaneghem,J.,Brems,A.,Lievens,P.,Block,C.,Billen,P.,Vermeulen,I.,Dewil,R.,Baeyens,J.,Vandecasteele,C.,2012.Fluidizedbedwasteincinerators:Design,operationalandenvironmentalissues.ProgressinEnergyandCombustionScience.[e‐journal]38(4),p.551‐582.Availablethrough:SciVersedatabase,at:http://www.sciencedirect.com/science/article/pii/S0360128512000160[Accessed23May2012].

78
Wang,H.,Nie,Y.,2001.MunicipalSolidWasteCharacteristicsandManagementinChina.JournaloftheAir&WasteManagementAssociation.[e‐journal]51(2),p.250‐263.Availablethrough:Taylor&Francisdatabasehttp://dx.doi.org/10.1080/10473289.2001.10464266[Accessed18May2012].
Wang,L.,2009.TheLineHaulCostandCostDriversforRoadFreightTransportationinChina.In:IEEM(IndustrialEngineeringandEngineeringManagement),The2009IEEEInternationalConferenceonIndustrialEngineeringandEngineeringManagement.HongKong,8‐11December2009.[online]Availableat:http://ieeexplore.ieee.org/xpl/login.jsp?tp=&arnumber=5373135&tag=1&url=http%3A%2F%2Fieeexplore.ieee.org%2Fxpls%2Fabs_all.jsp%3Farnumber%3D5373135%26tag%3D1[Accessed11August2012].
Winderickx,2012.Grateincineratorforcommunalwaste.[online]Availableat:http://www.winderickx.pl/en/msw_municipal_waste_incinerators.php[Accessed23May2012].
WorldBank,1999.MunicipalSolidWasteIncineration:Requirementsforasuccessfulproject.[pdf]WashingtonDC:TheWorldBank.Availableat:http://www‐wds.worldbank.org/external/default/WDSContentServer/WDSP/IB/2000/08/14/000094946_00072505420045/Rendered/PDF/multi_page.pdf[Accessed11June2012].
WRAP,2009.Comparingthecostofwastetreatmentoption.[pdf]Oxon:WRAP.Availableat:http://www.google.com/url?sa=t&rct=j&q=&esrc=s&source=web&cd=3&ved=0CGoQFjAC&url=http%3A%2F%2Fwww.wrap.org.uk%2Fsites%2Ffiles%2Fwrap%2FW504GateFeesWEB2009.b06b2d8d.7613.pdf&ei=h‐2wT_q3HoPAswbc_5i6Bg&usg=AFQjCNEpfbQ4pbU64iy_qrbF2IE4TVZxzg[Accessed14May2012].WuzhouEngineeringDesignandResearchCentre,2010.FeasibilityReportonTonghuaWastetoEnergyIncinerationPlant(inChinese).[online]Availableat:http://www.cn‐hw.net/plus/download.php?open=0&aid=24553&cid=3[Accessed10August2012].ZentrumFürNachhaltigeAbfall‐UndRessourcennutzung(ZAR),Böni,D.,DiLorenzo,F.,2011.ExperimentstoIncreasetheEfficiencyofEddyCurrentSeparators:AdditionalSeparationofNE‐MetalsfromtheFineBottomAsh(inGerman)[pdf]Zurich:ZAR.Availableat:http://www.zarch.ch/images/stories/OeffentlicheDokumente/110708_bericht_ne_abscheider.pdf[Accessed13May2012].Zhang,H.,He,P.J.,2012.BeneficialUsesofMunicipalWasteCombustionAsh(inChinese).[online]ChinaMunicipalSolidWasteForum.Availableat:http://www.msw.com.cn/file/upload/201201/07/03‐01‐58‐60‐1.pdf[Accessed15May

79
2012].Zhang,Y.M.,Shang,X.B.,Li,K.M.,Zhang,C.S.,Zhang,K.F.,Rong,H.W.,2011.TechnologiesstatusandmanagementstrategiesofmunicipalsolidwastedisposalinChina(inChinese).EcologyandEnvironmentalSciences(inChinese).20(2),p.389‐296.[online]Availableat:http://www.jeesci.com/article/2011/02/32%E5%BC%A0%E8%8B%B1%E6%B0%91389‐396.pdf[Accessed17May2012].Zhao,Y.,Si,J.T.,Tian,B.G.,Wang,H.T.,Lu,W.J.,2007.Methodoftechnologychoosingofmunicipalwastetreatmentanddisposal:I.Modelstudy(inChinese).ActaScientiarumNaturaliumUniversitatisPekinensis.[e‐journal]43(6),p.834‐848.[online]Availableat:http://d.wanfangdata.com.cn/periodical_bjdxxb200706017.aspx[Accessed24July2012].
Zhuang,Y.,Wu,S.W.,Wang,Y.L.,Wu,W.X.,andChen,Y.X.,2008.Sourceseparationofhouseholdwaste:AcasestudyinChina.WasteManagement[e‐journal]28(10),p.2022‐2030.Availablethrough:SciVersedatabase:http://www.sciencedirect.com/science/article/pii/S0956053X07002619[Accessed16August2012].