Embed Size (px)
Citation preview
A Critical Analysis of THz Applications:
The Intersection of Science and Technology
Frank C. De Lucia
Department of Physics
Ohio State University
We will consider the matching of technical approaches to applications in the THz spectral region. Particular attention will be
paid to the physics of the interaction of the radiation and matter, how this physics leads to selection of technology, and, indeed,
if the application is feasible. In many cases quantitative or semi-quantitative analyses are possible. Emphasis will be placed
on using these analyses to identify especially attractive paths to applications that can be competitive for wide spread adoption.
Specific results will be presented for both point and remote chemical sensors that are based on high resolution and brightness
electronic sources. Sensitivity, specificity, and background clutter and interference will be considered quantitatively. Paths to
low cost and compact THz electronic sensors will be described. Technical descriptions of the hardware implementations,
analysis of the interactions of this hardware with the molecular signatures, and analysis methods will be presented.
DTRA
May 29, 2012
Ft. Belvior, VA
Content
Physics: A Guide to Applications and Appropriate Technology
Examples Point gas sensors
Remote gas sensors
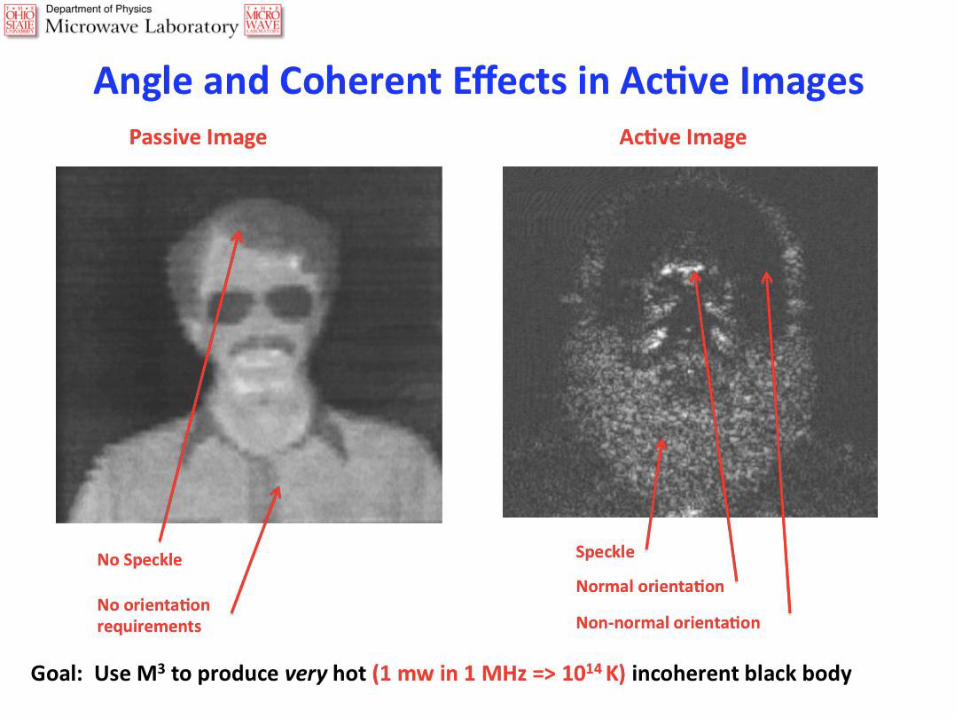
Imaging
special alignment and illumination requirements
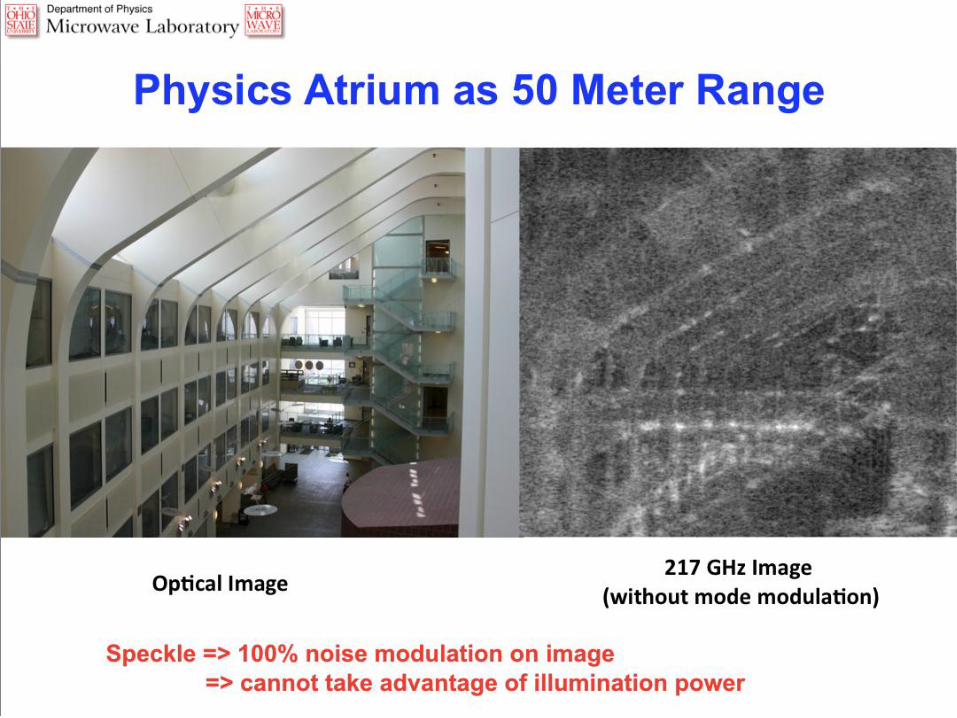
coherent effects (speckle)
A few comments on bio
Implementation and Comparisons R & D base for the THz vs IR, MS/GC, etc.
6.1 Research
Paths Forward Near term based of well defined strengths (specificity, small sample, . .)
What is possible with mature THz science and technology (broadening applicability)
The THz: A Useful Combination Applications often based on combination of attributes:
Penetration Angular Resolution Spectroscopic Capability
At what frequency within the THz (0.1 – 10 THz) do we execute this compromise?
Attributes typically are steep powers of frequency
How do we choose an appropriate technology?
Figures of merit – especially power/dynamic range vs. brightness; orders of magnitude
Analysis needed to supplement qualitative concepts to choose useful paths forward.
“Whispered Excitement about the THz” Graham Jordan
Opening Plenary Presentation
SPIE Symposium: Optics/Photonics in Security and Defense
Bruges, Belgium, 26 September, 2005
_________________________
Goal today:
To sort through some of the hype and clutter so that we can better see
the path forward in the THz (SMM, MM, FIR, NMM, . . .)
Themes:
There is a diversity of applications with similar technical requirements
Electronic technical approaches are very competitive
Leveraging the mass market is fundamental to success
The Physics:
A Guide to Applications and
Appropriate Technology
kT
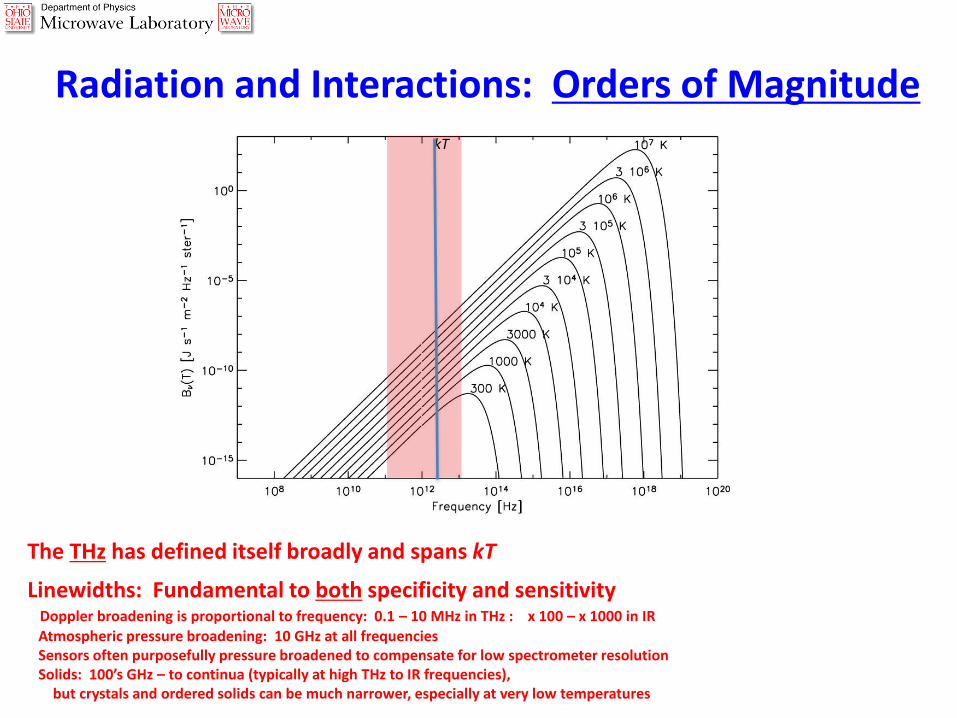
The THz has defined itself broadly and spans kT
Radiation and Interactions: Orders of Magnitude
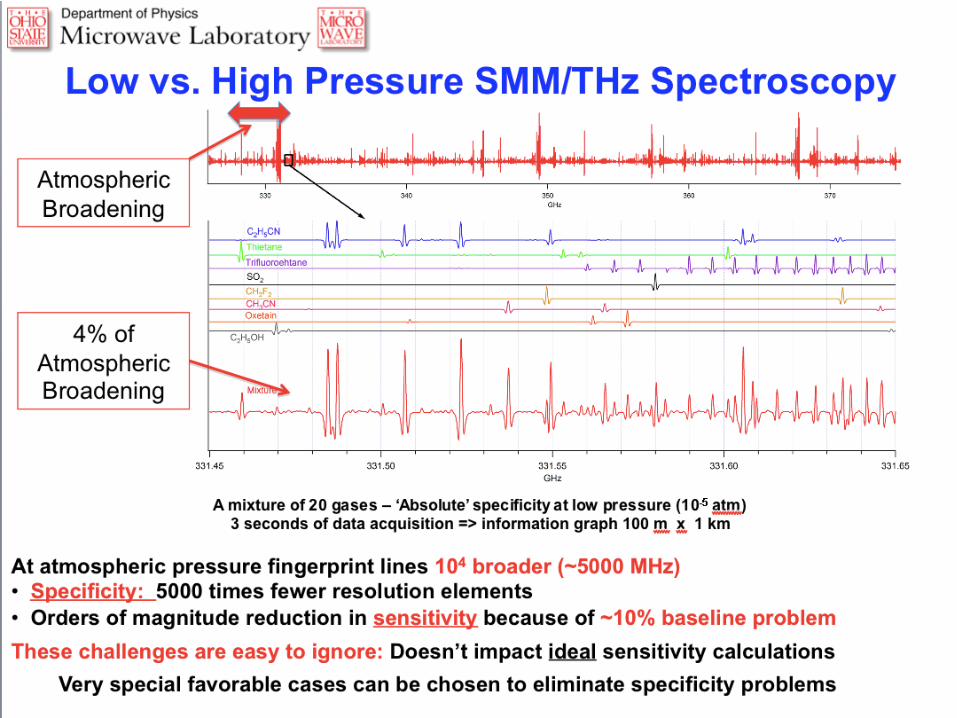
Linewidths: Fundamental to both specificity and sensitivity Doppler broadening is proportional to frequency: 0.1 – 10 MHz in THz : x 100 – x 1000 in IR
Atmospheric pressure broadening: 10 GHz at all frequencies Sensors often purposefully pressure broadened to compensate for low spectrometer resolution Solids: 100’s GHz – to continua (typically at high THz to IR frequencies), but crystals and ordered solids can be much narrower, especially at very low temperatures
kT
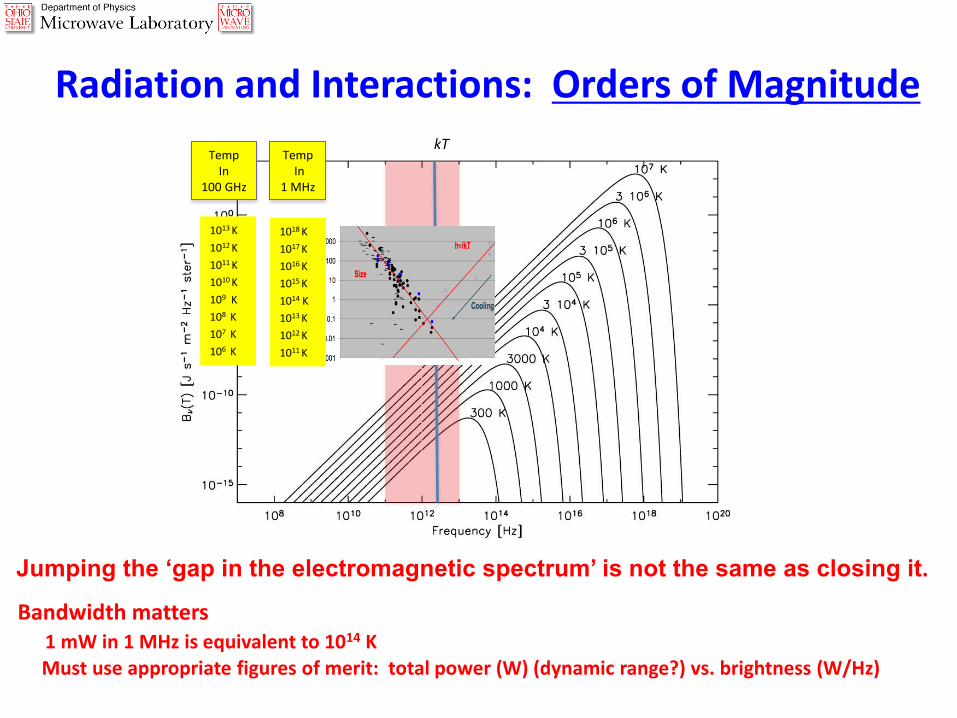
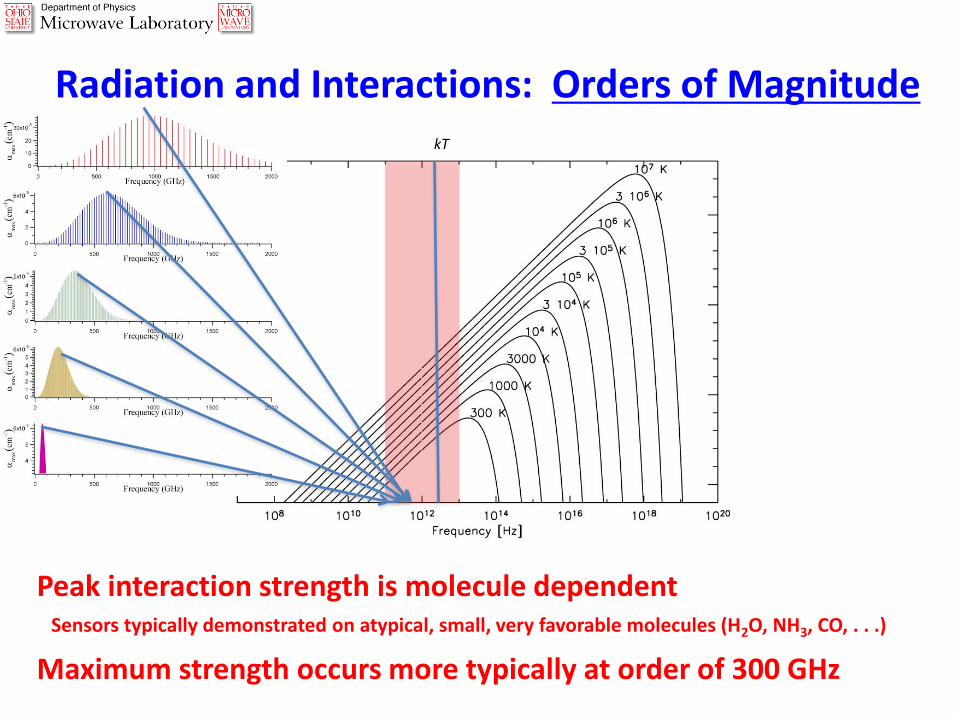
Radiation and Interactions: Orders of Magnitude
1018 K
1017 K
1016 K
1015 K
1014 K
1013 K
1012 K
1011 K
Temp In
1 MHz
1013 K
1012 K
1011 K
1010 K
109 K
108 K
107 K
106 K
Temp In
100 GHz
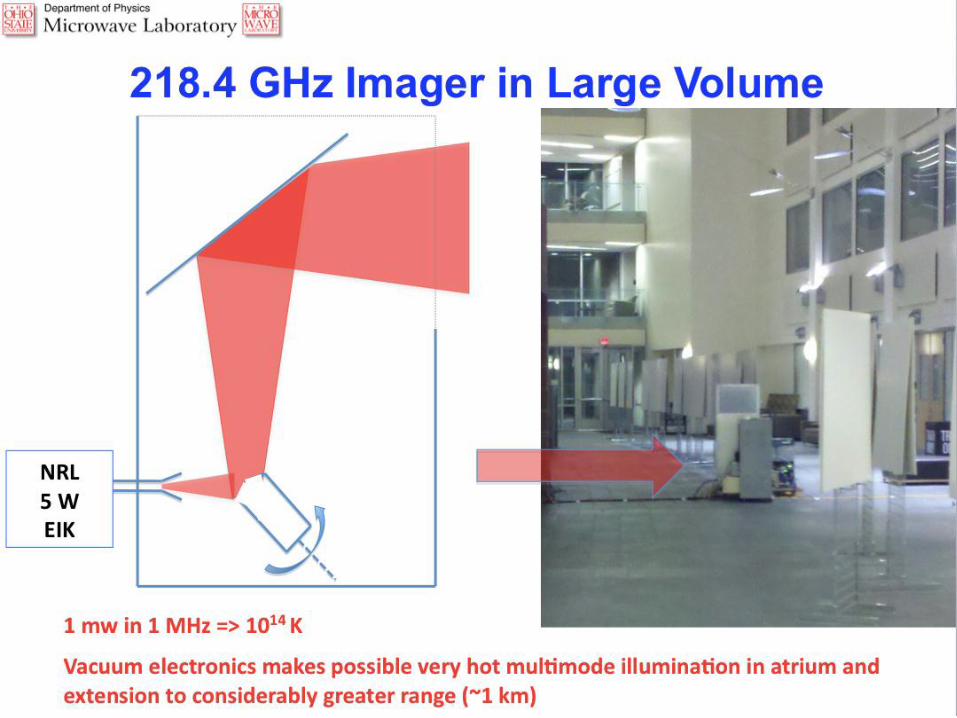
Bandwidth matters 1 mW in 1 MHz is equivalent to 1014 K Must use appropriate figures of merit: total power (W) (dynamic range?) vs. brightness (W/Hz)
Jumping the ‘gap in the electromagnetic spectrum’ is not the same as closing it.
kT
Radiation and Interactions: Orders of Magnitude
Peak interaction strength is molecule dependent Sensors typically demonstrated on atypical, small, very favorable molecules (H2O, NH3, CO, . . .)
Maximum strength occurs more typically at order of 300 GHz
kT
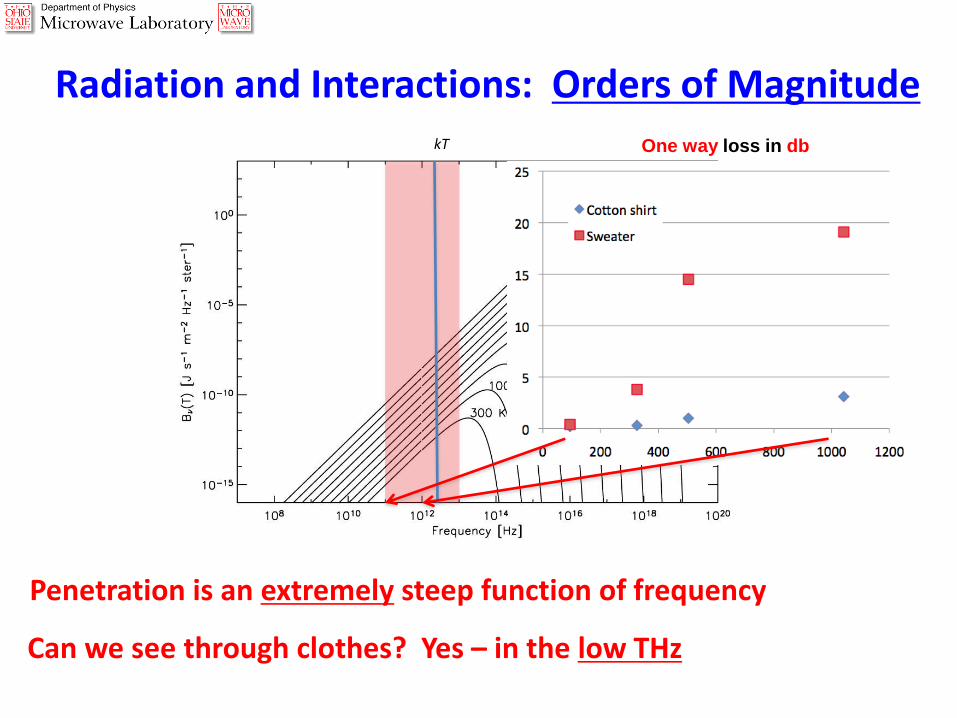
Penetration is an extremely steep function of frequency
Can we see through clothes? Yes – in the low THz
Radiation and Interactions: Orders of Magnitude
One way loss in db
kT
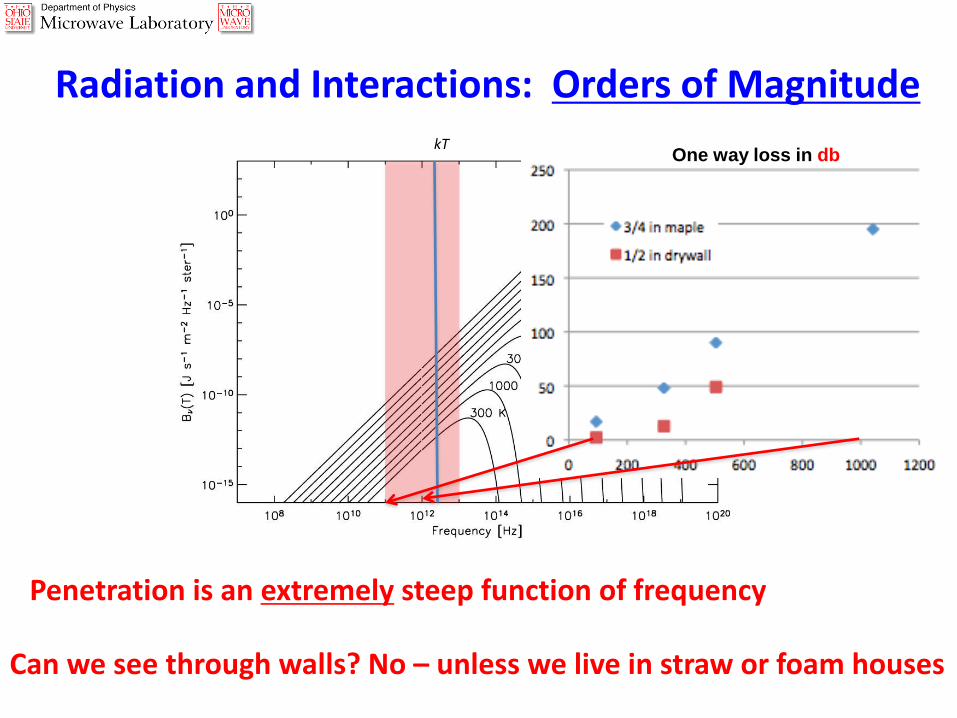
Penetration is an extremely steep function of frequency
Can we see through walls? No – unless we live in straw or foam houses
Radiation and Interactions: Orders of Magnitude
One way loss in db
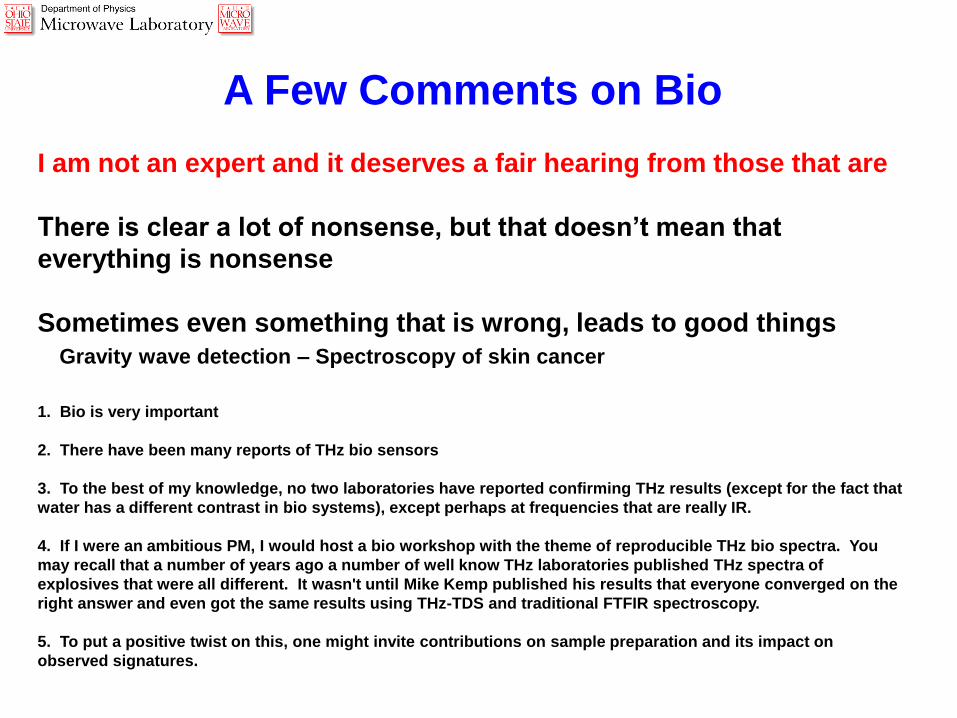
A Few Comments on Bio
I am not an expert and it deserves a fair hearing from those that are
There is clear a lot of nonsense, but that doesn’t mean that
everything is nonsense
Sometimes even something that is wrong, leads to good things
Gravity wave detection – Spectroscopy of skin cancer
1. Bio is very important
2. There have been many reports of THz bio sensors
3. To the best of my knowledge, no two laboratories have reported confirming THz results (except for the fact that
water has a different contrast in bio systems), except perhaps at frequencies that are really IR.
4. If I were an ambitious PM, I would host a bio workshop with the theme of reproducible THz bio spectra. You
may recall that a number of years ago a number of well know THz laboratories published THz spectra of
explosives that were all different. It wasn't until Mike Kemp published his results that everyone converged on the
right answer and even got the same results using THz-TDS and traditional FTFIR spectroscopy.
5. To put a positive twist on this, one might invite contributions on sample preparation and its impact on
observed signatures.
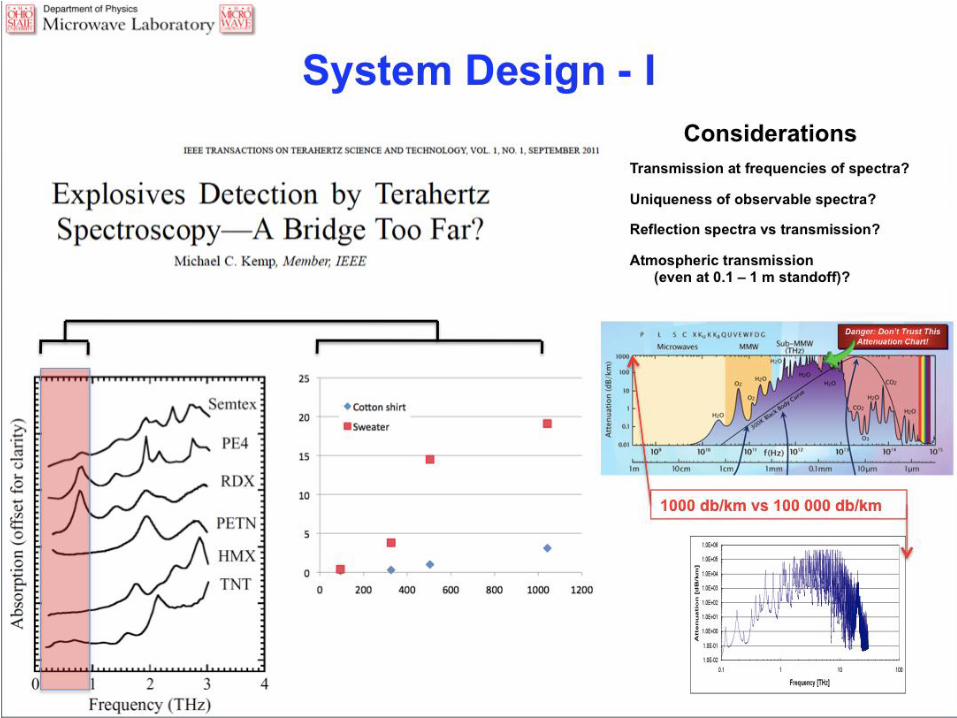
System Design - II
Examples
(How the physics drives system choices)
Point Gas Sensors
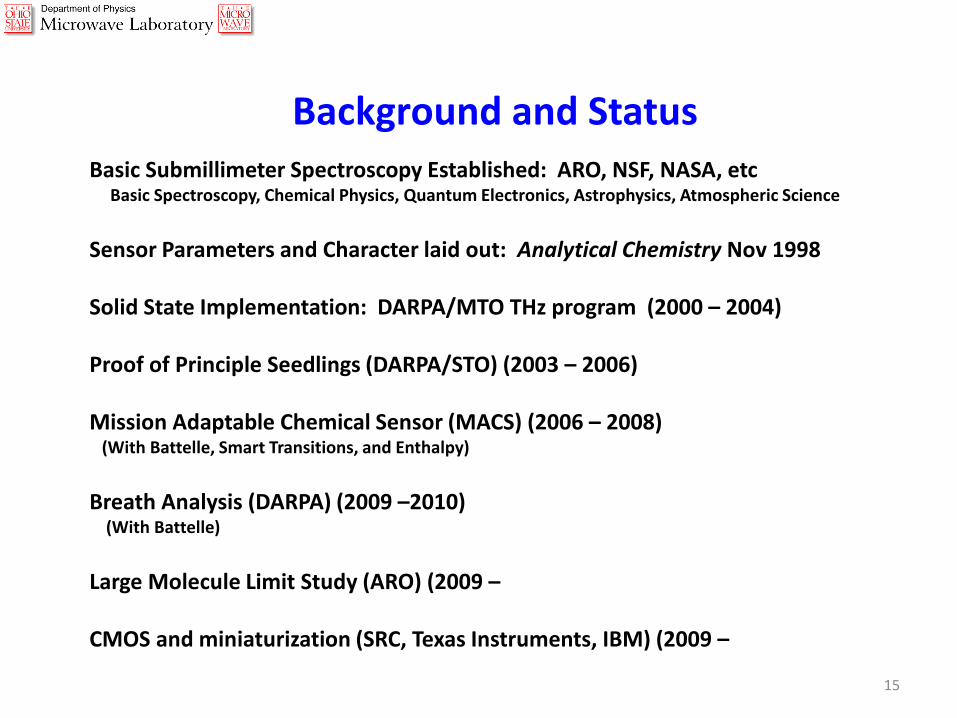
Background and Status
Basic Submillimeter Spectroscopy Established: ARO, NSF, NASA, etc Basic Spectroscopy, Chemical Physics, Quantum Electronics, Astrophysics, Atmospheric Science
Sensor Parameters and Character laid out: Analytical Chemistry Nov 1998 Solid State Implementation: DARPA/MTO THz program (2000 – 2004) Proof of Principle Seedlings (DARPA/STO) (2003 – 2006) Mission Adaptable Chemical Sensor (MACS) (2006 – 2008) (With Battelle, Smart Transitions, and Enthalpy)
Breath Analysis (DARPA) (2009 –2010) (With Battelle)
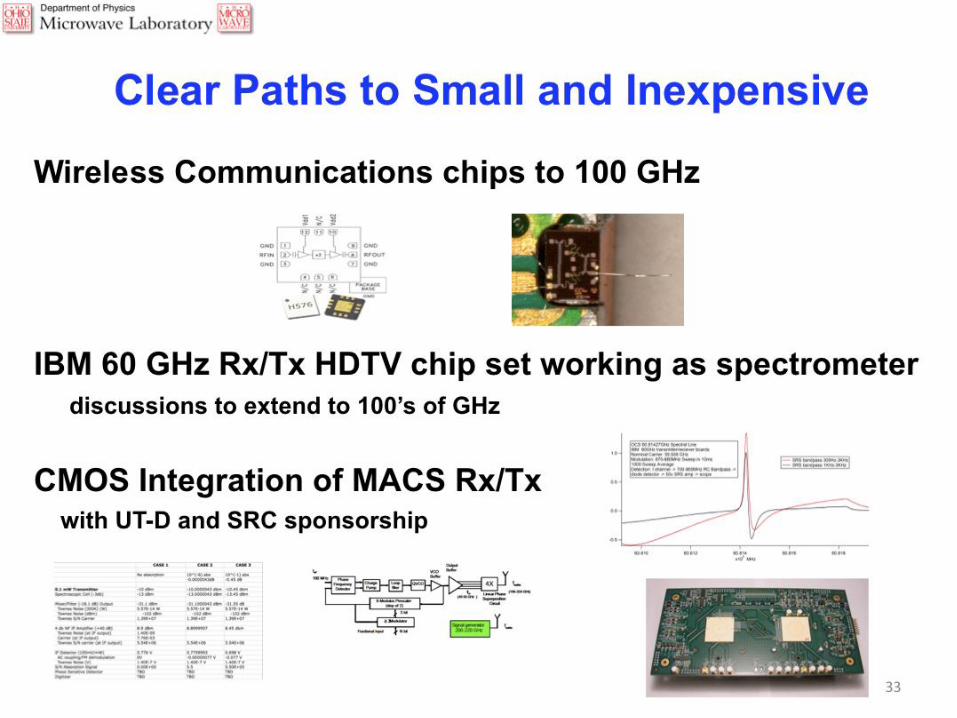
Large Molecule Limit Study (ARO) (2009 – CMOS and miniaturization (SRC, Texas Instruments, IBM) (2009 –
15
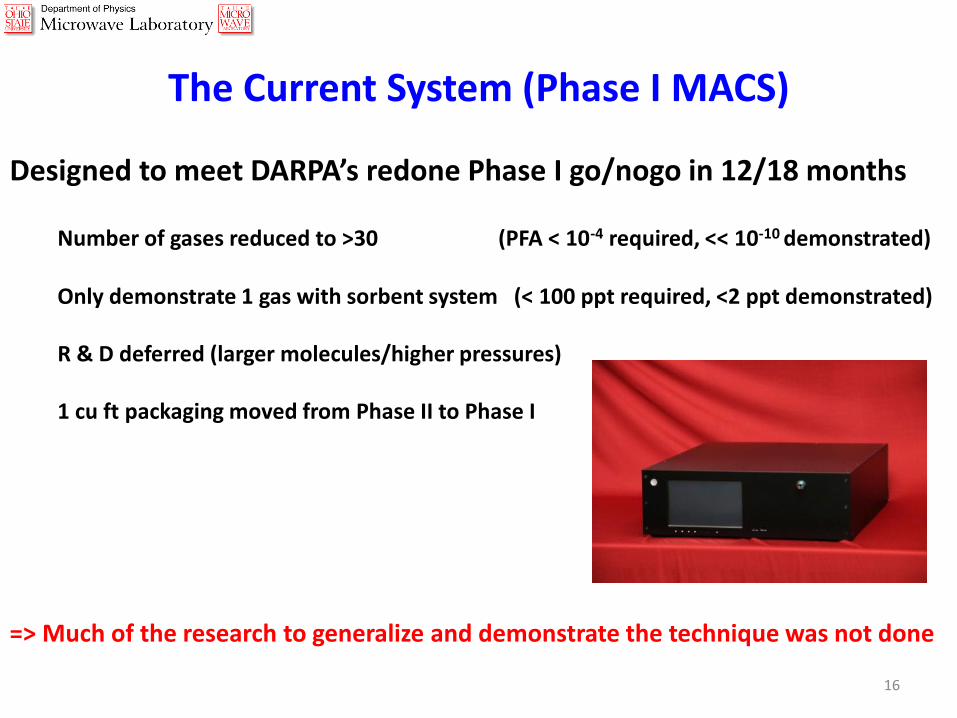
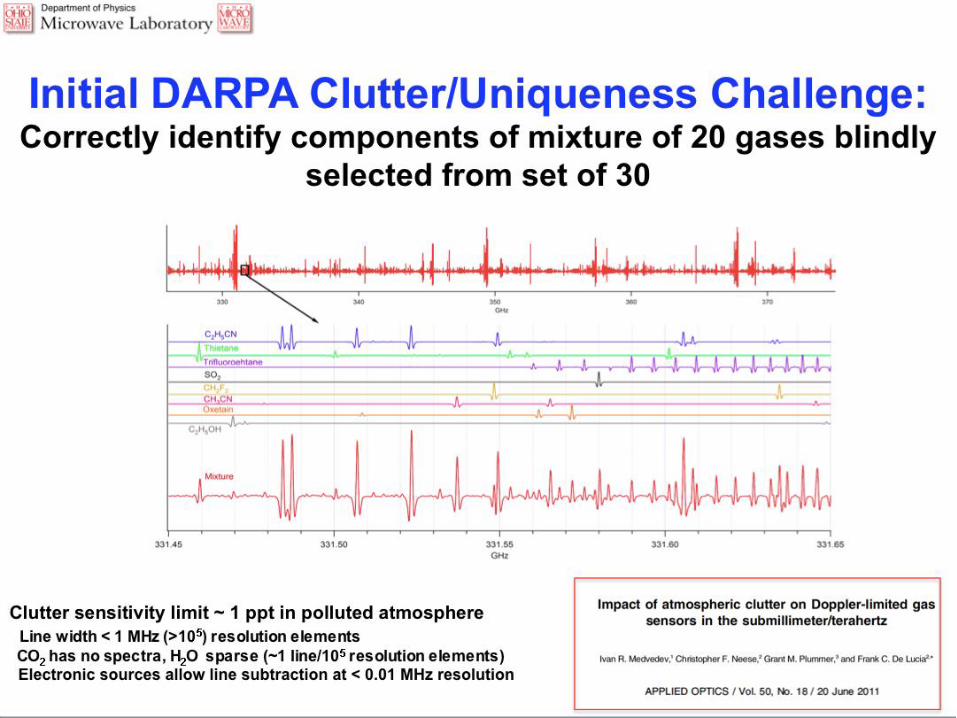
The Current System (Phase I MACS) Designed to meet DARPA’s redone Phase I go/nogo in 12/18 months
Number of gases reduced to >30 (PFA < 10-4 required, << 10-10 demonstrated) Only demonstrate 1 gas with sorbent system (< 100 ppt required, <2 ppt demonstrated) R & D deferred (larger molecules/higher pressures) 1 cu ft packaging moved from Phase II to Phase I
=> Much of the research to generalize and demonstrate the technique was not done
16
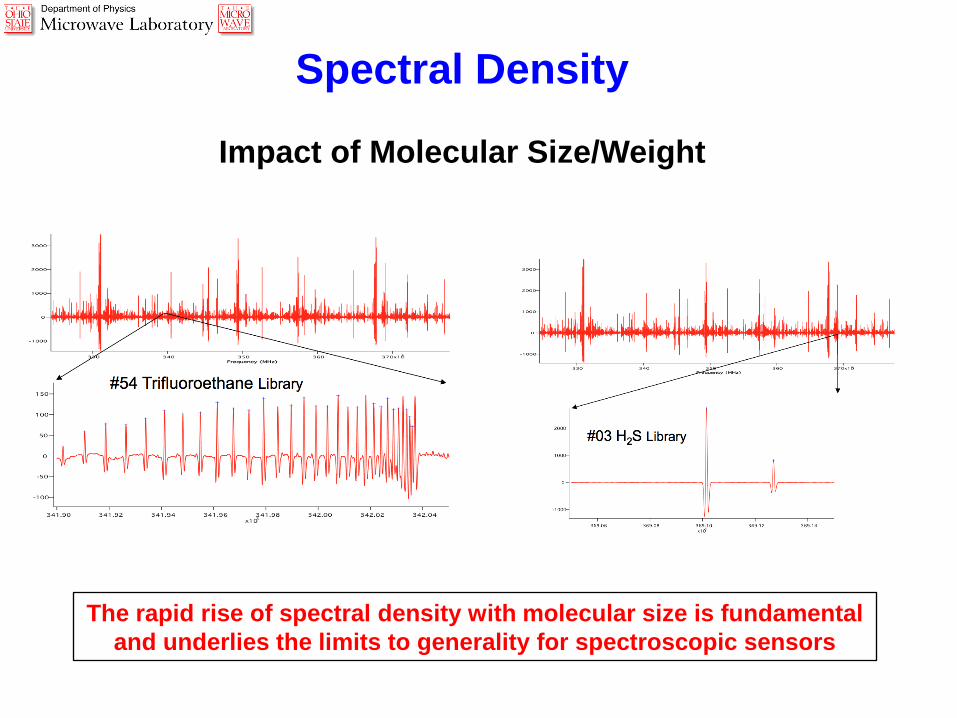
Spectral Density
Impact of Molecular Size/Weight
The rapid rise of spectral density with molecular size is fundamental
and underlies the limits to generality for spectroscopic sensors
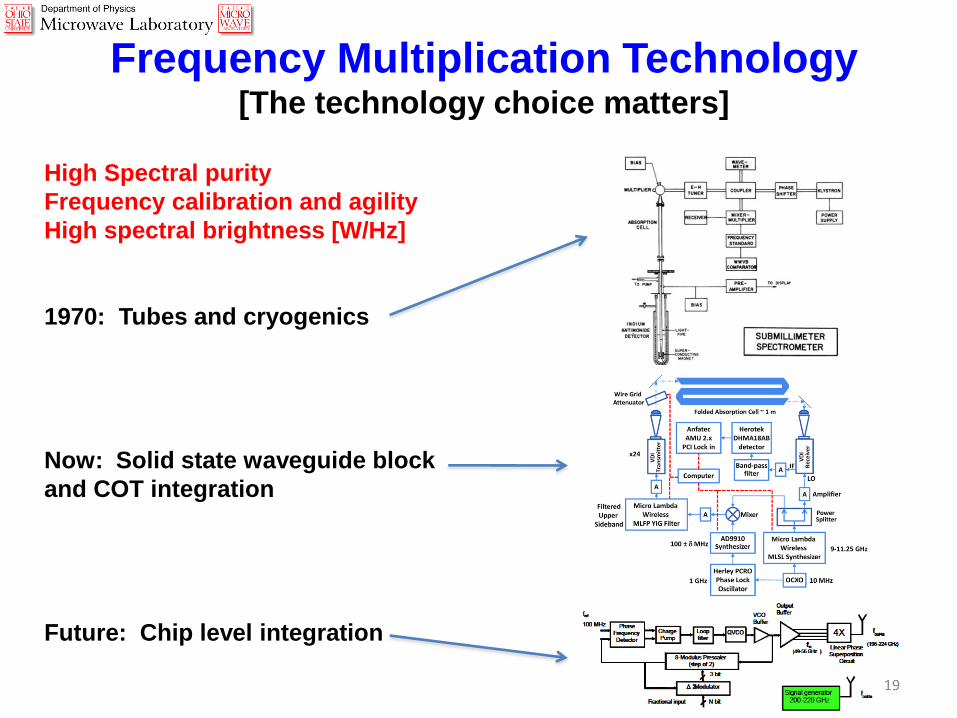
Frequency Multiplication Technology [The technology choice matters]
High Spectral purity
Frequency calibration and agility
High spectral brightness [W/Hz]
1970: Tubes and cryogenics
Now: Solid state waveguide block
and COT integration
Future: Chip level integration
19
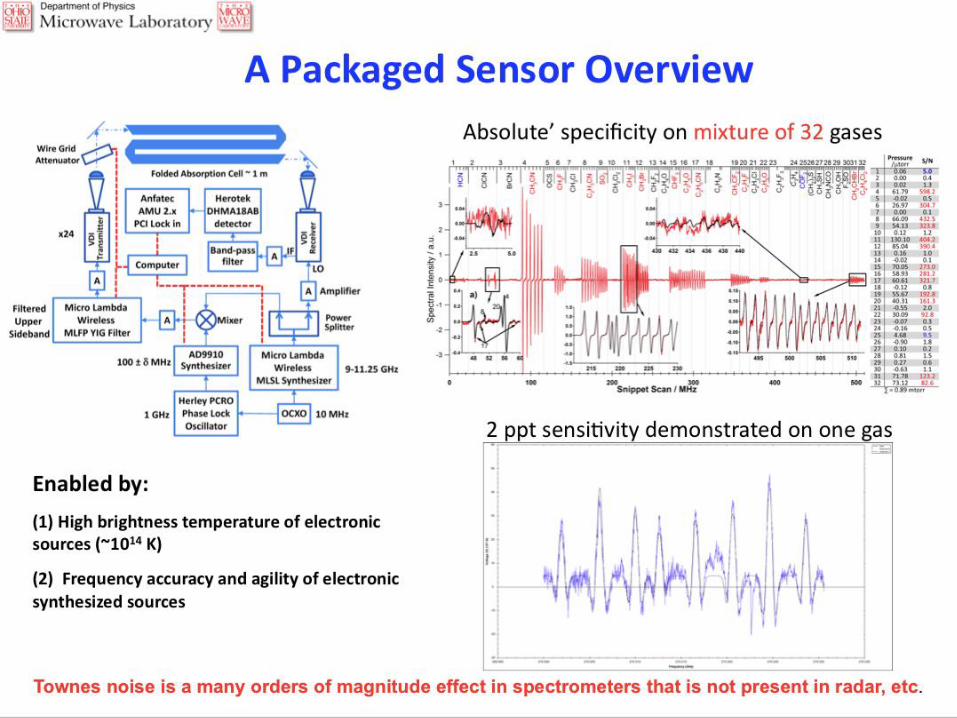
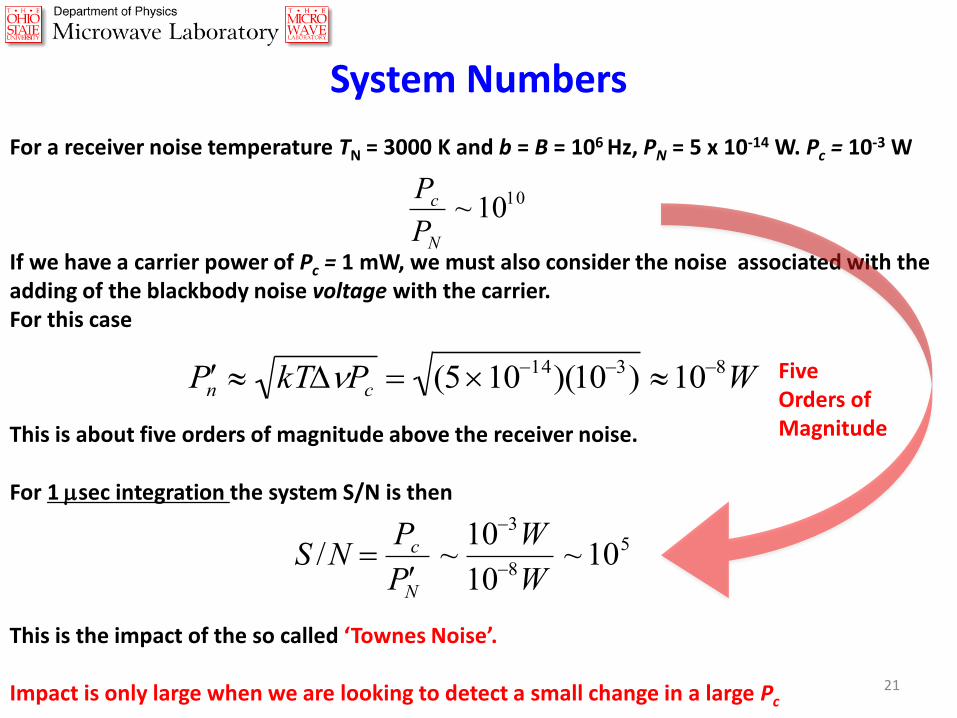
System Numbers For a receiver noise temperature TN = 3000 K and b = B = 106 Hz, PN = 5 x 10-14 W. Pc = 10-3 W If we have a carrier power of Pc = 1 mW, we must also consider the noise associated with the adding of the blackbody noise voltage with the carrier. For this case This is about five orders of magnitude above the receiver noise. For 1 msec integration the system S/N is then This is the impact of the so called ‘Townes Noise’. Impact is only large when we are looking to detect a small change in a large Pc
P n kTPc (51014)(103) 108W
S /N Pc
P N~103W
108W~105
Pc
PN
~ 1010
Five Orders of Magnitude
21
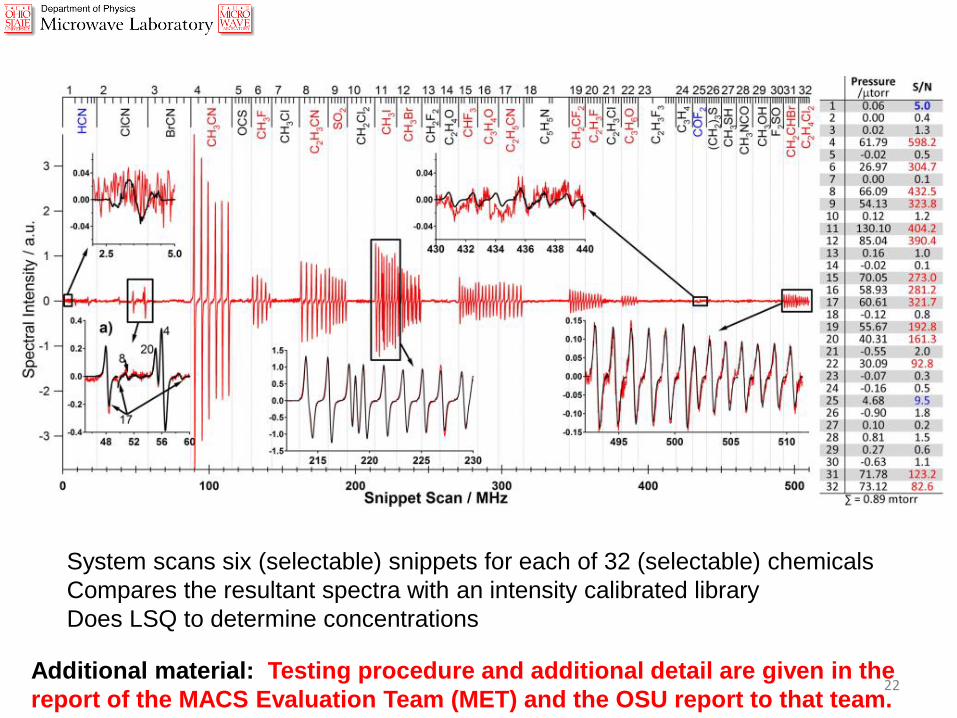
System scans six (selectable) snippets for each of 32 (selectable) chemicals
Compares the resultant spectra with an intensity calibrated library
Does LSQ to determine concentrations
Additional material: Testing procedure and additional detail are given in the
report of the MACS Evaluation Team (MET) and the OSU report to that team. 22
23
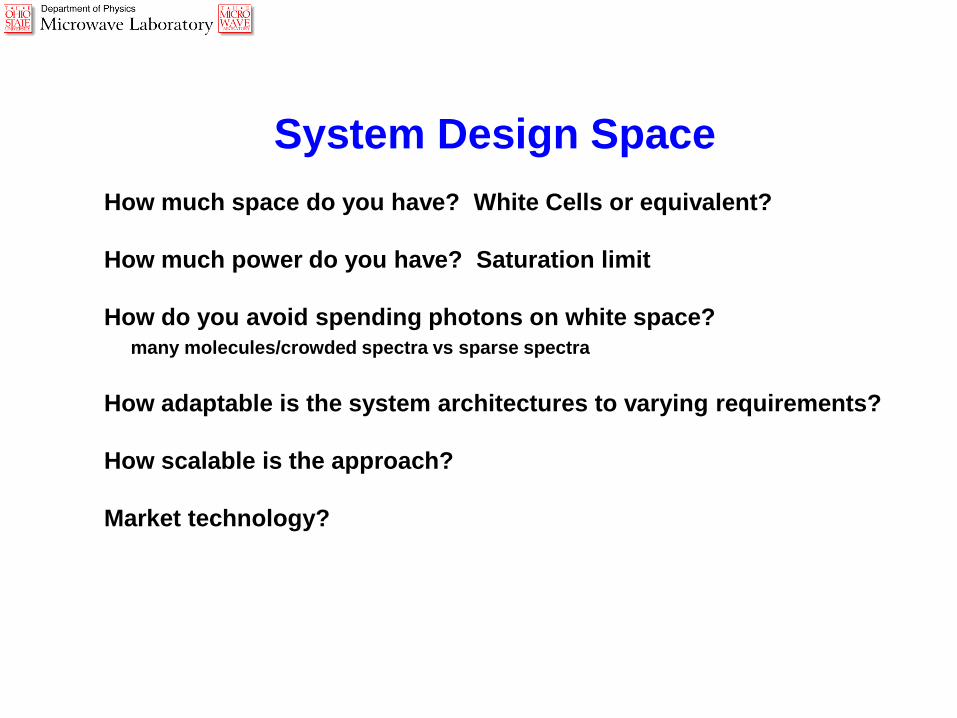
System Design Space
How much space do you have? White Cells or equivalent?
How much power do you have? Saturation limit
How do you avoid spending photons on white space?
many molecules/crowded spectra vs sparse spectra
How adaptable is the system architectures to varying requirements?
How scalable is the approach?
Market technology?
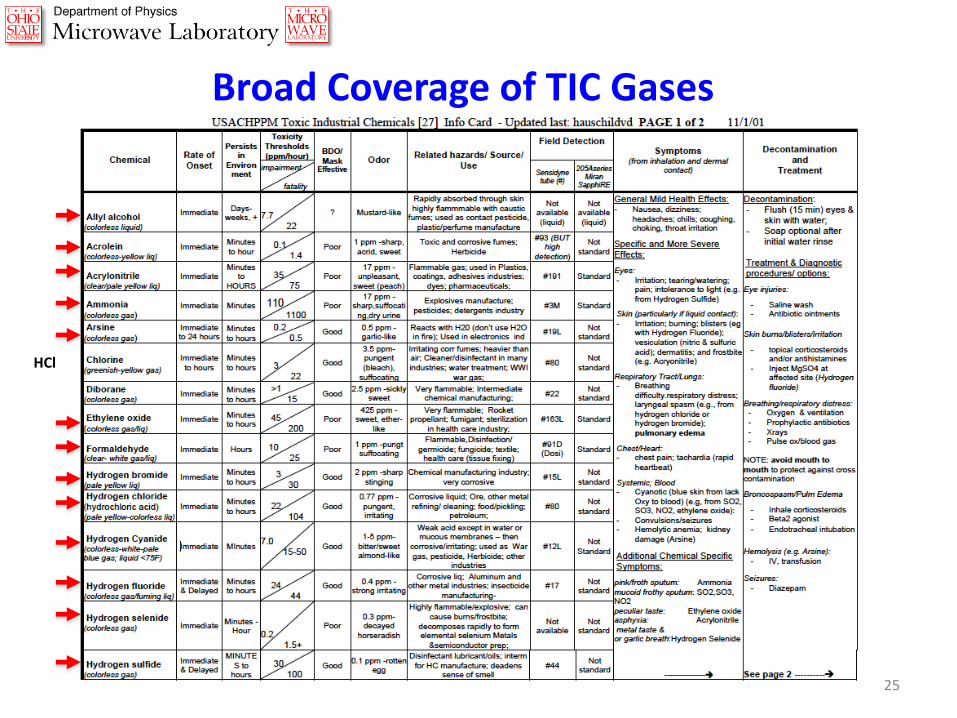
HCl
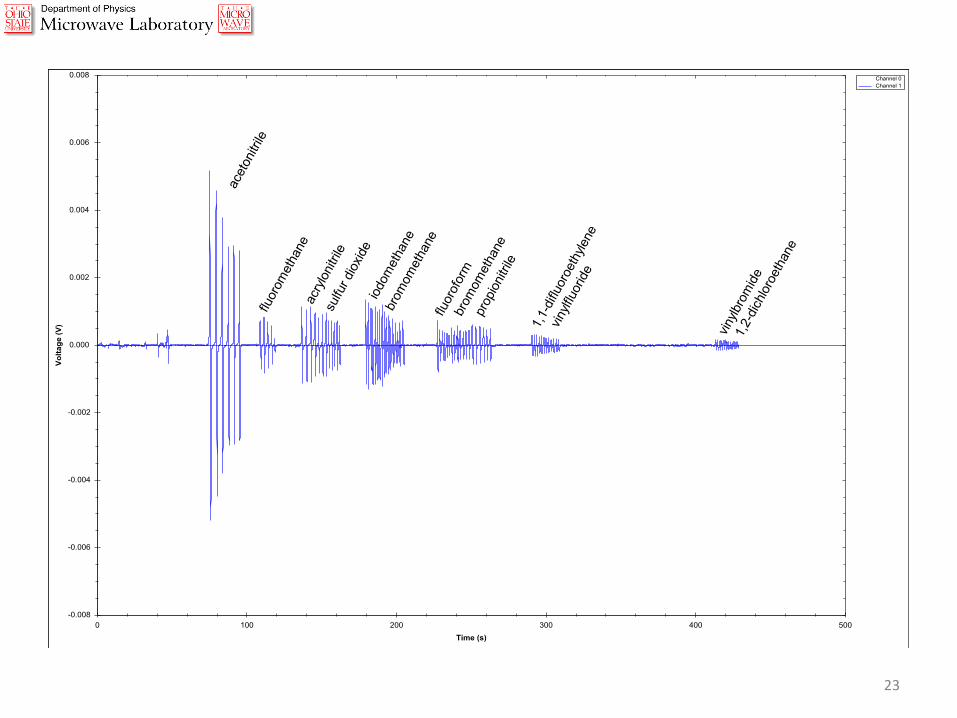
Broad Coverage of TIC Gases
25
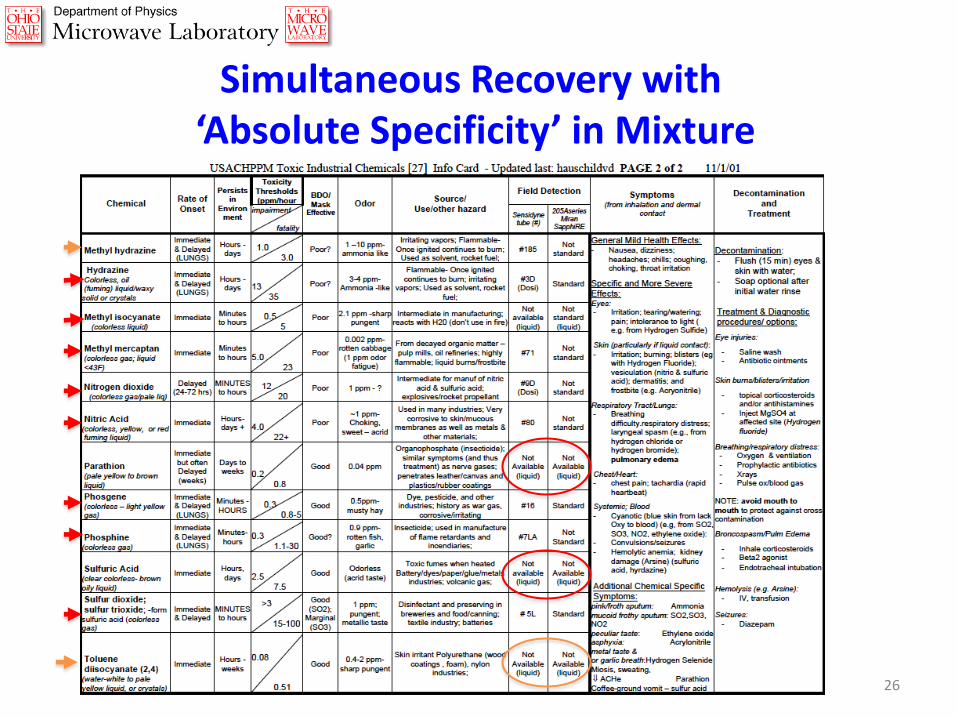
Simultaneous Recovery with ‘Absolute Specificity’ in Mixture
26
Hydrogen Cyanide
Cyanogen Chloride
Cyanogen Bromide
Methyl Cyanide
Carbonyl Sulfide Methyl Fluoride
Methyl Chloride Acrylonitrile
Sulfur dioxide
Dichloromethane
Methyl Iodide
Methyl Bromide
Difluoromethane
Ethylene oxide
Trifluoromethane Acrolein
Propionitrile
Pyridine
1,1 Difluoroethylene
Vinyl Fluoride
Vinyl Chloride
Oxetane
1,1,1 Trifluroethane
Propyne
Carbonyl Fluoride Thietane
Methanethiol
Methyl isocyanate
Methanol
Thionyl fluoride
vinyl bromide
1,2 dichloroethane
Hydrogen Chloride
Hydrogen Bromide
Carbon Monoxide
Nitric Oxide Ammonia
Hydrogen Sulfide Hydrogen Selenide
Nitrogen Dioxide
Arsine
Phosphorous Trichloride
Phosphine
Hypochlorous acid
Phosphorus Trichloride
Formaldehyde Nitric Acid
Chloroform
Phosgene
Nitromethane
Methylamine
Dimethyl Sulfate
Dimethyl Ether
GA (Tabun)
GB (Sarin)
GD (Soman) VX
HD (sulfur mustard)
L (Lewisite)
HN (nitrogen mustard)
GF (cyclosarin)
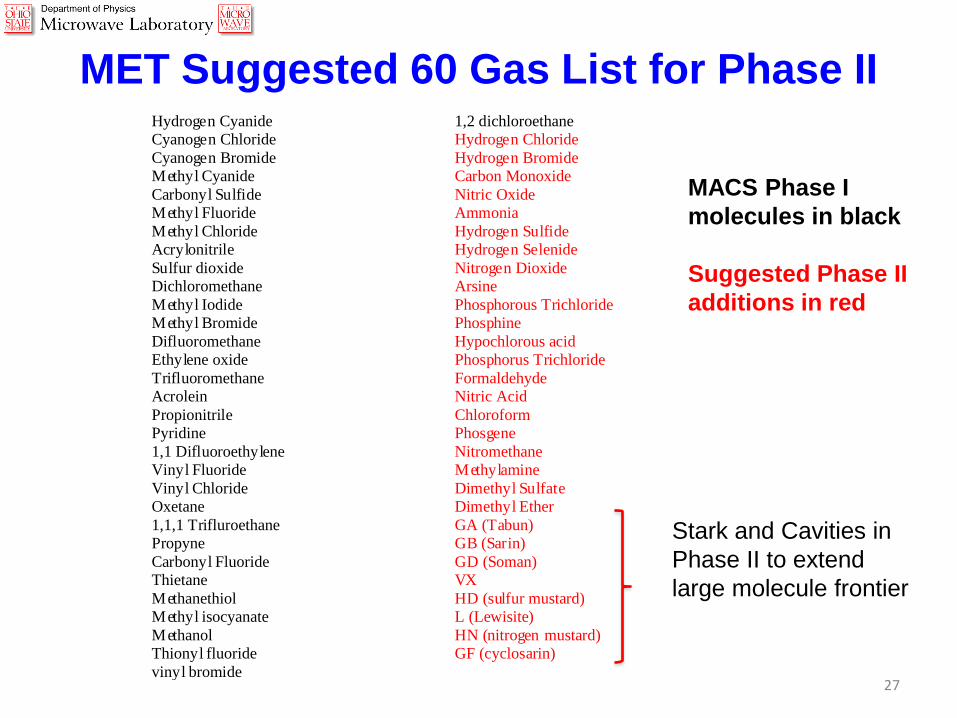
MET Suggested 60 Gas List for Phase II
MACS Phase I
molecules in black
Suggested Phase II
additions in red
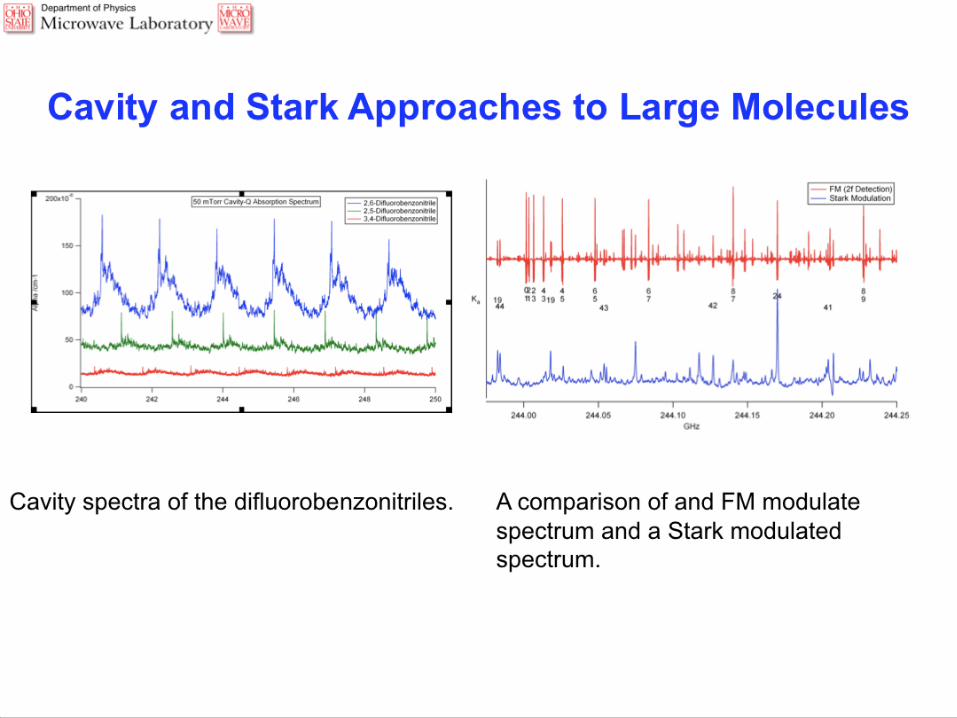
Stark and Cavities in
Phase II to extend
large molecule frontier
27
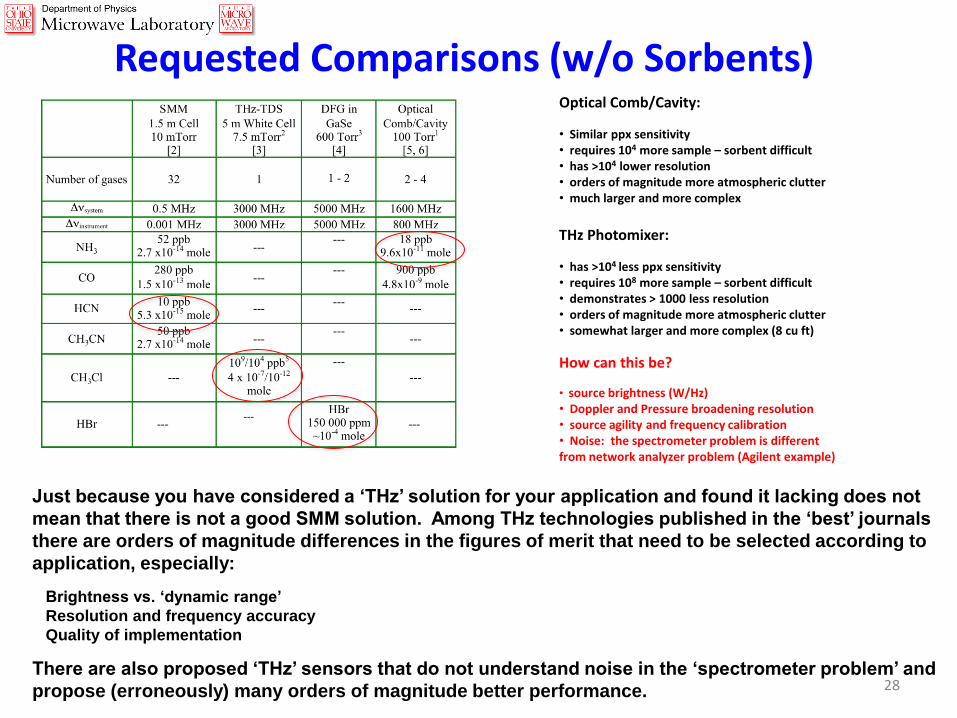
Requested Comparisons (w/o Sorbents)
Just because you have considered a ‘THz’ solution for your application and found it lacking does not
mean that there is not a good SMM solution. Among THz technologies published in the ‘best’ journals
there are orders of magnitude differences in the figures of merit that need to be selected according to
application, especially:
Brightness vs. ‘dynamic range’
Resolution and frequency accuracy
Quality of implementation
There are also proposed ‘THz’ sensors that do not understand noise in the ‘spectrometer problem’ and
propose (erroneously) many orders of magnitude better performance.
Optical Comb/Cavity:
• Similar ppx sensitivity • requires 104 more sample – sorbent difficult • has >104 lower resolution • orders of magnitude more atmospheric clutter • much larger and more complex
THz Photomixer:
• has >104 less ppx sensitivity • requires 108 more sample – sorbent difficult • demonstrates > 1000 less resolution • orders of magnitude more atmospheric clutter • somewhat larger and more complex (8 cu ft)
How can this be?
• source brightness (W/Hz) • Doppler and Pressure broadening resolution • source agility and frequency calibration • Noise: the spectrometer problem is different from network analyzer problem (Agilent example)
28
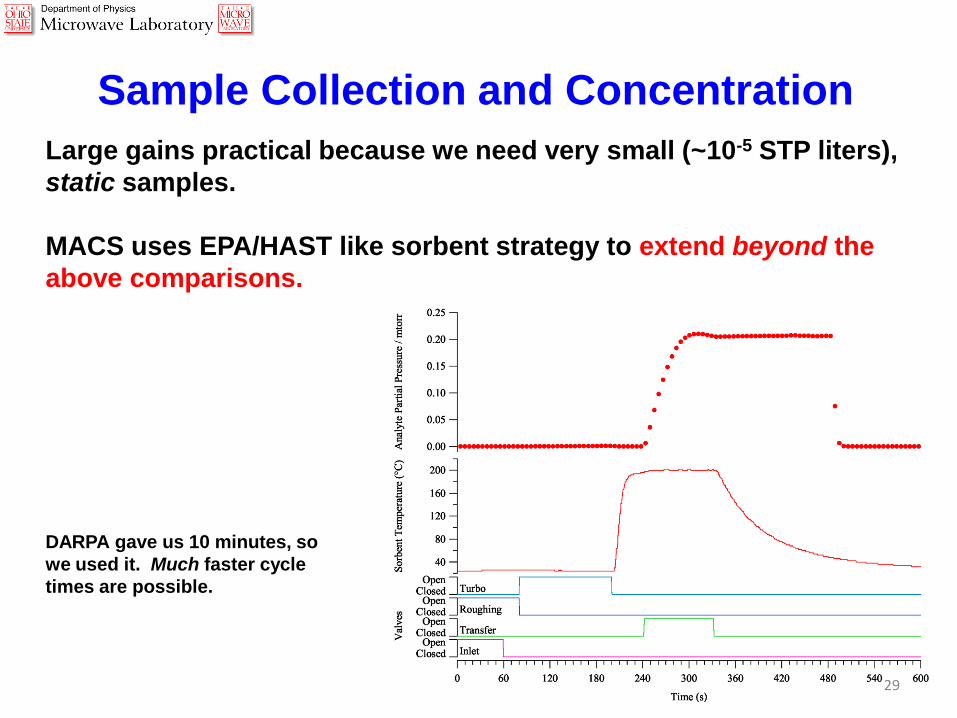
Sample Collection and Concentration
Large gains practical because we need very small (~10-5 STP liters),
static samples.
MACS uses EPA/HAST like sorbent strategy to extend beyond the
above comparisons.
DARPA gave us 10 minutes, so
we used it. Much faster cycle
times are possible.
29
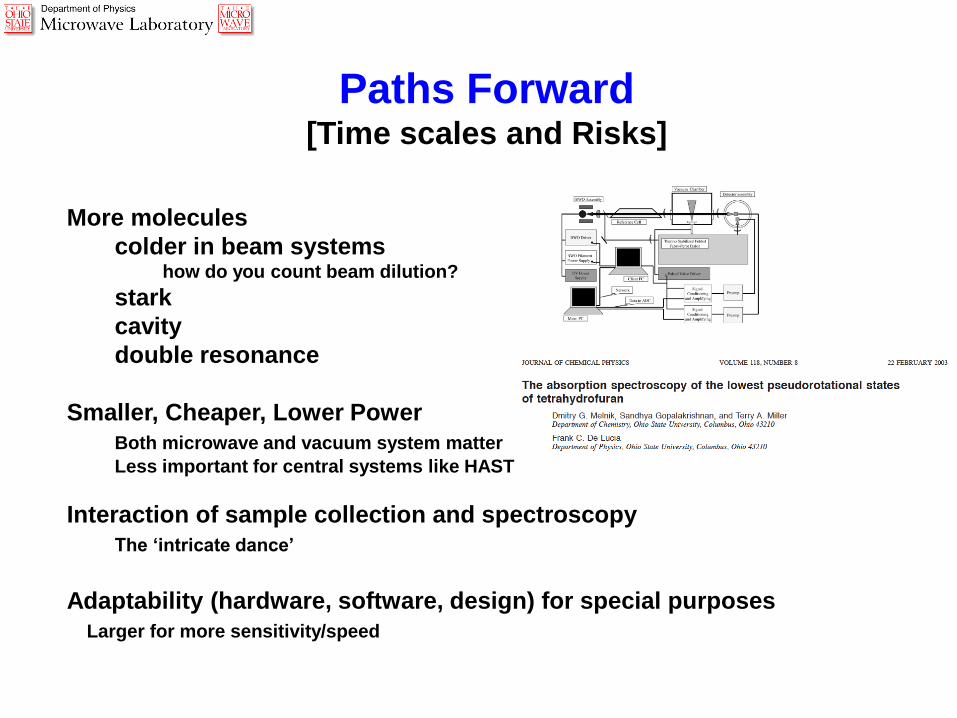
Paths Forward [Time scales and Risks]
More molecules
colder in beam systems
how do you count beam dilution?
stark
cavity
double resonance
Smaller, Cheaper, Lower Power
Both microwave and vacuum system matter
Less important for central systems like HAST
Interaction of sample collection and spectroscopy
The ‘intricate dance’
Adaptability (hardware, software, design) for special purposes
Larger for more sensitivity/speed
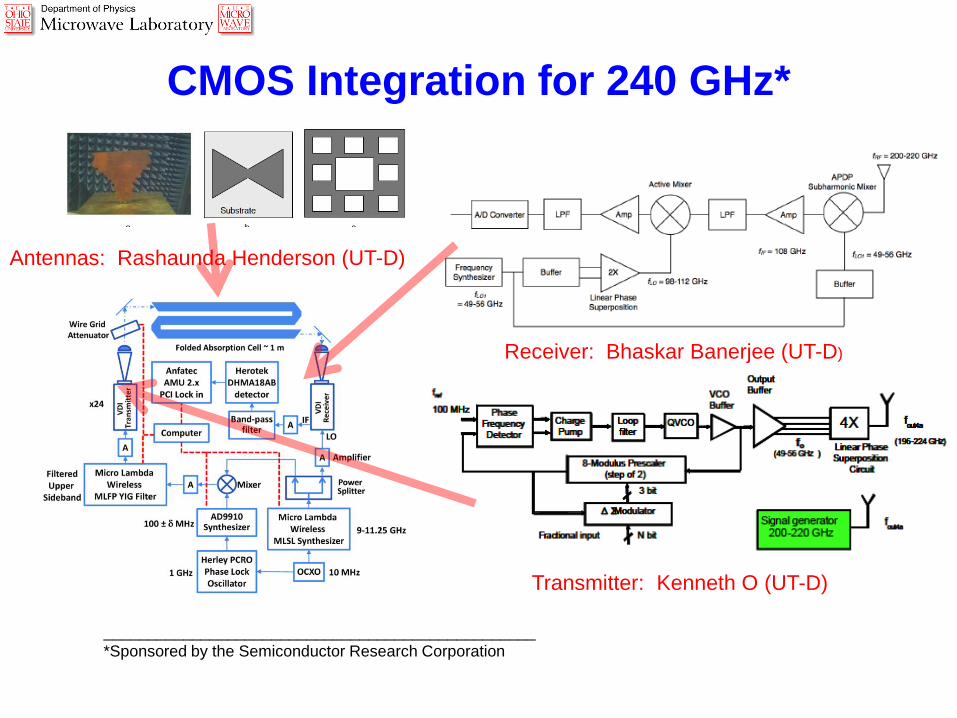
Transmitter: Kenneth O (UT-D)
Receiver: Bhaskar Banerjee (UT-D)
CMOS Integration for 240 GHz*
Antennas: Rashaunda Henderson (UT-D)
_________________________________________________
*Sponsored by the Semiconductor Research Corporation
Point Sensor Summary
The current Phase I MACS is the brassboard of an operational
sensor, with well defined capabilities as tested by a third party
for DARPA.
The technology used has been shown to be fieldable.
There are a few, low risk upgrades which should be
implemented, irregardless of application – can be done in the
context of a brassboard system that would be prototype for
production system.
It is likely that additional spectroscopy/library/preconcentration
work will be required to meet specific needs of users.
There are well defined paths forward (often correlated with
MACS Phase II) to meet a range of requirements. 35
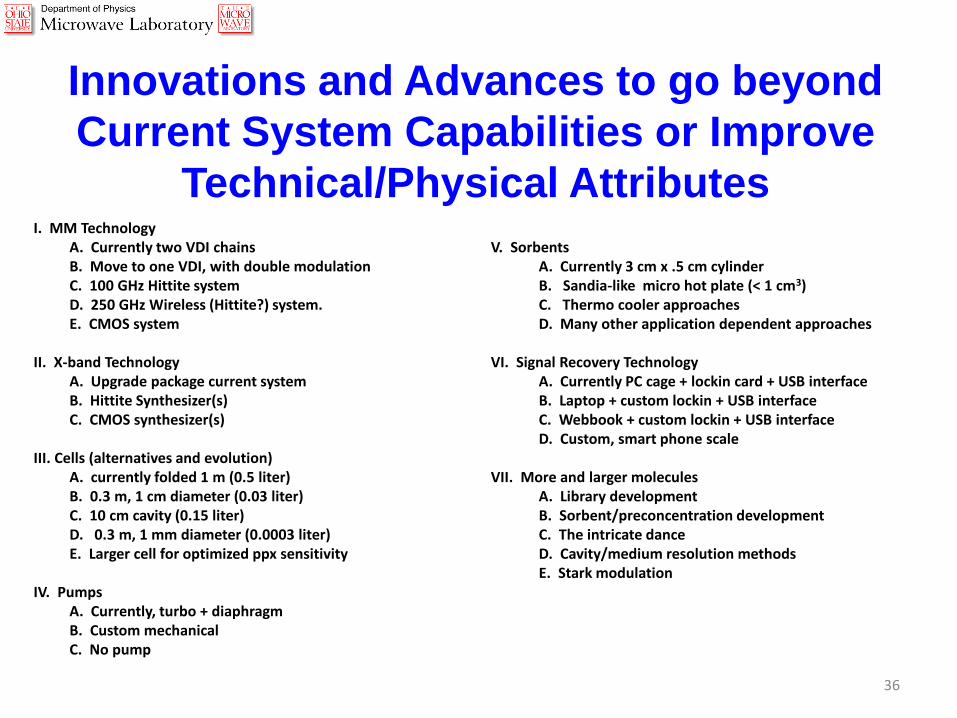
I. MM Technology A. Currently two VDI chains B. Move to one VDI, with double modulation C. 100 GHz Hittite system D. 250 GHz Wireless (Hittite?) system. E. CMOS system II. X-band Technology A. Upgrade package current system B. Hittite Synthesizer(s) C. CMOS synthesizer(s) III. Cells (alternatives and evolution) A. currently folded 1 m (0.5 liter) B. 0.3 m, 1 cm diameter (0.03 liter) C. 10 cm cavity (0.15 liter) D. 0.3 m, 1 mm diameter (0.0003 liter) E. Larger cell for optimized ppx sensitivity IV. Pumps A. Currently, turbo + diaphragm B. Custom mechanical C. No pump
V. Sorbents A. Currently 3 cm x .5 cm cylinder B. Sandia-like micro hot plate (< 1 cm3) C. Thermo cooler approaches D. Many other application dependent approaches VI. Signal Recovery Technology A. Currently PC cage + lockin card + USB interface B. Laptop + custom lockin + USB interface C. Webbook + custom lockin + USB interface D. Custom, smart phone scale VII. More and larger molecules A. Library development B. Sorbent/preconcentration development C. The intricate dance D. Cavity/medium resolution methods E. Stark modulation
Innovations and Advances to go beyond
Current System Capabilities or Improve
Technical/Physical Attributes
36
Examples
(How the physics drives system choices)
Remote Gas Sensors
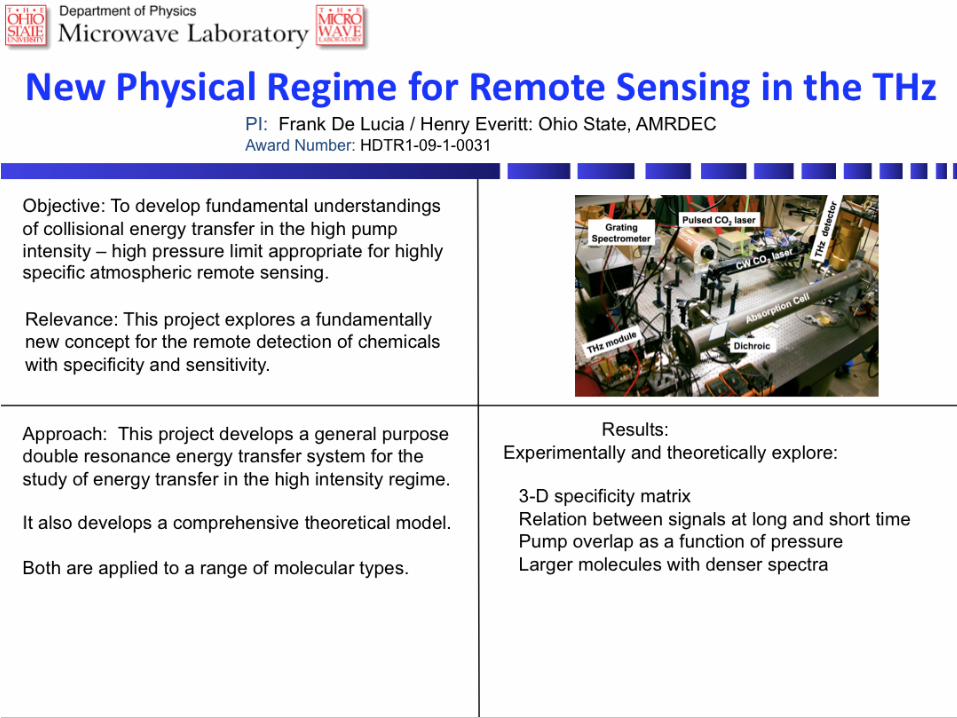
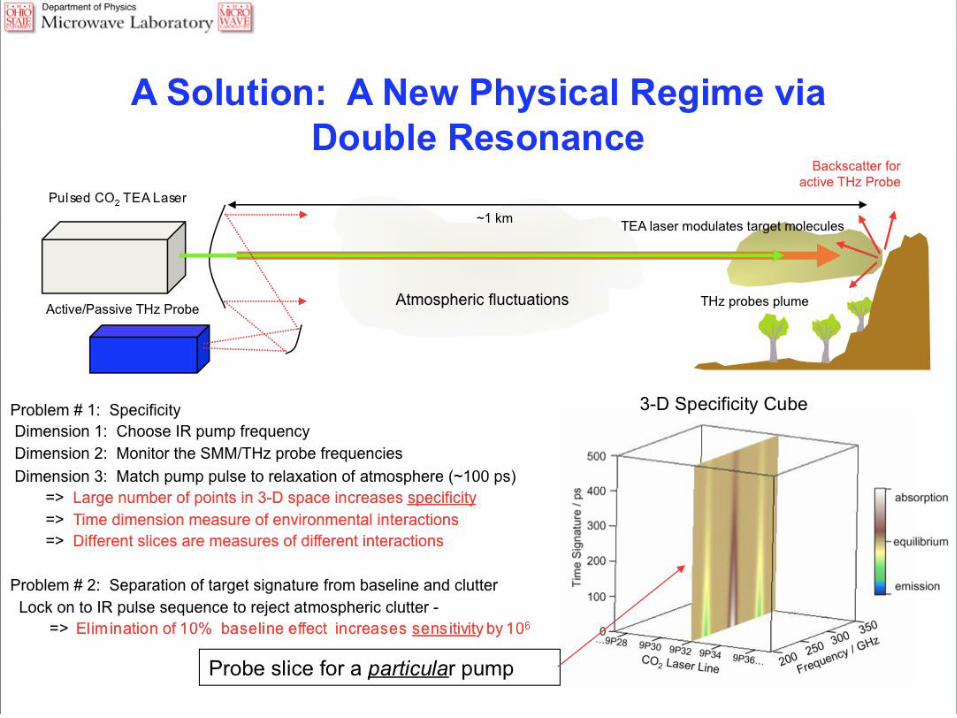
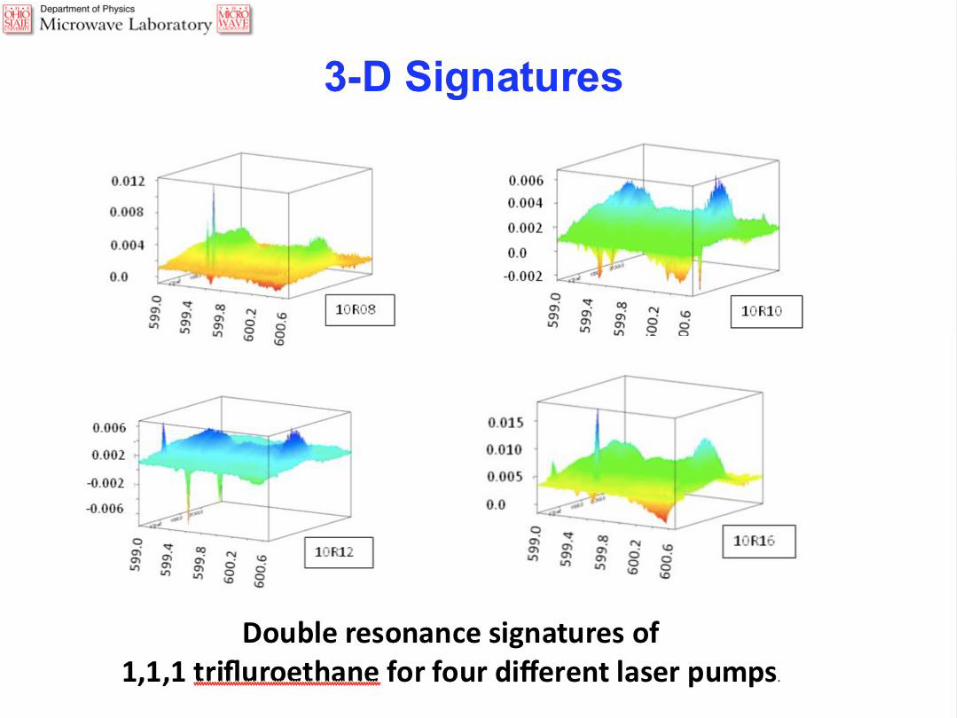
Double Resonance Paths Forward
Atmospheric Remote Sensing
Signatures and physics in the high pump (fixed frequency),
high pressure, 100 ps regime
DARPA funded laser under construction
Large Molecules in Point Sensors
Signatures in the ns regime
Operate at reduced pressure
Smaller QCL lasers (tunable)
Examples
(How the physics drives system choices)
THz Imaging
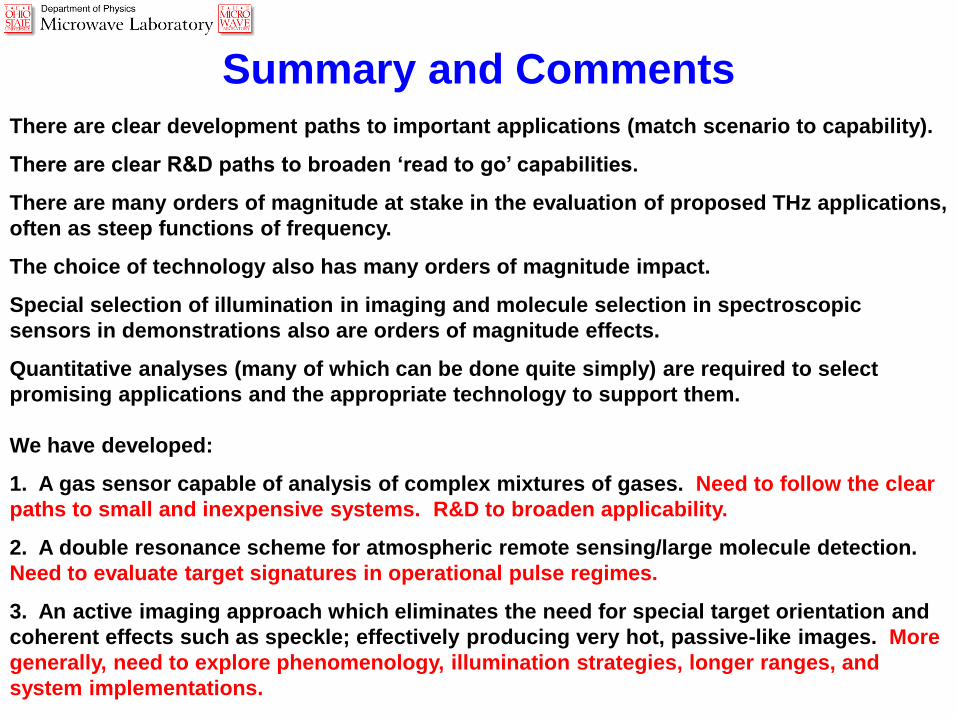
Summary and Comments
There are clear development paths to important applications (match scenario to capability).
There are clear R&D paths to broaden ‘read to go’ capabilities.
There are many orders of magnitude at stake in the evaluation of proposed THz applications,
often as steep functions of frequency.
The choice of technology also has many orders of magnitude impact.
Special selection of illumination in imaging and molecule selection in spectroscopic
sensors in demonstrations also are orders of magnitude effects.
Quantitative analyses (many of which can be done quite simply) are required to select
promising applications and the appropriate technology to support them.
We have developed:
1. A gas sensor capable of analysis of complex mixtures of gases. Need to follow the clear
paths to small and inexpensive systems. R&D to broaden applicability.
2. A double resonance scheme for atmospheric remote sensing/large molecule detection.
Need to evaluate target signatures in operational pulse regimes.
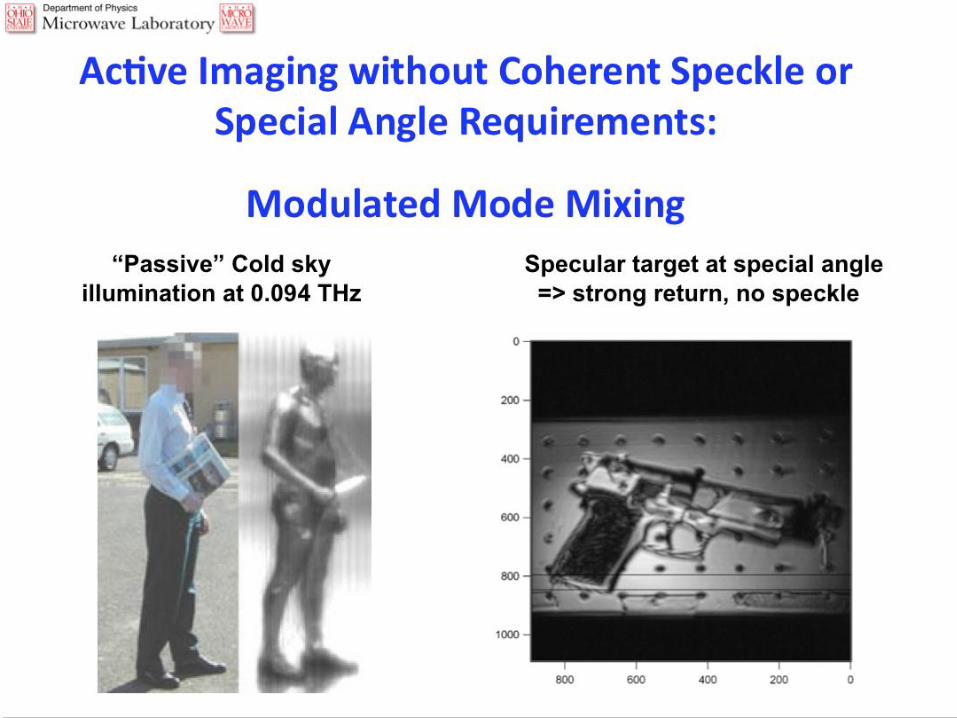
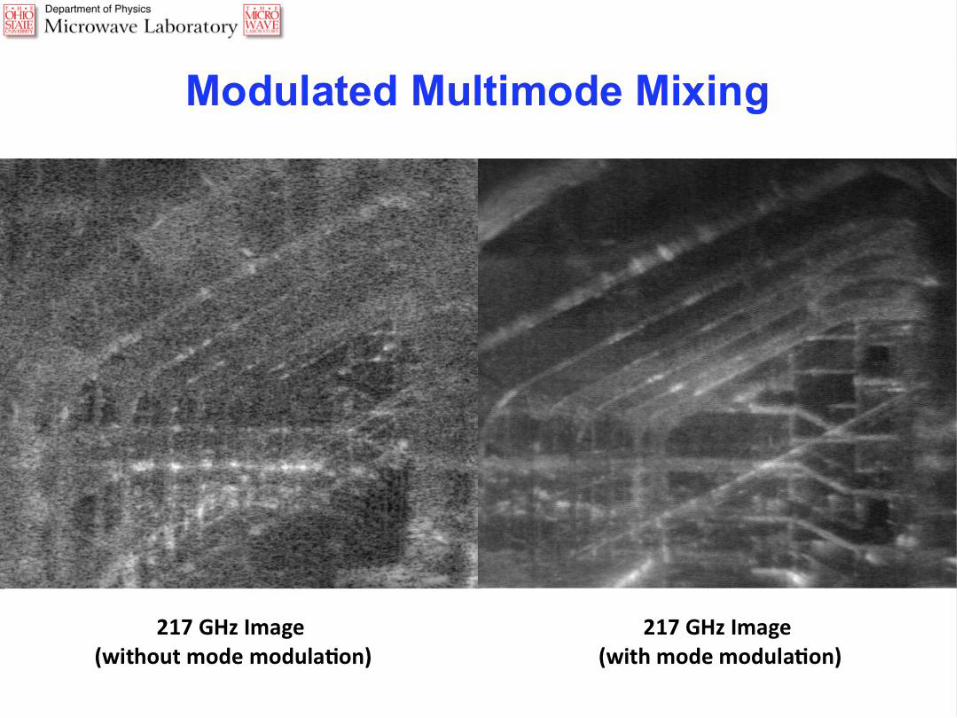
3. An active imaging approach which eliminates the need for special target orientation and
coherent effects such as speckle; effectively producing very hot, passive-like images. More
generally, need to explore phenomenology, illumination strategies, longer ranges, and
system implementations.
Acknowledgements
DARPA/ARO
Edgar Martinez, Mark Rosker, John Albrecht, Frank Patten, Dwight Woolard, John Prater
Northrop Grumman
Ken Kreischer
Teledyne
Mark Field
Semiconductor Research Corporation Ken O (TxACE/UT-D)
Chih-Ming Hung, Django Trombley, Baher Haroun (Kirby Laboratories, Texas Instruments)
A. Valdes-Garcia and A. Natarajan (Watson Laboratory, IBM)
Phillip Stout (Applied Materials)
AMRDEC
Henry Everitt, Dane Phillips
Naval Research Laboratory
Baruch Levush, John Pasour, Colin Joye
Applied Quantum Technologies Bob Guenther, Bob Lontz
Ohio State University Christopher Neese, Jen Holt, Mark Patrick
Wright State University Doug Pektie, Ivan Medvedev
Battelle
Chris Ball