Embed Size (px)
Citation preview
Brit. J. prev. soc. Med. (1957), 11, 79-89
A CRITICAL EXAMINATION OF THE REPUTED PRIMARYINFLUENCE OF ABO PHENOTYPE ON FERTILITY
AND SEX RATIOBY
J. H. EDWARDSFrom the Department of Social Medicine, University ofBirmingham
Within the last decade, statistical evidence hasaccumulated that the ABO blood groups haveselective influences other than those due to mis-matched or unavailable transfusions, and an in-creasing literature has convincingly demonstrateda primary influence on at least one group of diseasesin adults. Publications on the influence of the ABOphenotypes on fertility and sex ratio have madesimilar claims of apparent selective influences inex-plicable by chance, and such claims have beenwidely quoted (British Medical Journal, 1954), andhave been promoted to the attention of geneticistsin the Bateson lecture on morphism (Huxley, 1955).
Some Difficulties of Statistical AnalysisThe problem of analysis in the light of the exclu-
sive and exhaustive classes of prior hypotheses ofheterosis and foetal incompatibility would presentconsiderable inferential problems even with a di-allelic system, a Poissonian distribution of familysize, random sampling, and a well miscegenatedpopulation. In practice, most data refer to tri-allelic or tetra-allelic systems; the distribution offamily sizes is far from Poissonian; and randomsampling has rarely been achieved. Populationswith facilities for blood grouping are mostly cosmo-politan, with appreciable proportions of unusualblood group distribution (for example, Jews, Irish,or Negroes), and such minorities usually have dif-ferent views, abilities, or opportunities in relationto their standard of living and family size.The heterogeneity due to these factors is such that,
in conjunction with statistical methods which ignoreit, or which are assumed appropriate on the groundsthat they have been helpful when applied to experi-mental data or to observational data consisting offar fewer observations, almost every set of datapublished can be analysed to show evidence of"significant" differences in fertility. Such differenceswould be expected to arise from the heterogeneity of
the data itself, and the separation of the side-effectsof a gene from the effects of other genes with whichit is associated cannot usually be made on informa-tion implicit within any single set of data. Signifi-cance tests may be necessary, but they are certainlynot sufficient, as evidence of any such effect.While this multiplicity of claims is such as usually
initiates the healthy development of a new subject,and while the task of the critic is comparativelyeasy, in that he has the advantage of comparingany two papers at least one of whose authorscould not have read the other, it would appear tobe worth while to try to analyse some of the inherentdifficulties and to attempt to advance constructivesuggestions.
Firstly, in the absence of any well-groundedprior hypotheses, other than the vague and contra-dictory expectations of foetal incompatibility andheterozygote advantage, interpretation must largelybe based on posterior hypotheses. Consequently,tests of significance must be based on the wholedata, and this tends to shield any heterogeneitylimited to a few of many class frequencies. As it isquite possible that there may be systematic dis-crepancies limited to only one or two of many classfrequencies, as would be expected in the variousRhesus parent-child combinations, it would seemvalid to apply also a significance test to those classesmost discrepant from the mean. As in a many-classed contingency table the ratio of the square ofa discrepancy to its expectation (d /e) has, on thenull hypothesis, the probability of a random variatefrom a normal population of zero mean and unitvariance, significance tests may easily be appliedusing the probability distribution of the extremedeviates; these have been tabulated (May, 1952).Although only approximate, such methods wouldseem preferable to the highly fallacious methods oftesting those classes with the most extreme dif-ference for independence. There would, of course,
79
copyright. on January 9, 2022 by guest. P
rotected byhttp://jech.bm
j.com/
Br J P
rev Soc M
ed: first published as 10.1136/jech.11.2.79 on 1 April 1957. D
ownloaded from

J. H. EDWARDS
be a probability of almost pn of wrongly rejecting anull hypothesis with n independent tests at the pthlevel.
Secondly, conventional significance tests seemunsuited to such data. Methods dependent on thesampling distribution of attributes, as x2, may beuseful when small numbers of observations arebeing analysed and fairly gross distortions of pro-portionality are necessary for the rejection of thenull hypothesis, but are not suited to observationalmaterial in man where many thousands of casesare being compared. It is doubtful whether anynull hypothesis of association of attributes testedon observational data derived from, say, 10,000 menwould survive rejection at anything approaching1-p times at the pth level of significance.Most significance tests, including those dependent
on the probability distribution of X2, are compari-sons of the ratio of the square of a discrepancy toits variance, so that, as the size of the sample in-creases, any bias increases this ratio in proportionto the sample size. This leads to the paradox thatthe larger the series, the greater the caution necessaryin accepting any apparent rejection of the nullhypothesis. Consider a small systematic error y. Ifthe numbers are large, the discrepancy in a sampleof number n will be ny, with variance approximatelyn. Conventionally, it will be regarded as significantif ny exceeds 2Vn.
2When y > , this will occur "usually". When
y = by , this will occur with a probability of about
16 per cent., and, when y = 2Vn, of about 7-3per cent.For example, in a series of 10,000 cases, a 2 per
cent. systematic error would "usually" appear sig-nificant at the 5 per cent. level, and in 60,000 casesat the one in a million level.
This is, of course, not a criticism of such methodsof analysis as are designed to detect such discrepan-cies, but merely a demonstration of the confidenceof freedom from small systematic influences whichmust be assumed before using such tests. The beliefthat the difficulty can be overcome by using higherlevels of significance is not only fallacious, butharmful, in that very highly significant discrepanciesare less readily dismissed as statistical artefacts.
In view of the obvious racial, social, and religioussub-grouping in man, it is doubtful whether suchmethods are applicable to his reproduction. Apartfrom errors of paternity and blood-grouping, mis-interpretation of data may readily arise from such
correlation nets as: Irish ancestry, high proportiongroup 0, Catholicism, absence of contraception,larger families: Jewish faith, high proportion groupB, atypical morbidity experience, absence of contra-ception, Niddah, highly assortative mating; Negrofacies, high proportion group B, large family size,high neo-natal death rate.And this misinterpretation will often appear to
be confirmed by data from other regions. Further,race, religion, marital status, and parity may appre-ciably influence liability to become a blood donor.A simple solution to some of the problems of a
significance test which would be insensitive to smallsystematic bias would appear to be Woolf's efficienttest of proportionality in a 2 x 2 table (Woolf,1955), provided the null hypothesis is only regardedas rejected when the fiducial limits of this estimateexclude, not unity, but some arbitrarily determinedrange, say 0 95-1 *05, which is considered unlikelyto be exceeded by the bias which cannot be excluded.An essential, and unique, feature of this method isthe possibility of combining data from diversepopulations, without introducing bias or losinginformation. Haldane (1956) has published arefinement of Woolf's method which is very simpleand reduces any bias due to the asymetrical samplingerrors of small numbers. Data should therefore besubdivided as often as practicable: religion may besuggested as a simple attribute which is usuallyrecorded on hospital notes (Penrose, 1955). Thisanalysis will not detect very small discrepancieswhich are, by their nature, probably indiscerniblein man. The impossibility of detecting small dif-ferences, while possibly discouraging the furtheraccumulation of data on the ABO phenotypes, inwhich fertility is assessed by enumeration of thechildren of the fertile, should not discourage thecollection of other data. Appreciable differences inthe relative liability of different phenotypes maywell occur in certain particular forms of fertilityimpairment or in sterility, and yet have escaped re-cognition. In these cases, Woolf's method of analysiswould be particularly easy to apply.As there are i n(n - 1) internal comparisons
which can be made in an n x 2 table (i.e. two popu-lations classified into n phenotypes), the arbitraryadoption of some standard which would reducethe number of comparisons to n - 1 would seemdesirable. The recessive phenotypes (such as 0, d/d)would seem in general most suitable, being fairlyfrequent in most races and of unique genotype.This solution is only applicable to problems whichcan be presented as an n x 2 table, for example inrelation to disease, to the sex ratio, and to sterility.It is not applicable to investigations involving
80
copyright. on January 9, 2022 by guest. P
rotected byhttp://jech.bm
j.com/
Br J P
rev Soc M
ed: first published as 10.1136/jech.11.2.79 on 1 April 1957. D
ownloaded from
PRIMARY INFLUENCE OF ABO PHENOTYPE ON FERTILITY AND SEX RATIO 81
gradations in fertility. In such cases Student's "t"test is frequently used, but in view of the very poorapproximation of family size distribution to nor-mality or even to a Poissonian distribution, itwould seem most unsuitable. The difficulty maybe overcome with some loss of information, bydividing families into those above and below theirmedian size, or some other percentile. More refinedtests would require very exacting definitions offertility, if equally reasonable tests were not to giveopposing results.Any absence of acceptable evidence is, of course,
not negative evidence. A difference in fertility tooslight to demonstrate (for example 1 per cent.)would probably be sufficient to have maintainedthis genetic variation throughout or beyond thetime of man. Even the fairly intense selection againstsome heterozygotes of the Rhesus phenotypes wouldprobably not be evident from statistical studies inthe absence of a hypothesis derived from anecdotalevidence. Indeed, paradoxical discrepancies havebeen described in statistical studies relevant tosuch hypotheses (Glass, 1950).A trend evident in many of these studies is that,
while they have been explicitly made as a result ofthe theoretical necessity of differences with respectto genotype fitness (though not necessarily in pheno-type fitness) to maintain such variation, the hypo-theses advanced to explain such differences as havebeen claimed have usually been such as would leadto instability if they were real.
A Critical Examination of Published Work claimingan Association between Blood Group and Fertility.
Seven widely-quoted publications claim to havedemonstrated an association between blood groupand fertility.
(1) By assembling data from the literature, Water-house and Hogben (1947) inferred an intense selec-tion against Group A foetuses of Group 0 mothers.This conclusion was criticized by Bennett and Brandt(1954), who considered that the differences in birthrank of Group A and Group 0 children of A/0marriages (Group A husband and Group 0 wife)and the differences in the proportions of Group 0and Group A children of A/0 and O/A marriageswere "not other than trivial". Their rejection of theprimary hypothesis of progressive maternal in-hospitality to Group A foetuses by Group 0 mothersis on grounds of undisturbed birth order, and not,as is sometimes stated, of heterogeneity within thedata.
Although the tests used by Bennett and Brandtare technically efficient, the absence of any signifi-cant discrepancy does not necessarily imply thatthe data do not contain evidence of selection throughfoetal incompatibility. Firstly, Haldane and Smith'sefficient test of birth order disturbance on whichBennett and Brandt base their claim is a test forconsistent trend. Consequently, it is not efficient asa test of trend in the birth order disturbances oflater-born children if first-born are included and ifthey are (as is suggested by the histograms publishedby Waterhouse and Hogben) particularly prone tobastardy. If bastardy is far commoner in the first-born, the custom, once practised in the Highlands ofScotland (see Boswell's Journal of a Tour of theHebrides with Samuel Johnson, 1786), of excludingthe first-born from any ancestral status might befollowed with advantage. Secondly, in relation totheir claim of no significant disturbance in segrega-tion ratio, it cannot be assumed that segregationrecorded among the children of a mother of reces-sive group implies that the husband is heterozygous.The presence of a few large families, in which thehusband was homozygous for the dominant gene,and in which one child was a bastard of recessivegroup, would greatly bias any data on segregation.As an example of bias due to mistaken paternity,
consider a large number of families, each consistingof n children of Group 0 mothers whose husbandsare Group A, and let a small proportion (oc) ofchildren be not fathered by their mother's husband.If all families which contain a member of Group Bor AB are excluded, one may consider the gene con-ferring the B antigen to be excluded from theuniverse under discussion.
Let the gene frequencies be p and r. The propor-tion of A/0 marriages in which the husband is
p2homozygous is 1 - r2 and in almost ocrn families
there will be apparent segregation.
There will be ocrn2 P2 children of families
p2containing a bastard; of these children ocrn 1 -
p2will be of Group 0 and arn (n-) 1 -r 2
of Group A.
If we ignore the relatively small bias from bastardyin families in which the husband is heterozygous, thesegregation ratio (ratio of Group A to Group 0
copyright. on January 9, 2022 by guest. P
rotected byhttp://jech.bm
j.com/
Br J P
rev Soc M
ed: first published as 10.1136/jech.11.2.79 on 1 April 1957. D
ownloaded from
J. H. EDWARDS
children in the families which segregate) will be:
npr(l-ac) + ocnpr(n - 1)1-r2 1-r2 (l-c) + cxp(n-1)
npr(l-a) oxnp2r (l-a) + oCp
1-rl21 -rr2
If, as is probably common in European data,p = 0*3, n =4, a = 0 05, this ratio would be 1 03.In O/A marriages, the bias from bastardy would befar less, as spurious segregation could not occur.
Serious bias may also arise from grouping errors,particularly as they are usually systematic, and arecommoner in children, particularly in young child-ren (children of higher birth rank). Consider thesimple universe defined above, ignoring bastardy.Assume the parents accurately grouped, and letthe proportion of children of Group A misgroupedas O be P.
Then, of the A/0 or O/A matings, there will bep2
2 families of homozygous parents, of which
almost 1 2 will be regarded as segregating, so
that the segregation ratio will be:
npr(l - f) flnp2(n - 1)1-r2 1-r2 r(l-P) + ,Bp(n-1)
npr(l-fP) Pnp2 r(l-P) + pp1 -r2 1 - r2
If,forexampler=07,p =0-3,n =4,,B=0.05,this ratio will be 1 -04.
This apparent segregation, due to either bastardy,or grouping errors, or both, could clearly lead toconsiderable bias in interpretation.
(2) Allan (1953) reviewed the data of Waterhouseand Hogben and, concluding "that some otherdifference must be sought for the curious differencesin fertility found in the sample", proposed an in-genious hypothesis of "inverse fertility", the fertilityof each phenotype being supposed to differ from themean by an equal and opposite amount in the twosexes. Before considering the evidence for thishypothesis, it is of interest to consider whether thereis any justification for regarding these differences ascurious.One approach to this problem, which has some-
times been employed, is to test the combined nullhypotheses of random mating and equal fertility bya test of unreasonableness of proportions or a test
of independence relative to the marginal totals,assuming (n - 1)2 degrees of freedom where thereare n phenotypes. This, however, is fallacious; inthe presence of random mating, and of ascertain-ment independent of family size, the modal value of
2-, where e is the expected number and d that
number less the observed number, is not (n - 1)2but f(n - 1)2, where f is the mean number ofchildren per marriage. If f = 3 *3 and n = 4, thismodal value will exceed the very highly significantvalue of X2(9).When information on relative fertility is provided
only by those children who are in excess of a mini-mum number necessary for inclusion in the data,that minimum number, usually one, should be sub-tracted from all family sizes. A possible shortcomingof such data is that, if apparent sterility, that ischildlessness at the time of collection of the data,differs in degree, rather than in nature, from relativeinfertility, series from which childless marriages areexcluded may reveal apparent trends in fertilitydiametrically opposed to any which actually exist.
If the distribution of family size were Poissonian,the significance of any discrepancy from the expecta-tion of uniform fertility could easily be tested, since
d2e
would be distributed as X2(n- 2)'Waterhouse and Hogben have published the
family size of all O/A and A/O marriages, of whichthere were 453 with 1,068 children excluding thefirst, giving a mean of 2 36 and variance 8 90. Itmay reasonably be supposed, therefore, that in thedata as a whole, the variance considerably exceedsthe mean. Consequently, on the null hypothesis,the probability of obtaining a value of
d2e
l...nor higher will not be less than the probability ofexceeding X2(n 2-)Even if "significant differences" could be demon-
strated, these data would not necessarily imply anyprimary effect of blood group on fertility. In fact,even after excluding one child from each family,the differences in fertility (Tables I and II, opposite)are not beyond the reasonable expectations ofchanceand hardly form sufficient evidence for rejection ofthe null hypothesis.
82
copyright. on January 9, 2022 by guest. P
rotected byhttp://jech.bm
j.com/
Br J P
rev Soc M
ed: first published as 10.1136/jech.11.2.79 on 1 April 1957. D
ownloaded from

PRIMARY INFLUENCE OF ABO PHENOTYPE ON FERTILITY AND SEX RATIO 83
TABLE INUMBER OF MARRIAGES AND CHILDREN DUE TO THEM
IN EACH CLASS RELATIVE TO THE ABO SYSTEM
Blood Blood Group of WifeGroup of TotalHusband 0 A B AB
0 Marriages 225 244 54 19 542Children 779 835 171 56 1,841
A Marriages 209 189 63 28 489Children 686 599 196 96 1.577
B Marriages 66 59 17 8 150Children 229 210 62 30 531
AB Marriages 23 20 6 9 58Children 72 80 14 24 190
Total Marriages 523 512 140 64 1,239Children 1,766 1,724 443 206 4,139
Heterospecific marriages are shown in bold type.
TABLE IIVALUES OF d2/e FOR FAMILY SIZE (LESS ONE CHILD)
ACCORDING TO PARENTAL BLOOD GROUPe represents the number of children expected on the null hypothesis
and d the difference between observed and expected numbers(From data assembled by Waterhouse and Hogben, 1947)
Blood Blood Group of WifeGroup ofHusband 0 A B AB All Groups
0 1*423 0-693 0-698 1 *255 0-729
A 0.304 2-369 1-418 0 092 2-795
B 0*468 1*205 0*682 0*575 2-545
AB 0433 3*717 2*598 1 749 0104 J
AllGroups 0291 0 * 155 1859 0-0406 19*68
2-71
When X2(14) = 19-68, 0-1 < p < 0-2X2(s) = 6-17, 0-02 < p <0 -05X2(2) = 271, 0-2 < p < 0-3
It would seem, therefore, that Allan's hypothesisreceives little support from data in which the bodyof the table shows no significant differences infertility and in which the marginal totals do notboth differ significantly from expectation.
Allan has suggested that such inversions of fer-tility with sex may be a sufficient reason for theestablishment and persistence of such variation,and it is of interest to consider this sufficiency on asimple model.
Consider such genotypes Aij as are determined byautosomal alleles A1, A2....... A, having frequen-cies xl, X2...... x", and let the genotypes mA,jand fAij, where m and f imply male and female,have fertilities 1 + mlij and 1 + flij, and let thecombined fertility of a mating pair be the sum ofthe independent fertilities.
Allan's hypothesis appears to imply:(1 + mlii) = (1 -fli;).
Matings between genotypes which are alike willhave relative fertility:
(1 + mlii) + (1 + fli)= (1 -flij) + (1 + flij)= 2.
Matings between unlike genotypes will be: mAghand fAij or mAij and fAgh.It is assumed that these will have equal frequency,a condition not necessarily implying either random-ness of mating or unity of sex ratio. The formerwill have relative fertility: (1 + mlgh) + (1 + flij),and the latter: (1 + mlii) + (1 + Jlgh).On Allan's hypothesis, mlgh + flgh = 0, and
mlij + flij = 0. Therefore the mean relative fertilityof these matings will be 4/2 or 2. That is, the numbersof each genotype will be constant in the next genera-tion, whatever the gene frequencies (the equationsbeing independent of xl, x2 . .. x,,). The stabilityis therefore neutral. Allan's hypothesis is not, inthis interpretation, a sufficient reason for a stablevariation.
(3) Bryce, Jakobowicz, McArthur, and Penrose(1950), in an analysis of 7,856 consecutive mother-child pairs of known blood group in Australia,provided evidence of a relative deficiency of GroupAB infants and irregularities in the distribution ofblood groups among the children of Group A andB mothers. These observations were considered tobe suggestive of differential fertility or foetal via-bility, or both concordantly.The data were analysed by calculating the expected
numbers in each mother-infant phenotype pair, onthe assumption that the parents were a randomsample, randomly mated, from a universe whosefrequencies could be accurately inferred. For thebody of their table
Ed2e
is 24-26: this has been derived from fourteen classfrequencies, only one parameter, the total number,being derived from the data, the other two para-meters, specifying the gene frequencies, beingderived partly from the data but mainly from otherdata assumed to have been assembled from the sameuniverse. The heterogeneity in the body of the tableis significant at thirteen degrees of freedom(0 01 < p < 0 -05). However, differential fertilityor foetal viability cannot definitely be inferred as anecessary cause, since there is evidence of a consider-able, though not significant, discrepancy between the
copyright. on January 9, 2022 by guest. P
rotected byhttp://jech.bm
j.com/
Br J P
rev Soc M
ed: first published as 10.1136/jech.11.2.79 on 1 April 1957. D
ownloaded from
J. H. EDWARDS
expected and observed numbers of children of eachblood group (X2(3) = 6 37; 0 05 < p < 0-1), thediscrepancy being almost entirely due to a shortageof infants of Group AB, or an excess of Group ABmothers. The proportion of mothers of Group ABdoes not differ appreciably from that expected fromthe gene frequencies calculated from the other threephenotypes, nor from the proportion in the controlpopulation. The authors recognized the possibilityof some systematic grouping errors, some AB infantsbeing grouped as B, and comparison of the numberof infants grouped as AB with the number expectedfrom the gene frequencies calculated from the otherphenotypes suggests that such errors may be appre-ciable. In view of the known difficulty of detectingthe A2 antigen in group A2B infants, it appearsreasonable to consider grouping errors* as a likelycontributory cause of the observed discrepancies.The maximum likelihood estimate of this possibleerror, on the assumption that the children have thegene frequencies of the adult sample, is 0 * 116 ±0 045(11 6 per cent. ± 4 5 per cent. AB infants groupedas B). If this error were entirely due to failure todetect the A2 antigen, it suggests that about halfthe infants of group A2B were grouped as B. Ifthis estimate is used to calculate the expectations,the heterogeneity in the body of the table is consider-ably reduced,
d2- being 18 7,
which, if distributed as X2(12) (a second parameterhaving been estimated from the data), is not con-ventionally significant (0 * 05 < p < 0 * 1).Although these data are very suggestive of a high
fertility of Group AB women, a trend which couldbe a powerful influence in maintaining variation,the discrepancies are-largely explicable on groundsof the technical difficulty of detecting in infancy theA, antigen in the presence of the B antigen. Afollow-up of a series of infants presumed to beGroup B would be of interest.
(4) Kirk, Kirk, and Stenhouse (1953) analysedthe records assembled over a period of 4 years in alarge Australian maternity hospital and claimed tohave shown a highly significant trend in fertility,Group A women being more fertile than Group 0between the ages of 25 and 35, and Group 0 womenbeing more fertile before and after this period.They made no claim of any appreciable differencein overall fertility.
* The word ",error" is unfortunate, but not easily re-placed. It is merely intended to imply failure to discernthe indiscernible.
Their method consisted of fitting orthogonalpolynomials of unstated degree to the unweighteddifference between the mean number of pregnanciesof Group A and of Group 0 women by each age.The regression line shown in their graph does notappear to have a high significance, apparentlyaccounting for only about half the variance. Overhalf the children ascribed to women over 35 werefrom families exceeding six children, most of whomwere presumably born before their mothers reachedthat age, so that the inference about the differentialfertilities after age of 35 were made on data largelyrelevant to their fertilities before this age. In fact,the 271 women delivered between the ages of 35 and40 are credited with 1,453 children and it is thesechildren who form the major part of the data usedto establish the difference in fertility in this agegroup. The problem is further complicated by thefact that the delivery rate in the hospital doubledwithin the observation period, and that mothersin different age groups increased in very differentproportions.
Their second claim is that there was a significantexcess of Group 0 women among primigravidae.The discrepancy would seem to arise mainly fromthe extraordinary fact that over the 4-year period,during which the delivery rate doubled, Group Awomen had more second than first children. Sincesuch conditions would be impossible in a stable orexpanding universe there seems no likelihood of thisbeing other than a curious sampling error. Thestatement that "both for women of English name andfor the total Perth sample there is significant excessof Group 0 women experiencing their first pregnan-cy" is misleading. The discrepancies of the wholeare almost entirely due to the women of Englishname, who form the majority (for the women ofnon-English name X2(1) = 0 086).The statement, which forms the premise of an
argument, that Group 0 mothers experience a highernumber of pregnancies before the age of 19 thanGroup A mothers, is not supported by the data.The number of women delivered was 139 in GroupO and 130 in Group A; expected values are 138 4and 130 *6 respectively.The analysis of these data derived from a rapidly
expanding and highly fertile population is particu-larly difficult, and does not convincingly demon-strate a primary influence of blood group on fertility.
(5) Johnstone (1954a) published extensive data onmother, husband, and infant phenotype trios fromover 2,500 births which occurred in a West Londonhospital during a 13-month period. The data are
84
copyright. on January 9, 2022 by guest. P
rotected byhttp://jech.bm
j.com/
Br J P
rev Soc M
ed: first published as 10.1136/jech.11.2.79 on 1 April 1957. D
ownloaded from

PRIMAR Y INFLUENCE OF ABO PHENOTYPE ON FERTILITY AND SEX RATIO 85
particularly valuable because they relate to a con-secutive series derived from a limited populationover a short period, very few mothers therefore beingrepresented more than omce. Husbands as well asmothers were grouped, and many trios had theirRhesus groups tested. Tube methods were used,and the fact that the number of infants of GroupAB approximates closely to the expected numberand to the number of Group AB mothers suggeststhat the series was not biassed by systematic group-ing errors. Johnstone's analysis of the discrepanciesbetween the expected and observed numbers inhusband-wife-child phenotype classes, excludingclasses with very small or clearly anomalous fre-quencies, led to an almost modal value for the dis-crepancy on the null hypothesis (X224) = 24 6).A most interesting feature of the data is the large
number of children whose blood groups are incom-patible with those of their alleged parents. There areno fewer than seventeen bastards* detectable as such.In England the gene frequencies are such that onlyabout 18 per cent. of agamous children can bedetected by anomalies in the parent-child ABOblood groups, so that of the 2,578 matings almosta hundred, or nearly 4 per cent., are likely to beagamous.Efficient estimation of this incidence is difficult.Every trio provides some relevant information, andusually trios with the smallest frequencies are themost informative; in addition most phenotypescontain several genotypes in unknown proportions.The most informative unions are those betweenrecessives; in England about one-fifth of unionsare gg/gg (0/0) and, independently, one-thirtiethare dd/dd (rh/rh). Assuming equal phenotypefertility and foetal viability, and the fathers of theagamous children to be almost all different, and tocome from the same population, the probabilityof any paternal gene will be proportional to itsfrequency in the population. Consider the doublerecessive marriages, and let a proportion ax of thechildren be agamous, and D be the gene frequencyof the dominant gene or genes considered to beknown exactly (D = 0 - 3305 in ABO system, 0 - 5740
* The nomenclature of such children is difficult,bastardy and illegitimacy being legally defined, andconventionally used, in relation to wedlock. It is pro-posed to term these children, and the union giving riseto them, agamous, as opposed to gamous children whoseparents are married or living together; the many ille-gitimate children born of parents whose union, thoughstable, is not legal, may conveniently be consideredgamous. The words are short, euphonious, and notgrossly distorted from their natural meaning. Theiroccasional use in systematic botany is unlikely to causeconfusion.
in Rhesus), an assumption which ensures simplicityat a cost of slightly underestimating the varianceof the estimate. Let L children be recessive, and Bchildren dominant. Then, to estimate x, the likeli-hood function will be:
B logaD + L log ( - ocD).
Of the 550 reputed gg/gg (0/0) matings in John-stone's series, nine resulted in Group A or B children,giving an estimated proportion of agamous childrenof 4 95 ± 1 -63 per cent. Of the 59 reputed dd/dd(Rh/Rh) matings, six resulted in Rh + children,giving an estimate of 17-72 ± 7 07 per cent. Sincevery few marriages are likely to be represented inboth, only about 0 7 per cent. of marriages beinggg,dd/gg,dd and only about 40 per cent. of trioshaving been Rhesus-typed, these may be combinedwithout gross error, giving an approximate estimateof 5-7 ± 1 -6 per cent. This is a remarkably highfigure, suggesting that agamous children may evenoutnumber illegitimate children. Johnstone com-ments that most of the known cases were first-born.If, as is probable, most of these agamous unions wereprenuptial, then since only a minority of womennow marry when pregnant, a very large proportionof those who do would appear not to marry the manby whom they are pregnant. If, for example 10 percent. of first-born children were agamous and allconceived prenuptially, and 20 per cent. of womenmarried while pregnant, half these women wouldnot have married the man by whom they werepregnant.
Johnstone's only claim of significance relates to ashortage of Group 0 children of O/A marriages.He has pointed out that the data collected byHirszfeld (1928) and by Waterhouse and Hogben(1947) show a similar shortage, and their data haveclearly been approached to test a single prior hy-pothesis. It would appear that this deficiency ofGroup 0 children of O/A marriages is partly attri-butable to the high incidence of agamous children.This explanation, while sufficient to reduce the levelof significance to that conventionally trivial, is notsufficient to allay suspicion of a real effect.However, Johnstone's analysis of the data of
Hirszfeld and of Waterhouse and Hogben is opento two criticisms. Firstly, the two sets of data con-tain in common the data of Hirszfeld and Hirszfeldand of Hirszfeld, Hirszfeld, and Brokman (Table III,overleaf), comprising 23 O/A marriages with 69children; the fifteen segregating families contained21 Group 0 children and 32 Group A children. Thisconsiderable discrepancy has thus been countedtwice. Secondly, these data refer not to single births,but to families, and, since there is complete intraclass
copyright. on January 9, 2022 by guest. P
rotected byhttp://jech.bm
j.com/
Br J P
rev Soc M
ed: first published as 10.1136/jech.11.2.79 on 1 April 1957. D
ownloaded from
J. H. EDWARDS
correlation between the blood groups of all gamouschildren of gg/GAGA marriages, the significance ofthe discrepancy cannot be assessed by simple tests.An exact solution, with scores, has been presentedby Hogben (1932).
In Waterhouse and Hogben's data, the discrepancyis almost entirely due to the non-segregating families,the segregating families containing 272 Group 0
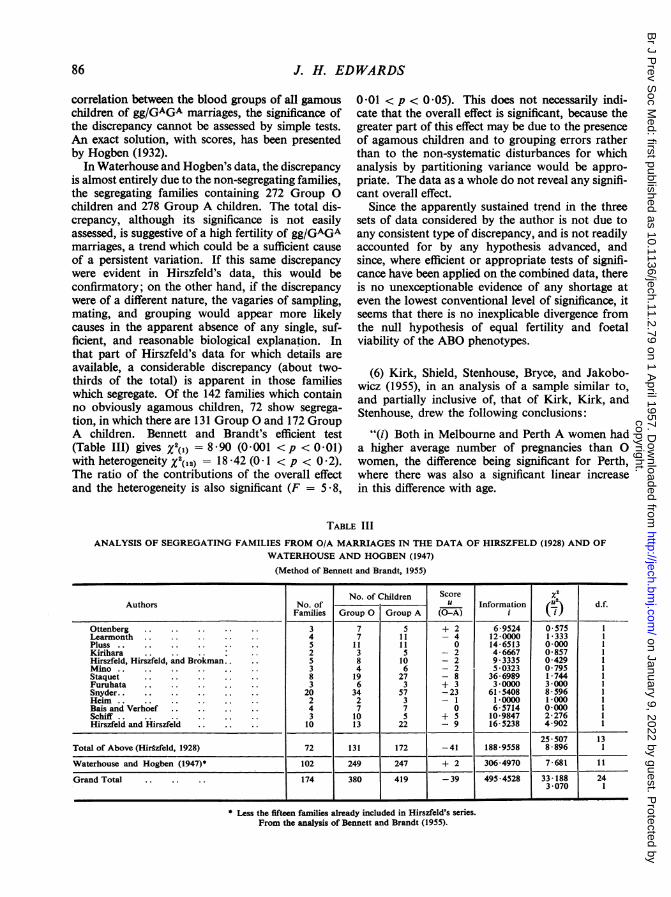
children and 278 Group A children. The total dis-crepancy, although its significance is not easilyassessed, is suggestive of a high fertility of gg/GAGAmarriages, a trend which could be a sufficient causeof a persistent variation. If this same discrepancywere evident in Hirszfeld's data, this would beconfirmatory; on the other hand, if the discrepancywere of a different nature, the vagaries of sampling,mating, and grouping would appear more likelycauses in the apparent absence of any single, suf-ficient, and reasonable biological explanation. Inthat part of Hirszfeld's data for which details areavailable, a considerable discrepancy (about two-thirds of the total) is apparent in those familieswhich segregate. Of the 142 families which containno obviously agamous children, 72 show segrega-tion, in which there are 131 Group 0 and 172 GroupA children. Bennett and Brandt's efficient test(Table III) gives X2(1) = 8 *90 (0*001 < p <O 01)with heterogeneity X2('2) = 18 42 (O0 1 < p < 0 2).The ratio of the contributions of the overall effectand the heterogeneity is also significant (F = 5-8,
0-01 < p < 0-05). This does not necessarily indi-cate that the overall effect is significant, because thegreater part of this effect may be due to the presenceof agamous children and to grouping errors ratherthan to the non-systematic disturbances for whichanalysis by partitioning variance would be appro-priate. The data as a whole do not reveal any signifi-cant overall effect.
Since the apparently sustained trend in the threesets of data considered by the author is not due toany consistent type of discrepancy, and is not readilyaccounted for by any hypothesis advanced, andsince, where efficient or appropriate tests of signifi-cance have been applied on the combined data, thereis no unexceptionable evidence of any shortage ateven the lowest conventional level of significance, itseems that there is no inexplicable divergence fromthe null hypothesis of equal fertility and foetalviability of the ABO phenotypes.
(6) Kirk, Shield, Stenhouse, Bryce, and Jakobo-wicz (1955), in an analysis of a sample similar to,and partially inclusive of, that of Kirk, Kirk, andStenhouse, drew the following conclusions:
"(i) Both in Melbourne and Perth A women hada higher average number of pregnancies than 0
women, the difference being significant for Perth,where there was also a significant linear increasein this difference with age.
TABLE IIIANALYSIS OF SEGREGATING FAMILIES FROM O/A MARRIAGES IN THE DATA OF HIRSZFELD (1928) AND OF
WATERHOUSE AND HOGBEN (1947)
(Method of Bennett and Brandt, 1955)
No. of Children Score x2Authors No. of u Information (.) d.f.
Families Group 0 Group A (0-A) i iJ
Ottenberg . .3 7 5 + 2 6-9524 0*575 1Learmonth .4 7 11 - 4 12-0000 1-333 1Pluss .. .. .... 5 1 1 1 1 0 14*6513 0 000 1Kirihara 2 3 5 - 2 4-6667 0857 1Hirszfeld, Hirszfeld, and Brokman 5 8 10 - 2 93335 0429 1Mino .3 4 6 - 2 5*0323 0*795 1Staquet 8 19 27 - 8 36-6989 1*744 1Furuhata .3 6 3 + 3 3*0000 3 *000 1Snyder. . 20 34 57 -23 61*5408 8*596 1Heim. 2 2 3 - 1 1*0000 1*000 1Bais and Verhoef .4 7 7 0 6-5714 0 000 1Schiff .3 10 5 + 5 10-9847 2-276 1Hirszfeld and Hirszfeld 10 13 22 - 9 16*5238 4*902 1
25 507 13Total of Above (Hirszfeld, 1928) 72 131 172 -41 188-9558 8-896 1
Waterhouse and Hogben (1947)* 102 249 247 + 2 306 4970 7 681 11
Grand Total 174 380 419 -39 495*4528 33 188 243 070 1
Less the fifteen families already included in Hirszfeld's series.From the analysis of Bennett and Brandt (1955).
86
copyright. on January 9, 2022 by guest. P
rotected byhttp://jech.bm
j.com/
Br J P
rev Soc M
ed: first published as 10.1136/jech.11.2.79 on 1 April 1957. D
ownloaded from
PRIMARY INFLUENCE OF ABO PHENOTYPE ON FERTILITY AND SEX RATIO 87
"(ii) A comparison of the calculated and observednumber of children in different mother-child blood-group combinations for 16,179 single births inMelbourne reveals a significant deficiency of GroupA children to Group 0 mothers and Group ABchildren to Group A and B mothers, and a signifi-cant excess ofGroup 0 children to Group 0 mothers,of Group A children to Group B mothers, and GroupB children to Group A mothers.
"(iii) A breakdown of mother-child blood-groupcombinations by birth rank reveals that the defi-ciency in Group A and B children to Group 0mothers is absent for first-born children, presentfor second-born children, and greatest for third-born children."
Their statement of the significant excess of childrento Group A mothers is based on a "t" test which isprobably not appropriate, as the variance of thenumber of children per family, especially when thefirst is excluded, as a necessary condition of mother-hood, usually greatly exceeds the mean. No detailsof the linear increase with age are given, but it isapparently based on the number of children bornby a given age and not the number being born atthat age.
Their second set of claims, although maintainedat very high levels of significance, are not necessarilyacceptable evidence of differing fertility, since theircomparison of phenotype frequencies of motherand child (X2(3) = 23 *22) suggests effects of suchmagnitude that they would have shown up in popu-lation surveys covering different generations andsexes. It seems more likely that there were system-atic grouping errors. This explanation is supportedby the discrepancy in blood group distributionbetween mothers and infants (X2(3) = 31 -87). Ifthis discrepancy is examined in detail (Table IV),it is evident that the greater part is due to a shortageof Group AB infants. If Groups B and AB arecombined, an efficient estimate of the proportionategene frequencies may be made by solving the follow-ing determinate equations, where 0, A, B, and ABare the proportionate phenotype frequencies:
r2 = 02pr + pl = A
2pq + 2qr + q2 = AB + BThese are satisfied by the values p = 0-2420,q = 0-0658, and r = 0 6922, giving the expectedproportion of AB as 3-185 per cent., the observedproportion being 2-695 per cent., which implies thatabout 15-4 per cent. of Group AB infants werewrongly grouped as B. This estimate is similar to
that obtained from Bryce and Jakobowicz's formerdata (11 6 ± 4 5 per cent.). After corrrecting forgrouping errors by the use of this estimate, com-parison of the phenotype distributions of mothersand children shows much smaller discrepancies(Table IV).
TABLE IVDISTRIBUTION OF MOTHERS AND CHILDREN
ACCORDING TO BLOOD GROUP
Blood No. of No. of xiGroup Mothers Children x2 (corrected*)
0 7,585 7,752 1-818 1-818A 6,406 6,369 0107 0107B 1,605 1,622 0*090 1*221AB 583 436 21-206 4-211
Total 16,179 16,179 23 *221 7 357
When X2(3) = 23-221, p < 0-001x2( = 7-357. 0-01 < p < 0-05
* Corrected for estimated grouping errors.
The discrepancies remaining are due to an excessof children of Group 0 and a deficiency of GroupsA, B, and AB. This is not unexpected, since thedata relate to at least two racial sub-groups withdifferent gene frequencies, and since mating isassortative (as is demonstrated by the differentgene frequencies of mothers with and withoutEnglish names) the children would be expectedto contain an excess of homozygous individualsover those calculated on the assumption of randommating. For the same reason gene frequenciescalculated as above, on the assumption of randommating (or random pairing of allelomorphs), andany estimate based on this calculation, must beregarded as approximate. Both assortative matingand grouping errors would lead to an apparentdeficiency in the observed numbers of Group ABinfants.
Their third claim regarding the influence of birthrank on infant blood group cannot be regarded asclearly demonstrated if consideration is extended tothe higher birth ranks. The relevant data (Table V,overleaf), although showing an apparent loss ofincompatible children in the second and third birthranks, do not show any consistent trend when viewedas a whole.
(7) Matsunaga (1953) and Matsunaga and Itoh(1953) in Japan, have made the only large surveyson entire families within defined districts. Since thedistricts were uniform for race and the familieswere large, these data would be of extreme value,but unfortunately only a part has so far been pub-lished. This shows an extreme impairment in fertility
copyright. on January 9, 2022 by guest. P
rotected byhttp://jech.bm
j.com/
Br J P
rev Soc M
ed: first published as 10.1136/jech.11.2.79 on 1 April 1957. D
ownloaded from

J. H. EDWARDS
TABLE VFREQUENCY OF INCOMPATIBLE CHILDREN* ACCORDING
TO BIRTH RANK
No. of Children Percentage ofBirth IncompatibleRank Compatible Incompatible Total Children
I 2,113 488 2,601 18-82 1,930 436 2,366 18-43 1,221 233 1,454 16-04 639 145 784 18-55
and Over 690 160 850 18*8
Total 6,593 1,462 8,055 18*2
* An incompatible child is one who would be incompatible(relative to the ABO system) as a blood donor to his mother.
and infant viability within heterospecific marriages,an effect which, it is suggested, may be balancedby mutation.Some of their data are more widely known
(Matsunaga, 1955) and are said to imply a signifi-cant deficiency of Group A children of Group 0mothers and Group A fathers, and of Group Bchildren of Group 0 mothers and Group B fathers.However, the significance has not yet been rigorouslydemonstrated, since the tests assume the proportionof homozygous fathers to have zero sampling vari-ance, the distribution of family size to be Poissonian,and husbands to be synonymous with fathers. Theapparent increase in abortion rate in heterospecificmarriages assumes that a woman who has had oneabortion is not more likely to have another. Thedata are such that no reasonable interpretation orinformed criticism can precede complete publication.
A Critical Examination of Published Work claimingan Association between Blood Group and Sex-Ratio
The influence of parental blood groups on thesex-ratio of children, which may be regarded as aparticular form of differential fertility, has been thesubject of three widely-quoted reports:
(1) Sanghvi (1951) claimed consistent significantdiscrepancies on two mother-child series, one of1,330 Indian births, the other of 865 births in NewYork. When each series is analysed as a whole,the data, excluding phenotype pairs oflow frequency,do not show any significant heterogeneity (X2('3) =13-9 for the Indian series and X2(6) = 9 9 for theNew York series).
However, Sanghvi has not made this analysis, buthas analysed only those classes in the body of thetable which are "large enough for further considera-tion". If these classes were selected purely ongrounds of size, the chance that the differencebetween the outlying pair would be significant at
the pth level considerably exceeds p. With suchlarge numbers, in any class frequency the probability
distribution ofd will be approximately that of
a random sample from a normal variate of unitvariance, and the range of the extremes in such caseshas been tabulated (May, 1952). The range of threesuch samples which will just not be exceeded in5 per cent. of cases is 3-32 units, and a 2 x 2 2
estimation will be at least 2(i x 3 32)2 or 5-51, in5 per cent. of cases. Sanghvi's value of X2(1) = 5 - 57is possiblyjust significant at this level. The New Yorkdata where then examined in the light of this priorhypothesis, which was confirmed, (X2(1) = 4 '93),although the high overall sex-ratio possibly impairsany assumption of generality.
This appears to be the only rigorously demon-strated discrepancy in relation to sex-ratio and bloodgroup. However, in view of the failure of morerecent work to confirm these findings, it appearslikely that this promising start was due to the factthat when tests are used to assess significance at the5 per cent. level, 5 per cent. of null hypotheses willinevitably be wrongly rejected through chance alone.
(2) Johnstone (1954b) published data referring to3,791 children of 2,100 marriages, the sexes of thechildren and the blood groups of both parents beingknown. This is by far the most informative seriesyet published. Having noted that the sex-ratio ofinfants of Group B mothers was high, while that ofGroup B fathers was low, he picked out for specialattention the two marriage classes B/not-B andnot-B/B and found a difference in the sex-ratio ofthe children which almost reached the conventionalthreshold of significance (X2(1) = 3 799). Littleimportance can be attached to this result, however,since numerous equally reasonable comparisonscould have been made. For example, if fourteenappropriate independent comparisons could bemade, there would usually be at least one "statisti-cally significant" discrepancy, even if there were noassociation between sex-ratio and blood group.A further analysis of the B/not-B marriages by
birth rank has inevitably led to discrepancies whichappear to be even more significant. As there areseveral possible comparisons, the highly significantdiscrepancy reputed to occur between the sex-ratiosof first children of the reciprocal marriage pairs can-not be accepted; and since it is a posterior hypothesisunsupported by exterior evidence or by any explana-tory mechanism it must provisionally be consideredas a vagary of sampling. The data as a whole,excluding three phenotype pairs with less than ten
88
copyright. on January 9, 2022 by guest. P
rotected byhttp://jech.bm
j.com/
Br J P
rev Soc M
ed: first published as 10.1136/jech.11.2.79 on 1 April 1957. D
ownloaded from

PRIMARYINFLUENCE OFABO PHENOTYPE ONFERTILITYAND SEXRATIO 89
children of either sex, do not reveal any significantheterogeneity (X2(ls) = 15.9).
(3) Cohen and Glass (1956), in an analysis of anextensive series of mother-child phenotype pairsassembled in Baltimore, were unable to demonstrateany significant association with sex-ratio. Theypointed out that Johnstone's data showed no dis-crepancy when similarly analysed, and this absenceof any significant discrepancy persisted after hisdata were combined with theirs. But the additionof Sanghvi's data from New York and Bombayenabled them to demonstrate highly significantdiscrepancies in a large number of comparisons; inparticular, the sex-ratio was low in offspring ofGroup A mothers and in Group A offspring, andwas high in offspring of Group B mothers and inGroup B offspring.The discrepancies found are not other than those
to be expected if data from Baltimore and Isleworthare combined with data from Bombay, since in theIndian data the sex-ratio was very high (54-6 percent.), and the frequency of Group B. relative toGroup A much higher than in the British andAmerican data. Consequently the infants of GroupB mothers and the Group B infants contain adisproportionate number of Indians, who are poorlyrepresented among both infants of Group A mothersand Group A infants. The data of Sanghvi are saidnot to differ significantly from those to which theywere added (X2(ss) = 25 -44), but as a similar testfor homogeneity of the Baltimore sample gave thealmost impossible result X2(14) = 0 - 67 (p> 0 * 999999),this claim of homogeneity cannot be accepted. Asthe sex-ratio and the proportions of the variousblood groups in the Indian and not-Indian datadiffer significantly and considerably, to an extentand in a direction sufficient to explain the overallheterogeneity, the analysis of the data cannot be
accepted as necessarily implying any primaryrelationship of ABO phenotype and sex-ratio.
SUMMARYEvidence is advanced that grouping errors (over
10 per cent. of Group AB infants being grouped asB in two series) and paternity errors (over 5 percent. of children being not fathered by their mother'shusband in one series) are so common as greatly tocomplicate any analysis of data suggestive of arelationship between fertility and blood group.
It is concluded, for these and other reasons, thatthere has not yet been any satisfactory demonstra-tion at the statistical level of any differences infertility or sex-ratio primarily related to the ABOblood groups.The apparent absence of any statistical evidence
is probably quite compatible with differences infertility sufficient to maintain the variation in theABO phenotypes.
REFERENCESAllan, T. M. (1953). British Journal ofPreventive and Social Medicine,
7, 220.Bennett, J. H. and Brandt, J. (1954). Ann. Eugen., (Camb.) 18, 302.British Medical Journal, 1, 1197 (Annotation).Bryce, L. M., Jacobowicz, R., McArthur, N., and Penrose, L. S.
(1950). Ann. Eugen. (Camb.), 15, 271.Cohen, B. H., and Glass, B. (1956). Hum. Biol., 28, 20.Glass, B. (1950). Amer. J. hum. Genet., 2, 269.Haldane, J. B. S. (1956). Ann. hum. Genet., 20, 309.Hirszfeld, L. (1928). "Konstitutionsserologie und Blutgruppen-
Forschung". Springer, Berlin.Hogben, L. (1932). J. Genet., 25, 211.Huxley, J. (1955). Heredity, 9, 1.Kirk, R. L., Kirk, M., and Stenhouse, N. S. (1953). British Journal of
Preventive and Social Medicine, 7, 1.Kirk, R. L., Shield, J. W., Stenhouse, N. S., Bryce, L. M., and Jacobo-
wicz, R. (1955). Ibid., 9, 104.Johnstone, J. M. (1954a). Ibid., 8, 117.- (1954b). Ibid., 8, 124.Matsunaga, E. (1953). Proc. Jap. Acad., 29, 399.
(1955). Amer. J. hum. Genet., 7, 66.and Itoh, S. (1953). Proc. Jap. Acad., 29, 529.
May, J. M. (1952). Biometrika, 39, 192.Penrose, L. S. (1955). Personal Communication.Sanghvi, L. D. (1951). Nature (Lond.), 168, 1077.Waterhouse, J. A. H., and Hogben, L. (1947). British Journal of
Social Medicine, 1, 1.Woolf, B. (1955). Ann. Eugen. (Camb.), 19, 251.
copyright. on January 9, 2022 by guest. P
rotected byhttp://jech.bm
j.com/
Br J P
rev Soc M
ed: first published as 10.1136/jech.11.2.79 on 1 April 1957. D
ownloaded from