Embed Size (px)
Citation preview
doiorg1026434chemrxiv9891992v1
A Cross-Method Comparison of Sub-10 nm Nanoparticle SizeDistributionYe Yang Suiyang Liao Zhi Luo Runzhang Qi Niamh Mac Fhionnlaoich Francesco Stellacci Stefan Guldin
Submitted date 23092019 bull Posted date 27092019Licence CC BY-NC-ND 40Citation information Yang Ye Liao Suiyang Luo Zhi Qi Runzhang Mac Fhionnlaoich Niamh StellacciFrancesco et al (2019) A Cross-Method Comparison of Sub-10 nm Nanoparticle Size DistributionChemRxiv Preprint
Accurate nanoparticle (NP) size determination is essential across research domains with many functions innanoscience and biomedical research being size-dependent Although transmission electron microscopy(TEM) is capable of resolving a single NP down to the sub-nm scale the reliable representation of entirepopulations is plagued by challenges in providing statistical significance predominantly due to limited samplecounts suboptimal preparation procedures and operator bias during image acquisition and analysisMeanwhile alternative techniques exist but reliable implementation requires a detailed understanding ofappendant limitations Herein conventional TEM is compared to the size determination of sub-10 nm goldNPs in solution by small-angle X-ray scattering and analytical ultracentrifugation Form-free Monte Carlo fittingof scattering profiles offers access to a direct representation of the core size distribution whileultracentrifugation sedimentation velocity analysis provides information of the hydrodynamic size distributionWe report a comparison of these three methods in determining the size of quasi-monodisperse polydisperseand bimodal gold nanoparticles of 2 ndash 7 nm and discuss advantages and limitations of each technique
File list (2)
download fileview on ChemRxivCross-method_size_determination_final(v7)pdf (512 MiB)
download fileview on ChemRxivSI_Cross-method_size_determination_final(v7)pdf (79971 KiB)
A cross-method comparison of sub-10 nm
nanoparticle size distribution
Ye Yangdagger Suiyang LiaoDagger Zhi LuoDagger Runzhang Qidagger Niamh Mac Fhionnlaoichdagger
Francesco StellacciDaggerpara and Stefan Guldinlowastdagger
daggerDepartment of Chemical Engineering University College London Torrington Place
London WC1E 7JE UK
DaggerInstitute of Materials Eacutecole Polytechnique Feacutedeacuterale de Lausanne 1015 Lausanne
Switzerland
paraInterfaculty Bioengineering Institute Eacutecole Polytechnique Feacutedeacuterale de Lausanne 1015
Lausanne Switzerland
E-mail sguldinuclacuk
Abstract
Accurate nanoparticle (NP) size determination is essential across research domains
with many functions in nanoscience and biomedical research being size-dependent Al-
though transmission electron microscopy (TEM) is capable of resolving a single NP
down to the sub-nm scale the reliable representation of entire populations is plagued
by challenges in providing statistical significance predominantly due to limited sample
counts suboptimal preparation procedures and operator bias during image acquisition
and analysis Meanwhile alternative techniques exist but reliable implementation re-
quires a detailed understanding of appendant limitations Herein conventional TEM is
compared to the size determination of sub-10 nm gold NPs in solution by small-angle
X-ray scattering and analytical ultracentrifugation Form-free Monte Carlo fitting of
1
scattering profiles offers access to a direct representation of the core size distribution
while ultracentrifugation sedimentation velocity analysis provides information of the
hydrodynamic size distribution We report a comparison of these three methods in de-
termining the size of quasi-monodisperse polydisperse and bimodal gold nanoparticles
of 2 ndash 7 nm and discuss advantages and limitations of each technique
Keywords
nanoparticle SAXS TEM AUC Monte Carlo
Introduction
The preparation and accurate characterization of sub-10 nm nanoparticles (NPs) plays a
pivotal role in a multitude of chemical and biomedical applications where size-dependent
efficacy is often observed1ndash3 Notably the cutoff for efficient renal clearance is below 10 nm
and NPs with broad size distributions may impair biocompatibility4 For gold nanoparticles
(AuNPs) in particular various important physicochemical properties are closely dependent
on size AuNP populations with mean diameters ranging from 2 ndash 10 nm manifest drastic
differences not only concerning in vitro colloidal stability but also their intracellular and
antimicrobial properties5ndash8 Consequently the quantitative assessment of the AuNP size
distribution in a sample of interest is an indispensable routine that needs particular attention
The most commonly implemented technique is transmission electron microscopy (TEM)
imaging combined with a plethora of software-based image analysis methods910 As a direct
imaging technique TEM is a convenient tool to study both size and shape in ultra-high res-
olution However obtaining an accurate and representative size distribution of the AuNPs
by TEM is challenged by limited sample counts preparation procedures and operator bias
in image acquisition and analysis11ndash13 Considering the rather limited sample size it is la-
borious to obtain results of statistical significance especially for non-uniform or multimodal
2
samples Moreover the drop casting for TEM sample preparation often results in drying
artifacts which vastly complicates image analysis1415 Even though fitting procedures with
minimal human intervention meanwhile exist10 image analysis in practice still commonly
involves manual operations prone to user bias While cryo-TEM and liquid-phase TEM offer
mitigation and present exciting pathways for NP research accessibility is limited With the
current experimental workflows their implementation in routine use for size characterization
remains unfeasible1316
To address these issues a number of bulk-scale quantification techniques for NPs have
been developed as alternatives to TEM imaging For instance dynamic light scattering
(DLS) is widely used for its ease of access and simple protocol Whilst DLS is able to probe
the hydrodynamic size information of colloidal systems at both microscopic and nanoscopic
scales non-monodisperse samples are typically not accurately described due to the size-
dependent scattering cross-section Thus smaller NPs are usually overshadowed by larger
NPs or aggregates1117 In addition the interference of multiple scattering events may also
impair the accuracy of DLS results For AuNPs below 20 nm it is therefore extremely
challenging to obtain reliable results with DLS18 X-ray diffraction (XRD) analysis enables
to obtain the mean size of crystalline domains either via the Scherrer formula or the more
recent Fourier inversion method1920 However this approach is unable to represent particle
size distributions and is challenged by issues such as the overweighting of larger crystallites
as well as contributions from amorphous layers and lattice defects1421 Nanoparticle tracking
analysis (NTA) allows to size each NP in an ensemble through the mapping of individual
Brownian trajectories22 Per contra it is challenging to resolve sub-10 nm NPs and to obtain
large enough datasets for an accurate representation of NP populations18
Analytical ultracentrifugation (AUC) offers an alternative route to size and shape char-
acterization of NPs in solution through an accurate determination of the velocity during
sedimentation Unlike the sedimentation equilibrium (SE) mode in which a moderate cen-
trifugal force is applied to achieve an equilibrium between sedimentation and back diffusion
3
the sedimentation velocity (SV) mode relies on high centrifugal fields that result in steep
concentration gradients23 While in principle being a simple and versatile technique the
utilization of AUC is still highly underrepresented in NP research One of the main reasons
is attributed to the difficulty in determining the effective NP density for core-shell hybrid
colloids since a solvation layer in addition to the ligand shell can pose significant influ-
ence This challenge was addressed with a 2D evaluation of sedimentation and diffusion
coefficients which permitted the direct estimation of the size density and molecular weight
distributions of AuNPs stabilized by a thiol ligand shell24 Further developments shared a
focus on modern algorithms for the analysis of core-shell properties as well as polydisperse
systems2526 However the AUC representation of non-uniform or multimodal NPs remains
largely unexplored
Another emerging technique to characterize the size distribution of colloidal ensembles is
small-angle X-ray scattering (SAXS) With a momentum transfer q of 006 ndash 63 nmminus1 SAXS
measurements are able to cover the NP size distribution ranging from 1 ndash 100 nm in diam-
eter Moreover gold has a pronounced scattering length density (SLD) of 125times 10minus6 Aringminus2
for Cu-source X-ray while the SLDs for H2O and alkanethiols are below 10times 10minus6 Aringminus2 This
distinct feature of gold gives rise to significant contrast and excellent signal-to-noise ratio for
resulting AuNP SAXS profiles Contrary to TEM analysis SAXS is an indirect method and
requires data correction and fitting for reconstructing the size distribution from measured
data27 In principle the size distribution of a NP sample can be directly calculated with
an assumed functional form ie lognormal Gaussian Boltzmann or Schultz-Zimm distri-
bution12 For the accurate representation of any kind of size distribution a form-free regu-
larization approach based on indirect Fourier transform has been widely adopted to probe
colloidal systems in solution involving form factor pattern matching and optimization with
least-squares methods28ndash30 In a recent comparative study for sub-5 nm hybrid NPs SAXS
demonstrated compelling advantages to DLS and fluorescence correlation spectroscopy by
resolving not only the size distribution of the silica core but also the molecular mass disper-
4
sity of the polymer shell via quantitative modeling with a core-shell sphere form factor31
Nonetheless the parametric regularization methods are sensitive to prior information such as
the maximum diameter which may occur artificial oscillations32 To this end a Monte Carlo
(MC) method based on model-free trial-and-error sampling was proposed for unbiased NP
size distribution analysis3334 Although this iterative process requires substantial computing
power MC fitting exhibits a rather simple theoretical structure since it assumes the scattered
intensity is approximated by the sum of elementary components ie for SAXS the Rayleigh
scattering functions of homogeneous spheres35 This approach was pioneered by Martelli
and Di Nunzio who demonstrated comparable sizing capabilities to the established indirect
Fourier transform structure interference and maximum entropy methods33 However this
pathway was limited to spherical systems which severely restricted its further application
A refined algorithm was developed by Pauw et al by compensating the effect of size and
shape on the scaling of the form factors which extended the use in polydisperse ensembles
with unknown shapes3436 Importantly the recent development of the user-friendly software
McSAS has further broadened the scope of this approach3738 In a cross-lab collaboration
of unimodal 5 nm AgNP the parametric fitting and the MC method led to consistent and
similar results highlighting the validity and reliability of employing the MC approach39
The consistency between the presupposed model fitting and the MC method was further
confirmed in a study of unimodal PbS nanocrystals in the range of 3 ndash 10 nm40 Despite
these encouraging results there remains a lack of comprehensive investigations utilizing the
MC-SAXS method especially for characterizing non-uniform NPs below 10 nm as well as in
direct comparison with other characterization techniques
To this end we present a cross-method comparative study of quasi-monodisperse polydis-
perse and bimodal thiol-capped AuNPs of 2 ndash 7 nm between conventional TEM and solution-
based SAXS and AUC The three techniques are based on fundamentally different working
principles ie direct imaging scattering and sedimentation We present feasible routes to
obtain experimental data from all three techniques and provide a side-by-side comparison
5
of the size distribution obtained from data analysis for a variety of samples By doing so
we aim to shed light on the general applicability of MC-SAXS and AUC-SV methods for
accurate NP size determination alongside a critical identification of their limitations
Materials and methods
Preparation of gold nanoparticles The 11-mercapto-1-undecanesulfonate (MUS) lig-
and41 and MUS-AuNP synthesis via oleylamine (OAm) ligand exchange42 were carried out
following previously published procedures Four batches of MUS-AuNPs were synthesized
with varying reaction temperatures at 40 25 15 10 C and labeled as MUS-NP1 ndash NP4
respectively We refer to the Supporting Information for experimental details
Transmission electron microscopy characterization The TEM samples were pre-
pared by dipping a sample grid (Holey Carbon Film on Copper 400 mesh EM Resolutions)
into AuNPs solutions in dichloromethane (DCM) TEM images were acquired with a high-
resolution JEM-2100 TEM system (200 keV JEOL) The size distribution was determined
by automated image analysis of the respective AuNP populations (count rates gt2000) us-
ing the software ImageJ The size and circularity threshold were set as gt2 nm2 and gt06
respectively To assess the reproducibility of TEM analysis three individual sample grids
were prepared from each of MUS-NP1 and MUS-NP4 sample solutions Subsequent TEM
imaging was performed in three separate experimental sessions
Small-angle X-ray scattering measurements and Monte Carlo fitting Samples
for solution-based SAXS were prepared in 10 mM NaCl aqueous solution at a concentration
of 5 mgml for MUS-NP1ndash4 and 10 mg mlminus1 for MUS-B1ndashB2 The SAXS measurements were
carried out using a Ganesha 300XL (SAXSLAB) at 20 C under vacuum with a high brilliance
microfocus Cu-source (wavelength 15418 Aring) The SAXS data were recorded on a Pilatus
300K solid-state photon-counting detector with a 2 mm beam stop for 1 h (q-range 0015
to 065 Aringminus1) After subtracting the scattering from the 10 mM NaCl buffer solution the
6
SAXS data were fed into the software McSAS (version 13) for size distribution analysis37
In McSAS the fitting of each SAXS dataset consisted of 10 individual repetitions with strict
fitting criteria namely a convergence criterion of χ2lt 1 and a minimum uncertainty estimate
of 2 Sphere model was chosen as the fit model and the ∆SLD (= SLDAu minus SLDH2O)
was input as 1155times 10minus6 Aringminus2 Number-weighted histograms were generated in the post-fit
analysis The number of bins was set to be 100 in a size range of 18 ndash 90 nm in diameter
Analytical ultracentrifugation characterization The AUC-SV measurements were
carried out using an Optima XL-A Ultracentrifuge (Beckman Coulter) for diluted SAXS
sample solutions (with 10 mM NaCl) Concentrations were adjusted to lie in the range
02 ndash 04 mgml which corresponded to 05 ndash 10 OD as confirmed by a pre-scan of UV-Vis
absorption at 400 nm for each sample before the SV measurement The recorded AUC
data were processed in the software SEDFIT to derive approximate solutions to the Lamm
equation via a numerical finite element method43 This fitting process generated a smooth
sedimentation coefficient distribution c(s) for each sample Extended 2D analysis was per-
formed to calculate the weighted average sedimentation s and diffusion coefficients D based
on average effective density using a previously published custom made MATLAB code24
Results and discussion
Homo-ligand AuNPs stabilized by MUS were prepared via thiol-for-OAm ligand exchange
from four batches of differently-sized AuNPs that were initially protected by OAm42 As
summarized in Tab S1 the core size of the four batches ranged from 2 ndash 7 nm and varying
degrees of size dispersity Two binary mixtures were prepared by mixing MUS-NP1 and
MUS-NP4 at weight ratios of 11 and 15 labeled as MUS-B1 and MUS-B2 respectively
(Tab S2)
7
TEM imaging
TEM size histograms of MUS-NP1 and MUS-NP4 from three separate experimental sessions
for both sample preparation and imaging are shown in Fig 1 alongside a normalized overlay
and representative micrographs The count rate for each individual analysis was gt 2000
20 nm
20 nm
Measurement
Measurement
(a)
(d)
a
b
c
a
bc
1 2 3 4 5 600
05
10
15
20
Rel
ativ
e C
ount
(au
)
Diameter (nm)
MUS-NP1-aMUS-NP1-bMUS-NP1-c
3 4 5 6 7 800
05
10
15
20
Rel
ativ
e C
ount
(au
)
Diameter (nm)
MUS-NP4-aMUS-NP4-bMUS-NP4-c
(b) (c)
(e) (f)
Figure 1 Size distribution histograms normalized overlays and representative TEM imageof MUS-NP1 (a-c) and MUS-NP4 (d-f) Three histograms were obtained per batch of AuNPsin three separate experiments (sample preparation and acquisition) from the identical samplesolution
8
For MUS-NP1 the obtained histograms are reasonably well represented by a normal
distribution (see Supporting Information Fig S1a) yielding mean size and standard deviation
of 28 plusmn 03 29 plusmn 05 and 28 plusmn 04 for the three respective analyses and corresponding
dispersity values of 124 177 and 159 These significant differences are also depicted
in the normalized overlays of the respective histograms shown in Fig 1b Further evidence for
the disparity of the three sub-populations is provided by direct statistical comparison namely
the t-test and the Kolmogorov-Smirnov test The t-test assumes that both sub-populations
follow a normal distribution with equal variance and determines whether the two groups
have the same mean ie originate from the same parental population The corresponding
p-values of the pairwise comparison are shown in the Supporting Information with MUS-
NP1-a and MUS-NP1-c likely originating from the same parental population while the null
hypothesis was rejected for all other couples ie there were significant differences detected
between the respective sub-populations The more generic two-sample Kolmogorov-Smirnov
test was also applied to determine whether the respective pairs of sub-populations follow the
same distribution The obtained p-values were orders of magnitude below the significance
level of 5 suggesting that none of the sub-population would from a statistical perspective
originate from the same AuNP population Overall these results indicate that the variation in
sample preparation and analysis is statistically significant See the Supporting Information
for details
A similar comparative analysis of the respective TEM experiments is presented for MUS-
NP4 in Fig 1d-f It is important to note that the above conducted (and widely common)
reporting of mean values standard deviation and dispersity represents a simplification and
is not suitable for size populations that deviate from normal distributions44 As shown in the
Supporting Information (Fig S1b) the MUS-NP4 sub-populations displayed herein cannot
be described by a normal distribution Nevertheless significant differences are also appar-
ent from qualitative comparison most notably by the lack of a shoulder towards smaller
AuNPs in MUS-NP4-b compared to MUS-NP4-a and MUS-NP4-c Furthermore the posi-
9
tion of the main peak ranges from 56 nm to 60 nm between the three runs Both t-test
and Kolmogorov-Smirnov were also applied to MUS-NP4-a MUS-NP4-b and MUS-NP4-c
yielding stark evidence that the three respective sub-populations are significantly different
from a statistical perspective (see Supporting Information)
These findings are in agreement with earlier studies emphasizing on the limitations of
TEM size analysis when based on the conventional practice of sample preparation and image
analysis applied herein2745
MC-SAXS analysis
The SAXS profiles of both single-type samples and binary mixtures were measured in aqueous
solutions For a better estimation of the form factor of individual AuNPs 10 mM NaCl was
added to increase the ionic strength of the medium and thus screen any medium- and long-
range interaction between AuNPs SAXS curves after background subtraction are presented
as log-log plots in Fig 2 for 5 mgml single-type solutions and 10 mgml binary mixtures
respectively Qualitatively both single-type and biomodal measured curves demonstrated
pronounced form peaks in the high q region and featureless flat profiles for q lt 1 nmminus1
For single-type samples the peak position of the form peak in the high q region was
at 32 28 22 and 19 nmminus1 for MUS-NP1 ndash NP4 respectively (Fig 2a-d) This clear shift
towards lower angles corresponds to a size increase of the scatterer which was in line with
the TEM results Meanwhile the curves of the binary mixtures followed closely the pattern
overlapping of individual form peaks observed in single-type samples (Fig 2ef)
Both the date fitting of single-type and binary mixtures indicate that effective scattering
occurred from individual AuNPs with non-interacting contributions which we relate to three
major factors 1) the distinct SLD of gold gave rise to pronounced form factors in diluted so-
lutions 2) the ionic repulsion by MUS maintained excellent colloidal stability and prevented
NP clustering or aggregation 3) the addition of 10 mM NaCl resulted in charge screening
which disrupted medium- and long-range NP-NP ionic interaction It is important to note
10
(c) (d)
(b)(a)
03 05 2 31001
01
1
10
100
MUS-NP4MC Fit
03 05 2 31001
01
1
10
100
MUS-NP1MC Fit
I(q)
q (nm-1)03 05 2 31
001
01
1
10
100
I (q)
q (nm-1)
MUS-NP2MC Fit
03 05 2 31
001
01
1
10
100
MUS-NP3MC Fit
(f)(e)
03 05 2 31001
01
1
10
100
MUS-NP1+4 (11)MC Fit
03 05 2 31001
01
1
10
100
MUS-NP1+4 (15)MC Fit
I (q)
q (nm-1)
I (q)
q (nm-1)
I (q)
q (nm-1)
I (q)
q (nm-1)
Figure 2 SAXS profiles and MC fitting (log-log plots) of (a) 5 mgml MUS-NP1 (b) 5 mgmlMUS-NP2 (c) 5 mgml MUS-NP3 (d) 5 mgml MUS-NP4 (e) 10 mgml MUS-B1 (11wt)and (f) 10 mgml MUS-B2 (15wt)
that these features were key prerequisites for the implementation of MC fitting analysis A
summary of statistical information obtained from 10 number-weighted output distributions
by independent MC fitting repetitions for each sample is shown in the Supporting Infor-
mation (Tab S3) Note the closely matched fitting curves and the negligible discrepancies
between individual runs These results indicate that the herein presented MC-SAXS method
provides robust results for non-monodisperse and bimodal AuNP populations with minimal
11
external information
AUC-SV analysis
The sedimentation of NPs relates to their size shape and density Herein the procedure
of an AUC-SV measurement alongside numerical finite element fitting in SEDFIT allowed
to retrieve the 1D sedimentation coefficient distribution c(s) and deconvolute D from the
s profile to generate 2D c(sD) information for a more comprehensive analysis The rep-
resentative results are shown in Fig 3 for MUS-B2 Further results for separate samples of
MUS-NP1 and MUS-NP4 are provided in the Supporting Information (Fig S2) Character-
ization of MUS-NP1 gave rise to a primary peak at 48 S (Svedberg unit equals to 10minus13 s)
and a less pronounced secondary peak at 77 S Both peaks were also retrieved in the 2D plot
with matched peak position and relative intensity By contrast although the 1D analysis of
MUS-NP4 resolved a dominant peak at 204 S and a much reduced peak at 141 S the sec-
ondary peak was diminished after 2D analysis which required experimental data of higher
signal-to-noise ratio Two peaks at 58 S and 198 S respectively were well resolved in both
1D and 2D plots of the mixed sample MUS-B2
Importantly with MUS-B2 being a mixture of MUS-NP1 and MUS-NP4 (15wt) both
peaks can be assigned to the primary peaks in the single-type solutions Meanwhile no
further distribution feature was extracted from the 2D analysis suggesting a potential loss of
information such as the secondary peaks of the respective native populations MUS-NP1 and
MUS-NP4 Our results are in line with a recent study by Walter et al who related the lack
of sensitivity to the regularization process and the simplified treatment of applying a global
average density in the 2D sedimentation-diffusion analysis ignoring the size dependence of
ρeff 26
Due to the above observed limitations of the 2D sedimentation-diffusion analysis the
results of the 1D sedimentation served to calculate the size distribution Please see the
Supporting Information for a full overview of the hydrodynamic size analysis In short the
12
50 100 150 200 250 300
2
3
4
5
6
7
8
9
10
0005
001
0015
002
0025
Sedimentation (S)
004
c(s)
(1S
)
002
0
-11
Diff
usio
n (m
s)
Figure 3 Sedimentation and diffusion analysis of MUS-B2 (15wt) Two plots correspondto the integral 1D sedimentation coefficient distribution and the 2D sedimentation-diffusioncorrelation
dH obtained from the Stokes-Einstein equation (Eq S1) was related to core-shell model (Fig
S3) consisting of a rigid gold core of diameter d and a soft shell of thickness l formed by
the MUS ligand capping and a solvation layer The effective density ρeff of MUS-AuNPs
with hydrodynamic diameter dH was then calculated for each sample The derived dH vs
c(s) relationships are summarized in Fig S4 and the results are exemplified by the plot for
MUS-B2 in Fig 4(a) Since the AUC data was represented by absorbance the c(s) data was
corrected by the extinction coefficient ε to compensate for size-dependent Rayleigh scattering
and absorption4647 The size dependence of NP extinction coefficient (black dots based on46)
and corrected distribution plots (green) for MUS-B2 are summarized in Fig 4(b) with results
for the other samples shown in Fig S4 Note the significant increase in the number fraction
of the smaller-sized AuNPs as a consequence of the extinction compensation
It is important to note that for retrieving the core size distribution of AuNPs with the
implemented 1D approach a fixed value for l was used to account for both the ligand capping
layer and the solvation layer here 13 nm according to published results on an identical NP
13
(b)(a)
5 6 7 8 9 10000
001
002
003
004
005
006
Rel
ativ
e N
umbe
r Fra
ctio
n
dH (nm)
MUS-NP1+4 (15)
00
20x107
40x107
60x107
80x107
10x108
12x108
5 6 7 8 9 10000
001
002
003
c(s)
(1S
)
dH (nm)
MUS-NP1+4 (15)
Extin
ctio
n C
oeffi
cien
t
Figure 4 Calculated size distribution before (a) and after (b) extinction correction of MUS-B2 (15wt) by AUC-SV The extinction coefficient of the gold core as a function of size isshown in black scatters
system48 While this is a simplified approximation the ample contrast between the gold core
and the soft shell layer still renders this method transferable to many NP systems which
have rigid cores and smooth surface morphologies
Comparative studies
Fig 5 summarizes the size distribution histograms obtained from TEM imaging MC-SAXS
and AUC-SV for the single-type samples MUS-NP1 ndash NP4 containing AuNPs ranging from
2 ndash 7 nm Some important characteristics emerge from a direct comparison
As evidenced by the Gaussian fit plotted alongside Figs 5ghi the results obtained for
MUS-NP3 by all three techniques follow a normal distribution thus enabling to reliably
compare mean size and standard deviation from statistical analysis The obtained mean size
was remarkably similar with 50 nm 51 nm and 50 nm calculated for TEM imaging MC-
SAXS and AUC-SV respectively The spread of counts was broader in TEM analysis with
a standard deviation of 03 nm in comparison to 02 nm obtained for both MC-SAXS and
14
AUC-SV The corresponding dispersity was calculated alongside with 68 39 34
respectively
Apart from MUS-NP1 (Fig 5a-c) where the MC-SAXS result was discrepant to TEM
and AUC-SV the position of the main peak was consistent for all AuNP populations across
the three techniques In general for AuNPs below 3 nm MC-SAXS provided a less defined
spread and higher error values The existence of shoulders or minority populations was
found more pronounced in TEM than in MC-SAXS and AUC-SV but all techniques picked
up some degree of dispersity In particular for MUS-NP1 and MUS-NP4 the main peak
obtained by AUC-SV was significantly narrower than for the other techniques
Cou
nt
Diameter (nm)(b) (e)
(d)(a) (g)
(h)
(f)(c) (i)
2 3 4 5 6 7 8 9000
003
006
009
012
015
Rel
ativ
e N
umbe
r Fra
ctio
n
Diameter (nm)
MUS-NP4
2 3 4 5 6 7 8 9000
002
004
006
008
010
012
Rel
ativ
e N
umbe
r Fra
ctio
n
Diameter (nm)
MUS-NP1
2 3 4 5 6 7 8 9000
002
004
006
008
010MUS-NP1
Rel
ativ
e N
umbe
r Fra
ctio
nC
ount
Diameter (nm)
Diameter (nm)2 3 4 5 6 7 8 9
000
002
004
006
008
010
012MUS-NP2
Rel
ativ
e N
umbe
r Fra
ctio
n
Diameter (nm)2 3 4 5 6 7 8 9
000
002
004
006
008
010MUS-NP4
Rel
ativ
e N
umbe
r Fra
ctio
n
Diameter (nm)
Cou
nt
Diameter (nm)
Cou
nt
Diameter (nm)
(j)
(k)
(l)
2 3 4 5 6 7 8 9000
002
004
006
008
Rel
ativ
e N
umbe
r Fra
ctio
n
Diameter (nm)
MUS-NP2
2 3 4 5 6 7 8 90
20
40
60
80
100MUS-NP3Gaussian fit
2 3 4 5 6 7 8 9000
004
008
012
016
020
024
Rel
ativ
e N
umbe
r Fra
ctio
n
Diameter (nm)
MUS-NP3Gaussian fit
2 3 4 5 6 7 8 9000
003
006
009
012
Rel
ativ
e N
umbe
r Fra
ctio
n
Diameter (nm)
MUS-NP3Gaussian fit
Figure 5 Size distribution analysis of single-type samples by TEM (red) SAXS (blue) andAUC (green) (a)ndash(c) MUS-NP1 (d)ndash(f) MUS-NP2 (g)ndash(i) MUS-NP3 (j)ndash(l) MUS-NP4 Torepresent core size distribution 2timesl were subtracted for the AUC results after normalizationwith corresponding extinction coefficients
15
These trends were also observed in the binary mixtures MUS-B1 and MUS-B2 as shown
in Fig 6 A comparison of the data to expected simulated histograms via superposition of
the single-type results can be found in the Supporting Information (Fig S5) Most notably
the AUC-SV characterization was unable to accurately represent the minority population in
MUS-B1 where a equal weight mixture of MUS-NP1 and MUS-NP4 and thus a dominance
of MUS-NP1 in numbers effectively led to an overshadowing of the larger less numerous
AuNPs
(b)
(a)
(c)
Diameter (nm)
Cou
nt
(f)
(d)
2 3 4 5 6 7 8 9000
003
006
009
012
015
018
021
Rel
ativ
e N
umbe
r Fra
ctio
n
Diameter (nm)
MUS-NP1+4 (11)
2 3 4 5 6 7 8 9000
001
002
003
004
005
006MUS-NP1+4 (11)
Rel
ativ
e N
umbe
r Fra
ctio
n
Diameter (nm)2 3 4 5 6 7 8 9
000
001
002
003
004
005
006
007MUS-NP1+5 (15)
Rel
ativ
e N
umbe
r Fra
ctio
n
Diameter (nm)
(e)
2 3 4 5 6 7 8 9000
002
004
006MUS-NP1+4 (15)
Diameter (nm)
Rel
ativ
e N
umbe
r Fra
ctio
n
Diameter (nm)
Cou
nt
Figure 6 Size distribution analysis of binary mixtures by TEM (red) SAXS (blue) and AUC(green) (a)ndash(c) MUS-B1 (11wt) (d)ndash(f) MUS-B2 (15wt) To represent core size distribution2timesl were subtracted for the AUC results after normalization with corresponding extinctioncoefficients
16
The following discussion aims to systematically examine the advantages and limitations
of each techniques In all samples the variation between individual characterization runs
for the identical sample was observed to be significantly higher for TEM compared to SAXS
and AUC This may be related to the fact that 1) TEM is a local imaging technique which
carries limited statistical representation by examining only a small fraction of the whole sam-
ple population 2) The inspection of single particles and the experimenter-guided workflow
of sample preparation imaging and data analysis can entail errors from operator bias1213
Furthermore it is important to mention that although we have seen a growing utilization
of in situ liquid-phase TEM and cryo-TEM the commonly used standard TEM requires
the removal of the suspending liquid after the drop-cast sample preparation This process
is typically realized by vacuum or ambient drying which often alters the dispersion state
of sample materials and introduces artifacts obscuring accurate measurement15 All these
factors generate discrepancies for representing the size distribution which can impair com-
parable and reproducible data analysis27 On the other hand the size distribution observed
in TEM results suggested a broader size distribution evidenced by a higher polydispersity
most notably in MUS-NP2 ndash NP4 It is important to note that in contrast to SAXS and
AUC TEM measures individual NPs and thus minority size fractions are equally counted
and represented offering an intrinsic advantage for arbitrary populations On the other
hand thresholding for image contrast may lead to an underestimation of the smaller-sized
NPs as the outer part of smaller NPs with poor contrast is typically filtered when applying
an overall threshold in common image analysis routines In spite of these drawbacks TEM
still offers a number of advantages including accessibility and ease of data analysis thus
providing a rapid characterization of AuNP core sizes and shapes with a semi-quantitative
estimation of the degree of homogeneity14
By contrast both SAXS and AUC are ensemble methods which provides collective data
in solution that can be used for detailed statistical analysis of in situ colloidal features Due
to the distinct X-ray SLD of gold core and the similar SLD values between alkanethiols and
17
solvent molecules in a AuNP sample SAXS permits the selective characterization of the gold
core while excluding the influence of the ligand shell and the solvation layer Compared to
the results by TEM and AUC the histograms by MC-SAXS entailed more detailed features
of the distribution patterns in both single-type samples and binary mixtures This can be
related to the adequate resolving power of SAXS and the implementation of the unbiased
MC modeling which extends the use of SAXS for non-monodisperse NP systems It is
important to note that the average size in SAXS histograms was slightly larger than those
of TEM and AUC for populations with NPs below 3 nm notably MUS-NP1 MUS-B1 and
MUS-B1 These findings are in agreement with the published results on PbS nanocrystals
with an unimodal distribution where larger average size of 32 nm for the MC method in
comparison to 28 nm when fitting the identical SAXS profile with a classical log-normal-
based model40 Importantly this discrepancy was markley reduced for samples above 4 nm40
This limitation of the MC method for sub-3 nm NPs may be attributed to a number of factors
1) as described by the Porodrsquos Law the scattering intensity decreases rapidly at the high q
region (corresponding to smaller size) which entails non-negligible systematic data noise 2)
molecules in solution (eg salt and solvent) share similar length scales to ultra-small NPs and
the scattering of these molecules can not be effectively canceled by solvent subtraction12
Once more this is in line with the PbS study in which the scattering of unbound lead
oleate molecules resulted in a secondary population at 23 nm in their MC fitting results40
Consequently the presented MC-SAXS is generally not suitable for characterizing ultra-
small AuNPs below 3 nm Moreover considering the limit of sample-to-detector distance in
SAXS instrumentation as well as the reduced beam flux at the low q region this MC-SAXS
method may not provide accurate estimation of NPs whose diameter above 100 nm without
the use of ultra-small angle X-ray scattering (USAXS)
AUC-SV analysis on the other hand is a strictly in situ process that examines the hy-
drodynamic behavior of the measured material system In our experiments the analysis
of 1D sedimentation by a simplified core-shell model resulted in sharp distribution profiles
18
observed by the pronounced primary peak in both single-type samples and binary mixtures
Consequently the underrepresentation of minority populations led to an overestimation of
the uniformity when compared to SAXS and TEM This can be explained by the constrained
resolution of both AUC measurements and subsequent data fitting It is important to note
that the at times laborious optimization of centrifugation conditions is imperative to achieve
a dynamic range covers all species of interest and avoid discrimination of a certain popu-
lations49 Furthermore although diluted sample solutions with salt stabilization were used
to minimize the charge effects the concentration dependence of dH could not be completely
excluded without the extrapolation to infinite dilutions17 The process of extrapolating core
sizes from hydrodynamic sizing of 1D sedimentation analysis may also incur systematic er-
rors especially for non-spherical samples or materials with extended soft shell structures
For such complex systems more advanced instrumentation such as multi-wavelength detec-
tor and fitting schemes eg the Custom Grid spectrum analysis are required to facilitate
the implementation of AUC252650
Conclusions
In summary a comparative study of sub-10 nm AuNP size distribution characterized by
TEM SAXS and AUC is presented All three methods provided consistent assessment
of quasi-monodisperse AuNPs with an average core diameter of 5 nm but distinct differ-
ences were observed for non-monodisperse and bimodal populations The conventional TEM
imaging method permitted facile characterization of AuNPs with various size distributions
but it suffered from poor reproducibility and a lack of statistical significance SAXS mea-
surement combined with subsequent model-free MC fitting enabled reliable estimation of
non-monodisperse size distributions with comprehensive statistical analysis However this
method is not suitable for ultra-small NPs below 3 nm due to the reduced scattering intensity
and the interference of small molecules The sedimentation-based AUC-SV method allowed
19
comparable estimation of both single-type samples and binary mixtures Par contra its
relatively low resolution resulted in the underrepresentation of the minor populations This
study offers valuable insights in state-of-art AuNP characterization methods and may be
transferred to guide the size distribution analysis on other material systems
Acknowledgement
This project received funding from the European Unionrsquos Horizon 2020 research and inno-
vation program under grant agreement No 633635 (DIACHEMO) YY acknowledges the
support by the UCL Overseas Research Scholarship and the Graduate Research Scholar-
ship as well as Dr Han Wu and the EPSRC CNIE research facility service (EPSRC Award
EPK0386561) at UCL for the SAXS instrument access NMF expresses gratitude for fund-
ing by the EPSRC under a Doctoral Training Partnership (EPM5079701) The authors
are grateful to Dr Paulo Jacob Silva (EPFL) for providing MUS ligand
Supporting Information Available
The Supporting Information is available free of charge on the ACS Publications website at
DOI
The following files are available free of charge
bull Filename brief description
bull Filename brief description
References
(1) C Dreaden E M Alkilany A Huang X J Murphy C A El-Sayed M The Golden
Age Gold Nanoparticles for Biomedicine Chem Soc Rev 2012 41 2740ndash2779
20
(2) Saha K Agasti S S Kim C Li X Rotello V M Gold Nanoparticles in Chemical
and Biological Sensing Chem Rev 2012 112 2739ndash2779
(3) Bodeloacuten G Costas C Peacuterez-Juste J Pastoriza-Santos I Liz-Marzaacuten L M Gold
Nanoparticles for Regulation of Cell Function and Behavior Nano Today 2017 13
40ndash60
(4) Burns A A Vider J Ow H Herz E Penate-Medina O Baumgart M Lar-
son S M Wiesner U Bradbury M Fluorescent Silica Nanoparticles with Efficient
Urinary Excretion for Nanomedicine Nano Lett 2009 9 442ndash448
(5) A Sousa A A Hassan S L Knittel L Balbo A A Aronova M H Brown P
Schuck P D Leapman R Biointeractions of Ultrasmall Glutathione-Coated Gold
Nanoparticles Effect of Small Size Variations Nanoscale 2016 8 6577ndash6588
(6) Pan Y Neuss S Leifert A Fischler M Wen F Simon U Schmid G Bran-
dau W Jahnen-Dechent W Size-Dependent Cytotoxicity of Gold Nanoparticles
Small 2007 3 1941ndash1949
(7) Jiang Y Huo S Mizuhara T Das R Lee Y-W Hou S Moyano D F Dun-
can B Liang X-J Rotello V M The Interplay of Size and Surface Functionality on
the Cellular Uptake of Sub-10 nm Gold Nanoparticles ACS Nano 2015 9 9986ndash9993
(8) Macdonald T J Wu K Sehmi S K Noimark S Peveler W J du Toit H
Voelcker N H Allan E MacRobert A J Gavriilidis A Parkin I P Thiol-Capped
Gold Nanoparticles Swell-Encapsulated into Polyurethane as Powerful Antibacterial
Surfaces Under Dark and Light Conditions Sci Rep 2016 6 39272
(9) Schneider C A Rasband W S Eliceiri K W NIH Image to ImageJ 25 years of
image analysis Nat Methods 2012 9 671ndash675
21
(10) Mondini S Ferretti A M Puglisi A Ponti A Pebbles and PebbleJuggler software
for accurate unbiased and fast measurement and analysis of nanoparticle morphology
from transmission electron microscopy (TEM) micrographs Nanoscale 2012 4 5356ndash
5372
(11) Cho E J Holback H Liu K C Abouelmagd S A Park J Yeo Y Nanoparti-
cle Characterization State of the Art Challenges and Emerging Technologies Mol
Pharm 2013 10 2093ndash2110
(12) Li T Senesi A J Lee B Small Angle X-Ray Scattering for Nanoparticle Research
Chem Rev 2016 116 11128ndash11180
(13) Modena M M Ruumlhle B Burg T P Wuttke S Nanoparticle Characterization
What to Measure Adv Mater 2019 0 1901556
(14) Borchert H Shevchenko E V Robert A Mekis I Kornowski A Gruumlbel G
Weller H Determination of Nanocrystal Sizes A Comparison of TEM SAXS and
XRD Studies of Highly Monodisperse CoPt3 Particles Langmuir 2005 21 1931ndash1936
(15) Michen B Geers C Vanhecke D Endes C Rothen-Rutishauser B Balog S
Petri-Fink A Avoiding Drying-Artifacts in Transmission Electron Microscopy Char-
acterizing the Size and Colloidal State of Nanoparticles Sci Rep 2015 5
(16) Evans J E Jungjohann K L Browning N D Arslan I Controlled Growth of
Nanoparticles from Solution with In Situ Liquid Transmission Electron Microscopy
Nano Lett 2011 11 2809ndash2813
(17) Dieckmann Y Coumllfen H Hofmann H Petri-Fink A Particle Size Distribution
Measurements of Manganese-Doped ZnS Nanoparticles Anal Chem 2009 81 3889ndash
3895
22
(18) Mahl D Diendorf J Meyer-Zaika W Epple M Possibilities and Limitations of
Different Analytical Methods for the Size Determination of a Bimodal Dispersion of
Metallic Nanoparticles Colloids Surf A 2011 377 386ndash392
(19) Zanchet D Hall B D Ugarte D Structure Population in Thiol-Passivated Gold
Nanoparticles J Phys Chem B 2000 104 11013ndash11018
(20) Hall B D Zanchet D Ugarte D Estimating Nanoparticle Size from Diffraction
Measurements J Appl Crystallogr 2000 33 1335ndash1341
(21) Calvin S Luo S X Caragianis-Broadbridge C McGuinness J K Anderson E
Lehman A Wee K H Morrison S A Kurihara L K Comparison of Extended X-
Ray Absorption Fine Structure and Scherrer Analysis of x-Ray Diffraction as Methods
for Determining Mean Sizes of Polydisperse Nanoparticles Appl Phys Lett 2005 87
233102
(22) Montes-Burgos I Walczyk D Hole P Smith J Lynch I Dawson K Characterisa-
tion of Nanoparticle Size and State Prior to Nanotoxicological Studies J Nanoparticle
Res 2010 12 47ndash53
(23) L Planken K Coumllfen H Analytical Ultracentrifugation of Colloids Nanoscale 2010
2 1849ndash1869
(24) Carney R P Kim J Y Qian H Jin R Mehenni H Stellacci F Bakr O M
Determination of Nanoparticle Size Distribution Together with Density or Molecular
Weight by 2D Analytical Ultracentrifugation Nat Commun 2011 2 335
(25) Demeler B Nguyen T-L Gorbet G E Schirf V Brookes E H Mulvaney P
El-Ballouli A O Pan J Bakr O M Demeler A K Hernandez Uribe B I Bhat-
tarai N Whetten R L Characterization of Size Anisotropy and Density Hetero-
geneity of Nanoparticles by Sedimentation Velocity Anal Chem 2014 86 7688ndash7695
23
(26) Walter J Gorbet G Akdas T Segets D Demeler B Peukert W 2D Analysis
of Polydisperse CorendashShell Nanoparticles Using Analytical Ultracentrifugation Analyst
2016 142 206ndash217
(27) Chen Z H Kim C Zeng X-b Hwang S H Jang J Ungar G Characterizing
Size and Porosity of Hollow Nanoparticles SAXS SANS TEM DLS and Adsorption
Isotherms Compared Langmuir 2012 28 15350ndash15361
(28) Glatter O A New Method for the Evaluation of Small-Angle Scattering Data J Appl
Cryst 1977 10 415ndash421
(29) Svergun D I Mathematical Methods in Small-Angle Scattering Data Analysis J Appl
Cryst 1991 24 485ndash492
(30) Pedersen J S Determination of Size Distribution from Small-Angle Scattering Data
for Systems with Effective Hard-Sphere Interactions J Appl Cryst 1994 27 595ndash608
(31) Barteau K P Ma K Kohle F F E Gardinier T C Beaucage P A
Gillilan R E Wiesner U Quantitative Measure of the Size Dispersity in Ultrasmall
Fluorescent OrganicndashInorganic Hybrid CorendashShell Silica Nanoparticles by Small-Angle
X-Ray Scattering Chem Mater 2019 31 643ndash657
(32) Hansen S Pedersen J S A Comparison of Three Different Methods for Analysing
Small-Angle Scattering Data J Appl Cryst 1991 24 541ndash548
(33) Martelli S Di Nunzio P E Particle Size Distribution of Nanospheres by Monte Carlo
Fitting of Small Angle X-Ray Scattering Curves Part Part Syst Charact 2002 19
247ndash255
(34) Pauw B R Pedersen J S Tardif S Takata M Iversen B B Improvements and
Considerations for Size Distribution Retrieval from Small-Angle Scattering Data by
Monte Carlo Methods J Appl Cryst 2013 46 365ndash371
24
(35) Nunzio P E D Martelli S Bitti R R Use of Monte Carlo Methods in Characterizing
Nanostructured Materials by Wide- and Small-Angle X-Ray Scattering J Dispers Sci
Technol 2005 25 491ndash501
(36) Rosalie J M Pauw B R Form-Free Size Distributions from Complementary Stereo-
logical TEMSAXS on Precipitates in a MgndashZn Alloy Acta Mater 2014 66 150ndash162
(37) Bressler I Pauw B R Thuumlnemann A F McSAS Software for the Retrieval of
Model Parameter Distributions from Scattering Patterns J Appl Cryst 2015 48
962ndash969
(38) Geertsen V Barruet E Gobeaux F Lacour J-L Tacheacute O Contribution to Ac-
curate Spherical Gold Nanoparticle Size Determination by Single-Particle Inductively
Coupled Mass Spectrometry A Comparison with Small-Angle X-Ray Scattering Anal
Chem 2018 90 9742ndash9750
(39) Pauw B R Kaumlstner C Thuumlnemann A F Nanoparticle Size Distribution Quantifi-
cation Results of a Small-Angle X-Ray Scattering Inter-Laboratory Comparison J
Appl Cryst 2017 50 1280ndash1288
(40) Maes J Castro N De Nolf K Walravens W Abeacutecassis B Hens Z Size and Con-
centration Determination of Colloidal Nanocrystals by Small-Angle X-Ray Scattering
Chem Mater 2018 30 3952ndash3962
(41) Carney R P Astier Y Carney T M Voiumltchovsky K Jacob Silva P H Stel-
lacci F Electrical Method to Quantify Nanoparticle Interaction with Lipid Bilayers
ACS Nano 2013 7 932ndash942
(42) Yang Y Serrano L A Guldin S A Versatile AuNP Synthetic Platform for Decoupled
Control of Size and Surface Composition Langmuir 2018 34 6820ndash6826
25
(43) Schuck P Size-Distribution Analysis of Macromolecules by Sedimentation Velocity
Ultracentrifugation and Lamm Equation Modeling Biophys J 2000 78 1606ndash1619
(44) Murphy C J Buriak J M Best Practices for the Reporting of Colloidal Inorganic
Nanomaterials Chem Mater 2015 27 4911ndash4913
(45) Domingos R F Baalousha M A Ju-Nam Y Reid M M Tufenkji N Lead J R
Leppard G G Wilkinson K J Characterizing Manufactured Nanoparticles in the
Environment Multimethod Determination of Particle Sizes Environ Sci Technol
2009 43 7277ndash7284
(46) Liu X Atwater M Wang J Huo Q Extinction Coefficient of Gold Nanoparticles
with Different Sizes and Different Capping Ligands Colloids Surf B 2007 58 3ndash7
(47) Lechner M D Coumllfen H Mittal V Voumllkel A Wohlleben W Sedimentation Mea-
surements with the Analytical Ultracentrifuge with Absorption Optics Influence of Mie
Scattering and Absorption of the Particles Colloid Polym Sci 2011 289 1145ndash1155
(48) Bekdemir A Stellacci F A Centrifugation-Based Physicochemical Characterization
Method for the Interaction between Proteins and Nanoparticles Nat Commun 2016
7 13121
(49) Walter J Peukert W Dynamic Range Multiwavelength Particle Characterization
Using Analytical Ultracentrifugation Nanoscale 2016 8 7484ndash7495
(50) Walter J Loumlhr K Karabudak E Reis W Mikhael J Peukert W Wohlleben W
Coumllfen H Multidimensional Analysis of Nanoparticles with Highly Disperse Properties
Using Multiwavelength Analytical Ultracentrifugation ACS Nano 2014 8 8871ndash8886
26
Graphical TOC Entry
Some journals require a graphical entry for the Table of Contents Thisshould be laid out ldquoprint readyrdquo so that the sizing of the text is correctInside the tocentry environment the font used is Helvetica 8 pt asrequired by Journal of the American Chemical SocietyThe surrounding frame is 9 cm by 35 cm which is the maximum per-mitted for Journal of the American Chemical Society graphical table ofcontent entries The box will not resize if the content is too big insteadit will overflow the edge of the boxThis box and the associated title will always be printed on a separatepage at the end of the document
27
download fileview on ChemRxivCross-method_size_determination_final(v7)pdf (512 MiB)
Supporting information for
A cross-method comparison of sub-10 nm
nanoparticle size distribution
Ye Yangdagger Suiyang LiaoDagger Zhi LuoDagger Runzhang Qidagger Niamh Mac Fhionnlaoichdagger
Francesco StellacciDaggerpara and Stefan Guldinlowastdagger
daggerDepartment of Chemical Engineering University College London Torrington Place
London WC1E 7JE UK
DaggerInstitute of Materials Eacutecole Polytechnique Feacutedeacuterale de Lausanne 1015 Lausanne
Switzerland
paraInterfaculty Bioengineering Institute Eacutecole Polytechnique Feacutedeacuterale de Lausanne 1015
Lausanne Switzerland
E-mail sguldinuclacuk
S1
AuNP synthesis
In a two-step procedures AuNPs intermittently stabilized by oleylamine (OAm) were firstly
prepared before subsequent thiol ligand exchange The reaction started with preparing the
precursor at room temperature (sim22 C) by dissolving 05 mmol hydrogen tetrachloroaurate
(III) hydrate (HAuCl4middot3H2O Reagent ACS Acros Organics) in a 40 ml solvent mixture
of OAm (C18 content 80 ndash 90 Acros Organics) and n-octane (99 Acros Organics)
(11vv) The solution was mixed and sonicated under Ar flow for 10 min before stirring at
the reaction temperature The temperature was controlled by employing a 100 ml jacketed
flask with a temperature-controlled GR150-R2 circulating bath (Grant Instruments) The
reducing solution was prepared by dissolving 05 mmol tert-butylamine borane (tBAB 97
Sigma-Aldrich) in 1 ml OAm and 1 ml octane Intensive mixing was required before the
injection into the precursor solution under vigorous stirring The mixture was left reacting
in Ar atmosphere at the designated reaction temperature for 2 h before 30 ml of ethanol
(EtOH) was added to quench the reaction The AuNPs were collected by centrifugation at
5000 g for 10 min and then re-dispersed in dichloromethane (DCM) The obtained samples
were dried in a vacuum desiccator after repeated centrifugal washing in EtOH and methanol
(MeOH) The reaction temperatures of 40 25 15 10 C were used in four syntheses and
the obtained MUS-AuNP samples were labeled as MUS-NP1 ndash NP4 respectively A biphasic
solution of DCM-H2O (11vv) was used for the MUS-for-OAm ligand-exchange reaction
01 mmol MUS was dissolved in 12 ml of the biphasic solution mixture by vigorous stirring
for 10 min Subsequently 30 mg of the OAm-capped AuNPs in 6 ml DCM solution were
injected and the reaction solution was allowed to react at room temperature for 20 h To
quench the ligand-exchange reaction acetone was added and the AuNPs were collected
by centrifugation at 5000 g for 10 min To remove unbound water-soluble MUS ligands
repetitive washing in H2O were implemented with Amicon Ultra centrifugal filters (15 ml
10000 NMWL Merck Millipore) at 5000 g for 10 min before final washing in acetone and
subsequent vacuum drying
S2
TEM characterization
Table S1 Sample information of employed single-type MUS-AuNPs
Sample OAm-AuNP synthesis temperature Core size by TEMlabel C nm
MUS-NP1 40 26plusmn03MUS-NP2 20 38plusmn06MUS-NP3 10 51plusmn06MUS-NP4 5 56plusmn08
Table S2 Sample information of employed binary mixed MUS-AuNPs
Sample single-type sample Mixing ratio
MUS-B1 MUS-NP1MUS-NP4 11wt
MUS-B2 MUS-NP1MUS-NP4 15wt
(a)
(b)
(a)
(b)
Figure S1 Size distribution histograms of (a) MUS-NP1 and (b) MUS-NP4 The histogramsfor each batch of AuNPs were obtained from three separate experiments of different samplegrids prepared from an identical sample solution (see Figure 1 in main manuscript) Here thecorresponding normal distribution based on the mean size and standard deviation obtainedby statistical analysis of each histogram is plotted alongside
S3
Pairwise statistical comparisons of histograms
t-Test
The t-test assumes that both populations follow a normal distribution with equal variance
and determines if the means of the two populations are the sameS1 The two-sample t-test
was performed for each pair of measurements For almost all cases the null hypothesis was
rejected at a 5 significance level the corresponding p-values are shown in Table S3
Table S3 t-Test with equal variance The p-values for obtained by two-sample t-test aredisplayed below
MUS-NP1 MUS-NP4a-b 178 lowast 10minus9 595 lowast 10minus7
a-c 02265 202 lowast 10minus17
b-c 180 lowast 10minus6 241 lowast 10minus60
Kolmogorov-Smirnov test
The two-sample Kolmogorov-Smirnov test was used to determine if each pair of populations
follow the same distributionS2S3 This is a non-parametric technique which can be applied
to any arbitrary continuous distribution and therefore does not require the populations to
follow a normal distribution By pairwise examination of the three populations obtained
from samples MUS-NP1 and MUS-NP4 it was found that statistically no pair came from
the same parental distribution at the 5 significance level the resulting p-values are reported
in Table S4
Table S4 Kolmogorov-Smirnov test The p-values for the two-sample Kolmogorov-Smirnov test are provided here
MUS-NP1 MUS-NP4a-b 110 lowast 10minus28 573 lowast 10minus111
a-c 327 lowast 10minus9 376 lowast 10minus105
b-c 130 lowast 10minus6 256 lowast 10minus46
S4
In summary the non-parametric two-sample Kolmogorov-Smirnov test rejected the null
hypothesis that each TEM analysis followed the same distribution Furthermore the t-test
largely rejected the null hypothesis that each sample had the same mean with exception
of MUS-NP-a and MUS-NP-c Overall this provides evidence that the variation in TEM
sample preparation and analysis is statistically significant
MC-SAXS characterization
Table S5 Discrepancies among 10 number-weighted output distributions generated fromindependent MC fitting repetitions for each sample
Sample Mean nm Deviation of mean Variance12 nm Deviation of variance
MUS-NP1 31 10 05 56MUS-NP2 40 04 04 93MUS-NP3 52 05 03 37MUS-NP4 56 16 08 97
MUS-B1 35 24 09 53MUS-B2 44 15 11 24
S5
AUC-SV characterization
Sedimentation and diffusion analysis
006
004
002
0
Sedimentation (S)
c(s)
(1S
)D
iffus
ion
(m s
)
Sedimentation (S)50 100 150 200 250 300
002
003
005
006
007
008
009
c(s)
(1S
)
006
003
0
Diff
usio
n (m
s)
-10
(a)
(b)
001
002
003
004
005
006
1
2
3
4
5
004
001
Figure S2 Sedimentation and diffusion analysis of (a) MUS-NP1 and (b) MUS-NP4 Twoplots for each sample correspond to the integral 1D sedimentation coefficient distributionand the 2D sedimentation-diffusion correlation
S6
Hydrodynamic size analysis
The hydrodynamic Stokesrsquo diameter dH was calculated using the Stokes-Einstein equationS4
dH =
98315718ηSs
ρeff minus ρS (1)
where ρeff and ρS are the particle density and the solution density and ηS is the solution
viscosity
dρAu
lρl
dHρeff
Figure S3 Schematic of a spherical core-shell model for hydrodynamic size analysis Thehydrodynamic radius of the employed MUS-AuNPs consists of a rigid gold core and a softshell formed by the ligand capping and a solvation layer
The effective density ρeff of MUS-AuNPs with hydrodynamic diameter dH was calculated
by the following equationsS5
dH = d+ 2l (2)
ρeff =Mcore +Mshell
(43)π(dH2)3=
ρAu(43)π(d2)3 + ρl(43)π[(d2 + l)3 minus (d2)3]
(43)π(d2 + l)3 (3)
Here ρAu and ρl are the densities of the gold core and the soft shell respectively For
the purpose of calculating the size distribution of the herein employed MUS-AuNP popu-
lations bulk values for core and shell of ρAu and ρl at 1932 and 103 g cmminus3 were used
respectivelyS5 Combining Eq 1 and Eq 3 the dH vs c(s) relationship was calculated for
each sample
S7
Extinction coefficient correction
The c(s) data was corrected with an extinction coefficient ε variation using the following
equationS6
lnε = 3321lnd+ 10805 (4)
(b)(a)
65 70 75 80 85 90 95000
003
006
009
012
015
Rel
ativ
e N
umbe
r Fra
ctio
n
dH (nm)
MUS-NP4
00
20x107
40x107
60x107
80x107
65 70 75 80 85 90 95000
002
004
006
008
010
c(s)
(1S
)
dH (nm)
MUS-NP4
50 55 60 65 70 75 80 85 90000
001
002
003
004
005
c(s)
(1S
)
dH (nm)
MUS-NP2
50 55 60 65 70 75 80 85 90000
002
004
006
008
Rel
ativ
e N
umbe
r Fra
ctio
n
dH (nm)
MUS-NP2
00
20x107
40x107
60x107
80x107
45 50 55 60 65 70 75000
001
002
003
004
005
006
c(s)
(1S
)
dH (nm)
MUS-NP1
45 50 55 60 65 70 75000
003
006
009
012
Rel
ativ
e N
umbe
r Fra
ctio
n
dH (nm)
MUS-NP1
0
1x10⁷
2x10⁷
3x10⁷
4x10⁷
5x10⁷
Extin
ctio
n C
oeffi
cien
t
65 70 75 80 85 90 95000
002
004
006
c(s)
(1S
)
dH (nm)
MUS-NP3
65 70 75 80 85 90 95000
003
006
009
012
Rel
ativ
e N
umbe
r Fra
ctio
n
dH (nm)
MUS-NP3
00
20x107
40x107
60x107
80x107
10x108
Extin
ctio
n C
oeffi
cien
tEx
tinct
ion
Coe
ffici
ent
Extin
ctio
n C
oeffi
cien
t
(d)(c)
(f)(e)
(h)(g)
5 6 7 8 9 10000
003
006
009
012
015
018
021
Rel
ativ
e N
umbe
r Fra
ctio
n
dH (nm)
MUS-NP1+4 (11)
00
20x107
40x107
60x107
80x107
10x108
12x108
5 6 7 8 9 10000
002
004
006
c(s)
(1S
)
dH (nm)
MUS-NP1+4 (11)
Extin
ctio
n C
oeffi
cien
t
(j)(i)
Figure S4 Calculated size distribution before (blue) and after (green) extinction correctionby AUC-SV (a)(b) MUS-NP1 (c)(d) MUS-NP2 (e)(f) MUS-NP3 (g)(h) MUS-NP4(i)(j) MUS-B1 (11wt) Black scatter the size dependence of the gold core extinction
S8
(b)
(a)
(c) (f)
(d)
(e)
000
003
006MUS-NP1+4 (11)
2 3 4 5 6 7 8 9000
003
006
Rel
ativ
e N
umbe
r Fra
ctio
n
Diameter (nm)
MUS-B1
000
002
004MUS-NP1+5 (15)
2 3 4 5 6 7 8 9000
003
006
Rel
ativ
e N
umbe
r Fra
ctio
n
Diameter (nm)
MUS-B2
000
005
010MUS-NP1+4 (11)
2 3 4 5 6 7 8 9000
007
014
021
Rel
ativ
e N
umbe
r Fra
ctio
n
MUS-B1
000
004
008MUS-NP1+4 (15)
2 3 4 5 6 7 8 9000
003
006
Rel
ativ
e N
umbe
r Fra
ctio
n
MUS-B2
000
008
016
Rel
ativ
e N
umbe
r Fra
ctio
n
MUS-NP1+4 (11)
2 3 4 5 6 7 8 90
250
500
Cou
nt
Diameter (nm)
MUS-B1
000
006
012
Rel
ativ
e N
umbe
r Fra
ctio
n
MUS-NP1+4 (15)
2 3 4 5 6 7 8 90
100
200
Cou
nt
Diameter (nm)
MUS-B2
Diameter (nm)Diameter (nm)
Figure S5 Size distribution analysis of binary mixtures by TEM (red) SAXS (blue) and AUC(green) (a)ndash(c) MUS-B1 (11wt) (d)ndash(f) MUS-B2 (15wt) with corresponding simulateddistribution histograms (pink) calculated from single-type results shown in Figure 5 of themain manuscript To represent core size distribution 2timesl were subtracted for the AUCresults after normalization with corresponding extinction coefficients
S9
References
(S1) Fisher R Statistical methods for research workers 14th ed Hafner New York 1970
(S2) Massey F J The Kolmogorov-Smirnov Test for Goodness of Fit Journal of the Amer-
ican Statistical Association 1951 46 68ndash78
(S3) Durbin J Distribution Theory for Tests Based on the Sample Distribution Function
1st ed Society for Industrial and Applied Mathematics Philadelphia 1973
(S4) L Planken K Coumllfen H Analytical Ultracentrifugation of Colloids Nanoscale 2010
2 1849ndash1869
(S5) Carney R P Kim J Y Qian H Jin R Mehenni H Stellacci F Bakr O M
Determination of Nanoparticle Size Distribution Together with Density or Molecular
Weight by 2D Analytical Ultracentrifugation Nat Commun 2011 2 335
(S6) Liu X Atwater M Wang J Huo Q Extinction Coefficient of Gold Nanoparticles
with Different Sizes and Different Capping Ligands Colloids Surf B 2007 58 3ndash7
S10
download fileview on ChemRxivSI_Cross-method_size_determination_final(v7)pdf (79971 KiB)
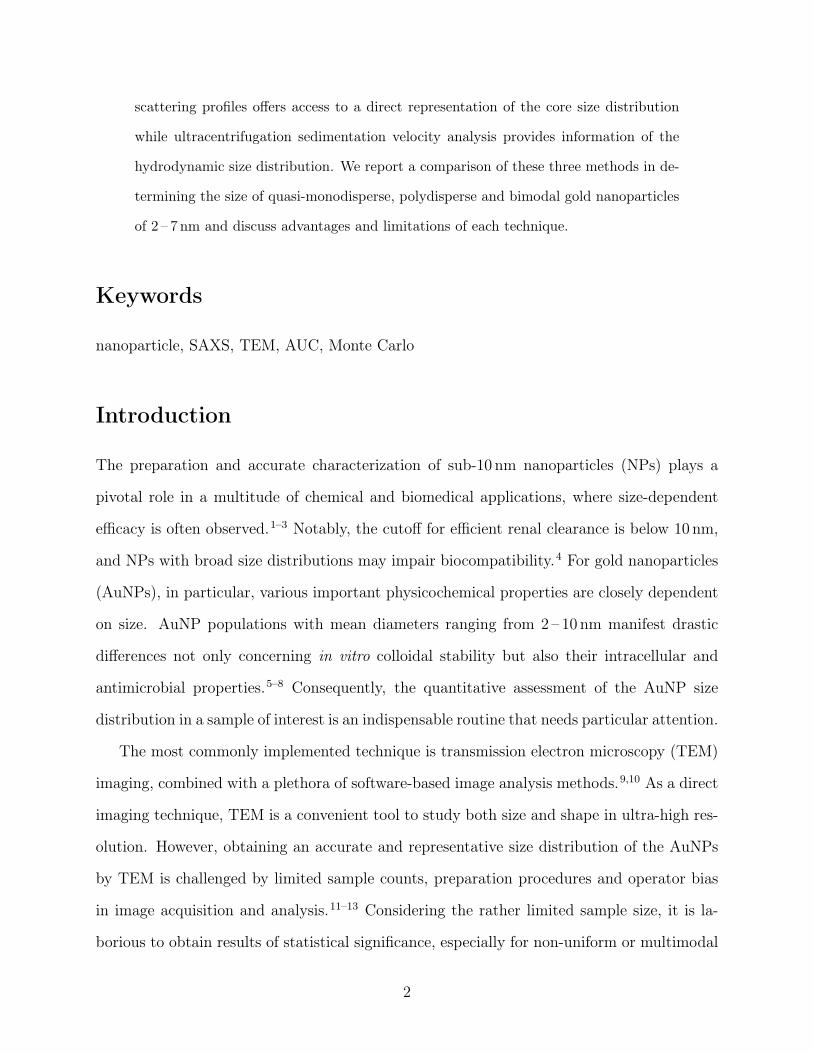
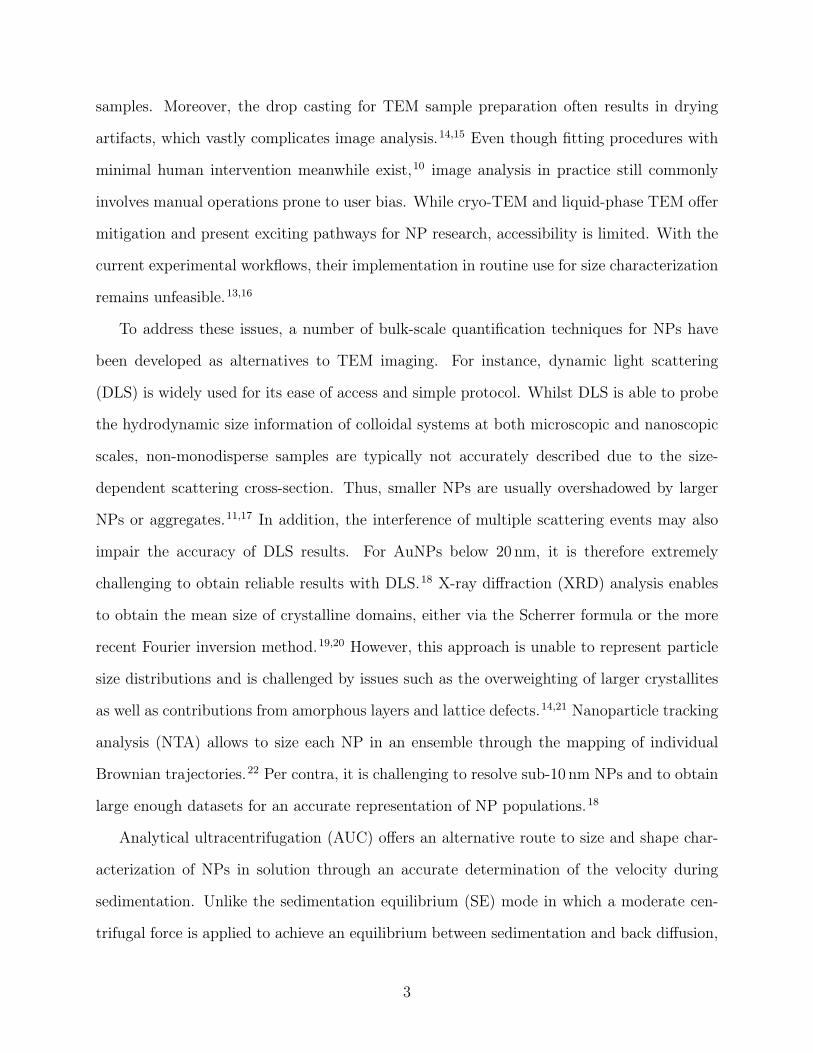
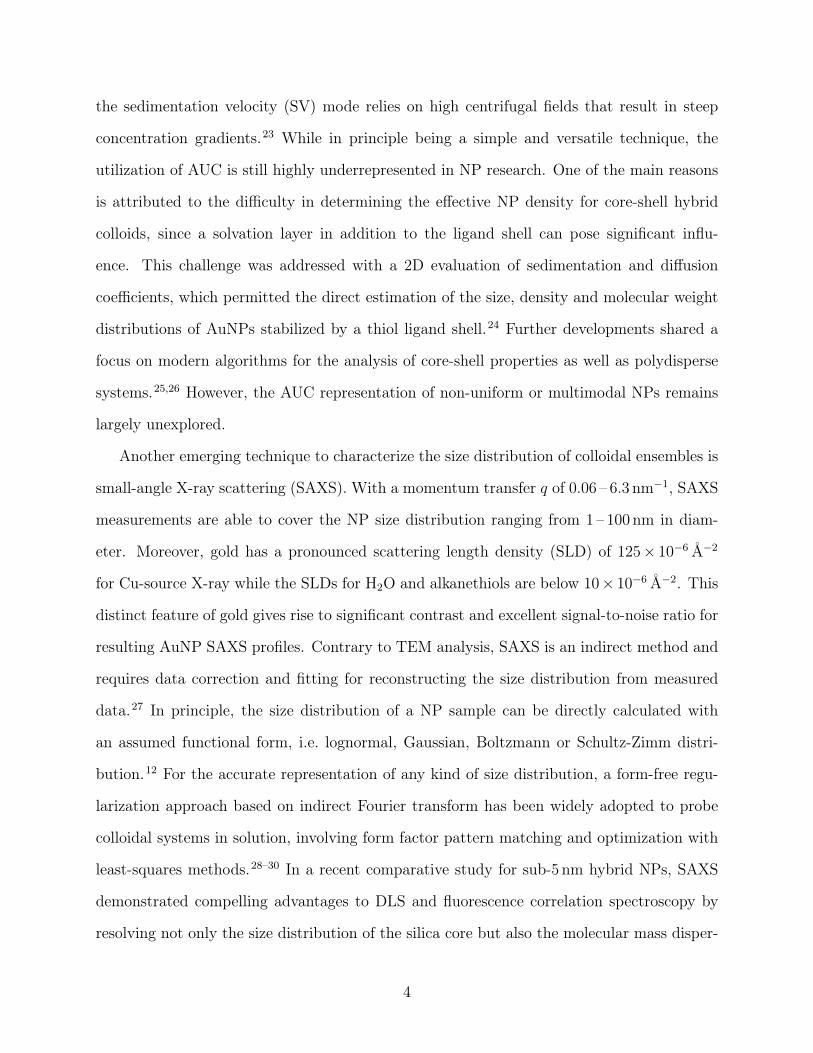
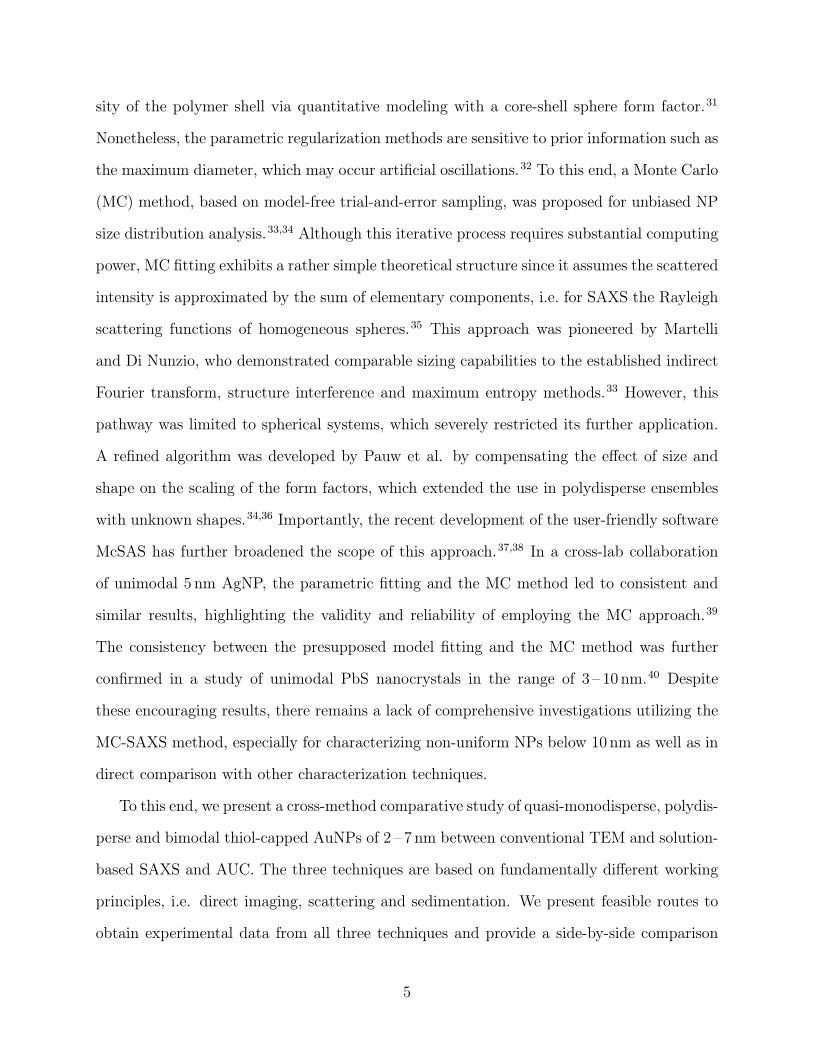
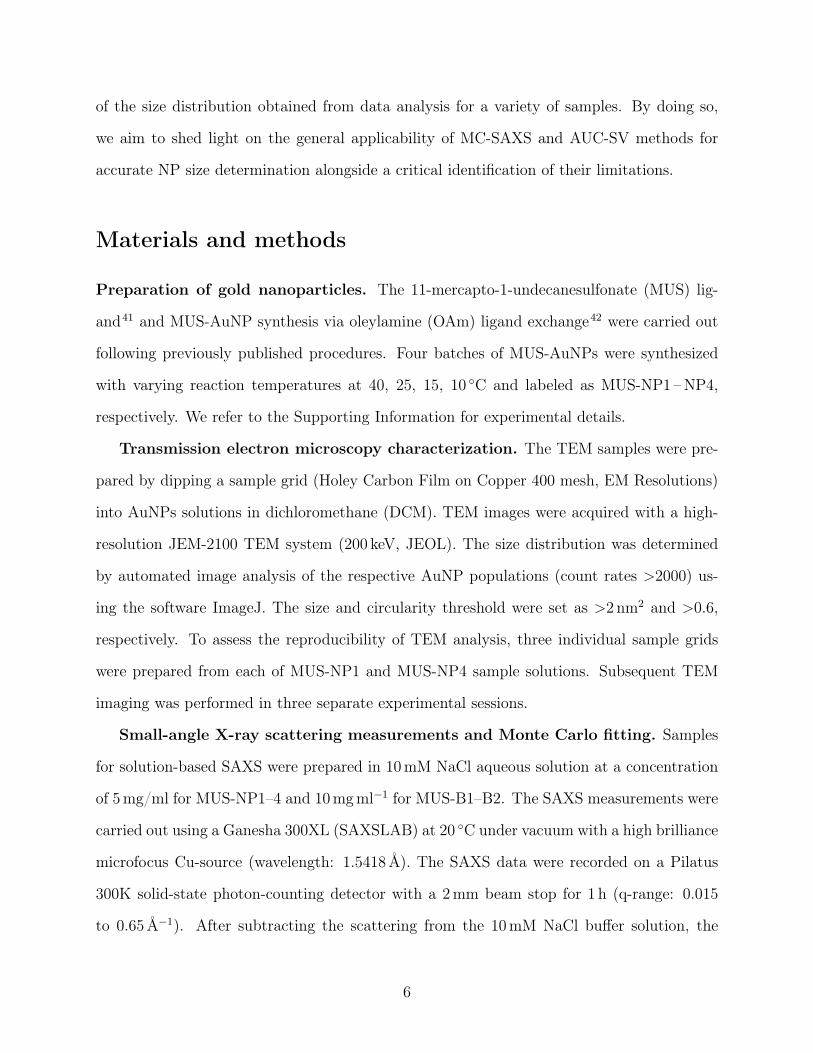
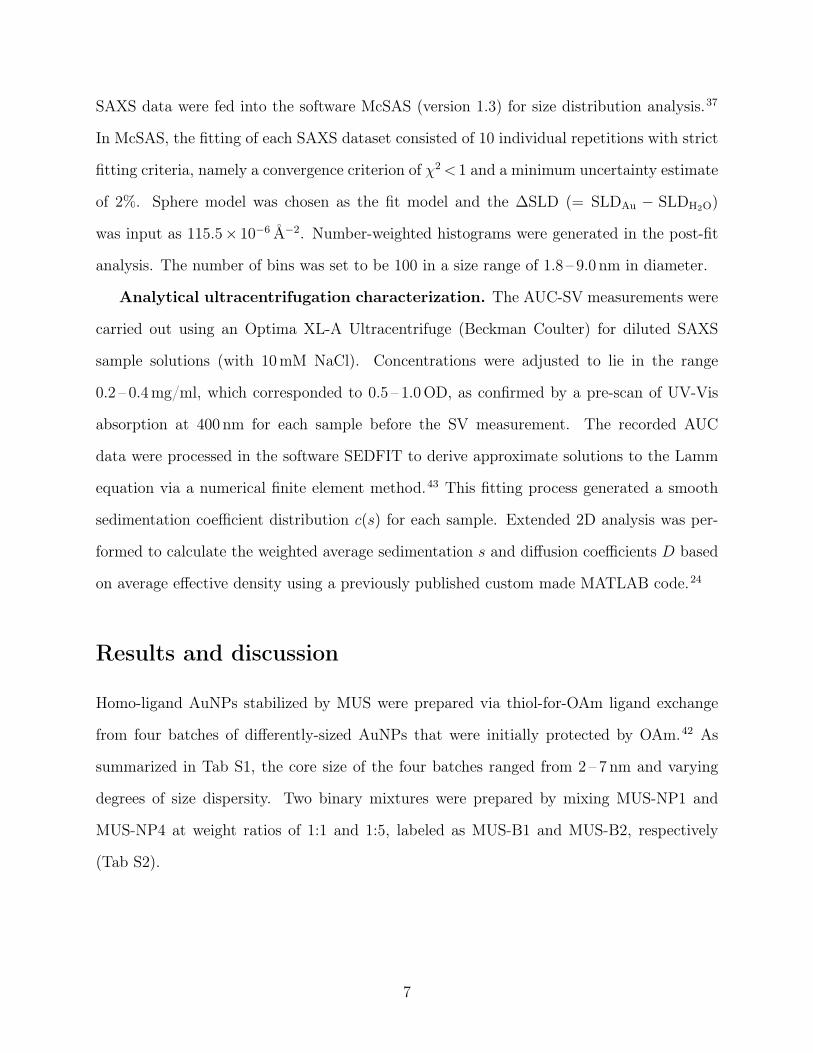
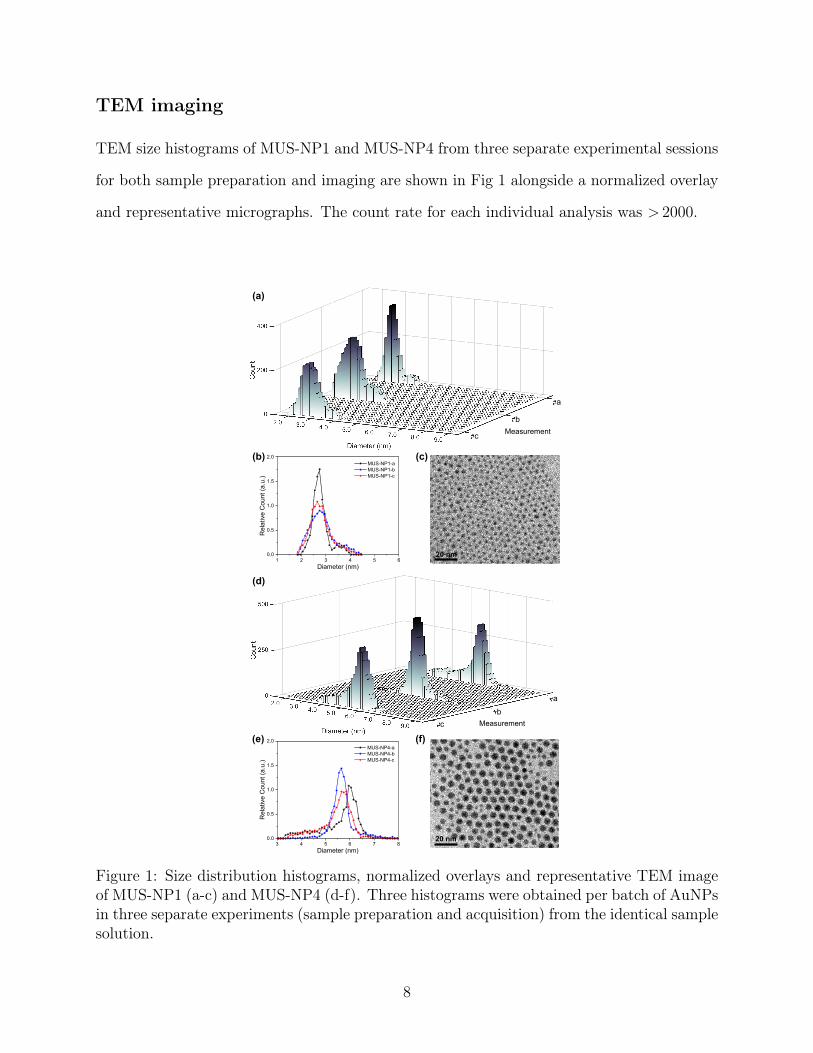
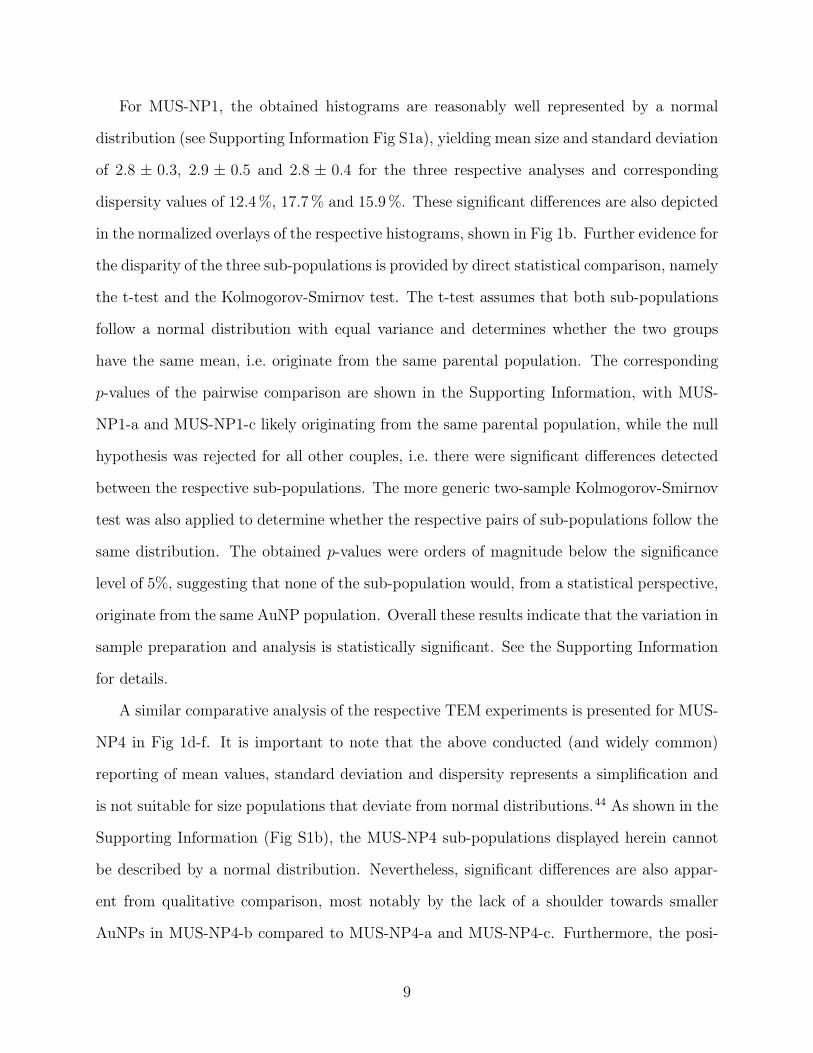
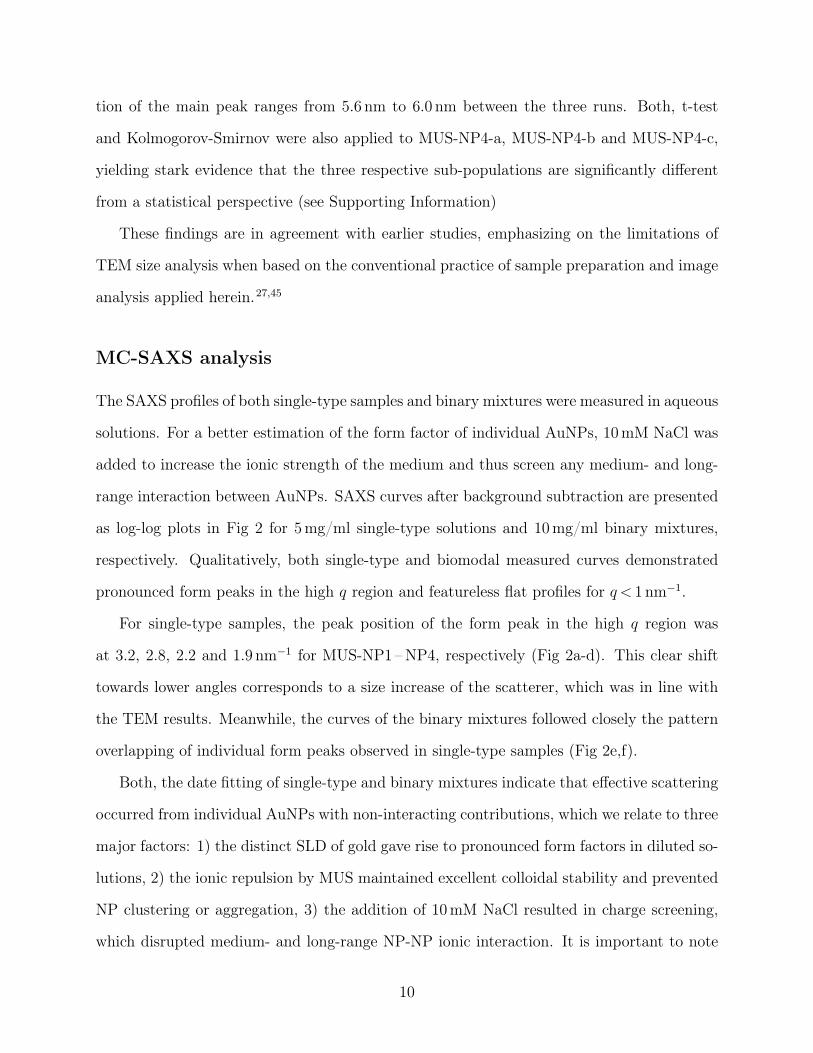
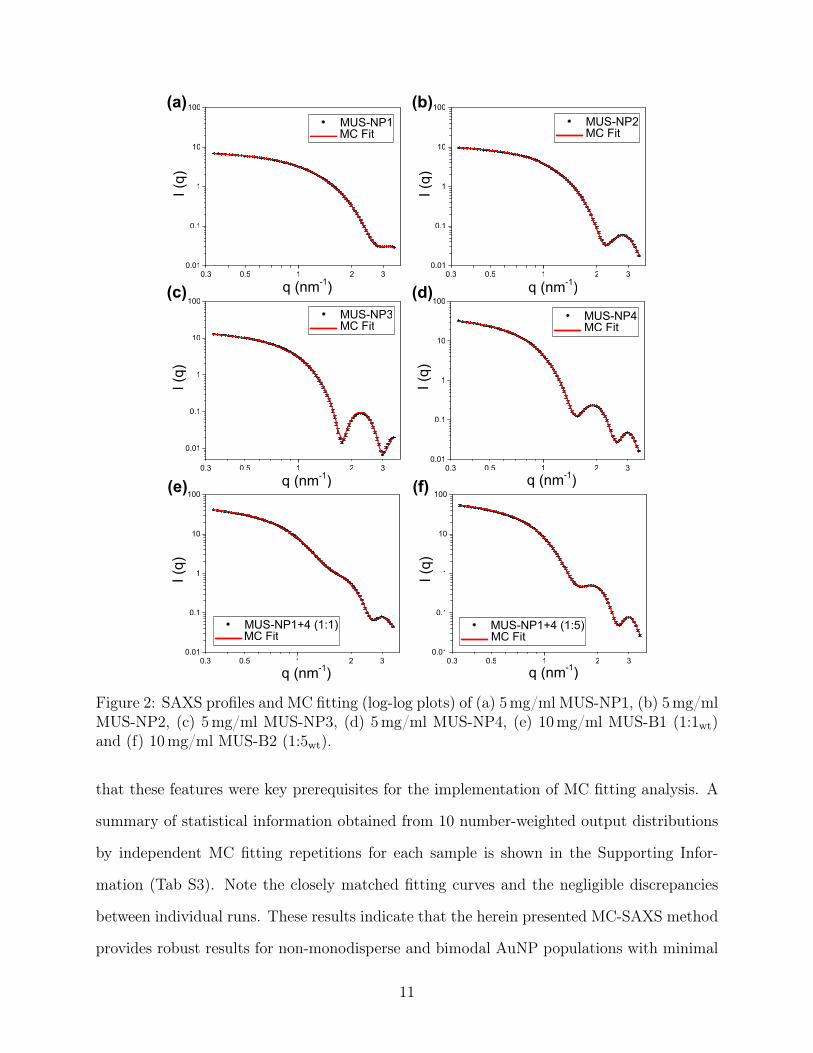
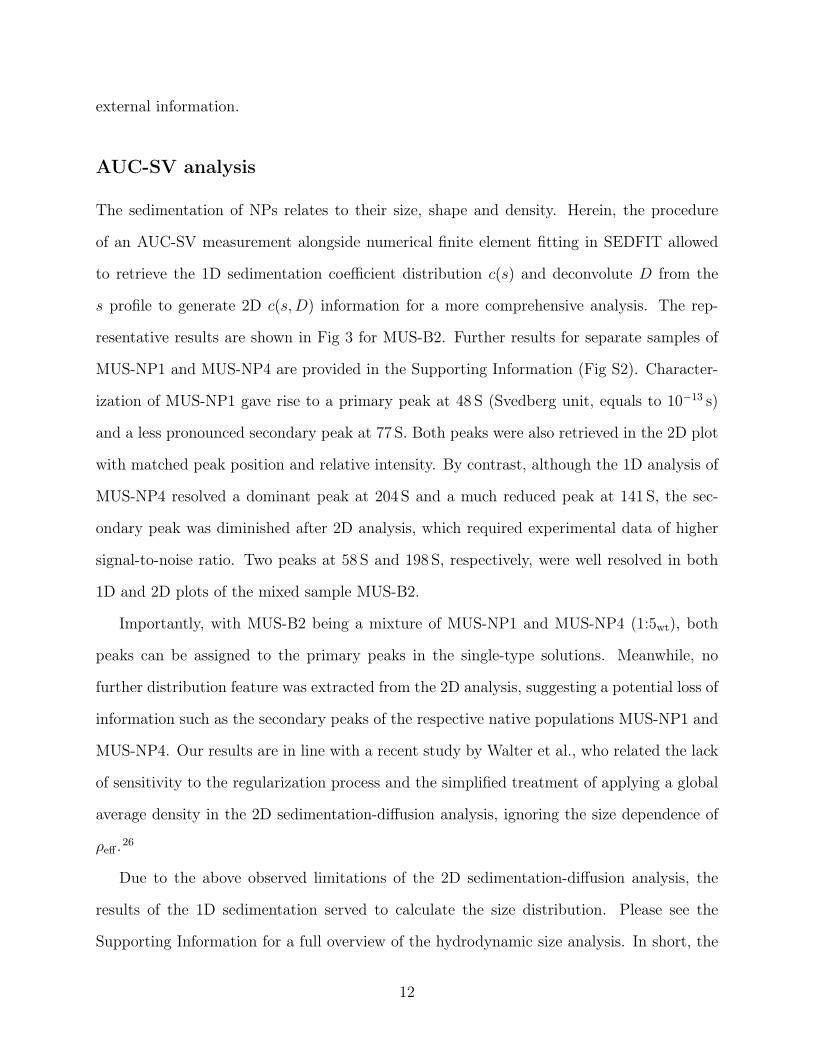
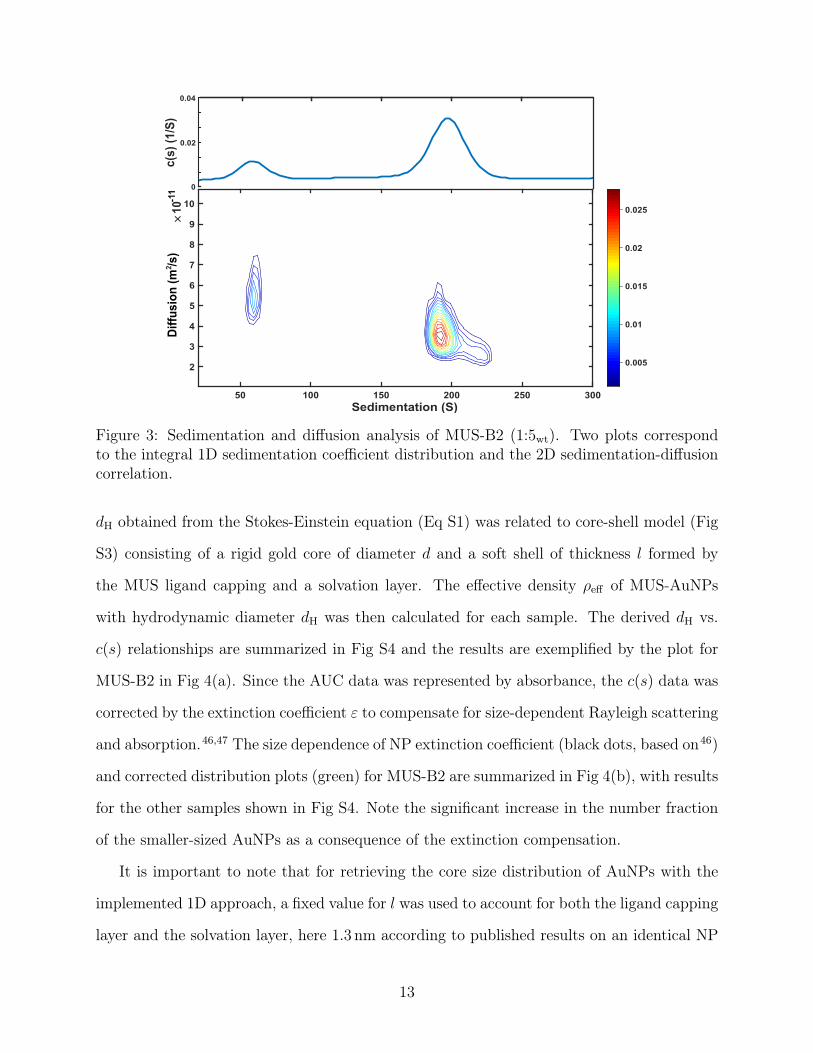
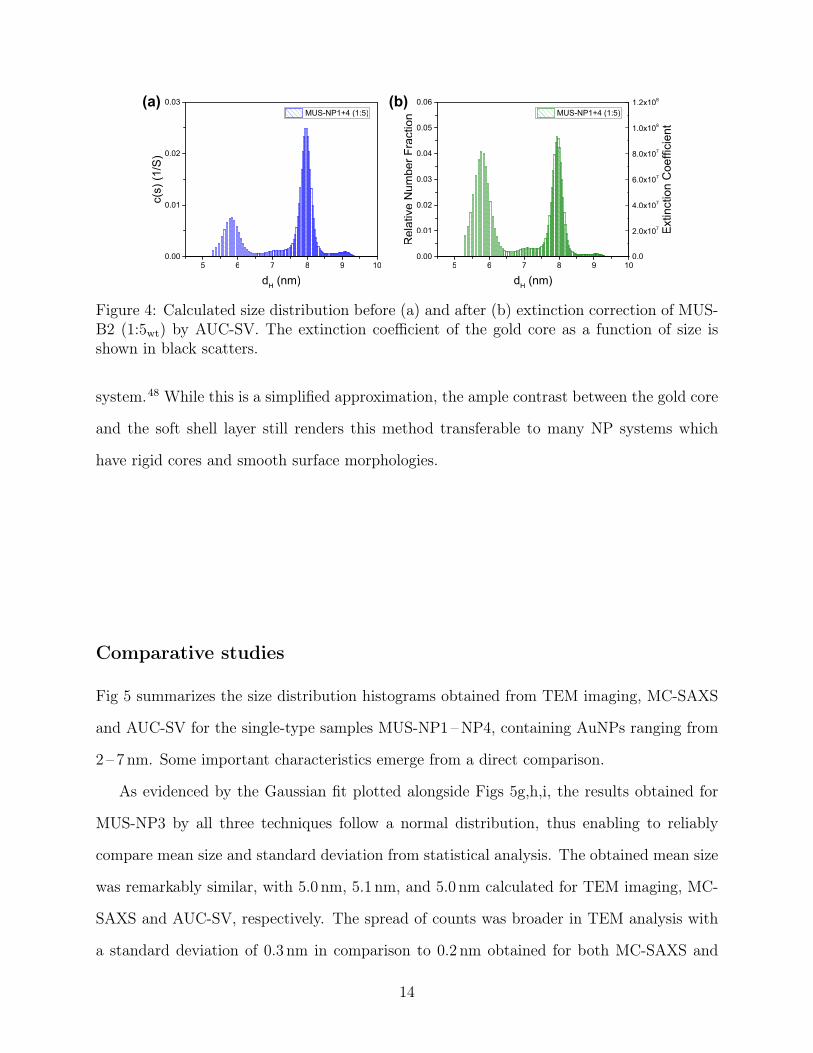
(b)(a)
5 6 7 8 9 10000
001
002
003
004
005
006
Rel
ativ
e N
umbe
r Fra
ctio
n
dH (nm)
MUS-NP1+4 (15)
00
20x107
40x107
60x107
80x107
10x108
12x108
5 6 7 8 9 10000
001
002
003
c(s)
(1S
)
dH (nm)
MUS-NP1+4 (15)
Extin
ctio
n C
oeffi
cien
t
Figure 4 Calculated size distribution before (a) and after (b) extinction correction of MUS-B2 (15wt) by AUC-SV The extinction coefficient of the gold core as a function of size isshown in black scatters
system48 While this is a simplified approximation the ample contrast between the gold core
and the soft shell layer still renders this method transferable to many NP systems which
have rigid cores and smooth surface morphologies
Comparative studies
Fig 5 summarizes the size distribution histograms obtained from TEM imaging MC-SAXS
and AUC-SV for the single-type samples MUS-NP1 ndash NP4 containing AuNPs ranging from
2 ndash 7 nm Some important characteristics emerge from a direct comparison
As evidenced by the Gaussian fit plotted alongside Figs 5ghi the results obtained for
MUS-NP3 by all three techniques follow a normal distribution thus enabling to reliably
compare mean size and standard deviation from statistical analysis The obtained mean size
was remarkably similar with 50 nm 51 nm and 50 nm calculated for TEM imaging MC-
SAXS and AUC-SV respectively The spread of counts was broader in TEM analysis with
a standard deviation of 03 nm in comparison to 02 nm obtained for both MC-SAXS and
14
AUC-SV The corresponding dispersity was calculated alongside with 68 39 34
respectively
Apart from MUS-NP1 (Fig 5a-c) where the MC-SAXS result was discrepant to TEM
and AUC-SV the position of the main peak was consistent for all AuNP populations across
the three techniques In general for AuNPs below 3 nm MC-SAXS provided a less defined
spread and higher error values The existence of shoulders or minority populations was
found more pronounced in TEM than in MC-SAXS and AUC-SV but all techniques picked
up some degree of dispersity In particular for MUS-NP1 and MUS-NP4 the main peak
obtained by AUC-SV was significantly narrower than for the other techniques
Cou
nt
Diameter (nm)(b) (e)
(d)(a) (g)
(h)
(f)(c) (i)
2 3 4 5 6 7 8 9000
003
006
009
012
015
Rel
ativ
e N
umbe
r Fra
ctio
n
Diameter (nm)
MUS-NP4
2 3 4 5 6 7 8 9000
002
004
006
008
010
012
Rel
ativ
e N
umbe
r Fra
ctio
n
Diameter (nm)
MUS-NP1
2 3 4 5 6 7 8 9000
002
004
006
008
010MUS-NP1
Rel
ativ
e N
umbe
r Fra
ctio
nC
ount
Diameter (nm)
Diameter (nm)2 3 4 5 6 7 8 9
000
002
004
006
008
010
012MUS-NP2
Rel
ativ
e N
umbe
r Fra
ctio
n
Diameter (nm)2 3 4 5 6 7 8 9
000
002
004
006
008
010MUS-NP4
Rel
ativ
e N
umbe
r Fra
ctio
n
Diameter (nm)
Cou
nt
Diameter (nm)
Cou
nt
Diameter (nm)
(j)
(k)
(l)
2 3 4 5 6 7 8 9000
002
004
006
008
Rel
ativ
e N
umbe
r Fra
ctio
n
Diameter (nm)
MUS-NP2
2 3 4 5 6 7 8 90
20
40
60
80
100MUS-NP3Gaussian fit
2 3 4 5 6 7 8 9000
004
008
012
016
020
024
Rel
ativ
e N
umbe
r Fra
ctio
n
Diameter (nm)
MUS-NP3Gaussian fit
2 3 4 5 6 7 8 9000
003
006
009
012
Rel
ativ
e N
umbe
r Fra
ctio
n
Diameter (nm)
MUS-NP3Gaussian fit
Figure 5 Size distribution analysis of single-type samples by TEM (red) SAXS (blue) andAUC (green) (a)ndash(c) MUS-NP1 (d)ndash(f) MUS-NP2 (g)ndash(i) MUS-NP3 (j)ndash(l) MUS-NP4 Torepresent core size distribution 2timesl were subtracted for the AUC results after normalizationwith corresponding extinction coefficients
15
These trends were also observed in the binary mixtures MUS-B1 and MUS-B2 as shown
in Fig 6 A comparison of the data to expected simulated histograms via superposition of
the single-type results can be found in the Supporting Information (Fig S5) Most notably
the AUC-SV characterization was unable to accurately represent the minority population in
MUS-B1 where a equal weight mixture of MUS-NP1 and MUS-NP4 and thus a dominance
of MUS-NP1 in numbers effectively led to an overshadowing of the larger less numerous
AuNPs
(b)
(a)
(c)
Diameter (nm)
Cou
nt
(f)
(d)
2 3 4 5 6 7 8 9000
003
006
009
012
015
018
021
Rel
ativ
e N
umbe
r Fra
ctio
n
Diameter (nm)
MUS-NP1+4 (11)
2 3 4 5 6 7 8 9000
001
002
003
004
005
006MUS-NP1+4 (11)
Rel
ativ
e N
umbe
r Fra
ctio
n
Diameter (nm)2 3 4 5 6 7 8 9
000
001
002
003
004
005
006
007MUS-NP1+5 (15)
Rel
ativ
e N
umbe
r Fra
ctio
n
Diameter (nm)
(e)
2 3 4 5 6 7 8 9000
002
004
006MUS-NP1+4 (15)
Diameter (nm)
Rel
ativ
e N
umbe
r Fra
ctio
n
Diameter (nm)
Cou
nt
Figure 6 Size distribution analysis of binary mixtures by TEM (red) SAXS (blue) and AUC(green) (a)ndash(c) MUS-B1 (11wt) (d)ndash(f) MUS-B2 (15wt) To represent core size distribution2timesl were subtracted for the AUC results after normalization with corresponding extinctioncoefficients
16
The following discussion aims to systematically examine the advantages and limitations
of each techniques In all samples the variation between individual characterization runs
for the identical sample was observed to be significantly higher for TEM compared to SAXS
and AUC This may be related to the fact that 1) TEM is a local imaging technique which
carries limited statistical representation by examining only a small fraction of the whole sam-
ple population 2) The inspection of single particles and the experimenter-guided workflow
of sample preparation imaging and data analysis can entail errors from operator bias1213
Furthermore it is important to mention that although we have seen a growing utilization
of in situ liquid-phase TEM and cryo-TEM the commonly used standard TEM requires
the removal of the suspending liquid after the drop-cast sample preparation This process
is typically realized by vacuum or ambient drying which often alters the dispersion state
of sample materials and introduces artifacts obscuring accurate measurement15 All these
factors generate discrepancies for representing the size distribution which can impair com-
parable and reproducible data analysis27 On the other hand the size distribution observed
in TEM results suggested a broader size distribution evidenced by a higher polydispersity
most notably in MUS-NP2 ndash NP4 It is important to note that in contrast to SAXS and
AUC TEM measures individual NPs and thus minority size fractions are equally counted
and represented offering an intrinsic advantage for arbitrary populations On the other
hand thresholding for image contrast may lead to an underestimation of the smaller-sized
NPs as the outer part of smaller NPs with poor contrast is typically filtered when applying
an overall threshold in common image analysis routines In spite of these drawbacks TEM
still offers a number of advantages including accessibility and ease of data analysis thus
providing a rapid characterization of AuNP core sizes and shapes with a semi-quantitative
estimation of the degree of homogeneity14
By contrast both SAXS and AUC are ensemble methods which provides collective data
in solution that can be used for detailed statistical analysis of in situ colloidal features Due
to the distinct X-ray SLD of gold core and the similar SLD values between alkanethiols and
17
solvent molecules in a AuNP sample SAXS permits the selective characterization of the gold
core while excluding the influence of the ligand shell and the solvation layer Compared to
the results by TEM and AUC the histograms by MC-SAXS entailed more detailed features
of the distribution patterns in both single-type samples and binary mixtures This can be
related to the adequate resolving power of SAXS and the implementation of the unbiased
MC modeling which extends the use of SAXS for non-monodisperse NP systems It is
important to note that the average size in SAXS histograms was slightly larger than those
of TEM and AUC for populations with NPs below 3 nm notably MUS-NP1 MUS-B1 and
MUS-B1 These findings are in agreement with the published results on PbS nanocrystals
with an unimodal distribution where larger average size of 32 nm for the MC method in
comparison to 28 nm when fitting the identical SAXS profile with a classical log-normal-
based model40 Importantly this discrepancy was markley reduced for samples above 4 nm40
This limitation of the MC method for sub-3 nm NPs may be attributed to a number of factors
1) as described by the Porodrsquos Law the scattering intensity decreases rapidly at the high q
region (corresponding to smaller size) which entails non-negligible systematic data noise 2)
molecules in solution (eg salt and solvent) share similar length scales to ultra-small NPs and
the scattering of these molecules can not be effectively canceled by solvent subtraction12
Once more this is in line with the PbS study in which the scattering of unbound lead
oleate molecules resulted in a secondary population at 23 nm in their MC fitting results40
Consequently the presented MC-SAXS is generally not suitable for characterizing ultra-
small AuNPs below 3 nm Moreover considering the limit of sample-to-detector distance in
SAXS instrumentation as well as the reduced beam flux at the low q region this MC-SAXS
method may not provide accurate estimation of NPs whose diameter above 100 nm without
the use of ultra-small angle X-ray scattering (USAXS)
AUC-SV analysis on the other hand is a strictly in situ process that examines the hy-
drodynamic behavior of the measured material system In our experiments the analysis
of 1D sedimentation by a simplified core-shell model resulted in sharp distribution profiles
18
observed by the pronounced primary peak in both single-type samples and binary mixtures
Consequently the underrepresentation of minority populations led to an overestimation of
the uniformity when compared to SAXS and TEM This can be explained by the constrained
resolution of both AUC measurements and subsequent data fitting It is important to note
that the at times laborious optimization of centrifugation conditions is imperative to achieve
a dynamic range covers all species of interest and avoid discrimination of a certain popu-
lations49 Furthermore although diluted sample solutions with salt stabilization were used
to minimize the charge effects the concentration dependence of dH could not be completely
excluded without the extrapolation to infinite dilutions17 The process of extrapolating core
sizes from hydrodynamic sizing of 1D sedimentation analysis may also incur systematic er-
rors especially for non-spherical samples or materials with extended soft shell structures
For such complex systems more advanced instrumentation such as multi-wavelength detec-
tor and fitting schemes eg the Custom Grid spectrum analysis are required to facilitate
the implementation of AUC252650
Conclusions
In summary a comparative study of sub-10 nm AuNP size distribution characterized by
TEM SAXS and AUC is presented All three methods provided consistent assessment
of quasi-monodisperse AuNPs with an average core diameter of 5 nm but distinct differ-
ences were observed for non-monodisperse and bimodal populations The conventional TEM
imaging method permitted facile characterization of AuNPs with various size distributions
but it suffered from poor reproducibility and a lack of statistical significance SAXS mea-
surement combined with subsequent model-free MC fitting enabled reliable estimation of
non-monodisperse size distributions with comprehensive statistical analysis However this
method is not suitable for ultra-small NPs below 3 nm due to the reduced scattering intensity
and the interference of small molecules The sedimentation-based AUC-SV method allowed
19
comparable estimation of both single-type samples and binary mixtures Par contra its
relatively low resolution resulted in the underrepresentation of the minor populations This
study offers valuable insights in state-of-art AuNP characterization methods and may be
transferred to guide the size distribution analysis on other material systems
Acknowledgement
This project received funding from the European Unionrsquos Horizon 2020 research and inno-
vation program under grant agreement No 633635 (DIACHEMO) YY acknowledges the
support by the UCL Overseas Research Scholarship and the Graduate Research Scholar-
ship as well as Dr Han Wu and the EPSRC CNIE research facility service (EPSRC Award
EPK0386561) at UCL for the SAXS instrument access NMF expresses gratitude for fund-
ing by the EPSRC under a Doctoral Training Partnership (EPM5079701) The authors
are grateful to Dr Paulo Jacob Silva (EPFL) for providing MUS ligand
Supporting Information Available
The Supporting Information is available free of charge on the ACS Publications website at
DOI
The following files are available free of charge
bull Filename brief description
bull Filename brief description
References
(1) C Dreaden E M Alkilany A Huang X J Murphy C A El-Sayed M The Golden
Age Gold Nanoparticles for Biomedicine Chem Soc Rev 2012 41 2740ndash2779
20
(2) Saha K Agasti S S Kim C Li X Rotello V M Gold Nanoparticles in Chemical
and Biological Sensing Chem Rev 2012 112 2739ndash2779
(3) Bodeloacuten G Costas C Peacuterez-Juste J Pastoriza-Santos I Liz-Marzaacuten L M Gold
Nanoparticles for Regulation of Cell Function and Behavior Nano Today 2017 13
40ndash60
(4) Burns A A Vider J Ow H Herz E Penate-Medina O Baumgart M Lar-
son S M Wiesner U Bradbury M Fluorescent Silica Nanoparticles with Efficient
Urinary Excretion for Nanomedicine Nano Lett 2009 9 442ndash448
(5) A Sousa A A Hassan S L Knittel L Balbo A A Aronova M H Brown P
Schuck P D Leapman R Biointeractions of Ultrasmall Glutathione-Coated Gold
Nanoparticles Effect of Small Size Variations Nanoscale 2016 8 6577ndash6588
(6) Pan Y Neuss S Leifert A Fischler M Wen F Simon U Schmid G Bran-
dau W Jahnen-Dechent W Size-Dependent Cytotoxicity of Gold Nanoparticles
Small 2007 3 1941ndash1949
(7) Jiang Y Huo S Mizuhara T Das R Lee Y-W Hou S Moyano D F Dun-
can B Liang X-J Rotello V M The Interplay of Size and Surface Functionality on
the Cellular Uptake of Sub-10 nm Gold Nanoparticles ACS Nano 2015 9 9986ndash9993
(8) Macdonald T J Wu K Sehmi S K Noimark S Peveler W J du Toit H
Voelcker N H Allan E MacRobert A J Gavriilidis A Parkin I P Thiol-Capped
Gold Nanoparticles Swell-Encapsulated into Polyurethane as Powerful Antibacterial
Surfaces Under Dark and Light Conditions Sci Rep 2016 6 39272
(9) Schneider C A Rasband W S Eliceiri K W NIH Image to ImageJ 25 years of
image analysis Nat Methods 2012 9 671ndash675
21
(10) Mondini S Ferretti A M Puglisi A Ponti A Pebbles and PebbleJuggler software
for accurate unbiased and fast measurement and analysis of nanoparticle morphology
from transmission electron microscopy (TEM) micrographs Nanoscale 2012 4 5356ndash
5372
(11) Cho E J Holback H Liu K C Abouelmagd S A Park J Yeo Y Nanoparti-
cle Characterization State of the Art Challenges and Emerging Technologies Mol
Pharm 2013 10 2093ndash2110
(12) Li T Senesi A J Lee B Small Angle X-Ray Scattering for Nanoparticle Research
Chem Rev 2016 116 11128ndash11180
(13) Modena M M Ruumlhle B Burg T P Wuttke S Nanoparticle Characterization
What to Measure Adv Mater 2019 0 1901556
(14) Borchert H Shevchenko E V Robert A Mekis I Kornowski A Gruumlbel G
Weller H Determination of Nanocrystal Sizes A Comparison of TEM SAXS and
XRD Studies of Highly Monodisperse CoPt3 Particles Langmuir 2005 21 1931ndash1936
(15) Michen B Geers C Vanhecke D Endes C Rothen-Rutishauser B Balog S
Petri-Fink A Avoiding Drying-Artifacts in Transmission Electron Microscopy Char-
acterizing the Size and Colloidal State of Nanoparticles Sci Rep 2015 5
(16) Evans J E Jungjohann K L Browning N D Arslan I Controlled Growth of
Nanoparticles from Solution with In Situ Liquid Transmission Electron Microscopy
Nano Lett 2011 11 2809ndash2813
(17) Dieckmann Y Coumllfen H Hofmann H Petri-Fink A Particle Size Distribution
Measurements of Manganese-Doped ZnS Nanoparticles Anal Chem 2009 81 3889ndash
3895
22
(18) Mahl D Diendorf J Meyer-Zaika W Epple M Possibilities and Limitations of
Different Analytical Methods for the Size Determination of a Bimodal Dispersion of
Metallic Nanoparticles Colloids Surf A 2011 377 386ndash392
(19) Zanchet D Hall B D Ugarte D Structure Population in Thiol-Passivated Gold
Nanoparticles J Phys Chem B 2000 104 11013ndash11018
(20) Hall B D Zanchet D Ugarte D Estimating Nanoparticle Size from Diffraction
Measurements J Appl Crystallogr 2000 33 1335ndash1341
(21) Calvin S Luo S X Caragianis-Broadbridge C McGuinness J K Anderson E
Lehman A Wee K H Morrison S A Kurihara L K Comparison of Extended X-
Ray Absorption Fine Structure and Scherrer Analysis of x-Ray Diffraction as Methods
for Determining Mean Sizes of Polydisperse Nanoparticles Appl Phys Lett 2005 87
233102
(22) Montes-Burgos I Walczyk D Hole P Smith J Lynch I Dawson K Characterisa-
tion of Nanoparticle Size and State Prior to Nanotoxicological Studies J Nanoparticle
Res 2010 12 47ndash53
(23) L Planken K Coumllfen H Analytical Ultracentrifugation of Colloids Nanoscale 2010
2 1849ndash1869
(24) Carney R P Kim J Y Qian H Jin R Mehenni H Stellacci F Bakr O M
Determination of Nanoparticle Size Distribution Together with Density or Molecular
Weight by 2D Analytical Ultracentrifugation Nat Commun 2011 2 335
(25) Demeler B Nguyen T-L Gorbet G E Schirf V Brookes E H Mulvaney P
El-Ballouli A O Pan J Bakr O M Demeler A K Hernandez Uribe B I Bhat-
tarai N Whetten R L Characterization of Size Anisotropy and Density Hetero-
geneity of Nanoparticles by Sedimentation Velocity Anal Chem 2014 86 7688ndash7695
23
(26) Walter J Gorbet G Akdas T Segets D Demeler B Peukert W 2D Analysis
of Polydisperse CorendashShell Nanoparticles Using Analytical Ultracentrifugation Analyst
2016 142 206ndash217
(27) Chen Z H Kim C Zeng X-b Hwang S H Jang J Ungar G Characterizing
Size and Porosity of Hollow Nanoparticles SAXS SANS TEM DLS and Adsorption
Isotherms Compared Langmuir 2012 28 15350ndash15361
(28) Glatter O A New Method for the Evaluation of Small-Angle Scattering Data J Appl
Cryst 1977 10 415ndash421
(29) Svergun D I Mathematical Methods in Small-Angle Scattering Data Analysis J Appl
Cryst 1991 24 485ndash492
(30) Pedersen J S Determination of Size Distribution from Small-Angle Scattering Data
for Systems with Effective Hard-Sphere Interactions J Appl Cryst 1994 27 595ndash608
(31) Barteau K P Ma K Kohle F F E Gardinier T C Beaucage P A
Gillilan R E Wiesner U Quantitative Measure of the Size Dispersity in Ultrasmall
Fluorescent OrganicndashInorganic Hybrid CorendashShell Silica Nanoparticles by Small-Angle
X-Ray Scattering Chem Mater 2019 31 643ndash657
(32) Hansen S Pedersen J S A Comparison of Three Different Methods for Analysing
Small-Angle Scattering Data J Appl Cryst 1991 24 541ndash548
(33) Martelli S Di Nunzio P E Particle Size Distribution of Nanospheres by Monte Carlo
Fitting of Small Angle X-Ray Scattering Curves Part Part Syst Charact 2002 19
247ndash255
(34) Pauw B R Pedersen J S Tardif S Takata M Iversen B B Improvements and
Considerations for Size Distribution Retrieval from Small-Angle Scattering Data by
Monte Carlo Methods J Appl Cryst 2013 46 365ndash371
24
(35) Nunzio P E D Martelli S Bitti R R Use of Monte Carlo Methods in Characterizing
Nanostructured Materials by Wide- and Small-Angle X-Ray Scattering J Dispers Sci
Technol 2005 25 491ndash501
(36) Rosalie J M Pauw B R Form-Free Size Distributions from Complementary Stereo-
logical TEMSAXS on Precipitates in a MgndashZn Alloy Acta Mater 2014 66 150ndash162
(37) Bressler I Pauw B R Thuumlnemann A F McSAS Software for the Retrieval of
Model Parameter Distributions from Scattering Patterns J Appl Cryst 2015 48
962ndash969
(38) Geertsen V Barruet E Gobeaux F Lacour J-L Tacheacute O Contribution to Ac-
curate Spherical Gold Nanoparticle Size Determination by Single-Particle Inductively
Coupled Mass Spectrometry A Comparison with Small-Angle X-Ray Scattering Anal
Chem 2018 90 9742ndash9750
(39) Pauw B R Kaumlstner C Thuumlnemann A F Nanoparticle Size Distribution Quantifi-
cation Results of a Small-Angle X-Ray Scattering Inter-Laboratory Comparison J
Appl Cryst 2017 50 1280ndash1288
(40) Maes J Castro N De Nolf K Walravens W Abeacutecassis B Hens Z Size and Con-
centration Determination of Colloidal Nanocrystals by Small-Angle X-Ray Scattering
Chem Mater 2018 30 3952ndash3962
(41) Carney R P Astier Y Carney T M Voiumltchovsky K Jacob Silva P H Stel-
lacci F Electrical Method to Quantify Nanoparticle Interaction with Lipid Bilayers
ACS Nano 2013 7 932ndash942
(42) Yang Y Serrano L A Guldin S A Versatile AuNP Synthetic Platform for Decoupled
Control of Size and Surface Composition Langmuir 2018 34 6820ndash6826
25
(43) Schuck P Size-Distribution Analysis of Macromolecules by Sedimentation Velocity
Ultracentrifugation and Lamm Equation Modeling Biophys J 2000 78 1606ndash1619
(44) Murphy C J Buriak J M Best Practices for the Reporting of Colloidal Inorganic
Nanomaterials Chem Mater 2015 27 4911ndash4913
(45) Domingos R F Baalousha M A Ju-Nam Y Reid M M Tufenkji N Lead J R
Leppard G G Wilkinson K J Characterizing Manufactured Nanoparticles in the
Environment Multimethod Determination of Particle Sizes Environ Sci Technol
2009 43 7277ndash7284
(46) Liu X Atwater M Wang J Huo Q Extinction Coefficient of Gold Nanoparticles
with Different Sizes and Different Capping Ligands Colloids Surf B 2007 58 3ndash7
(47) Lechner M D Coumllfen H Mittal V Voumllkel A Wohlleben W Sedimentation Mea-
surements with the Analytical Ultracentrifuge with Absorption Optics Influence of Mie
Scattering and Absorption of the Particles Colloid Polym Sci 2011 289 1145ndash1155
(48) Bekdemir A Stellacci F A Centrifugation-Based Physicochemical Characterization
Method for the Interaction between Proteins and Nanoparticles Nat Commun 2016
7 13121
(49) Walter J Peukert W Dynamic Range Multiwavelength Particle Characterization
Using Analytical Ultracentrifugation Nanoscale 2016 8 7484ndash7495
(50) Walter J Loumlhr K Karabudak E Reis W Mikhael J Peukert W Wohlleben W
Coumllfen H Multidimensional Analysis of Nanoparticles with Highly Disperse Properties
Using Multiwavelength Analytical Ultracentrifugation ACS Nano 2014 8 8871ndash8886
26
Graphical TOC Entry
Some journals require a graphical entry for the Table of Contents Thisshould be laid out ldquoprint readyrdquo so that the sizing of the text is correctInside the tocentry environment the font used is Helvetica 8 pt asrequired by Journal of the American Chemical SocietyThe surrounding frame is 9 cm by 35 cm which is the maximum per-mitted for Journal of the American Chemical Society graphical table ofcontent entries The box will not resize if the content is too big insteadit will overflow the edge of the boxThis box and the associated title will always be printed on a separatepage at the end of the document
27
download fileview on ChemRxivCross-method_size_determination_final(v7)pdf (512 MiB)
Supporting information for
A cross-method comparison of sub-10 nm
nanoparticle size distribution
Ye Yangdagger Suiyang LiaoDagger Zhi LuoDagger Runzhang Qidagger Niamh Mac Fhionnlaoichdagger
Francesco StellacciDaggerpara and Stefan Guldinlowastdagger
daggerDepartment of Chemical Engineering University College London Torrington Place
London WC1E 7JE UK
DaggerInstitute of Materials Eacutecole Polytechnique Feacutedeacuterale de Lausanne 1015 Lausanne
Switzerland
paraInterfaculty Bioengineering Institute Eacutecole Polytechnique Feacutedeacuterale de Lausanne 1015
Lausanne Switzerland
E-mail sguldinuclacuk
S1
AuNP synthesis
In a two-step procedures AuNPs intermittently stabilized by oleylamine (OAm) were firstly
prepared before subsequent thiol ligand exchange The reaction started with preparing the
precursor at room temperature (sim22 C) by dissolving 05 mmol hydrogen tetrachloroaurate
(III) hydrate (HAuCl4middot3H2O Reagent ACS Acros Organics) in a 40 ml solvent mixture
of OAm (C18 content 80 ndash 90 Acros Organics) and n-octane (99 Acros Organics)
(11vv) The solution was mixed and sonicated under Ar flow for 10 min before stirring at
the reaction temperature The temperature was controlled by employing a 100 ml jacketed
flask with a temperature-controlled GR150-R2 circulating bath (Grant Instruments) The
reducing solution was prepared by dissolving 05 mmol tert-butylamine borane (tBAB 97
Sigma-Aldrich) in 1 ml OAm and 1 ml octane Intensive mixing was required before the
injection into the precursor solution under vigorous stirring The mixture was left reacting
in Ar atmosphere at the designated reaction temperature for 2 h before 30 ml of ethanol
(EtOH) was added to quench the reaction The AuNPs were collected by centrifugation at
5000 g for 10 min and then re-dispersed in dichloromethane (DCM) The obtained samples
were dried in a vacuum desiccator after repeated centrifugal washing in EtOH and methanol
(MeOH) The reaction temperatures of 40 25 15 10 C were used in four syntheses and
the obtained MUS-AuNP samples were labeled as MUS-NP1 ndash NP4 respectively A biphasic
solution of DCM-H2O (11vv) was used for the MUS-for-OAm ligand-exchange reaction
01 mmol MUS was dissolved in 12 ml of the biphasic solution mixture by vigorous stirring
for 10 min Subsequently 30 mg of the OAm-capped AuNPs in 6 ml DCM solution were
injected and the reaction solution was allowed to react at room temperature for 20 h To
quench the ligand-exchange reaction acetone was added and the AuNPs were collected
by centrifugation at 5000 g for 10 min To remove unbound water-soluble MUS ligands
repetitive washing in H2O were implemented with Amicon Ultra centrifugal filters (15 ml
10000 NMWL Merck Millipore) at 5000 g for 10 min before final washing in acetone and
subsequent vacuum drying
S2
TEM characterization
Table S1 Sample information of employed single-type MUS-AuNPs
Sample OAm-AuNP synthesis temperature Core size by TEMlabel C nm
MUS-NP1 40 26plusmn03MUS-NP2 20 38plusmn06MUS-NP3 10 51plusmn06MUS-NP4 5 56plusmn08
Table S2 Sample information of employed binary mixed MUS-AuNPs
Sample single-type sample Mixing ratio
MUS-B1 MUS-NP1MUS-NP4 11wt
MUS-B2 MUS-NP1MUS-NP4 15wt
(a)
(b)
(a)
(b)
Figure S1 Size distribution histograms of (a) MUS-NP1 and (b) MUS-NP4 The histogramsfor each batch of AuNPs were obtained from three separate experiments of different samplegrids prepared from an identical sample solution (see Figure 1 in main manuscript) Here thecorresponding normal distribution based on the mean size and standard deviation obtainedby statistical analysis of each histogram is plotted alongside
S3
Pairwise statistical comparisons of histograms
t-Test
The t-test assumes that both populations follow a normal distribution with equal variance
and determines if the means of the two populations are the sameS1 The two-sample t-test
was performed for each pair of measurements For almost all cases the null hypothesis was
rejected at a 5 significance level the corresponding p-values are shown in Table S3
Table S3 t-Test with equal variance The p-values for obtained by two-sample t-test aredisplayed below
MUS-NP1 MUS-NP4a-b 178 lowast 10minus9 595 lowast 10minus7
a-c 02265 202 lowast 10minus17
b-c 180 lowast 10minus6 241 lowast 10minus60
Kolmogorov-Smirnov test
The two-sample Kolmogorov-Smirnov test was used to determine if each pair of populations
follow the same distributionS2S3 This is a non-parametric technique which can be applied
to any arbitrary continuous distribution and therefore does not require the populations to
follow a normal distribution By pairwise examination of the three populations obtained
from samples MUS-NP1 and MUS-NP4 it was found that statistically no pair came from
the same parental distribution at the 5 significance level the resulting p-values are reported
in Table S4
Table S4 Kolmogorov-Smirnov test The p-values for the two-sample Kolmogorov-Smirnov test are provided here
MUS-NP1 MUS-NP4a-b 110 lowast 10minus28 573 lowast 10minus111
a-c 327 lowast 10minus9 376 lowast 10minus105
b-c 130 lowast 10minus6 256 lowast 10minus46
S4
In summary the non-parametric two-sample Kolmogorov-Smirnov test rejected the null
hypothesis that each TEM analysis followed the same distribution Furthermore the t-test
largely rejected the null hypothesis that each sample had the same mean with exception
of MUS-NP-a and MUS-NP-c Overall this provides evidence that the variation in TEM
sample preparation and analysis is statistically significant
MC-SAXS characterization
Table S5 Discrepancies among 10 number-weighted output distributions generated fromindependent MC fitting repetitions for each sample
Sample Mean nm Deviation of mean Variance12 nm Deviation of variance
MUS-NP1 31 10 05 56MUS-NP2 40 04 04 93MUS-NP3 52 05 03 37MUS-NP4 56 16 08 97
MUS-B1 35 24 09 53MUS-B2 44 15 11 24
S5
AUC-SV characterization
Sedimentation and diffusion analysis
006
004
002
0
Sedimentation (S)
c(s)
(1S
)D
iffus
ion
(m s
)
Sedimentation (S)50 100 150 200 250 300
002
003
005
006
007
008
009
c(s)
(1S
)
006
003
0
Diff
usio
n (m
s)
-10
(a)
(b)
001
002
003
004
005
006
1
2
3
4
5
004
001
Figure S2 Sedimentation and diffusion analysis of (a) MUS-NP1 and (b) MUS-NP4 Twoplots for each sample correspond to the integral 1D sedimentation coefficient distributionand the 2D sedimentation-diffusion correlation
S6
Hydrodynamic size analysis
The hydrodynamic Stokesrsquo diameter dH was calculated using the Stokes-Einstein equationS4
dH =
98315718ηSs
ρeff minus ρS (1)
where ρeff and ρS are the particle density and the solution density and ηS is the solution
viscosity
dρAu
lρl
dHρeff
Figure S3 Schematic of a spherical core-shell model for hydrodynamic size analysis Thehydrodynamic radius of the employed MUS-AuNPs consists of a rigid gold core and a softshell formed by the ligand capping and a solvation layer
The effective density ρeff of MUS-AuNPs with hydrodynamic diameter dH was calculated
by the following equationsS5
dH = d+ 2l (2)
ρeff =Mcore +Mshell
(43)π(dH2)3=
ρAu(43)π(d2)3 + ρl(43)π[(d2 + l)3 minus (d2)3]
(43)π(d2 + l)3 (3)
Here ρAu and ρl are the densities of the gold core and the soft shell respectively For
the purpose of calculating the size distribution of the herein employed MUS-AuNP popu-
lations bulk values for core and shell of ρAu and ρl at 1932 and 103 g cmminus3 were used
respectivelyS5 Combining Eq 1 and Eq 3 the dH vs c(s) relationship was calculated for
each sample
S7
Extinction coefficient correction
The c(s) data was corrected with an extinction coefficient ε variation using the following
equationS6
lnε = 3321lnd+ 10805 (4)
(b)(a)
65 70 75 80 85 90 95000
003
006
009
012
015
Rel
ativ
e N
umbe
r Fra
ctio
n
dH (nm)
MUS-NP4
00
20x107
40x107
60x107
80x107
65 70 75 80 85 90 95000
002
004
006
008
010
c(s)
(1S
)
dH (nm)
MUS-NP4
50 55 60 65 70 75 80 85 90000
001
002
003
004
005
c(s)
(1S
)
dH (nm)
MUS-NP2
50 55 60 65 70 75 80 85 90000
002
004
006
008
Rel
ativ
e N
umbe
r Fra
ctio
n
dH (nm)
MUS-NP2
00
20x107
40x107
60x107
80x107
45 50 55 60 65 70 75000
001
002
003
004
005
006
c(s)
(1S
)
dH (nm)
MUS-NP1
45 50 55 60 65 70 75000
003
006
009
012
Rel
ativ
e N
umbe
r Fra
ctio
n
dH (nm)
MUS-NP1
0
1x10⁷
2x10⁷
3x10⁷
4x10⁷
5x10⁷
Extin
ctio
n C
oeffi
cien
t
65 70 75 80 85 90 95000
002
004
006
c(s)
(1S
)
dH (nm)
MUS-NP3
65 70 75 80 85 90 95000
003
006
009
012
Rel
ativ
e N
umbe
r Fra
ctio
n
dH (nm)
MUS-NP3
00
20x107
40x107
60x107
80x107
10x108
Extin
ctio
n C
oeffi
cien
tEx
tinct
ion
Coe
ffici
ent
Extin
ctio
n C
oeffi
cien
t
(d)(c)
(f)(e)
(h)(g)
5 6 7 8 9 10000
003
006
009
012
015
018
021
Rel
ativ
e N
umbe
r Fra
ctio
n
dH (nm)
MUS-NP1+4 (11)
00
20x107
40x107
60x107
80x107
10x108
12x108
5 6 7 8 9 10000
002
004
006
c(s)
(1S
)
dH (nm)
MUS-NP1+4 (11)
Extin
ctio
n C
oeffi
cien
t
(j)(i)
Figure S4 Calculated size distribution before (blue) and after (green) extinction correctionby AUC-SV (a)(b) MUS-NP1 (c)(d) MUS-NP2 (e)(f) MUS-NP3 (g)(h) MUS-NP4(i)(j) MUS-B1 (11wt) Black scatter the size dependence of the gold core extinction
S8
(b)
(a)
(c) (f)
(d)
(e)
000
003
006MUS-NP1+4 (11)
2 3 4 5 6 7 8 9000
003
006
Rel
ativ
e N
umbe
r Fra
ctio
n
Diameter (nm)
MUS-B1
000
002
004MUS-NP1+5 (15)
2 3 4 5 6 7 8 9000
003
006
Rel
ativ
e N
umbe
r Fra
ctio
n
Diameter (nm)
MUS-B2
000
005
010MUS-NP1+4 (11)
2 3 4 5 6 7 8 9000
007
014
021
Rel
ativ
e N
umbe
r Fra
ctio
n
MUS-B1
000
004
008MUS-NP1+4 (15)
2 3 4 5 6 7 8 9000
003
006
Rel
ativ
e N
umbe
r Fra
ctio
n
MUS-B2
000
008
016
Rel
ativ
e N
umbe
r Fra
ctio
n
MUS-NP1+4 (11)
2 3 4 5 6 7 8 90
250
500
Cou
nt
Diameter (nm)
MUS-B1
000
006
012
Rel
ativ
e N
umbe
r Fra
ctio
n
MUS-NP1+4 (15)
2 3 4 5 6 7 8 90
100
200
Cou
nt
Diameter (nm)
MUS-B2
Diameter (nm)Diameter (nm)
Figure S5 Size distribution analysis of binary mixtures by TEM (red) SAXS (blue) and AUC(green) (a)ndash(c) MUS-B1 (11wt) (d)ndash(f) MUS-B2 (15wt) with corresponding simulateddistribution histograms (pink) calculated from single-type results shown in Figure 5 of themain manuscript To represent core size distribution 2timesl were subtracted for the AUCresults after normalization with corresponding extinction coefficients
S9
References
(S1) Fisher R Statistical methods for research workers 14th ed Hafner New York 1970
(S2) Massey F J The Kolmogorov-Smirnov Test for Goodness of Fit Journal of the Amer-
ican Statistical Association 1951 46 68ndash78
(S3) Durbin J Distribution Theory for Tests Based on the Sample Distribution Function
1st ed Society for Industrial and Applied Mathematics Philadelphia 1973
(S4) L Planken K Coumllfen H Analytical Ultracentrifugation of Colloids Nanoscale 2010
2 1849ndash1869
(S5) Carney R P Kim J Y Qian H Jin R Mehenni H Stellacci F Bakr O M
Determination of Nanoparticle Size Distribution Together with Density or Molecular
Weight by 2D Analytical Ultracentrifugation Nat Commun 2011 2 335
(S6) Liu X Atwater M Wang J Huo Q Extinction Coefficient of Gold Nanoparticles
with Different Sizes and Different Capping Ligands Colloids Surf B 2007 58 3ndash7
S10
download fileview on ChemRxivSI_Cross-method_size_determination_final(v7)pdf (79971 KiB)
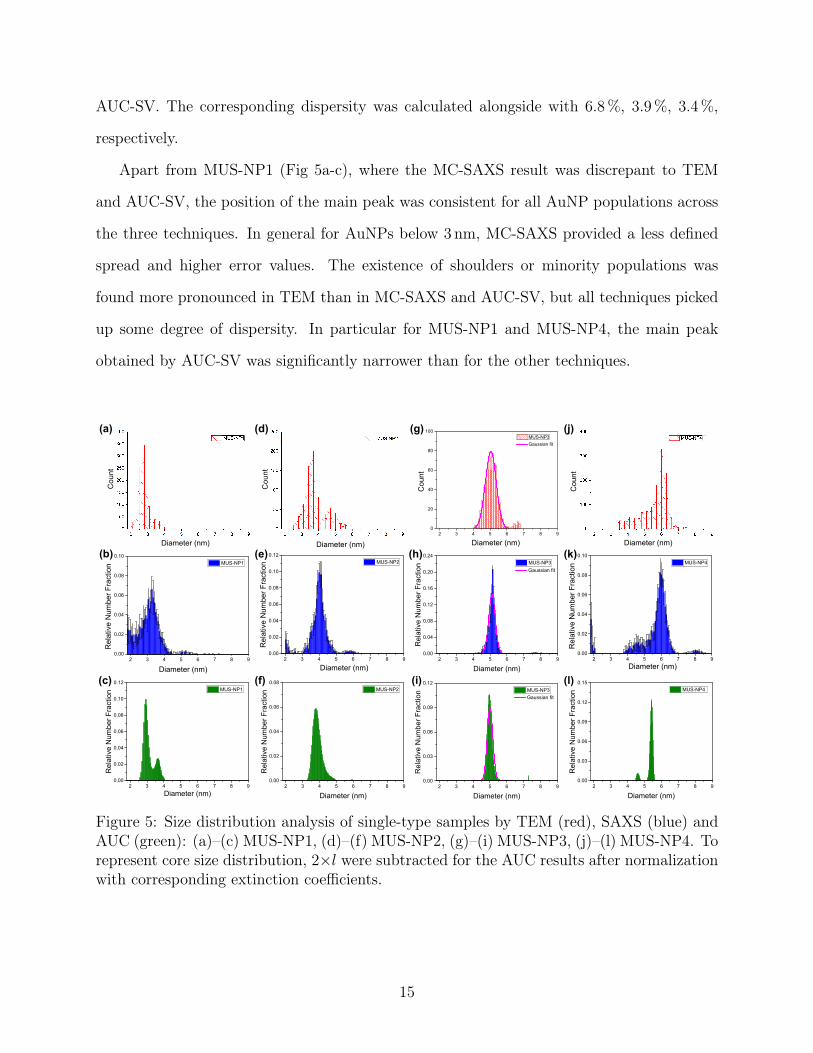
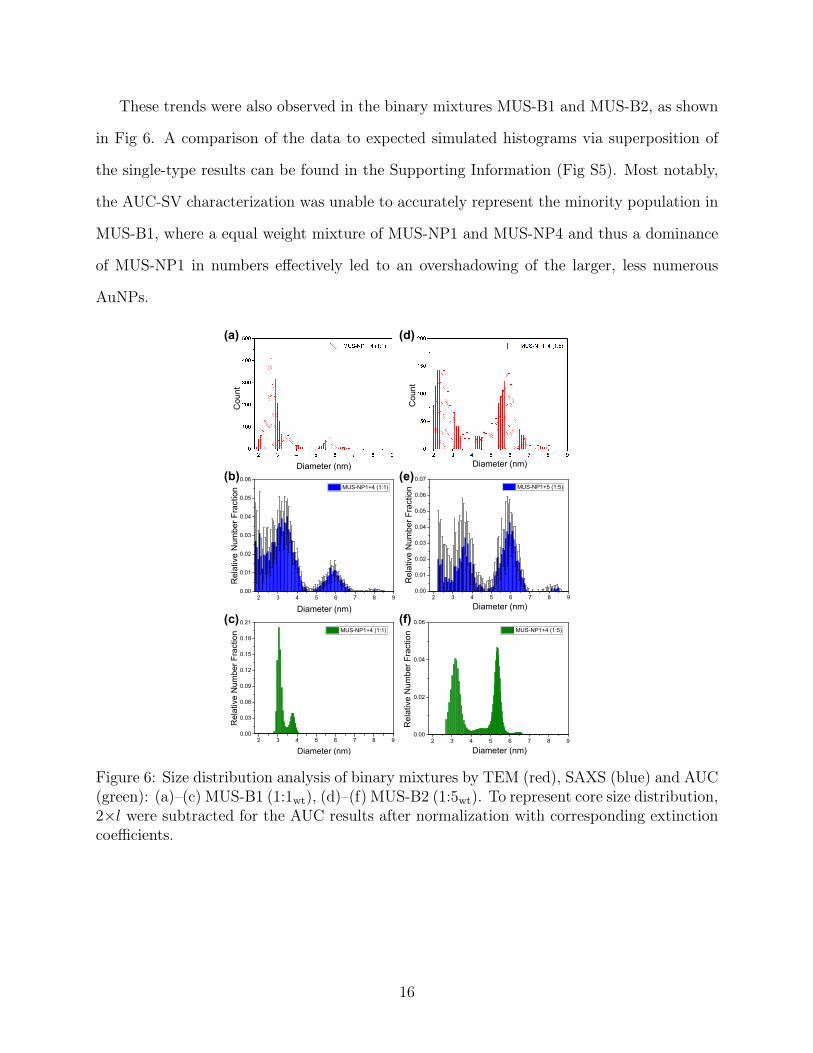
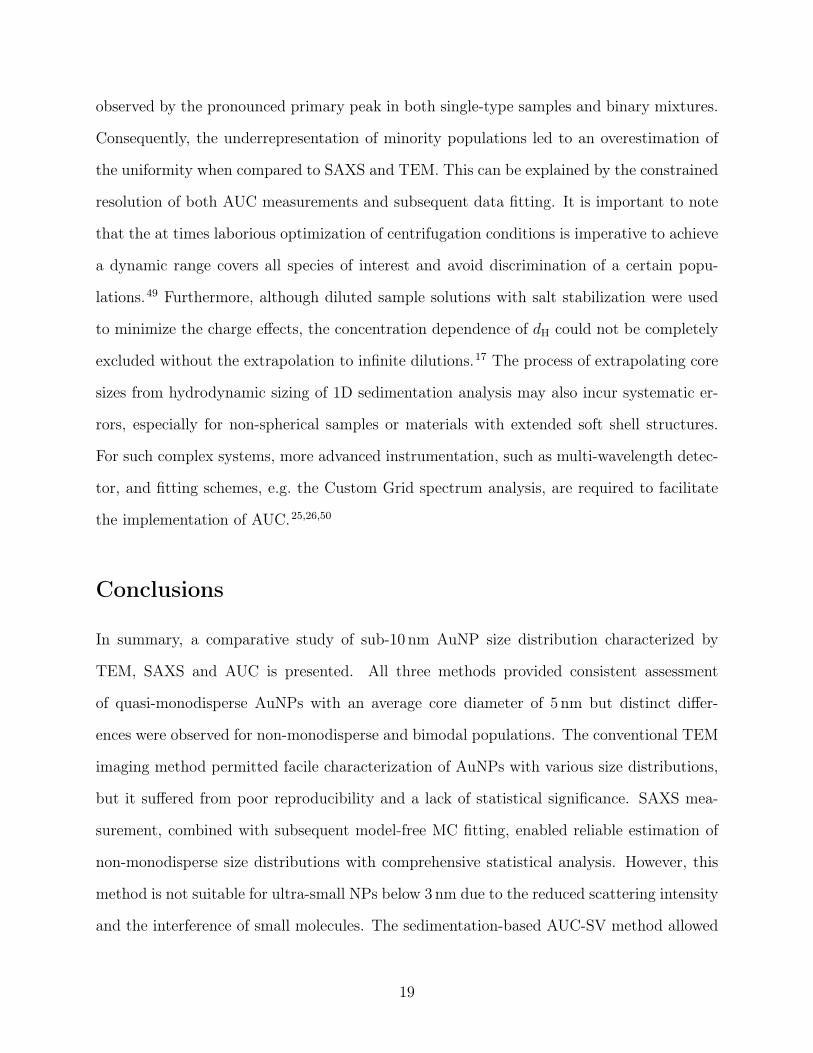
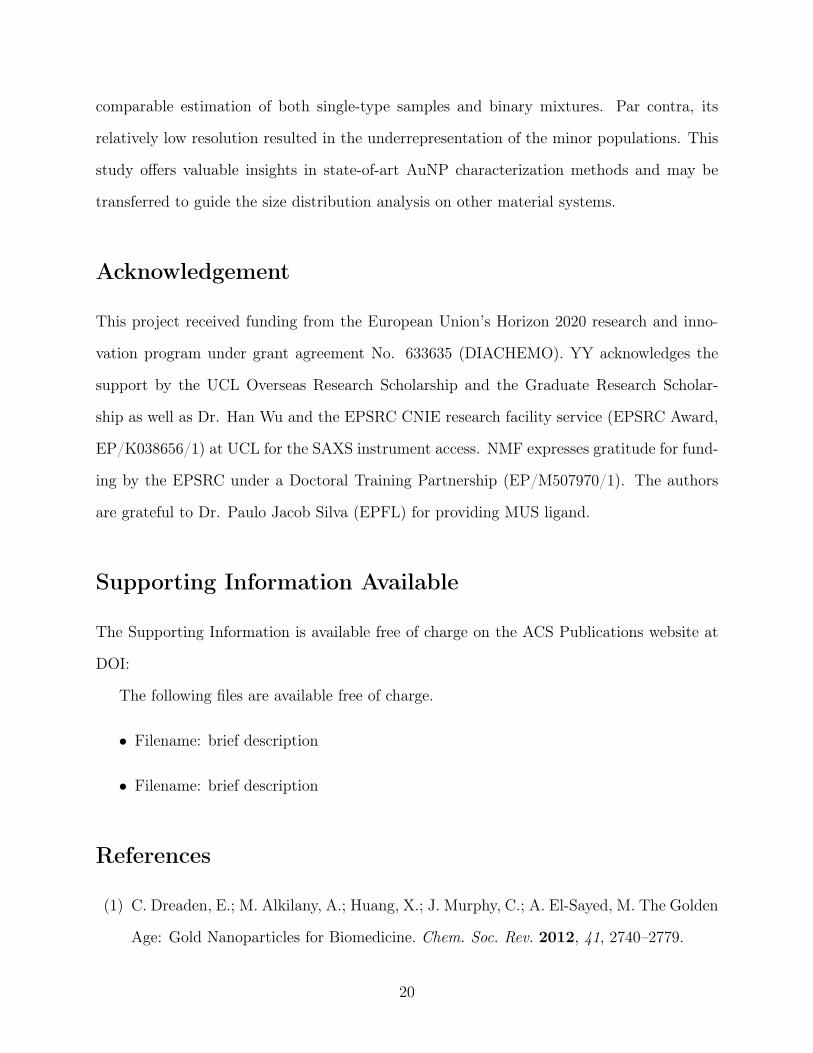
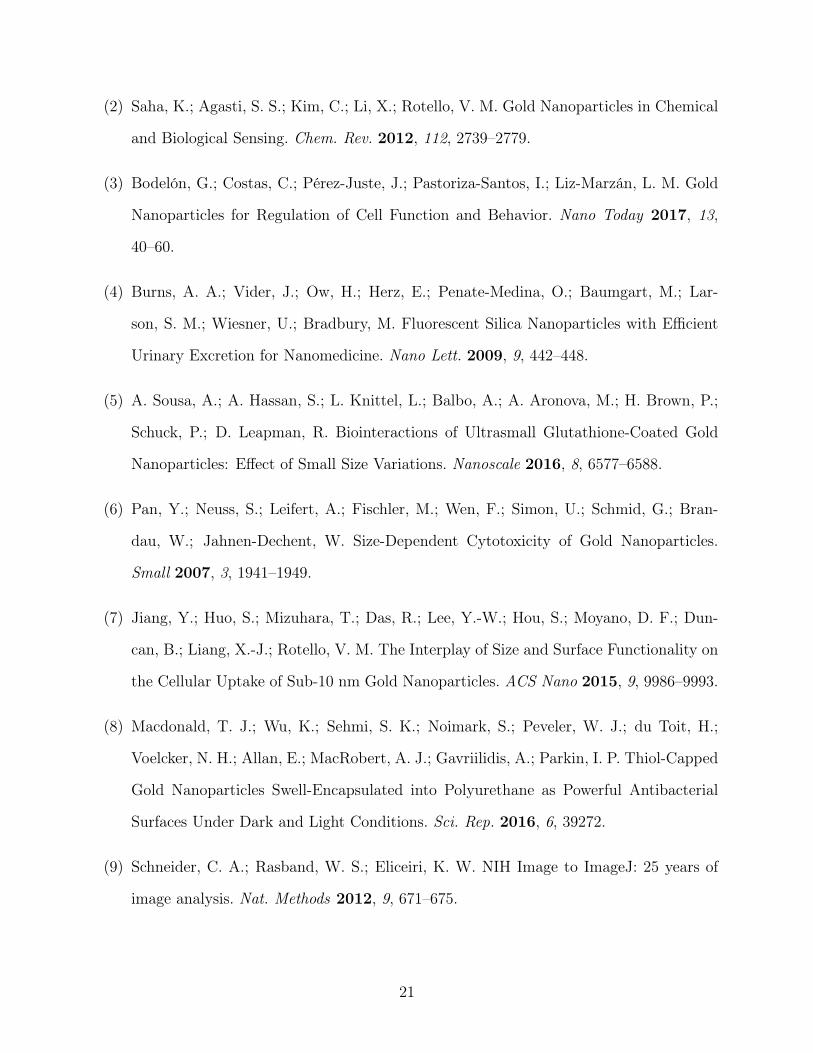
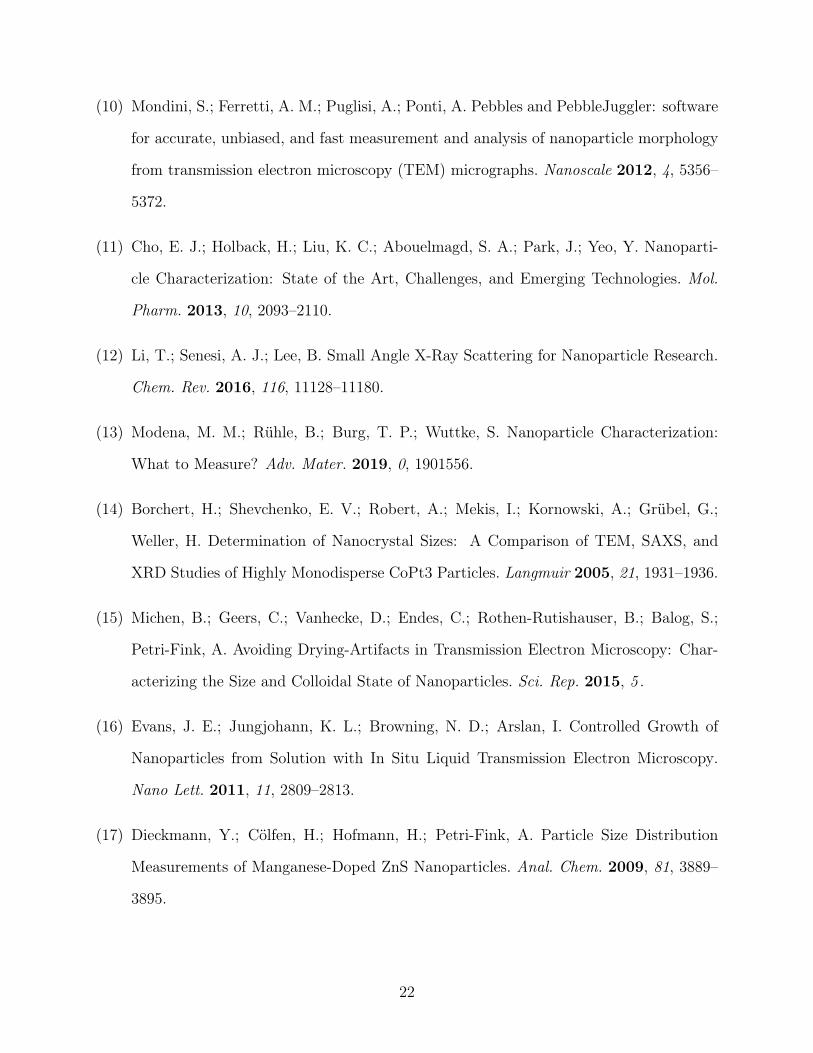
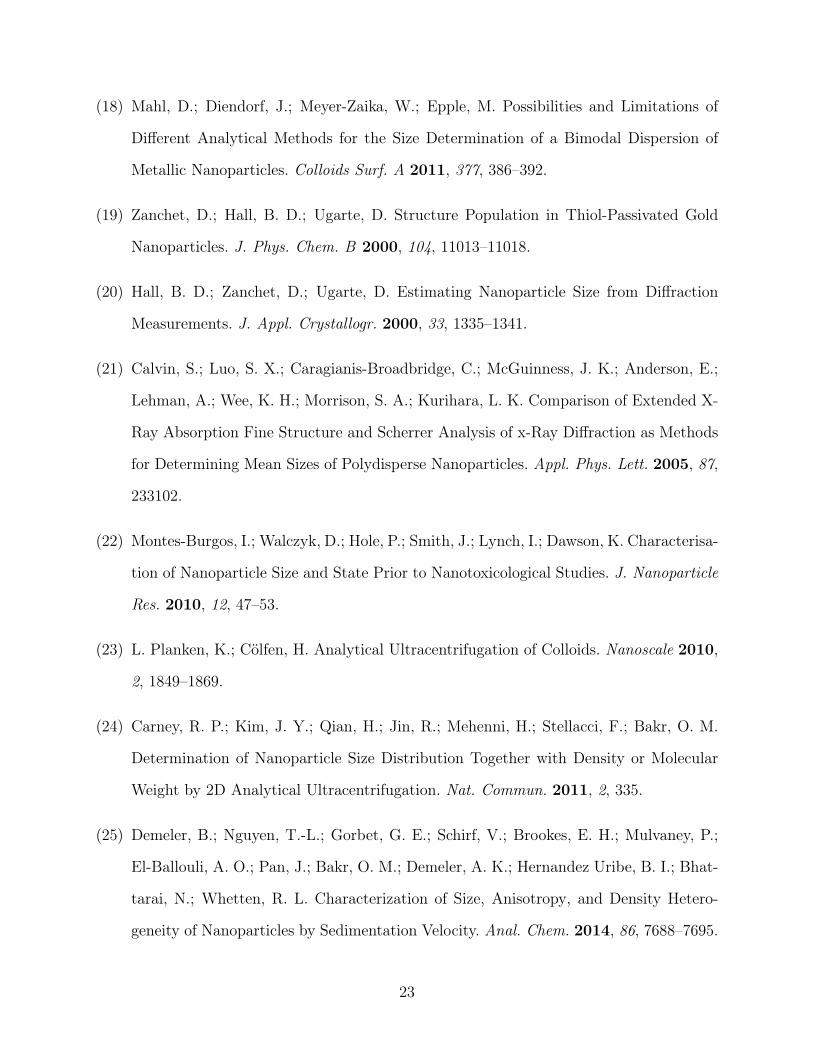
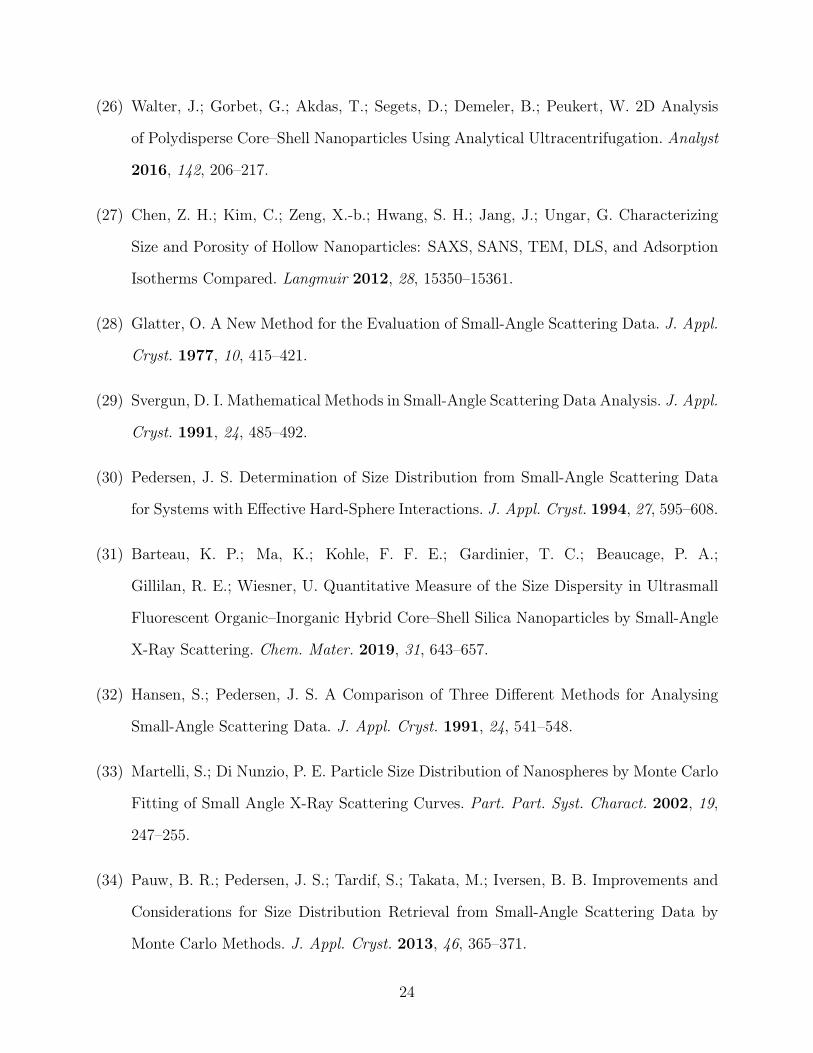
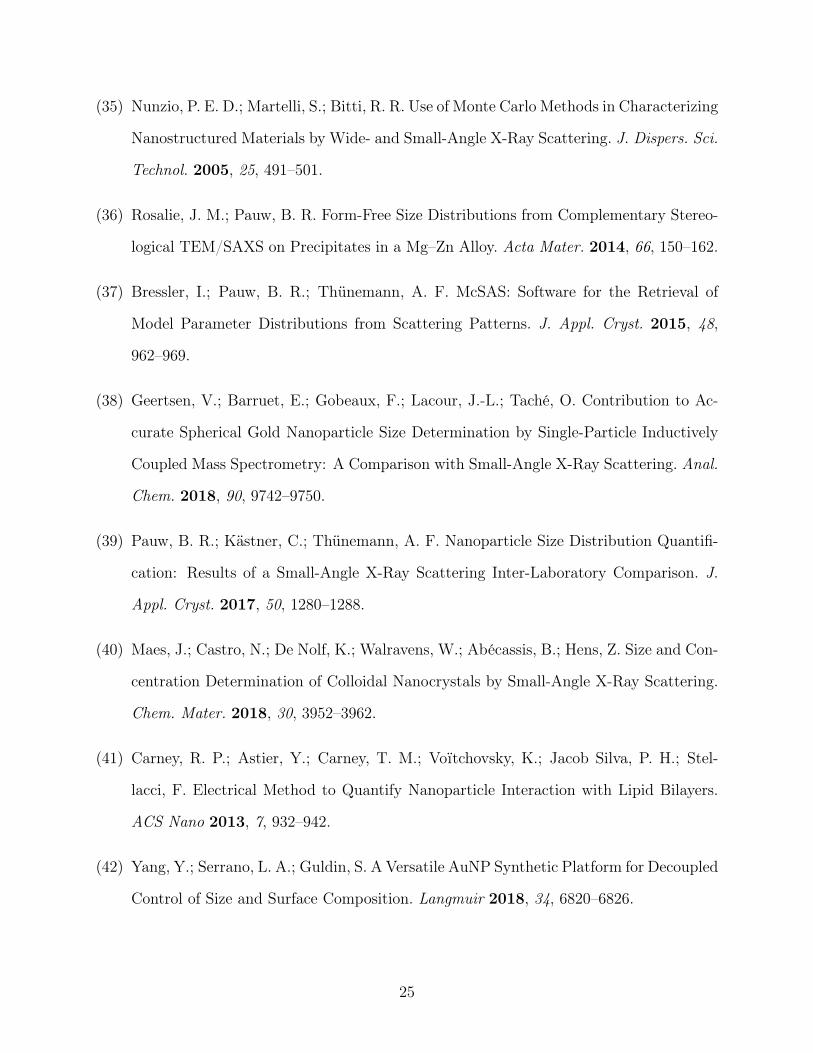
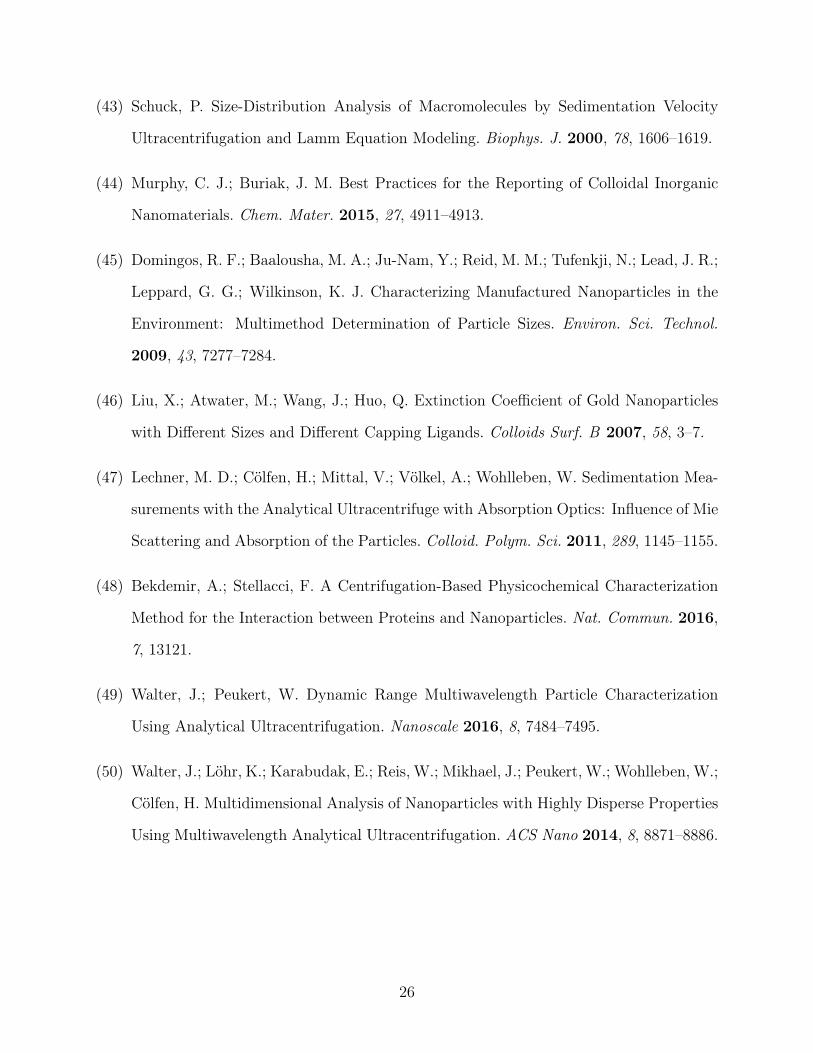
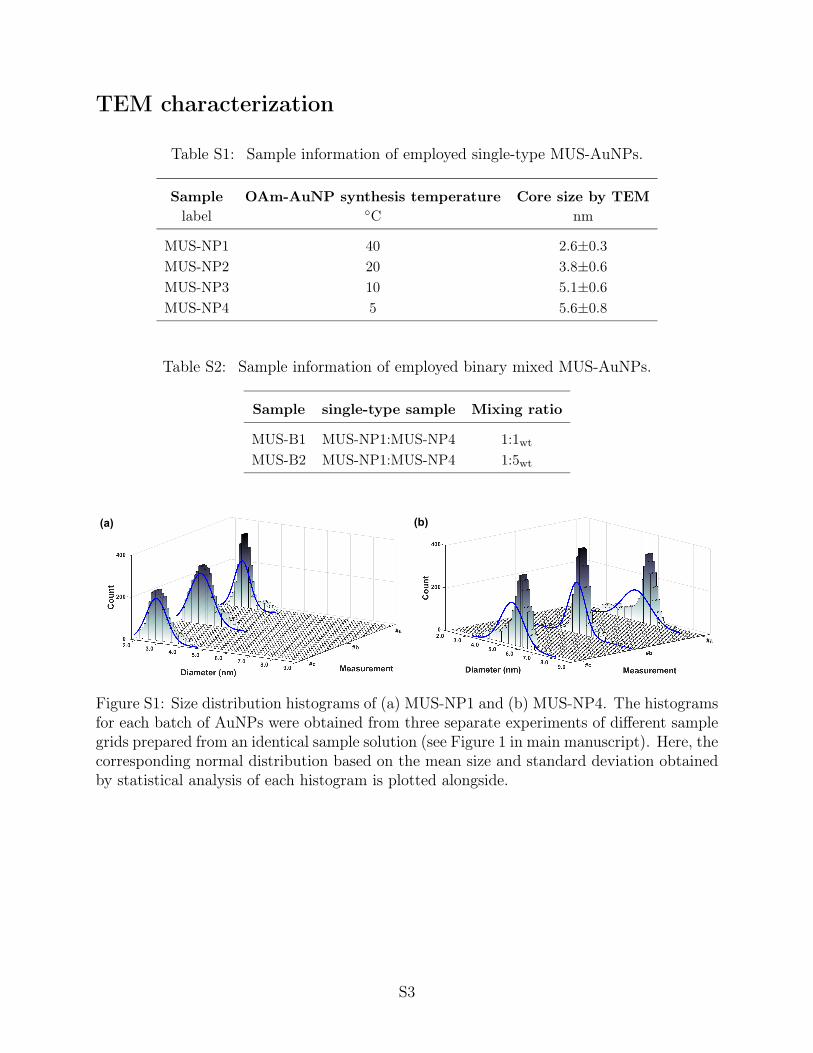
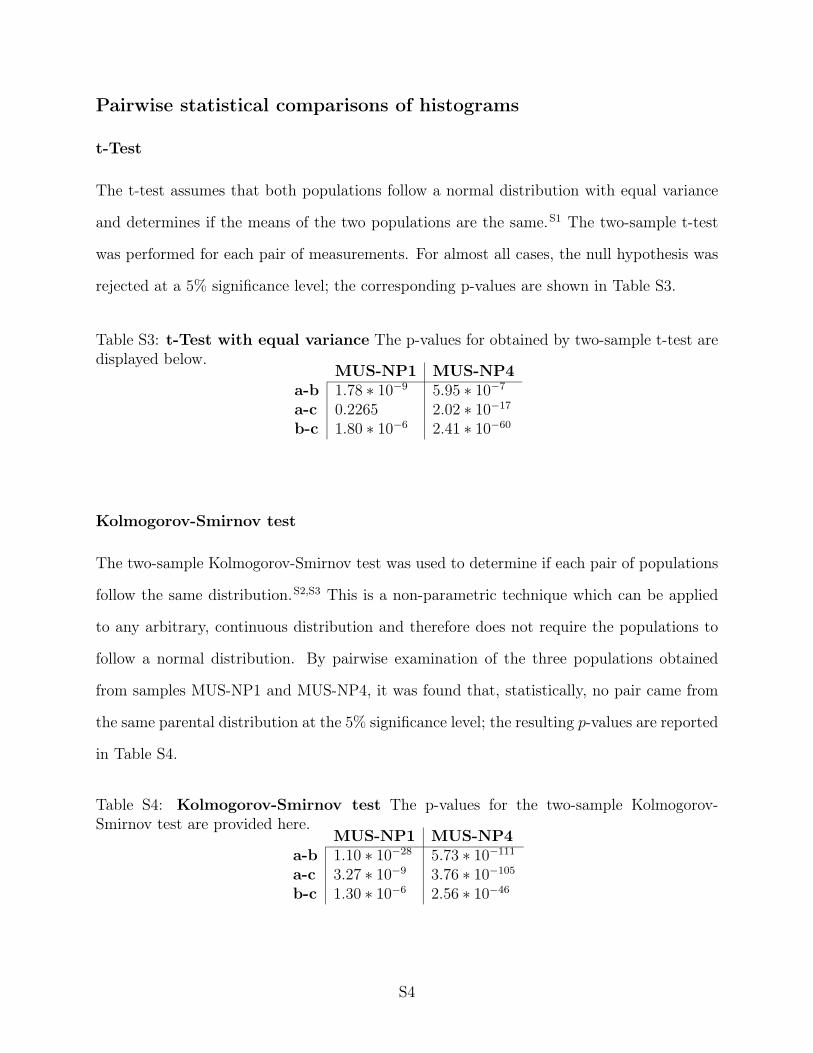
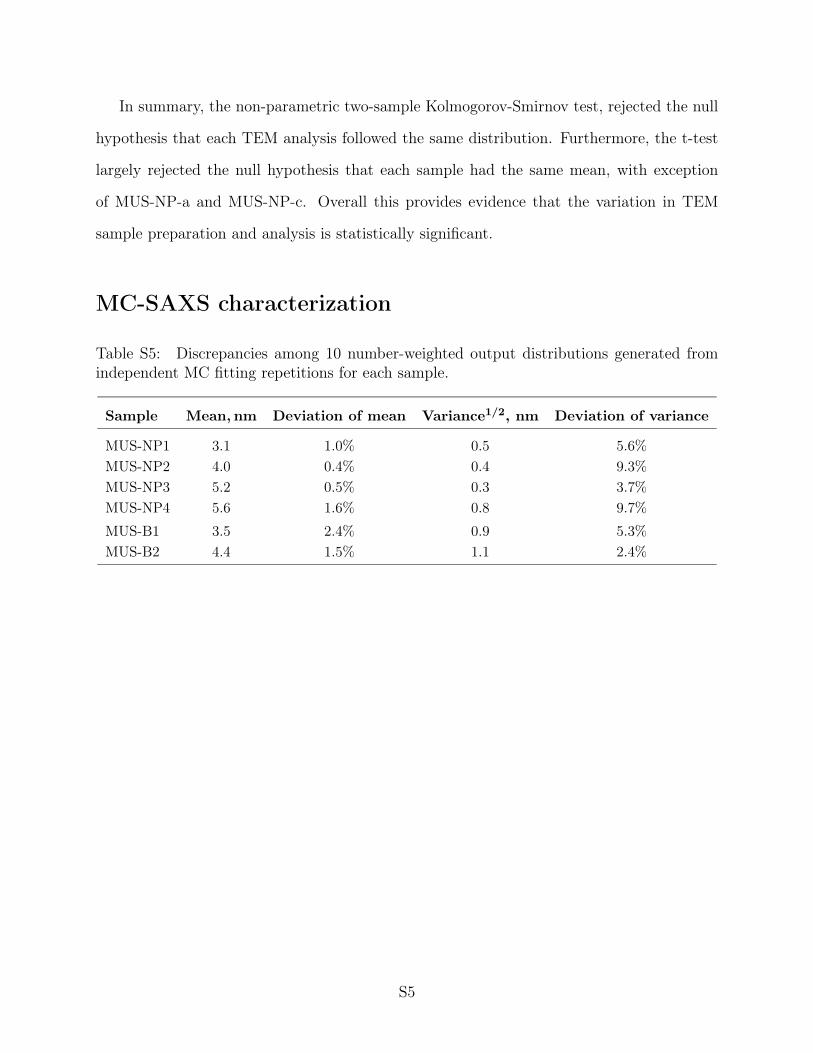
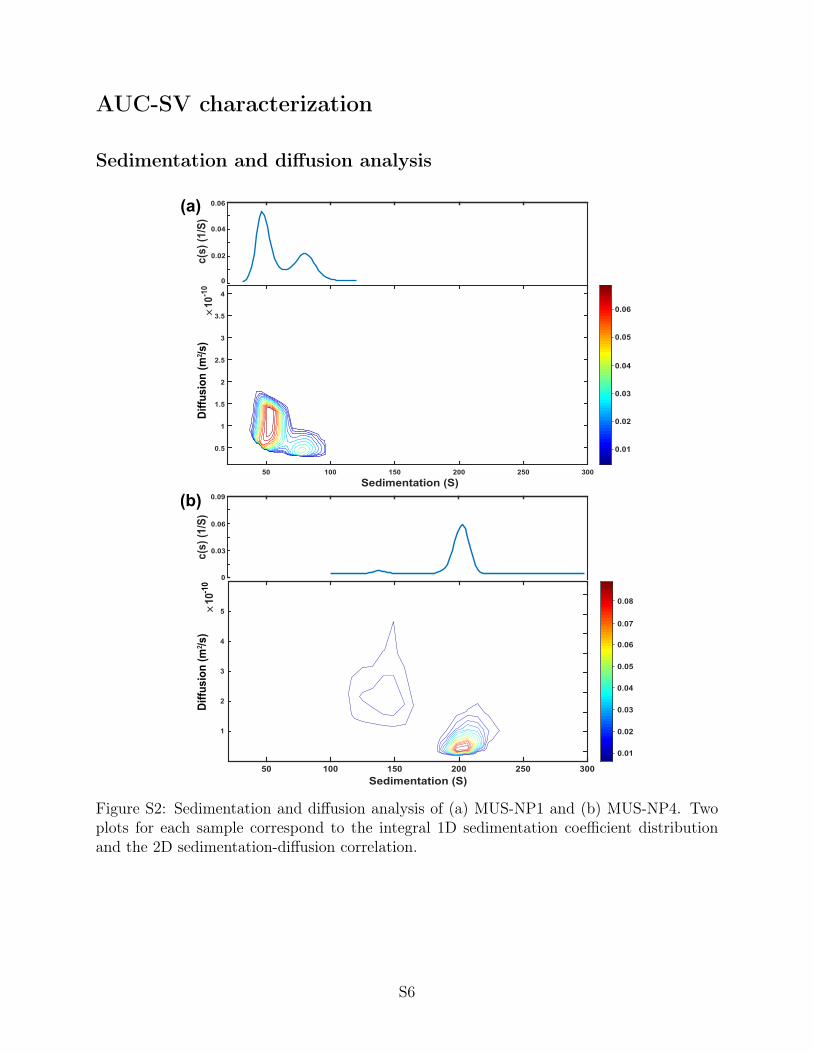
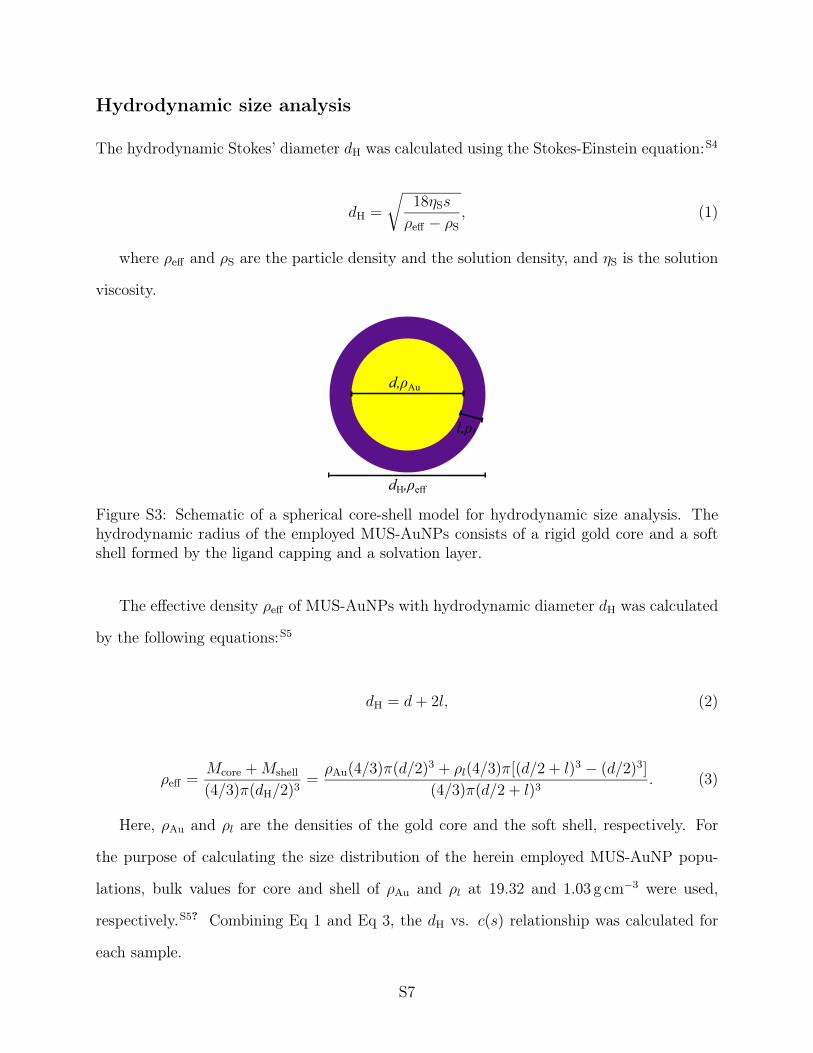
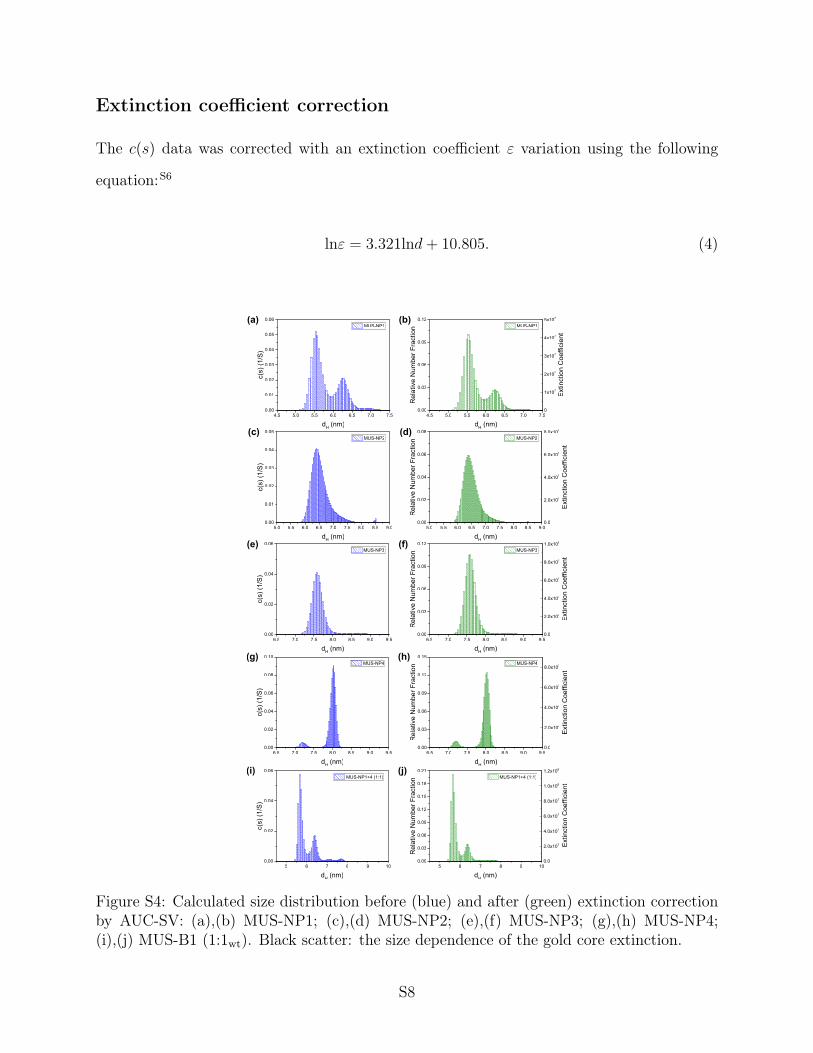
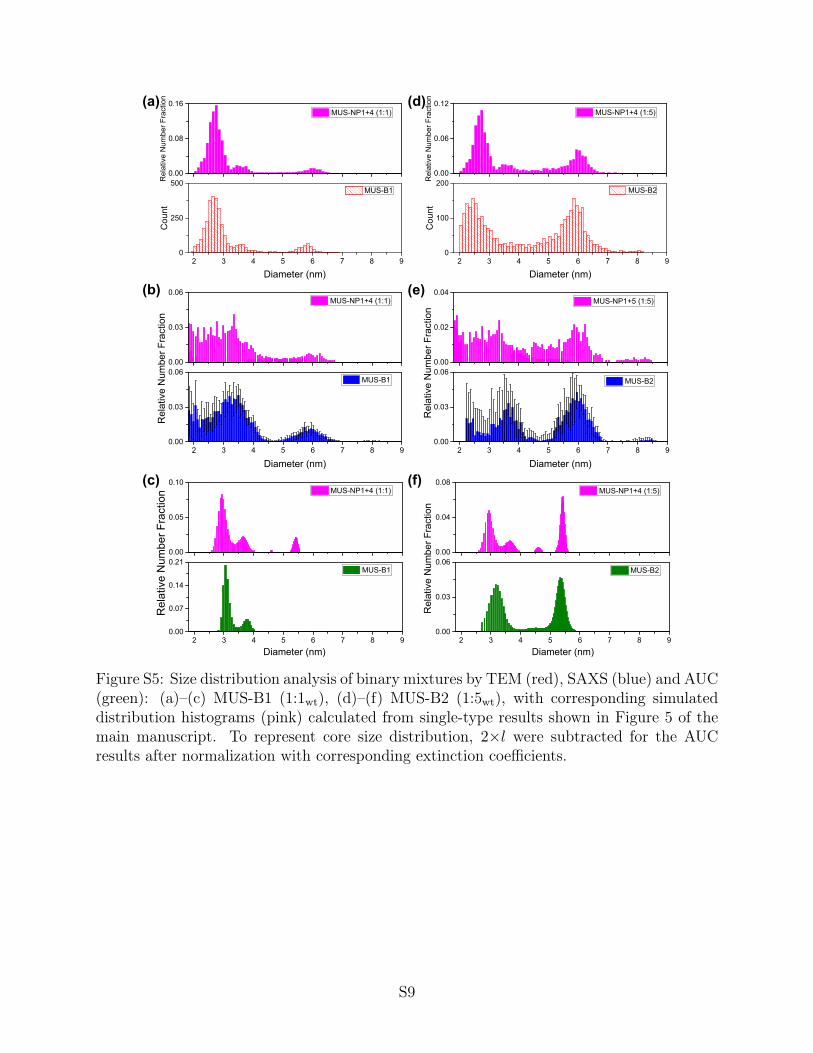

download fileview on ChemRxivSI_Cross-method_size_determination_final(v7)pdf (79971 KiB)


![digital.csic.esdigital.csic.es/.../10261/44017/3/Aizpurua_ACS_Nano_20… · Web viewPrecise sub-nm plasmonic junctions for SERS within gold nanoparticle assemblies using cucurbit[n]uril](https://img.pdfslide.net/doc/110x75/5b00d8d67f8b9a65618cadc8/web-viewprecise-sub-nm-plasmonic-junctions-for-sers-within-gold-nanoparticle-assemblies.jpg)