Embed Size (px)
Citation preview
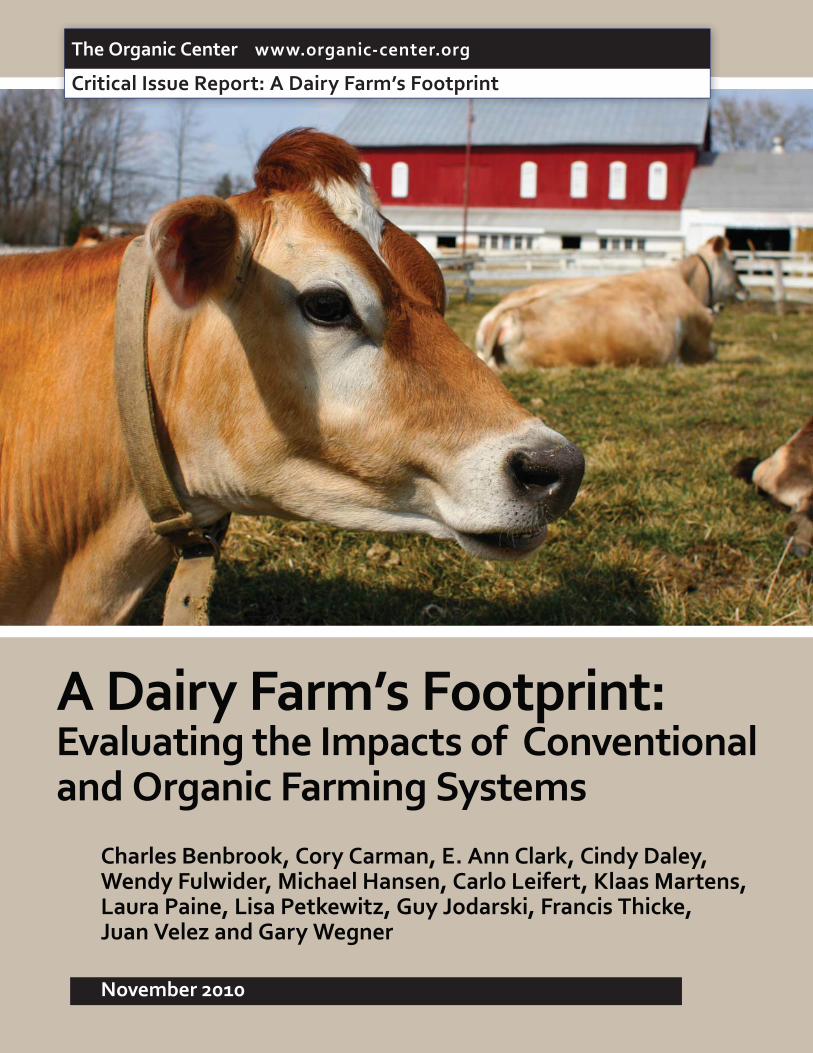
A Dairy Farm’s Footprint:Evaluating the Impacts of Conventional and Organic Farming Systems
November 2010
Charles Benbrook, Cory Carman, E. Ann Clark, Cindy Daley, Wendy Fulwider, Michael Hansen, Carlo Leifert, Klaas Martens, Laura Paine, Lisa Petkewitz, Guy Jodarski, Francis Thicke, Juan Velez and Gary Wegner
The Organic Center www.organic-center.org
Critical Issue Report: A Dairy Farm’s Footprint
The Organic Center Critical Issue Report Page
November 2010 Dairy Farm Footprint
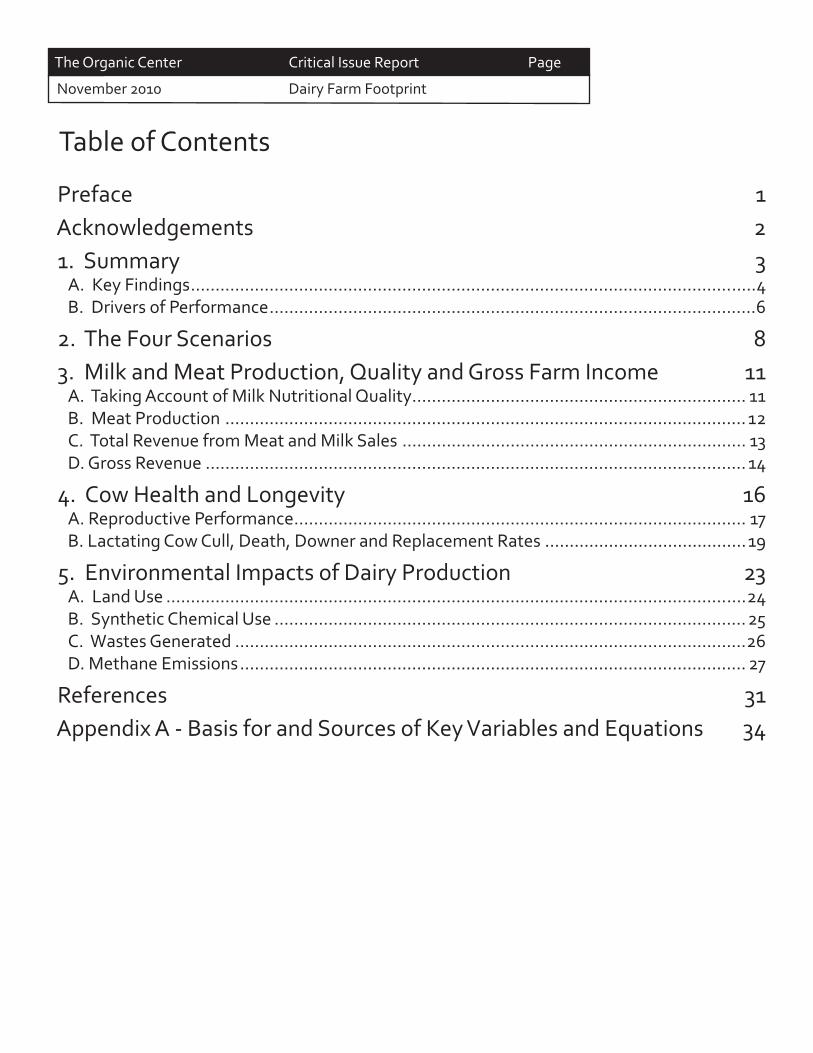
Preface 1 Acknowledgements 2 1. Summary 3
A. Key Findings ...................................................................................................................4B. Drivers of Performance ...................................................................................................6
2. The Four Scenarios 8 3. Milk and Meat Production, Quality and Gross Farm Income 11
A. Taking Account of Milk Nutritional Quality .................................................................... 11B. Meat Production .......................................................................................................... 12C. Total Revenue from Meat and Milk Sales ...................................................................... 13D. Gross Revenue .............................................................................................................. 14
4. Cow Health and Longevity 16A. Reproductive Performance ............................................................................................ 17B. Lactating Cow Cull, Death, Downer and Replacement Rates .........................................19
5. Environmental Impacts of Dairy Production 23A. Land Use ......................................................................................................................24B. Synthetic Chemical Use ................................................................................................25C. Wastes Generated ........................................................................................................26D. Methane Emissions ....................................................................................................... 27
References 31 Appendix A - Basis for and Sources of Key Variables and Equations 34
Table of Contents
The Organic Center Critical Issue Report Page November 2010 A Dairy Farm’s Footprint 1
Preface
Dairy farming systems impact the environment, animal well-being, and the nutritional quality and safety of milk and dairy products in many ways. Many private companies and organizations are developing new sustainability indicators encompassing energy and chemical use in the dairy sector, as well as system impacts on net greenhouse gas and nitrogen emissions.
The Organic Center’s initial work on the environmental impacts of dairy production focused on land use and the pounds of pesticides, animal drugs, and synthetic nitrogen fertilizer not used on organic dairy farms. A Critical Issue Report was released in March, 2009 entitled Shades of Green: Quantifying the Benefi ts of Organic Dairy Production (access this report at http://www.organic-center.org/science.environment.php?action=view&report_id=139.
Over the last 18 months, the “Shades of Green” (SOG) dairy sector calculator has been signifi cantly expanded and refi ned. Concurrent with the release of this report, the Center is making available free of charge via its website SOG Version 1.1, as well as a 92-page report documenting all the equations in SOG Version 1.1 and providing step-by-step instructions for people wanting to use the SOG calculator.
The Center is, to our knowledge, the fi rst organization to release a fully operational version of a dairy sector environmental footprint model, along with a comprehensive document on the structure, potential applications, and equations embedded in the model. While such full disclosure will not end debate on the structure or equations in SOG, it will help focus ongoing discussion on the science and key data inputs, rather than speculation regarding what the SOG model actually entails.
The SOG calculator is a work in progress. New modules will be added in the next year encompassing other greenhouse gas emissions, total Global Warming Potential, animal drug use, and soil carbon sequestration. New applications are also planned for the near future, beginning with the modeling of typical conventional and organic dairy farms by region.
The SOG calculator off ers farmers, researchers, the food industry, and policy makers an opportunity to expand the focus and sharpen the resolution of dairy sector environmental footprint studies. SOG Version 1.1 encompasses most of the critical impacts of dairy farm management systems on milk quality and safety and on cow health, areas of impact likely to remain high on the agenda of consumers wanting to support with their food dollars constructive change down on the farm.
Charles Benbrook Chief Scientist The Organic Center
The Organic Center Critical Issue Report Page
November 2010 A Dairy Farm’s Footprint 2
AcknowledgementsThe Center deeply appreciates the assistance of the team of dairy scientists, industry specialists, and researchers that have worked with the Center in developing SOG Version 1.1 and applying it in the “Conventional and Organic Farm Environmental Footprint” (COFEF) application of SOG Version 1.1 . Team members and co-authors of this report include:
Cory Carman, Carman Ranch, Wallowa, OregonE. Ann Clark, Associate Professor, Plant Agriculture, University of GuelphCindy Daley, Professor, College of Agriculture, Chico State University, Chico, CaliforniaWendy Fulwider, Animal Welfare Specialist, Organic Valley, LaFarge, WisconsinMichael Hansen, Consumer Policy Institute, Consumers Union, Yonkers, New YorkCarlo Leifert, Director, Food, Quality, and Heath Network, University of Newcastle, Newcastle, U.K.Klaas Martens, Klaas and Mary Howell Martens Farm and Lakeview Organic Grain, Penn Yan, New YorkLaura Paine, Wisconsin Department of Agriculture, Trade, and Consumer Protection, Madison, Wisconsin Lisa Petkewitz, Landsingburgh Veterinarian Hospital, Albany, New YorkGuy Jodarski, Veterinarian, Organic Valley, Neillsville, WisconsinFrancis Thicke, Radiance Dairy, Fairfi eld, IowaJuan Velez, VP Farm Operations, Aurora Organic Dairy, Boulder, ColoradoGary Wegner, Dairy Nutritionist, CIRCUL8 Systems, Reardan, Washington
Special recognition is warranted to two consultants working for the Center. Cory Carman helped throughout with the design of the calculator, and especially the projection of manure and methane emissions. Likewise, Karie Knoke, KComp Solutions of Sandpoint, Idaho, has done an excellent job in creating within Microsoft Excel a powerful and fl exible, yet user-friendly analytical tool. Karie also helped shape several enhancements that make the SOG calculator easier to use and understand. Thanks also to Karen Benbrook for desktop pub-lishing this report and the SOG user’s manual, as well as for the steady support and encouragement through-out the long process required to complete and release SOG Version 1.1, this fi rst application and report.
The development of SOG and this application were made possible by a generous grant from the Packard Foundation. This grant has allowed the Center to begin a program of research on the contributions of organic farming systems to the mitigation of nitrogen pollution and greenhouse gas emissions. Clearly, that potential is signifi cant and deserves far more recognition in the policy arena.
Funding from long-term supporters of The Organic Center has also helped fi nance work on the calculator and this report. Special thanks are due to Stonyfi eld Farm, Horizon Organic and WhiteWave Foods, Aurora Organic Dairy, and Organic Valley for encouragement and support as this project has unfolded over the last two years.
The Organic Center Critical Issue Report Page November 2010 A Dairy Farm’s Footprint 3
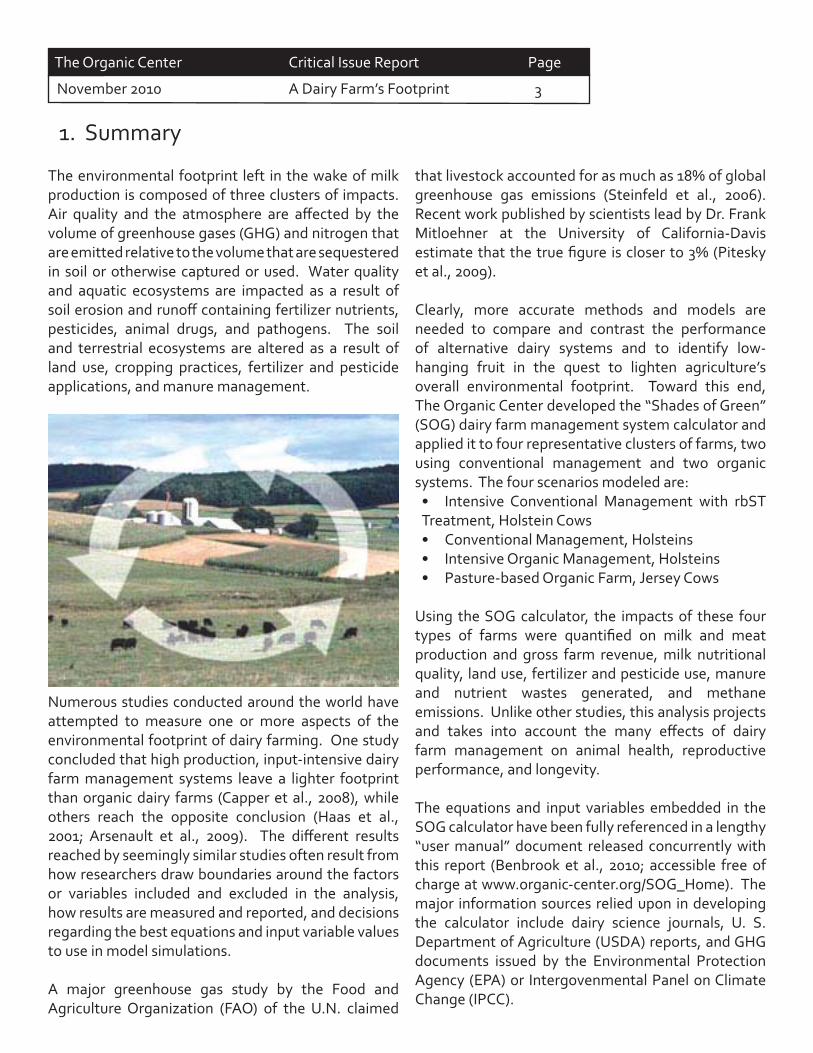
The environmental footprint left in the wake of milk production is composed of three clusters of impacts. Air quality and the atmosphere are aff ected by the volume of greenhouse gases (GHG) and nitrogen that are emitted relative to the volume that are sequestered in soil or otherwise captured or used. Water quality and aquatic ecosystems are impacted as a result of soil erosion and runoff containing fertilizer nutrients, pesticides, animal drugs, and pathogens. The soil and terrestrial ecosystems are altered as a result of land use, cropping practices, fertilizer and pesticide applications, and manure management.
Numerous studies conducted around the world have attempted to measure one or more aspects of the environmental footprint of dairy farming. One study concluded that high production, input-intensive dairy farm management systems leave a lighter footprint than organic dairy farms (Capper et al., 2008), while others reach the opposite conclusion (Haas et al., 2001; Arsenault et al., 2009). The diff erent results reached by seemingly similar studies often result from how researchers draw boundaries around the factors or variables included and excluded in the analysis, how results are measured and reported, and decisions regarding the best equations and input variable values to use in model simulations. A major greenhouse gas study by the Food and Agriculture Organization (FAO) of the U.N. claimed
1. Summary
that livestock accounted for as much as 18% of global greenhouse gas emissions (Steinfeld et al., 2006). Recent work published by scientists lead by Dr. Frank Mitloehner at the University of California-Davis estimate that the true fi gure is closer to 3% (Pitesky et al., 2009).
Clearly, more accurate methods and models are needed to compare and contrast the performance of alternative dairy systems and to identify low-hanging fruit in the quest to lighten agriculture’s overall environmental footprint. Toward this end, The Organic Center developed the “Shades of Green” (SOG) dairy farm management system calculator and applied it to four representative clusters of farms, two using conventional management and two organic systems. The four scenarios modeled are:
• Intensive Conventional Management with rbST Treatment, Holstein Cows• Conventional Management, Holsteins• Intensive Organic Management, Holsteins• Pasture-based Organic Farm, Jersey Cows
Using the SOG calculator, the impacts of these four types of farms were quantifi ed on milk and meat production and gross farm revenue, milk nutritional quality, land use, fertilizer and pesticide use, manure and nutrient wastes generated, and methane emissions. Unlike other studies, this analysis projects and takes into account the many eff ects of dairy farm management on animal health, reproductive performance, and longevity.
The equations and input variables embedded in the SOG calculator have been fully referenced in a lengthy “user manual” document released concurrently with this report (Benbrook et al., 2010; accessible free of charge at www.organic-center.org/SOG_Home). The major information sources relied upon in developing the calculator include dairy science journals, U. S. Department of Agriculture (USDA) reports, and GHG documents issued by the Environmental Protection Agency (EPA) or Intergovenmental Panel on Climate Change (IPCC).
The Organic Center Critical Issue Report Page
November 2010 A Dairy Farm’s Footprint 4
In addition, the SOG calculator itself and all details and results from the current application of SOG to the above four scenarios are freely accessible via The Organic Center website (www.organic-center.org/SOG_Home) for anyone that wishes to better understand the model’s structure and contents, or apply it to a given farm or set of farms.
A. Key Findings
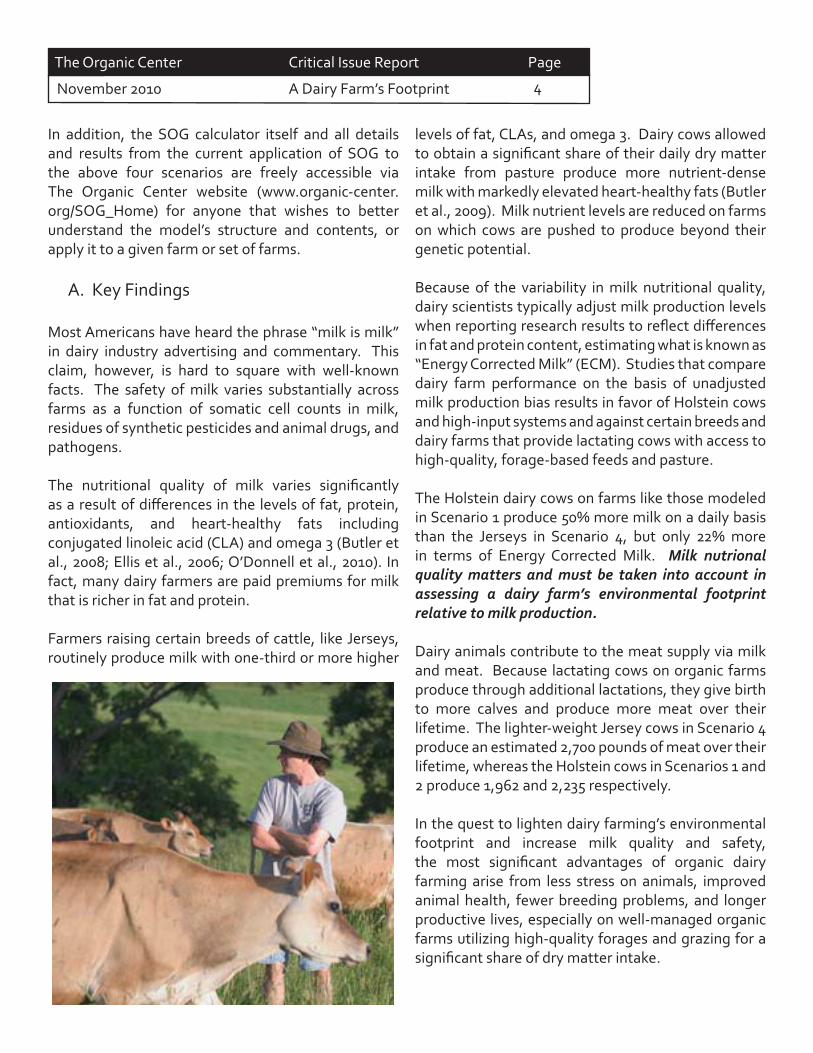
Most Americans have heard the phrase “milk is milk” in dairy industry advertising and commentary. This claim, however, is hard to square with well-known facts. The safety of milk varies substantially across farms as a function of somatic cell counts in milk, residues of synthetic pesticides and animal drugs, and pathogens. The nutritional quality of milk varies signifi cantly as a result of diff erences in the levels of fat, protein, antioxidants, and heart-healthy fats including conjugated linoleic acid (CLA) and omega 3 (Butler et al., 2008; Ellis et al., 2006; O’Donnell et al., 2010). In fact, many dairy farmers are paid premiums for milk that is richer in fat and protein.
Farmers raising certain breeds of cattle, like Jerseys, routinely produce milk with one-third or more higher
levels of fat, CLAs, and omega 3. Dairy cows allowed to obtain a signifi cant share of their daily dry matter intake from pasture produce more nutrient-dense milk with markedly elevated heart-healthy fats (Butler et al., 2009). Milk nutrient levels are reduced on farms on which cows are pushed to produce beyond their genetic potential.
Because of the variability in milk nutritional quality, dairy scientists typically adjust milk production levels when reporting research results to refl ect diff erences in fat and protein content, estimating what is known as “Energy Corrected Milk” (ECM). Studies that compare dairy farm performance on the basis of unadjusted milk production bias results in favor of Holstein cows and high-input systems and against certain breeds and dairy farms that provide lactating cows with access to high-quality, forage-based feeds and pasture.
The Holstein dairy cows on farms like those modeled in Scenario 1 produce 50% more milk on a daily basis than the Jerseys in Scenario 4, but only 22% more in terms of Energy Corrected Milk. Milk nutrional quality matters and must be taken into account in assessing a dairy farm’s environmental footprint relative to milk production.
Dairy animals contribute to the meat supply via milk and meat. Because lactating cows on organic farms produce through additional lactations, they give birth to more calves and produce more meat over their lifetime. The lighter-weight Jersey cows in Scenario 4 produce an estimated 2,700 pounds of meat over their lifetime, whereas the Holstein cows in Scenarios 1 and 2 produce 1,962 and 2,235 respectively.
In the quest to lighten dairy farming’s environmental footprint and increase milk quality and safety, the most signifi cant advantages of organic dairy farming arise from less stress on animals, improved animal health, fewer breeding problems, and longer productive lives, especially on well-managed organic farms utilizing high-quality forages and grazing for a signifi cant share of dry matter intake.
The Organic Center Critical Issue Report Page November 2010 A Dairy Farm’s Footprint 5
Compared to milk cows on high-production dairy farms like those modeled in Scenario 1, lactating cows on organic dairy farms:
• Live 1.5 to two years longer,• Milk through 4 or 4.5 lactations, in contrast to less than 2,• Milk through shorter lactations averaging 313 to 337 days, instead of 410 days,• Lose only 10% to 16% of successful conceptions as a result of embryonic loss or spontaneous abortions, compared to 27%, and• Require just 1.8 to 2.3 breeding attempts per calf carried to term, compared to 3.5 attempts.
These major diff erences between high-production conventional dairy farms and organic farms are brought about by declining animal health and incrementally more serious reproductive problems on farms that strive to maximize production via a regime of hormone and other drug use, coupled with high-energy, grain-based diets (Lucy, 2001; Smith et al., 2000).
Avoiding Bias in the Choice of Measurements
In comparing dairy farm performance, the volume of feed intake and wastes generated by dairy farms are typically expressed relative to some measure of milk output from dairy farm operations (e.g., milk per day, per lactation, or per year). How this basic metric of performance is defi ned and then quantifi ed has an enormous impact on results.
Studies that compare feed intake or wastes generated per unit of milk produced in a given year or over a single lactation ignore the impact of dairy management systems on cow health and longevity. This oversight is often inadvertent, but skews results against systems that strive to promote cow health and maximize milk and meat production over an animal’s life.
This source of bias is rooted in animal physiology. It arises from the signifi cant volumes of animal feed and wastes generated in the two years prior to the birth of a milk cow’s fi rst calf. On dairy farms with relatively
high replacement rates such as those in Scenario 1, the two years of feed and other inputs required to get a cow into production, and the wastes generated, are amortized over just 1.8 lactations, while on a grass-based farm like those modeled in Scenario 4, the average cow milks through an estimated 4.5 lactations, markedly changing longer-term measures of performance.
Organic dairy farms raising Holsteins require about the same amount of land to sustain a milk cow and the animals needed to keep her in production, but signifi cantly less prime cropland compared to high-production farms feeding large quantities of corn and soybeans. Organic dairy farms milking Jersey cows require an annual average 3.8 acres of land compared to 4.9 acres on high-production conventional farms.
Because certifi ed organic farmers cannot use the synthetic nitrogen fertilizers and pesticides routinely used in growing feed for conventional dairy animals, the environment and public health are spared any adverse impact from these production inputs.
In terms of the wastes generated by dairy farming, most footprint studies focus on the amount of manure, nutrient excretions, and methane emitted per pound or kilogram of milk. Again, virtually all past studies build bias into their results by focusing only on the volume of wastes or methane emitted per pound of milk over a lactation or in a year, rather than per pound of Energy Corrected Milk over a cow’s lifetime.
In comparing the wastes generated by the Jersey cows in Scenario 4 to the high-production Holsteins in Scenario 1, it is important to note that the Holstein cows are about 40% heavier and require more feed to support metabolic functions. The Jerseys, on the other hand, require additional feed energy to cover the metabolic expense of walking to, from and over pastures in the course of grazing, and the Jerseys are producing substantially less milk per day, and hence require less feed per day. The SOG calculator takes all these factors into account in projecting feed needs and the wastes generated across the four scenarios.
The Organic Center Critical Issue Report Page
November 2010 A Dairy Farm’s Footprint 6
The Jersey cows in Scenario 4 produce 2.5 kilograms (kg) of manure per kg of unadjusted milk, compared to 2.04, 2.28, and 2.42 kgs by the Holsteins in Scenarios 1, 2, and 3. But in terms of Energy Corrected Milk, the Jersey cows produce the least manure per kg of milk – 2.04 kgs compared to 2.07 kgs in Scenario 1.
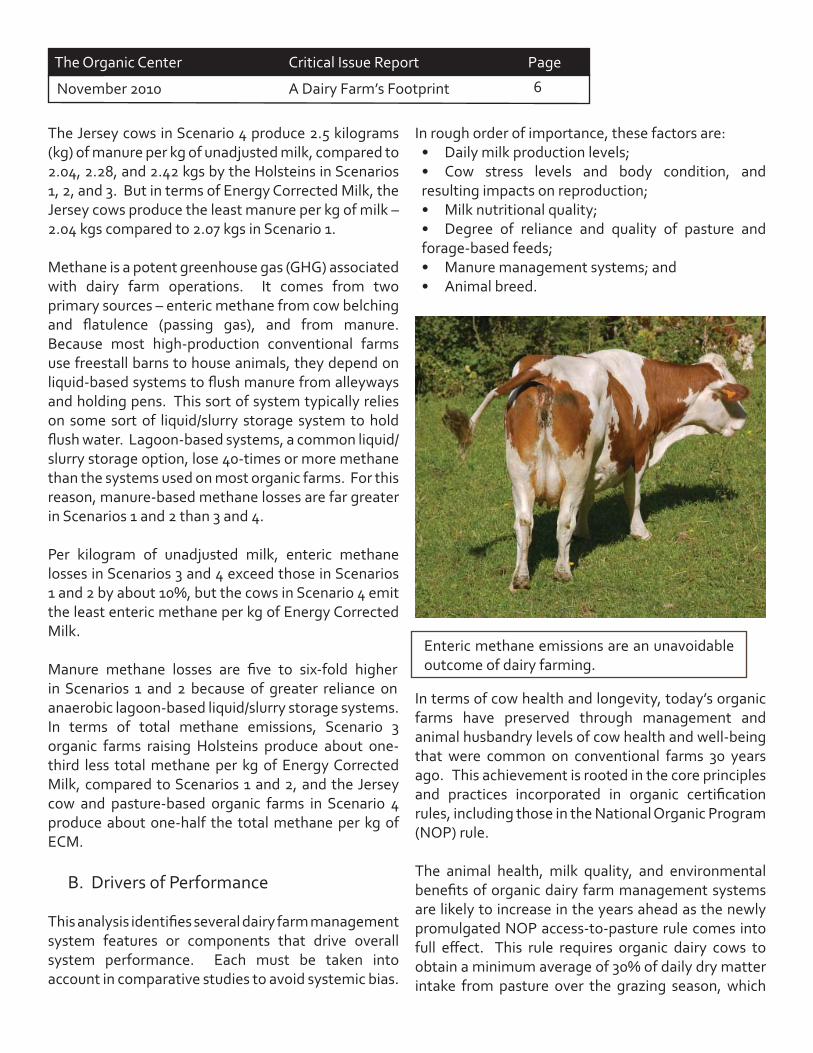
Methane is a potent greenhouse gas (GHG) associated with dairy farm operations. It comes from two primary sources – enteric methane from cow belching and fl atulence (passing gas), and from manure. Because most high-production conventional farms use freestall barns to house animals, they depend on liquid-based systems to fl ush manure from alleyways and holding pens. This sort of system typically relies on some sort of liquid/slurry storage system to hold fl ush water. Lagoon-based systems, a common liquid/slurry storage option, lose 40-times or more methane than the systems used on most organic farms. For this reason, manure-based methane losses are far greater in Scenarios 1 and 2 than 3 and 4.
Per kilogram of unadjusted milk, enteric methane losses in Scenarios 3 and 4 exceed those in Scenarios 1 and 2 by about 10%, but the cows in Scenario 4 emit the least enteric methane per kg of Energy Corrected Milk.
Manure methane losses are fi ve to six-fold higher in Scenarios 1 and 2 because of greater reliance on anaerobic lagoon-based liquid/slurry storage systems. In terms of total methane emissions, Scenario 3 organic farms raising Holsteins produce about one-third less total methane per kg of Energy Corrected Milk, compared to Scenarios 1 and 2, and the Jersey cow and pasture-based organic farms in Scenario 4 produce about one-half the total methane per kg of ECM.
B. Drivers of Performance
This analysis identifi es several dairy farm management system features or components that drive overall system performance. Each must be taken into account in comparative studies to avoid systemic bias.
In rough order of importance, these factors are:• Daily milk production levels;• Cow stress levels and body condition, and resulting impacts on reproduction;• Milk nutritional quality;• Degree of reliance and quality of pasture and forage-based feeds;• Manure management systems; and • Animal breed.
In terms of cow health and longevity, today’s organic farms have preserved through management and animal husbandry levels of cow health and well-being that were common on conventional farms 30 years ago. This achievement is rooted in the core principles and practices incorporated in organic certifi cation rules, including those in the National Organic Program (NOP) rule.
The animal health, milk quality, and environmental benefi ts of organic dairy farm management systems are likely to increase in the years ahead as the newly promulgated NOP access-to-pasture rule comes into full eff ect. This rule requires organic dairy cows to obtain a minimum average of 30% of daily dry matter intake from pasture over the grazing season, which
Enteric methane emissions are an unavoidable outcome of dairy farming.
The Organic Center Critical Issue Report Page November 2010 A Dairy Farm’s Footprint 7
must last at least 120 days each year and can be as long as 365 days in some regions. This new rule will increase reliance on pasture on many organic farms and will, as a result, promote average cow health and enhance organic milk quality, while lightening dairy farming’s environmental footprint.
The dominant trends in the conventional dairy sector are toward larger farms, higher production, virtually no access to pasture, heavier reliance on performance-enhancing drugs and antibiotics, and substantially greater and more concentrated environmental impacts, especially methane emissions and nitrogen losses from anaerobic lagoon-based manure management systems.
An encouraging series of insights emerged over the course of this study. Milk nutritional quality can be improved through management. Steps taken to improve milk quality tend to enhance animal health
SHADES OF GREENUSERS MANUAL
GUIDE AND DOCUMENTATION FOR A DAIRY FARM MANAGEMENT SYSTEM CALCULATOR
V 1.1
O 2010
CHECK FOR UPDATES AT: WWW.ORGANIC CENTER.ORG/SOG_HOME
THE ORGANIC CENTER BOULDER COLORADO
and longevity and lighten the environmental footprint of dairy farming. System changes that are good for cows are also benefi cial to people drinking their milk, and good for the land and the atmosphere. Such innovation can also improve the farmer’s bottom line, especially if the availability of high-quality organic dairy feed and other production inputs increases, a likely outcome as the industry grows in scale and sophistication.
New tools and deeper insights are needed to support eff orts by conventional and organic dairy farmers working to improve the safety and quality of milk, enhance animal health, and lighten the environmental footprint of dairy farming. The SOG calculator is one such a new tool that is fully documented, easy to use, fl exible, and off ered free to anyone hoping to identify the most cost-eff ective ways to improve the performance of dairy farm operations, for the benefi t of the animals and the land, and people and the planet.
The Organic Center Critical Issue Report Page
November 2010 A Dairy Farm’s Footprint 8
2. The Four Scenarios
Today, milk is produced by about 9.1 million dairy cows on U.S. farms. Lactating cows produce, on average, 21,108 pounds of milk per year, or 58 pounds per day, according to the USDA’s 2010 USDA forecast (Economic Research Service, 2010a). Of these 9.1 million cows, around 150,000 are managed on organic dairy farms.
In the current application of SOG, Version 1.1, four hypothetical, baseline scenarios are modeled:
• Intensive Conventional Management with rbST, Holsteins• Conventional Management, Holsteins• Intensive Organic Management, Holsteins• Pasture-based Organic Farm, Jersey Cows
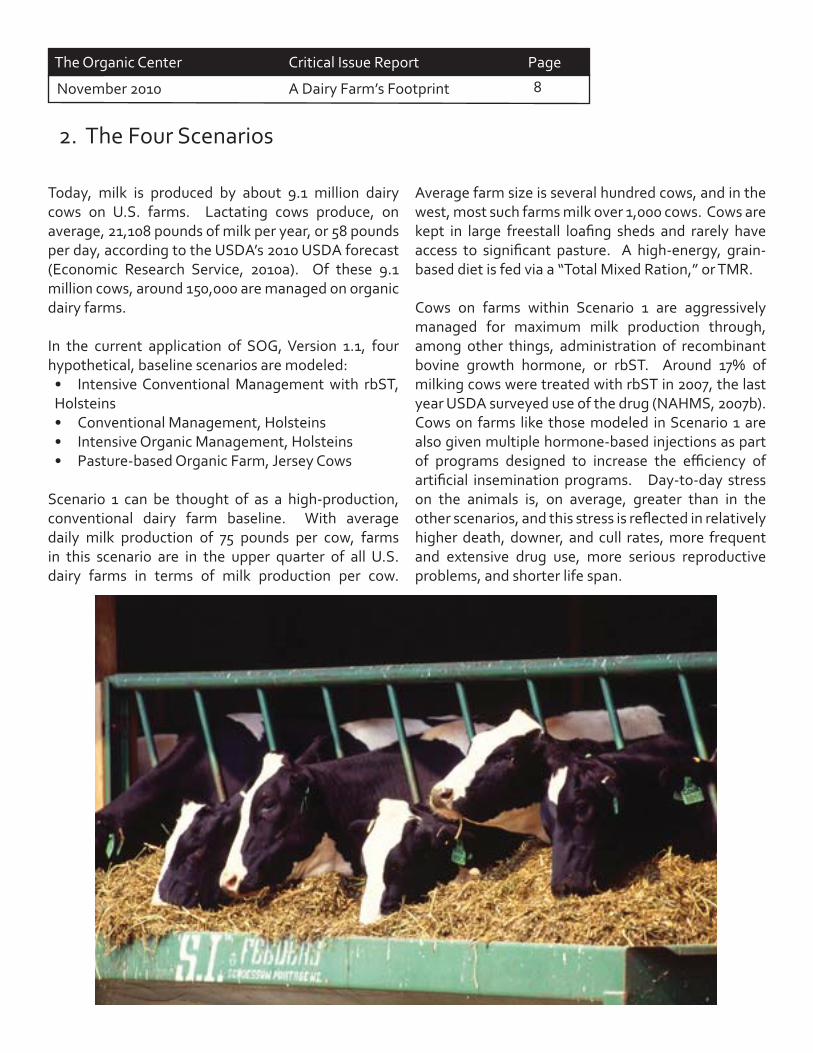
Scenario 1 can be thought of as a high-production, conventional dairy farm baseline. With average daily milk production of 75 pounds per cow, farms in this scenario are in the upper quarter of all U.S. dairy farms in terms of milk production per cow.
Average farm size is several hundred cows, and in the west, most such farms milk over 1,000 cows. Cows are kept in large freestall loafi ng sheds and rarely have access to signifi cant pasture. A high-energy, grain-based diet is fed via a “Total Mixed Ration,” or TMR. Cows on farms within Scenario 1 are aggressively managed for maximum milk production through, among other things, administration of recombinant bovine growth hormone, or rbST. Around 17% of milking cows were treated with rbST in 2007, the last year USDA surveyed use of the drug (NAHMS, 2007b). Cows on farms like those modeled in Scenario 1 are also given multiple hormone-based injections as part of programs designed to increase the effi ciency of artifi cial insemination programs. Day-to-day stress on the animals is, on average, greater than in the other scenarios, and this stress is refl ected in relatively higher death, downer, and cull rates, more frequent and extensive drug use, more serious reproductive problems, and shorter life span.
The Organic Center Critical Issue Report Page November 2010 A Dairy Farm’s Footprint 9
The connections between milk production levels, feed rations, farm size, animal stress, and cow health and longevity are well established in the dairy science literature (Chagas et al., 2007; Hadley et al., 2006; Kellogg et al., 2001; Knaus, 2008; McConnel et al., 2008; Olynk and Wolf, 2008; Smith el al., 2000; Thomsen et al., 2006; Tsurta et al., 2005) and are borne out in public and private surveys and detailed, farm-specifi c records.
Scenario 2 represents a less intensive, Holstein-based conventional farm alternative to Scenario 1. It assumes 65 pounds of daily milk production, about average for well-managed conventional dairies not administering rbST. Farms in Scenario 2 feed somewhat less grain and protein supplements, and somewhat more forage-based feeds compared to the farms in Scenario 1.
Scenario 3 refl ects organic dairy farms with Holstein cows under intense management and, for organic farms, relatively heavy reliance on grain-based feeds. Farms in Scenario 3 produce an average of 60 pounds of milk per day, 20% less than the high-production conventional farms in Scenario 1. Cows are fed much more forage-based feeds and must derive a signifi cant share of dry matter intake from pasture in order to comply with the National Organic Program rule
governing access to pasture on organic farms. Because the animals on such farms are fed a diet that matches more closely the natural diet of ruminant animals, they are not as stressed metabolically by relatively high daily milk production levels. On average, they experience fewer reproductive problems, milk through more lactations, and live longer than the cows on Scenario 1 or 2 farms.
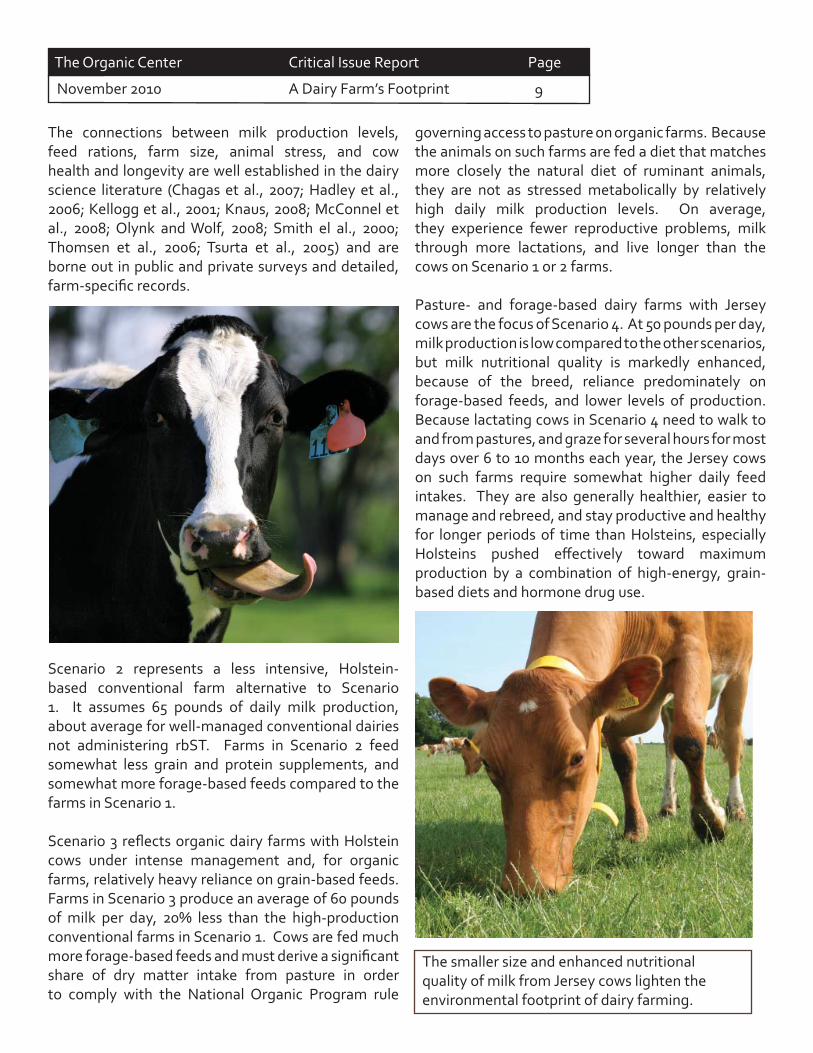
Pasture- and forage-based dairy farms with Jersey cows are the focus of Scenario 4. At 50 pounds per day, milk production is low compared to the other scenarios, but milk nutritional quality is markedly enhanced, because of the breed, reliance predominately on forage-based feeds, and lower levels of production. Because lactating cows in Scenario 4 need to walk to and from pastures, and graze for several hours for most days over 6 to 10 months each year, the Jersey cows on such farms require somewhat higher daily feed intakes. They are also generally healthier, easier to manage and rebreed, and stay productive and healthy for longer periods of time than Holsteins, especially Holsteins pushed eff ectively toward maximum production by a combination of high-energy, grain-based diets and hormone drug use.
The smaller size and enhanced nutritional quality of milk from Jersey cows lighten the environmental footprint of dairy farming.
The Organic Center Critical Issue Report Page
November 2010 A Dairy Farm’s Footprint 10
Assumptions Regarding Management Skill Levels
Numerous studies show that the quality of dairy farm management has an enormous impact on productivity, animal health and longevity, as well as the environmental performance of farms. A poorly managed organic farm will almost always have a deeper environmental footprint than an otherwise comparable, but well-managed conventional farm, and vice versa.
For this reason, we assume that the farms included in each scenario are equally well-managed. The farmers running such farms are comparably experienced and skilled at carrying out the routine tasks necessary to manage a dairy farm using the systems within each of the scenarios. The production and input parameter values used to characterize each of the four scenarios are based on typical conditions on equally well-managed farms.
Regional Diff erences
Dairy farm animal housing, milking parlors, feed rations, grazing, manure management, sources of environmental stress, and crop production systems vary greatly across the country. In future applications of the SOG calculator, the Center will develop and
share applications focusing on dairy farms within major production regions, allowing a closer match between the input parameter values in a scenario in SOG and an actual farm or group of farms.
In this application, our focus is typical average conditions on the conventional and organic farms across the country falling within the parameters set forth in each scenario. For this reason, many of the input parameter values will not correspond exactly with those typical in any given region. The team has drawn on its collective experience with organic dairy farms in all major production regions to produce typical, average values for all SOG input parameters that vary signifi cantly across the country, including rations and feed forms, grazing systems, and manure management.
In the two conventional scenarios, the team has relied on a number of USDA surveys reporting national average values for many aspects of dairy farm operations, management, production, animal health, and environmental performance. The 2007 survey of the dairy sector by the USDA’s National Animal Health Monitoring System (NAHMS, 2007a and 2007b) and the 2005 Agricultural Resources Management Survey (ARMS) of the dairy sector carried out by the Economic Research Service (ERS, 2006) have been particularly helpful in setting values across the four scenarios.
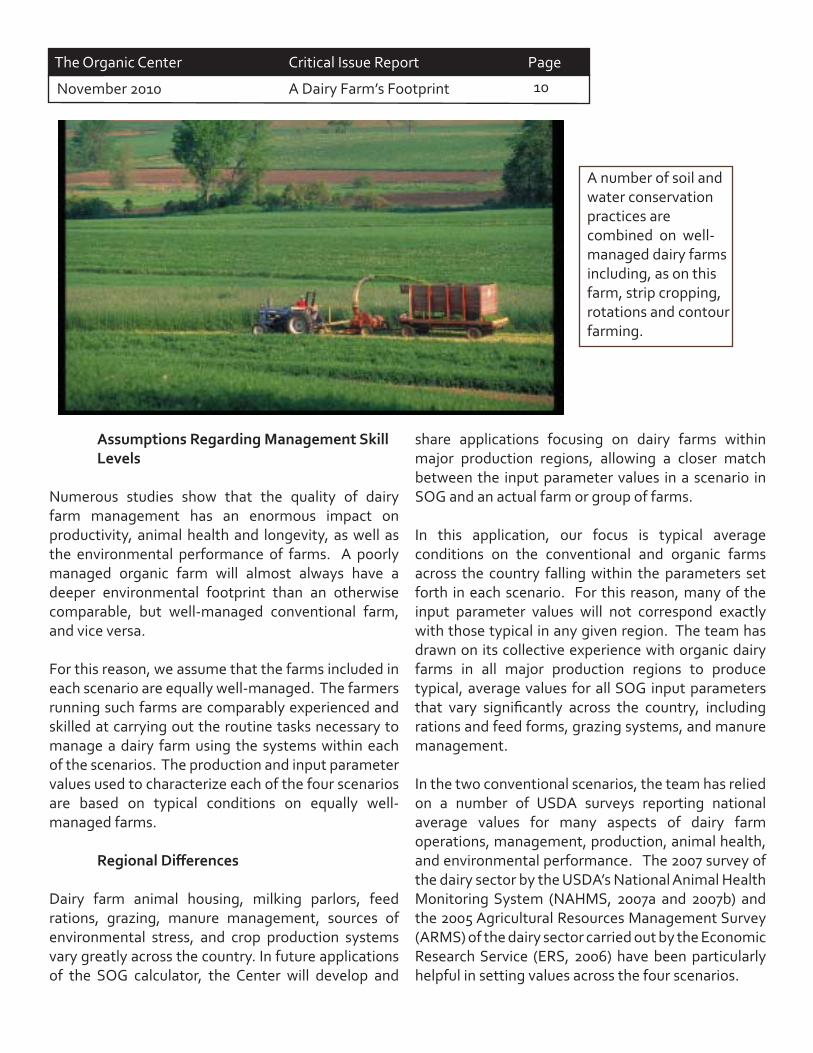
A number of soil and water conservation practices are combined on well-managed dairy farms including, as on this farm, strip cropping, rotations and contour farming.
The Organic Center Critical Issue Report Page November 2010 A Dairy Farm’s Footprint 11
A. Taking Account of Milk Nutritional Quality
Dairy farms generate two major sources of food and revenue for farmers – milk and meat. Alternative dairy management systems increase the production and revenue from one often at the expense of the other. For example, the dairy science literature has confi rmed in multiple studies that conventional farms that emphasis maximum daily milk production per cow produce more milk and less meat per lactating cow, compared to pasture-based farms that accept lower production as a price for superior cow health and longevity (Knaus, 2009). Results reported below quantify the magnitude of this tradeoff across the four sets of farms refl ected in the scenarios.
Milk production levels also drive milk quality in terms of protein, fat, and the concentration of other nutrients, especially the heart-healthy fatty acids omega 3 and conjugated linoleic acid (CLA). In general, the more pounds of milk produced in a day by a cow, the lower the concentrations of fat, protein, and CLA and omega 3s.
For this reason, milk from one farm is actually never the same as milk from other farms, as implied in the “milk is milk” marketing campaign. In fact, the nutrient content of milk, levels of somatic cells (a measure of the presence of bacterial cells from mastitis infections in the udder of cows), and pesticide and drug residues in milk vary considerably across farms, and even more greatly between organic and conventional farms.
There is, indeed, signifi cant room for improvement in both the nutritional quality and safety of milk produced on both organic and conventional farms. This report highlights some of the more promising options to do just that.
3. Milk and Meat Production, Quality and Gross Farm Income
Table 3.1 Unadjusted and Energy Corrected Milk (ECM) Production per Day and Milk Fat and Protein Levels Scenario 1 Scenario 2 Scenario 3 Scenario 4
Unadjusted Milk Production per day 75 65 60 50Milk Fat 3.5% 3.63% 3.8% 4.9%Milk Protein 3.0% 3.2% 3.3% 3.6%ECM Milk per day 73.9 66.1 62.7 60.4
In conducting research on diff erent dairy farm management systems, dairy scientists typically adjust milk production levels for fat and protein content, calculating what is called “Energy Corrected Milk” (ECM). The SOG calculator reports both unadjusted daily milk production, as well as daily ECM production. The equation used to calculate ECM from unadjusted milk production, fat and protein content is based on university recommendations (Washington State University Extension, 2008) and work by the National Research Council (Subcommittee on Dairy Cattle Nutrition, 2001). The equation appears in Appendix A.
The breed of dairy cow impacts milk production levels and nutritional quality. Holsteins were the breed of choice on 92% of dairy farms in 2007, while Jerseys accounted for 3.8% of operations (NAHMS, 2007a). Breeds other than Holstein, and cross-bred cows, are far more common on organic farms than conventional farms.
Jersey cows produce less milk per day than Holsteins, but their milk has higher fat and protein content, key milk quality attributes. The rations feed to lactating cows also can have a big impact on fat, protein, and fatty acid profi les. As a rule of thumb, the more grass and forage-based feeds in a dairy cow’s diet, the higher the levels of total fat and heart-healthy fatty acids including CLA and omega 3s.
The diff erences between unadjusted milk and ECM production per day are modest in the two conventional dairy farm scenarios, but are signifi cant in Scenarios 3 and 4, as evident in Table 3.1 below.
The Organic Center Critical Issue Report Page
November 2010 A Dairy Farm’s Footprint 12
Unadjusted milk production levels across the four scenarios – 75, 65, 60, and 50 pounds per day – are based on USDA and industry data and refl ect typical production levels on well-managed farms that share the characteristics defi ning each scenario.
The milk fat and protein levels in Scenarios 1 and 2 are based on USDA survey data and a recent summary of 2009 dairy income and production data in Hoard’s West, a widely read dairy magazine (Hoard’s Dairyman staff , 2010). The Holstein cows on the organic farms in Scenario 3 produce 8% less milk than the Holsteins on the conventional farm in Scenario 2 and are fed more forage-based feeds, leading to modestly higher projected fat and protein levels.
Jersey cows are known for their rich, high-fat milk. The average milk fat and protein levels in the milk from a subset of the pasture-based Jersey dairy farms shipping to Organic Valley were 4.9% and 3.6% respectively based on recent milk quality tests. These levels were used in Scenario 4.
ECM production in Scenario 4 is 60.4 pounds per day, 21% higher than the unadjusted milk production level of 50 pounds. The high-production cows in Scenario 1 produce 50% more unadjusted milk per day compared to the Jerseys in Scenario 4, but in terms of ECM, the diff erence is 22%.
These enormous diff erences between unadjusted and ECM production in Scenarios 1 and 4 drive home the importance of taking milk nutritional quality into account when assessing the productivity and environmental impacts of dairy farm management systems. For this reason, any study comparing impacts per unit of milk produced across dairy farms, whether conventional or organic, must take milk quality into account to avoid serious bias against farms raising breeds other than Holsteins or emphasizing the promotion of cow health via greater reliance on pasture and forage-based diets.
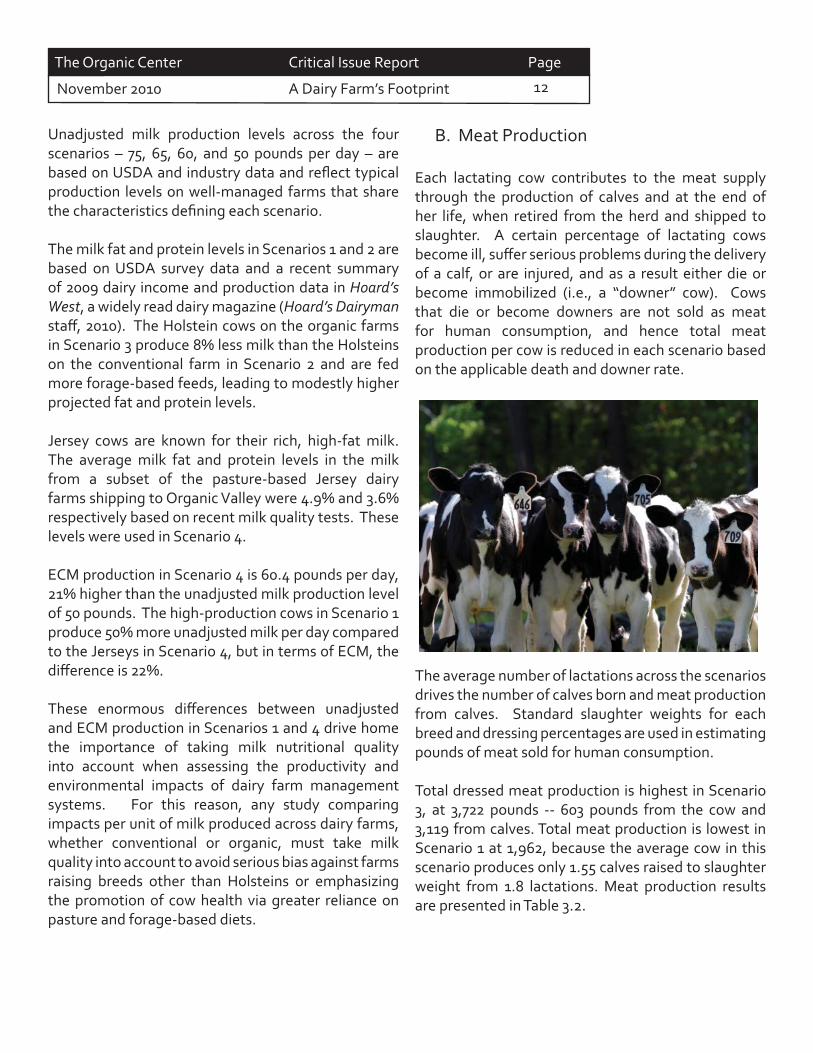
B. Meat Production
Each lactating cow contributes to the meat supply through the production of calves and at the end of her life, when retired from the herd and shipped to slaughter. A certain percentage of lactating cows become ill, suff er serious problems during the delivery of a calf, or are injured, and as a result either die or become immobilized (i.e., a “downer” cow). Cows that die or become downers are not sold as meat for human consumption, and hence total meat production per cow is reduced in each scenario based on the applicable death and downer rate.
The average number of lactations across the scenarios drives the number of calves born and meat production from calves. Standard slaughter weights for each breed and dressing percentages are used in estimating pounds of meat sold for human consumption.
Total dressed meat production is highest in Scenario 3, at 3,722 pounds -- 603 pounds from the cow and 3,119 from calves. Total meat production is lowest in Scenario 1 at 1,962, because the average cow in this scenario produces only 1.55 calves raised to slaughter weight from 1.8 lactations. Meat production results are presented in Table 3.2.
The Organic Center Critical Issue Report Page November 2010 A Dairy Farm’s Footprint 13
Table 3.2 Meat Production Associated with One Lactating Cow over Her Productive Life (see notes)Scenario 1 Scenario 2 Scenario 3 Scenario 4
COWLiveweight at Slaughter (pounds) 1,323 1,323 1,323 900Death and Downer Rate 9.2% 7.6% 5.0% 4.0%Dressing Percentage 48% 50% 48% 50%Pounds of Meat 576 611 603 432
CALFNumber of Calves 1.55 1.81 3.48 3.94Slaughter Weight (pounds) 1,543 1,543 1,543 992Dressing Percentage 58% 58% 58% 58%Pounds of Meat 1,386 1,624 3,119 2,268
Total Pounds of Meat 1,962 2,235 3,772 2,700Notes: A percentage of calves will be raised for replacement stock or for use as bulls for breeding, but these animals will eventually be sold for slaughter and enter the meat supply (except for those that die or become downers). SOG Version 1.1 does not project or address the feed, inputs, and wastes generated as calves are grown to adult weights. Average pounds of meat from lactating cows takes into account the death and downer rate.
C. Total Revenue from Meat and Milk Sales
Conventional farm-level milk prices vary over time and across the country and price swings are sometimes rapid and dramatic. In the survey of large commercial dairies published in Hoard’s West (September 25, 2010), the conventional milk price in 2009 was quoted as $11.81 per hundredweight in California, $12.89 in Texas, and $13.85 in the Upper Midwest. These historically low prices resulted in an average $655 loss per cow in 2009, according to Hoard’s West. Fortunately, for farmers, the conventional milk price has rebounded since, to a projected national average of $16.25 per hundredweight in 2010, as shown in the milk price table below. Over the last fi ve years, the conventional
pay price has varied by up to $7.00, from a low of $12.81 in 2009 to a peak in 2007 at $19.21. In light of this temporal price volatility, average fi ve-year milk prices per hundredweight are used in this application of SOG to project gross revenue from the sale of milk.
Organic milk pay prices vary much less dramatically than conventional prices because they are typically set in long-term contracts between farmers and milk processors. Table 3.3 includes organic pay price data for three major
organic milk processors that collectively account for around three-quarters of national organic milk
production. Over the last fi ve years, organic pay prices have averaged $26.82 per hundredweight, resulting in an average $10.98 premium over the conventional pay price. Costs on organic farms are also higher, of course, because of the added expenses in growing or buying certifi ed organic feed.
The Organic Center Critical Issue Report Page
November 2010 A Dairy Farm’s Footprint 14
Table 3.3 Conventional and Organic Farm-level Milk Prices Over the Last Five Years (see notes)2006 2007 2008 2009 2010 Five Year
AverageConventional Milk Price $12.99 $19.21 $18.41 $12.81 $16.25 $15.93
Organic Pay Prices HP Hood $26.00 $26.00 $27.40 $27.30 $27.30 $26.80Horizon Organic $26.00 $26.00 $27.50 $27.00 $27.00 $26.70Organic Valley $26.00 $26.00 $28.25 $27.25 $27.25 $26.95Average Three Organic Processors $26.82Notes: Conventional milk prices for 2006-2009 from the Economic Research Service, U.S. milk production costs and returns per hundredweight sold, 2005-2009.” Projected national milk price for 2010 from “Dairy Forecasts,” World Agricultural Supply and Demand Estimates, USDA. Organic processor pay price data for 2006-2009 from Ed Maltby, “Pay Price and Organic Milk Market in August 2010,” NODPA, http://www.nodpa.com/payprice_update_090610.shtml. Organic prices for 2010 assumed to equal prices in 2009.
D. Gross Revenue
Gross milk revenue in each scenario is total unadjusted milk production, less milk that is diverted from the human food supply, multiplied by the average pay prices shown in Table 3.3.
Milk is diverted from the human food supply for several reasons. A worksheet in SOG Step 4 provides users a place to enter data on the number of days during a typical lactation that milk is diverted in each scenario. Common reasons for milk diversion are:
• Providing colostrum to calves, • Feeding organic milk through weaning to heifer calves being raised as replacements on organic farms,• Milk withdrawal periods on conventional farms required as part of drug treatment,• High somatic cell counts (SCC), or • Diversion of loads of milk because of unacceptable residues or SSC counts.
The total number of days of diverted milk across the four scenarios range from a high of 14.5 in Scenario 1 to 7.4 in Scenario 4. Diversions related to mastitis and related drug use on conventional dairy farms account for most of the diff erence between the conventional
and organic scenarios (see Appendix A for the days of diverted milk worksheet).
Average prices paid for meat from cull dairy cows are used in Step 5 to project the revenue from lactating cow meat sales using the pounds of meat data in Table 3.2.
In Step 5, users must choose between two ways to project revenue from calf sales – selling the meat from fully grown animals, or selling calves at weaning. In this application, we assume that farmers sell calves at weaning. Heifer calves retained on the farm to be raised as replacements are credited in the revenue projection with the same value as a heifer calf that is sold.
Gross farm income from milk, meat, and calf sales are shown in Table 3.4 over a cow’s lifetime and per year of life across the four scenarios. Lifetime income and income per year of a cow’s life is highest in Scenario 3, because of higher prices and the relatively high levels of milk and calf production on this Holstein-based organic farm. The conventional farm in Scenario 2 shares several characteristics with the organic farm in Scenario 3, yet earns only 53% as much per year of a cow’s life. The average organic Holstein cow in Scenario 3 earns over her life-time 2.4-times more than the average Holstein in Scenario 2.
The Organic Center Critical Issue Report Page November 2010 A Dairy Farm’s Footprint 15
Despite the markedly lower unadjusted milk production level on the forage-based Jersey organic farm in Scenario 4, these farms produce more than twice the income per Holstein cow in Scenarios 1 and
2, and 50% more per year of life. Increased revenue from milk sales in Scenario 4 accounts for most of the diff erence, as evident in Table 3.4.
Table 3.4 Gross Revenue from Milk, Meat and Calf Sales (see notes)Scenario 1 Scenario 2 Scenario 3 Scenario 4
Unadjusted Milk SalesLifetime $8,506 $8,323 $20,891 $18,331Per Year of Life $1,900 $1,765 $3,345 $2,843
Meat Sales
Lifetime $554 $555 $667 $449Per Year of Life $124 $118 $107 $70
Calf SalesLifetime $227 $266 $511 $578Per Year of Life $51 $56 $82 $90
Total RevenueLifetime $9,287 $9,144 $22,069 $19,358Per Year of Life $2,075 $1,939 $3,533 $3,002
Notes: Milk diverted from sale to feed calves, comply with drug label withdrawal times, prevent drug residues from getting into milk, or in response to high somatic cell counts is not included in the calculation of revenue. Revenue from calves is based on sale at weaning.
The Organic Center Critical Issue Report Page
November 2010 A Dairy Farm’s Footprint 16
4. Cow Health and Longevity
The longevity of dairy cows can have a major impact on their environmental footprint because farmers must invest two years of feed into dairy animals, and the animals generate two years worth of manure and methane, before the fi rst gallon of milk is produced upon birth of a freshening heifer’s fi rst calf at about 25 months old.
The health and body condition of lactating dairy cows is the dominant factor determining how long cows remain productive. A cow’s udder, and her legs and feet are especially vulnerable to infections and gradual breakdown. Certain time periods in the annual cycle of breeding, the birth of calves, early lactation, and dry off pose unique cow health management challenges. The risk of metabolic problems peaks as milk production rises rapidly in the early stages of a lactation, and there is heightened mastitis risk in the beginning of the dry off period.
Factors that tend to push average daily milk production upward also increase the risk of declining body condition. Good managers that properly balance cow rations and reliably meet the nutritional needs of all lactating cows on a daily basis can sustain cow health even at high levels of production, but the margins for error are thin and the farmer’s degree of control over feed intakes generally declines with farm size.
Cows successfully pushed to produce near their maximum genetic potential are subject to multiple sources of stress, increasing the frequency and severity of health and reproductive problems. While increasing average daily milk production reduces the environmental impact of each pound of milk produced, other things being equal, the successful pursuit of relatively high milk production leaves nearly nothing equal in terms of milk quality, safety, and cow health and longevity.
The Organic Center Critical Issue Report Page November 2010 A Dairy Farm’s Footprint 17
Step 4 in the SOG calculator addresses the impact of dairy management systems on cow health, reproduction, and longevity. The factors addressed in Step 4 are ignored in virtually all recently published assessments of the environmental footprint of dairy production systems. This omission is another source of systemic bias in past studies.
Failure to take cow health and longevity into account skews results in favor of high-production systems relative to systems -- conventional or organic -- that place a premium on sustaining cow health. On farms where cows live longer, the signifi cant investment of feed, and the volumes of wastes generated prior to the birth of a fi rst calf, are amortized over more lactations and longer time periods, and hence lower the cow’s environmental footprint per unit of milk produced over her lifetime and per year of life. Moreover, the factors leading to longer productive lives for lactating cows also tend to improve milk quality, which also lightens a dairy farm’s environmental footprint per gallon of energy corrected milk produced.
A. Reproductive Performance
The ideal length of lactation on a dairy farm has historically been 305 days. When coupled with a traditional dry off period of 60 days, each cow has one calf and milks for 305 days in any given year. For decades now, however, the average length of lactations has been increasing, especially on large-scale, high-production farms. Some such farms milk cows for 400 or more days on average, with some lactations running twice the historic norm (600+ days). Such long lactations are caused by multiple, unsuccessful breeding attempts.
A recent survey of 103 high-production operations reported that farmers stopped trying to rebreed cows after an average 8.8 failed breeding attempts (Caraviello et al., 2006). Each such failed attempt would add
30-40 or more days to lactations that would otherwise run 300-plus days. Cows that fail to rebreed and experience long lactations are almost always destined for slaughter once their milk production level drops below a given farm’s production and profi t thresholds.
Recurring reproductive problems are one clear sign of metabolic stress on high-production dairy farms (Lucy, 2001). As cows are reaching their maximum daily milk production in a new lactation, they go into a period of negative energy balance, when food energy consumed each day fails to cover their metabolic needs (Smith et al., 2000). As a result, the animals are forced to burn stored fat and their body condition gradually declines. Irregular and weak estrus (heat) cycles, problems conceiving, and embryo loss are among the predictable consequence of negative energy balance.
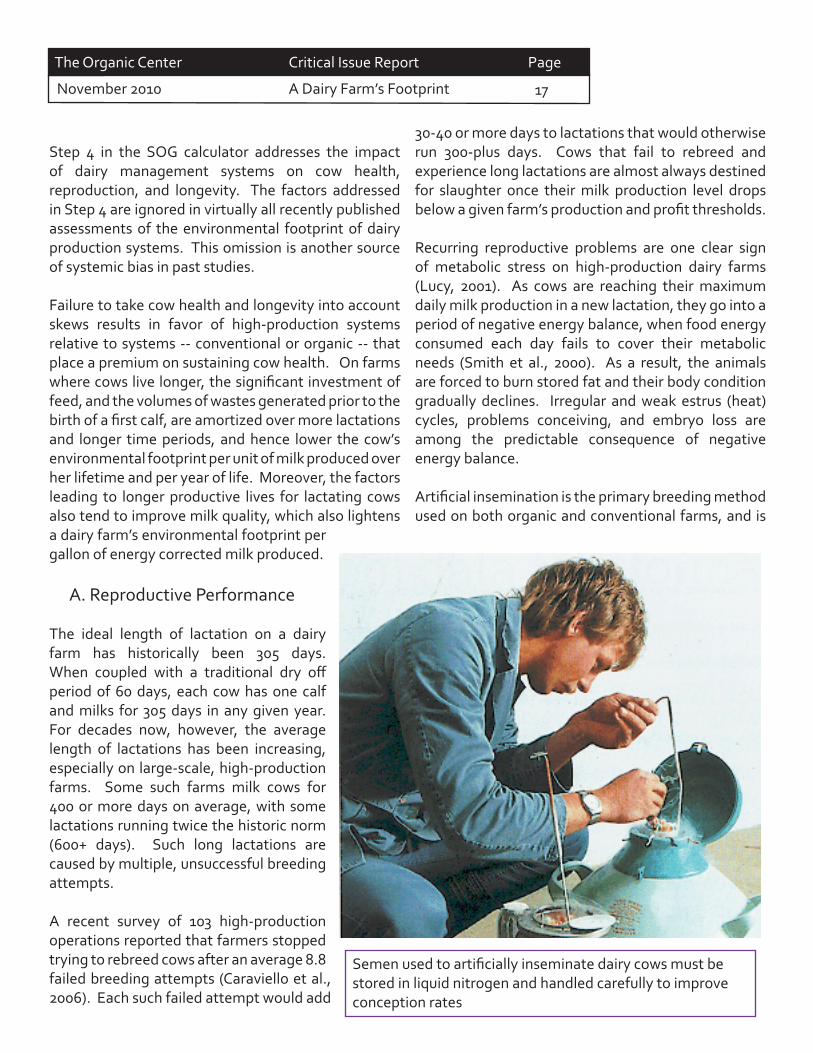
Artifi cial insemination is the primary breeding method used on both organic and conventional farms, and is
Semen used to artifi cially inseminate dairy cows must be stored in liquid nitrogen and handled carefully to improve conception rates
The Organic Center Critical Issue Report Page
November 2010 A Dairy Farm’s Footprint 18
the method of breeding assumed in each of the four scenarios. In Scenario 1, it is further assumed that artifi cial insemination is used in conjunction with hormone injections intended to synchronize estrus cycles (Fricke, undated).
The length in days of the average calving interval (CI) is the key indicator of the success of reproductive programs on dairy farms. CI is simply the length of lactation in days, plus the average dry-off period, which is assumed to be 57.8 days in all four scenarios. Gestation periods and the number of days into a lactation when dairy farmers fi rst start attempting to rebreed cows that have recently calved are two other factors determining the average length of lactations. These factors do not change much across dairy farms and are set at the same levels across the four scenarios.
The conception rate following a breeding attempt is a key factor driving diff erences in the length of lactations. Two other critical factors come into play in determining whether a successful conception results
in the birth of a calf and the beginning of a milking cycle. A certain portion of successful conceptions end between 1 and 40 days post-conception as a result of embryonic loss (Moore, undated).
In addition, some portion of conceptions that remain viable past 40 days are lost to spontaneous abortions between days 41 and 260 (Santos et al., 2004). Both embryonic loss and spontaneous abortions require farmers to rebreed cows and markedly increase the average length of lactations. Artificial insemination in conjunction with hormone-based synchronization programs increases the frequency of embryonic losses and spontaneous abortions (El-Zarkouny et al., 2004).
The impact of conception rate, the average number of breeding attempts per conception that goes to term, and embryonic losses and spontaneous abortions on the average length of lactations is calculated in Step 4 in each scenario. The average time between breeding attempts is another key variable that must be estimated in order to calculate the impact of reproductive outcomes on the average length of lactation.
In the case of failed breeding attempts, cows are typically rebred in 35-50 days on average, but in the case of embryonic loss, the time elapsed before a rebreeding is 10-40 days longer, depending on when the embryonic loss occurs and how soon the farmer recognizes that the cow is open. Much longer time periods between breeding attempts occur in the event of spontaneous abortions; 100 days is the projected average time period between breeding attempts in the event of spontaneous abortions in all four scenarios.The average number of days between breeding
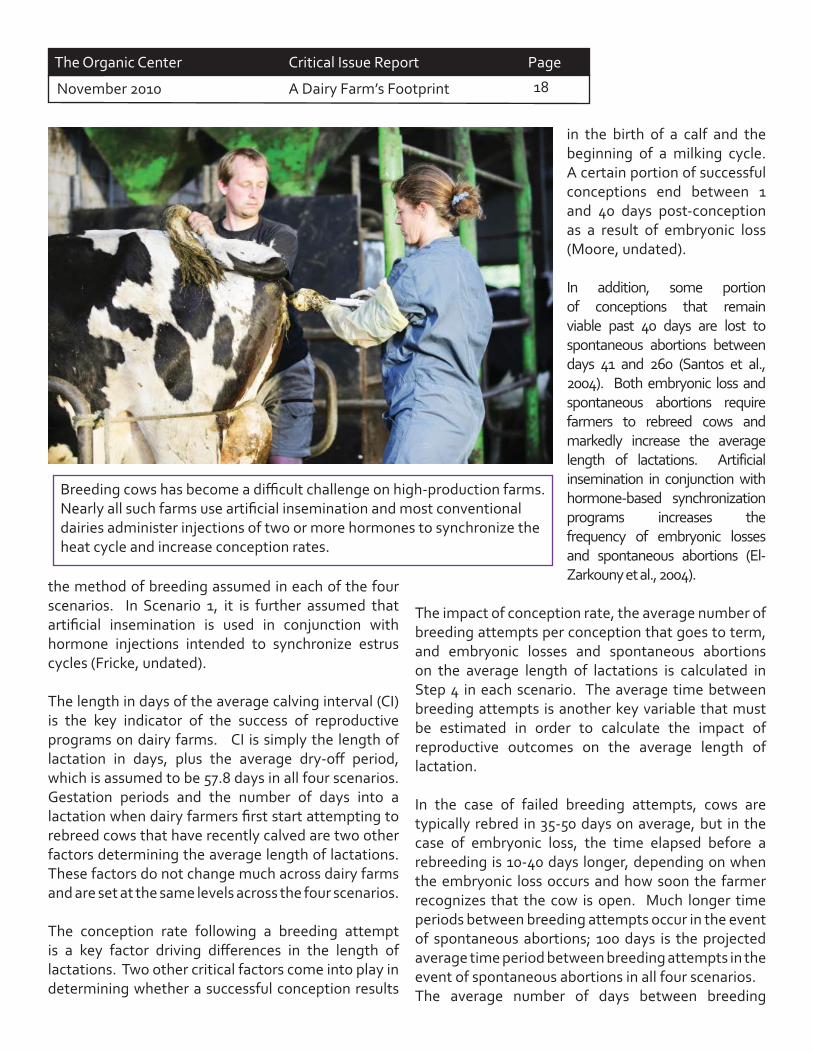
Breeding cows has become a diffi cult challenge on high-production farms. Nearly all such farms use artifi cial insemination and most conventional dairies administer injections of two or more hormones to synchronize the heat cycle and increase conception rates.
The Organic Center Critical Issue Report Page November 2010 A Dairy Farm’s Footprint 19
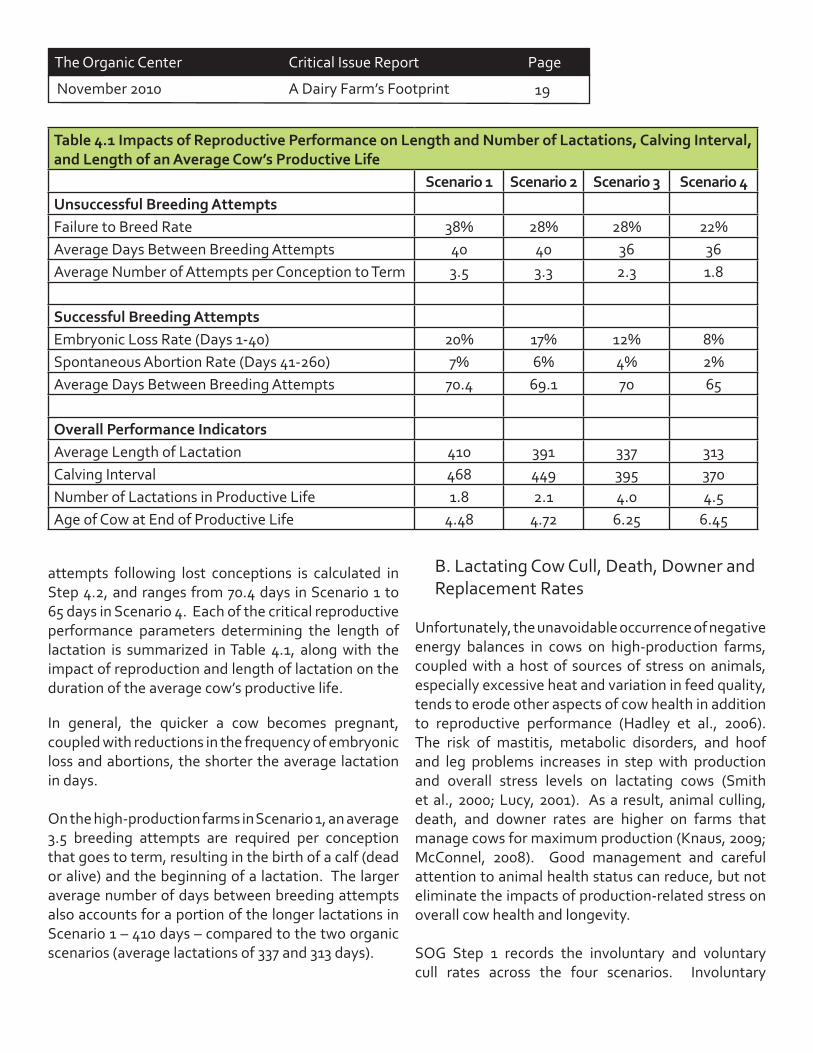
Table 4.1 Impacts of Reproductive Performance on Length and Number of Lactations, Calving Interval, and Length of an Average Cow’s Productive Life
Scenario 1 Scenario 2 Scenario 3 Scenario 4Unsuccessful Breeding AttemptsFailure to Breed Rate 38% 28% 28% 22%Average Days Between Breeding Attempts 40 40 36 36Average Number of Attempts per Conception to Term 3.5 3.3 2.3 1.8
Successful Breeding AttemptsEmbryonic Loss Rate (Days 1-40) 20% 17% 12% 8%Spontaneous Abortion Rate (Days 41-260) 7% 6% 4% 2%Average Days Between Breeding Attempts 70.4 69.1 70 65
Overall Performance IndicatorsAverage Length of Lactation 410 391 337 313Calving Interval 468 449 395 370Number of Lactations in Productive Life 1.8 2.1 4.0 4.5Age of Cow at End of Productive Life 4.48 4.72 6.25 6.45
In general, the quicker a cow becomes pregnant, coupled with reductions in the frequency of embryonic loss and abortions, the shorter the average lactation in days. On the high-production farms in Scenario 1, an average 3.5 breeding attempts are required per conception that goes to term, resulting in the birth of a calf (dead or alive) and the beginning of a lactation. The larger average number of days between breeding attempts also accounts for a portion of the longer lactations in Scenario 1 – 410 days – compared to the two organic scenarios (average lactations of 337 and 313 days).
attempts following lost conceptions is calculated in Step 4.2, and ranges from 70.4 days in Scenario 1 to 65 days in Scenario 4. Each of the critical reproductive performance parameters determining the length of lactation is summarized in Table 4.1, along with the impact of reproduction and length of lactation on the duration of the average cow’s productive life.
B. Lactating Cow Cull, Death, Downer and Replacement Rates
Unfortunately, the unavoidable occurrence of negative energy balances in cows on high-production farms, coupled with a host of sources of stress on animals, especially excessive heat and variation in feed quality, tends to erode other aspects of cow health in addition to reproductive performance (Hadley et al., 2006). The risk of mastitis, metabolic disorders, and hoof and leg problems increases in step with production and overall stress levels on lactating cows (Smith et al., 2000; Lucy, 2001). As a result, animal culling, death, and downer rates are higher on farms that manage cows for maximum production (Knaus, 2009; McConnel, 2008). Good management and careful attention to animal health status can reduce, but not eliminate the impacts of production-related stress on overall cow health and longevity.
SOG Step 1 records the involuntary and voluntary cull rates across the four scenarios. Involuntary
The Organic Center Critical Issue Report Page
November 2010 A Dairy Farm’s Footprint 20
culling is triggered by cow health problems or falling production, and results in a decision to ship a cow from the milking herd to slaughter.
Voluntary culling is done to open up a space in a milking herd for a younger animal with preferred genetics, or as a part of a switch from one breed to another, or to reduce the size of a milking herd. A worksheet in Step 2 of SOG provides users a place to record the percent of cows culled for diff erent reasons. Average involuntary and voluntary cull rates are estimated, and transferred from the Step 2 worksheet to Step 1, where the herd profi le is specifi ed across the four scenarios. Cull and death rates, in turn, drive the calculation in Step 1 of the number of replacements needed annually to sustain a milking herd with a stable number of lactating cows.
Likewise, there is a detailed worksheet in SOG Step 2 where the causes and frequency of death or immobilization among lactating cows are recorded in each of the scenarios. A cow that becomes immobilized on the farm is typically referred to as a downer cow, and like cows that die on a farm, they must be sold for rendering and hence do not enter the human food supply.
Each lactating cow that leaves a steady-state herd must be replaced with a newly freshening cow that
can come from the heifers raised on the farm or purchased from outside the farm. The total number of replacements needed per year is another key indicator of cow health and longevity. In general, the healthier cows are on a given farm, the longer they live, and the lower the annual replacement rate.
Table 4.2 summarizes these rates, all of which are reported as a percent of one lactating cow in a given herd, or across a given set of farms. Total cull rates are highest in Scenario 1 at 37%, based on involuntary cull rates of 32% and voluntary cull rates of 5%. The total cull rate drops to 25% and 21% in Scenarios 3 and 4 as a result of less stress on lactating cows, a more natural diet, improved reproductive performance, and fewer serious health problems.
The death and downer cow rate of 9.2% in Scenario 1 is about twice as high as the rate on in the two organic farm scenarios. The rates in Scenario 1 and 2 are moderately above the national average of 5.7% as reported in a 2007 NAHMS survey, and in Scenarios 3 and 4, are modestly below the national average rate as a result of the lower levels of stress on cows on well-managed organic farms.
The replacement rate combines the total cull rate and death and downer cow rate, and ranges from 46.2%
Table 4.2 Lactating Cow Culling, Death and Downer, and Replacement Rates as a Percent of One Lactating Cow
Scenario 1 Scenario 2 Scenario 3 Scenario 4Involuntary Culling 32% 27% 20% 15%Voluntary Culling 5% 4.5% 5% 6%
Total Cull Rates 37% 32% 25% 21%
Death and Downer Rate 9.2% 7.6% 5% 4%
Total Replacements Needed 46.2% 39.1% 30% 25%
The Organic Center Critical Issue Report Page November 2010 A Dairy Farm’s Footprint 21
in Scenario 1 to 25% in Scenario 4. The 46.2% rate in Scenario 1 is well below the average 57% turnover rate reported for High Plains dairies in the Hoard’s West story on dairy profi tability in 2009, and is close to the rate reported for many high-production dairy farms, including the award winning herd of 151 Holsteins cows on a Michigan State University (MSU) farm. This farm was honored for low somatic cell counts (SCC) by Hoards Dairyman, in the article “Low numbers add up to top quality milk” (January 10, 2010 issue).
The low average SCC in the MSU herd was achieved in part by culling cows with mastitis, given the 45.7%
replacement rate reported in the Hoards Dairyman story. DHI records show that many large-scale, high-production herds have replacement rates well over 50% and some farms have rates as high as 60% (e.g., CA Farm # 1 in the fi gure below). High replacement rates are often driven by the need to cull cows with recurrent problems with mastitis that lead to relatively high somatic cell counts, a milk safety factor that can seriously jeopardize income from milk sales. Figure 4.1 compares these replacement rates graphically. See also the information provided in the dairy farm sale fl yer shown on the next page.
0
10
20
30
40
50
60
MSU High Plains
The Organic Center Critical Issue Report Page
November 2010 A Dairy Farm’s Footprint 22
Heavy culling of older cows with chronic mastitis is a common strategy on conventional farms to reduce average somatic cell counts (SCC). The fl yer for a recent farm auction states that the herd’s SCC is well below average for either conventional or organic farms, at 200,000 and that the “Herd has been culled hard most are First or 2nd Calf.” The average daily milk production of 65 pounds per day is the same as in Scenario 2.
In addition, USDA data point to a 48.4% replacement rate in 2009, since there were 4.4 million dairy heifers
over 500 pounds being raised as replacements for the milking cow herd of 9.1 million (USDA-NASS Quick Stats, Cattle and Calves, accessed 10/10/2010).
The Organic Center Critical Issue Report Page November 2010 A Dairy Farm’s Footprint 23
Dairy farm operations impact the environment through the management and disposal of manure, the emission and sequestration of greenhouse gases, especially methane and nitrous oxide, and through the impacts of feed crop production including soil erosion and energy, fertilizer, and pesticide use. Most of these impacts occur exclusively on or near the farm, while others, like feed production or the raising of replacement heifers, might occur hundreds or thousands of miles away.
Numerous studies, however, conclude that methane emissions, manure management, nutrient runoff , and nitrous oxide losses from fi eld crop production account for most of a dairy farms environmental
footprint. The footprint of a given farm is composed of three clusters of impacts on:
• Air quality and the atmosphere via net greenhouse gas (GHG) emissions, and the loss of ammonia and nitrogen in any of several chemical forms from the soil, livestock housing, and manure management,• Water quality and aquatic ecosystems as a
result of erosion and runoff containing fertilizer nutrients, pesticides, animal drugs, and pathogens, and
• Soil and terrestrial ecosystems and water quality from cropping practices, fertilizer and pesticide applications, and manure management.
5. Environmental Impacts of Dairy Production
Runoff from this dairy farm operation may enter nearby streams and degrade water quality, particularly after a heavy rainfall. Photo courtesy of USDA NRCS.
The Organic Center Critical Issue Report Page
November 2010 A Dairy Farm’s Footprint 24
SOG Version 1.1 projects methane losses from animal respiration and digestion, as well as from manure. Modules covering nitrous oxide and CO2 losses are under development and will be incorporated in a future version of SOG, allowing estimation of total Global Warming Potential. Water quality and terrestrial impacts from synthetic pesticide and fertilizer use are not estimated, although the pounds of these inputs required to grow feed for a lactating cow and her supporting animals are calculated and reported.
SOG does not project soil erosion rates. In general, dairy farming, and especially organic and other forage-based dairy operations, is not a signifi cant contributor to national or regional soil loss because of reliance on pasture and forage crops that dramatically reduce average erosion rates in most farming systems. Clearly, some dairy farmers grow corn and soybeans on highly erodible land, but they typically do so in rotation with forage crops, reducing erosion to average rates well below those associated with specialized grain farms.
A. Land Use
Steps within the SOG calculator project the Dry Matter Intake (DMI) needed per day to support daily milk production per cow within each of the four scenarios. The estimates of DMI needed per day are derived from the Cornell-Pennsylvania-Minor dairy nutrition model (CPM-Dairy; Chalupa et al., 2004) and
are based on the percent of daily DMI provided by 11 forage, grain, and supplement feed options in SOG. The amounts of DMI across the 11 feeds are converted to the number of acres that need to be harvested to feed a lactating cow and her supporting population, taking into account harvest and storage losses, and average waste during feeding.
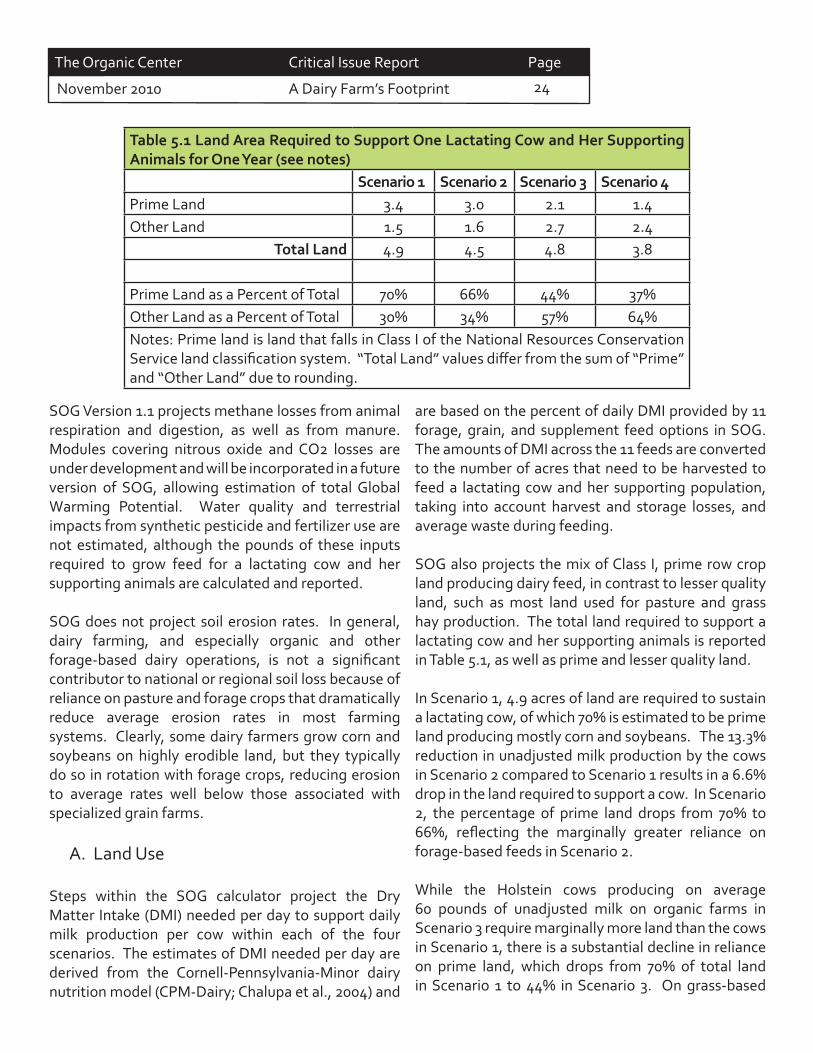
SOG also projects the mix of Class I, prime row crop land producing dairy feed, in contrast to lesser quality land, such as most land used for pasture and grass hay production. The total land required to support a lactating cow and her supporting animals is reported in Table 5.1, as well as prime and lesser quality land. In Scenario 1, 4.9 acres of land are required to sustain a lactating cow, of which 70% is estimated to be prime land producing mostly corn and soybeans. The 13.3% reduction in unadjusted milk production by the cows in Scenario 2 compared to Scenario 1 results in a 6.6% drop in the land required to support a cow. In Scenario 2, the percentage of prime land drops from 70% to 66%, refl ecting the marginally greater reliance on forage-based feeds in Scenario 2.
While the Holstein cows producing on average 60 pounds of unadjusted milk on organic farms in Scenario 3 require marginally more land than the cows in Scenario 1, there is a substantial decline in reliance on prime land, which drops from 70% of total land in Scenario 1 to 44% in Scenario 3. On grass-based
Table 5.1 Land Area Required to Support One Lactating Cow and Her Supporting Animals for One Year (see notes)
Scenario 1 Scenario 2 Scenario 3 Scenario 4Prime Land 3.4 3.0 2.1 1.4Other Land 1.5 1.6 2.7 2.4
Total Land 4.9 4.5 4.8 3.8
Prime Land as a Percent of Total 70% 66% 44% 37%Other Land as a Percent of Total 30% 34% 57% 64%Notes: Prime land is land that falls in Class I of the National Resources Conservation Service land classifi cation system. “Total Land” values diff er from the sum of “Prime” and “Other Land” due to rounding.
The Organic Center Critical Issue Report Page November 2010 A Dairy Farm’s Footprint 25
Jersey farms like those modeled in Scenario 4, less land is required to sustain one lactating cow because the animals are smaller and milk production levels are lower. Plus, only 1.4 acres of prime land are needed to sustain one lactating Jersey cow on a grass-based organic farm, in contrast to 3.4 acres to sustain a high-production Holstein in Scenario 1.
Crops and pasture subject to average annual soil erosion rates of generally less than 0.2 tons per acre account for almost two-thirds of the land required to support a Jersey cow in Scenario 4, but for less than one-third of the land sustaining high-production Holsteins in Scenarios 1 and 2. Corn and soybean cropland acreage contributes two to three tons of erosion per acre on average, even when grown on relatively fl at, prime land. Accordingly, total soil erosion associated with Scenarios 1 and 2 is likely greater than Scenario 3, and several times the rate typical on grass-based dairy farms like those modeled in Scenario 4.
B. Synthetic Chemical Use
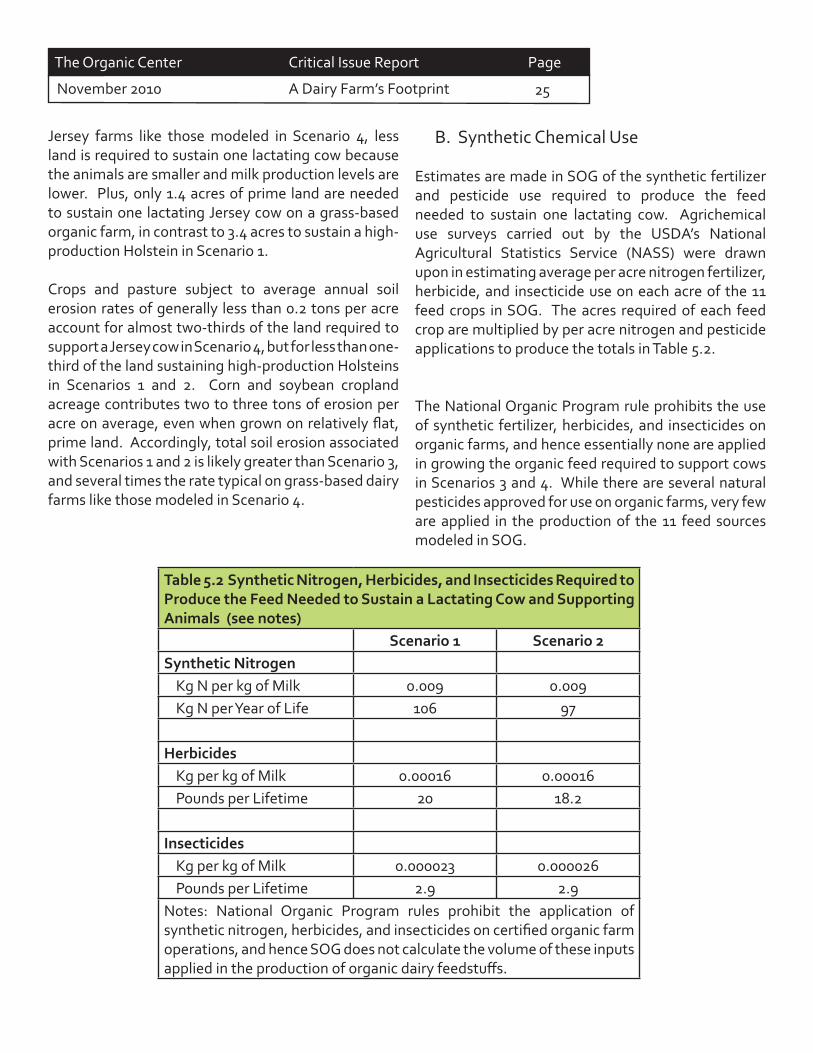
Estimates are made in SOG of the synthetic fertilizer and pesticide use required to produce the feed needed to sustain one lactating cow. Agrichemical use surveys carried out by the USDA’s National Agricultural Statistics Service (NASS) were drawn upon in estimating average per acre nitrogen fertilizer, herbicide, and insecticide use on each acre of the 11 feed crops in SOG. The acres required of each feed crop are multiplied by per acre nitrogen and pesticide applications to produce the totals in Table 5.2.
The National Organic Program rule prohibits the use of synthetic fertilizer, herbicides, and insecticides on organic farms, and hence essentially none are applied in growing the organic feed required to support cows in Scenarios 3 and 4. While there are several natural pesticides approved for use on organic farms, very few are applied in the production of the 11 feed sources modeled in SOG.
Table 5.2 Synthetic Nitrogen, Herbicides, and Insecticides Required to Produce the Feed Needed to Sustain a Lactating Cow and Supporting Animals (see notes)
Scenario 1 Scenario 2Synthetic Nitrogen
Kg N per kg of Milk 0.009 0.009Kg N per Year of Life 106 97
HerbicidesKg per kg of Milk 0.00016 0.00016Pounds per Lifetime 20 18.2
InsecticidesKg per kg of Milk 0.000023 0.000026Pounds per Lifetime 2.9 2.9
Notes: National Organic Program rules prohibit the application of synthetic nitrogen, herbicides, and insecticides on certifi ed organic farm operations, and hence SOG does not calculate the volume of these inputs applied in the production of organic dairy feedstuff s.
The Organic Center Critical Issue Report Page
November 2010 A Dairy Farm’s Footprint 26
While organic farmers do not apply synthetic sources of nitrogen, other steps are essential in order to meet the nitrogen needs of their crops. Soil fertility management practices on organic farms include crop rotations, the planting of legumes and cover crops, applications of compost and animal manure, and various organically approved fertilizers that are usually manufactured from animal wastes, minerals, and other sources of organic wastes (Committee on 21st Century Systems Agriculture, 2010).
All sources of nitrogen must be carefully managed on organic farms to assure that the amount of nitrogen available in the soil at any one time meets, but does not greatly exceed crop needs. Organic crop farmers, especially those growing nitrogen-hungry crops like
corn, face many more challenges than conventional farmers in meeting and synchronizing nitrogen supplies to crop needs, but they also deploy a far more diverse set of practices and tools in accomplishing this critical goal.
C. Wastes Generated
There are only modest diff erences across the three Holstein-cow based scenarios in the amount of manure generated by lactating cows, as well as in the excretions of nitrogen, phosphorous, and potassium. Both manure and nutrient excretions are lower in Scenario 4, largely because of the smaller size of Jersey cows, their lower level of milk production, and their need for less DMI per day.
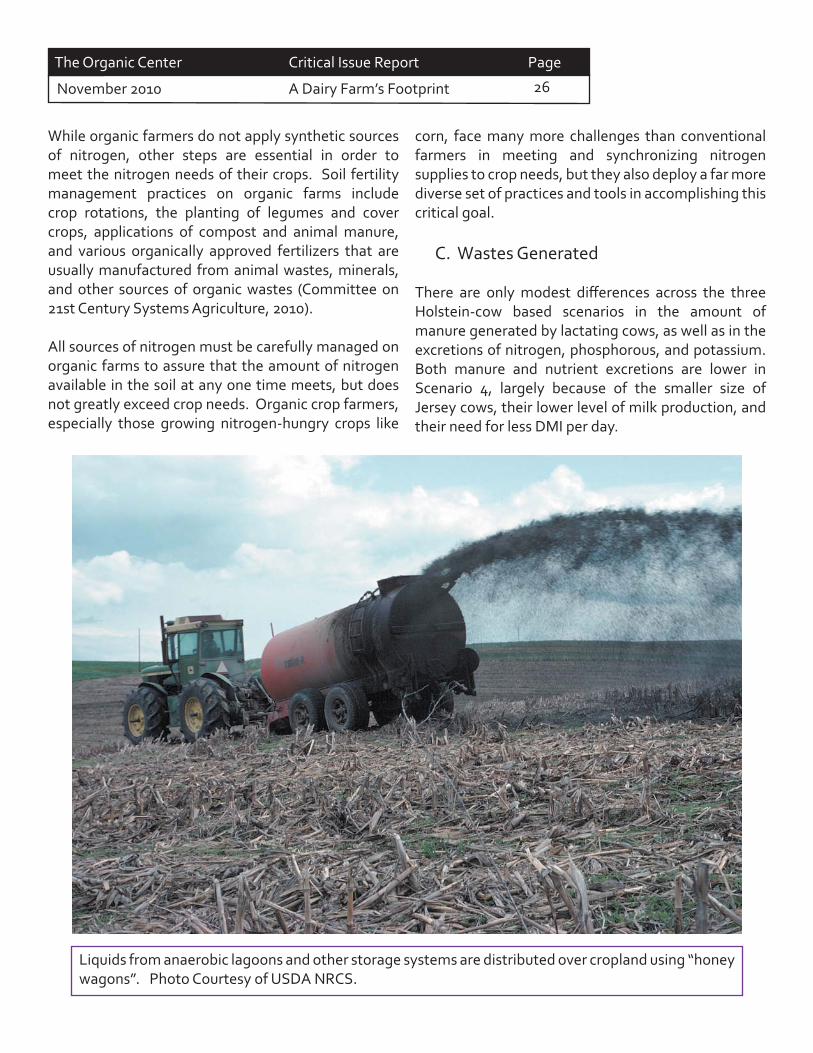
Liquids from anaerobic lagoons and other storage systems are distributed over cropland using “honey wagons”. Photo Courtesy of USDA NRCS.
The Organic Center Critical Issue Report Page November 2010 A Dairy Farm’s Footprint 27
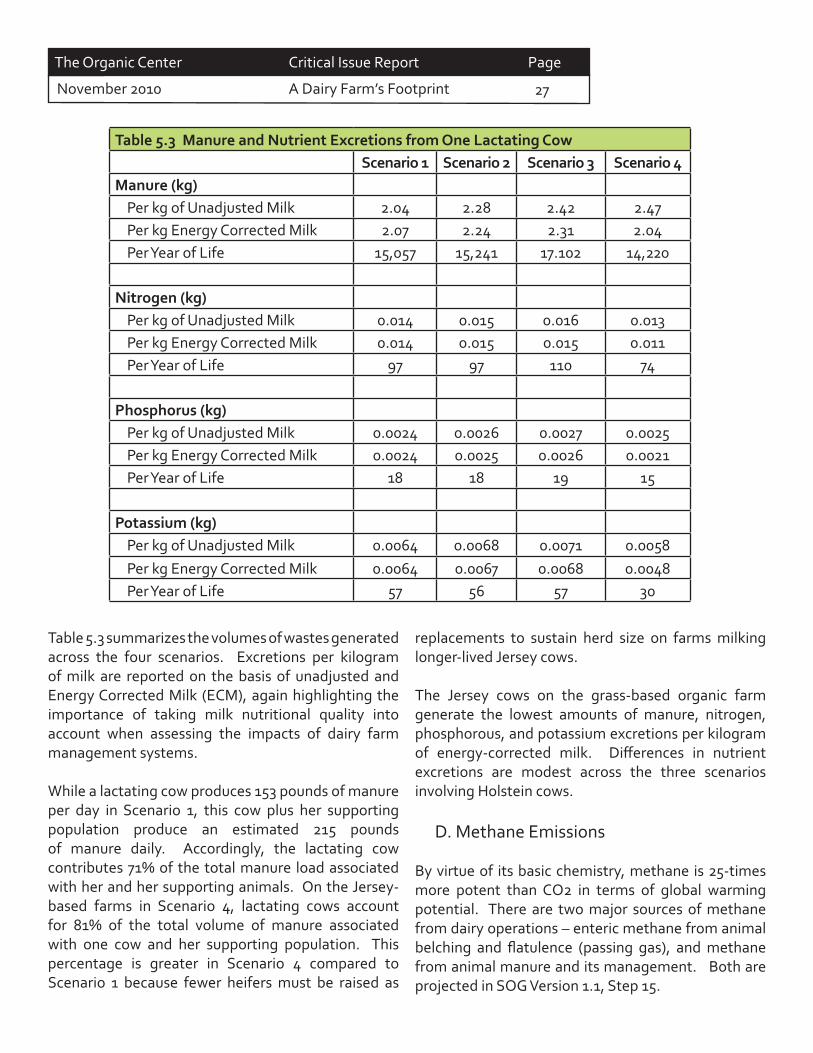
Table 5.3 summarizes the volumes of wastes generated across the four scenarios. Excretions per kilogram of milk are reported on the basis of unadjusted and Energy Corrected Milk (ECM), again highlighting the importance of taking milk nutritional quality into account when assessing the impacts of dairy farm management systems.
While a lactating cow produces 153 pounds of manure per day in Scenario 1, this cow plus her supporting population produce an estimated 215 pounds of manure daily. Accordingly, the lactating cow contributes 71% of the total manure load associated with her and her supporting animals. On the Jersey-based farms in Scenario 4, lactating cows account for 81% of the total volume of manure associated with one cow and her supporting population. This percentage is greater in Scenario 4 compared to Scenario 1 because fewer heifers must be raised as
replacements to sustain herd size on farms milking longer-lived Jersey cows.
The Jersey cows on the grass-based organic farm generate the lowest amounts of manure, nitrogen, phosphorous, and potassium excretions per kilogram of energy-corrected milk. Diff erences in nutrient excretions are modest across the three scenarios involving Holstein cows.
D. Methane Emissions
By virtue of its basic chemistry, methane is 25-times more potent than CO2 in terms of global warming potential. There are two major sources of methane from dairy operations – enteric methane from animal belching and fl atulence (passing gas), and methane from animal manure and its management. Both are projected in SOG Version 1.1, Step 15.
Table 5.3 Manure and Nutrient Excretions from One Lactating CowScenario 1 Scenario 2 Scenario 3 Scenario 4
Manure (kg)Per kg of Unadjusted Milk 2.04 2.28 2.42 2.47Per kg Energy Corrected Milk 2.07 2.24 2.31 2.04Per Year of Life 15,057 15,241 17.102 14,220
Nitrogen (kg)Per kg of Unadjusted Milk 0.014 0.015 0.016 0.013Per kg Energy Corrected Milk 0.014 0.015 0.015 0.011Per Year of Life 97 97 110 74
Phosphorus (kg)Per kg of Unadjusted Milk 0.0024 0.0026 0.0027 0.0025Per kg Energy Corrected Milk 0.0024 0.0025 0.0026 0.0021Per Year of Life 18 18 19 15
Potassium (kg)Per kg of Unadjusted Milk 0.0064 0.0068 0.0071 0.0058Per kg Energy Corrected Milk 0.0064 0.0067 0.0068 0.0048Per Year of Life 57 56 57 30
The Organic Center Critical Issue Report Page
November 2010 A Dairy Farm’s Footprint 28
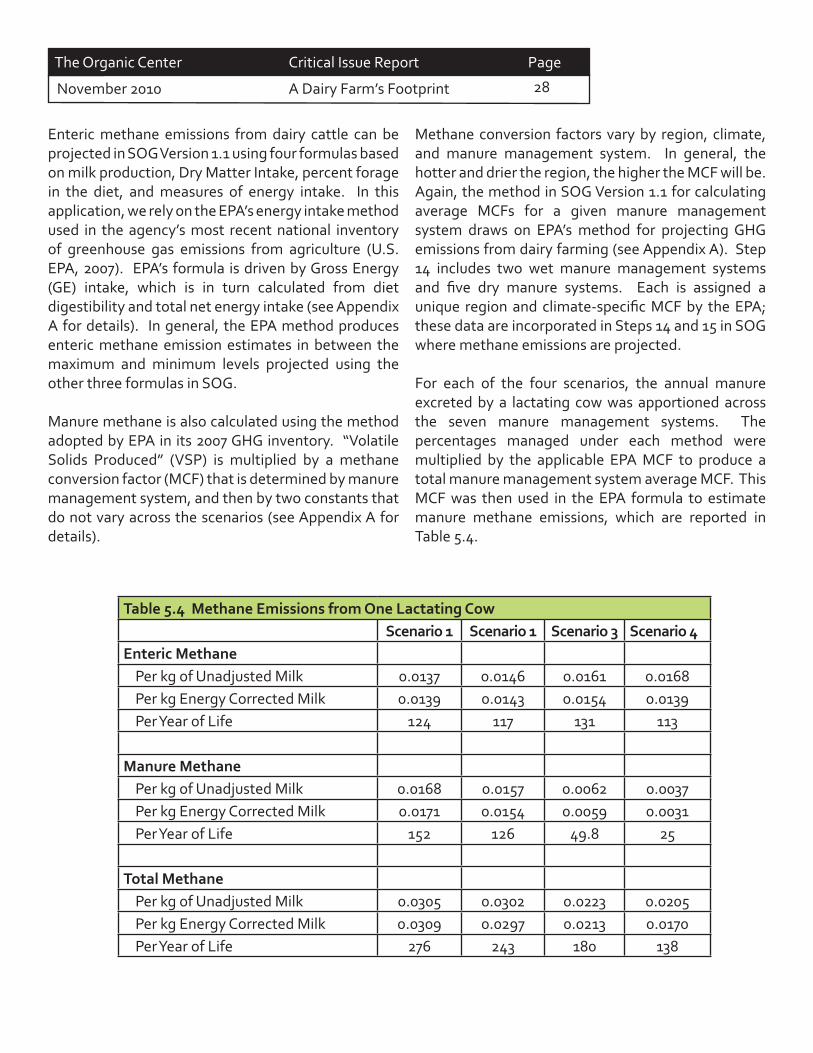
Enteric methane emissions from dairy cattle can be projected in SOG Version 1.1 using four formulas based on milk production, Dry Matter Intake, percent forage in the diet, and measures of energy intake. In this application, we rely on the EPA’s energy intake method used in the agency’s most recent national inventory of greenhouse gas emissions from agriculture (U.S. EPA, 2007). EPA’s formula is driven by Gross Energy (GE) intake, which is in turn calculated from diet digestibility and total net energy intake (see Appendix A for details). In general, the EPA method produces enteric methane emission estimates in between the maximum and minimum levels projected using the other three formulas in SOG.
Manure methane is also calculated using the method adopted by EPA in its 2007 GHG inventory. “Volatile Solids Produced” (VSP) is multiplied by a methane conversion factor (MCF) that is determined by manure management system, and then by two constants that do not vary across the scenarios (see Appendix A for details).
Methane conversion factors vary by region, climate, and manure management system. In general, the hotter and drier the region, the higher the MCF will be. Again, the method in SOG Version 1.1 for calculating average MCFs for a given manure management system draws on EPA’s method for projecting GHG emissions from dairy farming (see Appendix A). Step 14 includes two wet manure management systems and fi ve dry manure systems. Each is assigned a unique region and climate-specifi c MCF by the EPA; these data are incorporated in Steps 14 and 15 in SOG where methane emissions are projected.
For each of the four scenarios, the annual manure excreted by a lactating cow was apportioned across the seven manure management systems. The percentages managed under each method were multiplied by the applicable EPA MCF to produce a total manure management system average MCF. This MCF was then used in the EPA formula to estimate manure methane emissions, which are reported in Table 5.4.
Table 5.4 Methane Emissions from One Lactating CowScenario 1 Scenario 1 Scenario 3 Scenario 4
Enteric MethanePer kg of Unadjusted Milk 0.0137 0.0146 0.0161 0.0168Per kg Energy Corrected Milk 0.0139 0.0143 0.0154 0.0139Per Year of Life 124 117 131 113
Manure MethanePer kg of Unadjusted Milk 0.0168 0.0157 0.0062 0.0037Per kg Energy Corrected Milk 0.0171 0.0154 0.0059 0.0031Per Year of Life 152 126 49.8 25
Total MethanePer kg of Unadjusted Milk 0.0305 0.0302 0.0223 0.0205Per kg Energy Corrected Milk 0.0309 0.0297 0.0213 0.0170Per Year of Life 276 243 180 138
The Organic Center Critical Issue Report Page November 2010 A Dairy Farm’s Footprint 29
Enteric methane emissions per kilogram (kg) of unadjusted milk are greatest in Scenario 4, and lowest in Scenario 1. But methane emissions per kg of ECM are greatest in Scenario 3, and lowest in Scenarios 1 and 4, again highlighting the need to base performance metrics on energy-corrected milk.
The big diff erences in total methane between the two conventional and two organic scenarios are driven by the large reductions in manure methane emissions on the organic farms. Manure methane emissions per kg of ECM from Scenario 1 cows are 5.5-fold higher than from Scenario 4 cows. In terms of total methane per kg of ECM, the management system in place on Scenario 4 farms reduce emissions 45% compared to Scenario 1 farms, from 0.0309 kg methane/kg ECM to 0.017 kg methane/kg ECM.
Manure Management Trends Impacting the Dairy Farm Footprint
Two trends are clear in conventional dairy production that are pushing farmers toward adoption of wet
manure management systems. First, there has been steady growth for many years in the number of cows on the average farm, as evident in the September 22, 2010 release from NASS entitled “Large Operations Increase Share of Inventory and Milk Production.” This informational bulletin reports that the number of dairy farms declined 33% in just the eight years between 2001 and 2009. As a group, operations milking 2,000 or more cows have increased the fastest since 2001 and now account for about 30% of the nation’s lactating cows. Farms with 500 or more milking cows account for 56% of the milking herd.
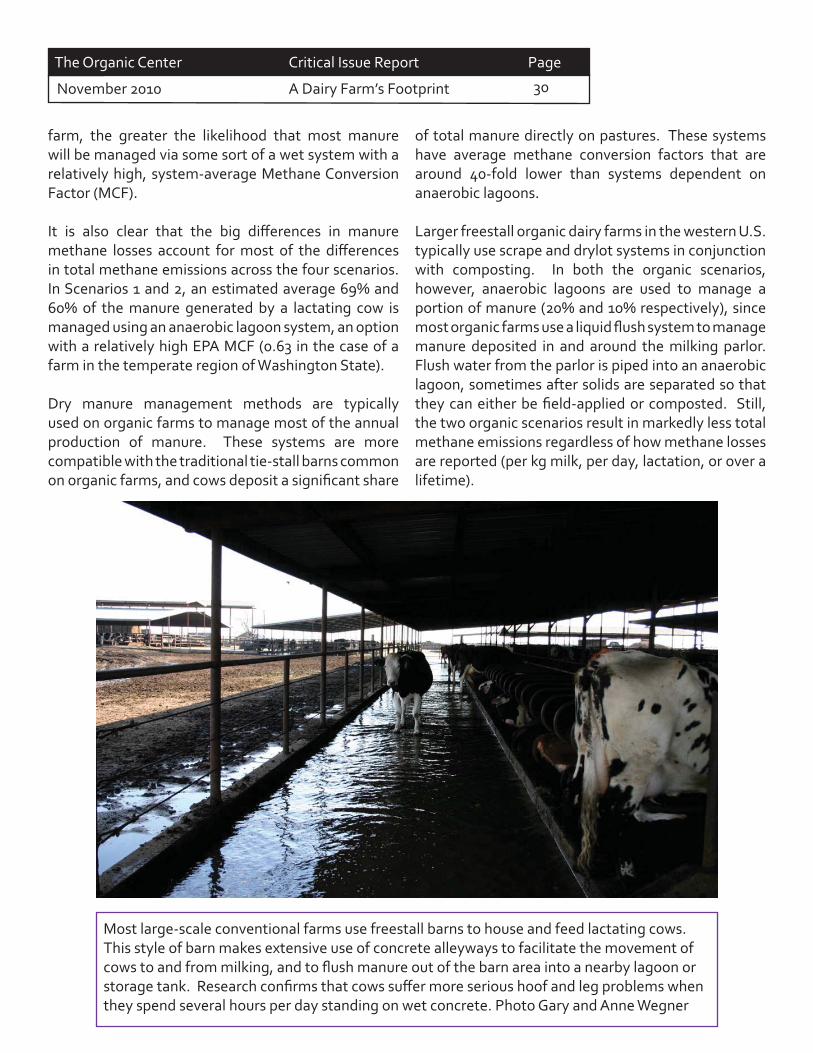
The second trend is increasing reliance on open freestall barns, a type of housing for lactating cows that is typically coupled on large conventional farms with some sort of liquid-based, manure fl ushing system that feeds into an anaerobic lagoon, either with or without the separation of solids. In the NAHMS dairy sector survey, 83.2% of farms with 500 or more cows used a freestall barn in 2007, whereas only 27.2% did among farms milking fewer than 100 cows (NAHMS, 2007b). So clearly, the larger the
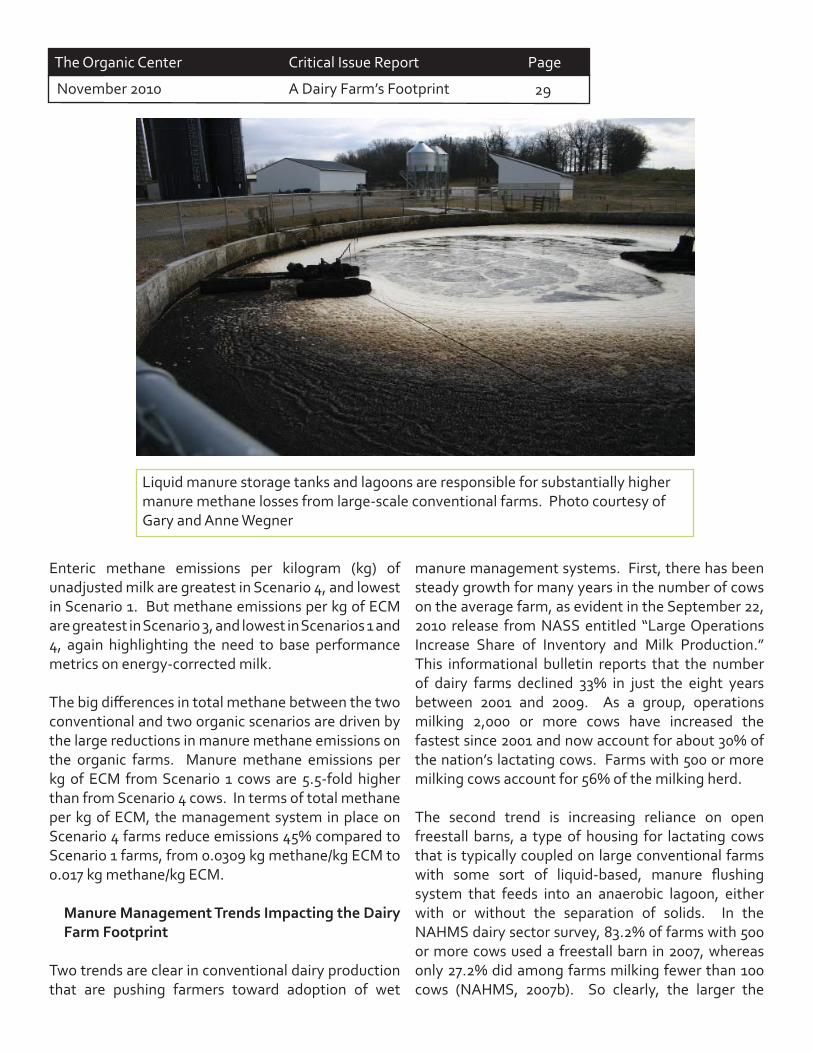
Liquid manure storage tanks and lagoons are responsible for substantially higher manure methane losses from large-scale conventional farms. Photo courtesy of Gary and Anne Wegner
The Organic Center Critical Issue Report Page
November 2010 A Dairy Farm’s Footprint 30
farm, the greater the likelihood that most manure will be managed via some sort of a wet system with a relatively high, system-average Methane Conversion Factor (MCF). It is also clear that the big diff erences in manure methane losses account for most of the diff erences in total methane emissions across the four scenarios. In Scenarios 1 and 2, an estimated average 69% and 60% of the manure generated by a lactating cow is managed using an anaerobic lagoon system, an option with a relatively high EPA MCF (0.63 in the case of a farm in the temperate region of Washington State). Dry manure management methods are typically used on organic farms to manage most of the annual production of manure. These systems are more compatible with the traditional tie-stall barns common on organic farms, and cows deposit a signifi cant share
of total manure directly on pastures. These systems have average methane conversion factors that are around 40-fold lower than systems dependent on anaerobic lagoons.
Larger freestall organic dairy farms in the western U.S. typically use scrape and drylot systems in conjunction with composting. In both the organic scenarios, however, anaerobic lagoons are used to manage a portion of manure (20% and 10% respectively), since most organic farms use a liquid fl ush system to manage manure deposited in and around the milking parlor. Flush water from the parlor is piped into an anaerobic lagoon, sometimes after solids are separated so that they can either be fi eld-applied or composted. Still, the two organic scenarios result in markedly less total methane emissions regardless of how methane losses are reported (per kg milk, per day, lactation, or over a lifetime).
Most large-scale conventional farms use freestall barns to house and feed lactating cows. This style of barn makes extensive use of concrete alleyways to facilitate the movement of cows to and from milking, and to fl ush manure out of the barn area into a nearby lagoon or storage tank. Research confi rms that cows suff er more serious hoof and leg problems when they spend several hours per day standing on wet concrete. Photo Gary and Anne Wegner
The Organic Center Critical Issue Report Page November 2010 A Dairy Farm’s Footprint 31
Arsenault, N., Tyedmers, P., and A. Fredeen, 2009. “Comparing the environmental impacts of pasture-based and confi nement-based dairy systems in Nova Scotia (Canada) using life cycle assessment,” International Journal of Agricultural Sustainability, Vol. 7, No. 1:19-41.
Benbrook, C., 2010. Shades of Green Users Manual – Guide and Documentation for a Dairy Farm Management System Calculator, The Organic Center, Boulder, CO., Access at www.organic-center.org/SOG_Home
Butler, G., Nielsen, J.H., Slots, T., Seal, C., Eyre, M.D., Sanderson, R, and C. Leifert, 2008. “Fatty acid and fat-soluble antioxidant concentrations in milk from high- and low-input conventional and organic dairy systems: seasonal variation,” Journal of the Science of Food and Agriculture, Vol. 88: 1431-1441.
Butler, G., Collomb, M., Rehberger, B., Sanderson, R., Eyre, M., and C. Leifert, 2009. “CLA isomer concentrations in milk from high and low input management dairy systems,” Journal of the Science of Food and Agriculture, Vol. 89: 697-705.
Caraviello, D.Z. et al., 2006. “Survey of Management Practices on Reproductive Performance of Dairy Cattle on Large US Commercial Farms,” Journal Dairy Science, Vol. 89: 4723-4735.
Capper, J.L., Castaneda-Gutierrez, E., Cady, R.A., and D. E. Bauman, 2008. “The environmental impact of recombinant bovine somatotin (rbST) use in dairy production,” Proceedings of the National Academy of Sciences, Vol. 105, No. 28: 9688-9673.
Chagas, L.M., et al., 2007. “Invited Review: New Perspectives on the Roles of Nutrition and Metabolic Priorities in the Subfertility of High-Producing Dairy Cows,” Journal of Dairy Science, Vol. 90: 4022-4032.
Chalupa, W. et al., 2004. “Dairy nutrition models: their forms and applications,” http://www.docstoc.com/docs/4530729/W-Chalupa-et-al-Dairy-nutrition-models-their-forms.
Committee on 21st Century Systems Agriculture, 2010. Toward Sustainable Agricultural Systems in the 21st Century, National Research Council, National Academy Press, Washington, D.C.
Economic Research Service, 2010a. “Dairy Forecasts,” World gricultural Supply and Demand Estimates, ERS-USDA, accessed 10/10/10, http://www.ers.usda.gov/publications/ldp
Economic Research Service, USDA, 2006. “2005 Dairy Agricultural Resource Management Survey,” tables generated for The Organic Center by Purdue University.
Ellis, K.A., Innocent, G., Grove-White, D., Cripps, P., McLean, W.G., Howard, C.V., and M. Mihm, 2006. “Comparing the Fatty Acid Composition of Organic and Conventional Milk,” Journal of Diary Science, Vol. 89: 1938-1950.
El-Zarkouny, S.Z. et al., 2004. “Pregnancy in dairy cows after synchronized ovulation regimens with or without presynchronization and progesterone,” Journal of Dairy Science, Vol 87: 1024-1037.
References
The Organic Center Critical Issue Report Page
November 2010 A Dairy Farm’s Footprint 32
Fricke, P.M. “Ovsynch, Pre-synch, the Kitchen-Synch: What’s Up with Synchronization Protocols,” Dept. of Dairy Science, University of Wisconsin-Madison, http://www.wisc.edu/dysci/uwex/brochures/brochures/fricke.pdf
Haas, G., Wetterich, F., and U. Kopke, 2001. “Comparing intensive, extensifi ed and organic grassland farming in southern Germany by process life cycle assessment,” Agriculture Ecosystems and Environment, Vol. 83: 43-53.
Hadley, G.L, Wolf, C.A., and S.B. Harsh, 2006. “Dairy Cattle Culling Patterns, Explanations, and Implications,” Journal of Diary Science, Vol. 89:2286-2296.
Hoard’s Dairyman staff , 2010. “How deep a fi nancial hole did milk producers dig in 2009?,” Hoard’s West, September 25, 2010.
Kellogg, D.W. et al., 2001. “Survey of Management Practices Used for the Highest Producing DHI Herds in the United States,” Journal of Dairy Science, Vol 84 (E. Suppl.)” E120-127.
Knaus, W., 2009. “Dairy cows trapped between performance demands and adaptability,” Journal of Science of Food and Agriculture, Vol. 89: 1107-1114.
Lucy, M.C., 2001. “ADSA Foundation Scholar Award --Reproductive Loss in High Producing Dairy Cattle: Where Will It End?”, Journal of Dairy Science, Vol. 84: 1277-1293.
McConnel, C.S., Lombard, J.E., Wagner, B.A., and F.B. Garry, 2008. “Evaluation of Factors Associated with Increased Dairy Cow Mortality on United States Dairy Operations,” Journal of Dairy Science, Vol. 91: 1423-1432.
Moore, D. and J. Kirk, “Embryonic Loss in Dairy Cattle,” School of Veterinary Medicine, U.C.-Davis, Tulare, California, (Undated).
NAHMS, 2007a. Dairy 2007 Part II: Changes in the U.S. Dairy Cattle Industry, 1991-2007, National Animal Health Monitoring Systems, USDA-APHIS, Washington, D.C.
NAHMS, 2007b. Dairy 2007 Part III: Reference of Dairy Cattle Health and Management Practices in the United States, 2007, National Animal Health Monitoring Systems, USDA-APHIS, Washington, D.C.
Nennich, T. D., J. H. Harrison, et al., 2005. “Prediction of manure and nutrient excretion from dairy cattle,” Journal of Dairy Science, Vol. 88: 3721-3733.
Olynk, N.J. and C.A. Wolf, 2008. “Economic Analysis of Reproductive Management Strategies on US Commercial Dairy Farms,” Journal of Dairy Science, Vol. 91: 4082-4091.
O’Donnell, Spatny, K.P., Vicini, J.L., and D.E. Bauman, 2010. “Survey of the fatty acid composition of retail milk diff ering in label claims based on production management practices,” Journal of Dairy Science, Vol. 93: 1918-1925.
Pitesky, M., Stackhouse, K., and F. Mitloehner, 2009. “Clearing the Air: Livestock’s Contributions to Climate Change,” Advances in Agronomy, Vol . 103
The Organic Center Critical Issue Report Page November 2010 A Dairy Farm’s Footprint 33
Santos, J.E.P. et al., 2004. “Eff ect of bST and reproductive management on reproductive performance of Holstein dairy cows,” Journal of Dairy Science, Vol 87: 868-881.
Smith, J.W., Ely, L.O., and A.M. Chapa, 2000. “Eff ect of Region, Herd Size, and Milk Production on Reasons Cows Leave the Herd,” Journal of Dairy Science, Vol. 88: 2980-2987.
Steinfeld, H., Gerber, P., Wassenaar, T., Castel, V., Rosales, M., and C. de Haan, 2006. Livestock’s Long Shadow: Environmental Issues and Options, Food and Agriculture Organization of the United Nations, Rome, Italy. Access summary at ftp://ftp.fao.org/docrep/fao/010/a0701e/a0701e00.pdf
Subcommittee on Dairy Cattle Nutrition, 2001. Nutrient Requirements of Dairy Cattle, Seventh Revised Edition, 2001, National Research Council, Washington, D.C.
Thomsen, P.T., et al., 2006. “Herd-level risk factors for the mortality of cows in Danish dairy herds,” The Veterinary Record, Vol. 158:622-625.
Tsuruta, S. Misztai, I., and J. Lawlor, 2005. “Changing Defi nition of Productive Life in US Holsteins: Eff ect on Genetic Correlations,” Journal of Dairy Science, Vol. 88: 1156-1165.
U.S. Environmental Protection Agency (EPA), 2007. Inventory of U.S. Greenhouse Gas Emissions and Sinks: 1990-2007. Chapter 3.10. Methodology for Estimating CH4 and N2O Emissions from Manure Management, Washington, D.C.
Washington State University Extension, 2008. “FAQ #27579 -- What is dry matter intake effi ciency, and how is this important in nutrient management?,” access at http://www.extension.org/faq/27579
Windig, J.J. et al., 2005. “Infl uence of herd environment on health and fertility and their relationship with milk production,” Journal of Dairy Science, Vol 88: 335-347.
The Organic Center Critical Issue Report Page
November 2010 A Dairy Farm’s Footprint 34
1. Formula for ECM
The equation to calculate “Energy Corrected Milk,” or ECM is:
ECM (kgs or pounds/day) = (UMPD x 0.323) + (7.13 x Protein Content) + (12.82 x Fat Content)
Where:UMPD is unadjusted milk production per dayProtein content is kgs/pounds of proteinFat content is total kgs/pounds of fat.
Source: Washington State University Extension, 2008; http://www.extension.org/faq/27579.
2. Number of Days with Diverted Milk Worksheet, from Step 4 of SOG Version 1.1
Appendix A - Basis for and Sources of Key Variables and Equations
Worksheet A for Step 4.4 - Estimating the Average Number of Days in a Lactation with Diverted Milk in the Four Scenarios (see notes)
Reason for Diverted Milk DaysColostrum
Post-Calving and Feeding
Heifer Calves*
Hold/Divert Milk Post Drug Treatment per Label
High SCC; Farmer
Diverted
High SCC in Load, Milk Diverted
Antibiotics in Load,
Milk Diverted
Sum of Five
Reasons
Sum of Five Reasons or Enter User Reported
TotalScenario 1 2 5 4 2 1.5 14.5 14.5Scenario 2 2 4 3 1 0.5 10.5 10.5Scenario 3 6 0.5 2 0.5 0 9 9Scenario 4 6 0.2 1 0.2 0 7.4 7.4Notes: The column “Sum of Five Reasons” is the sum of the previous fi ve columns. These values are automatically transferred to the last column, which will be inserted in the line “Days of Diverted Milk” in Step 4.4 under “User Reported.” If a user does not know the specifi c reasons why milk was diverted, but knows the total number of days on average per lactating cow that milk was diverted, place this number of days in the last column.* Organic heifer calves fed one gallon of organic milk per day for average 60 days, leading to the diversion of an average of 10 days of organic milk. Bull calves fed organic milk for two days, resulting in an average of 6 days of diverted milk per calf on organic farms.
The Organic Center Critical Issue Report Page November 2010 A Dairy Farm’s Footprint 35
3. EPA Method for Calculating Enteric Methane Emissions per Cow
The EPA-recommended formula for estimating enteric methane emissions from a cow is:
Enteric Methane (kg/day) = (GE x Ym)/55.65
Where:GE is Gross Energy intake,Ym is a constant, and refl ects the portion of GE converted to methane55.65 converts millijoules to kilograms
4. EPA Method for Manure Methane Emissions
The method used by EPA to project manure methane emissions is:
Manure Methane (kg/day) = VSP x Bo x MCF x 0.662
Where:VSP is Volatile Solids ProducedBo is a methane producing potential of wasteMCF is Waste Management System Methane Conversion Factor (MCF), composed of a weighted average of the MCFs associated with the diff erent methods used on a farm to manage manure.