Embed Size (px)
Citation preview

Article
A Data Driven Approach to SAR Data Focusing
Cataldo Guaragnella (1) and Tiziana D’Orazio (2)
(1) DEI – Department of Electrical and Information Engineering, Politecnico di Bari, Bari, Italy,[email protected]
(2) STIIMA – Institute of Intelligent Industrial Technologies and Systems for Advanced Manufacturing,CNR – Italian National Research Council, Bari, Italy, [email protected]
* Correspondence: [email protected]; Tel.: +39-080-596-3655
Abstract: Synthetic Aperture RADAR (SAR) is a radar imaging technique in which the relativemotion of the sensor is used to synthesize a very long antenna and obtain high spatial resolution.Standard SAR raw data processing techniques assume uniform motion of the satellite (or aerialvehicle) and a fixed antenna beam pointing sideway orthogonally to the motion path, assumedrectilinear. Despite SAR data processing is a well established imaging technology that has becomefundamental in several fields and applications, in this paper a novel approach has been used toexploit coherent illumination, demonstrating the possibility of extracting a large part of the ancillarydata information from the raw data itself, to be used in the focusing procedure. In this work an efforthas been carried out to try to focus the raw SAR complex data matrix without the knowledge of anyof the parameters needed in standard focusing procedures as Range Doppler (RD) algorithm, Ω−Kalgorithm and Chirp Scaling (CS) algorithm. All the literature references regarding the algorithmsneeded to obtain a precise image from raw data use such parameters that refer both to the SARsystem acquisition geometry and its radiometric specific parameters. In [22], authors introduceda preliminary work dealing with this problem and able to obtain, in the presence of a strongpoint scatterer in the observed scene, good quality images, if compared to the standard processingtechniques. In this work the proposed technique is described and performances parameters areextracted to compare the proposed approach to RD.
Keywords: SAR system; efficient focusing of SAR data; Inverse problem; radar theory; remotesensing; SAR data focusing; phase shifts; satellite trajectory; spatial resolution; syntheticaperture radar; Geometry; Satellites; Ancillary Data; Singular Value Decomposition; Blinddeconvolution; Signal Processing; Parameter estimation; Algorithm; Imaging; Phase estimation;Phase compensation; Computational modeling; Image resolution; Synthetic Aperture
1. Introduction
The Synthetic Aperture Radar ([1][2][3][4])can acquire very high resolution images of theinspected area using high bandwidth of the transmitted coherent illumination signal by means of anaccurate processing of the ground received returns. In a standard structure, the system is composedof a platform (i.e. airborne or satellite) using the same antenna both for the transmitting and receivingphases; the target scene is repeatedly illuminated with pulses of radio waves. The signals echoes arereceived in the band of the transmitted pulse along the satellite track at different positions, convertedto an intermediate frequency channel and IQ sampled so that a baseband processing procedure canallow the synthetic aperture processing algorithm, obtaining the equivalent return of a very narrowantenna beam. Due to physical limitations, it is not possible to manufacture an antenna of long lengthand mount it on an airborne platform, and this is particularly true for small and cheap unmannedAerial Vehicles (UAV) so that the narrow beam in the along track direction (Azimuth) is synthesizedfrom data. Three main algorithms are available to obtain such high quality images, namely RangeDoppler ([6]) algorithm, Ω − K ([5]) algorithm and Chirp Scaling algorithm. All such algorithms
Preprints (www.preprints.org) | NOT PEER-REVIEWED | Posted: 6 July 2018 doi:10.20944/preprints201807.0120.v1
© 2018 by the author(s). Distributed under a Creative Commons CC BY license.
2 of 14
require precise geometric acquisition parameters and radiometric parameters. Such parameters arealways available as a side documentation of each acquired image.
Fig.1 reports the acquisition geometry of a SAR system. The synthesis procedure in focusing theacquired data is carried out by coherent integration. Each target on the ground contributes to theradar return on several subsequent transmitted pulses. In SAR two main directions are importantto focus the data: slant range direction, in which transmitted pulses travel, and Azimuth direction,i.e. the direction of sensor movement. The precise knowledge of the geometry of the acquisitionallows to add in phase each contribute of the single point scatterer on the ground to obtain thefocused image. The wider the beam, the less the detail acquired by any return, but the larger theintegration size of the track contribution to synthesize the image, so that the azimuth radar resolutionis not theoretically bounded. The practical azimuth resolution is limited by the PRF choice (the PulseRepetition Frequency of transmitted pulses used for coherent illumination of the target area), i.e. theazimuth sampling frequency.
Figure 1. Sar Data acquisition geometry
In several cases, due to imprecise knowledge of the satellite or aerial vehicle acquisitiongeometry or due to the presence of motion in the scene (ships, cars, etc.) defocusing of theobtained image appears so many authors addressed the problem of a post processing procedureable to exploit the residual correlation present in data to perform accurate focusing of the image.Motion compensation is very important to help achieving high resolution in SAR image. The highfrequency phase error that may be present on the focused image can be compensated through InertialMeasurement Unit (IMU) and Global Positioning System (GPS) side information. However, theneed to measure and add such information to the ancillary data complicates the burden on anymotion compensation system. In this cases SAR autofocus algorithms ([11][12][13][14][15]) are usedto solve the problem in a blind mode. SAR autofocusing algorithms are categorized into three types:sub-aperture-based algorithms, prominent point-based algorithm and metric-based autofocus. Mostof the traditional autofocus algorithms assume there are strong scatters in the scene. Compared to theother conventional autofocus methods, the metric-based methods can work well without prominentpoints but deal with an already focused image.
The defocused image can be considered as the perfect focused image convoluted with thepointed spread function (PSF) caused by the phase error. Only recently and with the advent oflightweight and cheap SAR systems and UAV and drones, the problem of high cost of the systemhas pushed research to find new solutions in the development of such systems that imply in somecases the development of new techniques trying to focus the acquired raw data matrix using a subsetof the ancillary data parameters and in presence of strong geometry anomalies that occur in suchcases ([16][17][18][19][20][21]). As the availability of parameters needed to extract has always beenguaranteed no author, at our knowledge, tried to estimate the reference function to be used as thefocusing operator from the data itself and develop a completely blind focusing procedure.
Preprints (www.preprints.org) | NOT PEER-REVIEWED | Posted: 6 July 2018 doi:10.20944/preprints201807.0120.v1

3 of 14
While all the available algorithms to solve the SAR data focusing problem are model driven,as they use ancillary parameters information to model the inverse problem in radar soil backscatter,in this paper a data driven approach is proposed to develop a totally blind SAR data focusing ispresented, able to obtain good image quality working on the complex SAR raw data matrix in absenceof any information about the sensor. The proposed approach at the state of the art works well in thepresence of a strong point scatterer in the scene.
The main idea of the proposed approach is to exploit all the inherent information intrinsicallystored in the data itself to extract the focusing reference functions to be used in a Ω − K or RDalgorithm to obtain the Single Look Complex of any SAR sensor without even knowing importantancillary data parameters, needed by all the SAR focusing processors, such as the distance at thecenter of the beam, the radar sampling frequency, the transmitted chirp bandwidth, the chirp rateand the chirp duration, the radar wavelength, the PRF, the sensor speed and the off nadir angle, usedin data acquisition.
The proposed approach has been tested on several images of ERS raw data, made accessible forthe scientific purpose from the Italian Space Agency (ASI) and the cross comparison with the state ofthe art focusing algorithm is carried out. Preliminary results seem to indicate a good accordance tothe standard focusing of obtained images with respect to the officially distributed ones. The proposedapproach can reveal interesting and convenient in several application fields such as local monitoringzones made by SAR systems carried by small lightweight and low cost aerial unmanned vehicles.Modern hardware technology permits to reduce the dimensions and weights of SAR systems intosmall and cheap flying platforms that can be conveniently used with low cost unmanned aerialvehicle (UAV) platforms and flying drones. High-resolution microwave images of the observed scenecan be obtained under various environmental conditions. Thus, UAV-SAR attracts growing interestin recent years ([17]). The possibility of developing commercial low cost systems is anyway stilllimited by the complication of the development of SAR due to the precise need of mission parametersto obtain good quality images. Such parameters are very unstable for this kind of applications;furthermore the knowledge of all the mission parameters introduces a complication in the systemin storage of ancillary parameters files, increasing their cost.
With respect to the reference [22] in which authors have preliminary proposed the blindtechnique to focus SAR data in the presence of a point scatterers in the scene, in this paper a morecomplete discussion about the quality of the focused image is carried out. To define the resolutionin the range and azimuth directions, point scatterers responses are extracted from the image andazimuth and range cuts are compared with range doppler focusing of the same image. Also, aninterferometric pair has been processed and the interference fringes have been extracted to show thegood performance and phase stability of the proposed technique.
2. SAR data acquisition
SAR normally use chirp transmitted pulse. The radar moves along the track in the azimuthdirection while transmitting repeated chirp signals with a given PRF in the direction orthogonal tothe satellite trajectory (slant range). The received samples of the radar return are acquired along theslant range direction and each recorded data vector represents a row of a sequentially stored matrixof complex data (raw data matrix). The chirp signal is a linearly frequency modulated (FM) signalspanning the bandwidth of the radar; its peculiarity is the ability of conveying high energy of thetransmitted long pulse duration without the limitation inherent in geometric resolution because theuse of a matched filter at the receiver end allows to recover a high peak signal to noise ratios and aresolution in distance directly related to the chirp signal bandwidth ([1], [2], [3]). Due to the manyreturn contributions at each given instant of the recorded file (the superposition of returns of all thepoints on the ground within the physical antenna footprint located on the Earth at the same distancefrom the sensor), the acquired raw data matrix assumes the aspect of a complex random noise with agaussian distribution. The problem of SAR data focusing is commonly known as an inverse problem,
Preprints (www.preprints.org) | NOT PEER-REVIEWED | Posted: 6 July 2018 doi:10.20944/preprints201807.0120.v1
4 of 14
where the deconvolution algorithm that permits to obtain the focused image makes recourse to thedefinition of the correlation operator to be used on raw data, precisely known if several missionparameters are known; such parameters are made available, for each RAW data product, in the formof an ancillary information file. As the SAR algorithm is linear, the deconvolution implementationcan be described observing a single point target at the center of the scene (or within) and extract allthe useful information from geometrical considerations.
3. Transmitted Chirp
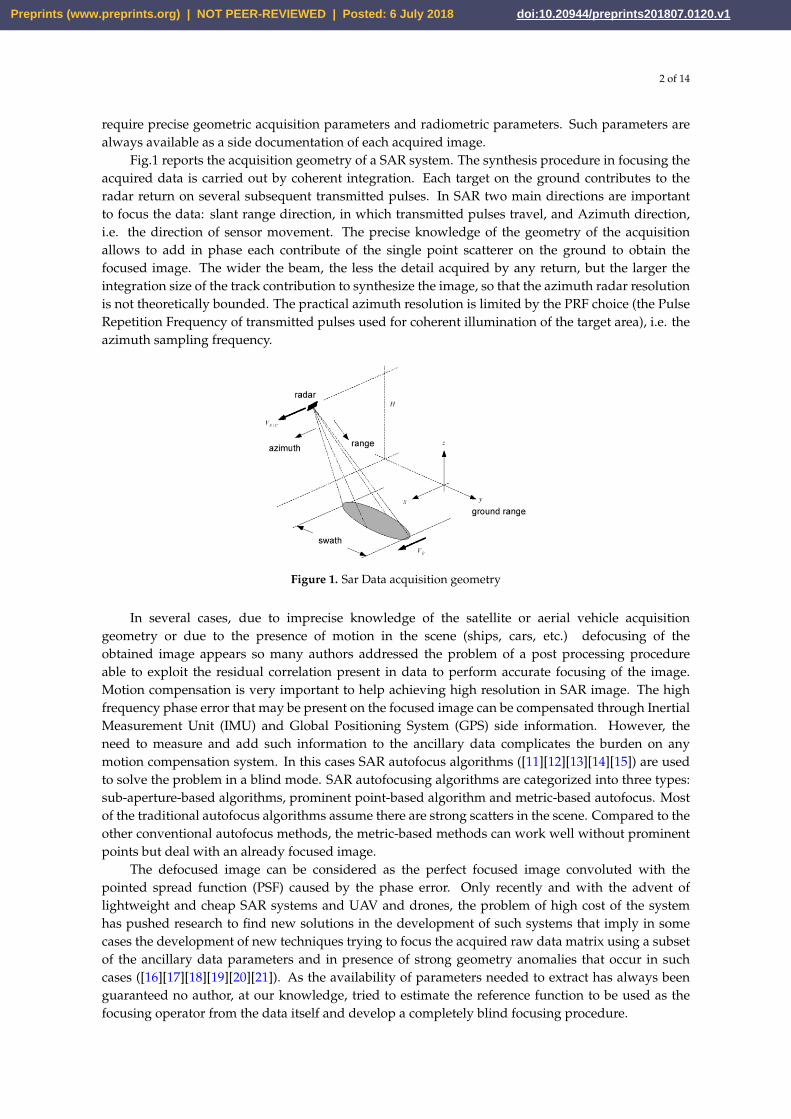
At every position along the sensor track of a perfectly absorbing surface where a single strongpoint scatterer is placed, a return of the scatterer to the chirp is recorded. This signal is acquired alongthe track in all the point until it remains within the azimuth antenna beam pattern. The antenna gainchanges and assumes its largest value when the scatterer is exactly at the center of the antenna patternwhile the intensity of the received return is tapered for different position of the sensor along the track.
Figure 2. Simulated response of a point scatterer: Magnitude and real part
Fig. 2 reports the magnitude of the response of a simulated single point scatterer in an idealacquisition SAR system. What is clearly visible in the figure is both the degradation of the response forazimuthal position displaced from the center beam and the phenomenon known as range migrationor range walk, that is the displacement, in the slant range direction, of the first sample of the radarreturn as the sensor moves along the track. In the figure is also represented the real part of thesimulated raw data.
3.1. Range Migration and Azimuthal chirp
If the raw data matrix in Fig. 3 is read in the vertical (azimuth) direction, due to the rangemigration and delay in received chirp response of the single point scatterer on the ground, theazimuth response reveals to be a chirp signal too, amplitude modulated by the antenna beam patternin azimuth (see Fig.3). The state of the art focusing algorithms obtain high resolution images from
Preprints (www.preprints.org) | NOT PEER-REVIEWED | Posted: 6 July 2018 doi:10.20944/preprints201807.0120.v1

5 of 14
SAR raw data matrices basing on precise knowledge of the data acquisition geometry and SARsystem parameters. The mostly used SAR focusing algorithms are RD and Ω− K. Also a modifiedversion of the focusing algorithm is the Chirp Scaling (CS). In the Range-Doppler approach, thefocusing algorithm can be decomposed easily in two different parts: first focusing in the rangedirection is carried out by correlating the received raw data rows with the range reference function(i.e. the transmitted chirp signal); once obtained the range focused image, focusing in the azimuthdirection takes place normally in two steps: first, the range migration compensation is applied (RangeCell Migration Compensation), then the azimuth compression takes place using a geometricallyconstructed phase history of the received signal.
Figure 3. Azimuth chirp, real part
In a real scenario, several other distortions can take place, due to non ideal acquisition geometry.The presence of a shift in the doppler centroid requires its estimation and compensation; suchphenomenon is generally due to relative motion of Earth ground point with respect to the sensortrajectory or to the satellite attitude deviations with respect to theoretical assumed one. Severalrefinement algorithms have been presented in the scientific literature and are part of the focusingalgorithm actually available and used to produce official data ([9], [10], [11]). Also efficiency hasalways been addressed in the performances evaluation of a focusing algorithm, nowadays overcomeby the high computational capacity of existing hardware that makes this problem less severe thanonce.
4. Extracting information from SAR data
Several information about the SAR data format can be extracted from the acquired data. In thissection all the useful information that can be extracted from the data itself will be addressed and therequired procedures to extract the information will also be presented.
4.1. Blind SAR data Focusing Algorithm
The acquired data, as discussed, is the result of backscattering contribution of the ground atthe SAR frequency. As a coherent illuminating source is used, the received data refer to severalobservations of the same scene taken in different points along the satellite trajectory; each returnshould contain, for several pulses in the sequence, roughly the same information so that theexploitation of coherence of the received signal can be attempted. The radar transmitted pulses arestable in time: all the received returns show a strong azimuth correlation. This hypothesis allows touse some correlation-based algorithm to extract useful information from data. The use of Singular
Preprints (www.preprints.org) | NOT PEER-REVIEWED | Posted: 6 July 2018 doi:10.20944/preprints201807.0120.v1
6 of 14
Value Decomposition (SVD) ([6]) technique can give us information about the reference functions tobe used to focus the image.
4.2. SVD – Signal Processing
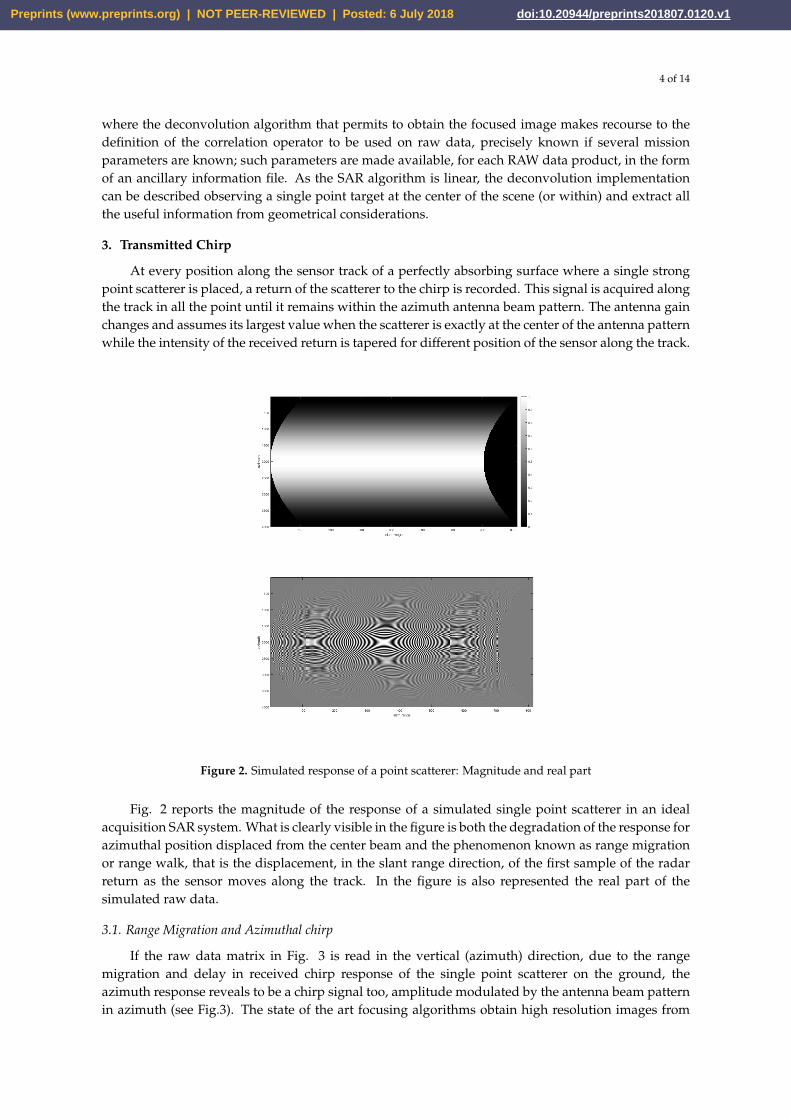
Singular Value Decomposition ([7]), in its economy formulation, is a standard algorithm able todecompose a given rectangular matrix into the product of three matrices, U, S and V as schematicallydepicted in Fig. 4.
Figure 4. Schematic description of the SVD decomposition
X is the data matrix of size M · N, U and V are orthonormal matrices; U has the same size of thematrix X while S is a real valued diagonal matrix of size N and V is a complex orthonormal squarematrix of size N, where:
UH ·U = IN (1)
and
VH ·V = IN (2)
S is the matrix containing the Singular Values of the matrix decomposition, sorted along thediagonal from the highest value to the lowest. In Analytical form, The SVD decomposition can bewritten simply as:
X = U · S ·VH (3)
where the superscript (·)H represents the transpose and conjugate operator (Hilbert operator). Ifa right multiplication for matrix V of both terms in (3) is applied, it can be usefully restated in anotherform:
X ·V = U · S = E (4)
The V matrix is the matrix mixing columns of the data matrix X to obtain E, an orthogonal matrix.The right multiplication of the matrix U with S only scales the vector columns in U non affecting theorthogonality property. E is a matrix containing columns obtained from the linear mixture of thecolumns of the data matrix. The columns of the original data matrix can be considered as differentrealizations of a given process, so that this orthogonality and the hypothesis of zero mean for thesignal time series permits the separation of the data matrix in uncorrelated signals. As a simpleexample if the SVD decomposition X of two columns requires the right singular vector matrix V anorthonormal matrix of size 2. The V matrix in this simple case represents a complex Gibbs rotationmatrix. In this very simple case, the operation carried out by the decomposition becomes clear:
[~x1 ~x2
]·[
c s−s c
]=
[~e1 ~e2
](5)
Preprints (www.preprints.org) | NOT PEER-REVIEWED | Posted: 6 July 2018 doi:10.20944/preprints201807.0120.v1
7 of 14
The E matrix is thus obtained as a simple linear combination of columns of X. V is the Gibbsrotation matrix and:
|c|2 + |s|2 = 1 (6)
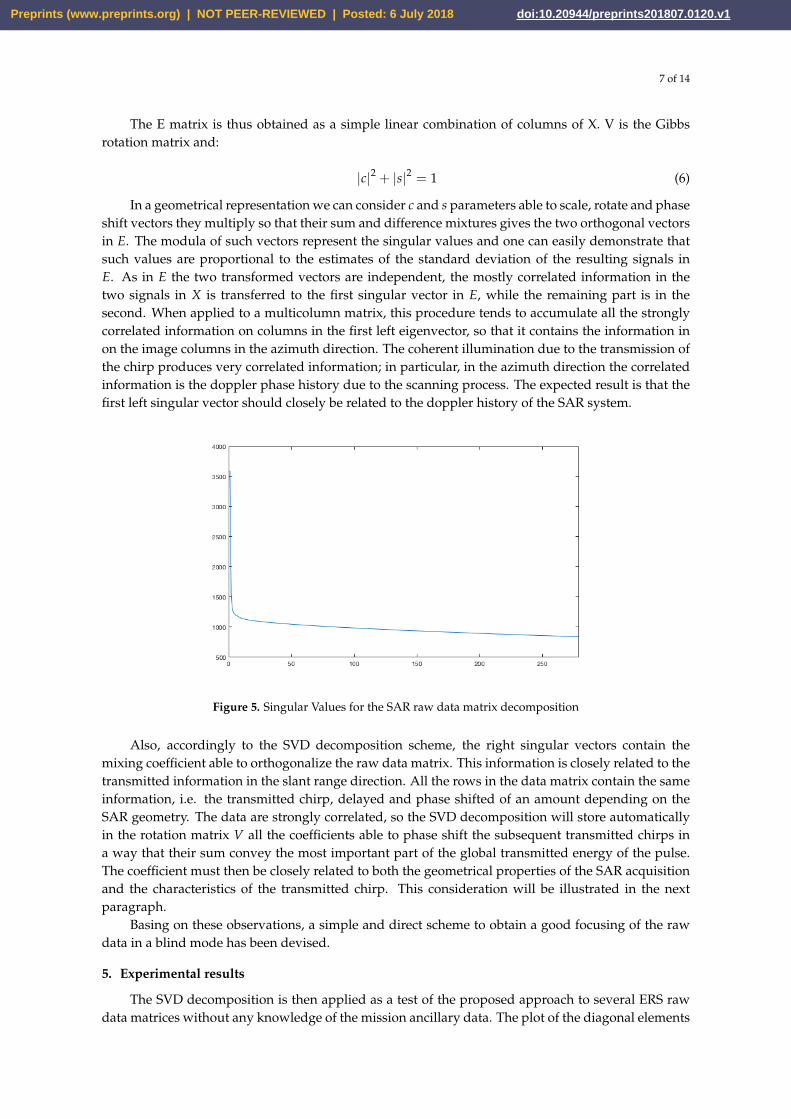
In a geometrical representation we can consider c and s parameters able to scale, rotate and phaseshift vectors they multiply so that their sum and difference mixtures gives the two orthogonal vectorsin E. The modula of such vectors represent the singular values and one can easily demonstrate thatsuch values are proportional to the estimates of the standard deviation of the resulting signals inE. As in E the two transformed vectors are independent, the mostly correlated information in thetwo signals in X is transferred to the first singular vector in E, while the remaining part is in thesecond. When applied to a multicolumn matrix, this procedure tends to accumulate all the stronglycorrelated information on columns in the first left eigenvector, so that it contains the information inon the image columns in the azimuth direction. The coherent illumination due to the transmission ofthe chirp produces very correlated information; in particular, in the azimuth direction the correlatedinformation is the doppler phase history due to the scanning process. The expected result is that thefirst left singular vector should closely be related to the doppler history of the SAR system.
Figure 5. Singular Values for the SAR raw data matrix decomposition
Also, accordingly to the SVD decomposition scheme, the right singular vectors contain themixing coefficient able to orthogonalize the raw data matrix. This information is closely related to thetransmitted information in the slant range direction. All the rows in the data matrix contain the sameinformation, i.e. the transmitted chirp, delayed and phase shifted of an amount depending on theSAR geometry. The data are strongly correlated, so the SVD decomposition will store automaticallyin the rotation matrix V all the coefficients able to phase shift the subsequent transmitted chirps ina way that their sum convey the most important part of the global transmitted energy of the pulse.The coefficient must then be closely related to both the geometrical properties of the SAR acquisitionand the characteristics of the transmitted chirp. This consideration will be illustrated in the nextparagraph.
Basing on these observations, a simple and direct scheme to obtain a good focusing of the rawdata in a blind mode has been devised.
5. Experimental results
The SVD decomposition is then applied as a test of the proposed approach to several ERS rawdata matrices without any knowledge of the mission ancillary data. The plot of the diagonal elements
Preprints (www.preprints.org) | NOT PEER-REVIEWED | Posted: 6 July 2018 doi:10.20944/preprints201807.0120.v1

8 of 14
of matrix S is a simple description of how the energy of the orthogonalized signals is distributed. Thisgives a quick description of how efficient was the separation of signals into uncorrelated components.Fig.5 shows the plot of singular values for the ERS data matrix.
A large part of the energy in the data matrix is concentrated in the first singular value, clearlystating that the first left singular vector (i.e. the first column of matrix U) should contain theorthogonal signal with maximum energy in the data. Fig.7 b) represents the real part of this singularvector and, as it can be seen, it is clearly similar to the azimuth chirp, hence showing also the antennabeam pattern intensity modulation. From the simple observation of the first left singular vector ofthe matrix U two informations can be extracted: the antenna beam pattern in azimuth and the phasehistory of the azimuth reference to be used in the focusing procedure.
Thresholding can be applied to define the useful phase history and estimate the antenna beampattern. Also, the estimate of the doppler centroid can be carried out measuring the azimuthposition of the lowest instantaneous frequency with respect to the peak value of the azimuth referencefunction, representing the antenna beam pattern central position. Considering the matrix product ofthe SVD decomposition, to extract the first left singular vector of matrix U, the mixing coefficientsto be used are the ones in the right first singular vector of matrix V. This signal contains thecomplex coefficients needed to re-phase and add the received chirp signal in the raw data matrix.It is interesting to verify what such coefficients are. Fig. 6 a) represents the real part of the firstcolumn of the matrix V. The proposed approach is thus simple and direct and allows to extractuseful information to focus the received data.
It should be pointed out that the possibility of obtaining good estimates of the range and azimuthchirp responses is due to the clear presence of a point scatterer with high signal to noise ratio thatconveys a large part of the data matrix energy in a restricted part of the data matrix, allowing goodestimates. Once known parameters of the azimuth and range histories, focusing can become simpleand can be carried out with either RD or Ω− K algorithms. In this paper the frequency approach hasbeen used to obtain the focused image. In the subsequent subparagraph the details of the proposedalgorithm are given.
Figure 6. Raw range and azimuth reference functions as extracted from the SAR raw data bi SVDprocessing. For the azimuth reference is evident the antenna azimuth beam pattern shaping. Amoderate attenuation pattern in the range direction is visible also for the range reference function
6. B–SAR – Blind SAR Data focusing Algorithm
From the matrix U two informations can be extracted: the antenna beam pattern in azimuthand the phase history of the azimuth reference to be used in the focusing procedure. Thresholdingcan also be applied to define the useful phase history and estimate the antenna beam pattern. Also,observing the azimuth position of the lowest instantaneous frequency with respect to the azimuthantenna beam center the estimate of the doppler centroid can be obtained. Fig. 6 a) and b) showthat the obtained information is noisy so that a more accurate derivation of the azimuth and rangehistories can be carried out to obtain a clean focusing reference function.
Preprints (www.preprints.org) | NOT PEER-REVIEWED | Posted: 6 July 2018 doi:10.20944/preprints201807.0120.v1

9 of 14
To select the proper length of the range chirp history and reconstruct a clean reference in range,simple thresholding is used as the reference signal is much higher than the background noise. In thiscase the selected range time duration by the choice of a threshold at 10 % of the signal peak value hasrevealed efficient. The estimated length of the range chirp was 703 samples. To reduce the influence ofnoise, the unwrapped phase of the range chirp has been used in the LMS estimation of the parabolicphase in the construction of the range chirp to be used in the focusing algorithm.
Figure 7. Range and Azimuth references to be used in the focusing procedure. Left range, rightazimuth. The three rows present extracted phase histories, the real parts of the reference functionsand their spectra
The same procedure was carried out for the azimuth chirp, with a slight more care: the antennabeam pattern estimated in this way is not always effective due to the growing attenuation and thejoint influence of azimuth and range beam patterns with the slant range and the possible presence ofextended strong scatterers that can reduce the quality of the estimated pattern. Also, it is not clearwhere the azimuth phase history should be stopped. The main objective is to limit the phase historyin a proper way to avoid azimuth aliasing.
The proposed approach uses the phase unwrapping of the azimuth history. The cut of theimportant information was obtained also by thresholding with respect to the antenna beam patternmaximum, occurring at the signal peak position and selecting the phase history in a generallyasymmetric interval around the peak. The limitation of this interval was chosen as the 10 % of theestimated peak of the beam pattern. Also, tapered tails are used to avoid aliasing effects on thefocused image, both in the range and azimuth reference functions.
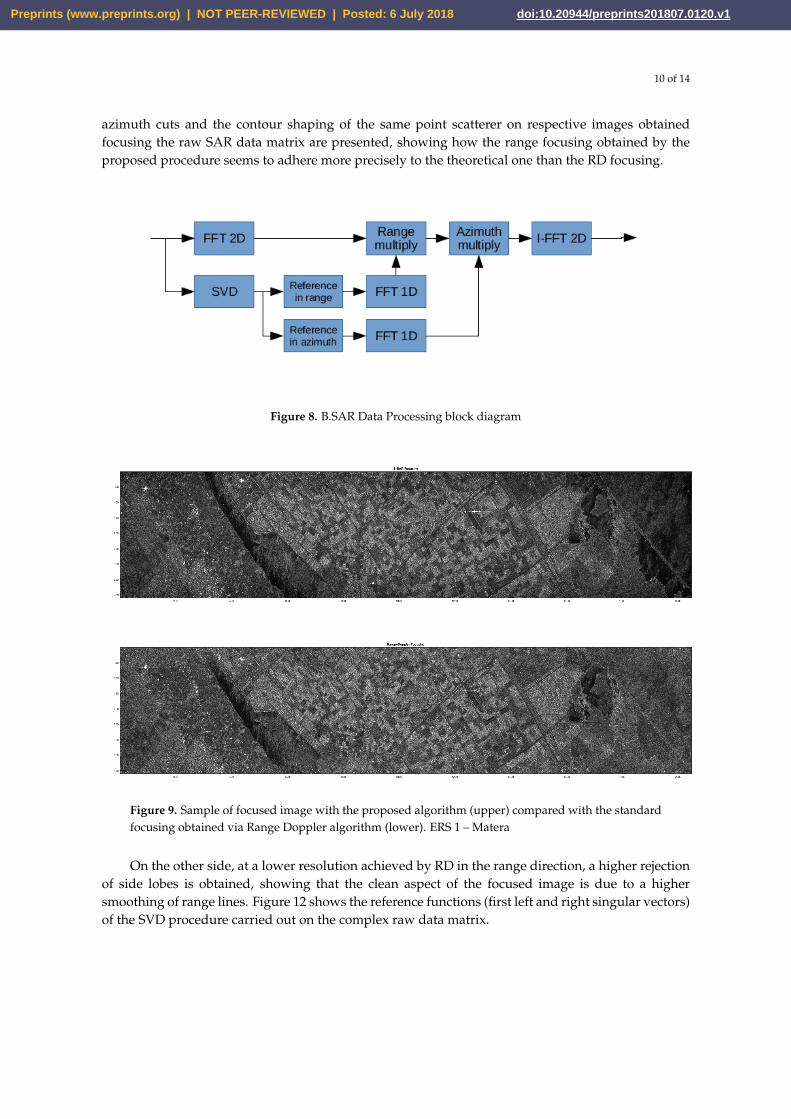
Once obtained via LMS the references of azimuth and range histories (see Fig.8), we can considerready to focus the image. A block diagram of the complete algorithm is reported in Fig. 8. In ??, thefocused ERS image obtained with the proposed algorithm (B-SAR) and the focusing obtained by astandard Range-Doppler SAR processor are compared.
7. Semi Quantitative Evaluation of focusing performances
In this paragraph the comparison of the range and azimuth cuts of the proposed B-SARalgorithm in comparison with RD is carried out. In particular, in figure 10 and 11 the range and
Preprints (www.preprints.org) | NOT PEER-REVIEWED | Posted: 6 July 2018 doi:10.20944/preprints201807.0120.v1
10 of 14
azimuth cuts and the contour shaping of the same point scatterer on respective images obtainedfocusing the raw SAR data matrix are presented, showing how the range focusing obtained by theproposed procedure seems to adhere more precisely to the theoretical one than the RD focusing.
Figure 8. B.SAR Data Processing block diagram
Figure 9. Sample of focused image with the proposed algorithm (upper) compared with the standardfocusing obtained via Range Doppler algorithm (lower). ERS 1 – Matera
On the other side, at a lower resolution achieved by RD in the range direction, a higher rejectionof side lobes is obtained, showing that the clean aspect of the focused image is due to a highersmoothing of range lines. Figure 12 shows the reference functions (first left and right singular vectors)of the SVD procedure carried out on the complex raw data matrix.
Preprints (www.preprints.org) | NOT PEER-REVIEWED | Posted: 6 July 2018 doi:10.20944/preprints201807.0120.v1

11 of 14
Figure 10. Range Doppler algorithm. Point scatterer image, contour plot and range and azimuth cuts
Figure 11. B-SAR algorithm. Point scatterer image, contour plot and range and azimuth cuts
7.1. B-SAR Phase stability
The possibility of using the proposed algorithm in several applications in the field of Earthobservation, interferometry and multi-temporal interferometry should be a goal to pursue even whennon mission parameters are known. To this goal, phase stability of the proposed approach for blindSAR data focusing should reveal stable in phase. To address the phase stability the interferometricimage has been computed in a tandem pair image of ERS1-2 pass over the Fucino region in Italy.Fig.13 shows one of the focused images of the tandem pass pair, while figure 14 shows the (5 looks,slope corrected) interferometric image obtained by B-SAR focusing algorithm with superimposedthe intensity image. A close correspondence between the flat zones in the valley with the smoothvariations of the phase seem to assess the good behavior and the phase stability of the proposedprocessing technique.
Preprints (www.preprints.org) | NOT PEER-REVIEWED | Posted: 6 July 2018 doi:10.20944/preprints201807.0120.v1

12 of 14
The superposition of SAR image and interferometry fringes is reported in the last figure showinga good adherence to the zones of the region imaged. In particular, very smooth interference fringesare evident on the flat land region among hills around.
Figure 12. The reference functions (real parts) of the SVD procedure carried out on the complex rawdata matrix: the quasi constant amplitude of the range chirp and the beam shaped returns in theazimuth direction are clearly visible
8. Discussion, limitations and future developments
In this work the SVD decomposition has been used to extract correlated information from SARraw data on scenes where a strong point scatterer is present. The use of the SVD is a sufficientinformation allowing the development of a simple and direct procedure to focus the acquired datawithout the need of information about the sensor attitudes, path and SAR system parameters.The proposed algorithm, at the state of the art, is sufficient to obtain a fair focused image. Theappearance of the focused image obtained with the proposed algorithm is comparable with standardRD focusing, as shown in Fig.9. To assess the performances of the proposed approach, point scattererresponses have been compared between the RD and B-SAR focused images, showing a pretty goodcorrespondence.
Figure 13. B-SAR focusing. Caramanico site, Fucino Valley, Italy
Also the problem of phase stability of the algorithm has been addressed, computing theinterference fringes corresponding to a ERS 1-2 tandem mission, showing also good adherence othe specific local orography. The main limitations of the proposed algorithm lyes in its need ofthe presence of a strong point scatterer in the imaged zone. This limitation is payed back by itssimplicity and the lack of need of the ancillary parameters file in the focusing procedure, aspect thatsimplifies both the processing and the development of simple and cheap SAR systems to be used inlocal monitoring also with the recourse to simple aerial unmanned vehicles like drones.
Preprints (www.preprints.org) | NOT PEER-REVIEWED | Posted: 6 July 2018 doi:10.20944/preprints201807.0120.v1

13 of 14
Also, the possibility of blind focusing SAR raw data, here addressed only in the presence of apoint scatterer (e.g. a corner reflector or a transponder), in the general case of SAR stripmap datafocusing represents the field of application for future work.
Figure 14. B-SAR, 5 looks, slope corrected interferometric image obtained by B.SAR focusingalgorithm with superimposed the intensity image. Caramanico site, Fucino Valley, Italy.
9. Conclusions
Fair maps can be obtained by focusing SAR stripmaps raw data with the proposed algorithm.Obtained results are close to the standard images given by the official space agencies. The proposedalgorithm, developed in Matlab, is distributed under the Noncommercial – Share Alike 4.0 –International Creative Common license by the authors.
10. References
1. Ridenour, L. N., Radar System Engineering, McGraw-Hill Book Co.,New York, 1945, or BostonTechnical Lithographers, Lexington, Mass., 1963.
2. Skolnik, M. I., Introduction to Radar Systems, McGraw-Hill Book Co., New York,1962.3. Klauder, J. R., Price, A. C., Darlington, S., Albersheim, W. J., The Theory and Design of Chirp
Radars," Vol. 39, No 4, Bell System Technical Journal, July 1960.4. L. J. Cutrona, "Synthetic aperture radar" in Radar Handbook, New York:McGraw-Hill, pp.
23.1-23.25, 1970.5. C. Cafforio and C. Prati and F. Rocca, SAR data focusing using seismic migration techniques,
IEEE Transactions on Aerospace and Electronic Systems, 1991, vol. 27, no 2, pp. 194-207, doi10.1109/7.78293, ISSN 0018-9251
6. R. Bamler, A comparison of range-Doppler and wavenumber domain SAR focusing algorithms,IEEE Transactions on Geoscience and Remote Sensing, 1992, vol 30,no 4, pp. 706-713,doi10.1109/36.158864, ISSN 0196-2892
7. Golub, G. H. and Reinsch, C., Singular value decomposition and least squares solutions,Numerische Mathematik, 1970, Apr, 01, vol. 14, no.5, pp. 403-420, issn 0945-3245, doi10.1007/BF02163027
8. A. S. Amein and J. J. Soraghan, Fractional Chirp Scaling Algorithm: Mathematical Model, IEEETransactions on Signal Processing, 2007, vol 55, no 8, pp. 4162-4172, doi 10.1109/TSP.2007.895994,ISSN 1053-587X
9. W. Wang and R. Wang and Z. Zhang and Y. Deng and N. Li and L. Hou and Z. Xu, FirstDemonstration of Airborne SAR With Nonlinear FM Chirp Waveforms, IEEE Geoscience andRemote Sensing Letters, 2016, Feb, vol. 13, no. 2, pp. 247-251, doi: 10.1109/LGRS.2015.2508102,ISSN: 1545-598X
Preprints (www.preprints.org) | NOT PEER-REVIEWED | Posted: 6 July 2018 doi:10.20944/preprints201807.0120.v1
14 of 14
10. P. Imperatore and A. Pepe and R. Lanari, Spaceborne Synthetic Aperture Radar Data Focusing onMulticore-Based Architectures, IEEE Transactions on Geoscience and Remote Sensing, 2016, Aug,vol. 54, no. 8, pp. 4712-4731, doi: 10.1109/TGRS.2016.2550201, ISSN: 0196-2892
11. L. Chen and D. An and X. Huang, Extended Autofocus Backprojection Algorithm forLow-Frequency SAR Imaging, IEEE Geoscience and Remote Sensing Letters, 2017, Aug, vol. 14,no. 8, pp. 1323-1327, doi: 10.1109/LGRS.2017.2711005, ISSN: 1545-598X
12. L. Ran and Z. Liu and L. Zhang and T. Li and R. Xie, An Autofocus Algorithm for EstimatingResidual Trajectory Deviations in Synthetic Aperture Radar, IEEE Transactions on Geoscience andRemote Sensing, 2017, June, vol. 55, no. 6, pp. 3408-3425, doi: 10.1109/TGRS.2017.2670785, ISSN:0196-2892
13. D. Li and H. Lin and H. Liu and G. Liao and X. Tan, Focus Improvement for High-ResolutionHighly Squinted SAR Imaging Based on 2-D Spatial-Variant Linear and Quadratic RCMsCorrection and Azimuth-Dependent Doppler Equalization, IEEE Journal of Selected Topics inApplied Earth Observations and Remote Sensing, 2017, Jan, vol. 10, no. 1, pp. 168-183, doi:10.1109/JSTARS.2016.2569561, ISSN: 1939-1404
14. J. Ma and H. Tao and P. Huang, Subspace-based super-resolution algorithm for ground movingtarget imaging and motion parameter estimation, IET Radar, Sonar Navigation, 2016, vol. 10, no.3, pp. 488-499, doi: 10.1049/iet-rsn.2015.0188, ISSN: 1751-8784
15. J. Torgrimsson and P. Dammert and H. Hellsten and L. M. H. Ulander, An Efficient Solution tothe Factorized Geometrical Autofocus Problem, IEEE Transactions on Geoscience and RemoteSensing, 2016, Aug, vol. 54, no. 8, pp. 4732-4748, doi: 10.1109/TGRS.2016.2550663, ISSN:0196-2892
16. Brian D. Rigling, Flying blind: a challenge problem for SAR imaging without navigational data,Proc. SPIE, 3 May 2012, vol. 8394, doi 10.1117/12.923439
17. L. Zhang and M. Hu and G. Wang and H. Wang, Range-Dependent Map-Drift Algorithm forFocusing UAV SAR Imagery, IEEE Geoscience and Remote Sensing Letters, 2016, Aug, vol. 13,no. 8, pp. 1158-1162, doi: 10.1109/LGRS.2016.2574752, ISSN: 1545-598X
18. P. Guo and S. Tang and L. Zhang and G. C. Sun, Improved focusing approach for highly squintedbeam steering SAR, IET Radar, Sonar Navigation, 2016, vol. 10, no. 8, pp. 1394-1399, doi:10.1049/iet-rsn.2015.0473, ISSN: 1751-8784
19. Z. Li and Y. Liang and M. Xing and Y. Huai and L. Zeng and Z. Bao, Focusing of Highly SquintedSAR Data With Frequency Nonlinear Chirp Scaling, IEEE Geoscience and Remote Sensing Letters,2016, Jan, vol. 13, no. 1, pp. 23-27, doi: 10.1109/LGRS.2015.2492681, ISSN: 1545-598X
20. C. Noviello and G. Fornaro and M. Martorella, Focused SAR Image Formation of Moving TargetsBased on Doppler Parameter Estimation, IEEE Transactions on Geoscience and Remote Sensing,2015, June, vol. 53, no. 6, pp. 3460-3470, doi: 10.1109/TGRS.2014.2377293, ISSN: 0196-2892
21. S. Tang and L. Zhang and P. Guo and G. Liu and Y. Zhang and Q. Li and Y. Gu andC. Lin, Processing of Monostatic SAR Data With General Configurations, IEEE Transactionson Geoscience and Remote Sensing, 2015, Dec, vol. 53, no. 12, pp. 6529-6546, doi:10.1109/TGRS.2015.2443835, ISSN: 0196-2892
22. C. Guaragnella, T. D’Orazio, B.SAR - Blind SAR Data Focusing, SPIE - International Conferenceon Image and Signal Processing for Remote Sensing, Berlin, 2018, sept. 10-13
Preprints (www.preprints.org) | NOT PEER-REVIEWED | Posted: 6 July 2018 doi:10.20944/preprints201807.0120.v1