Embed Size (px)
Citation preview
Scholars' Mine Scholars' Mine
Masters Theses Student Theses and Dissertations
Fall 2015
A decision support simulation model for bed management in A decision support simulation model for bed management in
healthcare healthcare
Raja A. Baru
Follow this and additional works at: https://scholarsmine.mst.edu/masters_theses
Part of the Health Services Administration Commons, and the Operations Research, Systems
Engineering and Industrial Engineering Commons
Department: Department:
Recommended Citation Recommended Citation Baru, Raja A., "A decision support simulation model for bed management in healthcare" (2015). Masters Theses. 7460. https://scholarsmine.mst.edu/masters_theses/7460
This thesis is brought to you by Scholars' Mine, a service of the Missouri S&T Library and Learning Resources. This work is protected by U. S. Copyright Law. Unauthorized use including reproduction for redistribution requires the permission of the copyright holder. For more information, please contact [email protected].

A DECISION SUPPORT SIMULATION MODEL FOR BED MANAGEMENT IN
HEALTHCARE
by
RAJA ANVESH BARU
A THESIS
Presented to the Faculty of the Graduate School of the
MISSOURI UNIVERSITY OF SCIENCE AND TECHNOLOGY
In Partial Fulfillment of the Requirements for the Degree
MASTER OF SCIENCE
in
ENGINEERING MANAGEMENT
2015
Approved by
Dr. Elizabeth A. Cudney, Advisor
Dr. Ivan G. Guardiola
Dr. Susan L. Murray

Copyright 2015
Raja Anvesh Baru
All Rights Reserved

iii
PUBLICATION THESIS OPTION
This thesis consists of the following two articles that have been submitted for
publication as follows:
Paper I, Pages 2 - 18 were submitted to the INDUSTRIAL AND SYSTEMS
ENGINEERING RESEARCH CONFERENCE.
Paper II, Pages 19 - 46 were submitted to the HEALTH CARE
MANAGEMENT SCIENCE JOURNAL.

iv
ABSTRACT
In order to provide access to care in a timely manner, it is necessary to effectively
manage the allocation of limited resources such as beds. Bed management is key to the
effective delivery of high-quality and low-cost healthcare. An efficient utilization of beds
requires a detailed understanding of the hospital’s operational behavior. It is necessary to
understand the behavior of a hospital in order to make necessary adjustments to its
resources, and policies, which can improve patient’s access to care. The aim of this
research was to develop a discrete event simulation to assist in planning and staff
scheduling decisions. Each department’s performance measures were taken into
consideration separately to understand and quantify the behavior of individual
departments, and the hospital system as a whole. Several scenarios were analyzed to
determine the impact on reducing the number of patients waiting in queue, waiting time
for patients, and length of stay of patients. From the results, the departments that have
long queues of patients, waiting times, and lengths of stay are detailed to predict how the
hospital reacts to patient flow.

v
ACKNOWLEDGEMENTS
I am forever grateful to Dr. Elizabeth Cudney, my thesis advisor, for her
guidance, support, and patience throughout this project. Also, I would like to thank her
for all the inputs, comments, and suggestions. She helped me during difficult situations
and gave motivational support. I am very thankful to the invaluable knowledge and sense
of discipline she has ingrained in me. I am thankful for the generous financial support she
has provided me all throughout, in the form of a research assistantship.
I would like to express my heartfelt thanks to Dr. Ivan Guardiola for serving on
my thesis committee and for his cooperation in my research. His support during the
research was inspirational and educational. I learned a lot from him during the course of
the research. I would also thank Dr. Susan Murray for the honor of having her on my
committee. Also, I would like to thank all the EMSE department staff and faculty for
everything they have done during my studies.
I would like to thank Dr. William Cahill, Dr. Raymond Phillips and staff at
Veterans Health Administration for supporting this research.
I want to my dearest ones and my friends for their support and words of
encouragement.
Finally I would like to thank my family. I could not have accomplished any of this
work without my parents care and support. Their motivation and sacrifice for my well-
being has been immense. I express my deepest gratitude to them from my bottom of my
heart.

vi
TABLE OF CONTENTS
Page
PUBLICATION THESIS OPTION…………………………………………………….. iii
ABSTRACT…………………………………………………………………………….. iv
ACKNOWLEDGEMENTS……………………………………………………………....v
LIST OF ILLUSTRATIONS……………………………………………………………viii
LIST OF TABLES………………………………………………………………………. ix
NOMENCLATURE……………………………………………………………………... x
SECTION
1. INTRODUCTION……………………………...…………………………………….1
PAPER
I. SYSTEMATIC REVIEW OF OPERATIONS RESEARCH AND SIMULATION
MODELS FOR BED MANAGEMENT…………………………………………….. 2
Abstract……………………………………………………………………………. 2
1. INTRODUCTION……………………………………………………………… 3
2. RESEARCH METHODOLOGY………………………………………………. 4
3. BED MANAGEMENT LITERATURE REVIEW…………………………….. 5
3.1. BED MANAGEMENT USING OPERATIONS RESEARCH ……………. 5
3.2. BED MANAGEMENT USING SIMULATION…………………………… 8
3.3. BED MANAGEMENT USING SIMULATION AND OPERATIONS
RESEARCH………………………………………………………………….. 12
4. CONCLUSION…………………….………………………………………….. 14
References………………………..………………………………………………. 16

vii
II. A DECISION SUPPORT SIMULATION MODEL FOR BED MANAGEMENT
IN HEALTHCARE…………………………………………………………............ 19
Abstract……………….………………………………………………………….. 19
INTRODUCTION AND MOTIVATION……………….………………………. 20
LITERATURE REVIEW…………………………………….………………….. 21
HOSPITAL BACKGROUND…………………………………….……………... 26
RESEARCH METHODOLOGY…………………………………….……. ……. 26
MODELING AND SIMULATION METHODOLOGY…………….…………... 30
MODEL VERIFICATION AND VALIDATION…………………….…………. 33
ANALYSIS OF SIMULATION RESULTS…………………………….………. 35
SCENARIO 1: REDUCE THE NUMBER OF PEOPLE WAITING IN
QUEUE AND WAITING TIME BY DECREASING THE BED
TURNOVER TIME……………...…………………………………………….. 36
SCENARIO 2: REDUCE THE NUMBER OF PEOPLE WAITING IN
QUEUE AND WAITING TIME THROUGH A REDUCTION IN LOS…….. 37
SCENARIO 3: ADDITION OF FOUR BEDS TO 3 TCU AND TWO
BEDS 4 MSU………………………………………...........…………………… 39
CONCLUSIONS AND IMPLICATIONS………………………………………. .40
LIMITATIONS AND FUTURE RESEARCH…………………………………... 41
References………………..………………………………………………………. 43
SECTION
2. CONCLUSIONS………………….……………………………………………….. 47
VITA……………………………………………………………………………………. 48
viii
LIST OF ILLUSTRATIONS
Figure Page
PAPER II
4.1. Graphical Distribution of LOS for the ICU Department…………………………... 28
5.1. Conceptual Model for Simulation………………………………………………….. 31
5.2. Bed Layout in the Arena Simulation………………………………………………. 33
7.1. Average number of people waiting in queue with reduced LOS…………………... 39

ix
LIST OF TABLES
Table Page
PAPER I
3.1. Comparison of Operation Research Methods………………………………………. 7
3.2. Comparison of Simulation Methods………………………………………………...11
3.3. Comparison of Operations Research and Simulation Methods……………………. 14
PAPER II
4.1. Distributions for all departments…………………………………………………... 28
4.2. Proportions of Transfers by Department…………………………………………… 29
6.1. P values of LOS simulated and actual values……………………………………… 35
7.1. P values for reduced bed turnover time……………………………………………. 37
7.2. P values for reduced LOS………………………………………………………….. 38
7.3. Comparative analysis for 3 TCU with 16 and 20 private beds…………………….. 39
7.4. Comparative analysis for 4 MSU with 5 and 7 private beds ……………………… 40

x
NOMENCLATURE
Symbol Description
LOS length of stay
ICU intensive care unit
3 TCU transitional care unit on third floor
3 MSU medical surgery unit on third floor
4 MSU medical surgery units on fourth floor
ED emergency department
TCU transitional care unit
MSU medical surgery unit
OR operating room
M/ PH/ c poisson arrivals/ phase type/ number of servers
MAU medical assessment unit
VAMC veterans administration medical center
BMS bed management system
EDIS emergency department integration software
FIFO first in first out
ANOVA analysis of variance
1. INTRODUCTION
The demand for hospitals has been increasing with the increase in population, but
the resources are not increasing accordingly. Bed management has become an important
criterion in delivering quality and cost effective health care. An efficient utilization of
beds requires a detailed understanding of the hospital’s operational behavior. It is
necessary to understand the behavior of a hospital in order to make necessary adjustments
to its resources, and policies, which can improve patient’s access to care.
In order to learn what has already been researched in the field of bed
management, Paper I provides a current literature review in bed management. It
investigates the utilization of various operations and simulation methods to analyze and
design hospital facilities. It also details the problems faced during capacity planning and
in the process of developing models for bed management.
This research focuses on developing a simulation model for decision support for
bed management. Most hospitals have a restriction on beds, and large amounts of money
are needed to increase the capacity. Hospitals need to have a model for how they would
behave if they were to increase the resources in any department or decrease the bed
turnover time or reduce the length of stay for patients. All of these activities are difficult
to implement in the real world but it is easier to implement these decisions in a simulation
model. Paper II covers the simulation model for a hospital to understand the hospital’s
behavior. The model developed in this paper was meant to assist in planning and staff
scheduling decisions. It is provided along with several scenarios to reduce the patient
waiting times and length of queue of patients.

2
PAPER
I. SYSTEMATIC REVIEW OF OPERATIONS RESEARCH AND SIMULATION
METHODS FOR BED MANAGEMENT
Raja A. Baru, Elizabeth A. Cudney, and Ivan G. Guardiola
Engineering Management and Systems Engineering
Missouri University of Science and Technology
Rolla, MO 65401, USA
Debra L. Warner and Raymond E. Phillips
Veterans Health Administration
Abstract
Efficient functioning of a hospital depends on how it allocates its resources, particularly
allocating beds to patients, a problem fraught with complexities and uncertainties.
Prolonged waiting induces patients leaving the hospital without being seen and causing
losses to the hospital. To improve hospital efficiency and level of service, decision
support systems are proposed to enable better decisions. There is substantial published
research evaluating the use of decision support systems applied to analyze and design
hospital facilities. The approaches identified in the literature include operations research
techniques such as integer programming, goal programming, stochastic process, and
queuing theory; simulation; and, in some cases, both approaches are used. These
techniques enable a hospital to treat its patients more efficiently, meet performance
targets, and manage costs. This paper aims to review and categorize this literature to
motivate further research in bed management. In addition, various practices in different
specialization units, problems faced while capacity planning, and methods developed for
bed management in hospitals are provided.
Keywords
Bed Management, Healthcare, Literature Review

3
1. INTRODUCTION
Bed management has been an issue from the evolution of hospitals, but due to the
increasing demand it has become more critical. In addition, bed management has become
an important criterion in delivering quality and cost effective health service. Now it has
grown to such a level that most hospitals have a bed management team for capacity
planning.
Bed management is the allocation and provision of beds especially in a hospital where
beds in specialist wards are a scarce resource [1]. It is focused on facility performance
and reduction in costs to both the hospital and patients through optimization of the
various processes involved. Bed management involves goal oriented tasks. The goals of
bed management involve access to an appropriate bed to each patient in a timely way and
reduction in number of patients that are turned away and directed to another facility due
to lack of an available bed. There are numerous benefits of bed management including
customer satisfaction, increased profits, forecasting capacity, and increased level of care.
Hospitals must focus on reliability, accuracy, and customer level of care to be
competitive and profitable, a key method to accomplish this is by continuously improving
their bed management system. Complexity in planning is rising due to the increased day-
to-day variations in demand and insufficient resources.
A convenient model for planning needs to involve the best techniques, objectives,
adaptability, and usability by staff. To develop a model it involves analyzing different
approaches, identifying drawbacks and system constraints, testing these approaches, and
implementing and validating the solutions. Hospital administrators can choose these
techniques for planning (e.g., operations, simulation). These techniques are used to
monitor, analyze, and improve flow processes, which can aid in increasing inpatient
number and quality. Through the use of these techniques hospital staff are able to manage
and develop an understanding of the critical situations and develop solutions through the
use of collective knowledge [2].
Further improvement in practices is necessary to meet the requirements due to the
increased demand and constantly changing scenarios. There are more complexities day-
by-day, and often hour-by-hour, and improving bed management systems will increase

4
efficiency, improve prediction of inpatients, enable better health care, and reduced risks.
Several decision support systems are currently used to route the patient flow into
respective hospitalization units. These decision support systems include operations
research techniques such as integer programming, goal programming, stochastic process,
queuing theory; simulation; and, in some cases, both approaches are used.
Out of the many subsystems in a healthcare system, hospitals are highly integrated
service units attending to the needs of the patients under treatment. A hospital system
consists of a number of sub-units which can include the emergency department (ED),
intensive care unit (ICU), transitional care unit (TCU), medical surgical unit (MSU),
operating room (OR), and diagnostic services, such as pathology and radiology, etc.
Healthcare systems deal with different aspects of healthcare and its problems are due to
several combinations of patient status, service types, and varieties of constraints.
Therefore, it is necessary to design the system with respect to the various constraints and
conditions [3-6].
The purpose of these techniques is to identify the factors that are causing bed blockage,
occupancy level, length of stay (LOS), number of inpatient admissions, and patient
tracking. The increasing cost of operations and maintenance, and healthcare cost to the
patients due to the use of newer technologies, resources, and methods have added newer
dimensions as constraints to the problems of healthcare system [7-9].
2. RESEARCH METHODOLOGY
This study aimed to review the existing literature regarding bed management practices,
use of bed management, and provide findings and trends. The research was carried out
using the Google Scholar database. With the research goals in mind, the terms operations
research, simulation, and bed management were used to search for articles. Since bed
management has been a research topic for many years, no data ranges were used to limit
the search. There are many sources that outline these various topics of bed management.
A thorough search of peer-reviewed literature was conducted and the findings compiled.
Through the systematic literature review, several main themes for research practices were
identified. These included the use of operations research, simulation, and combined

5
operations research and simulation models. The following section provides the literature
review based on these categories [2].
3. BED MANAGEMENT LITERATURE REVIEW
The required number of beds to meet the demand is a recurrent problem in bed
management. Therefore, hospital capacity planning is a well-researched problem in
healthcare [10, 11]. There are several practices followed to solve this problem based on
different concepts. Oliveira et al. utilized a data mining tool to identify data about
patient’s management to provide decision makers with critical information to aid their
decisions [12].
Most recently, Tortorella et al. investigated bed management in detail by employing a
different approach that increased the patient’s bed turn over time through coordination
and communication. Through the development of a bed management system,
communication was improved among the various disciplines in the system. This led to an
increase inpatient flow [13].
Lovett et al. reported an innovative approach that integrates multiple services into a
single patient flow management center to manage the supply and demand for inpatient
services across the system [14]. This process aids in improving communication,
coordination, and accountability. It is important to note that while researchers are
investigating various practices in bed management, there are many other models that
warrant discussion [2].
3.1 BED MANAGEMENT USING OPERATIONS RESEARCH
Several researchers looked at the effectiveness of practicing operation research
techniques for bed management. To that point, Cochran et al. approximated the hospital
inpatient demand by employing a queuing technique for decision-making. They
identified, in general, that patients’ data is collected at midnight, but this data cannot be
taken into consideration since it does not indicate any variations in demand during the
day. The month of March was selected for analysis because it is considered to be the
busiest month by hospital management. They deduced that financial data plays a vital

6
role and for inpatient bed capacity planning; therefore, this data should be utilized in any
analysis [15].
Similarly, Cote developed an advanced forecasting model using census data. This model
determined the frequency distribution using hourly census information to interpret bed
demand. Cote developed an analytical model, compared the results with the simulation
results, and concluded that both results were almost similar. It was determined that the
analytical model avoids the computational effort necessary in simulation models [16].
Gorunescu et al. took a broader approach by using queuing theory to illustrate patient
flow to develop an approach for advancing the utilization of hospital resources in order to
enhance care. They utilized the M/PH/c queue, where M is for Poisson arrivals, PH is the
service distribution (i.e. phase type), and c denotes the number of beds. The research
provided a method for determining the optimum number of beds by giving an adequate
level of patient dismissal. The finding suggested that a level of 10-15% bed vacancy is
important to maintain administration productivity [17].
Utley et al. proposed the creation of an intermediate care unit in the process from
emergency to specialized wards. The optimal number of beds in the care unit is
determined using a mathematical sizing model. This model calculates the patient flows,
waiting times, length of stay, and service time until they discharge from care unit. This
approach reduces the excess flow of patients into acute care and reduces the losses due to
admission cancellations [18].
Nguyen et al. proposed a straightforward model to hone the bed capacity of a hospital.
The proposed model took into account a score model with three elements as parameters,
which included the number of beds, number of unscheduled affirmations, and number of
vacant beds. The optimum number of beds is the number for which both the mean and the
standard deviation of the score are the least. The algorithm of the model is focused
around the increase of one virtual bed at each stage and the count of the score for every
saturation limit for each empty bed [19].
With a different view, Akcali et al. developed a network model that simultaneously
determines the timing and extent of changes in bed limit that minimizes the limit expense

7
while maintaining the desired level of quality operation. The research transformed the
capacity planning model into a shortest path model, where the target is to minimize the
expense. This model fuses the sensible concerns connected with deciding the size of the
hospital, for example, finite planning horizon, an upper limit on the normal holding up
time, and budget constraint. It accommodates capacity change through shuttering. One
limitation of this model is that it is focused around a broad view in the assumption that
the requirement and service are equal [20].
Recently, Bachouch et al. proposed a model that involves bed planning for both elective
and acute patients. Several constraints such as single rooms, no mixed-sex rooms,
incompatibility between pathologies, and contagious patients are taken into account while
planning. Each time the same patient is hospitalized, the patient is allocated to the same
bed and an availability time period is defined. An integer linear program is constructed
based on these constraints. The objective function is to minimize the associated costs due
to readmission of the patient and refused admissions [21].
Ataollahi et al. proposed the use of goal programming for bed management. Goal
programming is a technique used for multiple objective optimization. Goal programming
is different from linear programming, in that instead of maximizing or minimizing the
objective function, the deviations between objectives are minimized in light of the
constraints. The three steps of goal programming model include defining the decision
variables, defining the goals, and defining the deviation variables. This model is solved
using General Algebraic Modeling System (GAMS) [22]. Table 1 provides a summary of
the various operations research methods for bed management.
Table 3.1. Comparison of Operations Research Methods
Author Method Findings
Cochran
Queuing Technique March is busiest month.
Midnight data cannot be taken
into consideration.
Financial data plays a vital
role.
Cote Forecasting Model Frequency distribution of data
helps to interpret bed demand.

8
Table 3.1. Comparison of Operations Research Methods (cont.)
Gorunescu M/PH/c queue 10-15% bed vacancy helps to
improve productivity.
Utley Mathematical sizing model The creation of intermediate
care regulates excess patient
flow.
Nguyen Score model The optimum number of
patients is for which mean and
SD are least.
Akcali Network model This model reduces the timing
and extent of changes in bed
limit that reduces expense.
Bachouch Integer linear model Expenses due to readmission
of patient and refused
admissions can be reduced.
Ataollahi Goal programming Minimum deviations between
objectives helps to identify
optimal number of beds
required.
3.2 BED MANAGEMENT USING SIMULATION
Researchers have also proposed several models using a different approach based on
simulation to solve the bed management problem because of its ability to analyze
dynamic situations.
In order to optimize bed management, El-Darzi et al. analyzed a geriatric department in a
hospital to study the effect of length of stay, occupancy, and bed blocking on patient
flow. Discrete event simulation was used to identify the distribution, flow in each state,
and key factors affecting the flow. With the help of a queuing system, the model
estimated the bed blockage quantities among different units. Several constraints were
placed on the queue list and the amount of emptiness needed for each state. The
limitation in this approach is the model assumed that both the arrival and admission
number were the same [23].
The research of Huang mainly focused on reducing the medical emergency admissions by
15% through the medical assessment unit (MAU) and reducing the patient’s average
length-of-stay by one day. The decision making support provided includes the

9
determination of size of the MAU (i.e., number of beds), which helps in allocating beds
to different units. The research evaluated the number of beds required for the MAU to
handle the expected load by taking the results from the data collected in the month of
March as it is the believed to be the busiest month of a year. A computer simulation
model using the AT&T Witness simulation package was developed with the available
data to estimate how many beds were required by the MAU and to represent the mid-day
bed occupancies of each specialty. The average bed occupancy rate of a specialty by its
own patients was increased if the emergency patients are sent to the MAU and they
deliberately ignored the effect of bed overflows, and then checked the effect of bed
overflows. The objective was to minimize the number of bed days with overflow. The
model was used to simulate and obtain an optimal bed allocation only in the sense to
achieve the objective [24].
Standridge et al. proposed that simulation can be applied to various public related
problems within the hospital. A description of how simulation is useful in each of these
areas with examples was provided. Standridge et al. explained that simulation was better
in analyzing various cases and barriers to the acceptance of simulation. The main
limitation is that the use of simulation is complex; therefore, a simpler and faster
foundation should be taken [25].
In another application, Bagust et al. determined the effect of emergency department
admissions on hospital bed management. The research examined the effect of emergency
admissions on hospital bed demand on a daily basis to identify the bottlenecks of
inpatient flow. Discrete event simulation modeling was used due to randomness in the
demand. The proposed model defines the relationship between fluctuating demand and
available bed capacity. The results of the model indicate that a hospital can have regular
shortages if the average bed occupancy of the unit rises to 90% or more. The limitation to
the proposed model is the length of the time required to run the model [15, 26].
Elbeyli et al. examined inpatient flow to identify bottlenecks and assess the impact of bed
availability on the waiting time of the admitted patients in ED before being transferred to
other units of the hospital. Bottlenecks are the sources of long waiting times. The
simulation software ProModel was used for this research. First, data related to the daily

10
volume of the ED and other units was collected and analysis was performed. Several
what-if scenarios such as adding beds were introduced into the model and results were
compared [27].
Harper et al. created a simulation model using a three-phase simulation shell, which is
flexible and fast. The research identified that the deterministic way of calculating length
of stay, which uses a constant daily arrival rate that is independent of time for emergency
and elective patients, would lead to erroneousness results. Therefore, the determination of
LOS for each individual department would be a more representative indicator in the
estimation of beds. The priority of relationship between bed occupancy and refusal rate,
forecasting future bed requirements, and patient categorization could be illustrated by this
model [28].
A simulation model that focused on the plausibility of elective surgery quotas in
conjunction with a planning window to enhance the booking of elective surgeries for an
ICU (consisting of 14 beds) was the focus of the research of Kim et al. The steps for this
model include establishing a scheduling window and a specific form of quota system.
The research was performed using a simulation of one surgery per day quota system, two
surgeries per day quota system on a horizon of a one week and two week window. From
the results obtained it was recommended one elective surgery per day quota system over
a week or 2 week scheduling window reduces the number of cancellations in surgeries.
However, there is an effect from the quota system on upstream patient sources and the
downstream ICU server. Therefore, the research determined that linking the controllable
process, the scheduling of elective surgeries, and the ICU admission process would
improve the performance of the ICU [29].
A simulation model approach was proposed by Eldabi et al. called the Modelling
Approach that is Participative Iterative for Understanding (MAPIU). The main objective
was to improve the understanding of the system by stakeholders. Eldabi et al. explained
how the steps in a simulation model varied by different authors in the construction of a
simulation model. The research proposed an alternative model to all the existing
simulation models that includes the participation of stakeholders in the model [30].
11
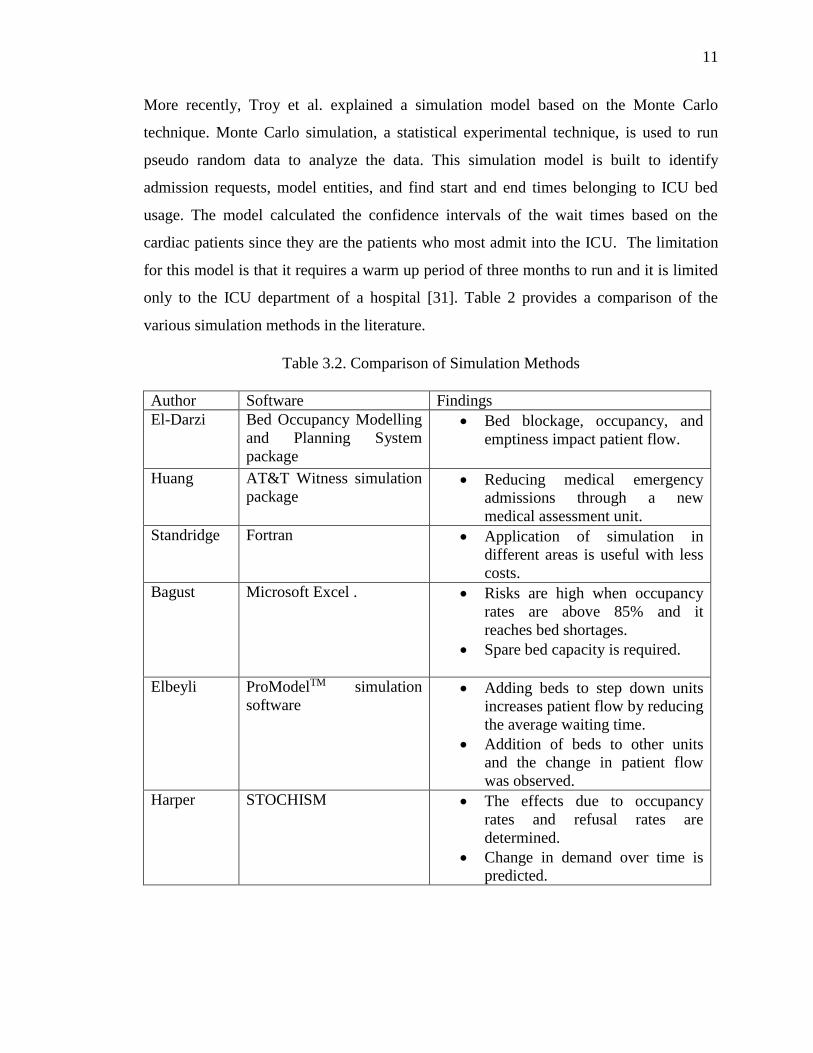
More recently, Troy et al. explained a simulation model based on the Monte Carlo
technique. Monte Carlo simulation, a statistical experimental technique, is used to run
pseudo random data to analyze the data. This simulation model is built to identify
admission requests, model entities, and find start and end times belonging to ICU bed
usage. The model calculated the confidence intervals of the wait times based on the
cardiac patients since they are the patients who most admit into the ICU. The limitation
for this model is that it requires a warm up period of three months to run and it is limited
only to the ICU department of a hospital [31]. Table 2 provides a comparison of the
various simulation methods in the literature.
Table 3.2. Comparison of Simulation Methods
Author Software Findings
El-Darzi Bed Occupancy Modelling
and Planning System
package
Bed blockage, occupancy, and
emptiness impact patient flow.
Huang AT&T Witness simulation
package Reducing medical emergency
admissions through a new
medical assessment unit.
Standridge Fortran Application of simulation in
different areas is useful with less
costs.
Bagust Microsoft Excel . Risks are high when occupancy
rates are above 85% and it
reaches bed shortages.
Spare bed capacity is required.
Elbeyli
ProModelTM simulation
software Adding beds to step down units
increases patient flow by reducing
the average waiting time.
Addition of beds to other units
and the change in patient flow
was observed.
Harper STOCHISM The effects due to occupancy
rates and refusal rates are
determined.
Change in demand over time is
predicted.

12
Table 3.2. Comparison of Simulation Methods (cont.)
Kim Slam II simulation
language Linking the scheduling of elective
surgeries through a quota system
to admission process can improve
the performance of ICU.
Troy Monte Carlo Simulation Functional capacity has the
strongest impact on performance
than actual capacity.
3.3 BED MANAGEMENT USING SIMULATION AND OPERATIONS
RESEARCH
A hybrid approach where researchers took advantage of both operations research and
simulation to reduce the complexities involved and to improve the patient flow has also
been applied in the literature. This combined approach helps in identifying several key
factors that influence patient flow in hospitals [31].
With this view, Costa et al. proposed a model to calculate the number of beds in a critical
care unit. This model takes the distribution of data of different categories to determine the
number of patients expected in a year, length of stay, and a target occupancy level. The
research defined the steps of model as 1) rules are required to explain the patients flow;
2) statistical information about the current patient case mix, arrival patterns, length of
stay, and number of beds is needed; and 3) the model is run repetitively with the current
rules dictating patients’ flow, to simulate the working unit with patients’ arriving and
leaving over long periods. In the last step, the results are compared with the actual data to
verify the model. The model is based on queuing theory and computer simulation is used
to solve the complex mathematical equations [32].
Marshall et al. proposed a model for patient flow based on the length of stay. The
research focused on bringing together recent developments for inpatient flow modelling.
For modelling LOS, probabilistic solutions are used to quantify their impact and
sustainability in supporting hospital management service. Markov models, phase-type
distributions, and conditional phase distributions are used in the proposed model. In

13
addition, this approach suggested a mixed exponential model for the compartmental
model of stream which can be converted to a discrete event simulation model [33].
Cochran et al. proposed a model to balance bed utilization by reducing bed blocking.
Queuing networks are first used to analyze the flow patterns, then discrete event
simulation is performed to maximize the flow. Queuing network analysis can be then
used to test the bed reallocation. In order to maximize the flow and determine the waiting
times the model used simulation; in particular, this research used the ARENA simulation
package. The limitation is a large simulation model must be tested in order to validate the
model with actual data. This can take a large warm-up time period, which is time
consuming [34].
In another application, Oddoye et al. described the importance of a medical assessment
unit to reduce the bottlenecks in acute patient flow in a general hospital. Simulation with
the help of goal programming was performed to set the objectives to aid in decision-
making. A visual interactive modelling system, developed in Micro Saint, was designed
for patient flow in the hospital. The advantage of this simulation model is it takes less
time to run and the results obtained are consistent with the different scenarios tested.
Changes in the resources were also verified to determine these effects on the system [35].
Kokangul proposed a nonlinear mathematical model to determine the optimum number of
beds. First, a simulation model was constructed, then the relationship between control
parameters was determined. Finally, nonlinear mathematical models were used.
Statistical modeling packages are used to determine the distributions for the daily
accepted, rejected, transferred arrivals, discharges, and length of stay. The mathematical
relationship between the control parameters and size of bed capacity is unknown;
therefore, a fitting capacity function containing unknown parameters had to be chosen,
and these parameters are estimated from the simulation models. Subsequently, this was
performed for each of the control parameters suitable mathematical relationships; for
example, linear or quadratic relationships should be obtained. Then these can be utilized
as objective functions or constraints in nonlinear numerical models. These nonlinear
models were solved using LINGO or MATLAB [36]. Table 3 provides a summary of the
research literature in which both operations research and simulation models were applied.

14
Table 3.3. Comparison of Operations Research and Simulation Models
Author Method and Software Findings
Costa Queuing theory and
classification and
regression tree (CART)
analysis
Developed a simulation model which
predicts the arrival of patients in the
Intensive Care Unit.
A model based on the average values
leads to false results.
Marshall Queuing and Bed
Occupancy
Management and
Planning System
(BOMPS)
A different way in determining length
of stay using Markov models, phase
type distributions, and conditional
phase type distributions is performed
rather than calculating averages for
length of stay parameter.
Cochran Jackson Queuing
networks and ARENA
simulation package
Queuing network was used to find out
the bottlenecks in different units.
Simulation is done to balance the
demand for beds.
Oddoye Goal Programming and
Micro Saint Importance of a medical assessment
unit in an acute hospital and the way it
helps to manage patient flow.
Simulation is developed to reduce the
bed blockage.
Kokangul LINGO or MATLAB Simulation was used to find the
mathematical relationship between
control parameters and size of bed
capacity.
Cost analysis of additional bed
capacity is performed
4. CONCLUSION
Bed management is a complex issue in healthcare system. However, the current literature
has tackled the issue from multiple perspectives. Here, we have investigated several ways
to solve bed management using operations research, simulation, and both techniques.
While this review limits itself to bed management, operations research, and simulation,
there are many more documented examples of solving bed management using different
techniques. Therefore, much research exists. It is relevant to mention that a successful
bed management strategy is complex and should be handled with care. Administrators

15
and staff need to be educated more and awareness is necessary to use different software
for bed management. Moreover, research has to be continuous in this area to determine
the best practices for bed management.

16
References
1. Boaden, R., Proudlove, N., & Wilson, M., 1999, “An exploratory study of bed
management,” Journal of Management in Medicine, 13(4), 234-250.
2. Cudney, E. A., Elrod, C. C., & Stanley, S. M., 2014, “A systematic literature review
of Six Sigma practices in education,” International Journal of Six Sigma and
Competitive Advantage, 8(3), 163-175.
3. Cardoen, B., Demeulemeester, E., & Beliën, J., 2010, “Operating room planning and
scheduling: A literature review,” European Journal of Operational Research, 201(3),
921-932.
4. Cayirli, T., & Veral, E., 2003, “Outpatient scheduling in health care: a review of
literature,” Production and Operations Management, 12(4), 519-549.
5. Kim, S. C., Horowitz, I., Young, K. K., & Buckley, T. A. (1999). Analysis of
capacity management of the intensive care unit in a hospital. European Journal of
Operational Research, 115(1), 36-46.
6. McClean, S. I., & Millard, P. H., 1998, “A three compartment model of the patient
flows in a geriatric department: a decision support approach,” Health care
management science, 1(2), 159-163.
7. Brailsford, S., & Vissers, J., 2011, “OR in healthcare: A European perspective,”
European journal of operational research, 212(2), 223-234.
8. Brandeau, M. L., Sainfort, F., & Pierskalla, W. P. (Eds.), 2004, “Operations research
and health care: a handbook of methods and applications,” Springer Science &
Business Media, 70.
9. Rais, A., & Viana, A., 2011, “Operations research in healthcare: a survey,”
International Transactions in Operational Research, 18(1), 1-31.
10. Newsholme H.P., 1933, “Hospital bed accommodation,” Public Health, 46, 73-77.
11. Hardie, M.C., 1954, “Hospital bed for children,” The Lancet, 263 (6816), 831.
12. Oliveira, S., Portela, F., Santos, M.F., Machado, J., & Abelha, A., 2014, “Hospital
bed management support using regression data mining models,” Proceedings
IWBBIO 2014, Granada.
13. Tortorella, F., Ukanowicz, D., Douglas-Ntagha, P., Ray, R., & Triller, M., 2013,
“Improving bed turnover time with a bed management system,” Journal of Nursing
Administration, 43(1), 37-43.

17
14. Lovett, P.B., Illg, M.L., & Sweeney, B.E., 2014, “A Successful Model for a
Comprehensive Patient Flow Management Center at an Academic Health System,”
American Journal of Medical Quality (in press).
15. Cochran, J.K., & Roche, K., 2008, “A queuing-based decision support methodology
to estimate hospital inpatient bed demand,” Journal of the Operational Research
Society, 59(11), 1471-1482.
16. Cote, M.J., 2005, “A note on Bed allocation techniques based on census data,” Socio-
Economic Planning Sciences, 39(2), 183-192.
17. Gorunescu, F., McClean, S.I., & Millard, P.H., 2002, “A queuing model for bed-
occupancy management and planning of hospitals,” Journal of the Operational
Research Society, 53(1), 19-24.
18. Utley, M., Gallivan, S., Davis, K., Daniel, P., Reeves, P., & Worrall, J., 2003,
“Estimating bed requirements for an intermediate care facility,” European Journal of
Operational Research, 150(1), 92-100.
19. Nguyen, J.M., Six, P., Antonioli, D., Glemain, P., Potel, G., Lombrail, P., & Le Beux,
P., 2005, “A simple method to optimize hospital beds capacity,” International Journal
of Medical Informatics, 74(1), 39-49.
20. Akcali, E., Côté, M.J., & Lin, C., 2006, “A network flow approach to optimizing
hospital bed capacity decisions,” Health Care Management Science, 9(4), 391-404.
21. Bachouch, R.M., Guinet, A., & Hajri-Gabouj, S., 2012, “An integer linear model for
bed planning,” Int. J. Production Economics, 140 (2), 833-843.
22. Ataollahi, F., & Bahrami, M.A., 2013, “A goal programming model for reallocation
of hospitals' inpatient beds,” Middle-East Journal of Scientific Research, 18(11),
1537-1543.
23. El‐Darzi, E., Vasilakis, C., Chaussalet, T., & Millard, P.H., 1998, “A simulation
modelling approach to evaluating length of stay, occupancy, emptiness and bed
blocking in a hospital geriatric department,” Health Care Management Science, 1(2),
143-149.
24. Huang, X.M., 1998, “Decision making support in reshaping hospital medical
services,” Health Care Management Science, 1(2), 165-173.
25. Standridge, C. R., 1999, “A tutorial on simulation in health care: applications issues,”
In Proceedings of the 31st conference on Winter simulation: Simulation---a bridge to
the future, 1, 49-55.

18
26. Bagust, A., Place, M., & Posnett, J.W, 1999, “Dynamics of bed use in
accommodating emergency admissions: stochastic simulation model,” British
Medical Journal, 319(7203), 155-158.
27. Elbeyli S and Krishnan P, 2000, “In-patient flow analysis using ProModelTM
simulation package.”
28. Harper, P.R., & Shahani, A.K., 2002, “Modelling for the planning and management
of bed capacities in hospitals,” Journal of the Operational Research Society, 53(1),
11-18.
29. Kim, S.C., & Horowitz, I., 2002, “Scheduling hospital services: the efficacy of
elective-surgery quotas,” Omega, 30(5), 335-346.
30. Baldwin, L.P., Eldabi, T., & Paul, R.J., 2004, “Simulation in healthcare management:
a soft approach (MAPIU),” Simulation Modelling Practice and Theory, 12(7-8), 541-
557.
31. Troy, P.M., & Rosenberg, L., 2009, “Using simulation to determine the need for ICU
beds for surgery patients, Surgery,” 146(4), 608-617.
32. Costa, A.X., Ridley, S.A., Shahani, A. K., Harper, P.R., De Senna, V., & Nielsen,
M.S., 2003, “Mathematical modelling and simulation for planning critical care
capacity,” Anaesthesia, 58(4), 320-327.
33. Marshall, A., Vasilakis, C., & El-Darzi, E., 2005, “Length of stay-based patient flow
models: recent developments and future directions,” Health Care Management
Science, 8(3), 213-220.
34. Cochran, J. K., & Bharti, A., 2006, “Stochastic bed balancing of an obstetrics
hospital,” Health Care Management Science, 9(1), 31-45.
35. Oddoye, J.P., Jones, D.F., Tamiz, M., & Schmidt, P., 2009, “Combining simulation
and goal programming for healthcare planning in a medical assessment unit,”
European Journal of Operational Research, 193(1), 250-261.
36. Kokangul, A., 2008, “A combination of deterministic and stochastic approaches to
optimize bed capacity in a hospital unit,” Computer Methods and Programs in
Biomedicine, 90(1), 56-65.

19
II. A DECISION SUPPORT SIMULATION MODEL FOR BED MANAGEMENT
IN HEALTHCARE
Raja A. Baru, Elizabeth A. Cudney, and Ivan G. Guardiola
Missouri University of Science and Technology
William T. Cahill, Raymond E. Phillips, Bruce L. Mutter, Debra L. Warner, and
Christopher M. Masek
Veterans Health Administration
Abstract
In order to provide access to care in a timely manner, it is necessary to effectively
manage the allocation of limited resources such as beds. Bed management is key to the
effective delivery of high quality and low cost healthcare. The aim of this research was to
develop a discrete event simulation to assist in planning and staff scheduling decisions.
Each department’s performance measures were taken into consideration separately to
understand and quantify the behavior of departments individually, and the hospital
system as a whole. Several scenarios were analyzed to determine the impact on reducing
the number of patients waiting in queue, waiting time, and length of stay of patients.
From the results, the departments that have high waiting times for patients, waiting times
and length of stay are detailed to predict how the hospital reacts to patient flow.
Keywords: Discrete event simulation, capacity planning, hospital behavior, waiting
times, scenarios.
20
INTRODUCTION AND MOTIVATION
The proper and effective allocation of limited resources is a ubiquitous problem across all
hospitals and healthcare delivery systems. The most common of these limited resources
being the finite number of beds. Hospitals frequently have more patients than they can
handle resulting in significant scheduling delays and increasing queue length [1]. To
address these problems hospital management requires an understanding of the hospital’s
internal functions, operations, and level of care to effectively plan and staff operations.
Furthermore, hospital administrators should know each department’s or unit’s operational
behavior and interdepartmental relationships to decrease waiting times and increase
timely delivery of care to patients [2]. Allocation of a bed to a patient with minimum
waiting time and reduction of the number of patients waiting for beds are the basis for the
research. To address this common problem in hospitals a detailed understanding of each
department’s average length of stay (LOS) of patients, waiting times, bed turnover time,
and queue length should be analyzed to enable a complete understanding of the
functioning of a hospital.
The healthcare industry comprised 15% of the United States’ Gross Domestic Product
(GDP) in 2006, of which 45% of the cost was funded publically [3]. This grew to 17.1%
in 2013 [4]. Due to this growth there is a need to increase the efficiency of processes and
procedures used in healthcare. Perhaps no issue is more prevalent than increasing access
to care. Access to care is concerned with helping people receive appropriate and timely
health care resources in order to preserve or improve their health.
Access to health care services is very important for any hospital to provide quality service
to patients. Moreover, timely access to healthcare can reduce preventable death, increase
quality of life, increase life expectancy, and prevent the spread of diseases. Barriers in
providing services include the lack of available beds and increased waiting times which
lead to patient dissatisfaction, increased number of patients who leave without being
seen, and prolonged delays in care [5].
There are a variety of measures that dictate the access of care; however, the most
common is the reduction of waiting times and effective use of bed management policies.
Wait times increase risk and affects the quality of care [6]. A patient waiting also leads to

21
increased costs, complications, suffering, and reduced efficiency. Healthcare processes
can be improved by determining the bottlenecks in the system and facilitating patient
flow within the hospital units at all acute levels. The flow of patients can be addressed
using discrete event simulation to model the individual departments and relationships
between departments in a hospital. Discrete event simulation was utilized in this research
due to its ability to model what-if scenarios and make predictions of outcomes,
particularly for situations such as those in healthcare that are very expensive to perform
in reality.
The purpose of this research was to develop a comprehensive simulation model for a
hospital system to characterize the behavior and information for each department
statistically. During the analysis of each department, several opportunities for improving
patient access to care were identified. Through the use of discrete event simulation, these
scenarios for improvement were tested to determine the factors influencing patient
waiting times. The hypotheses and resulting analyses are also provided.
This paper is organized as follows. First, a review current relevant literature is provided.
The research methodology is then presented, which gives insight to patient flow in a
hospital and its related parameters. The different scenarios for the simulation model are
then discussed. The paper concludes with key findings, study limitations, and future
research.
LITERATURE REVIEW
Patient flow, bed allocation, and resource utilization in hospitals through the application
of queuing and simulation models have been extensively studied [7-9]. Harper and
Shahani [10] argue that a hospital system is complex and reducing its complexity does
not result in an ideal model.
Several key studies on bed allocation and hospital flow utilize queuing theory. Cochran et
al. [11] approximated the hospital inpatient demand by employing a queuing technique
for decision-making. They identified that, in general, patients’ data collected at midnight
was not sufficient due to the variance that occurs during the day. The month of March
was selected for analysis because it was considered to be the busiest month by hospital

22
management. The research found that financial data plays a vital role for inpatient bed
capacity planning; therefore, this data should be utilized for any analysis. Cote [12]
developed an advanced forecasting model using census data. This model determined the
frequency distribution using hourly census information to interpret bed demand.
Gorunescu et al. [13] took a broader approach by using queuing theory to illustrate
patient flow to develop an approach for advancing the utilization of hospital resources in
order to enhance care. The findings suggested that a level of 10-15% bed vacancy is
important to maintain administration productivity. Utley et al. [14] proposed the creation
of an intermediate care unit in the process from emergency to specialized wards. This
approach reduces the excess flow of patients into acute care and reduces the losses due to
admission cancellations.
The model proposed by Nguyen et al. [15] took into account a score model with three
elements as parameters, which included the number of beds, unscheduled affirmations,
and vacant beds. The algorithm for the model focused around the increase of one virtual
bed at each stage and the count score for every saturation limit for each empty bed.
Akcali et al. [16] developed a network model that simultaneously determined the timing
and extent of changes in the bed limit that minimizes the limit expense while maintaining
the desired level of quality operations. One limitation of this model is that it is focused
around a broad view in the assumption that the requirement and service are equal.
The use of simulation in the health care industry has grown considerably since it can be
used to model a wide range of topics and answer a variety of research questions [17, 18].
From the literature, it is recommended to use simulation over analytical and deterministic
approaches due to its ability to model complex systems. Uncertainty, accuracy,
variability, and reliability are the key reasons to use simulation in healthcare modeling.
Analytical models use formulas or mathematical equations to solve problems, and the
variable demand patterns in a hospital are very difficult to model. Stochastic models have
the advantage of probabilistic components while deterministic models do not [19]. Jun et
al. [20] provided an extensive taxonomy on the literature of patient flow and allocation of
resources using discrete event simulation in healthcare.

23
Simulation models have been utilized in health care operations broadly because of their
ability to model dynamic systems. Lagergren [21] proposed the utilizing simulation to
model scenarios that do not exist, which makes it possible to make predictions of
outcomes. It also has the capacity to model unexpected situations which are very
expensive to perform in reality. Standridge [22] proposed that simulation can be applied
to various public related problems within the hospital and explained that simulation was
better in analyzing various cases. The main limitation is that the use of simulation is
complex; therefore, a simpler and faster foundation should be taken. Jacobson et al. [23]
described the benefits of using optimization and simulation tools in health care decision-
making. They proposed that with simulation models, many performance measures could
be analyzed, which also helps in understanding relationship between various inputs.
Harper and Shahani [10] used simulation for general surgery to alter queue policies and
day-to-day scheduling. Results have shown the throughput of patients can be increased
without additional resources. Harper and Gamblin [24] addressed wait list issues by using
a visual interactive simulation within a structured environment, which also helped to
build acceptance of simulation results amongst managers. Duguay and Chetonane [25]
modeled emergency departments (ED) using discrete event simulation and found it to be
an effective tool due to the complexity of healthcare systems. A regional hospital was
studied to improve the current process through data collection and change of control
variables. Several ‘what if’ scenarios such adding staff and exam rooms were performed.
Kumar and Mo [26] also used discrete event simulation to develop bed prediction
models. They modeled bed occupancy for three different wards and three different types
of patients. Data regarding the number of admissions, average length of stay over one
year, and number of beds in each ward was collected. The simulation results showed that
simulation was a useful tool in predicting bed occupancy.
In order to optimize bed management, El-Darzi et al. [27] analyzed a geriatric department
in a hospital using discrete event simulation to study the effect of length of stay,
occupancy, and bed blocking on patient flow. The limitation in this approach is the model
assumed that both the arrival and admission number were the same. Bagust et al. [28]
determined the effect of emergency department admissions on hospital bed management.

24
Discrete event simulation modeling was used due to the randomness in the demand. The
results of the model indicated that a hospital could have regular shortages if the average
bed occupancy of the unit rises to 90% or more. The limitation to the proposed model is
the length of the time required to run the model.
More recently, Troy and Rosenberg [29] explained a simulation model based on the
Monte Carlo technique. The simulation model was built to identify admission requests,
model entities, and find start and end times belonging to the intensive care unit (ICU) bed
usage. The model calculated the confidence intervals of the wait times based on the
cardiac patients since they are the patients who are admitted the most into the ICU. Costa
et al. [30] proposed a model to calculate the number of beds in a critical care unit. This
model uses the distribution of the data from different categories to determine the number
of patients expected in a year, length of stay, and a target occupancy level. The model
was based on queuing theory and computer simulation was used to solve the complex
mathematical equations. Cochran et al. [31] proposed a model to balance bed utilization
by reducing bed blocking. Queuing networks were first used to analyze the flow patterns,
and then discrete event simulation was performed to maximize the flow.
Elbeyli and Krishnan [32] examined inpatient flow to identify bottlenecks and assess the
impact of bed availability on the waiting time of the admitted patients in the ED before
being transferred to other units of the hospital. Bottlenecks are the sources of long
waiting times. Eldabi et al. [33] proposed a simulation model approach called the
Modelling Approach that is Participative Iterative for Understanding (MAPIU). The main
objective was to improve the understanding of the system by stakeholders. The research
illustrated how the steps in a simulation model varied by different authors in the
construction of a simulation model. The research proposed an alternative model to the
existing simulation models that includes the participation of stakeholders in the model.
Marshall et al. [34] proposed a model for patient flow based on the length of stay. The
research focused on bringing together recent developments for inpatient flow modeling.
For modeling the LOS, probabilistic solutions were used to quantify their impact and
sustainability in supporting hospital management services.

25
Oddoye et al. [35] described the importance of a medical assessment unit to reduce the
bottlenecks in acute patient flow in a general hospital. Simulation, with the help of goal
programming, was performed to set the objectives and aid in decision-making. A visual
interactive modeling system was designed for patient flow in the hospital. The advantage
of this simulation model is it takes less time to run and the results obtained are consistent
with the different scenarios tested. Changes in the resources were also verified to
determine these effects on the system.
Many public health systems have been modeled with the use of simulation to analyze
wait times. Managers have used simulation as a tool by managers to experiment with
different resources to quantify how the hospital system reacts if they were implemented
[36]. Davies [37] proposed a simulation model to determine the bottlenecks and identify
the main cause as bed shortages for the situation.
Jun et al. [20] also reviewed literature on the application of discrete event simulation to
hospital systems and determined that distributing patient demand over horizon improved
patient flow by decreasing waiting time in outpatient clinics. Rohleder et al. [38] used
simulation modeling to redesign phlebotomy and specimen collection centers. The main
focus was to reduce average waiting times as well as their variability. Simulation was
used to predict implementation problems and to improve results. In addition, an
orthopedic outpatient clinic was modeled to improve process flow and patient scheduling
and optimize staffing levels.
Simulation models have been extensively utilized in surgical suites to improve efficiency
and reduce wait times. Blake et al. [39] used operation research techniques to analyze
wait times in a surgery department. Capacity planning decisions were developed and
performance was analyzed using discrete event simulation. The research examined
various scenarios and studied the consequences of reallocating resources, maintaining
standard length of stays, and various options for reducing wait times. Bowers and Mould
[40] designed a simulation model to increase operating room (OR) utilization by
scheduling deferrable patients into planned orthopedics blocks.
McLay et al. [41] performed a study on screening strategies for cervical cancer patients.
They developed a simulation optimization model to determine the ages at which

26
screening should be performed, which resulted in dynamic, age based screening policies.
Simulation was used to predict the number of vaccines, and also provide information on
screening policies that offered substantial economic savings.
Harper [42] proposed a framework for larger, robust models that highlights the
significance of developing patient groups that are statistically and meaningfully correct.
The research also suggests that outputs must provide detailed information to end-users.
Everett [36] suggested that a simulation model must be understandable to health
administrators and should involve them in the development process rather than just
providing detailed information.
The proposed research analyzes the hospital beds in all departments rather than just in
one department. This is a contribution to the literature because it takes into account the
dependencies between departments. A critical consideration for hospital beds is the
transfer of patients between departments and how this impacts the overall length of stay
of patients. Therefore, the simulation model enables a unique set of scenarios to
efficiently model the hospital units, patient’s admissions, and wait times to improve bed
management and quantify the impact on the overall system.
HOSPITAL BACKGROUND
For this research, the Sacramento Veterans Administration Medical Center (VAMC) was
used to develop the simulation model. The Sacramento VAMC provides comprehensive
health care services and has all acute beds, in which patients are treated for brief stays
related to surgery recovery, disease, trauma, or illness. It consists of 50 beds distributed
in the intensive care unit, transitional care unit (TCU), and medical surgical unit (MSU).
Patients admitted to the hospital are assigned to the ICU, TCU, and MSU departments
based on their level of acuity. The ICU consists of 10 beds, TCU consists of 16 beds, and
MSU consists of 19 beds on the third floor and five beds on the fourth floor.
RESEARCH METHODOLOGY
In order to develop simulation model, data was collected from the Sacramento VAMC on
patient movement throughout the hospital. The data was comprised of multiple large sets
of data and spans across all major units within the hospital. Specifically, the data

27
contained all departments and units within the hospital with the exception of behavioral
health unit. Hence, the data is comprised of high fidelity information for each patient,
which included admission time and date, discharge time and date, ward/unit of
admission, ward/unit of discharge, and spanned from January 1, 2009 through December
31, 2014. The data set contained information on 23,019 patients. From the total data, the
records from January 1, 2009 through December 31, 2013 were used for the analysis.
Initially data was filtered in Excel to determine the details for each department
individually. Therefore, the details for direct admission to a department for each patient
and their length of stay were determined. In a similar manner the transfer data contained
details of how patients moved throughout the hospital. In these transfers individual
patients are tracked from admission to discharge with transfer information regarding the
unit of care. However, it is important to note that these transfers may in many cases not
directly correspond to a physical movement of the patient’s location, but rather
correspond to a lower or elevated level of care. Also, in some cases patients were
elevated to levels that required a physical movement of the patient. The data on patient
transfers spans from April 2014 to March 2015 and consists information for 1,129
patients. The data is used to calculate the length of stay of patients transferred from one
department to another department. The data was filtered initially in Excel to separate
transfer patients records individually by department. From the data, transferred patient’s
length of stay in ICU, 3 TCU, 3 MSU, and 4 MSU were calculated. The length and
detailed information facilitated the statistical analysis associated with all patient flow
within the hospital across the various units within the hospital.
The required data for the simulation model was based on the arrival times of patients,
admission department, length of stay of each patient, discharge department, and
department transfer data. The data was collected from patient’s records and the Bed
Management System (BMS) for five years. With the details of LOS of direct admission
and transferred patients to ICU, 3 TCU, 3 MSU, and 4 MSU, the length of stay
distributions were calculated using the input analyzer in ARENA and graphical
evaluation (confirming the histogram with the distribution function). The input analyzer
fits the best distribution to the provided data for each department. The Input Analyzer
assures that these distributions are fitted to non-negative data using the in built feature

28
auto data translation. Since the 3 TCU and 3 MSU data does not fit to any distribution in
the Input Analyzer, so a user defined continuous distribution based on the probabilities
are used as input distributions. Table 1 and Figure 1 show the graphical evaluation. All
distributions were determined using actual patient data provided by the VA Hospital.
Table 1. Distributions for all departments
Department Sample
Size
Distribution Choice Chi Square
Value
ICU 1365 LOGN(63.1,68.5) 0.02
4 MSU 232 LOGN(37.3,30.3)+2 0.24
ICU Transfer 169 -0.5+WEIB(4.12,1.15) 0.75
3 TCU Transfer 279 -0.5+LOGN(3.63,3.26) 0.74
3 MSU Transfer 1397 -0.5+LOGN(3.71,3.8) 0.71
4 MSU Transfer 213 -0.5+LOGN(2.69,2.09) 0.33
Figure 1. Graphical Distribution of LOS for the ICU Department.
29
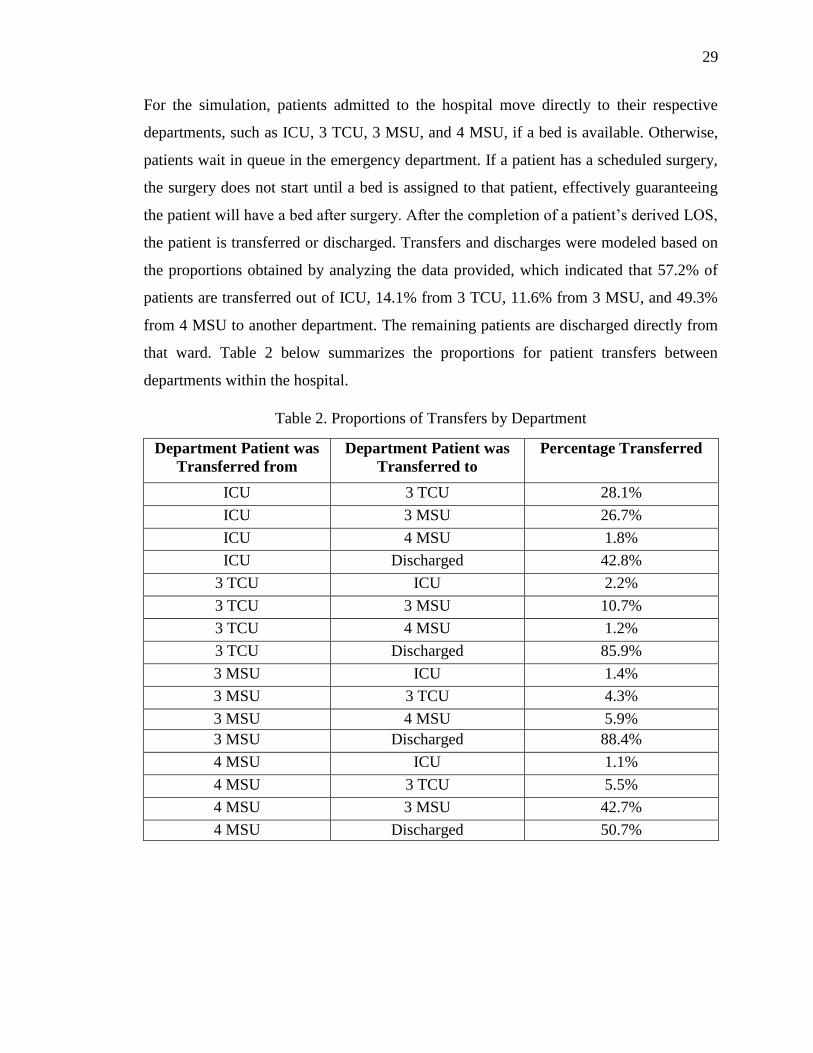
For the simulation, patients admitted to the hospital move directly to their respective
departments, such as ICU, 3 TCU, 3 MSU, and 4 MSU, if a bed is available. Otherwise,
patients wait in queue in the emergency department. If a patient has a scheduled surgery,
the surgery does not start until a bed is assigned to that patient, effectively guaranteeing
the patient will have a bed after surgery. After the completion of a patient’s derived LOS,
the patient is transferred or discharged. Transfers and discharges were modeled based on
the proportions obtained by analyzing the data provided, which indicated that 57.2% of
patients are transferred out of ICU, 14.1% from 3 TCU, 11.6% from 3 MSU, and 49.3%
from 4 MSU to another department. The remaining patients are discharged directly from
that ward. Table 2 below summarizes the proportions for patient transfers between
departments within the hospital.
Table 2. Proportions of Transfers by Department
Department Patient was
Transferred from
Department Patient was
Transferred to
Percentage Transferred
ICU 3 TCU 28.1%
ICU 3 MSU 26.7%
ICU 4 MSU 1.8%
ICU Discharged 42.8%
3 TCU ICU 2.2%
3 TCU 3 MSU 10.7%
3 TCU 4 MSU 1.2%
3 TCU Discharged 85.9%
3 MSU ICU 1.4%
3 MSU 3 TCU 4.3%
3 MSU 4 MSU 5.9%
3 MSU Discharged 88.4%
4 MSU ICU 1.1%
4 MSU 3 TCU 5.5%
4 MSU 3 MSU 42.7%
4 MSU Discharged 50.7%

30
MODELING AND SIMULATION METHODOLOGY
The simulation model was developed using the ARENA© software package, which uses
an entity-based, flowcharting for modeling dynamic processes. Entities in the simulation
model proceed through a flow chart of the process and seize control of resources as they
are processed. Resource units can be changed according to the patient flow requirements
and results can be used to understand the changes in system behavior.
In the simulation model, patient flow is used to model the processes within hospital for
the ICU, TCU, and MSU. The dynamic nature of patient arrivals to hospitals is embedded
into the system. When the patients are admitted to MSU on the third floor, if the queue
length is greater than three then they are shifted to the fourth floor. In the case of the ICU,
if the queue length is greater than two then patients are diverted to another nearby
hospital for treatment. Patients arrive into the system according to the real arrival times
obtained for the four years of data (2009-2013). That is, the hospital’s historical data is
directly embedded in the model. In implementing the historical information of patient
behavior into the simulation removes the need to estimate parametric statistical models to
describe arrivals and discharges, as well as LOS stochasticity. Patient flow was
simulated to develop a prediction model of hospital bed occupancy. Figure 2 provides the
conceptual model for the simulation. The conceptual model for the simulation takes into
account patient movement (transfers) between departments and was modeled using data
from the BMS. The assignment and movement to beds were modeled using data directly
from the Emergency Department Integration Software (EDIS) and BMS; therefore, it
indirectly takes into account surgery cancellations and nursing shortages that are captured
in the normal variability within the historical data. Anomalies or extreme conditions were
captured in the data but were not considered in the model development. However, these
conditions could be easily modeled with minor changes to the simulation model for
“what if” scenarios.
The appropriate application of discrete-event simulations as an effective model is due in
part to the temporally dynamic and stochastic behavior associated to the mixture of
patient care needs. In that, patient mixture can vary from day to day; moreover, the
healthcare needs of the patient can vary as well and have unforeseen characteristics or

31
complications that impact the most common measures of performance such as, but not
limited to, LOS, daily admissions distributions, daily discharge distributions, and other
major factors that impact effective decision-making and process improvements
methodologies. To this end, discrete event simulation has been widely accepted as a
viable and effective modeling tool for hospital dynamics and stochasticity where the
development of deterministic or stochastic models is not tractable.
Figure 2. Conceptual Model for Simulation
Patients enter into the system according to the original arrival records of patients. A
ReadWrite module is used to import the data from an Excel file. Since different kinds of
patients admit to a hospital they must be routed to respective departments for care. Using
the ReadWrite module each patient is assigned an attribute called type, which assigns
each patient to his or her respective ward according to the data. After the patient is
checked at the triage, patients move to their departments. A decide module is used to
route patients based on conditions or proportions calculated from the historical data.
When a patient is routed to a different department, the patient’s attributes are changed
with respect to that department, such as an ICU patient. A bed is allocated to the patient if
3 SURG
AOD TRIAGE WAITING ROOM
EMERGENCY
ROOM
DISCHARGE
OPERATING ROOM
RECOVERY ROOM
4 MED
4 OBS-
M
4 OBS-
S
4 SURG
3 MED
3 OBS-
MS
3 OBS-
S
3 TCU-
M
3 TCU-
S
2 MICU
2 OBS-
M
2 SICU
DR

32
there are available beds. If a bed is not available, the patient waits in queue until a bed is
available. After a patient is assigned to a bed, the patient stays there for their treatment.
This is simulated using the process module and seize delay logic, which seizes a bed for a
patient whenever it is available for a specified amount of time. The release module is then
used to release the seized resources after the patient LOS is completed. The length of stay
for the patient is expressed in terms of a distribution. After the patient LOS is completed,
the patient is moved from that bed and transferred to another department or discharged
from the hospital. Bed cleaning occurs before another patient occupies the bed. Only after
cleaning, the bed is available for another patient. The bed resource is set into a failure
state for two hours after the patient vacates the bed, which then enables the bed to be
available to another patient after cleaning. The patient is discharged or transferred to
another department depending on the level of the care required using the decide module.
The number of patients transferred or discharged is calculated in terms of the proportions
from the actual data. After the patient is transferred, the attributes are changed
accordingly; for example, an ICU patient may be transferred to 3 MSU.
The rule for patients waiting in queue is first in first out (FIFO), even though this is not
followed clinically because many factors influence this decision. For example, a patient
with complications that needs a higher level of care is given a higher priority for seizing a
resource. However, the FIFO principle is used to reduce the complexity for the purpose
of this model.
From the simulation model three hypotheses were developed to validate the model and
test “what if scenarios”:
H10: There is no statistical difference between the simulated LOS and actual LOS
values.
H1A: There is a statistical difference between simulated LOS and actual LOS values.
H20: A change in bed turnover time does not reduce the number of people waiting in
queue.
H2A: A change in bed turnover time reduces the number of people waiting in queue.
H30: A reduction in LOS does not reduce the number of patients waiting in queue.
H31: A reduction in LOS reduces the number of patients waiting in queue.

33
With the large dataset provided, the inputs for the simulation model were calculated. The
main inputs for the model were arrival times of patients, LOS, and department assigned
to at admission. The arrival times of patients were calculated from the dataset and
imported into the simulation model where each patient is admitted to their respective
department.
The LOS data was calculated for each department and analyzed to determine the
appropriate distribution. The data from the simulation was compared to the original data
statistically. The simulation model provides in-depth details on waiting times, queues,
average LOS by department, and total number of patients discharged by department.
In addition to comparing output performance measures, an animated version of the
hospital bed usage was developed using the ARENA simulation package as shown in
Figure 3. The simulation animation was to hospital administration to confirm patient flow
and validate the expected output. In the animation, whenever a bed is occupied by a
patient, the bed color changes to blue.
Figure 3. Bed Layout in the Arena Simulation
MODEL VERIFICATION AND VALIDATION
Verification of the model was performed in three stages. First, the arrival of patients were
examined to confirm they were embedded into the simulation appropriately by exporting
the arrival time information for each patient to an excel file using the ReadWrite module.
34
In the second stage, the model was verified using the check model function in Arena.
Finally, the information logic was verified with the staff and administration of the
hospital.
To determine if the actual LOS and simulated LOS values are different from each other
both parametric and non-parametric tests were performed. Parametric tests are used to
compare two samples that are normally distributed. However, non-parametric tests are
used to compare two samples whose underlying statistical distribution are unknown or for
samples for which the assumption of normality exists. A two-sample t-test is used in
parametric tests and a Wilcoxon Rank Sum Test is used for non-parametric tests. It is the
non-parametric equivalent to the two-sample t-test and is sometimes called as Mann–
Whitney U test. The only assumption for this test is that the observations are independent.
As these samples are not normally distributed and independent, a non-parametric test was
used for the statistical analysis.
To ensure that the model is an accurate representation of the hospital system, initially the
LOS data elements were verified. This included comparing the LOS predicted values
from the simulation model to the actual data for year 2014. A Wilcoxon test was
performed since the data were non-normally distributed.
The first hypothesis was developed to determine if there was a statistical difference
between the simulated (predicted) and actual LOS. The purpose of this hypothesis was to
validate the simulation model.
H10: There is no statistical difference between the simulated LOS and actual LOS
values.
H1A: There is a statistical difference between simulated LOS and actual LOS values.
A one-way analysis was performed initially to characterize how the distribution of LOS
values differs between the actual LOS and simulated LOS for each department. The
ANOVA tests the null hypothesis that samples in two or more groups are drawn from
populations with the same mean values. The variable of interest and the factor examined
is LOS values. There are classified in two groups as Simulated LOS values and Actual
LOS values.

35
Table 3. P-values of LOS simulated and actual values
Test Hypothesis P-value
Wilcoxon test There is no statistical difference between the ICU
simulated LOS and actual LOS values.
0.64
Wilcoxon test There is no statistical difference between the 3 TCU
simulated LOS and actual LOS values.
0.15
Wilcoxon test There is no statistical difference between the 3 MSU
simulated LOS and actual LOS values.
0.09
Wilcoxon test There is no statistical difference between the 4 MSU
simulated LOS and actual LOS values.
0.40
Wilcoxon test There is no statistical difference between the transfers to
ICU simulated LOS and actual LOS values.
0.87
Wilcoxon test There is no statistical difference between the transfers to 3
TCU simulated LOS and actual LOS values.
0.25
Wilcoxon test There is no statistical difference between the transfers to 3
MSU simulated LOS and actual LOS values.
0.06
Wilcoxon test There is no statistical difference between the transfers to 4
MSU simulated LOS and actual LOS values.
0.10
The one-way ANOVA technique was used to compare means of simulated LOS values
and actual LOS values. The results showed no statistical difference at a significance level
of 0.05. Since the P-value statistic was greater than 0.05, we fail to reject the null
hypothesis; therefore, there is no statistical difference between the simulated and actual
LOS. The P-value was greater than 0.05 indicates that the model was performing
correctly. Table 3 shows the Wilcoxon tests for 3 MSU, 3 TCU, 4 MSU, and ICU,
Transfer to ICU, Transfer to 3 TCU, Transfers to 3 MSU, Transfers to 4 MSU. Therefore,
it was concluded that the model performed as designed and the design was an accurate
depiction of the actual hospital system.
ANALYSIS OF SIMULATION RESULTS
Arena generates output reports which give details about the patient waiting times,
average length of stay of patients of each department, average queue length of patients,
average waiting times, statistics of each department admissions, and records of patients

36
transferred to another hospital because of restricted queue length at ICU department.
After validating the proposed simulation model, several what if scenarios were analyzed
to determine performance measures and quantify how these impact the waiting time and
waiting queues of patients. Three scenarios where tested, including:
1. Scenario 1: Reduce the number of people waiting in queue and waiting time by
decreasing the bed turnover time.
2. Scenario 2: Reduce the number of people waiting in queue and waiting time
through reducing LOS.
3. Scenario 3: Addition of two beds to 3 TCU and 4 MSU.
SCENARIO 1: REDUCE THE NUMBER OF PEOPLE WAITING IN QUEUE
AND WAITING TIME BY DECREASING THE BED TURNOVER TIME
Bed turnover time indicates the time elapsed between a discharged patient and another
admission. Bed cleaning time is also included in this time. In the first scenario, the
purpose was to determine if reducing the bed turnover time from two hours to one hour
affected the number of patients waiting in queue. A reduction in the cleaning time can be
achieved through adding additional housekeeping staff. The data for the number of
patients waiting in queue with and without reduced bed turnover time was analyzed using
the simulation model. The data was compared statistically to determine if there was any
change in the number of patients waiting due to a reduction in the bed turnover time.
The scenario relates to the second hypothesis, which was developed to determine if there
was a statistical difference in the number of people waiting in queue when the bed
turnover time was reduced. This “what if” scenario was developed to determine the
impact of bed turnover time on the number of patients in queue. The bed turnover time
was reduced from a two hour to one hour time process in all departments. The number of
people waiting in queue was collected for both time periods from the simulation model
using the statistic module.
H20: A change in bed turnover time does not reduce the number of people waiting in
queue.
H2A: A change in bed turnover time reduces the number of people waiting in queue.

37
A one-way ANOVA technique was used to compare means of the number of patients in
queue by changing the bed turnover time. This data was collected using the statistic
module in ARENA. Since these samples were not normally distributed and independent,
a non-parametric Wilcoxon test was performed.
Table 4. P value for reduced bed turnover time
Test Hypothesis P value
Wilcoxon test A change in bed turnover time does not reduce the
number of people waiting in queue
<0.001
The results showed no statistical difference at a significance level of 0.05. Since the P-
value was less than 0.05, we reject the null hypothesis; therefore, there is a statistical
difference between the number of patients in queue when the bed turnover time is
reduced. Table 4 shows the Wilcoxon tests for the second hypothesis. Statistical results
for reduced bed turnover time.
The average waiting time for patients and the average patients waiting in queue in
hospital system were 7.95 hours and 2.93 patients, respectively. When the bed turnover
time was reduced from 2 hours to 1.5 hours both measures were reduced to 7.18 hours
and 2.55 patients. A further reduction to a 1 hour time period reduced the average waiting
time to 6.10 hours and an average queue of 2.33 patients.
SCENARIO 2: REDUCE THE NUMBER OF PATIENTS WAITING IN QUEUE
AND WAITING TIME THROUGH A REDUCTION IN LOS
Improper planning can lead to an increase in the patient’s LOS, which directly affects the
other patients. In particular in this hospital, the number of patients the ICU department
can hold in queue is two. When there are more than two patients in queue for the ICU,
they are transferred to another nearby hospital. The queue can be reduced by decreasing
the patient LOS by proper planning, improving the rounds of doctor, and timely
discharge of patients. For this analysis, the LOS for each direct admission department and
transfer department was reduced by 10 hours to analyze its impact on the waiting queue.
The patients LOS can be reduced by discharging the patients more effectively and

38
decreasing the discharge time. Data for the patients waiting in queue was gathered
through the simulation for before and after the change in the LOS. Statistical analysis was
performed to determine if there was an impact on the waiting queue due to a reduction in
the LOS. The third hypothesis was developed to determine if there was a statistical
difference in the number of people waiting in queue when the LOS was reduced.
H30: A reduction in LOS does not reduce the number of patients waiting in queue.
H31: A reduction in LOS reduces the number of patients waiting in queue.
A one-way ANOVA technique was used to compare the means of the number of patients
in queue by changing the LOS values. The LOS values were reduced by 10 hours for
direct admission departments and by one day for transfer departments. This data was
collected using the statistic module in ARENA.
Table 5. P value for reduced LOS.
Test Hypothesis P value
Wilcoxon test A reduction in LOS does not reduce the number of
patients waiting in queue
<0.001
The results showed a statistical difference at a significance level of 0.05. Since the P-
value was less than 0.05, we reject the null hypothesis; therefore, there is statistical
difference between the number of patients in queue when the bed turnover time is
reduced. Table 5 shows the Wilcoxon tests for the third hypothesis.
With the reduction in LOS by 10 hours for each department, there is a change in the
average patient wating times and average patient queues. Both measures were reduced in
terms of waiting time from 7.95 hours to 2.07 hours and number in queue from 2.93 to
0.80 patients. From the simulation model, the number of people being transferred to
another hosptial because of high queue length can also be estimated. In particular, at the
VA Sacramento Hospital, the maximum number of patients allowed waiting in queue for
admission into the ICU Department is two. If the waiting number is above two patients,
these additional patients are routed to another hospital. Figure 4 provides the average
number of patients waiting in queue based on the actual data. LOS values are reduced by

39
10 hours for direct admission departments and transfer departments. The reduction in
LOS also reduces the number of patients waiting in queue as shown in Figure 4.
Figure 4. Average number of people waiting in queue with reduced LOS
SCENARIO 3: ADDITION OF FOUR BEDS TO 3 TCU AND TWO BEDS TO 4
MSU
From the results obtained, the data shows that the 3 TCU and 4 MSU have large waiting
times for patients, 8.95 and 13.10 hours, respectively. The waiting times are due to the
lack of available beds for patients. The addition of beds may reduce the waiting times,
number of patients in queue, and length of stay. Tables 6 and 7 show the comparative
analysis of the 3 TCU and 4 MSU with addition of four beds and two beds respectively to
each department.
Table 6. Comparative analysis for 3 TCU with 16 and 20 private beds
3 TCU Average Waiting
Time (hours)
Average Number of
Patients in Queue
Average Length of Stay
(hours)
16 Beds 8.95 1.57 71.78
20 Beds 0.40 0.07 62.92

40
Table 7. Comparative analysis for 4 MSU with 5 and 7 private beds
4 MSU Average Waiting Time
(hours)
Average Number of
Patients in Queue
Average Length of
Stay (hours)
5 Beds 13.10 0.37 52.15
7 Beds 2.77 0.1 42.18
CONCLUSIONS AND IMPLICATIONS
A simulation model of the hospital system was constructed using ARENA to understand
admission and transfer patients length of stay, waiting time, and queue lengths. Through
the analysis of the historical data and the simulation model it was shown that the wait
times are highest for the 3 TCU and 4 MSU and transfers to 3 TCU with an average
waiting time of 8.95, 13.10, and 9.07 hours, respectively. With the current LOS and the
bed turnover time, the patients wait in long queues before being admitted. If the
following reccommendations are implemented there will be decrease in the patients
waiting time.
Reducing the length of stay of patients and decreasing the bed turnover time allows
resources to become available for another patient quickly, which improves patient access
to care. The average wait times for 3 TCU and 4 MSU and transfers to 3 TCU will reduce
to 1.74, 2.77, and 1.86 hours, respectively.
The number of people being transferred to another hospital because of high queue length
at ICU can also been reduced with reduction in LOS. A reduction in 10 hours in LOS will
result in a decrease of the average number of patients in queue from 11 to 4 patients. The
statistics of patient waiting times and waiting queues for each department helped in
determining the appropriate number of beds for each ward.
The departments with the highest waiting times and waiting number can be reduced by
addition of beds. From the simulation results indicated that 3 TCU and 4 MSU have the
highest waiting time and waiting queues. Therefore, an addition of 4 beds to 3 TCU and 2
beds to 4 MSU reduce the average waiting times of 3 TCU and 4 MSU from 8.95 to 0.4

41
hours in 3 TCU and from 13.10 to 3.49 hours in 4 MSU. In addition, the waiting queue
was reduced from 1.57 to 0.07 in 3 TCU and from 0.37 to 0.10 in 4 MSU.
Through the use of simulation, the operational behavior of the hospital was determined.
The simulation model was used to determine patient statistics, average waiting times,
average length of stay of direct admitted, and transferred patients. This model can be
applied to any hospital which demonstrates indepth details of its functionality. This
model allows hospital administrators to model their hospital and quantify the behavior of
the hospital with respect to changes in resources, LOS, and bed turnover times. This
methodology helped to solve the problem faced in hospital in real terms patient waiting
times due to a limitation of beds.
Based on the findings from the study the following additional recommendations are
proposed to reduce waiting times, number of patients waiting, and number of patients
transferrred to another hospital due to lack of beds. A clear and quick notification of the
discharge of patients should be implemented to provide timely notification to the cleaning
staff, which will reduce delays in the cleaning time. Patient status and level of care
required should be examined frequently to reduce the length of stay of patients and
reduce the need for patients to be transferred to another hospital due to long queues.
Finally, the policies and practices of scheduling and discharge should be reviewed and
updated as necessary.
LIMITATIONS AND FUTURE RESEARCH
Due to the limitations in the data, the current model only accounts for a maximum of one
transfer between departments for each patient. Data was not available on multiple
transfers. In reality, patients that require a high level of care or have frequent changes in
their condition can be transferred more than once during their hospital stay.
After a patient is admitted to a department, they may be transferred to another
department. In the current model, patients are transferred to other departments using
proportions calculated from historical data. However, if this data was available it could
be modeled more effectively. In addition, the bed cleaning time is a constant of two hours
in the proposed model due to a lack of available data. Historical data of bed cleaning will
enable the determination of the appropriate statistical distribution.

42
In the proposed model the resources are beds. However, a simulation model with
resources using nurses, doctors, and beds could provide a more accurate and robust
model. Finally, the development of a simulation model with optimization values to
determine better usage of resources and estimates costs of each activity could be
developed. There are many extensions to this work which are currently under research.

43
References
1. Green LV, Soares J, Giglio JF, Green RA (2006) Using queueing theory to increase the
effectiveness of emergency department provider staffing. Academic Emergency
Medicine 13(1): 61-68.
2. Haraden C, Resar R, Horton SS, Henderson D, Dempsey C, Appleby D, Lambert IIIM
(2004) Patient Flow in Hospitals: Understanding and Controlling It Better. FRONTIERS
20:4.
3. Gupta D, Denton B (2008) Appointment scheduling in health care: Challenges and
opportunities. IIE Transactions 40(9): 800-819.
4. http://data.worldbank.org/indicator/SH.XPD.TOTL.ZS.
5. http://www.healthypeople.gov/2020/topics-objectives/topic/Access-to-Health-Services.
6. Richards JR, Navarro ML, Derlet RW (2000) Survey of directors of emergency
departments in California on overcrowding. Western Journal of Medicine 172(6): 385.
7. Sargent RG (2011) Verification and validation of simulation models. Proceedings of
2011Winter Simulation Conference, IEEE Computer Society 183 - 198.
8. Eddy DM, Hollingworth W, Caro JJ, Tsevat J, McDonald KM, Wong JB (2012) Model
Transparency and Validation: A Report of the ISPOR-SMDM Modeling Good Research
Practices Task Force - 7. Medical Decision Making 32 (5): 733-743.
9. Miller MJ, Ferrin DM, Szymanski JM (2003) Simulating six sigma improvement ideas
for a hospital emergency department. Proceedings of the 2003 Winter Simulation
Conference 2: 1926-1929.
10. Harper PR, Shahani AK (2002) Modelling for the planning and management of bed
capacities in hospitals. Journal of the Operational Research Society 53(1): 11-18
11. Cochran JK, Roche K (2008) A queuing-based decision support methodology to estimate
hospital inpatient bed demand. Journal of the Operational Research Society 59(11): 1471-
1482.
12. Cote MJ (2005) A note on bed allocation techniques based on census data. Socio-
Economic Planning Sciences 39(2): 183-192.
13. Gorunescu F, McClean SI, Millard PH (2002) A queuing model for bed-occupancy
management and planning of hospitals. Journal of the Operational Research Society
53(1): 19-24.

44
14. Utley M, Gallivan S, Davis K, Daniel P, Reeves P, Worrall J (2003) Estimating bed
requirements for an intermediate care facility. European Journal of Operational Research
150(1): 92-100.
15. Nguyen JM, Six P, Antonioli D, Glemain P, Potel G, Lombrail P, Le Beux P (2005) A
simple method to optimize hospital beds capacity. International Journal of Medical
Informatics 74(1): 39-49.
16. Akcali E, Côté MJ, Lin C (2006) A network flow approach to optimizing hospital bed
capacity decisions. Health Care Management Science 9(4): 391-404.
17. Fone D, Hollinghurst S, Temple M, Round A, Lester N, Weightman A, Palmer S (2003)
Systematic review of the use and value of computer simulation modelling in population
health and health care delivery. Journal of Public Health 25(4): 325-335.
18. Baru R, Cudney E, Guardiola I, Warner D, Phillips R (2015) Systematic Review of
Operations Research and Simulation Methods for Bed Management. Proceedings of the
Industrial and Systems Engineering Research Conference.
19. Lowery, J. C. (1998) Getting started in simulation in healthcare. Simulation Conference
Proceedings, Winter 1:31-35.
20. Jun JB, Jacobson SH, Swisher JR (1999) Application of discrete-event simulation in
health care clinics: A survey. Journal of the operational research society 50(2): 109-123.
21. Lagergren M (1998) What is the role and contribution of models to management and
research in the health services? A view from Europe. European Journal of Operational
Research 105(2): 257-266.
22. Standridge CR (1999) A tutorial on simulation in health care: applications issues. In
Proceedings of the 31st conference on Winter simulation 1: 49-55.
23. Jacobson SH, Hall SN, Swisher JR (2006) Discrete-Event Simulation of Health Care
Systems. International Series in Operations Research & Management Science 91: 211-
252.
24. Harper PR, Gamlin HM (2003) Reduced outpatient waiting times with improved
appointment scheduling: a simulation modelling approach. OR Spectrum 25(2): 207-222.
25. Duguay C, Chetouane F (2007) Modeling and improving emergency department systems
using discrete event simulation. Simulation 83(4): 311-320.

45
26. Kumar A, Mo J (2010) Models for bed occupancy management of a hospital in
Singapore. In Proceedings of the 2010 International Conference on Industrial
Engineering and Operations Management.
27. El-Darzi E, Vasilakis C, Chaussalet T, Millard PH (1998) A simulation modelling
approach to evaluating length of stay, occupancy, emptiness and bed blocking in a
hospital geriatric department. Health Care Management Science 1(2): 143-149.
28. Bagust A, Place M, Posnett JW (1999) Dynamics of bed use in accommodating
emergency admissions: stochastic simulation model. British Medical Journal 319(7203):
155-158.
29. Troy PM, Rosenberg L (2009) Using simulation to determine the need for ICU beds for
surgery patients. Surgery 146(4): 608-617.
30. Costa AX, Ridley SA, Shahani AK, Harper PR, De Senna V, Nielsen MS (2003)
Mathematical modelling and simulation for planning critical care capacity. Anaesthesia
58(4): 320-327.
31. Cochran JK, Bharti A (2006) Stochastic bed balancing of an obstetrics hospital. Health
Care Management Science 9(1): 31-45.
32. Elbeyli S, Krishnan P (2001) In-patient flow analysis using ProModelTM simulation
package. Proceedings of FREC SP00-02.
33. Baldwin LP, Eldabi T, Paul RJ (2004) Simulation in healthcare management: a soft
approach (MAPIU). Simulation Modelling Practice and Theory 12(7-8): 541-557.
34. Marshall A, Vasilakis C, El-Darzi E (2005) Length of stay-based patient flow models:
recent developments and future directions. Health Care Management Science 8(3): 213-
220.
35. Oddoye JP, Jones DF, Tamiz M, Schmidt P (2009) Combining simulation and goal
programming for healthcare planning in a medical assessment unit. European Journal of
Operational Research 193(1): 250-261.
36. Everett JE (2002) A decision support simulation model for the management of an elective
surgery waiting system. Health Care Management Science 5(2): 89-95.
37. Davies R (1994) Simulation for planning services for patients with coronary artery
disease. European Journal of Operational Research 72(2): 323-332.
38. Rohleder TR, Bischak DP, Baskin LB (2007) Modeling patient service centers with
simulation and system dynamics. Health Care Management Science 10(1): 1-12.

46
39. Blake J, Carter M, O'Brien-Pallas L, McGillis-Hall L (1994) A surgical process
management tool. MEDINFO 8: 527-531.
40. Bowers J, Mould G (2004) Managing uncertainty in orthopedic trauma
theatres. European Journal of Operational Research 154(3): 599-608.
41. McLay LA, Foufoulides C, Merrick JR (2010) Using simulation-optimization to
construct screening strategies for cervical cancer. Health Care Management Science
13(4): 294-318.
42. Harper PR (2002) A framework for operational modelling of hospital resources. Health
care management science 5(3): 165-17

47
SECTION
2. CONCLUSION
With the increase in population, the number of hospital’s patients is also
increasing. There is a large difference between the rate of patients arriving at the hospital
and the rate of increase for a hospital’s resources. Several of the studies that have been
conducted based on this issue were grouped in this research study in order to determine
various methods that have been already used.
The simulation model developed in this research provided solutions to reduce the
long waiting times that patients face in hospitals. This model helps to understand the
behavior of hospitals by providing estimates of waiting times, waiting numbers and
lengths of stay for patients in individual department. This model also helps in planning
and decision making in terms of increasing beds and staff. It allows a facility to run the
hospital virtually with different possible and impossible cases and so that the results can
be evaluated. The model has the capability to solve different scenarios and which help
determine the optimal solution. Though the model may not give the accurate results, it
gives the most appropriate results.
The research has filled some of the gaps in the current literature of bed
management issues, as well as that of decision methods for bed management. Important
extensions from this research, however, will bring more robust decision support
simulation models for bed management in healthcare.
The research was limited to the case of bed management of four departments in
the hospital. An immediate extension to this work would be to consider cases that include
all departments in the hospital. In this research models were developed using the beds as
resources, however it would be more effective if nurses, doctors and staff were
incorporated in the model. This would help to analyze the entire working climate and
patient movements in hospital system. An important area of future work from this
research would be to consider integrating the data directly into the simulation from
hospital data systems. Therefore, future work is needed to fill this gap.

48
VITA
Raja Anvesh Baru was born on 4th May 1993 in Khammam, India. He received
his Bachelor of Science degree in Electrical and Electronics Engineering from University
College of Engineering, Osmania University in Hyderabad, India.
In 2014, Raja began attending Missouri University of Science and Technology
(Missouri S&T) in Rolla, USA. In December 2015, Raja received a Master of Science
degree in Engineering Management.