Embed Size (px)
Citation preview
J Sched (2009) 12: 147–161DOI 10.1007/s10951-008-0086-4
A decision support system for cyclic master surgery schedulingwith multiple objectives
Jeroen Beliën · Erik Demeulemeester · Brecht Cardoen
Received: 12 March 2007 / Accepted: 16 July 2008 / Published online: 15 August 2008© Springer Science+Business Media, LLC 2008
Abstract This paper presents a decision support system forcyclic master surgery scheduling and describes the results ofan extensive case study applied in a medium-sized Belgianhospital. Three objectives are taken into account when build-ing the master surgery schedule. First of all, the resultingbed occupancy at the hospitalization units should be leveledas much as possible. Second, a particular operating room isbest allocated exclusively to one group of surgeons havingthe same speciality; i.e., operating rooms should be sharedas little as possible between different surgeon groups. Third,the master surgery schedule is preferred to be as simple andrepetitive as possible, with few changes from week to week.The system relies on mixed integer programming techniquesinvolving the solution of multi-objective linear and quadraticoptimization problems, and on a simulated annealing meta-heuristic.
J. Beliën as postdoctoral researcher supported by FondsWetenschappelijk Onderzoek—Vlaanderen.
J. Beliën (�)Research Center for Modelling and Simulation, CampusEconomische Hogeschool, Hogeschool-Universiteit Brussel(HUB), Stormstraat 2, 1000 Brussels, Belgiume-mail: [email protected]
J. Beliën · E. Demeulemeester · B. CardoenDepartament of Decision Sciences and Information Management,Faculty of Business and Economics, Katholieke UniversiteitLeuven, Naamsestraat 69, 3000 Leuven, Belgium
E. Demeulemeestere-mail: [email protected]
B. Cardoene-mail: [email protected]
Keywords Master surgery scheduling · Decision supportsystem · Mixed integer programming · Simulatedannealing · Case study
1 Introduction
Due to the ageing of society and the continuously growingdemands, health care is becoming very expensive. Accord-ing to the 2005 report of RIZIV, the Belgian national ex-penses for health care amounted to 15.38 billion Euro in2003. Five years earlier, in 1998, we spent no more than11.29 billion Euro. In other words, the total health care ex-penses have increased by 36% in only five years. The annualfigures indicate an average growth of 6.3% per year with astrong acceleration of 8.2% in 2003 (RIVIZ 2005). A pos-sible way to keep the expenses at an acceptable level is tointroduce more responsibility into the system. Principally,the Belgian health care system is free at the point of deliv-ery, and therefore neither the patients nor the care providersdirectly feel the real cost-price of health care. The problemof health care finance is not that the incomes are too low,but mainly that the expenses grow too fast. Policy makersand health care providers must determine how to providethe most effective health care to citizens using the limitedresources that are available. Therefore, they need effectivemethods for planning, prioritization, and decision making.
A critical resource in each hospital is the operating room.As pointed out by Litvak and Long (2000), the operatingroom can be seen as the engine of the hospital. Indeed, theactivities inside the operating room have a dramatic impacton many other activities within hospitals. For instance, op-erated patients are expected to recover during a number ofdays, called the length of stay (LOS), during which they oc-
148 J Sched (2009) 12: 147–161
cupy a bed in a recovery department, also called a ward or ahospitalization unit.
This paper presents a decision support system for assist-ing in the development of master surgery schedules. Themaster surgery schedule is a cyclic schedule that defines thenumber and type of operating rooms available, the hours thatrooms will be open, and the surgeons who are to be givenpriority for the operating room time (Blake et al. 2002).A cyclic schedule is a schedule that is repeated after a pre-determined time, called the cycle time. The cycle time isusually one week. A new master schedule is created when-ever the total amount of operating room time changes. Wedefine a block as the amount of time during which operatingroom time in a specific room can be allocated to a specificsurgeon.
The system aims at three objectives. A first important ob-jective is the visualization and optimization of the resultingbed occupancy. An optimal resulting bed occupancy, in thisrespect, is one that is as leveled as possible. To this pur-pose, the model presented in Beliën and Demeulemeester(2007) is adopted and embedded in the decision support sys-tem. Second, surgeons prefer to share an operating roomwith their direct colleagues, i.e., with surgeons belongingto the same surgeon group. We define a surgeon group asall surgeons having the same specialty, for instance, oph-thalmology or oncology. Finally, in the case that the cycletime is two or more weeks, the schedule should be as repet-itive as possible within the individual weeks of the cycle. Inother words, the changes in the schedule from week to weekshould be minimized.
Although not necessarily, the three objectives often con-flict with each other, meaning that building an optimalschedule with respect to one objective goes at the cost ofthe two other objectives. This requires a multi-objective ap-proach in which the performance with respect to the threeobjectives is quantified in order to measure the schedulequality. To this purpose, our model has a weighted penaltyfunction in which the weights represent the importance ofeach objective. The relative magnitudes of these weights areof course a subjective matter and can be set (and adapted)by the human scheduler.
The system presented in this paper only takes into ac-count elective cases. In contrast to non-elective (emer-gency) cases, elective cases are surgical interventions thatare planned beforehand. Obviously, non-elective cases con-tribute dramatically to the huge amount of variability in thebed occupancy, however, an important part of the variancecan be controlled by applying well-thought-out schedulingpolicies to the elective cases. More specifically, if the bedoccupancy resulting from the elective cases is nicely leveled,there is at any time instance room left to absorb unexpectedpeaks in bed requirements from non-elective cases.
2 Literature review
This literature review focuses on work in which operationsresearch (OR) and artificial intelligence (AI) techniqueshave been applied in real-life health care settings. Despitethe rich literature on effective methods and efficient algo-rithms for health care scheduling problems, relatively fewpapers present results for real-life data. Case studies wherethe algorithms are implemented in some kind of softwaresystem and applied in practice are even harder to find. Anearly bibliographic overview that focuses on OR health careapplications can be found in Fries (1976). Wiers (1997)gives a more general review on the applicability of schedul-ing techniques in practice that also includes some interest-ing health care applications. A more recent collection ofOR applications in health care is provided by Brandeau etal. (2004). Besides operating room scheduling, successfulapplications of OR/MS techniques in health care includebenchmarking using DEA (e.g., Coppola et al. 2003), lo-cation of health care facilities (e.g., Adenso-Díaz and Ro-dríguez 1997; Brotcorne et al. 2003), organ allocation (e.g.,Pritsker 1998), disease control and vaccination (e.g., Sewelland Jacobson 2003), radiotherapy treatment planning (e.g.,Romeijn et al. 2006), and many others.
A number of interesting case studies and applications onhealth care scheduling deal with the development of nurserosters. A literature review on nurse rostering including aninteresting classification with respect to the applicability ofthe approach has been provided by Burke et al. (2004). Kel-logg and Walczak (2007) present an exploratory researchstudy in which they examine the models that academics haveproduced and the models that have been actually used inpractice. According to their study only 30% of the mod-els presented in the literature have been implemented. Oneremarkable result was that the research-application gap ismuch larger in the US (more publications, less implementa-tions) than in Europe. Aickelin and Dowsland (2000) applya genetic algorithm approach on real life data from wards ofup to 30 nurses in a major UK hospital. More recently, Aick-elin and White (2004) experiment with Bayesian optimiza-tion and classifier techniques to similar rostering problems.Burke et al. (1999, 2004) describe the successful applicationof a hybrid tabu search metaheuristic. Their method has beenimplemented in software that has been used to create nurserosters in over forty Belgian hospitals. Further research ledto the development of variable neighborhood search tech-niques that also have been applied on highly constrainedreal world nurse rostering data (Burke et al. 2003). This ap-proach was hybridized with heuristic ordering (Burke et al.2008) to produce a methodology that significantly outper-forms a commercially implemented genetic algorithm ap-proach on real-life data.
In the hierarchical framework for hospital production andcontrol by Vissers et al. (2001) master surgery scheduling
J Sched (2009) 12: 147–161 149
could be positioned on the tactical level, somewhere be-tween the Resource Planning & Control level and the Pa-tient Group Planning & Control level. An interesting paperthat also concerns the development of master surgery sched-ules has been written by Blake et al. (2002). They proposean integer programming model that minimizes the weightedaverage undersupply of operating room hours, that is allocat-ing to each surgical group a number of operating room hoursas close as possible to its target operating room hours (seealso Blake and Donald 2002). The master surgery scheduleis preferred to be as simple and repetitive as possible whichentails as few changes as possible from week to week. Blakeet al. (2002) use a two-step approach that successively dealswith both objectives. In the first step, they assume a shortcycle time (one week) and use integer programming to findthe cyclic schedule with minimal undersupply of target op-erating room hours. In the second step, a post-improvementheuristic is run that tries to further improve this objectiveby introducing some changes in the schedule from week toweek. The model has been successfully applied in a largeCanadian hospital.
Van Oostrum et al. (2006) model the problem of con-structing master surgical schedules as a Mathematical Pro-gram containing probabilistic constraints. Due to computa-tional intractability the authors propose a two-phase columngeneration approach that first maximizes the OR utilizationand subsequently levels the demand for succeeding hospi-tal departments, such as wards and intensive care units. Theapproach was tested using data from the Erasmus MedicalCenter, Rotterdam, the Netherlands. Hans et al. (2008) pro-pose several constructive and local search heuristics for therobust surgery loading problem. The objective is to assignthe surgeries by the specialties in such a way, that the riskof working in overtime is minimized, no surgeries are can-celed, and at the same time the operating room capacity uti-lization can be improved. The approach has also been devel-oped in collaboration with the Erasmus Medical Center andtested on historical data.
Santibanez et al. (2007) present a system-wide optimiza-tion model for block scheduling that enables managers to ex-plore trade-offs between operating room availability, book-ing privileges by surgeons, bed capacity and waiting lists forpatients.
Kusters and Groot (1996) present a decision supportsystem for admission planning based on a series of re-source availability models. The main support of the com-puter model is in predicting the effects of decisions on theavailability of scarce resources like beds, operating theaterfacilities, and nursing staff. It enables the human decisionmaker to choose the right patients from the waiting list inorder to better balance the daily demand of hospital facil-ities against the availability of these resources. The paper
contains an empirical study validating the statistical mod-els and reports on the problems encountered when imple-menting the system in practice. The results obtained withthe model show that such an approach based on statisticaldata provides sufficiently accurate results to be useful.
Lapierre et al. (1999) propose guidelines in order to setup a measurement system to improve on-time performanceof first health care services of the day. Their main finding isthat, even if surgeons are the main cause of delay, efforts arelikely better aimed at improving hospital workers’ on-timeperformance than on improving surgeons’ on-time perfor-mance. If the on-time performance of other hospital depart-ments is improved, then anesthesiologists will improve theirperformance and surgeons will eventually improve theirs,with a lag. These findings are illustrated by analyzing onehospital organization’s case.
Everett (2002) describes the design of a simulationmodel to provide decision support for the management andscheduling of patients waiting for elective surgery in thepublic hospital system. The model can also be useful inmonitoring the performance of the system and exploring therelative effectiveness of alternative policies in coping withhistorical or statistically generated patient load.
Hsu et al. (2003) present a deterministic approach toschedule patients in an ambulatory surgical center such thatthe number of postanesthesia care unit nurses at the centeris minimized. Their heuristic has been tested on a set of realdata from a university hospital’s ambulatory surgical center.
Marcon and Dexter (2006) use discrete event simulationto analyze the impact of seven different sequencing ruleson over-utilized operating room time, delays in phase I postanesthesia care unit (PACU) admission, the PACU comple-tion time, and PACU nurse staffing.
The ability to cope with uncertainty is considered to bean essential part of modern health care scheduling. Kim etal. (2000) describe a flexible bed allocation scheme that re-serves one or more beds for the exclusive use of elective-surgery patients to enhance the operations of the intensivecare unit. Kim and Horowitz (2002) elaborate on this workand show through a simulation model that the combinationof this flexible bed allocation scheme and a quota systemfor elective surgery greatly reduces the number of canceledsurgeries.
The operating room scheduling problems described inthe literature often contain several, sometimes conflictingobjectives. Cardoen et al. (2006) present a multi-objectiveoptimization model for scheduling individual cases in thesurgical day-care center of a large Belgian hospital. Theauthors introduce a so-called room for improvement mea-sure to trade-off between six different objectives (childrenas early as possible, prioritized patients as early as possible,patients having a large travel distance as much as possiblebefore a particular hour, minimizing overtime in recoveryand leveling bed occupancy in both recovery phase 1 and
150 J Sched (2009) 12: 147–161
recovery phase 2). The model is solved using integer pro-gramming and branch-and-bound algorithms. In a more re-cent work, Cardoen et al. (2007) also present a branch-and-price approach to deal with this multi-objective optimizationproblem. Ogulata and Erol (2003) develop a set of hierar-chical multiple criteria mathematical programming modelsto generate weekly operating room schedules. The objec-tives considered in this study are maximum utilization ofoperating room capacity, balanced distribution of operationsamong surgeon groups and minimization of patient waitingtimes. Pérez et al. (2005) propose a so-called possibilisticlinear multi-objective programming model as an informa-tion system in order to analyze the internal coherency of thedifferent goals expressed by Spanish Health Service in rela-tion to the maximum stay on a waiting list. Using a Multicri-teria Decision technique they intend to assign and manage,in an optimal way, the real performance of the surgical ser-vices of a medium-sized hospital in Spain.
The remainder of this paper is structured as follows. Sec-tion 3 describes the mathematical model on which the deci-sion support system is built. Section 4 presents the solutionprocedures that were developed starting from this mathemat-ical model. Section 5 gives some more information on thecase study. Section 6 contains a presentation of the graph-ical user interface that was built on top of the algorithmsto visualize the operation and performance of the system.Section 7 discusses the results obtained by applying the dif-ferent algorithms while Sect. 8 draws conclusions and listssome topics for future research.
3 Mathematical model
As already mentioned in the introduction, our decision sup-port model aims at three objectives. With respect to the firstobjective, leveling the resulting bed occupancy, the systemuses the model presented in Beliën and Demeulemeester(2007). This model assumes multinomial distribution func-tions for both the number of patients per operating roomblock and the length of stay of each operated patient. Us-ing this information, the model is capable of constructinga master surgery schedule with leveled resulting bed occu-pancy. In addition, performance measures such as the dailyexpected bed occupancy, the variance on this occupancy,the expected bed shortage, and the probability of a short-age on each day can be calculated. Leveling is achieved us-ing mixed integer programming (linear as well as quadratic)and a simulated annealing metaheuristic.
The theoretic model described in Beliën and Demeule-meester (2007) has been slightly modified in order to dealwith some practical issues. First, in the theoretic model, allpatients are assumed to recover in one hospitalization unit.In practice, of course, a hospital has more than one hospital-ization unit at which predetermined groups of patients can
recover from surgery. This is a fairly straightforward exten-sion, that can be achieved by considering different probabil-ity distributions for each surgeon–hospitalization-unit com-bination. A second limit of the theoretic model is the factthat block sizes are assumed to be fixed. In practice, how-ever, the time for which an operating room can be allo-cated to a particular surgeon is not necessarily fixed. Forinstance, one surgeon can be allocated to a block of 4 hourswhile another surgeon gets a block of 6 hours. This exten-sion has some consequences for the simulated annealing ap-proach (described in Beliën and Demeulemeester 2007) forwhich we have added a corresponding neighborhood move.Finally, the system described in this paper allows for the al-location of operating room time to individual surgeons in-stead of surgeon groups. This extension requires the addi-tion of an extra constraint that prevents individual surgeonsfrom being scheduled in different rooms at the same time.
We now state the mixed integer programming models thatare used to develop the master surgery schedules. We startwith the model that only aims at a leveled resulting bed oc-cupancy. Starting from this model we present the modifi-cations needed in order to take into account the other twoobjectives. The notation used in these models is as follows:
The indices and sets are:
i, j, d, d1, d2: days in the cycle.s: surgeons.r : rooms.h: hospitalization units.D: set of days in the cycle.A: set of days on which surgery takes place (=active days)
(usually all days, except for the weekends).S: set of surgeons.R: set of rooms.H : set of hospitalization units.
The decision variable is:
xisr =⎧⎨
⎩
1, if surgeon s obtains an operating room blockin room r on day i;
0, otherwise.
The help variables are:
meanhi = the mean bed occupancy in hospitalization unit h
on day i.meanh = the peak mean bed occupancy in hospitalization
unit h over all days in the cycle.varhi = the variance of the bed occupancy in hospitaliza-
tion unit h on day i.varh = the peak variance of the bed occupancy in hospital-
ization unit h over all days in the cycle.
The data parameters are:
reqs : the number of blocks required by surgeon s.capir : the total capacity (in hours) of room r on day i.
J Sched (2009) 12: 147–161 151
durs : the duration (in hours) of a block allocated to sur-geon s.
mbsijh: the contribution of allocating a block to surgeon s
on day j to the mean bed occupancy on day i in hospital-ization unit h.
vbsijh: the contribution of allocating a block to surgeon s
on day j to the variance of the bed occupancy on day i inhospitalization unit h.
wmeanh: the relative importance of leveling the mean occu-
pancy in hospitalization unit h.wvarh
: the relative importance of leveling the variance of theoccupancy in hospitalization unit h.
We start with the linear min–max model that aims at min-imizing the weighted peaks in the expected bed occupancyand/or the variance in bed occupancy:
Minimize∑
h∈H
(wmeanhmeanh + wvarh
varh) (1)
subject to:∑
i∈A
∑
r∈R
xisr = reqs ∀s ∈ S; (2)
∑
s∈S
dursxisr ≤ capir ∀i ∈ A and ∀r ∈ R; (3)
∑
r∈R
xisr ≤ 1 ∀i ∈ A and ∀s ∈ S; (4)
meanhi =∑
s∈S
∑
j∈A
∑
r∈R
mbsijhxjsr
∀h ∈ H and ∀i ∈ D; (5)
varhi =∑
s∈S
∑
j∈A
∑
r∈R
vbsijhxjsr
∀h ∈ H and ∀i ∈ D; (6)
meanhi ≤ meanh ∀h ∈ H and ∀i ∈ D; (7)
varhi ≤ varh ∀h ∈ H and ∀i ∈ D; (8)
meanhi, varhi ≥ 0 ∀h ∈ H and ∀i ∈ D; (9)
meanh, varh ≥ 0 ∀h ∈ H ; (10)
xisr ∈ {0,1} ∀i ∈ A,∀s ∈ S and ∀r ∈ R. (11)
The objective function (1) minimizes the weighted sum ofpeaks in the bed occupancy and variance over all hospi-talization units. Constraint set (2) ensures that every sur-geon obtains the right number of blocks. The number ofhours preserved for each surgeon is decided on a higher leveland is a consequence of the hospital’s strategic decision forwhich ailments capacity will be preserved (case mix plan-ning). Constraint set (3) makes sure that the total operatingtime assigned on each day in each room does not exceedthe available operating room time. Constraint set (4) pre-vents a surgeon to be scheduled simultaneously in two dif-ferent rooms. Constraint set (5) calculates the expected bed
occupancy in each hospitalization unit as a function of theoperating room schedule, while constraint set (6) calculatesthe variance on this occupancy. The reader is referred to Be-liën and Demeulemeester (2007) for more details on howthe values mbsijh and vbsijh are calculated. Constraint set(7) provides the link with the objective function by impos-ing for each hospitalization unit that the expected bed oc-cupancy on each day cannot exceed the peak expected bedoccupancy. Constraint set (8) does the same for the variance.Finally, constraint sets (9) and (10) define the mean and vari-ance to be nonnegative and constraint set (11) defines xisr asa binary decision variable.
The quadratic MIP model is identical to the linear min–max MIP model except for the objective function that rep-resents an explicit (weighted) leveling of the mean and vari-ance of the occupancy in the different hospitalization units:
Minimize∑
h∈H
(
wmeanh
∑
i∈A
mean2hi + wvarh
∑
i∈A
var2hi
)
. (12)
Obviously, constraints (7), (8), and (10) can now be removedas these are no longer required.
In order to take into account the second objective, that is,try to concentrate surgeons that belong to the same surgeongroup as much as possible in the same room, we need to addan extra penalty term in the objective function and two extraconstraints triggering this penalty. Define G as the set of allsurgeon groups g. In the ideal case all surgeons of one groupare scheduled in one and the same operating room. Let ROg
be an integer decision variable that represents the numberof extra operating rooms allocated to surgeon group g. Forinstance, if a group is allocated to two different rooms, thenROg equals 1, if a group is allocated to three different rooms,then ROg equals 2, etc. Now, we can add the following termto the objective functions (1) and (12):∑
g∈G
wroomg ROg (13)
with wroomg the relative importance (compared to the otherobjectives) of the room concentrating objective with respectto group g. To impose that ROg obtains the correct value,two constraints must be added to the model. Let bgr be abinary decision variable that equals 1 if at least one surgeonof surgeon group g ∈ G obtains an operating room blockin room r . Let Sg be the set containing all surgeons s thatbelong to group g and let |Sg| and |A| be the respective num-bers of elements in the sets Sg and A. The extra constraintsare:∑
i∈A
∑
s∈Sg
xisr ≤ |A||Sg|bgr ∀g ∈ G and ∀r ∈ R; (14)
∑
r∈R
bgr ≤ 1 + ROg ∀g ∈ G. (15)
152 J Sched (2009) 12: 147–161
In order to take into account the third objective, that is,making the schedules as repetitive as possible from weekto week if the cycle time is longer than one week, we needsome extra decision variables. Since the cycle time in thestudied hospital is either one or two weeks, we will onlyconsider this case. Let Oisr be a binary decision variablethat equals 1 if surgeon s obtains an operating room block atday i in room r only during the odd weeks and 0 otherwise,while Eisr represents the same for the even weeks. Whetherthe cycle time is one week or two weeks, the set of activedays A remains the same containing 5 days (from Mondayto Friday). The set of days D, however, contains all days inthe cycle time (hence, 14 days in case of a cycle time of twoweeks). Note that if xisr is set to 1, then surgeon s obtainsa block on day i in the odd weeks and on day i in the evenweeks, whereas, if Oisr (Eisr ) is set to 1, this surgeon onlygets a block in the odd (even) weeks. The following term isadded to the objective functions (1) and (12):
∑
i∈A
∑
s∈S
∑
r∈R
woddevens (Oisr + Eisr ) (16)
with woddevens the relative importance of a repetitive sched-ule for surgeon s. The constraints (2)–(6) are modified asfollows:
∑
i∈A
∑
r∈R
(2xisr + Oisr + Eisr ) = 2reqs ∀s ∈ S; (17)
∑
s∈S
durs(xisr + Oisr + Eisr ) ≤ capir
∀i ∈ A and ∀r ∈ R; (18)
∑
r∈R
(xisr + Oisr + Eisr ) ≤ 1 ∀i ∈ A and ∀s ∈ S; (19)
meanhi =∑
s∈S
∑
j∈A
∑
r∈R
(mbsijhxjsr + ombsijhOjsr
+ embsijhEjsr ) ∀h ∈ H and ∀i ∈ D; (20)
varhi =∑
s∈S
∑
j∈A
∑
r∈R
(vbsijhxjsr + ovbsijhOjsr
+ evbsijhEjsr ) ∀h ∈ H and ∀i ∈ D, (21)
with ombsijh (embsijh) the contribution to the mean bed oc-cupancy on day i in hospitalization unit h of allocating ablock to surgeon s on day j of the odd (even) weeks andovbsijh (evbsijh) the contributions to the respective bed oc-cupancy variances.
4 Solution procedures
To solve the model outlined above, the application cancall the CPLEX MIP solver (ILOG 2002) for linear andquadratic optimization. Unfortunately, incorporating thethree objectives simultaneously leads to such a large mixedinteger program that the problem becomes computationallyintractable (see further). As the system is designed to sup-port the decision making process, it is crucial that users getquick answers to what-if questions. Therefore, alternativeheuristic solution procedures have been developed. A firstheuristic is a modified version of the simulated annealingprocedure described in Beliën and Demeulemeester (2007)that also evaluates the second and third objective.
Simulated annealing (SA) is a technique to find a goodsolution to an optimization problem by trying random vari-ations of the current solution. A worse variation is acceptedas the new solution with a probability that decreases as thecomputation proceeds. The slower the cooling schedule, orrate of decrease, the more likely the algorithm is to findan optimal or near-optimal solution. The algorithm is basedupon that of Metropolis et al. (1958), which was originallyproposed as a means of finding the equilibrium configura-tion of a collection of atoms at a given temperature. The con-nection between this algorithm and mathematical minimiza-tion was first noted by Pincus (1970), but it was Kirkpatricket al. (1983) who proposed that it forms the basis of a searchtechnique for combinatorial (and other) problems. Good the-oretic expositions on simulated annealing can also be foundin Huang et al. (1986) and Van Laarhoven and Aarts (1988).
We implemented a basic SA implementation in which theneighborhood is defined as all solutions which could be ob-tained after swapping two surgery blocks from the currentsolution. The first block is chosen randomly. The secondblock is the first encountered block for which a swap re-sults in an improvement (decrease) of the objective value. Ifno such block can be found, the block leading to the small-est increase is chosen. In order to deal with variable blocksizes we added the restriction that surgeon block allocationscan only be swapped if they have the same duration. To beable to explore a larger neighborhood, also swaps betweensets of surgeon block allocations could be performed, pro-vided that these sets have the same total duration, makingsure that available operating room time is not exceeded inone of the rooms after a swap. In order to decide whetheror not to accept a worse solution, a standard Boltzman func-tion is evaluated. Let T denote the temperature and �f thedecrease in objective function. For swaps with negative �f
the probability of acceptance is given by e�fT . Of course, the
best found schedule is saved. For the test results reported be-low, the temperature T was initialized at 500 and decreasedwith 5% after each 10 iterations.
A second attempt to obtain good solutions in small com-putation times resulted in the development of hierarchical
J Sched (2009) 12: 147–161 153
goal programming models. These models first concentrateon one objective after which the next objective is opti-mized. A first important simplification concerns the cycletime. Even when changes from the first week to the secondare, to a small extent, allowed, and hence the cycle time isin theory two weeks, we will start with developing a one-week schedule. This schedule is then copied to the secondweek, after which some modifications can be made in a post-optimization step (see further).
Observation 1 The resulting bed occupancy remains un-changed when a surgeon block is shifted to a different oper-ating room on the same day. Indeed, only the time of surgerydetermines when patients enter the hospital and when theyare expected to occupy a bed; the operating room wheresurgery takes place has no impact on the bed occupancy.
This first observation leads to a first hierarchical goalprogramming approach consisting of two goal programmingmodels that are solved successively (HIER-GOAL-1):
1. Solve the MIP that only aims at leveling the bed oc-cupancy, that is, solve the linear MIP (1)–(11) or thequadratic MIP with objective function (12).
2. Solve a MIP that only aims at the room objective, inwhich surgeon blocks cannot be shifted to different daysbut only to different rooms.
The decision variables in the second MIP are selectedbased on the solution of the first MIP. If xisr equals one inthe solution of the first MIP, then all xi′sr with i′ �= i willnot be present in the second MIP, ensuring that surgeons arenot shifted to another day. This two-step approach makes themodel much easier to solve.
Observation 2 The number of different operating roomsused by a surgeon group remains unchanged when a sur-geon block is shifted to a different day in the same operatingroom.
This second observation leads to a second hierarchi-cal goal programming approach consisting of two goalprogramming models that are solved successively (HIER-GOAL-2):
1. Solve the MIP that only aims at the room objective, thatis, solve the linear MIP with objective (13) and con-straints (2)–(4).
2. Solve a MIP that only aims at the leveling objective,in which surgeon blocks cannot be shifted to differentrooms but only to different days.
Similarly, the decision variables in the second MIP areselected based on the solution of the first MIP. If xisr equalsone in the solution of the first MIP, then all xisr ′ with r ′ �= r
will not be present in the second MIP, ensuring that sur-geons are not shifted to another room. This two-step ap-proach makes the model again much easier to solve.
Improvement step As already said, even when the cycletime is two weeks, both hierarchical approaches outlinedabove aim at a one-week schedule. Afterwards the devel-oped schedule is copied to the second week. Since the sched-ule of the first week is exactly the same as the schedule ofthe second week, we incur no penalty cost for the differencebetween odd and even weeks (no odd–even penalty cost).Although leading to an odd–even penalty cost, some modi-fications to the schedule could be beneficial with respect tothe resulting bed occupancy. Therefore, a post-optimizationprocedure can be applied that searches for the surgeon swapthat results in the best improvement with respect to a chosenobjective (leveling, minimizing expected shortage, probabil-ity of shortage). The user can control the odd–even penaltycost by limiting the maximal number of swaps in the post-optimization procedure.
An extra asset is that the different procedures of the hi-erarchical goal programming models can also be used sepa-rately in order to solve what-if questions. One can start froma given schedule, for instance the schedule that is currentlyin practice, and execute the second MIP optimization forwhich either the days or the rooms of surgery are fixed. If,for instance, the room allocation is fixed, one can find ananswer to the question: To what extent the bed occupancycan be leveled without changing the room allocations? Al-ternatively, if the days are fixed, one can obtain an answerto the question: To what extent the room allocations can berearranged such that the same specialties share the same op-erating room without changing the expected bed occupancy?
5 Case study
The case study presented entails the Virga Jesse Hospital,situated in Hasselt, Belgium. Virga Jesse’s central operat-ing room complex consists of 9 rooms in which a total of46 surgeons have been assigned operating room time. Thesesurgeons are classified into 14 different surgeon groups withrespect to the specialism. Each operating room is open fromMonday to Friday for 8.5 hours. Up to now, no electivesurgery takes place during the weekends. The hospital has25 different hospitalization units, however, only 10 unitshave served more than 100 elective cases in 2004. Themodels applied in this study involve the development of a(cyclic) master surgery schedule with leveled bed occupancyin these 10 major hospitalization units.
For the leveling objective we need as input for eachsurgeon–hospitalization-unit combination the probabilitydistributions of the number of patients per block and the
154 J Sched (2009) 12: 147–161
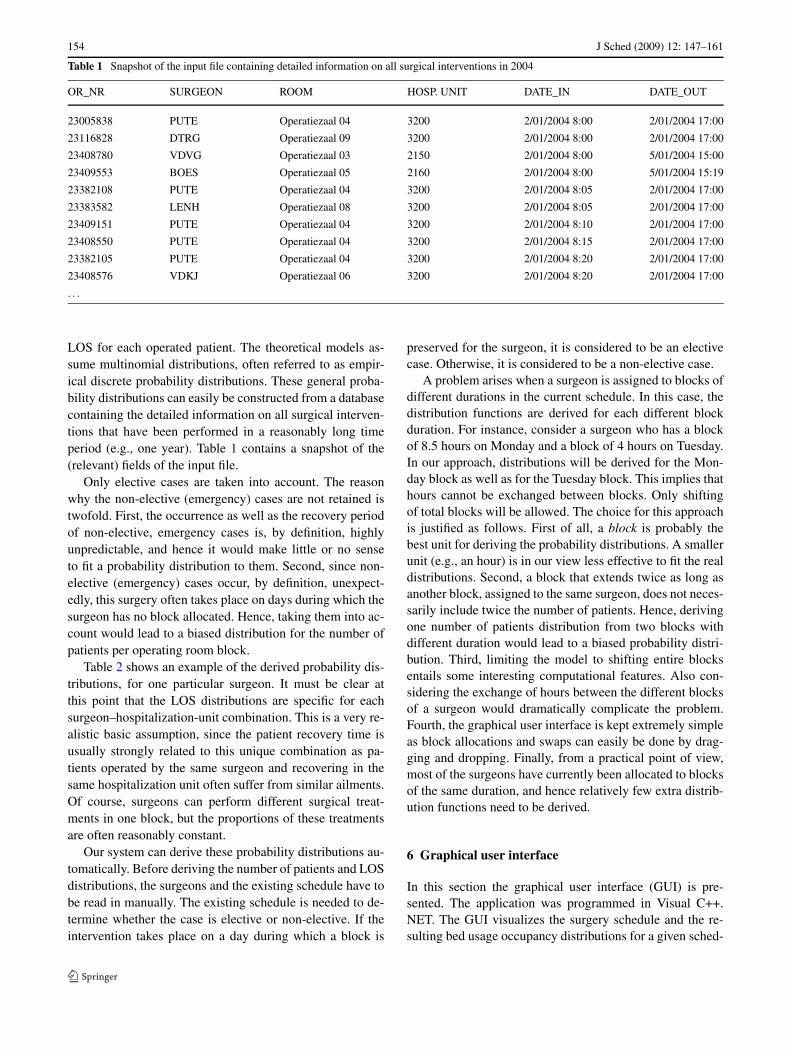
Table 1 Snapshot of the input file containing detailed information on all surgical interventions in 2004
OR_NR SURGEON ROOM HOSP. UNIT DATE_IN DATE_OUT
23005838 PUTE Operatiezaal 04 3200 2/01/2004 8:00 2/01/2004 17:00
23116828 DTRG Operatiezaal 09 3200 2/01/2004 8:00 2/01/2004 17:00
23408780 VDVG Operatiezaal 03 2150 2/01/2004 8:00 5/01/2004 15:00
23409553 BOES Operatiezaal 05 2160 2/01/2004 8:00 5/01/2004 15:19
23382108 PUTE Operatiezaal 04 3200 2/01/2004 8:05 2/01/2004 17:00
23383582 LENH Operatiezaal 08 3200 2/01/2004 8:05 2/01/2004 17:00
23409151 PUTE Operatiezaal 04 3200 2/01/2004 8:10 2/01/2004 17:00
23408550 PUTE Operatiezaal 04 3200 2/01/2004 8:15 2/01/2004 17:00
23382105 PUTE Operatiezaal 04 3200 2/01/2004 8:20 2/01/2004 17:00
23408576 VDKJ Operatiezaal 06 3200 2/01/2004 8:20 2/01/2004 17:00
. . .
LOS for each operated patient. The theoretical models as-sume multinomial distributions, often referred to as empir-ical discrete probability distributions. These general proba-bility distributions can easily be constructed from a databasecontaining the detailed information on all surgical interven-tions that have been performed in a reasonably long timeperiod (e.g., one year). Table 1 contains a snapshot of the(relevant) fields of the input file.
Only elective cases are taken into account. The reasonwhy the non-elective (emergency) cases are not retained istwofold. First, the occurrence as well as the recovery periodof non-elective, emergency cases is, by definition, highlyunpredictable, and hence it would make little or no senseto fit a probability distribution to them. Second, since non-elective (emergency) cases occur, by definition, unexpect-edly, this surgery often takes place on days during which thesurgeon has no block allocated. Hence, taking them into ac-count would lead to a biased distribution for the number ofpatients per operating room block.
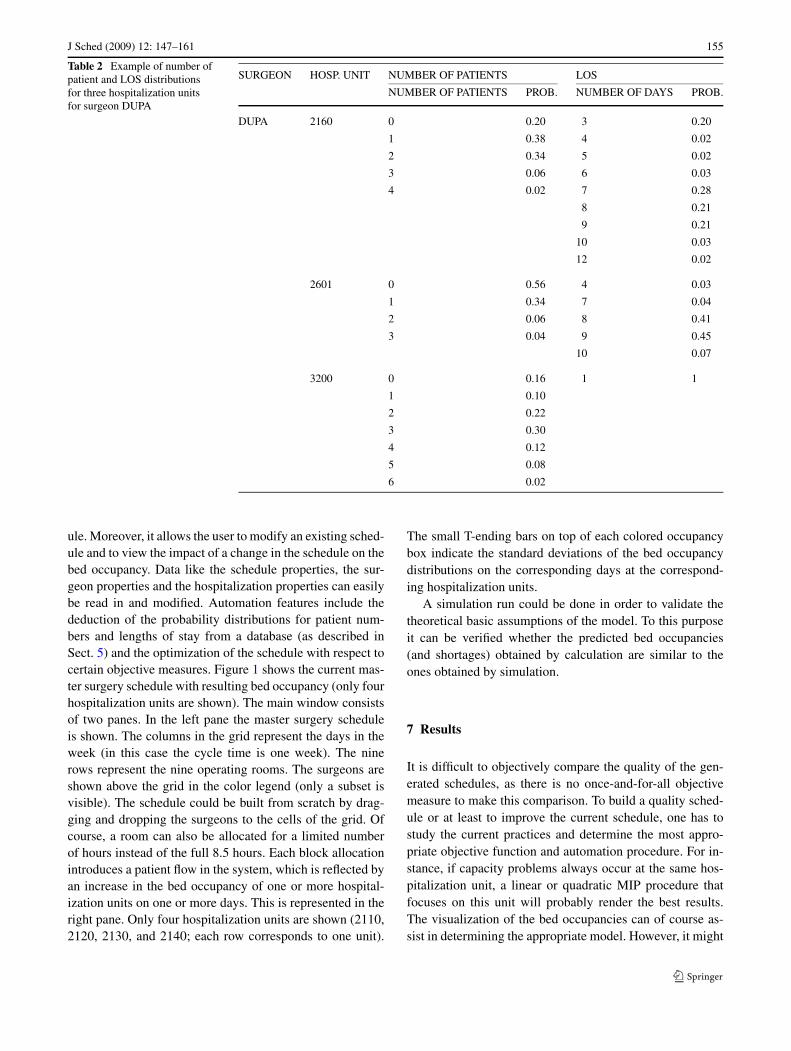
Table 2 shows an example of the derived probability dis-tributions, for one particular surgeon. It must be clear atthis point that the LOS distributions are specific for eachsurgeon–hospitalization-unit combination. This is a very re-alistic basic assumption, since the patient recovery time isusually strongly related to this unique combination as pa-tients operated by the same surgeon and recovering in thesame hospitalization unit often suffer from similar ailments.Of course, surgeons can perform different surgical treat-ments in one block, but the proportions of these treatmentsare often reasonably constant.
Our system can derive these probability distributions au-tomatically. Before deriving the number of patients and LOSdistributions, the surgeons and the existing schedule have tobe read in manually. The existing schedule is needed to de-termine whether the case is elective or non-elective. If theintervention takes place on a day during which a block is
preserved for the surgeon, it is considered to be an electivecase. Otherwise, it is considered to be a non-elective case.
A problem arises when a surgeon is assigned to blocks ofdifferent durations in the current schedule. In this case, thedistribution functions are derived for each different blockduration. For instance, consider a surgeon who has a blockof 8.5 hours on Monday and a block of 4 hours on Tuesday.In our approach, distributions will be derived for the Mon-day block as well as for the Tuesday block. This implies thathours cannot be exchanged between blocks. Only shiftingof total blocks will be allowed. The choice for this approachis justified as follows. First of all, a block is probably thebest unit for deriving the probability distributions. A smallerunit (e.g., an hour) is in our view less effective to fit the realdistributions. Second, a block that extends twice as long asanother block, assigned to the same surgeon, does not neces-sarily include twice the number of patients. Hence, derivingone number of patients distribution from two blocks withdifferent duration would lead to a biased probability distri-bution. Third, limiting the model to shifting entire blocksentails some interesting computational features. Also con-sidering the exchange of hours between the different blocksof a surgeon would dramatically complicate the problem.Fourth, the graphical user interface is kept extremely simpleas block allocations and swaps can easily be done by drag-ging and dropping. Finally, from a practical point of view,most of the surgeons have currently been allocated to blocksof the same duration, and hence relatively few extra distrib-ution functions need to be derived.
6 Graphical user interface
In this section the graphical user interface (GUI) is pre-sented. The application was programmed in Visual C++.NET. The GUI visualizes the surgery schedule and the re-sulting bed usage occupancy distributions for a given sched-
J Sched (2009) 12: 147–161 155
Table 2 Example of number ofpatient and LOS distributionsfor three hospitalization unitsfor surgeon DUPA
SURGEON HOSP. UNIT NUMBER OF PATIENTS LOS
NUMBER OF PATIENTS PROB. NUMBER OF DAYS PROB.
DUPA 2160 0 0.20 3 0.20
1 0.38 4 0.02
2 0.34 5 0.02
3 0.06 6 0.03
4 0.02 7 0.28
8 0.21
9 0.21
10 0.03
12 0.02
2601 0 0.56 4 0.03
1 0.34 7 0.04
2 0.06 8 0.41
3 0.04 9 0.45
10 0.07
3200 0 0.16 1 1
1 0.10
2 0.22
3 0.30
4 0.12
5 0.08
6 0.02
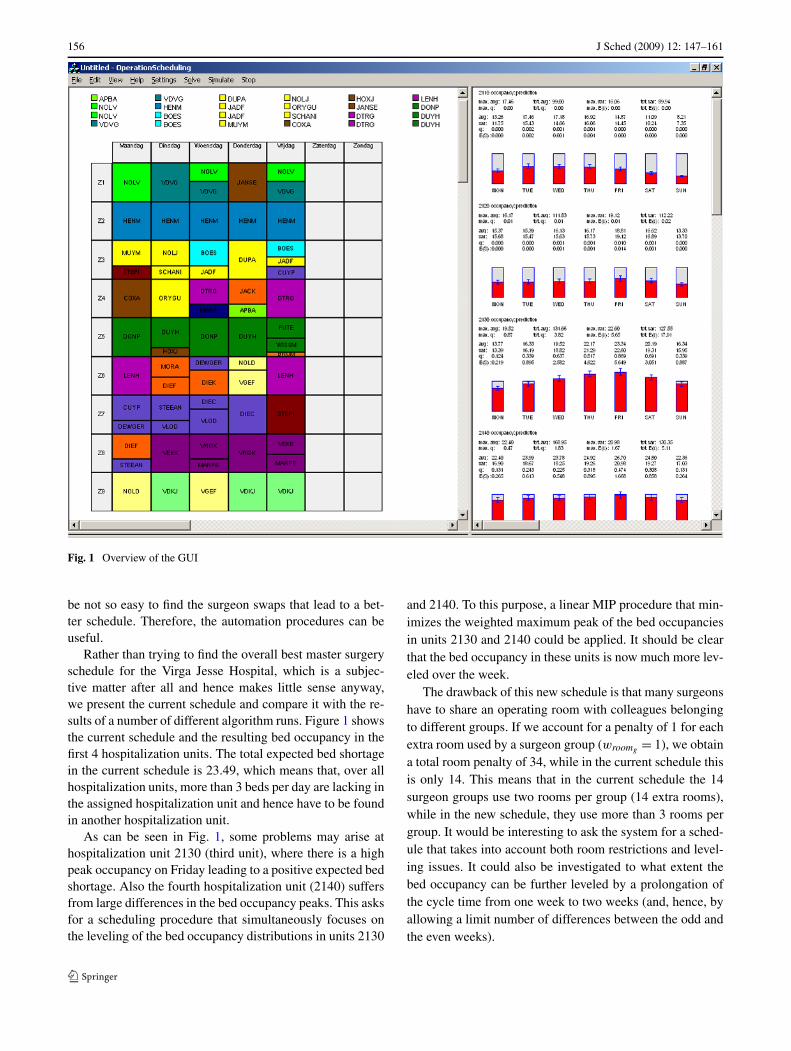
ule. Moreover, it allows the user to modify an existing sched-ule and to view the impact of a change in the schedule on thebed occupancy. Data like the schedule properties, the sur-geon properties and the hospitalization properties can easilybe read in and modified. Automation features include thededuction of the probability distributions for patient num-bers and lengths of stay from a database (as described inSect. 5) and the optimization of the schedule with respect tocertain objective measures. Figure 1 shows the current mas-ter surgery schedule with resulting bed occupancy (only fourhospitalization units are shown). The main window consistsof two panes. In the left pane the master surgery scheduleis shown. The columns in the grid represent the days in theweek (in this case the cycle time is one week). The ninerows represent the nine operating rooms. The surgeons areshown above the grid in the color legend (only a subset isvisible). The schedule could be built from scratch by drag-ging and dropping the surgeons to the cells of the grid. Ofcourse, a room can also be allocated for a limited numberof hours instead of the full 8.5 hours. Each block allocationintroduces a patient flow in the system, which is reflected byan increase in the bed occupancy of one or more hospital-ization units on one or more days. This is represented in theright pane. Only four hospitalization units are shown (2110,2120, 2130, and 2140; each row corresponds to one unit).
The small T-ending bars on top of each colored occupancybox indicate the standard deviations of the bed occupancydistributions on the corresponding days at the correspond-ing hospitalization units.
A simulation run could be done in order to validate thetheoretical basic assumptions of the model. To this purposeit can be verified whether the predicted bed occupancies(and shortages) obtained by calculation are similar to theones obtained by simulation.
7 Results
It is difficult to objectively compare the quality of the gen-erated schedules, as there is no once-and-for-all objectivemeasure to make this comparison. To build a quality sched-ule or at least to improve the current schedule, one has tostudy the current practices and determine the most appro-priate objective function and automation procedure. For in-stance, if capacity problems always occur at the same hos-pitalization unit, a linear or quadratic MIP procedure thatfocuses on this unit will probably render the best results.The visualization of the bed occupancies can of course as-sist in determining the appropriate model. However, it might
156 J Sched (2009) 12: 147–161
Fig. 1 Overview of the GUI
be not so easy to find the surgeon swaps that lead to a bet-ter schedule. Therefore, the automation procedures can beuseful.
Rather than trying to find the overall best master surgeryschedule for the Virga Jesse Hospital, which is a subjec-tive matter after all and hence makes little sense anyway,we present the current schedule and compare it with the re-sults of a number of different algorithm runs. Figure 1 showsthe current schedule and the resulting bed occupancy in thefirst 4 hospitalization units. The total expected bed shortagein the current schedule is 23.49, which means that, over allhospitalization units, more than 3 beds per day are lacking inthe assigned hospitalization unit and hence have to be foundin another hospitalization unit.
As can be seen in Fig. 1, some problems may arise athospitalization unit 2130 (third unit), where there is a highpeak occupancy on Friday leading to a positive expected bedshortage. Also the fourth hospitalization unit (2140) suffersfrom large differences in the bed occupancy peaks. This asksfor a scheduling procedure that simultaneously focuses onthe leveling of the bed occupancy distributions in units 2130
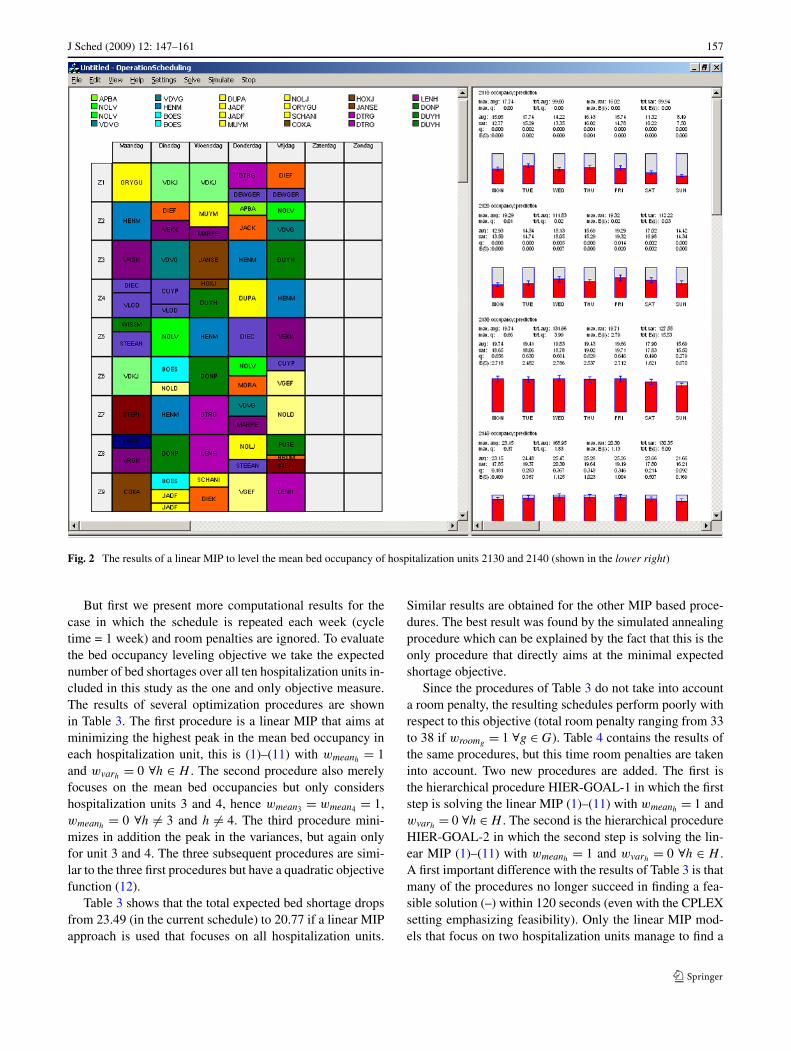
and 2140. To this purpose, a linear MIP procedure that min-imizes the weighted maximum peak of the bed occupanciesin units 2130 and 2140 could be applied. It should be clearthat the bed occupancy in these units is now much more lev-eled over the week.
The drawback of this new schedule is that many surgeonshave to share an operating room with colleagues belongingto different groups. If we account for a penalty of 1 for eachextra room used by a surgeon group (wroomg = 1), we obtaina total room penalty of 34, while in the current schedule thisis only 14. This means that in the current schedule the 14surgeon groups use two rooms per group (14 extra rooms),while in the new schedule, they use more than 3 rooms pergroup. It would be interesting to ask the system for a sched-ule that takes into account both room restrictions and level-ing issues. It could also be investigated to what extent thebed occupancy can be further leveled by a prolongation ofthe cycle time from one week to two weeks (and, hence, byallowing a limit number of differences between the odd andthe even weeks).
J Sched (2009) 12: 147–161 157
Fig. 2 The results of a linear MIP to level the mean bed occupancy of hospitalization units 2130 and 2140 (shown in the lower right)
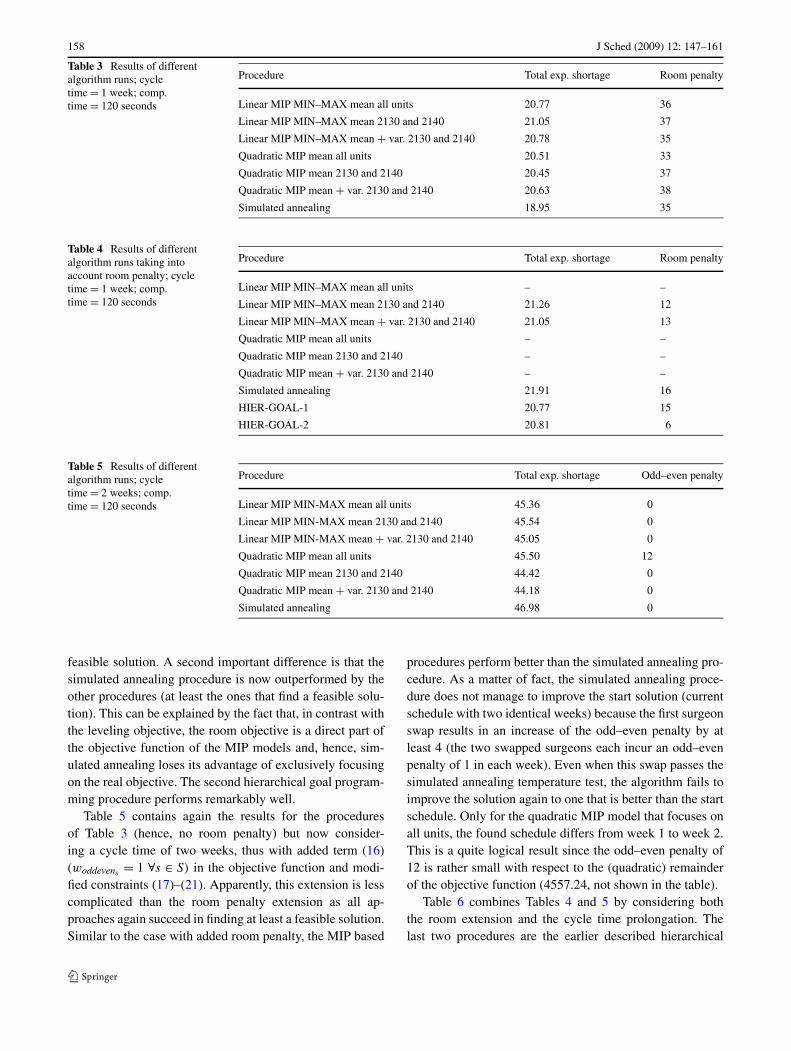
But first we present more computational results for thecase in which the schedule is repeated each week (cycletime = 1 week) and room penalties are ignored. To evaluatethe bed occupancy leveling objective we take the expectednumber of bed shortages over all ten hospitalization units in-cluded in this study as the one and only objective measure.The results of several optimization procedures are shownin Table 3. The first procedure is a linear MIP that aims atminimizing the highest peak in the mean bed occupancy ineach hospitalization unit, this is (1)–(11) with wmeanh
= 1and wvarh
= 0 ∀h ∈ H . The second procedure also merelyfocuses on the mean bed occupancies but only considershospitalization units 3 and 4, hence wmean3 = wmean4 = 1,wmeanh
= 0 ∀h �= 3 and h �= 4. The third procedure mini-mizes in addition the peak in the variances, but again onlyfor unit 3 and 4. The three subsequent procedures are simi-lar to the three first procedures but have a quadratic objectivefunction (12).
Table 3 shows that the total expected bed shortage dropsfrom 23.49 (in the current schedule) to 20.77 if a linear MIPapproach is used that focuses on all hospitalization units.
Similar results are obtained for the other MIP based proce-dures. The best result was found by the simulated annealingprocedure which can be explained by the fact that this is theonly procedure that directly aims at the minimal expectedshortage objective.
Since the procedures of Table 3 do not take into accounta room penalty, the resulting schedules perform poorly withrespect to this objective (total room penalty ranging from 33to 38 if wroomg = 1 ∀g ∈ G). Table 4 contains the results ofthe same procedures, but this time room penalties are takeninto account. Two new procedures are added. The first isthe hierarchical procedure HIER-GOAL-1 in which the firststep is solving the linear MIP (1)–(11) with wmeanh
= 1 andwvarh
= 0 ∀h ∈ H . The second is the hierarchical procedureHIER-GOAL-2 in which the second step is solving the lin-ear MIP (1)–(11) with wmeanh
= 1 and wvarh= 0 ∀h ∈ H .
A first important difference with the results of Table 3 is thatmany of the procedures no longer succeed in finding a fea-sible solution (–) within 120 seconds (even with the CPLEXsetting emphasizing feasibility). Only the linear MIP mod-els that focus on two hospitalization units manage to find a
158 J Sched (2009) 12: 147–161
Table 3 Results of differentalgorithm runs; cycletime = 1 week; comp.time = 120 seconds
Procedure Total exp. shortage Room penalty
Linear MIP MIN–MAX mean all units 20.77 36
Linear MIP MIN–MAX mean 2130 and 2140 21.05 37
Linear MIP MIN–MAX mean + var. 2130 and 2140 20.78 35
Quadratic MIP mean all units 20.51 33
Quadratic MIP mean 2130 and 2140 20.45 37
Quadratic MIP mean + var. 2130 and 2140 20.63 38
Simulated annealing 18.95 35
Table 4 Results of differentalgorithm runs taking intoaccount room penalty; cycletime = 1 week; comp.time = 120 seconds
Procedure Total exp. shortage Room penalty
Linear MIP MIN–MAX mean all units – –
Linear MIP MIN–MAX mean 2130 and 2140 21.26 12
Linear MIP MIN–MAX mean + var. 2130 and 2140 21.05 13
Quadratic MIP mean all units – –
Quadratic MIP mean 2130 and 2140 – –
Quadratic MIP mean + var. 2130 and 2140 – –
Simulated annealing 21.91 16
HIER-GOAL-1 20.77 15
HIER-GOAL-2 20.81 6
Table 5 Results of differentalgorithm runs; cycletime = 2 weeks; comp.time = 120 seconds
Procedure Total exp. shortage Odd–even penalty
Linear MIP MIN-MAX mean all units 45.36 0
Linear MIP MIN-MAX mean 2130 and 2140 45.54 0
Linear MIP MIN-MAX mean + var. 2130 and 2140 45.05 0
Quadratic MIP mean all units 45.50 12
Quadratic MIP mean 2130 and 2140 44.42 0
Quadratic MIP mean + var. 2130 and 2140 44.18 0
Simulated annealing 46.98 0
feasible solution. A second important difference is that thesimulated annealing procedure is now outperformed by theother procedures (at least the ones that find a feasible solu-tion). This can be explained by the fact that, in contrast withthe leveling objective, the room objective is a direct part ofthe objective function of the MIP models and, hence, sim-ulated annealing loses its advantage of exclusively focusingon the real objective. The second hierarchical goal program-ming procedure performs remarkably well.
Table 5 contains again the results for the proceduresof Table 3 (hence, no room penalty) but now consider-ing a cycle time of two weeks, thus with added term (16)(woddevens = 1 ∀s ∈ S) in the objective function and modi-fied constraints (17)–(21). Apparently, this extension is lesscomplicated than the room penalty extension as all ap-proaches again succeed in finding at least a feasible solution.Similar to the case with added room penalty, the MIP based
procedures perform better than the simulated annealing pro-cedure. As a matter of fact, the simulated annealing proce-dure does not manage to improve the start solution (currentschedule with two identical weeks) because the first surgeonswap results in an increase of the odd–even penalty by atleast 4 (the two swapped surgeons each incur an odd–evenpenalty of 1 in each week). Even when this swap passes thesimulated annealing temperature test, the algorithm fails toimprove the solution again to one that is better than the startschedule. Only for the quadratic MIP model that focuses onall units, the found schedule differs from week 1 to week 2.This is a quite logical result since the odd–even penalty of12 is rather small with respect to the (quadratic) remainderof the objective function (4557.24, not shown in the table).
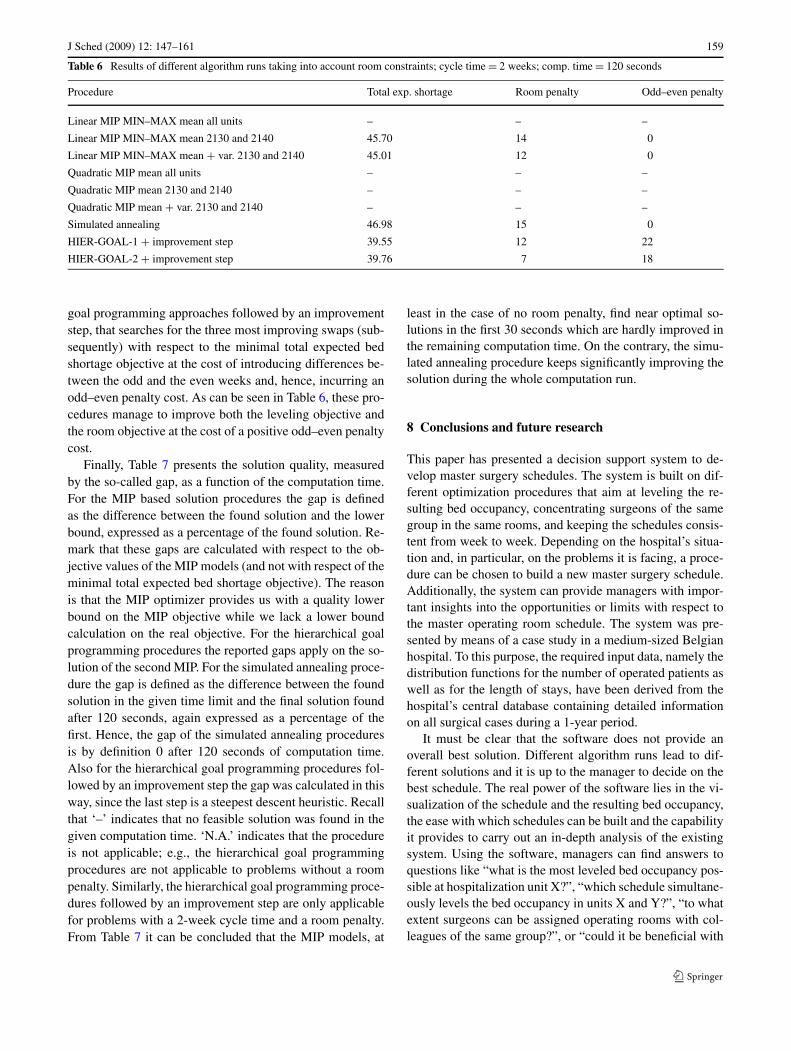
Table 6 combines Tables 4 and 5 by considering boththe room extension and the cycle time prolongation. Thelast two procedures are the earlier described hierarchical
J Sched (2009) 12: 147–161 159
Table 6 Results of different algorithm runs taking into account room constraints; cycle time = 2 weeks; comp. time = 120 seconds
Procedure Total exp. shortage Room penalty Odd–even penalty
Linear MIP MIN–MAX mean all units – – –
Linear MIP MIN–MAX mean 2130 and 2140 45.70 14 0
Linear MIP MIN–MAX mean + var. 2130 and 2140 45.01 12 0
Quadratic MIP mean all units – – –
Quadratic MIP mean 2130 and 2140 – – –
Quadratic MIP mean + var. 2130 and 2140 – – –
Simulated annealing 46.98 15 0
HIER-GOAL-1 + improvement step 39.55 12 22
HIER-GOAL-2 + improvement step 39.76 7 18
goal programming approaches followed by an improvementstep, that searches for the three most improving swaps (sub-sequently) with respect to the minimal total expected bedshortage objective at the cost of introducing differences be-tween the odd and the even weeks and, hence, incurring anodd–even penalty cost. As can be seen in Table 6, these pro-cedures manage to improve both the leveling objective andthe room objective at the cost of a positive odd–even penaltycost.
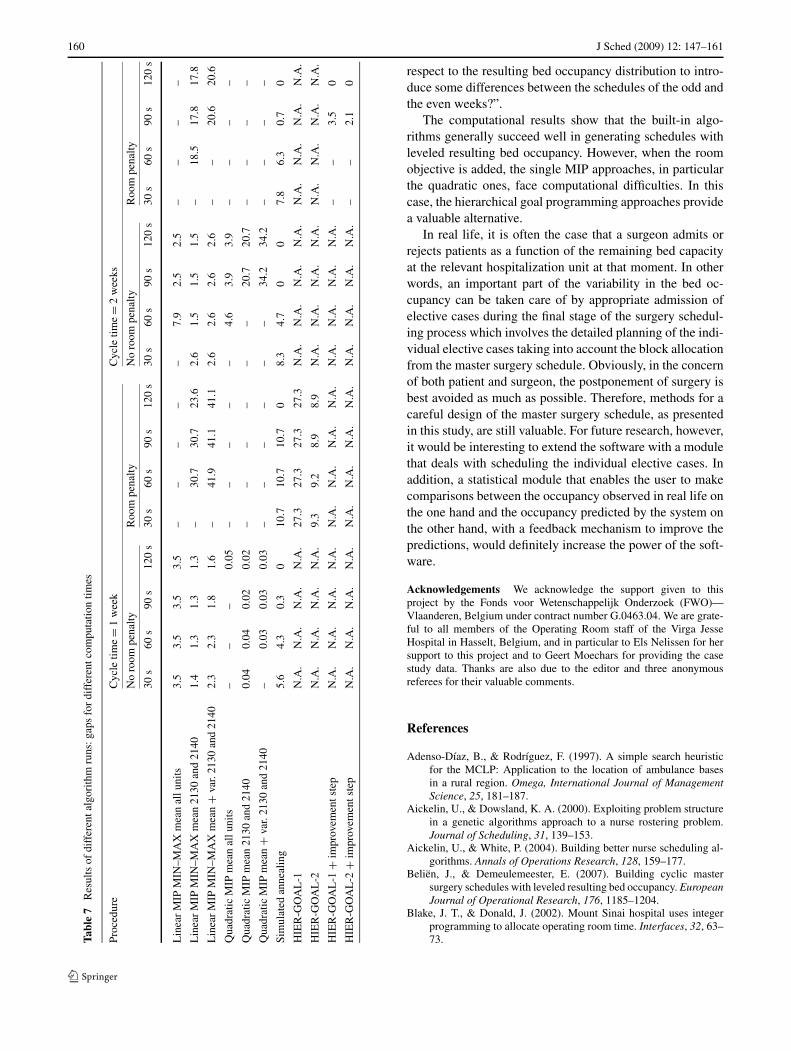
Finally, Table 7 presents the solution quality, measuredby the so-called gap, as a function of the computation time.For the MIP based solution procedures the gap is definedas the difference between the found solution and the lowerbound, expressed as a percentage of the found solution. Re-mark that these gaps are calculated with respect to the ob-jective values of the MIP models (and not with respect of theminimal total expected bed shortage objective). The reasonis that the MIP optimizer provides us with a quality lowerbound on the MIP objective while we lack a lower boundcalculation on the real objective. For the hierarchical goalprogramming procedures the reported gaps apply on the so-lution of the second MIP. For the simulated annealing proce-dure the gap is defined as the difference between the foundsolution in the given time limit and the final solution foundafter 120 seconds, again expressed as a percentage of thefirst. Hence, the gap of the simulated annealing proceduresis by definition 0 after 120 seconds of computation time.Also for the hierarchical goal programming procedures fol-lowed by an improvement step the gap was calculated in thisway, since the last step is a steepest descent heuristic. Recallthat ‘–’ indicates that no feasible solution was found in thegiven computation time. ‘N.A.’ indicates that the procedureis not applicable; e.g., the hierarchical goal programmingprocedures are not applicable to problems without a roompenalty. Similarly, the hierarchical goal programming proce-dures followed by an improvement step are only applicablefor problems with a 2-week cycle time and a room penalty.From Table 7 it can be concluded that the MIP models, at
least in the case of no room penalty, find near optimal so-lutions in the first 30 seconds which are hardly improved inthe remaining computation time. On the contrary, the simu-lated annealing procedure keeps significantly improving thesolution during the whole computation run.
8 Conclusions and future research
This paper has presented a decision support system to de-velop master surgery schedules. The system is built on dif-ferent optimization procedures that aim at leveling the re-sulting bed occupancy, concentrating surgeons of the samegroup in the same rooms, and keeping the schedules consis-tent from week to week. Depending on the hospital’s situa-tion and, in particular, on the problems it is facing, a proce-dure can be chosen to build a new master surgery schedule.Additionally, the system can provide managers with impor-tant insights into the opportunities or limits with respect tothe master operating room schedule. The system was pre-sented by means of a case study in a medium-sized Belgianhospital. To this purpose, the required input data, namely thedistribution functions for the number of operated patients aswell as for the length of stays, have been derived from thehospital’s central database containing detailed informationon all surgical cases during a 1-year period.
It must be clear that the software does not provide anoverall best solution. Different algorithm runs lead to dif-ferent solutions and it is up to the manager to decide on thebest schedule. The real power of the software lies in the vi-sualization of the schedule and the resulting bed occupancy,the ease with which schedules can be built and the capabilityit provides to carry out an in-depth analysis of the existingsystem. Using the software, managers can find answers toquestions like “what is the most leveled bed occupancy pos-sible at hospitalization unit X?”, “which schedule simultane-ously levels the bed occupancy in units X and Y?”, “to whatextent surgeons can be assigned operating rooms with col-leagues of the same group?”, or “could it be beneficial with
160 J Sched (2009) 12: 147–161
Tabl
e7
Res
ults
ofdi
ffer
enta
lgor
ithm
runs
:gap
sfo
rdi
ffer
entc
ompu
tatio
ntim
es
Proc
edur
eC
ycle
time=
1w
eek
Cyc
letim
e=
2w
eeks
No
room
pena
ltyR
oom
pena
ltyN
oro
ompe
nalty
Roo
mpe
nalty
30s
60s
90s
120
s30
s60
s90
s12
0s
30s
60s
90s
120
s30
s60
s90
s12
0s
Lin
ear
MIP
MIN
–MA
Xm
ean
allu
nits
3.5
3.5
3.5
3.5
––
––
–7.
92.
52.
5–
––
–
Lin
ear
MIP
MIN
–MA
Xm
ean
2130
and
2140
1.4
1.3
1.3
1.3
–30
.730
.723
.62.
61.
51.
51.
5–
18.5
17.8
17.8
Lin
ear
MIP
MIN
–MA
Xm
ean
+va
r.21
30an
d21
402.
32.
31.
81.
6–
41.9
41.1
41.1
2.6
2.6
2.6
2.6
––
20.6
20.6
Qua
drat
icM
IPm
ean
allu
nits
––
–0.
05–
––
––
4.6
3.9
3.9
––
––
Qua
drat
icM
IPm
ean
2130
and
2140
0.04
0.04
0.02
0.02
––
––
––
20.7
20.7
––
––
Qua
drat
icM
IPm
ean
+va
r.21
30an
d21
40–
0.03
0.03
0.03
––
––
––
34.2
34.2
––
––
Sim
ulat
edan
neal
ing
5.6
4.3
0.3
010
.710
.710
.70
8.3
4.7
00
7.8
6.3
0.7
0
HIE
R-G
OA
L-1
N.A
.N
.A.
N.A
.N
.A.
27.3
27.3
27.3
27.3
N.A
.N
.A.
N.A
.N
.A.
N.A
.N
.A.
N.A
.N
.A.
HIE
R-G
OA
L-2
N.A
.N
.A.
N.A
.N
.A.
9.3
9.2
8.9
8.9
N.A
.N
.A.
N.A
.N
.A.
N.A
.N
.A.
N.A
.N
.A.
HIE
R-G
OA
L-1
+im
prov
emen
tste
pN
.A.
N.A
.N
.A.
N.A
.N
.A.
N.A
.N
.A.
N.A
.N
.A.
N.A
.N
.A.
N.A
.–
–3.
50
HIE
R-G
OA
L-2
+im
prov
emen
tste
pN
.A.
N.A
.N
.A.
N.A
.N
.A.
N.A
.N
.A.
N.A
.N
.A.
N.A
.N
.A.
N.A
.–
–2.
10
respect to the resulting bed occupancy distribution to intro-duce some differences between the schedules of the odd andthe even weeks?”.
The computational results show that the built-in algo-rithms generally succeed well in generating schedules withleveled resulting bed occupancy. However, when the roomobjective is added, the single MIP approaches, in particularthe quadratic ones, face computational difficulties. In thiscase, the hierarchical goal programming approaches providea valuable alternative.
In real life, it is often the case that a surgeon admits orrejects patients as a function of the remaining bed capacityat the relevant hospitalization unit at that moment. In otherwords, an important part of the variability in the bed oc-cupancy can be taken care of by appropriate admission ofelective cases during the final stage of the surgery schedul-ing process which involves the detailed planning of the indi-vidual elective cases taking into account the block allocationfrom the master surgery schedule. Obviously, in the concernof both patient and surgeon, the postponement of surgery isbest avoided as much as possible. Therefore, methods for acareful design of the master surgery schedule, as presentedin this study, are still valuable. For future research, however,it would be interesting to extend the software with a modulethat deals with scheduling the individual elective cases. Inaddition, a statistical module that enables the user to makecomparisons between the occupancy observed in real life onthe one hand and the occupancy predicted by the system onthe other hand, with a feedback mechanism to improve thepredictions, would definitely increase the power of the soft-ware.
Acknowledgements We acknowledge the support given to thisproject by the Fonds voor Wetenschappelijk Onderzoek (FWO)—Vlaanderen, Belgium under contract number G.0463.04. We are grate-ful to all members of the Operating Room staff of the Virga JesseHospital in Hasselt, Belgium, and in particular to Els Nelissen for hersupport to this project and to Geert Moechars for providing the casestudy data. Thanks are also due to the editor and three anonymousreferees for their valuable comments.
References
Adenso-Díaz, B., & Rodríguez, F. (1997). A simple search heuristicfor the MCLP: Application to the location of ambulance basesin a rural region. Omega, International Journal of ManagementScience, 25, 181–187.
Aickelin, U., & Dowsland, K. A. (2000). Exploiting problem structurein a genetic algorithms approach to a nurse rostering problem.Journal of Scheduling, 31, 139–153.
Aickelin, U., & White, P. (2004). Building better nurse scheduling al-gorithms. Annals of Operations Research, 128, 159–177.
Beliën, J., & Demeulemeester, E. (2007). Building cyclic mastersurgery schedules with leveled resulting bed occupancy. EuropeanJournal of Operational Research, 176, 1185–1204.
Blake, J. T., & Donald, J. (2002). Mount Sinai hospital uses integerprogramming to allocate operating room time. Interfaces, 32, 63–73.
J Sched (2009) 12: 147–161 161
Blake, J. T., Dexter, F., & Donald, J. (2002). Operating room manager’suse of integer programming for assigning block time to surgicalgroups: A case study. Anesthesia and Analgesia, 94, 143–148.
Brandeau, M. L., Sainfort, F., & Pierskalla, W. P. (2004). Operationsresearch and health care: A handbook of methods and applica-tions. Dordrecht: Kluwer Academic.
Brotcorne, L., Laporte, G., & Semet, F. (2003). Ambulance loca-tion and relocation models. European Journal of Operational Re-search, 147, 451–463.
Burke, E. K., De Causmaecker, P., & Vanden Berghe, G. (1999). A hy-brid tabu search algorithm for the nurse rostering problem. In Sim-ulated evolution and learning (Vol. 1585, pp. 187–194). Berlin:Springer.
Burke, E. K., De Causmaecker, P., Petrovic, S., & Vanden Berghe, G.(2003). METAHEURISTICS: computer decision-making. In M.G. C. Resende (Ed.), Combinatorial Optimization Book Series.Variable neighborhood search for nurse rostering problems (pp.153–172). Dordrecht: Kluwer.
Burke, E. K., De Causmaecker, P., & Vanden Berghe, G. (2004). Novelmetaheuristic approaches to nurse rostering problems in Belgianhospitals. In J. Leung (Ed.), Handbook of scheduling: algorithms,models and performance analysis (Vol. 18, pp. 1–44). Boca Ra-ton: CRC Press.
Burke, E. K., De Causmaecker, P., Vanden Berghe, G., & Van Lan-deghem, H. (2004). The state of the art of nurse rostering. Journalof Scheduling, 7, 441–499.
Burke, E., Curtois, T., Post, G., Qu, R., & Veltman, B. (2008). A hy-brid heuristic ordering and variable neighbourhood search for thenurse rostering problem. European Journal of Operational Re-search. 188(2), 330–341.
Cardoen, B., Demeulemeester, E., & Beliën, J. (2006). Optimizing amultiple objective surgical case scheduling problem (Working pa-per KBI 0625). Katholieke Universiteit Leuven, Belgium.
Cardoen, B., Demeulemeester, E., & Beliën, J. (2007). Scheduling sur-gical cases in a day-care environment: a branch-and-price ap-proach (Working paper KBI 0724). Katholieke Universiteit Leu-ven, Belgium.
Coppola, M., Ozcan, Y., & Bogacki, R. (2003). Evaluation of perfor-mance of dental providers on posterior restorations: Does experi-ence matter? A data envelopment analysis (DEA) approach. Jour-nal of Medical Systems, 27, 447–458.
Everett, J. (2002). A decision support simulation model for the man-agement of an elective surgery waiting system. Health Care Man-agement Science, 5, 89–95.
Fries, B. (1976). Bibliography of operations research in health-caresystems. Operations Research, 24, 801–804.
Hans, E. W., Wullink, G., van Houdenhoven, M., & Kazemier, G.(2008). Robust surgery loading. European Journal of OperationalResearch. 185(3), 1038–1050.
Hsu, V., de Matta, R., & Lee, C.-Y. (2003). Scheduling patients in anambulatory surgical center. Naval Research Logistics, 50, 218–238.
Huang, M. D., Romeo, F., & Sangiovanni-Vincentelli, A. (1986). Anefficient general cooling schedule for simulated annealing. InIEEE international conference on computer-aided design (pp.381–384).
ILOG (2002) ILOG CPLEX 8.1 user’s manual.Kellogg, D. L., & Walczak, S. (2007). Nurse scheduling: From acad-
emia to implementation or not? Interfaces, 37(4), 355–369.
Kim, S.-C., & Horowitz, I. (2002). Scheduling hospital services: Theefficacy of elective-surgery quotas. Omega—The InternationalJournal of Management Science, 30, 335–346.
Kim, S.-C., Horowitz, I., & Buckley, T. A. (2000). Flexible bed al-location and performance in the intensive care unit. Journal ofOperations Management, 18, 427–443.
Kirkpatrick, S., Gerlatt, C. D. J., & Vecchi, M. P. (1983). Optimizationby simulated annealing. Science, 220, 671–680.
Kusters, R., & Groot, P. (1996). Modelling resource availability in gen-eral hospitals: Design and implementation of a decision supportmodel. European Journal of Operational Research, 88, 428–445.
Lapierre, S., Batson, C., & McCaskey, S. (1999). Improving on-timeperformance in health care organizations: a case study. HealthCare Management Science, 2, 27–34.
Litvak, E., & Long, M. C. (2000). Cost and quality under managedcare: Irreconcilable differences? The American Journal of Man-aged Care, 6, 305–312.
Marcon, E., & Dexter, F. (2006). Impact of surgical sequencing on postanesthesia care unit staffing. Health Care Management Science, 9,87–98.
Metropolis, N., Rosenbluth, A. W., Rosenbluth, M. N., Teller, A. H., &Teller, E. (1958). Equations of state calculations by fast comput-ing machines. Journal of Chemical Physics, 21, 1087–1092.
Ogulata, S., & Erol, R. (2003). A hierarchical multiple criteria math-ematical programming approach for scheduling general surgeryoperations in large hospitals. Journal of Medical Systems, 27(3),259–270.
Pérez, B., Arenas, M., Bilbao, A., & Rodriguez, M. (2005). Manage-ment of surgical waiting lists through a possiblistic linear multi-objective programming problem. Applied Mathematics and Com-putation, 167, 477–495.
Pincus, M. (1970). A Monte Carlo method for the approximate solutionof certain types of constrained optimization problems. OperationsResearch, 18, 1225–1228.
Pritsker, A. (1998). Life and death decisions: Organ transplantationallocation policy analysis. ORMS Today, 25, 22–28.
RIZIV (2005). Evolutie van de uitgaven voor geneeskundige verzorg-ing. www.riziv.be.
Romeijn, H. E., Ahuja, R. K., Dempsey, J. F., & Kumar, A. (2006).A new linear programming approach to radiation therapy treat-ment planning problems. Operations Research, 54(2), 201–216.
Santibanez, P., Begen, M., & Atkins, D. (2007). Managing surgicalwaitlists for a British Columbia health authority. Health CareManagement Science, 10, 269–282.
Sewell, E., & Jacobson, S. (2003). Using an integer programmingmodel to determine the price of combination vaccines for child-hood immunization. Annals of Operations Research, 119, 261–284.
Van Laarhoven, P. J. M., & Aarts, E. H. L. (1988). Simulated anneal-ing: Theory and applications. Dordrecht: Kluwer.
van Oostrum, J., Van Houdenhoven, M., Hurink, J., Hans, E., Wullink,G., & Kazemier, G. (2006). A master surgical scheduling ap-proach for cyclic scheduling in operating room departments. ORSpektrum, 30(2), 355–374.
Vissers, J. M. H., Bertrand, J., & de Vries, G. (2001). A framework forproduction control in healthcare organisations. Production Plan-ning and Control, 12(6), 591–604.
Wiers, V. C. (1997). A review of the applicability of OR and AIscheduling techniques in practice. Omega—The InternationalJournal of Management Science, 25(2), 145–153.