Embed Size (px)
Citation preview
1
A Deep-Learning Algorithm for ThyroidMalignancy Prediction From Whole Slide
Cytopathology ImagesDavid Dov, Shahar Z. Kovalsky, Jonathan Cohen, Danielle Elliott Range, Ricardo Henao,
and Lawrence Carin Fellow, IEEE
Abstract—We consider thyroid-malignancy prediction fromultra-high-resolution whole-slide cytopathology images. We pro-pose a deep-learning-based algorithm that is inspired by the waya cytopathologist diagnoses the slides. The algorithm identifiesdiagnostically relevant image regions and assigns them localmalignancy scores, that in turn are incorporated into a globalmalignancy prediction. We discuss the relation of our deep-learning-based approach to multiple-instance learning (MIL)and describe how it deviates from classical MIL methods bythe use of a supervised procedure to extract relevant regionsfrom the whole-slide. The analysis of our algorithm furtherreveals a close relation to hypothesis testing, which, along withunique characteristics of thyroid cytopathology, allows us todevise an improved training strategy. We further propose anordinal regression framework for the simultaneous predictionof thyroid malignancy and an ordered diagnostic score actingas a regularizer, which further improves the predictions of thenetwork. Experimental results demonstrate that the proposedalgorithm outperforms several competing methods, achievingperformance comparable to human experts.
Index Terms—Thyroid, AI, deep learning, medical imaging,healthcare, pathology, human level
I. INTRODUCTION
THE prevalence of thyroid cancer is increasing worldwide[1]. The most important test in the preoperative diag-
nosis of thyroid malignancy is the analysis of a fine needleaspiration biopsy (FNAB). The FNAB sample is stained andsmeared onto a glass slide, and manually examined under anoptical microscope by a cytopathologist, who estimates the riskof malignancy. This diagnosis, however, involves substantialclinical uncertainty and often results in unnecessary surgery.In this work, we propose a deep-learning-based algorithm forthe preoperative prediction of thyroid malignancy from whole-slide cytopathology scans.
A cytopathologist determines the risk of thyroid malignancyaccording to various features of follicular (thyroid) cells, suchas their size, color and the architecture of cell groups. Basedon these features, they assign a score to the slide accordingto the Bethesda System (TBS), which is the universally
D. David, R. Henao and L. Carin are with the Department of Electrical andComputer Engineering, Duke University, Durham, NC 27708, USA (e-mail:[email protected]; [email protected]; [email protected]).
S. Z. Kovalsky is with the Department of Mathematics, Duke University,Durham, NC 27708, USA (e-mail: [email protected]).
J. Cohen is with the Department of Surgery, Duke University MedicalCenter, Durham, NC 27710, USA (e-mail: [email protected]).
D. Elliott Range is with the Department of Pathology, Duke UniversityMedical Center, Durham, NC 27710, USA (e-mail: [email protected]).
accepted reporting system for thyroid FNAB (there are sixTBS categories). TBS 2 indicates a benign slide, TBS 3, 4and 5 reflect inconclusive findings with an increasing riskof malignancy, and TBS 6 indicates malignancy. TBS 1 isassigned to inadequately prepared slides and is out of the scopeof this work. In many of the indeterminate cases that undergosurgery, however, the post-surgical histopathology analysis,which is considered the gold standard for determining thyroidmalignancy, shows no evidence of malignancy thus deemingthe surgery unnecessary.
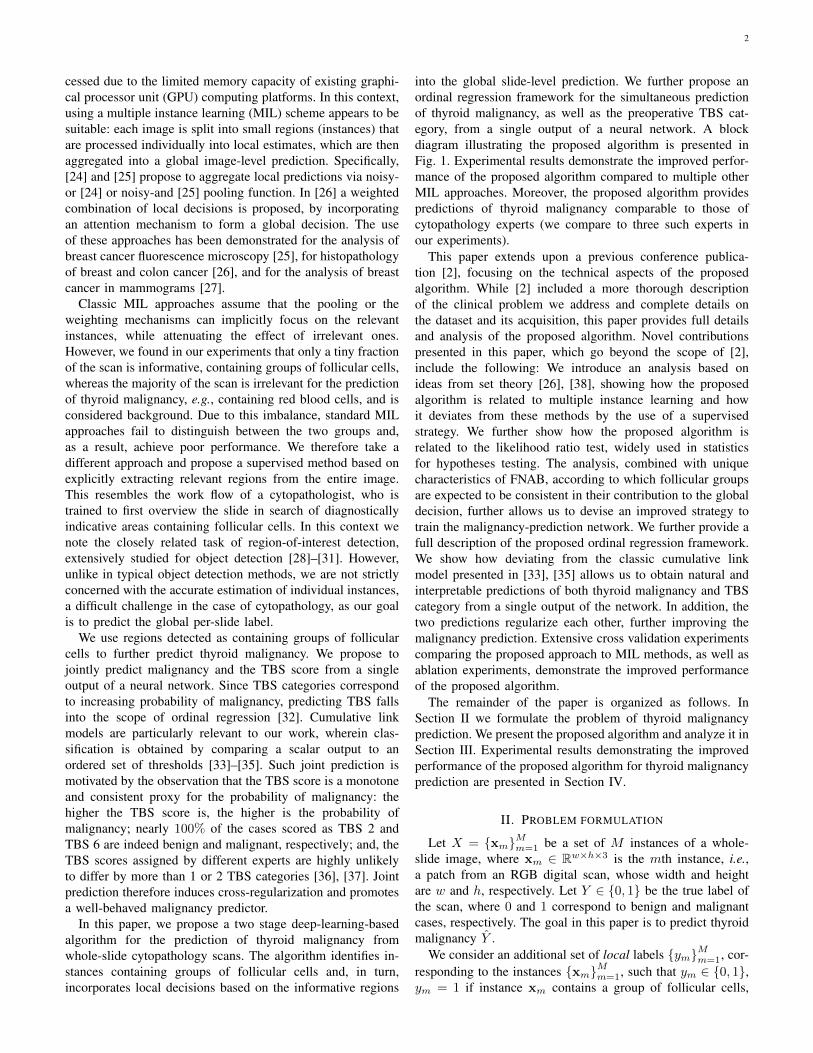
Cytopathology slides are typically examined via an opticalmicroscope and are not digitized in most healthcare systems.Therefore, for the automated analysis of FNAB, we haveestablished in [2] a dataset of 908 samples. Each samplecomprises a full scan of the glass slides whose typical res-olution is ∼ 40, 000 × 25, 000 and is referred to as wholeslide cytopathology image. An example of a whole-slide imageis presented in Fig. 2 (top). Each sample in the datasetincludes the TBS category assigned by a cytopathologist,extracted from the medical record, as well as the postoperativehistopathology diagnosis, which is considered the ground truthin this study. The goal in this paper is to predict the groundtruth malignancy label from the whole-slide scans.
Machine learning, and in particular deep neural networks,have become prevalent in medical imaging [3]. Such methodshave been used for the detection of diabetic retinopathy [4],the classification of skin cancer [5], and in histopathology [6]–[8] and cytopathology [9]. Thyroid malignancy prediction viamachine learning has been studied in ultrasound images [10]–[15] and in post-surgical histological tissues [16]. The use ofautomated methods for preoperative thyroid cytopathology hasalso been studied: [17], [18] study morphometric features ofindividual cells extracted using image analysis software; [19]discuss the cytomorphometric analysis of nuclear features ofindividual thyroid cells in extreme magnification; [20] classifythyroid cytopathology images for educational and trainingpurposes. In [21]–[23] the authors use machine learning tech-niques trained and tested on a small number of “zoomed-in” regions manually selected and specified as diagnosticallyrelevant by an expert cytopathologist. However, these studiesdo not address the problem of intervention-free malignancyprediction from whole-slide cytopathology images.
The exceptionally high resolution of whole-slide cytopathol-ogy images, each tens of gigabytes in size, presents a signif-icant challenge since they cannot be straightforwardly pro-
This work has been submitted to the IEEE for possible publication. Copyright may be transferred without notice, after which this version may no longer be accessible.
arX
iv:1
904.
1273
9v1
[ph
ysic
s.m
ed-p
h] 2
6 A
pr 2
019
2
cessed due to the limited memory capacity of existing graphi-cal processor unit (GPU) computing platforms. In this context,using a multiple instance learning (MIL) scheme appears to besuitable: each image is split into small regions (instances) thatare processed individually into local estimates, which are thenaggregated into a global image-level prediction. Specifically,[24] and [25] propose to aggregate local predictions via noisy-or [24] or noisy-and [25] pooling function. In [26] a weightedcombination of local decisions is proposed, by incorporatingan attention mechanism to form a global decision. The useof these approaches has been demonstrated for the analysis ofbreast cancer fluorescence microscopy [25], for histopathologyof breast and colon cancer [26], and for the analysis of breastcancer in mammograms [27].
Classic MIL approaches assume that the pooling or theweighting mechanisms can implicitly focus on the relevantinstances, while attenuating the effect of irrelevant ones.However, we found in our experiments that only a tiny fractionof the scan is informative, containing groups of follicular cells,whereas the majority of the scan is irrelevant for the predictionof thyroid malignancy, e.g., containing red blood cells, and isconsidered background. Due to this imbalance, standard MILapproaches fail to distinguish between the two groups and,as a result, achieve poor performance. We therefore take adifferent approach and propose a supervised method based onexplicitly extracting relevant regions from the entire image.This resembles the work flow of a cytopathologist, who istrained to first overview the slide in search of diagnosticallyindicative areas containing follicular cells. In this context wenote the closely related task of region-of-interest detection,extensively studied for object detection [28]–[31]. However,unlike in typical object detection methods, we are not strictlyconcerned with the accurate estimation of individual instances,a difficult challenge in the case of cytopathology, as our goalis to predict the global per-slide label.
We use regions detected as containing groups of follicularcells to further predict thyroid malignancy. We propose tojointly predict malignancy and the TBS score from a singleoutput of a neural network. Since TBS categories correspondto increasing probability of malignancy, predicting TBS fallsinto the scope of ordinal regression [32]. Cumulative linkmodels are particularly relevant to our work, wherein clas-sification is obtained by comparing a scalar output to anordered set of thresholds [33]–[35]. Such joint prediction ismotivated by the observation that the TBS score is a monotoneand consistent proxy for the probability of malignancy: thehigher the TBS score is, the higher is the probability ofmalignancy; nearly 100% of the cases scored as TBS 2 andTBS 6 are indeed benign and malignant, respectively; and, theTBS scores assigned by different experts are highly unlikelyto differ by more than 1 or 2 TBS categories [36], [37]. Jointprediction therefore induces cross-regularization and promotesa well-behaved malignancy predictor.
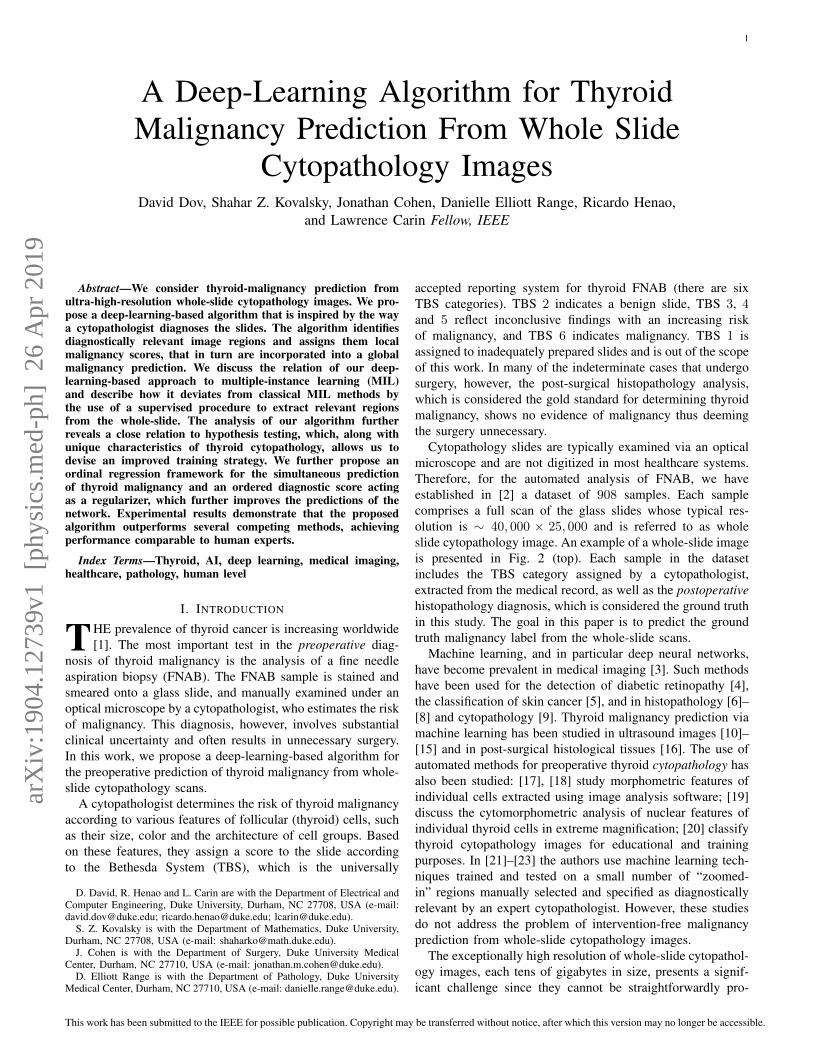
In this paper, we propose a two stage deep-learning-basedalgorithm for the prediction of thyroid malignancy fromwhole-slide cytopathology scans. The algorithm identifies in-stances containing groups of follicular cells and, in turn,incorporates local decisions based on the informative regions
into the global slide-level prediction. We further propose anordinal regression framework for the simultaneous predictionof thyroid malignancy, as well as the preoperative TBS cat-egory, from a single output of a neural network. A blockdiagram illustrating the proposed algorithm is presented inFig. 1. Experimental results demonstrate the improved perfor-mance of the proposed algorithm compared to multiple otherMIL approaches. Moreover, the proposed algorithm providespredictions of thyroid malignancy comparable to those ofcytopathology experts (we compare to three such experts inour experiments).
This paper extends upon a previous conference publica-tion [2], focusing on the technical aspects of the proposedalgorithm. While [2] included a more thorough descriptionof the clinical problem we address and complete details onthe dataset and its acquisition, this paper provides full detailsand analysis of the proposed algorithm. Novel contributionspresented in this paper, which go beyond the scope of [2],include the following: We introduce an analysis based onideas from set theory [26], [38], showing how the proposedalgorithm is related to multiple instance learning and howit deviates from these methods by the use of a supervisedstrategy. We further show how the proposed algorithm isrelated to the likelihood ratio test, widely used in statisticsfor hypotheses testing. The analysis, combined with uniquecharacteristics of FNAB, according to which follicular groupsare expected to be consistent in their contribution to the globaldecision, further allows us to devise an improved strategy totrain the malignancy-prediction network. We further provide afull description of the proposed ordinal regression framework.We show how deviating from the classic cumulative linkmodel presented in [33], [35] allows us to obtain natural andinterpretable predictions of both thyroid malignancy and TBScategory from a single output of the network. In addition, thetwo predictions regularize each other, further improving themalignancy prediction. Extensive cross validation experimentscomparing the proposed approach to MIL methods, as well asablation experiments, demonstrate the improved performanceof the proposed algorithm.
The remainder of the paper is organized as follows. InSection II we formulate the problem of thyroid malignancyprediction. We present the proposed algorithm and analyze it inSection III. Experimental results demonstrating the improvedperformance of the proposed algorithm for thyroid malignancyprediction are presented in Section IV.
II. PROBLEM FORMULATION
Let X = {xm}Mm=1 be a set of M instances of a whole-slide image, where xm ∈ Rw×h×3 is the mth instance, i.e.,a patch from an RGB digital scan, whose width and heightare w and h, respectively. Let Y ∈ {0, 1} be the true label ofthe scan, where 0 and 1 correspond to benign and malignantcases, respectively. The goal in this paper is to predict thyroidmalignancy Y .
We consider an additional set of local labels {ym}Mm=1, cor-responding to the instances {xm}Mm=1, such that ym ∈ {0, 1},ym = 1 if instance xm contains a group of follicular cells,
3
Follicular group detection
NN NN
Malignancy prediction
Fig. 1: Block diagram of the proposed algorithm. The left and the right blocks denoted by NN refer to the first and the secondneural networks, respectively.
and ym = 0 otherwise. Our dataset includes 5461 instancescontaining follicular groups manually selected from 142 digitalscans. These local labels are used to train a convolutionalneural network to distinguish instances containing folliculargroups from those only containing background. In turn, theinstances containing follicular groups are used to predictthyroid malignancy.
Similar to Y , let S ∈ {2, 3, 4, 5, 6} be the TBS categoryassigned to a whole slide by a pathologist. We propose inSection III-D to simultaneously predict thyroid malignancy Yand the TBS category S using a single output of a neuralnetwork. We show in Section IV that this not only improvesprediction accuracy, but also leads to more reliable predictions.
III. THYROID MALIGNANCY PREDICTION
A. Detecting groups of follicular cells
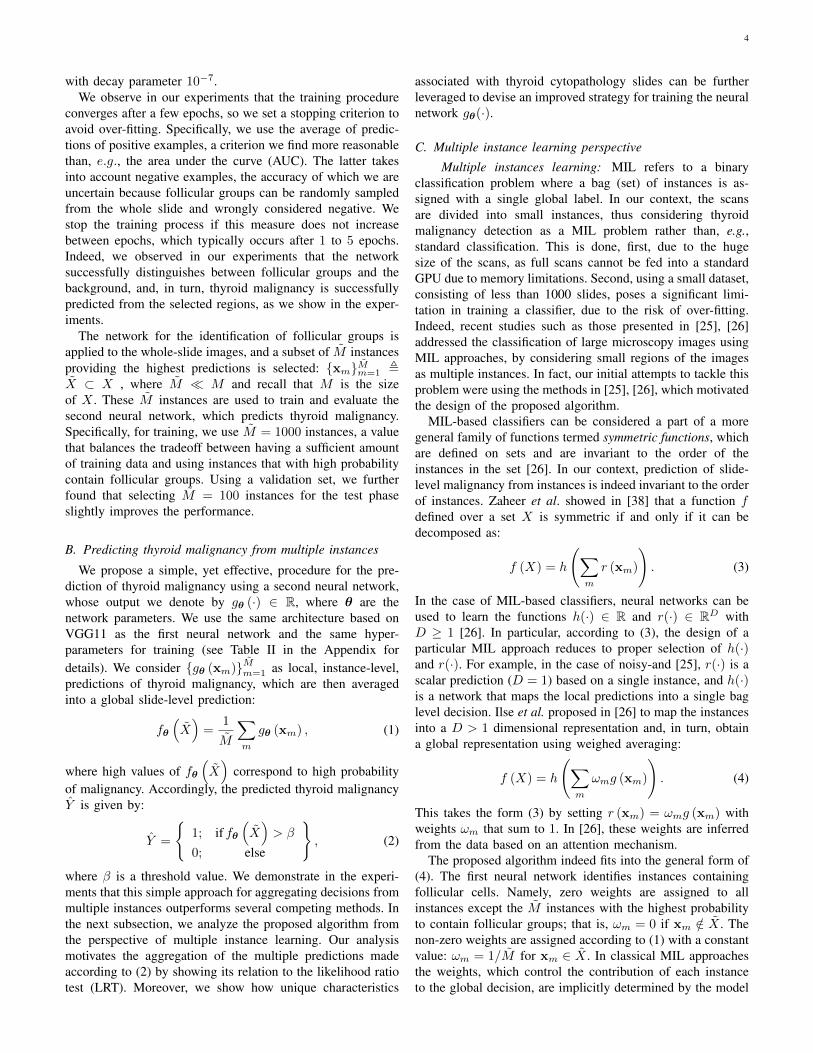
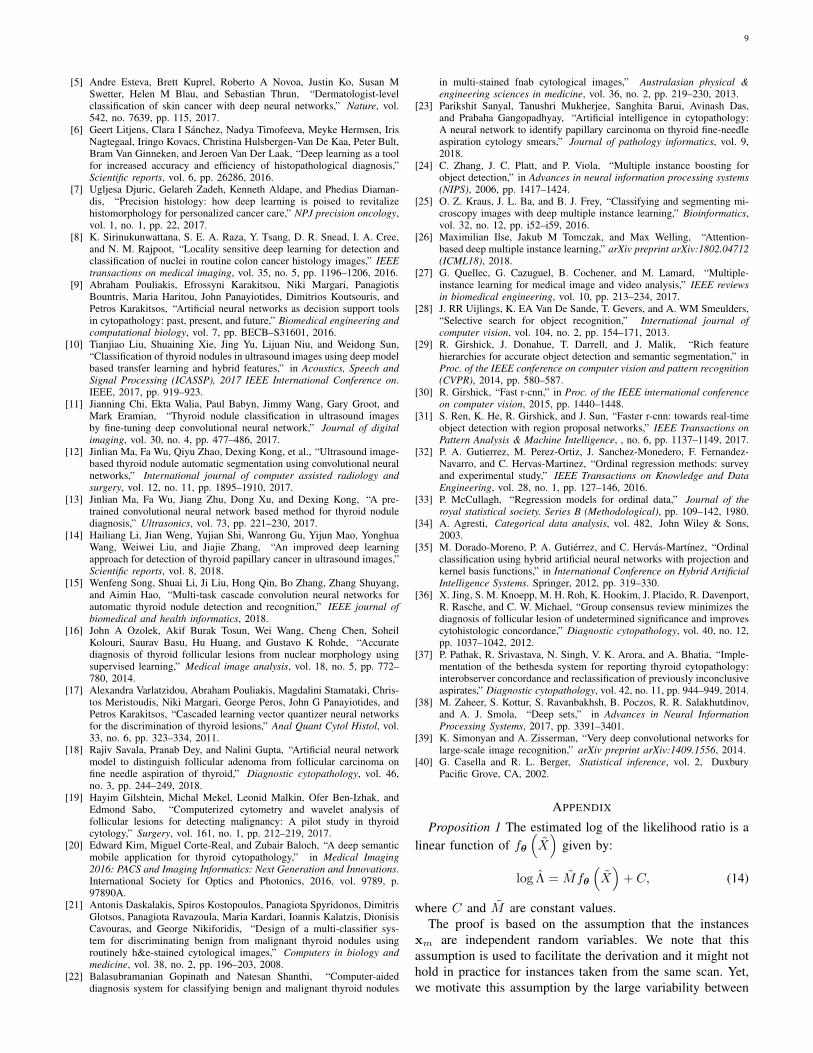
The proposed algorithm follows the work of cytopatholo-gists, who identify groups of follicular cells, based on whichthe evaluation of thyroid malignancy is performed. Malignantand benign groups differ from each other in the tone of thecells, their size and texture, and the shape and the architectureof the group. The slide, however, only contains a small amountof follicular groups and is mainly covered with blood cells,which are irrelevant for the prediction and are consideredbackground. In Fig. 3, we present examples of instancescontaining follicular groups, as well as instances containingbackground.
We use the local labels {ym} to train a convolutional neuralnetwork to distinguish instances containing follicular groupsfrom those containing background. The network is based onthe small and the fast converging VGG11 architecture [39],details of which are summarized in Table II in the Appendix.Training the network requires a sufficient amount of labeleddata, the collection of which was done manually by an expertpathologist through an exhaustive examination of the slides.To make the labeling effort efficient, the cytopathologist onlymarked positive examples of instances containing folliculargroups (ym = 1). We further observed in our experiments
Fig. 2: (Top) Whole-slide cytopathology scan. (Bottom left)Detail of the area marked by the red rectangle. (Middle) Heatmap of prediction values of the first neural network. Instancespredicted to contain follicular groups correspond to brightregions. (Bottom right) Detail of the are marked by the redrectangle.
that instances randomly sampled from the whole slide mostlycontain background. Therefore, to train the network, we pro-pose the following design of training batches. We use batchescomprising an equal number of positive and negative examplesto overcome the class imbalance. As positive examples we takefollicular groups sampled uniformly at random from the set ofthe labeled instances, i.e., for which ym = 1. Negative exam-ples are obtained by sampling uniformly at random instancesfrom the whole slide, for which we assign ym = 0, assumingthey contain background. The network is trained using thebinary cross entropy (BCE) loss via stochastic gradient descentwith learning rate 0.001, momentum 0.99 and weight decay
4
with decay parameter 10−7.We observe in our experiments that the training procedure
converges after a few epochs, so we set a stopping criterion toavoid over-fitting. Specifically, we use the average of predic-tions of positive examples, a criterion we find more reasonablethan, e.g., the area under the curve (AUC). The latter takesinto account negative examples, the accuracy of which we areuncertain because follicular groups can be randomly sampledfrom the whole slide and wrongly considered negative. Westop the training process if this measure does not increasebetween epochs, which typically occurs after 1 to 5 epochs.Indeed, we observed in our experiments that the networksuccessfully distinguishes between follicular groups and thebackground, and, in turn, thyroid malignancy is successfullypredicted from the selected regions, as we show in the exper-iments.
The network for the identification of follicular groups isapplied to the whole-slide images, and a subset of M instancesproviding the highest predictions is selected: {xm}Mm=1 ,X ⊂ X , where M � M and recall that M is the sizeof X . These M instances are used to train and evaluate thesecond neural network, which predicts thyroid malignancy.Specifically, for training, we use M = 1000 instances, a valuethat balances the tradeoff between having a sufficient amountof training data and using instances that with high probabilitycontain follicular groups. Using a validation set, we furtherfound that selecting M = 100 instances for the test phaseslightly improves the performance.
B. Predicting thyroid malignancy from multiple instances
We propose a simple, yet effective, procedure for the pre-diction of thyroid malignancy using a second neural network,whose output we denote by gθ (·) ∈ R, where θ are thenetwork parameters. We use the same architecture based onVGG11 as the first neural network and the same hyper-parameters for training (see Table II in the Appendix fordetails). We consider {gθ (xm)}Mm=1 as local, instance-level,predictions of thyroid malignancy, which are then averagedinto a global slide-level prediction:
fθ
(X)
=1
M
∑m
gθ (xm) , (1)
where high values of fθ(X)
correspond to high probabilityof malignancy. Accordingly, the predicted thyroid malignancyY is given by:
Y =
{1; if fθ
(X)> β
0; else
}, (2)
where β is a threshold value. We demonstrate in the experi-ments that this simple approach for aggregating decisions frommultiple instances outperforms several competing methods. Inthe next subsection, we analyze the proposed algorithm fromthe perspective of multiple instance learning. Our analysismotivates the aggregation of the multiple predictions madeaccording to (2) by showing its relation to the likelihood ratiotest (LRT). Moreover, we show how unique characteristics
associated with thyroid cytopathology slides can be furtherleveraged to devise an improved strategy for training the neuralnetwork gθ(·).
C. Multiple instance learning perspective
Multiple instances learning: MIL refers to a binaryclassification problem where a bag (set) of instances is as-signed with a single global label. In our context, the scansare divided into small instances, thus considering thyroidmalignancy detection as a MIL problem rather than, e.g.,standard classification. This is done, first, due to the hugesize of the scans, as full scans cannot be fed into a standardGPU due to memory limitations. Second, using a small dataset,consisting of less than 1000 slides, poses a significant limi-tation in training a classifier, due to the risk of over-fitting.Indeed, recent studies such as those presented in [25], [26]addressed the classification of large microscopy images usingMIL approaches, by considering small regions of the imagesas multiple instances. In fact, our initial attempts to tackle thisproblem were using the methods in [25], [26], which motivatedthe design of the proposed algorithm.
MIL-based classifiers can be considered a part of a moregeneral family of functions termed symmetric functions, whichare defined on sets and are invariant to the order of theinstances in the set [26]. In our context, prediction of slide-level malignancy from instances is indeed invariant to the orderof instances. Zaheer et al. showed in [38] that a function fdefined over a set X is symmetric if and only if it can bedecomposed as:
f (X) = h
(∑m
r (xm)
). (3)
In the case of MIL-based classifiers, neural networks can beused to learn the functions h(·) ∈ R and r(·) ∈ RD withD ≥ 1 [26]. In particular, according to (3), the design of aparticular MIL approach reduces to proper selection of h(·)and r(·). For example, in the case of noisy-and [25], r(·) is ascalar prediction (D = 1) based on a single instance, and h(·)is a network that maps the local predictions into a single baglevel decision. Ilse et al. proposed in [26] to map the instancesinto a D > 1 dimensional representation and, in turn, obtaina global representation using weighed averaging:
f (X) = h
(∑m
ωmg (xm)
). (4)
This takes the form (3) by setting r (xm) = ωmg (xm) withweights ωm that sum to 1. In [26], these weights are inferredfrom the data based on an attention mechanism.
The proposed algorithm indeed fits into the general form of(4). The first neural network identifies instances containingfollicular cells. Namely, zero weights are assigned to allinstances except the M instances with the highest probabilityto contain follicular groups; that is, ωm = 0 if xm /∈ X . Thenon-zero weights are assigned according to (1) with a constantvalue: ωm = 1/M for xm ∈ X . In classical MIL approachesthe weights, which control the contribution of each instanceto the global decision, are implicitly determined by the model
5
Fig. 3: (Top) Instances containing groups of follicular cells. (Bottom) Instances containing background.
trained using the global labels alone. In contrast, the proposedalgorithm identifies the important instances via a supervisedprocedure using the labels {ym}.
Finally, to obtain (1) we simply use h(·) = (·), i.e., theidentity function in (4). The selection of the pooling functionh(·) is directly related to the interplay between the local andthe global labels. The typical assumption in MIL approachesis that a bag of instances is labeled positive if at least one ofthe instances is positive. Noisy-and, for example, is designedbased on the assumption that a certain amount of positiveinstances triggers a positive global label. Yet, our experimentsshow no advantage to this approach casting doubt on thisassumption in the case of thyroid malignancy detection. Nextwe motivate (1) by showing its relation to the likelihood ratiotest, which further allows us to devise a strategy to train theneural network in (1).
The likelihood ratio test: The following proposition mo-tivates (1) and (2) by showing that fθ
(X)
is directly relatedto the likelihood ratio test (LRT) widely used in statistics forhypothesis testing [40]. Let Λ be the likelihood ratio given by:
Λ ,P(X|Y = 1
)P(X|Y = 0
) . (5)
Proposition 1: The estimated log likelihood ratio is a linearfunction of fθ
(X)
defined in (1) given by:
log Λ = Mfθ
(X)
+ C, (6)
where C is a constant value and M is the number of instancesin X .Proposition 1 implies that making a prediction according to (2)by comparing fθ
(X)
to a threshold value β is equivalent tocomparing the estimated log likelihood ratio to the thresholdγ , Mβ+C, which means applying the likelihood ratio test.The proof is provided in the Appendix.
As a corollary to Proposition 1, we further devise a sim-plified and improved training strategy for the second neuralnetwork. An implicit assumption made in the proof is thatσ (gθ (xm)), where σ (·) is the sigmoid function, estimatesthe probability P (Y = 1|xm) of the slide being malignant
given a single instance xm; a similar assumption is made inthe derivation of the noisy-and MIL in [25]. Proposition 1therefore implies that fθ
(X)
is a better estimate of thelikelihood ratio provided that gθ (xm) is a good estimateof P (Y = 1|xm). This comes in contrast to classical MILapproaches, wherein the network is optimized to predict theglobal label from the entire set, and there is no guarantee onthe quality of the predictions of individual instances.
Expert consensus dictates that in a malignant slide, allfollicular groups are malignant, while in a benign slide,all groups are benign. Namely, all local labels of instancescontaining the follicular groups match the global label. Indeed,due to the use of a fine needle in FNAB, the follicular cellsare extracted from a single homogeneous lesion. So motivated,we propose to directly train gθ (xm) to predict the global labelfrom a single instance xm using the the binary cross entropyloss (BCE):
Y log [σ (gθ (xm))] + (1− Y ) log [1− σ (gθ (xm))] , (7)
where σ (·) is the sigmoid function. We note that this trainingstrategy differs from classical MIL approaches, in which themodel is trained at the bag level by replacing gθ (xm) in (7)with fθ
(X)
since only a global label is available.
Experimental results presented in Section IV show that thistraining strategy indeed leads to improved performance, thussupporting the assumption that the local labels are consistentwith the corresponding global label, and, in turn, that thelikelihood ratio test is successfully estimated from fθ
(X)
according to Proposition 1.
D. Simultaneous prediction of malignancy and Bethesda cat-egory
We propose a framework for predicting thyroid malignancyand the Bethesda category simultaneously from a single outputof a neural network. Similarly to (2), we propose to predict theTBS category by comparing the output of the network fθ(X)
6
to threshold values β0 < β1 < β2 < β3 ∈ R. Recall that theTBS category takes an integer value between 2 to 6, yielding:
S =
2; if fθ
(X)< β0
l + 2; if βl−1 < fθ
(X)< βl, l ∈ [1, 2, 3]
6; if fθ
(X)> β3
.
The proposed framework for ordinal regression is inspiredby the proportional odds model, also termed cumulative linkmodel [33], [35]. The original model suggests to link betweenfθ
(X)
, the threshold βl and the cumulative probabilityP (S − 2 ≤ l):
logit (S − 2 ≤ l) = fθ
(X)− βl, (8)
where
logit (·) , log (odds (·)) , log(
P (·)1− P (·)
)(9)
The proportional odds model imposes order between differentTBS by linking them to fθ
(X)
so that higher values of
fθ
(X)
correspond to higher TBS categories. Recalling thatthe logit function is a monotone mapping of a probabilityfunction into the real line, values of fθ
(X)
which aresignificantly smaller than βl correspond to high probabilitythat the TBS category is smaller than l + 2.
We deviate from [33], [35] by estimating P (S − 2 > l)rather than P (S − 2 ≤ l). We note that this deviation is notnecessary for the prediction of TBS, yet it allows combin-ing the predictions of the thyroid malignancy and the TBScategory in an elegant and interpretable way. By plugging inP (S − 2 ≤ l) = 1− P (S − 2 > l) into (9), we have:
logit (S − 2 > l) = −logit (S − 2 ≤ l) . (10)
Further substituting the last equation into (8), gives:
logit (S − 2 > l) = −(fθ(X)− βl
). (11)
We note that (11) satisfies the property that high values offθ(X) correspond to high TBS categories. We rewrite (11) as
P (S − 2 > l) =1
1 + exp[−(fθ
(X)− βl
)] , (12)
and observe that the right term is the sigmoid functionσ(fθ
(X)− βl
). Accordingly, we can train the network to
predict P (S − 2 > l) using a BCE loss, and propose thefollowing loss function:
3∑l=0
Sl log [σ (gθ (xm)− βl)]
+ (1− Sl) log [1− σ (gθ (xm)− βl)] ,(13)
where Sl , P (S − 2 > l). Namely, Sl are labels used to train4 classifiers corresponding to l ∈ (0, 1, 2, 3), whose explicitrelation to TBS is presented in Table III in the Appendix. Theuse of gθ (xm) in (13), instead of the more natural choice of
fθ
(Xm
), is enabled by the analysis provided in Subsection
III-C.For the simultaneous prediction of thyroid malignancy and
TBS category, the total loss function is given by the sum of(7) and (13). Note the similarity between (7) and (13), whichis a result of our choice to estimate P (S − 2 > l) rather thanP (S − 2 ≤ l) and has the following interpretation: (7) can beconsidered a special case of ordinal regression with a singlefixed threshold value of 0. Namely, the total loss functionsimultaneously optimizes the parameters θ of the networkgθ (·) according to 5 classification tasks corresponding to thethreshold values 0, β0, β1, β2, β3.
In this context, we note that the threshold valuesβ0, β1, β2, β3 are learned along with the parameters of thenetworks, via stochastic gradient descent. While the trainingprocedure does not guarantee the correct order of β0 < β1 <β2 < β3 [35], we have found in our experiments that thisorder is indeed preserved.
We note that, in some cases, the term of the loss functioncorresponding to the prediction of malignancy may be inconflict with that of the TBS category. For example, considera malignant case (Y = 1) with TBS category 3 assignedby a pathologist. The term of the loss, in this case, whichcorresponds to TBS penalize high values of fθ
(X)
, whereasthe term corresponding to malignancy encourages them. Wetherefore interpret the joint estimation of TBS category andmalignancy as a cross-regularization scheme: Given two scanswith the same TBS but different final pathology, the networkis trained to provide higher prediction values for the malignantcase. Likewise, in the case of two scans with the same pathol-ogy but different TBS, the prediction value of the scan withthe higher TBS is expected to be higher. Thus, the networkadopts properties of the Bethesda system, such that the higherthe prediction value fθ
(X)
the higher is the probability ofmalignancy. Yet the network is not strictly restricted to theBethesda system, so it can learn to provide better predictions.
IV. EXPERIMENTS
a) Experimental Setting: To evaluate the proposed al-gorithm, we performed a 5-fold cross validation procedure,splitting the 908 scans by 60%, 20%, 20% for training,validation and testing, respectively, such that a test scan isnever seen during training. The algorithm is trained usinga Tesla P100-PCIE GPU with 16 Gb of memory. We useinstances of size 128 × 128 pixels. This size is large enoughto capture large groups of follicular cells, while allowing theuse of a sufficient amount of instances in each minibatch.Specifically, to train the first network, we use 10 instances perminibatch, a value set arbitrarily and that has a small effecton the performance. For the second network we found thatincreasing the number of instances per minibatch improves theperformance, so we used 288 instances, which corresponds tothe maximum memory capacity of the GPU.
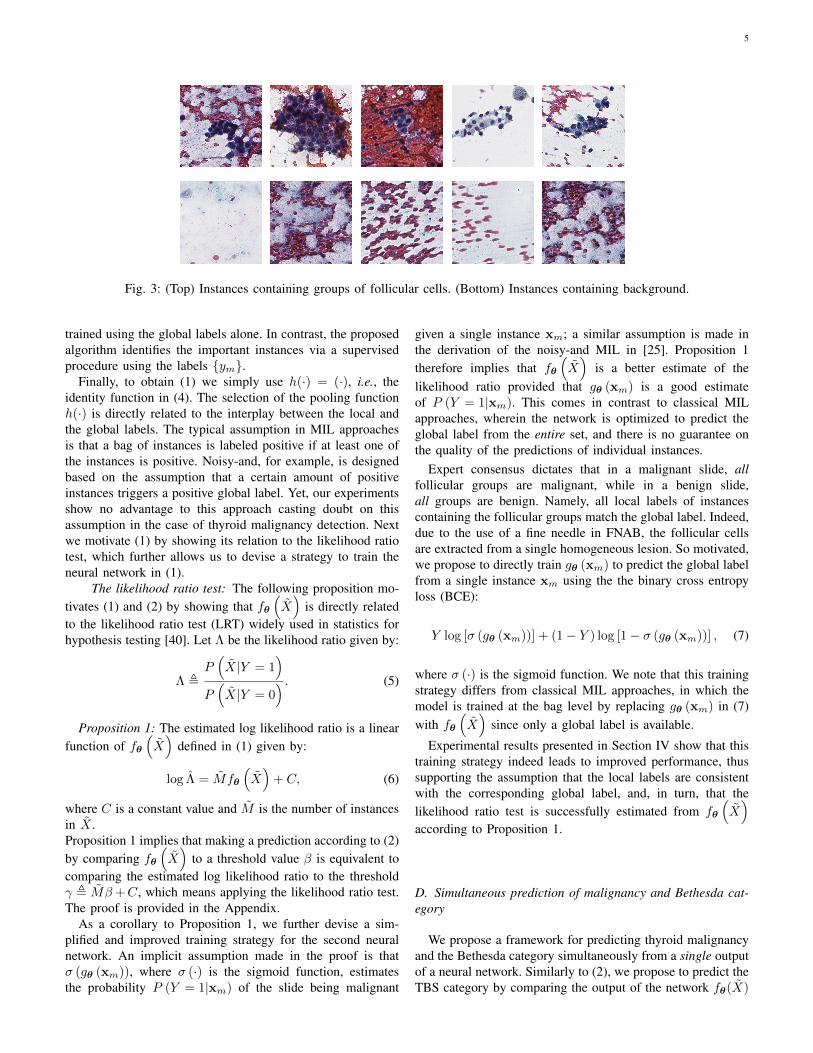
b) Identification of instances with follicular groups: Aheat map illustrating the prediction values of the first networkand the corresponding histogram of prediction values of arepresentative scan are presented in Figs. 2 and 4, respectively.
7
0.0 0.2 0.4 0.6 0.8 1.0Prediction value
0.0
0.5
1.0
1.5
2.0
2.5Nu
mbe
r of i
nsta
nces
1e5
Fig. 4: Histogram of predictions of instances taken from asingle slide. High predictions correspond to high probabilitiesthat an instance contain follicular groups.
With low prediction values, the majority of the instancescontain background, as is seen in both figures. Specifically,the follicular groups (Fig. 2 top) are highlighted with brightcolors in the heat map (Fig. 2 middle). In Fig. 4, the majorityof instances contain background with low prediction values,however, the histogram is bimodal, with a second peak in therange of 0.95 to 1. These high predictions indeed correspondto instances containing follicular groups, which we select forthyroid malignancy prediction. In Fig. 7, we present examplesof instances detected as containing follicular groups.
c) Competing methods: To evaluate the performance ofthe proposed algorithm in predicting thyroid malignancy, wecompare it to a baseline CNN, a noisy-and MIL [25] and theattention based MIL algorithm presented in [26]; we termthese methods “CNN”, “NoisyAND” and “AttentionMIL”,respectively. These methods are originally designed to processwhole images, which is not possible in our case due to memorylimitations. Therefore, we use crops of size 448×448 pixels, toallow 10 crops per minibatch, subject to memory limitations.These values were selected to optimize performance over thevalidation set.
As an ablation study, we consider two additional ap-proaches, where the proposed network for the selection of in-stances containing follicular groups is followed by the MIL ap-proaches [25], [26] for obtaining a slide-level malignancy pre-diction; we refer to these methods as “Proposed+NoisyAND”and “Proposed+AttentionMIL”. These approaches are used tospecifically evaluate the second network in the proposed algo-rithm. Moreover, we compare the performance of the proposedalgorithm to a variant trained as a classical MIL approach,by replacing gθ (xm) in (7) with fθ
(X)
. We term thismethod “Proposed-classical-training,” since the second neuralnetwork is trained as a standard MIL approach using the globallabel. Finally, we consider a variant of the proposed methodtermed “Proposed-pathology-loss,” in which the second neuralnetwork is trained to predict thyroid malignancy alone, but notthe TBS category, so that the loss function is given by (7).
d) Prediction of thyroid malignancy and the TBS cate-gory: Table I summarizes the performance of the algorithms
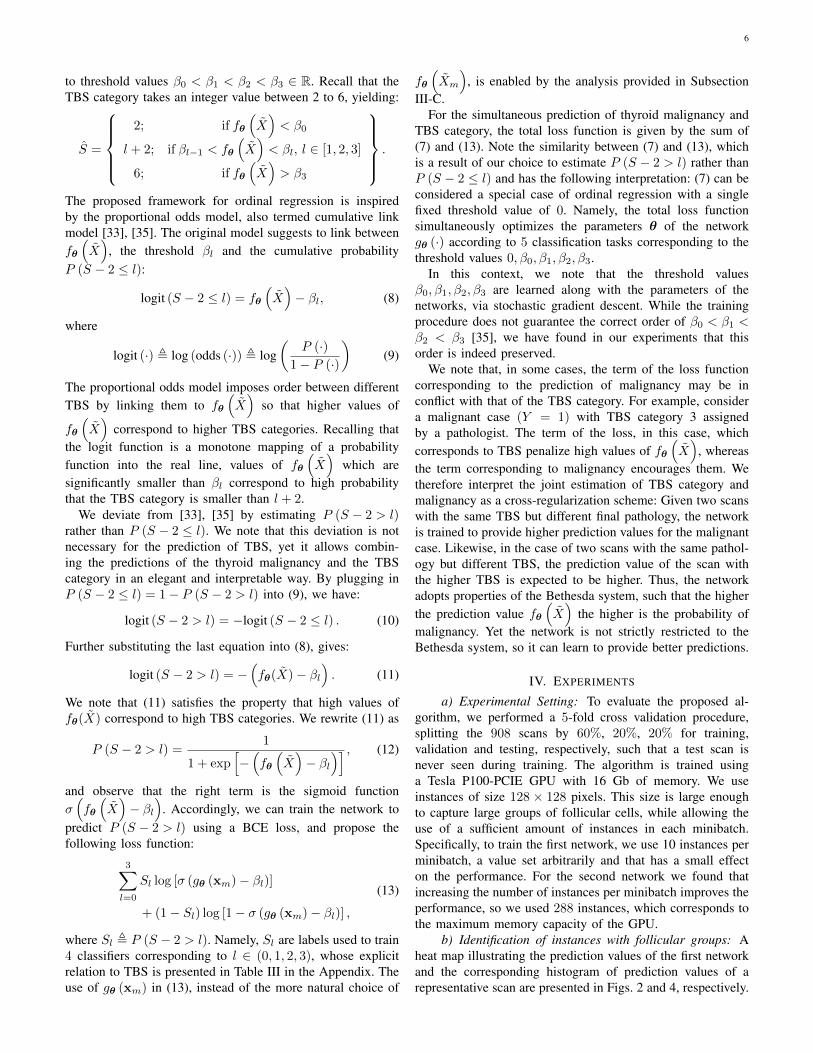
Method AUC APCNN 0.748 0.498NoisyAND 0.761 0.538AttentionMIL 0.743 0.486Proposed+NoisyAND 0.845 0.708Proposed+AttentionMIL 0.823 0.643Proposed-classical-training 0.85 0.693Proposed-pathology-loss 0.858 0.719Proposed 0.87 0.743
TABLE I: Comparison of the performance of the competingalgorithms in the form of AUC and AP scores.
in the form of area under the curve (AUC) and averageprecision (AP) such that the higher is the better. As can beseen in the table, “CNN”, “NoisyAND” and “AttentionMIL”achieve significantly inferior performance compared to theother methods. This is because their decisions are largely madeaccording to irrelevant background data. Specifically, the MILapproaches “NoisyAND” and “AttentionMIL” do not properlydistinguish between the background and the regions contain-ing follicular groups. The methods “Proposed+NoisyAND,”“Proposed+AttentionMIL” and “Proposed-classical-training”perform significantly better; thus reflecting the importance ofproper selection of instances containing follicular groups. Thecomparable performance of these three methods indicates thatthere is no advantage to the sophisticated aggregation of deci-sions based on multiple instances according to [25], [26] com-pared to the simple averaging in (1). In addition, “Proposed-pathology-loss” provides inferior performance compared tothe proposed approach, highlighting the contribution of theordinal regression framework presented in Subsection III-D.The proposed method, based on the improved training strategydevised from the analysis in Subsection III-C, outperforms allother methods.
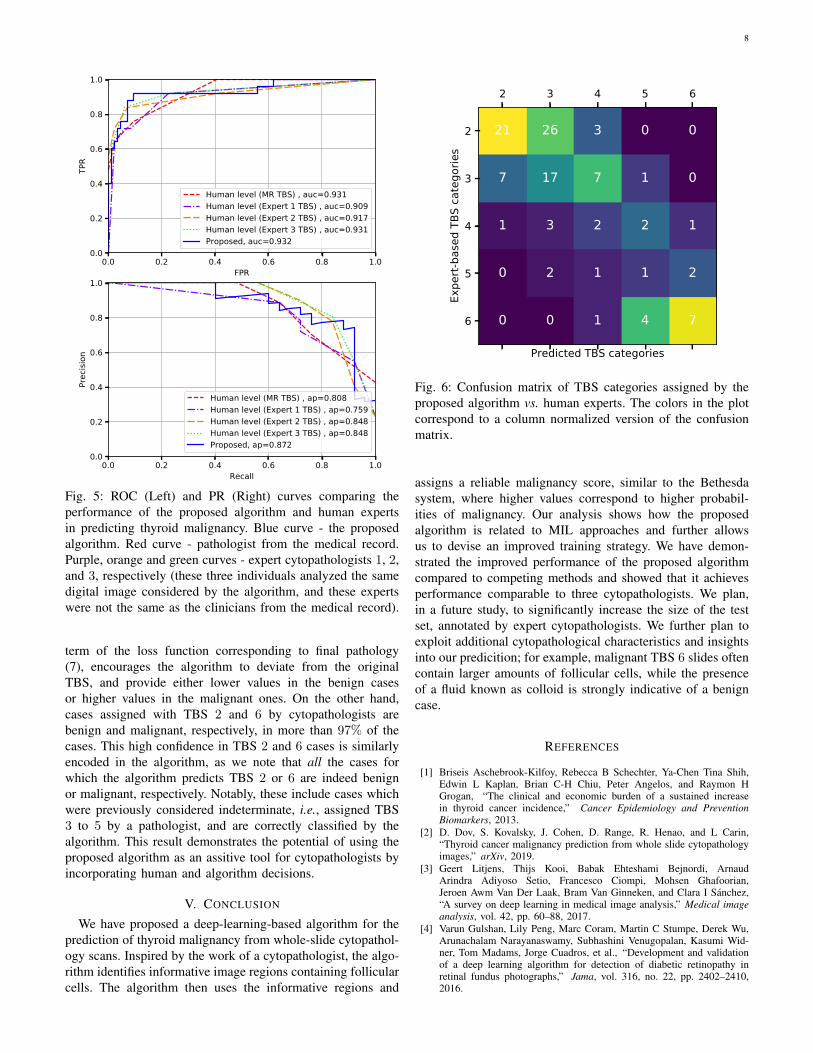
For the comparison of the algorithm to human level perfor-mance, we use a subset of 109 slides which are annotatedby 3 expert cytopathologists (Experts 1 to 3), in additionto the TBS scores available in the original medical record(MR TBS). The MR TBS results are also human-generated,but in general a different clinician analyzed each of thesecases, to constitute the cumulative MR TBS results. Theperformance of the proposed algorithm is compared to those ofhuman in Fig. 5 using receiver operating characteristic (ROC)and precision-recall (PR) curves. The curves representing theperformance of the human experts are obtained by consideringthe TBS categories as “human predictions of malignancy”such that TBS categories 2 to 6 correspond to increasingprobability of thyroid malignancy. The AUC score obtainedby the proposed algorithm is comparable to those of humans,and the algorithm provides an improved AP score comparedto the human experts.
Fig. 6 further presents a comparison of TBS scores assignedby the algorithm and the human experts. It can be seen in theplot that high values are obtained at the top-left and right-bottom of the matrix, while off diagonal values decay. Thisblock diagonal structure is exactly what is expected fromthe algorithm rather than, e.g., a diagonal structure. For theindeterminate cases, assigned TBS 3 to 5 by the experts, the
8
0.0 0.2 0.4 0.6 0.8 1.0FPR
0.0
0.2
0.4
0.6
0.8
1.0TP
R
Human level (MR TBS) , auc=0.931Human level (Expert 1 TBS) , auc=0.909Human level (Expert 2 TBS) , auc=0.917Human level (Expert 3 TBS) , auc=0.931Proposed, auc=0.932
0.0 0.2 0.4 0.6 0.8 1.0Recall
0.0
0.2
0.4
0.6
0.8
1.0
Prec
ision
Human level (MR TBS) , ap=0.808Human level (Expert 1 TBS) , ap=0.759Human level (Expert 2 TBS) , ap=0.848Human level (Expert 3 TBS) , ap=0.848Proposed, ap=0.872
Fig. 5: ROC (Left) and PR (Right) curves comparing theperformance of the proposed algorithm and human expertsin predicting thyroid malignancy. Blue curve - the proposedalgorithm. Red curve - pathologist from the medical record.Purple, orange and green curves - expert cytopathologists 1, 2,and 3, respectively (these three individuals analyzed the samedigital image considered by the algorithm, and these expertswere not the same as the clinicians from the medical record).
term of the loss function corresponding to final pathology(7), encourages the algorithm to deviate from the originalTBS, and provide either lower values in the benign casesor higher values in the malignant ones. On the other hand,cases assigned with TBS 2 and 6 by cytopathologists arebenign and malignant, respectively, in more than 97% of thecases. This high confidence in TBS 2 and 6 cases is similarlyencoded in the algorithm, as we note that all the cases forwhich the algorithm predicts TBS 2 or 6 are indeed benignor malignant, respectively. Notably, these include cases whichwere previously considered indeterminate, i.e., assigned TBS3 to 5 by a pathologist, and are correctly classified by thealgorithm. This result demonstrates the potential of using theproposed algorithm as an assitive tool for cytopathologists byincorporating human and algorithm decisions.
V. CONCLUSION
We have proposed a deep-learning-based algorithm for theprediction of thyroid malignancy from whole-slide cytopathol-ogy scans. Inspired by the work of a cytopathologist, the algo-rithm identifies informative image regions containing follicularcells. The algorithm then uses the informative regions and
2 3 4 5 6
Predicted TBS categories
2
3
4
5
6
Expe
rt-ba
sed
TBS
cate
gorie
s
21 26 3 0 0
7 17 7 1 0
1 3 2 2 1
0 2 1 1 2
0 0 1 4 7
Fig. 6: Confusion matrix of TBS categories assigned by theproposed algorithm vs. human experts. The colors in the plotcorrespond to a column normalized version of the confusionmatrix.
assigns a reliable malignancy score, similar to the Bethesdasystem, where higher values correspond to higher probabil-ities of malignancy. Our analysis shows how the proposedalgorithm is related to MIL approaches and further allowsus to devise an improved training strategy. We have demon-strated the improved performance of the proposed algorithmcompared to competing methods and showed that it achievesperformance comparable to three cytopathologists. We plan,in a future study, to significantly increase the size of the testset, annotated by expert cytopathologists. We further plan toexploit additional cytopathological characteristics and insightsinto our predicition; for example, malignant TBS 6 slides oftencontain larger amounts of follicular cells, while the presenceof a fluid known as colloid is strongly indicative of a benigncase.
REFERENCES
[1] Briseis Aschebrook-Kilfoy, Rebecca B Schechter, Ya-Chen Tina Shih,Edwin L Kaplan, Brian C-H Chiu, Peter Angelos, and Raymon HGrogan, “The clinical and economic burden of a sustained increasein thyroid cancer incidence,” Cancer Epidemiology and PreventionBiomarkers, 2013.
[2] D. Dov, S. Kovalsky, J. Cohen, D. Range, R. Henao, and L Carin,“Thyroid cancer malignancy prediction from whole slide cytopathologyimages,” arXiv, 2019.
[3] Geert Litjens, Thijs Kooi, Babak Ehteshami Bejnordi, ArnaudArindra Adiyoso Setio, Francesco Ciompi, Mohsen Ghafoorian,Jeroen Awm Van Der Laak, Bram Van Ginneken, and Clara I Sanchez,“A survey on deep learning in medical image analysis,” Medical imageanalysis, vol. 42, pp. 60–88, 2017.
[4] Varun Gulshan, Lily Peng, Marc Coram, Martin C Stumpe, Derek Wu,Arunachalam Narayanaswamy, Subhashini Venugopalan, Kasumi Wid-ner, Tom Madams, Jorge Cuadros, et al., “Development and validationof a deep learning algorithm for detection of diabetic retinopathy inretinal fundus photographs,” Jama, vol. 316, no. 22, pp. 2402–2410,2016.
9
[5] Andre Esteva, Brett Kuprel, Roberto A Novoa, Justin Ko, Susan MSwetter, Helen M Blau, and Sebastian Thrun, “Dermatologist-levelclassification of skin cancer with deep neural networks,” Nature, vol.542, no. 7639, pp. 115, 2017.
[6] Geert Litjens, Clara I Sanchez, Nadya Timofeeva, Meyke Hermsen, IrisNagtegaal, Iringo Kovacs, Christina Hulsbergen-Van De Kaa, Peter Bult,Bram Van Ginneken, and Jeroen Van Der Laak, “Deep learning as a toolfor increased accuracy and efficiency of histopathological diagnosis,”Scientific reports, vol. 6, pp. 26286, 2016.
[7] Ugljesa Djuric, Gelareh Zadeh, Kenneth Aldape, and Phedias Diaman-dis, “Precision histology: how deep learning is poised to revitalizehistomorphology for personalized cancer care,” NPJ precision oncology,vol. 1, no. 1, pp. 22, 2017.
[8] K. Sirinukunwattana, S. E. A. Raza, Y. Tsang, D. R. Snead, I. A. Cree,and N. M. Rajpoot, “Locality sensitive deep learning for detection andclassification of nuclei in routine colon cancer histology images,” IEEEtransactions on medical imaging, vol. 35, no. 5, pp. 1196–1206, 2016.
[9] Abraham Pouliakis, Efrossyni Karakitsou, Niki Margari, PanagiotisBountris, Maria Haritou, John Panayiotides, Dimitrios Koutsouris, andPetros Karakitsos, “Artificial neural networks as decision support toolsin cytopathology: past, present, and future,” Biomedical engineering andcomputational biology, vol. 7, pp. BECB–S31601, 2016.
[10] Tianjiao Liu, Shuaining Xie, Jing Yu, Lijuan Niu, and Weidong Sun,“Classification of thyroid nodules in ultrasound images using deep modelbased transfer learning and hybrid features,” in Acoustics, Speech andSignal Processing (ICASSP), 2017 IEEE International Conference on.IEEE, 2017, pp. 919–923.
[11] Jianning Chi, Ekta Walia, Paul Babyn, Jimmy Wang, Gary Groot, andMark Eramian, “Thyroid nodule classification in ultrasound imagesby fine-tuning deep convolutional neural network,” Journal of digitalimaging, vol. 30, no. 4, pp. 477–486, 2017.
[12] Jinlian Ma, Fa Wu, Qiyu Zhao, Dexing Kong, et al., “Ultrasound image-based thyroid nodule automatic segmentation using convolutional neuralnetworks,” International journal of computer assisted radiology andsurgery, vol. 12, no. 11, pp. 1895–1910, 2017.
[13] Jinlian Ma, Fa Wu, Jiang Zhu, Dong Xu, and Dexing Kong, “A pre-trained convolutional neural network based method for thyroid nodulediagnosis,” Ultrasonics, vol. 73, pp. 221–230, 2017.
[14] Hailiang Li, Jian Weng, Yujian Shi, Wanrong Gu, Yijun Mao, YonghuaWang, Weiwei Liu, and Jiajie Zhang, “An improved deep learningapproach for detection of thyroid papillary cancer in ultrasound images,”Scientific reports, vol. 8, 2018.
[15] Wenfeng Song, Shuai Li, Ji Liu, Hong Qin, Bo Zhang, Zhang Shuyang,and Aimin Hao, “Multi-task cascade convolution neural networks forautomatic thyroid nodule detection and recognition,” IEEE journal ofbiomedical and health informatics, 2018.
[16] John A Ozolek, Akif Burak Tosun, Wei Wang, Cheng Chen, SoheilKolouri, Saurav Basu, Hu Huang, and Gustavo K Rohde, “Accuratediagnosis of thyroid follicular lesions from nuclear morphology usingsupervised learning,” Medical image analysis, vol. 18, no. 5, pp. 772–780, 2014.
[17] Alexandra Varlatzidou, Abraham Pouliakis, Magdalini Stamataki, Chris-tos Meristoudis, Niki Margari, George Peros, John G Panayiotides, andPetros Karakitsos, “Cascaded learning vector quantizer neural networksfor the discrimination of thyroid lesions,” Anal Quant Cytol Histol, vol.33, no. 6, pp. 323–334, 2011.
[18] Rajiv Savala, Pranab Dey, and Nalini Gupta, “Artificial neural networkmodel to distinguish follicular adenoma from follicular carcinoma onfine needle aspiration of thyroid,” Diagnostic cytopathology, vol. 46,no. 3, pp. 244–249, 2018.
[19] Hayim Gilshtein, Michal Mekel, Leonid Malkin, Ofer Ben-Izhak, andEdmond Sabo, “Computerized cytometry and wavelet analysis offollicular lesions for detecting malignancy: A pilot study in thyroidcytology,” Surgery, vol. 161, no. 1, pp. 212–219, 2017.
[20] Edward Kim, Miguel Corte-Real, and Zubair Baloch, “A deep semanticmobile application for thyroid cytopathology,” in Medical Imaging2016: PACS and Imaging Informatics: Next Generation and Innovations.International Society for Optics and Photonics, 2016, vol. 9789, p.97890A.
[21] Antonis Daskalakis, Spiros Kostopoulos, Panagiota Spyridonos, DimitrisGlotsos, Panagiota Ravazoula, Maria Kardari, Ioannis Kalatzis, DionisisCavouras, and George Nikiforidis, “Design of a multi-classifier sys-tem for discriminating benign from malignant thyroid nodules usingroutinely h&e-stained cytological images,” Computers in biology andmedicine, vol. 38, no. 2, pp. 196–203, 2008.
[22] Balasubramanian Gopinath and Natesan Shanthi, “Computer-aideddiagnosis system for classifying benign and malignant thyroid nodules
in multi-stained fnab cytological images,” Australasian physical &engineering sciences in medicine, vol. 36, no. 2, pp. 219–230, 2013.
[23] Parikshit Sanyal, Tanushri Mukherjee, Sanghita Barui, Avinash Das,and Prabaha Gangopadhyay, “Artificial intelligence in cytopathology:A neural network to identify papillary carcinoma on thyroid fine-needleaspiration cytology smears,” Journal of pathology informatics, vol. 9,2018.
[24] C. Zhang, J. C. Platt, and P. Viola, “Multiple instance boosting forobject detection,” in Advances in neural information processing systems(NIPS), 2006, pp. 1417–1424.
[25] O. Z. Kraus, J. L. Ba, and B. J. Frey, “Classifying and segmenting mi-croscopy images with deep multiple instance learning,” Bioinformatics,vol. 32, no. 12, pp. i52–i59, 2016.
[26] Maximilian Ilse, Jakub M Tomczak, and Max Welling, “Attention-based deep multiple instance learning,” arXiv preprint arXiv:1802.04712(ICML18), 2018.
[27] G. Quellec, G. Cazuguel, B. Cochener, and M. Lamard, “Multiple-instance learning for medical image and video analysis,” IEEE reviewsin biomedical engineering, vol. 10, pp. 213–234, 2017.
[28] J. RR Uijlings, K. EA Van De Sande, T. Gevers, and A. WM Smeulders,“Selective search for object recognition,” International journal ofcomputer vision, vol. 104, no. 2, pp. 154–171, 2013.
[29] R. Girshick, J. Donahue, T. Darrell, and J. Malik, “Rich featurehierarchies for accurate object detection and semantic segmentation,” inProc. of the IEEE conference on computer vision and pattern recognition(CVPR), 2014, pp. 580–587.
[30] R. Girshick, “Fast r-cnn,” in Proc. of the IEEE international conferenceon computer vision, 2015, pp. 1440–1448.
[31] S. Ren, K. He, R. Girshick, and J. Sun, “Faster r-cnn: towards real-timeobject detection with region proposal networks,” IEEE Transactions onPattern Analysis & Machine Intelligence, , no. 6, pp. 1137–1149, 2017.
[32] P. A. Gutierrez, M. Perez-Ortiz, J. Sanchez-Monedero, F. Fernandez-Navarro, and C. Hervas-Martinez, “Ordinal regression methods: surveyand experimental study,” IEEE Transactions on Knowledge and DataEngineering, vol. 28, no. 1, pp. 127–146, 2016.
[33] P. McCullagh, “Regression models for ordinal data,” Journal of theroyal statistical society. Series B (Methodological), pp. 109–142, 1980.
[34] A. Agresti, Categorical data analysis, vol. 482, John Wiley & Sons,2003.
[35] M. Dorado-Moreno, P. A. Gutierrez, and C. Hervas-Martınez, “Ordinalclassification using hybrid artificial neural networks with projection andkernel basis functions,” in International Conference on Hybrid ArtificialIntelligence Systems. Springer, 2012, pp. 319–330.
[36] X. Jing, S. M. Knoepp, M. H. Roh, K. Hookim, J. Placido, R. Davenport,R. Rasche, and C. W. Michael, “Group consensus review minimizes thediagnosis of follicular lesion of undetermined significance and improvescytohistologic concordance,” Diagnostic cytopathology, vol. 40, no. 12,pp. 1037–1042, 2012.
[37] P. Pathak, R. Srivastava, N. Singh, V. K. Arora, and A. Bhatia, “Imple-mentation of the bethesda system for reporting thyroid cytopathology:interobserver concordance and reclassification of previously inconclusiveaspirates,” Diagnostic cytopathology, vol. 42, no. 11, pp. 944–949, 2014.
[38] M. Zaheer, S. Kottur, S. Ravanbakhsh, B. Poczos, R. R. Salakhutdinov,and A. J. Smola, “Deep sets,” in Advances in Neural InformationProcessing Systems, 2017, pp. 3391–3401.
[39] K. Simonyan and A. Zisserman, “Very deep convolutional networks forlarge-scale image recognition,” arXiv preprint arXiv:1409.1556, 2014.
[40] G. Casella and R. L. Berger, Statistical inference, vol. 2, DuxburyPacific Grove, CA, 2002.
APPENDIX
Proposition 1 The estimated log of the likelihood ratio is alinear function of fθ
(X)
given by:
log Λ = Mfθ
(X)
+ C, (14)
where C and M are constant values.The proof is based on the assumption that the instances
xm are independent random variables. We note that thisassumption is used to facilitate the derivation and it might nothold in practice for instances taken from the same scan. Yet,we motivate this assumption by the large variability between
10
Feature extraction layers
Layer Number of filtersconv2d 64
Max-pooling(M-P)conv2d 128M-P
conv2d 256conv2d 256M-P
conv2d 512conv2d 512M-P
Classification layers
Layer Output sizeLinear 4096
Linear 4096
Linear 1
TABLE II: VGG11 based architecture used for both the firstand the second neural networks in the proposed algorithm.Each conv2d layer comprises 2D convolutions with the pa-rameters kernel size = 3 and padding = 1. Parameters of theMax-pooling layer: kernel size = 2, stride = 2. The conv2dand the linear layers (except the last one) are followed bybatch normalization and ReLU.
the follicular groups in their size, architecture and the numberof cells as demonstrated in Fig. 3.
Proof: By the independence assumption and by takingthe log, we have:
log Λ =∑m
log
(P (xm|Y = 1)
P (xm|Y = 0)
). (15)
By applying the Bayes rule, we have:
log Λ =∑m
log
(P (Y = 1|xm)P (Y = 0)
P (Y = 0|xm)P (Y = 1)
), (16)
which we rewrite by:
log Λ =∑m
log
(P (Y = 1|xm)
P (Y = 0|xm)
)+ C (17)
=∑m
logit (Y = 1|xm) + C, (18)
where: C ,∑
m log(
P (Y=0)P (Y=1)
)and logit (·) , log
(P (·)
1−P (·)
).
The first term in the last equation is estimated from the neuralnetwork, so that the estimated log likelihood ratio is given by:
log Λ =∑m
gθ (xm) + C (19)
Finally, (14) is given by assigning (1) into (19).
S0 S1 S2 S3
2 0 0 0 0Bethesda 3 1 0 0 0
score 4 1 1 0 05 1 1 1 06 1 1 1 1
TABLE III: Binary labels used in the proposed ordinal regres-sion framework to predict the Bethesda score.
Fig. 7: Instances containing follicular groups. The rows, fromtop to bottom, correspond to TBS 2− 6 categories.
![PRIMARY DISTAL ESOPHAGEAL MALIGNANCY PRESENTING AS … · adjacent primaries, a hematogenous pathway and lymphatic route for metastatic spread to the thyroid have been suggested [8]](https://img.pdfslide.net/doc/110x75/5e53ac8c30394239ea461534/primary-distal-esophageal-malignancy-presenting-as-adjacent-primaries-a-hematogenous.jpg)