Embed Size (px)
Citation preview

A Deeper Look at Saliency:
Feature Contrast, Semantics, and Beyond
Neil D. B. Bruce, Christopher Catton, Sasa Janjic
University of Manitoba
Winnipeg, MB
Abstract
In this paper we consider the problem of visual saliency
modeling, including both human gaze prediction and salient
object segmentation. The overarching goal of the paper
is to identify high level considerations relevant to deriving
more sophisticated visual saliency models. A deep learn-
ing model based on fully convolutional networks (FCNs) is
presented, which shows very favorable performance across
a wide variety of benchmarks relative to existing proposals.
We also demonstrate that the manner in which training data
is selected, and ground truth treated is critical to resulting
model behaviour. Recent efforts have explored the relation-
ship between human gaze and salient objects, and we also
examine this point further in the context of FCNs. Close ex-
amination of the proposed and alternative models serves as
a vehicle for identifying problems important to developing
more comprehensive models going forward.
1. Introduction
The past decade has seen numerous developments in
modeling visual saliency, including introduction of a wide
variety of models, many new and larger datasets, and a bet-
ter understanding of metrics that are most appropriate for
measuring model performance. Additionally, the notion of
saliency has broadened such that several distinct problems
are treated as problems of modeling saliency, including gaze
prediction, salient object segmentation, and objectness mea-
sures [2] respectively. Many domains of computer vision
have benefitted from deep learning, and it is natural to con-
sider that value of deep learning models in saliency predic-
tion. Preliminary efforts of this variety suggest that there
may also be significant benefits to deep learning for visual
saliency prediction [19]. One contribution of this paper is
a deep learning model for visual saliency prediction based
on fully convolutional networks [23]. While the principal
focus of this work is on gaze prediction, we also consider
the problem of salient object segmentation and further ex-
plore the relationship between salient objects and human
gaze patterns.
Given the vast array of developments in visual saliency
prediction of late, there is value in taking account of where
models currently stand in their capabilities, and where im-
provements might be made. This consideration is especially
timely given that the choice of data is critical to how deep
learning models will ultimately behave, and their capabili-
ties will be determined in part by the relative balance of dif-
ferent types of patterns and concepts expressed in the data.
Aside from the proposed deep learning model that is pro-
posed, in our view this paper carries two additional and im-
portant contributions:
1. Data and ground truth: The manner in which data is
selected, ground truth created, and performance assessed
(e.g. loss function) are critical to the problem. We there-
fore place a heavy emphasis on examining this issue, and
reveal nuances of the problem critical to treating gaze pre-
diction using neural networks. This problem is introduced
in section 2 and explored in detail in section 3. Supporting
benchmark results are presented in section 4 of the paper.
2. Failures and shortcomings: Equally important to reveal-
ing what models grounded in deep learning can do well, is
revealing what they cannot do well. To this end, we dedi-
cate a significant portion of our analysis and discussion to
revealing current challenges and suggestions for overcom-
ing these challenges. These issues are explored in section
5.
Overall, the experimentation that is included reveals a
number of issues important to any work involving the inter-
section of saliency with deep learning, and remaining chal-
lenges and possible paths forward are summarized in sec-
tion 6.
2. Methods
In this section, we describe the models we have consid-
ered and evaluation methodology. This includes the struc-
1516

2x2_2
3x3_1
3x3_1
2x2_2
3x3_1
3x3_1
2x2_2
3x3_1
3x3_1
64
64
128
128
256
256
3x3_1256
2x2_2
3x3_1
3x3_1
512
512
3x3_1512
2x2_2
3x3_1
3x3_1
512
512
3x3_1512
7x7_14096 0.5
1x1_14096 0.5
4x4_260
1x1_160
4x4_260
1x1_160
16x16_860
1x1_112
1x1_11
N
%
Max Pooling Euclidean Loss
DropoutDeconvolutionConvolution +
ReLU
# Outputs Sum
KxK_sKxK_s
KxK_s
Figure 1. A high-level overview of the FUCOS architecture. Pa-
rameters in the legend are as follows: K corresponds to kernel
dimensions, S to stride, N to number of outputs, % to the percent
of dropout units.
ture of FCNs used in experimentation and considerations
relevant to benchmarking.
2.1. Models
In recent years, there has been tremendous progress in
certain areas of computer vision built on the success of deep
learning. Problems that prescribe a pixel level labeling at
the output such as semantic segmentation have shared in this
success [12]. In the paper, we explore the extent to which
saliency prediction may benefit from a similar treatment.
This is inspired in part by the apparent benefits of leveraging
semantics in the context of saliency prediction. To this end,
we present a model deemed Fully Convolutional Saliency
(FUCOS), that is applied to either gaze, or salient object
85S 85N 90S 90N 95S 95N
0.714
0.716
0.718
0.72
0.722
0.724
0.726
0.728
0.73
AUC Score on PASCAL dataset
0 0.01 0.02 0.03 0.04 0.05 0.06 0.07 0.080.68
0.69
0.7
0.71
0.72
0.73
0.74
Blur Width(STD of Gaussian kernel in image widths)
AU
C S
core
(ave
rag
ed
acro
ss a
ll im
ag
es)
AUC Score on PASCAL dataset
85S
85N
90S
90N
95S
95N
Figure 2. Area under ROC curve for the FUCOS model corre-
sponding to different ground truth thresholds, and with (N) or
without (S) center-biased based normalization.
prediction. For some experiments involving salient object
segmentation, we also consider an alternative model based
on deconvolutional neural networks [26] for comparison.
FUCOS shares a similar structure to models that have
had success in addressing the problem of semantic segmen-
tation including the family of FCN networks presented by
Long et al. [23]. A simple schematic of the FUCOS net-
work employed for most of the experimentation in the paper
is presented in Figure 1.
Model weights for layers matching the Long et al. ar-
chitecture [23] were initialized to those derived from train-
ing an 8 pixel prediction stride FCN on PASCAL-Context.
Remaining layers were assigned random weights subject to
Xavier initialization [14]. The initial learning rate was set
to 10−14, with weights decreasing by a step γ = 0.1 ev-
ery 10k iterations. 80k total iterations were used to train
each version of the model appearing in results and bench-
mark metrics. Note that versions specific to salient object
segmentation (and not gaze) are introduced later on in sec-
tion 4. These are referred to as SAL-FCN and SAL-DC to
distinguish from the gaze based cases.
2.2. Evaluation
The problem of evaluating saliency models is challeng-
ing in itself which has contributed to fragmentation among
benchmarks that are used. In light of these considerations,
the specific evaluation we have applied aims to remove any
advantages of one algorithm over another due to bias inde-
pendent of image signal, and variation due to gain/contrast
associated with algorithm output. We have restricted our
analysis to gaze data to avoid challenges that may arise
from the additional variability introduced by data collec-
tion methods that approximate gaze data on a larger scale
[19, 36, 30]. The evaluation is largely focused on model-
ing gaze prediction, however we also consider salient ob-
ject segmentation. Given all of these considerations, bench-
marking for both fixation data and salient object segmenta-
tion is based on the methods described by Li et al. [22].
We have compared our output with several saliency and
517

segmentation algorithms including: ITTI [18], AIM [5],
GBVS [15], DVA [17], SUN [37], SIG [16], AWS [13],
FT [1], GC [10], SF [27], and PCAS [24]. We have also
compared to one alternative deep learning model SALICON
[19] that performs well in standard benchmarks. Model per-
formance for gaze data is therefore based on the area under
the ROC curve (auROC) corresponding to a shuffled-ROC
metric [33, 22]. Parameters relevant to a fair comparison
of capabilities of different methods (e.g. post-processing
blur) are also optimized in this process. Model performance
for salient object segmentation is based on Precision-Recall
(PR) analysis. Optimal F-Scores along the precision-recall
curves are also taken as an additional measure of algorithm
performance.
3. The Devil in the Data
The outcome of learning is dependent on the specific na-
ture of the image data used in training, and corresponding
ground truth. Analysis presented in this paper therefore in-
cludes detailed consideration of these factors, as discussed
in what follows.
3.1. Choice of Data
Models based on very deep neural networks typically re-
quire a significant amount of data for training. To overcome
this challenge, recent efforts have sought to develop alter-
native strategies for deriving ground truth data that scale to
much larger data sets [19, 36, 30]. In lieu of this strategy,
we instead leverage a combination of different traditional
eye tracking data sets to derive a suitably sized data set for
training. Specifically, we have used a subset of the Bruce
[5], Judd [20], PASCAL [22], and Imgsal [21] datasets. The
{training/testing} division for each of the datasets is as fol-
lows: {60/60}, {300/703}, {325/525}, {117/118}. This
reflects a trade-off between the size of the set of training ex-
amples, and the desire to balance the contribution of sam-
ples from each distinct dataset. The intent of this latter
consideration is towards diminishing bias specific to indi-
vidual datasets. It is also the case then, that all output and
benchmark results for different source datasets correspond
to the same model, and not different models trained for each
dataset individually.
3.2. Ground Truth
Ground truth forms the basis for evaluation, but also
serves an important role in its relation to the loss function
used in training the neural network. This is complicated by
the fact that most metrics employed for performance eval-
uation don’t lend themselves to a form that can be directly
optimized, or treated as a loss function. This obscures the
connection between the ground truth, and the behavior of
the resultant model that is trained. In the case of gaze data,
one typically has a sparse sampling of discrete pixel loca-
tions within each image. These might be assumed to be
observations that may be treated as samples from a latent
distribution. One can convert discrete gaze points to a non-
parametric density via convolution with a Gaussian kernel.
This strategy has been employed to consider the approx-
imate visual acuity of sampling corresponding to a set of
fixation points [5], and blurring of the fixation map is often
used to generate human fixation data derived saliency map
that can be treated as a classifier.
For a variety of common loss functions, direct use of
the discrete fixated locations may not be the best choice:
For example, the sparsity of fixated pixels might imply that
a zero output nearly everywhere is optimal in the eyes of
a Euclidian loss function, without additional constraints.
Moreover, a mix of different datasets results in some hetero-
geneity in the statistical properties of the combined dataset.
In considering treatment of the ground truth data, we have
identified a number of important considerations:
1. Intuitively, one might hope to maximize the signal asso-
ciated with image content driving gaze, while minimiz-
ing noise corresponding to non-gaze related factors and
low sample density in measured fixation data.
2. A continuous representation derived from raw gaze co-
ordinates is a sensible means of producing dense ground
truth.
3. Noise factors may include noise intrinsic to the gaze
tracking instrument, but also inherent bias related to gaze
behavior. The issue of center bias in gaze data has been
much discussed [31], in particular for its role in evalua-
tion. However, one might also treat this bias as a noise
variable, since the salience of local samples is less re-
lated to image content when spatial bias is present in the
data. This is especially important if convolutional layers
have only a local view of the image, without any more
global influence.
4. Gaze tracking data is heterogeneous. Factors that vary
include total viewing times, number of viewers, image
size, viewing distance, and bias in the nature of images.
For these reasons, the spatial distribution and contrast of
derived density maps can vary substantially. This may be
problematic in combining ground truth samples drawn
from different data sets, as their associated statistics may
differ.
Given the aforementioned considerations, we have
adopted the following procedure for producing ground truth
data:
1. Fixation maps are first convolved with a Gaussian kernel,
with σ corresponding to 1 degree visual angle. This im-
plies that density is a good match with sampling density
518

A B C D E F G H I A B C D E F G H I
A B C D E F G H I A B C D E F G H I
Figure 3. Heatmaps superimposed on images from the 4 datasets considered. Top Left: Bruce [5], Top Right: Pascal [22], Bottom Left:
ImgSal [21], Bottom Right: Judd [20]. Each frame shows output corresponding to: (a) the original image, (b) DVA [17], (c) AIM [5], (d)
SIG [16], (e) AWS [13], (f) SALICON [19], (g) 80N, (h) 95N, and (i) fixation density corresponding to the human data.
accounting for differences between foveal and periph-
eral visual acuity. Differences in contrast remain, due to
differing numbers of viewers or viewing time per image.
2. Fixation density maps are averaged over all ground truth
samples within each individual data set. This is prepara-
tion for the optional step that follows.
3. [optional] The average density map for each dataset is
subtracted from each individual density map from the
same dataset. This step is intended to factor out the gaze
signal driven by center bias. It is worth noting that more
sophisticated methods might be used at this stage (e.g.
factoring out context [6]).
4. Ground truth density maps are converted to binary masks
by thresholding. The threshold is percentile based, such
that values across all (rather than individual) density
maps within each dataset determine a threshold value
corresponding to percentile p. This was found to be
a useful way to compensate for differences in contrast
across continuous density maps corresponding to differ-
ent datasets. The value of p is varied in experimentation,
including in serving observation of its interaction with
519

0 0.01 0.02 0.03 0.04 0.05 0.06 0.07 0.080.6
0.62
0.64
0.66
0.68
0.7
0.72
0.74
Blur Width(STD of Gaussian kernel in image widths)
AU
C S
core
(avera
ged a
cro
ss a
ll im
ages)
AUC Score on IMGSAL dataset
SUN
ITTI
DVA
GBVS
SIG
AIM
AWS
SALICON
80N
85N
90N
95N
sun itti dva gbvs sig aim aws salicon 80N 85N 90N 95N
0.65
0.66
0.67
0.68
0.69
0.7
0.71
0.72
0.73
0.74
AUC Score on IMGSAL dataset
0 0.01 0.02 0.03 0.04 0.05 0.06 0.07 0.080.62
0.64
0.66
0.68
0.7
0.72
0.74
0.76
Blur Width(STD of Gaussian kernel in image widths)
AU
C S
core
(avera
ged a
cro
ss a
ll im
ages)
AUC Score on BRUCE dataset
SUN
ITTI
DVA
GBVS
SIG
AIM
AWS
SALICON
80N
85N
90N
95N
sun itti dva gbvs sig aim aws salicon 80N 85N 90N 95N
0.64
0.66
0.68
0.7
0.72
0.74
AUC Score on BRUCE dataset
0 0.01 0.02 0.03 0.04 0.05 0.06 0.07 0.080.6
0.62
0.64
0.66
0.68
0.7
0.72
0.74
0.76
0.78
0.8
Blur Width(STD of Gaussian kernel in image widths)
AU
C S
core
(avera
ged a
cro
ss a
ll im
ages)
AUC Score on JUDD dataset
SUN
ITTI
DVA
GBVS
SIG
AIM
AWS
SALICON
80N
85N
90N
95N
sun itti dva gbvs sig aim aws salicon 80N 85N 90N 95N
0.64
0.66
0.68
0.7
0.72
0.74
0.76
0.78
AUC Score on JUDD dataset
0 0.01 0.02 0.03 0.04 0.05 0.06 0.07 0.08
0.58
0.6
0.62
0.64
0.66
0.68
0.7
0.72
0.74
Blur Width(STD of Gaussian kernel in image widths)
AU
C S
core
(avera
ged a
cro
ss a
ll im
ages)
AUC Score on PASCAL dataset
SUN
ITTI
DVA
GBVS
SIG
AIM
AWS
SALICON
80N
85N
90N
95N
sal-fcn
sal-dc
sun itti dva gbvs sig aim aws salicon 80N 85N 90N 95N sal-fcn sal-dc
0.6
0.62
0.64
0.66
0.68
0.7
0.72
0.74
AUC Score on PASCAL dataset
Figure 4. Benchmark performance for gaze prediction for 4 datasets. Left column: Curves depicting area under ROC curve as a function
of post-processing blurring kernel σ. Curves are labeled according to Legend. Right: Bar plots showing optimal area under ROC values
for the shuffled-ROC metric. Note for the pascal dataset, two algorithms trained for salient object prediction are also included.
the optional step 3.
Results are discussed in detail in the section that follows,
but we present one set of results here that is germane to the
points made in this section. Figure 2 demonstrates perfor-
mance of FUCOS for fixation prediction for the PASCAL
dataset, in following the above steps for varying values of
p. It is evident that the normalization for center bias is im-
portant to the results that are achieved. Note that given the
dependence of the FUCOS model on data, we refer to indi-
vidual instantiations of FUCOS according to shorthand that
reflects the nature of the training data. In particular, each of
the models is numbered according to the percentile thresh-
old used, with N indicating normalization to compensate for
center bias, and S indicating no such normalization. (e.g.
85S indicates training based on binary outputs correspond-
ing to a threshold based on the 85th percentile value in the
non-normalized fixation density maps)
4. Results
In this section, we present qualitative examples of out-
put from various algorithms corresponding to the 4 datasets,
and results from performance evaluation benchmarks. Fig-
ure 3 demonstrates the output of a variety of algorithms,
with the correspondence to dataset and algorithm noted
in the figure caption. Visualization is based on super-
imposing a heatmap corresponding to algorithm output
(saliency) over the original image. The problem of visu-
alizing saliency map output appropriately can be a chal-
lenge (e.g. see [7]). To ensure that observed differences due
to perceptual considerations are minimized, output saliency
maps are histogram equalized to ensure matching contrast.
Pixels covered by the superimposed heatmap correspond to
the top 20% of output values in each saliency map, with col-
ormap values mapped linearly to the equalized heatmap val-
ues. This provides an effective means of comparing the pre-
dictions of most salient regions across different algorithms.
As mentioned in the methods section, performance is
quantified according to the area under the ROC curve, treat-
ing the output of algorithms as a binary classifier. Evalu-
ation corresponds to the shuffled AUC score that is com-
mon in saliency evaluation. It is also important to note that
benchmarking is performed on the raw gaze data as is typ-
ical, and the earlier discussion of binarized ground truth
maps applied only to produce data used in training. Re-
sults for a variety of algorithms, and for the 4 datasets are
shown in Figure 4. It is evident that FUCOS significantly
outperforms existing approaches to the problem. We have
also compared the output to the SALICON model, which
is a deep learning model. Interestingly, our solution per-
forms significantly better for 2 of the 4 datasets, slightly
better for 1 and significantly worse for the other. It is worth
noting that the case where FUCOS is not the top perform-
ing model may be due to training of the competing model
(SALICON) on images that comprise the test data. Over-
all, this analysis hints at strengths and weaknesses of deep
520
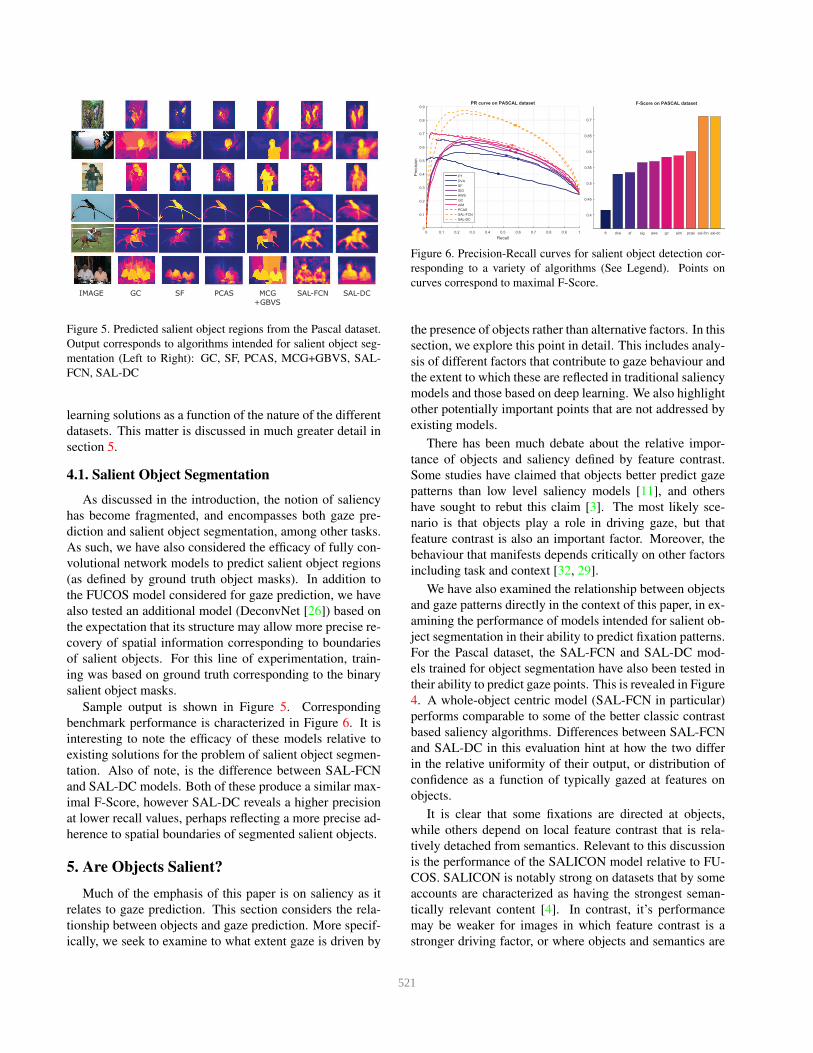
IMAGE GC SF PCAS MCG
+GBVS
SAL-FCN SAL-DC
Figure 5. Predicted salient object regions from the Pascal dataset.
Output corresponds to algorithms intended for salient object seg-
mentation (Left to Right): GC, SF, PCAS, MCG+GBVS, SAL-
FCN, SAL-DC
learning solutions as a function of the nature of the different
datasets. This matter is discussed in much greater detail in
section 5.
4.1. Salient Object Segmentation
As discussed in the introduction, the notion of saliency
has become fragmented, and encompasses both gaze pre-
diction and salient object segmentation, among other tasks.
As such, we have also considered the efficacy of fully con-
volutional network models to predict salient object regions
(as defined by ground truth object masks). In addition to
the FUCOS model considered for gaze prediction, we have
also tested an additional model (DeconvNet [26]) based on
the expectation that its structure may allow more precise re-
covery of spatial information corresponding to boundaries
of salient objects. For this line of experimentation, train-
ing was based on ground truth corresponding to the binary
salient object masks.
Sample output is shown in Figure 5. Corresponding
benchmark performance is characterized in Figure 6. It is
interesting to note the efficacy of these models relative to
existing solutions for the problem of salient object segmen-
tation. Also of note, is the difference between SAL-FCN
and SAL-DC models. Both of these produce a similar max-
imal F-Score, however SAL-DC reveals a higher precision
at lower recall values, perhaps reflecting a more precise ad-
herence to spatial boundaries of segmented salient objects.
5. Are Objects Salient?
Much of the emphasis of this paper is on saliency as it
relates to gaze prediction. This section considers the rela-
tionship between objects and gaze prediction. More specif-
ically, we seek to examine to what extent gaze is driven by
Recall
0 0.1 0.2 0.3 0.4 0.5 0.6 0.7 0.8 0.9 1
Precision
0
0.1
0.2
0.3
0.4
0.5
0.6
0.7
0.8
0.9PR curve on PASCAL dataset
FT
DVA
SF
SIG
AWS
GC
AIM
PCAS
SAL-FCN
SAL-DC
ft dva sf sig aws gc aim pcas sal-fcn sal-dc
0.4
0.45
0.5
0.55
0.6
0.65
0.7
F-Score on PASCAL dataset
Figure 6. Precision-Recall curves for salient object detection cor-
responding to a variety of algorithms (See Legend). Points on
curves correspond to maximal F-Score.
the presence of objects rather than alternative factors. In this
section, we explore this point in detail. This includes analy-
sis of different factors that contribute to gaze behaviour and
the extent to which these are reflected in traditional saliency
models and those based on deep learning. We also highlight
other potentially important points that are not addressed by
existing models.
There has been much debate about the relative impor-
tance of objects and saliency defined by feature contrast.
Some studies have claimed that objects better predict gaze
patterns than low level saliency models [11], and others
have sought to rebut this claim [3]. The most likely sce-
nario is that objects play a role in driving gaze, but that
feature contrast is also an important factor. Moreover, the
behaviour that manifests depends critically on other factors
including task and context [32, 29].
We have also examined the relationship between objects
and gaze patterns directly in the context of this paper, in ex-
amining the performance of models intended for salient ob-
ject segmentation in their ability to predict fixation patterns.
For the Pascal dataset, the SAL-FCN and SAL-DC mod-
els trained for object segmentation have also been tested in
their ability to predict gaze points. This is revealed in Figure
4. A whole-object centric model (SAL-FCN in particular)
performs comparable to some of the better classic contrast
based saliency algorithms. Differences between SAL-FCN
and SAL-DC in this evaluation hint at how the two differ
in the relative uniformity of their output, or distribution of
confidence as a function of typically gazed at features on
objects.
It is clear that some fixations are directed at objects,
while others depend on local feature contrast that is rela-
tively detached from semantics. Relevant to this discussion
is the performance of the SALICON model relative to FU-
COS. SALICON is notably strong on datasets that by some
accounts are characterized as having the strongest seman-
tically relevant content [4]. In contrast, it’s performance
may be weaker for images in which feature contrast is a
stronger driving factor, or where objects and semantics are
521
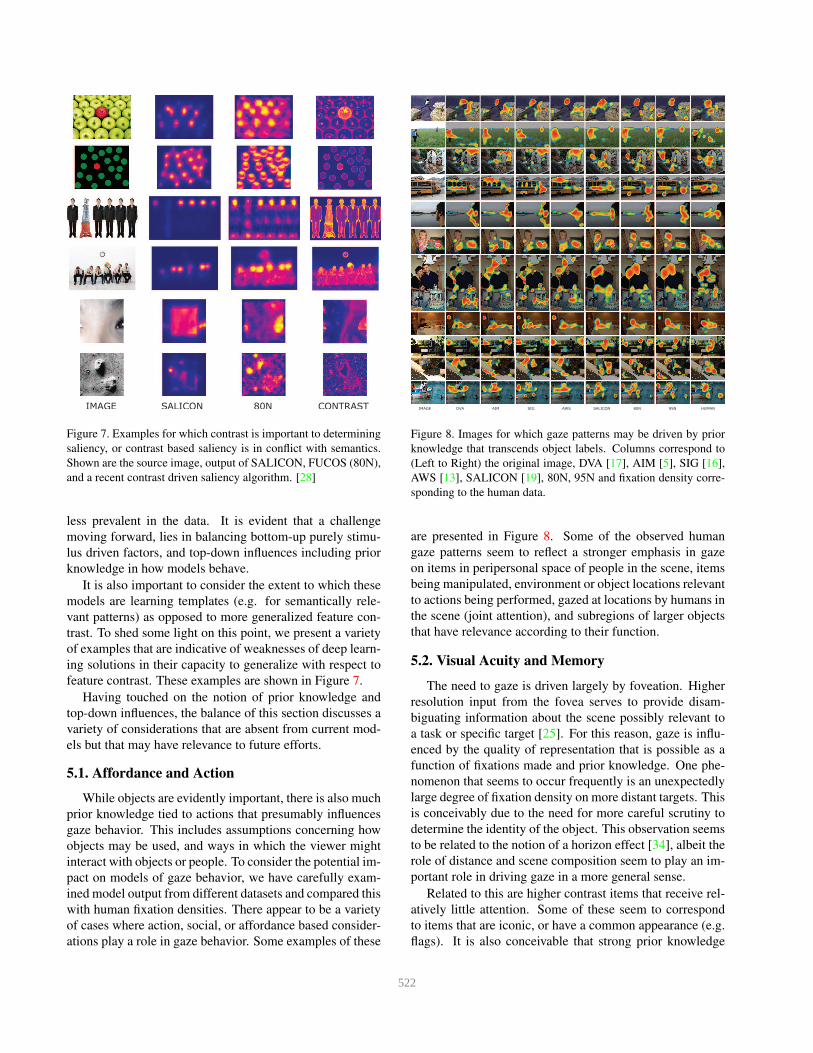
IMAGE SALICON 80N CONTRAST
Figure 7. Examples for which contrast is important to determining
saliency, or contrast based saliency is in conflict with semantics.
Shown are the source image, output of SALICON, FUCOS (80N),
and a recent contrast driven saliency algorithm. [28]
less prevalent in the data. It is evident that a challenge
moving forward, lies in balancing bottom-up purely stimu-
lus driven factors, and top-down influences including prior
knowledge in how models behave.
It is also important to consider the extent to which these
models are learning templates (e.g. for semantically rele-
vant patterns) as opposed to more generalized feature con-
trast. To shed some light on this point, we present a variety
of examples that are indicative of weaknesses of deep learn-
ing solutions in their capacity to generalize with respect to
feature contrast. These examples are shown in Figure 7.
Having touched on the notion of prior knowledge and
top-down influences, the balance of this section discusses a
variety of considerations that are absent from current mod-
els but that may have relevance to future efforts.
5.1. Affordance and Action
While objects are evidently important, there is also much
prior knowledge tied to actions that presumably influences
gaze behavior. This includes assumptions concerning how
objects may be used, and ways in which the viewer might
interact with objects or people. To consider the potential im-
pact on models of gaze behavior, we have carefully exam-
ined model output from different datasets and compared this
with human fixation densities. There appear to be a variety
of cases where action, social, or affordance based consider-
ations play a role in gaze behavior. Some examples of these
IMAGE DVA AWSAIM SIG SALICON 80N 95N HUMAN
Figure 8. Images for which gaze patterns may be driven by prior
knowledge that transcends object labels. Columns correspond to
(Left to Right) the original image, DVA [17], AIM [5], SIG [16],
AWS [13], SALICON [19], 80N, 95N and fixation density corre-
sponding to the human data.
are presented in Figure 8. Some of the observed human
gaze patterns seem to reflect a stronger emphasis in gaze
on items in peripersonal space of people in the scene, items
being manipulated, environment or object locations relevant
to actions being performed, gazed at locations by humans in
the scene (joint attention), and subregions of larger objects
that have relevance according to their function.
5.2. Visual Acuity and Memory
The need to gaze is driven largely by foveation. Higher
resolution input from the fovea serves to provide disam-
biguating information about the scene possibly relevant to
a task or specific target [25]. For this reason, gaze is influ-
enced by the quality of representation that is possible as a
function of fixations made and prior knowledge. One phe-
nomenon that seems to occur frequently is an unexpectedly
large degree of fixation density on more distant targets. This
is conceivably due to the need for more careful scrutiny to
determine the identity of the object. This observation seems
to be related to the notion of a horizon effect [34], albeit the
role of distance and scene composition seem to play an im-
portant role in driving gaze in a more general sense.
Related to this are higher contrast items that receive rel-
atively little attention. Some of these seem to correspond
to items that are iconic, or have a common appearance (e.g.
flags). It is also conceivable that strong prior knowledge
522

concerning object characteristics precludes the need for di-
rect foveation to completely disambiguate their characteris-
tics. These observations all lend support to the notion that
models that include more prior knowledge about objects,
scene composition, actions, social interaction, and human
behavior will help to bridge the gap between the state of the
art in gaze prediction, and recorded human gaze data.
6. Discussion
In this paper, we present a deep learning model for
saliency prediction, and demonstrate the effectiveness of
this approach for both gaze prediction and salient object
segmentation. A variety of important observations follow
from this analysis:
1. Choice of image data: The behaviour of FUCOS and
related models evidently depends on the choice of in-
put data. The variable nature of performance for the
SALICON model across different datasets suggests that
the source data used in training may match some of the
datasets tested better than others. In contrast, a more var-
ied selection of input data seems to result in strong per-
formance across varied datasets. The role of efforts to
crowdsource data collection that approximates gaze data
[19, 36, 30] will no doubt help in these efforts. Never-
theless, training with more data, and more varied data is
not necessarily the most effective solution. This is elab-
orated on in some of the points that follow.
2. Choice of ground truth: There are instances where the
manner for treating ground truth is well-defined, espe-
cially when there is a direct relationship between the
loss function being optimized in training, and the metric
used for performance evaluation. This is generally not
the case for gaze prediction, and results presented in this
paper reveal the importance of carefully considering how
human gaze data is translated into a form that is suitable
training. Even in cases that have a clearer correspon-
dence between ground truth and problem objective (e.g.
salient object segmentation), sensitivity to perturbations
of ground truth is not well established. Hand labeled re-
gions may be relatively coarse grained, or follow specific
form and details of the objects. These differences might
conceivably have a similar importance in the model be-
havior following training.
3. Role of Semantics: Incorporating knowledge of seman-
tics in gaze prediction is evidently important. This has
been clear from efforts that reveal the importance of
faces and text in driving fixations [9]. It is also clear that
people and animals are important, including a particular
emphasis on both human and animal faces. One target
for future work is the need to understand the relative im-
portance of semantics beyond some of these established
categories.
4. On Feature Contrast: A filter sensitive to edges, or
a local Difference of Gaussians operator may each be
viewed as a detector for a certain type of contrast. This
consideration extends to more complex patterns includ-
ing discontinuities in texture and other mid-level fea-
tures. One might assume that an appropriate response
to all patterns may be encoded in a feedforward manner,
with an appropriate network configuration and training
data. However, this presents a rather rigid way of encod-
ing feature contrast. A more likely candidate is mecha-
nisms that involve recurrence. Local divisive normaliza-
tion is sufficiently ubiquitous in the human visual system
that this has been deemed to be a canonical operation in
visual and other sensory computation [8]. It is likely
that highly flexible models of visual saliency computa-
tion are possible with a much simpler network in im-
plementing similar computation alongside semantically
driven selection.
5. Affordances and more: We have provided examples of
cases that may be challenging for current models of gaze
prediction. Some of these are anecdotal or based on the
authors’ assumptions concerning visual routines [35] at-
tached to these scenes. Nevertheless, it is well estab-
lished that phenomena such as joint attention are impor-
tant to driving viewing behaviour. Moreover, the role of
the eye as a sensory instrument is largely lacking from
existing models, but presumably plays a significant role
in how visual content is parsed.
It is clear that deep learning models may be highly capa-
ble in visual saliency prediction. However, this capability
may be bolstered significantly by careful decisions in how
models are trained. As richer levels of scene and action un-
derstanding are developed, this will also allow models for
gaze prediction to address scenarios that are currently out
of reach. Feature contrast as a general phenomenon is one
central component to saliency driven fixation behavior that
may be poorly captured by deep learning models. This can
likely be rectified by appropriate adjustments to the neural
architecture used, including by incorporating local mecha-
nisms for gain control and normalization. This is a con-
sideration that may also have important implications for all
deep learning models, including those that target problems
outside of saliency or gaze modeling.
7. Acknowledgements
The authors gratefully acknowledge financial support
from the Natural Sciences and Engineering Research Coun-
cil Canada (NSERC) Discovery Grants program and ONR
grant #N00178-14-Q-4583.
523

References
[1] R. Achanta, S. Hemamiz, F. Estrada, and S. Susstrunk.
Frequency-tuned salient region detection. CVPR 2009 Work-
shops, pages 1597–1604, 2009. 3
[2] B. Alexe, T. Deselaers, and V. Ferrari. Measuring the ob-
jectness of image windows. IEEE Transactions on PAMI,
34(11):2189–2202, 2012. 1
[3] A. Borji, D. N. Sihite, and L. Itti. Objects do not predict fix-
ations better than early saliency: A re-analysis of einhauser
et al.’s data. Journal of vision, 13(10):18, 2013. 6
[4] A. Borji, H. R. Tavakoli, D. N. Sihite, and L. Itti. Analysis
of scores, datasets, and models in visual saliency prediction.
In Computer Vision (ICCV), 2013 IEEE International Con-
ference on, pages 921–928. IEEE, 2013. 6
[5] N. Bruce and J. Tsotsos. Saliency based on information max-
imization. NIPS 2005, pages 155–162, 2005. 3, 4, 7
[6] N. D. Bruce. Towards fine-grained fixation analysis: distill-
ing out context dependence. In Proceedings of the sympo-
sium on eye tracking research and applications, pages 99–
102. ACM, 2014. 4
[7] N. D. Bruce, C. Wloka, N. Frosst, S. Rahman, and J. K. Tsot-
sos. On computational modeling of visual saliency: Exam-
ining whats right, and whats left. Vision research, 2015. 5
[8] M. Carandini and D. J. Heeger. Normalization as a canon-
ical neural computation. Nature Reviews Neuroscience,
13(1):51–62, 2012. 8
[9] M. Cerf, E. P. Frady, and C. Koch. Faces and text attract
gaze independent of the task: Experimental data and com-
puter model. Journal of vision, 9(12):10, 2009. 8
[10] M.-M. Cheng, N. Mitra, X. Huang, P. Torr, and S.-M. Hu.
Global contrast based salient region detection. IEEE TPAMI,
37(3):569–582, 2015. 3
[11] W. Einhauser, M. Spain, and P. Perona. Objects predict fixa-
tions better than early saliency. Journal of Vision, 8(14):18,
2008. 6
[12] M. Everingham, L. Van Gool, C. K. I. Williams, J. Winn, and
A. Zisserman. The PASCAL Visual Object Classes Chal-
lenge 2012 (VOC2012) Results. 2
[13] A. Garcia-Diaz, V. Lebor n, X. Fdez-Vidal, and X. Pardo. On
the relationship between optical variability, visual saliency,
and eye fixations: A computational approach. Journal of
Vision, 12(6), 2012. 3, 4, 7
[14] X. Glorot and Y. Bengio. Understanding the difficulty of
training deep feedforward neural networks. In International
conference on artificial intelligence and statistics, pages
249–256, 2010. 2
[15] J. Harel, C. Koch, and P. Perona. Graph-based visual
saliency. NIPS 2006, 19:545, 2007. 3
[16] X. Hou, J. Harel, and C. Koch. Image signature: High-
lighting sparse salient regions. IEEE TPAMI, 34(1):194–201,
2012. 3, 4, 7
[17] X. Hou and L. Zhang. Dynamic visual attention: Searching
for coding length increments. NIPS 2008, pages 681–688,
2009. 3, 4, 7
[18] L. Itti, C. Koch, and E. Niebur. A model of saliency-based
visual attention for rapid scene analysis. IEEE T PAMI,
20(11):1254–1259, 1998. 3
[19] M. Jiang et al. Salicon: Saliency in context. CVPR 2015,
pages 1072–1080, 2015. 1, 2, 3, 4, 7, 8
[20] T. Judd, K. Ehinger, F. Durand, and A. Torralba. Learning to
predict where humans look. In Computer Vision, 2009 IEEE
12th international conference on, pages 2106–2113. IEEE,
2009. 3, 4
[21] J. Li, M. D. Levine, X. An, X. Xu, and H. He. Visual saliency
based on scale-space analysis in the frequency domain. IEEE
TPAMI, 35(4):996–1010, 2013. 3, 4
[22] Y. Li, X. Hou, C. Koch, J. Rehg, and A. Yuille. The secrets
of salient object segmentation. CVPR 2014, pages 280–287,
2014. 2, 3, 4
[23] J. Long, E. Shelhamer, and T. Darrell. Fully convolutional
networks for semantic segmentation. In Proceedings of the
IEEE Conference on Computer Vision and Pattern Recogni-
tion, pages 3431–3440, 2015. 1, 2
[24] R. Margolin, A. Tal, and L. Zelnik-Manor. What makes a
patch distinct? CVPR 2013, pages 1139–1146, 2013. 3
[25] J. Najemnik and W. S. Geisler. Eye movement statistics in
humans are consistent with an optimal search strategy. Jour-
nal of Vision, 8(3):4, 2008. 7
[26] H. Noh, S. Hong, and B. Han. Learning deconvolu-
tion network for semantic segmentation. arXiv preprint
arXiv:1505.04366, 2015. 2, 6
[27] F. Perazzi, P. Krahenbuhl, Y. Pritch, and A. Hornung.
Saliency filters: Contrast based filtering for salient region
detection. CVPR 2012, pages 733–740, 2012. 3
[28] S. Rahman and N. Bruce. Saliency, scale and information:
Towards a unifying theory. In Advances in Neural Informa-
tion Processing Systems, pages 2179–2187, 2015. 7
[29] C. A. Rothkopf, D. H. Ballard, and M. M. Hayhoe. Task
and context determine where you look. Journal of vision,
7(14):16, 2007. 6
[30] D. Rudoy, D. B. Goldman, E. Shechtman, and L. Zelnik-
Manor. Crowdsourcing gaze data collection. Collective In-
telligence (CI), 2012. 2, 3, 8
[31] B. W. Tatler. The central fixation bias in scene viewing: Se-
lecting an optimal viewing position independently of motor
biases and image feature distributions. Journal of Vision,
7(14):4, 2007. 3
[32] B. W. Tatler. Current understanding of eye guidance. Visual
Cognition, 17(6-7):777–789, 2009. 6
[33] B. W. Tatler, R. J. Baddeley, and I. D. Gilchrist. Visual cor-
relates of fixation selection: effects of scale and time. Vision
Research, 45(5):643 – 659, 2005. 3
[34] A. Torralba, A. Oliva, M. S. Castelhano, and J. M. Hender-
son. Contextual guidance of eye movements and attention
in real-world scenes: the role of global features in object
search. Psychological review, 113(4):766, 2006. 7
[35] S. Ullman. Visual routines. Cognition, 18(1):97–159, 1984.
8
[36] P. Xu, K. A. Ehinger, Y. Zhang, A. Finkelstein, S. R.
Kulkarni, and J. Xiao. Turkergaze: Crowdsourcing
saliency with webcam based eye tracking. arXiv preprint
arXiv:1504.06755, 2015. 2, 3, 8
[37] L. Zhang, M. Tong, T. Marks, H. Shan, and G. Cottrell. Sun:
A bayesian framework for saliency using natural statistics.
Journal of Vision, 8(7), 2008. 3
524