Embed Size (px)
Citation preview

I S S U E S & A N S W E R S R E L 2 0 1 2 – N o . 1 2 7
At Pennsylvania State University
A descriptive analysis of enrollment and achievement among English language learner students in Pennsylvania
I S S U E S&ANSWERS R E L 2 0 12 – N o . 12 7
At Pennsylvania State University
A descriptive analysis of enrollment and achievement among English language
learner students in Pennsylvania
April 2012
Prepared by
Rosemarie O’Conner ICF International
Jamal Abedi University of California, Davis
Stephanie Tung ICF International

WA
OR
ID
MT
NV
CA
UT
AZ
WY
ND
SD
NE
KSCO
NM
TX
OK
CO
AR
LA
MS AL GA
SC
NC
VAWV
KY
TN
PA
NY
FL
AK
NJ
MN
WI
IA
IL IN
MI
OH
VT
NH
ME
MDDE
DCMO
At Pennsylvania State University
Issues and Answers is an ongoing series of reports from short-term Fast Response Projects conducted by the regional educational laboratories on education issues of importance at local, state, and regional levels. Fast Response Project topics change to reflect new issues, as identified through lab outreach and requests for assistance from policymakers and educa-tors at state and local levels and from communities, businesses, parents, families, and youth. All Issues and Answers reports meet Institute of Education Sciences standards for scientifically valid research.
April 2012
This report was prepared for the Institute of Education Sciences (IES) under Contract ED-06–CO-0029 by Regional Edu-cational Laboratory Mid-Atlantic administered by Pennsylvania State University. The content of the publication does not necessarily reflect the views or policies of IES or the U.S. Department of Education nor does mention of trade names, com-mercial products, or organizations imply endorsement by the U.S. Government.
This report is in the public domain. While permission to reprint this publication is not necessary, it should be cited as:
O’Conner, R., Abedi, J., and Tung, S. (2012). A descriptive analysis of enrollment and achievement among English language learner students in Pennsylvania. (Issues and Answers Report, REL 2012–No. 127). Washington, DC: U.S. Department of Education, Institute of Education Sciences, National Center for Education Evaluation and Regional Assistance, Regional Educational Laboratory Mid-Atlantic. Retrieved from http://ies.ed.gov/ncee/edlabs.
This report is available on the regional educational laboratory web site at http://ies.ed.gov/ncee/edlabs.

Summary
A descriptive analysis of enrollment and achievement among English language learner students in Pennsylvania
REL 2012–No. 127
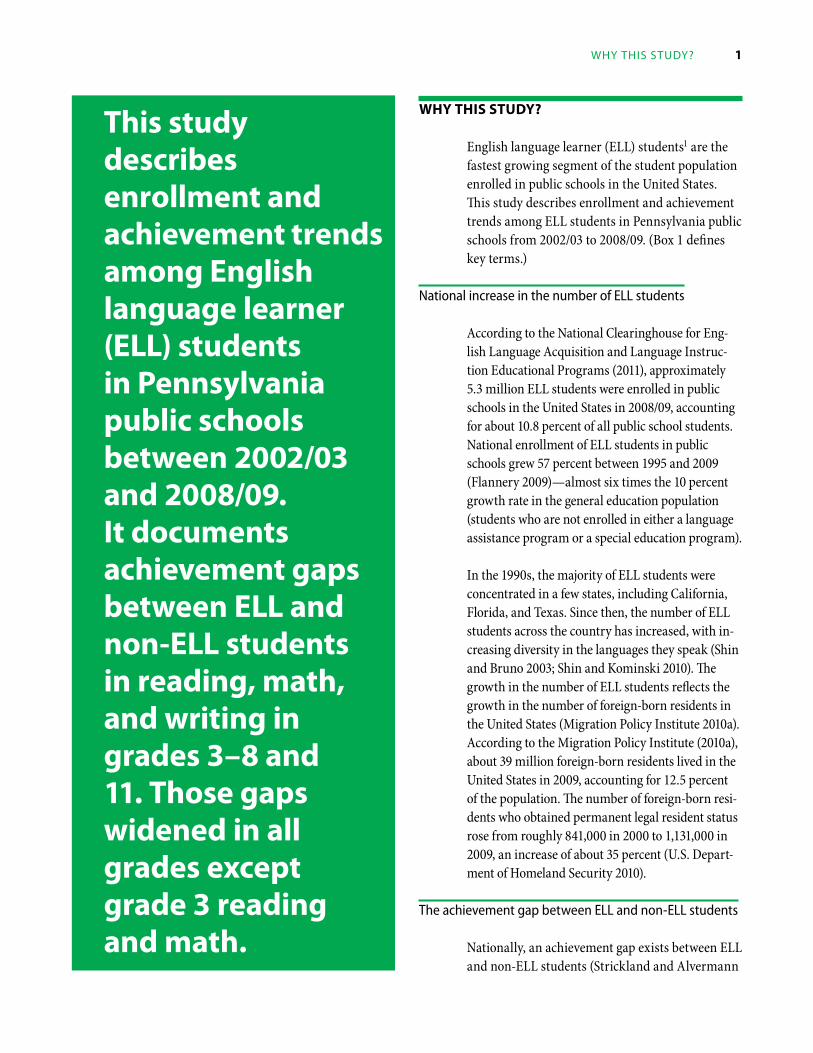
This study describes enrollment and achievement trends among English language learner (ELL) students in Penn-sylvania public schools between 2002/03 and 2008/09. It documents achievement gaps between ELL and non-ELL stu-dents in reading, math, and writing in grades 3–8 and 11. Those gaps widened in all grades except grade 3 reading and math.
English language learner (ELL) students are the fastest growing segment of the U.S. student population. According to the National Clearinghouse for English Language Acquisi-tion and Language Instruction Educational Programs (2011), approximately 5.3 million ELL students were enrolled in preK–12 in 2008/09, accounting for about 10.8 percent of public school students in the United States. National enrollment of ELL students in public schools grew 57 percent between 1995 and 2009 (Flannery 2009) — almost six times the 10 percent growth rate in the general educa-tion population (students who are not enrolled in a language assistance program or a special education program). In Pennsylvania, the number of ELL students has also been grow-ing, in conjunction with a rise in foreign-born residents in the state.1 In 2009, people born in other countries accounted for more than 5 per-cent of Pennsylvania’s population (Migration Policy Institute 2010b).
Nationally, an achievement gap exists between ELL and non-ELL students in all subject areas, particularly subjects with high lan-guage demands (Strickland and Alvermann 2004). On statewide assessments across the country, the percentage of students who achieve proficiency (as defined by each state) is 20–30 percentage points lower among ELL students than among non-ELL students (Abedi and Dietel 2004). The No Child Left Behind Act of 2001 requires states to imple-ment accountability systems to assess the achievement of all students, including stu-dents from traditionally underserved popula-tions such as ELL students. The goal is to have all students reach proficiency and to close the achievement gap by 2014 (No Child Left Behind Act of 2001).
This study describes ELL student enrollment and achievement trends in Pennsylvania pub-lic schools between 2002/03 and 2008/09. Two research questions guide this study:2
• How did the enrollment of ELL students in Pennsylvania public schools change between 2002/03 and 2008/09?
• How did performance (the percentage scoring at the proficient or advanced level) on state assessments in reading, math, and writing in grades 3–8 and 11 compare between ELL and non-ELL students in
iv Summary
Pennsylvania public schools from 2004/05 to 2008/09?
To report changes in ELL student enrollment and performance, the study uses enroll-ment and assessment data available through the Pennsylvania Department of Education website. The descriptive analyses of enrollment data track the number of ELL students state-wide. The analyses of performance data pres-ent the percentage of ELL and non-ELL stu-dents who scored at the proficient or advanced level in reading, math, and writing on the Pennsylvania System of School Assessment.3
The study’s main findings include:
On enrollment trends:
• Although Pennsylvania’s total student en-rollment fell 2.4 percent between 2002/03 and 2008/09, the enrollment of ELL students rose 24.7 percent. ELL student enrollment increased from 2.1 percent of the student population in 2002/03 to 2.7 percent in 2008/09.
• ELL students in Pennsylvania spoke 211 languages in 2008/09, up from 138 in 2002/03. In 2008/09, Spanish (spoken by 57.6 percent of ELL students in the state) had the most speakers, followed by English dialects4 (7.0 percent), Chinese (3.6 percent), Vietnamese (3.2 percent), Arabic (2.6 percent), and Russian (2.3 per-cent). ELL students speaking “other” languages (languages other than the 18 most common in the state) accounted for 12.2 percent of the ELL student population in 2008/09.
• Between 2002/03 and 2008/09, the number and percentage of ELL students speaking Spanish and English dialects increased, while the number and percentage of ELL students speaking Vietnamese, Russian, and “other” languages decreased. The number of ELL students speaking Chinese and Arabic increased, but the percentage decreased.
On achievement trends:
• Between 2004/05 and 2008/09, ELL stu-dents’ performance in reading increased 3.6–10.8 percentage points in grades 3, 4, and 8 but decreased 4.1–9.5 percentage points in grades 5, 6, 7, and 11.
• Between 2004/05 and 2008/09, ELL students’ performance in math increased 1.4–3.2 percentage points in grades 3, 4, 6, 7, and 8 but decreased 3.0–5.5 percentage points in grades 5 and 11.
• Between 2005/06 and 2008/09, ELL stu-dents’ performance in writing decreased 2.5–10.0 percentage points in all grades studied (grades 5, 8, and 11).
• In every year during the period studied, non-ELL students’ performance was 21–55 percentage points higher than that of ELL students in reading, math, and writing.
• In every year during the period studied, ELL and non-ELL students’ performance in reading was closer in grades 3–5 than in grades 6–8 and 11; ELL and non-ELL students’ performance in math and
Summary v
writing was closer in grades 3–5 and grade 11 than in grades 6–8.
• During the period studied, the overall achievement gap in reading, math, and writing between ELL and non-ELL stu-dents widened in all grades studied except grade 3, where the achievement gap nar-rowed in reading and math.
• During the period studied and in all grades studied, the average achievement gap between ELL and non-ELL students was narrower in math than in reading and writing. In all grades studied, the average achievement gap between ELL and non-ELL students was wider in reading than in writing.
• During the period studied, the average achievement gap in reading, writing, and math widened from elementary school (grades 3–5) to middle school (grades 6–8) and high school (grade 11), except in grade 11 math and writing.
April 2012
Notes
1. The Pennsylvania Department of Education (2010) defines an ELL student as “one who: (1) was not born in the United States or whose native language is other than English and comes from an environment where a language other than English is dominant; or (2) is a Native
American or Alaska Native who is a native resident of the outlying areas and comes from an environment where a language other than English has had a significant impact on (the student’s) level of English language proficiency; or (3) is migratory and whose native language is other than English and comes from an envi-ronment where a language other than English is dominant; and (1) has sufficient difficulty speaking, reading, writing or understanding the English language and (2) has difficulties that may deny (the student) the opportunity to learn successfully in classrooms where the language of instruction is English or to participate fully in our society.” (For definitions of key terms, see box 1 in the main report.)
2. This report is one in a series for jurisdictions in the Mid-Atlantic Region (which also includes Delaware, the District of Columbia, Maryland, and New Jersey). The findings are presented in separate reports because each jurisdiction has different ELL policies and definitions, and so it may be inappropriate to compare ELL student enrollment and achievement across jurisdictions. The available data also varied by jurisdiction.
3. Reading and math assessment results for grades 3, 5, 8, and 11 for 2004/05 and later are not comparable to those before 2004/05 because of new test blueprints, test items, assessment anchors, and item distribution; thus, 2004/05 was selected as the base year for the analyses of performance data. In 2005/06, the Pennsyl-vania Department of Education added reading and math assessments in grades 4, 6, and 7. The writing assessment was not administered in grades 5 and 8 until 2005/06. The focus, format, and scoring of the writing assessment for grade 11 changed in 2005/06.
4. English dialects are English, Barbados; English, Guyana; English, Jamaican; English, Trinidad; and Liberian English.
vi Table of conTenTS
tAblE of contEnts
Why this study? 1National increase in the number of ELL students 1The achievement gap between ELL and non-ELL students 1Legislation affecting the assessment of ELL students 3Regional need for this study 3Research questions 4
Trends in enrollment of ELL students 4
Trends in performance of ELL students 7Reading 7Math 11Writing 15Summary of achievement gaps across content areas 16
Study limitations 17
Conclusion 18
Appendix A Data and methodology 20
Appendix B Performance-level descriptions of the Pennsylvania System of School Assessment 22
Appendix C Score ranges of the Pennsylvania System of School Assessment 41
Appendix D Percentage of students scoring at the proficient or advanced level in Pennsylvania’s assessment program 42
Notes 46
References 47
Boxes
1 Key terms 2
2 Data sources 4
3 Pennsylvania assessment program 7
Figures
1 Percentage of students scoring at or above the proficient level on the 2009 National Assessment of Educational Progress, by grade, subject, and English language learner status 3
2 Percentage of students scoring at the proficient or advanced level on the grade 3 Pennsylvania System of School Assessment in reading, by English language learner status, 2004/05–2008/09 8
3 Percentage of students scoring at the proficient or advanced level on the grade 4 Pennsylvania System of School Assessment in reading, by English language learner status, 2005/06–2008/09 8
4 Percentage of students scoring at the proficient or advanced level on the grade 5 Pennsylvania System of School Assessment in reading, by English language learner status, 2004/05–2008/09 9

Table of conTenTS vii
5 Percentage of students scoring at the proficient or advanced level on the grade 6 Pennsylvania System of School Assessment in reading, by English language learner status, 2005/06–2008/09 9
6 Percentage of students scoring at the proficient or advanced level on the grade 7 Pennsylvania System of School Assessment in reading, by English language learner status, 2005/06–2008/09 9
7 Percentage of students scoring at the proficient or advanced level on the grade 8 Pennsylvania System of School Assessment in reading, by English language learner status, 2004/05–2008/09 10
8 Percentage of students scoring at the proficient or advanced level on the grade 11 Pennsylvania System of School Assessment in reading, by English language learner status, 2004/05–2008/09 10
9 Percentage of students scoring at the proficient or advanced levels on the grade 3 Pennsylvania System of School Assessment in math, by English language learner status, 2004/05−2008/09 11
10 Percentage of students scoring at the proficient or advanced level on the grade 4 Pennsylvania System of School Assessment in math, by English language learner status, 2005/06−2008/09 12
11 Percentage of students scoring at the proficient or advanced level on the grade 5 Pennsylvania System of School Assessment in math, by English language learner status, 2004/05−2008/09 12
12 Percentage of students scoring at the proficient or advanced level on the grade 6 Pennsylvania System of School Assessment in math, by English language learner status, 2005/06−2008/09 13
13 Percentage of students scoring at the proficient or advanced level on the grade 7 Pennsylvania System of School Assessment in math, by English language learner status, 2005/06−2008/09 13
14 Percentage of students scoring at the proficient or advanced level on the grade 8 Pennsylvania System of School Assessment in math, by English language learner status, 2004/05−2008/09 13
15 Percentage of students scoring at the proficient or advanced level on the grade 11 Pennsylvania System of School Assessment in math, by English language learner status, 2004/05−2008/09 14
16 Percentage of students scoring at the proficient or advanced level on the grade 5 Pennsylvania System of School Assessment in writing, by English language learner status, 2005/06−2008/09 15
17 Percentage of students scoring at the proficient or advanced level on the grade 8 Pennsylvania System of School Assessment in writing, by English language learner status, 2005/06−2008/09 15
18 Percentage of students scoring at the proficient or advanced level on the grade 11 Pennsylvania System of School Assessment in writing, by English language learner status, 2005/06−2008/09 16
Tables
1 Total and ELL student enrollment in Pennsylvania public schools, 2002/03–2008/09 5
2 Number of native languages spoken by ELL students in Pennsylvania public schools, 2002/03–2008/09 5
3 Number and percentage of ELL students in Pennsylvania public schools, by native language, 2002/03–2008/09 6
4 Achievement gap in reading on the Pennsylvania System of School Assessment between ELL and non-ELL students, by grade, 2004/05–2008/09 11
5 Achievement gap in math on the Pennsylvania System of School Assessment between ELL and non-ELL students, by grade, 2004/05−2008/09 14
viii Table of conTenTS
6 Achievement gap in writing on the Pennsylvania System of School Assessment between ELL and non-ELL students, by grade, 2005/06–2008/09 16
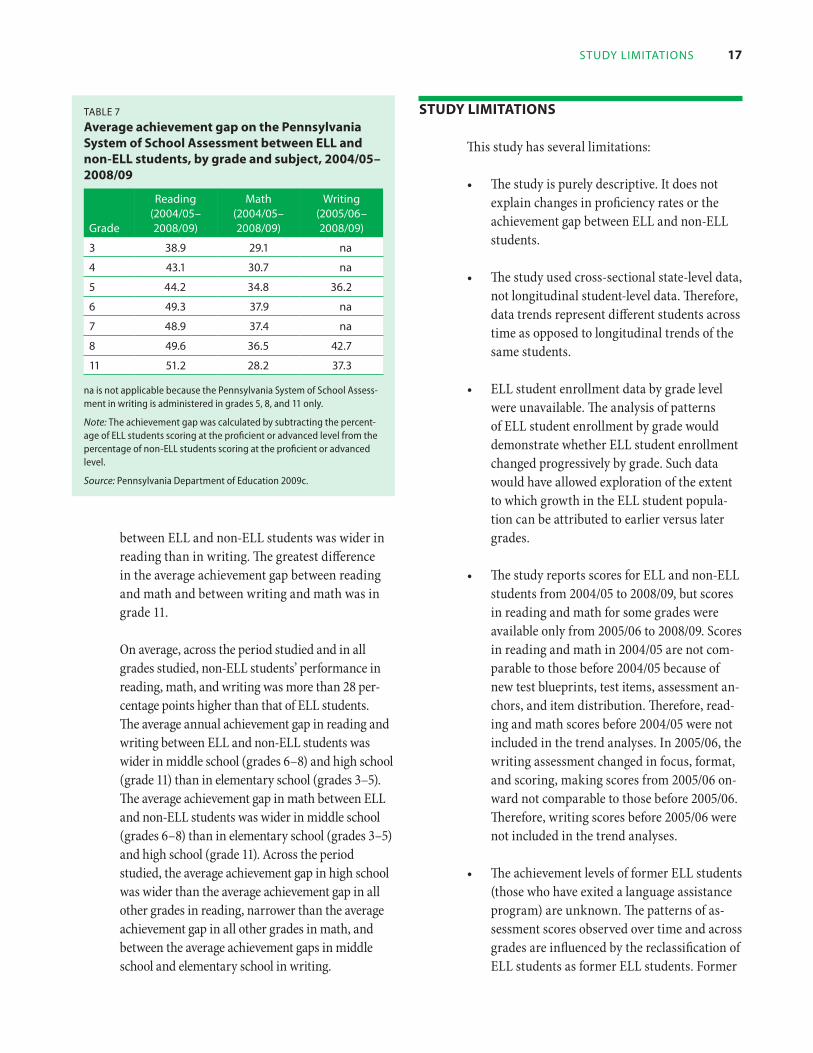
7 Average achievement gap on the Pennsylvania System of School Assessment between ELL and non-ELL students, by grade and subject, 2004/05–2008/09 17
B1 Performance-level descriptors for the Pennsylvania System of School Assessment, reading, by grade 22
B2 Performance-level descriptors for the Pennsylvania System of School Assessment, math, by grade 29
B3 Performance-level descriptors for the Pennsylvania System of School Assessment, writing, by grade 37
C1 Pennsylvania System of School Assessment reading score ranges, by grade 41
C2 Pennsylvania System of School Assessment math score ranges, by grade 41
C3 Pennsylvania System of School Assessment writing score ranges, by grade 41
D1 Percentage of students scoring at the proficient or advanced level on the grade 3 Pennsylvania System of School Assessment, by subject and English language learner status, 2004/05–2008/09 42
D2 Percentage of students scoring at the proficient or advanced level on the grade 4 Pennsylvania System of School Assessment, by subject and English language learner status, 2005/06–2008/09 42
D3 Percentage of students scoring at the proficient or advanced level on the grade 5 Pennsylvania System of School Assessment, by subject and English language learner status, 2004/05–2008/09 43
D4 Percentage of students scoring at the proficient or advanced level on the grade 6 Pennsylvania System of School Assessment, by subject and English language learner status, 2005/06–2008/09 43
D5 Percentage of students scoring at the proficient or advanced levels on the grade 7 Pennsylvania System of School Assessment, by subject and English language learner status, 2005/06–2008/09 44
D6 Percentage of students scoring at the proficient or advanced level on the grade 8 Pennsylvania System of School Assessment, by subject and English language learner status, 2004/05–2008/09 44
D7 Percentage of students scoring at the proficient or advanced level on the grade 11 Pennsylvania System of School Assessment, by subject and English language learner status, 2004/05–2008/09 45
Why ThiS STudy? 1
this study describes enrollment and achievement trends among English language learner (Ell) students in Pennsylvania public schools between 2002/03 and 2008/09. it documents achievement gaps between Ell and non-Ell students in reading, math, and writing in grades 3–8 and 11. those gaps widened in all grades except grade 3 reading and math.
Why this study?
English language learner (ELL) students1 are the fastest growing segment of the student population enrolled in public schools in the United States. This study describes enrollment and achievement trends among ELL students in Pennsylvania public schools from 2002/03 to 2008/09. (Box 1 defines key terms.)
National increase in the number of ELL students
According to the National Clearinghouse for Eng-lish Language Acquisition and Language Instruc-tion Educational Programs (2011), approximately 5.3 million ELL students were enrolled in public schools in the United States in 2008/09, accounting for about 10.8 percent of all public school students. National enrollment of ELL students in public schools grew 57 percent between 1995 and 2009 (Flannery 2009) — almost six times the 10 percent growth rate in the general education population (students who are not enrolled in either a language assistance program or a special education program).
In the 1990s, the majority of ELL students were concentrated in a few states, including California, Florida, and Texas. Since then, the number of ELL students across the country has increased, with in-creasing diversity in the languages they speak (Shin and Bruno 2003; Shin and Kominski 2010). The growth in the number of ELL students reflects the growth in the number of foreign-born residents in the United States (Migration Policy Institute 2010a). According to the Migration Policy Institute (2010a), about 39 million foreign-born residents lived in the United States in 2009, accounting for 12.5 percent of the population. The number of foreign-born resi-dents who obtained permanent legal resident status rose from roughly 841,000 in 2000 to 1,131,000 in 2009, an increase of about 35 percent (U.S. Depart-ment of Homeland Security 2010).
The achievement gap between ELL and non-ELL students
Nationally, an achievement gap exists between ELL and non-ELL students (Strickland and Alvermann
2 enrollmenT and achievemenT among limiTed engliSh proficienT STudenTS in pennSylvania
box 1
Key terms
Achievement gap. The difference between how well students from mi-nority subgroups, including English language learner (ELL) students and low-income households, perform on standardized tests as compared with their peers (No Child Left Behind Glossary 2001). In this report, the achievement gap in reading, math, and writing for each year is calcu-lated for each grade level by subtract-ing the percentage of ELL students at a specific grade level who scored pro-ficient or advanced on a state assess-ment from the percentage of non-ELL students at the same grade level who scored proficient or advanced on the same assessment.
English language learner (ELL) students. According to the Penn-sylvania Department of Education
(2010c), an ELL student: “(1) was not born in the United States or whose native language is other than English and comes from an environ-ment where a language other than English is dominant; or (2) is a Na-tive American or Alaska Native who is a native resident of the outlying areas and comes from an environ-ment where a language other than English has had a significant impact on (the student’s) level of English language proficiency; or (3) is migra-tory and whose native language is other than English and comes from an environment where a language other than English is dominant; and (1) has sufficient difficulty speaking, reading, writing or understanding the English language and (2) has dif-ficulties that may deny (the student) the opportunity to learn successfully in classrooms where the language of instruction is English or to partici-pate fully in our society.”
Foreign born. Anyone residing in the United States who was not a U.S. citizen at birth, including naturalized citizens, lawful permanent residents, certain legal nonimmigrants (for example, people on student or work visas), people admitted under refugee or asylee status, and people illegally residing in the United States (Migra-tion Policy Institute 2010a).
Non–English language learner (non-ELL) students. Native speakers of English, those who speak a language other than English at home but are identified as initially fluent speakers of English, and those who were ELL students but have been reclassified as fluent English proficient (Abedi 2004).
Performance. In this study, a term used as shorthand for the percentage of students scoring at the proficient or advanced level on the Pennsylva-nia System of School Assessment.
Alvermann 2004). On state assessments, the percentage of students who achieve proficiency (as defined by each state) is 20–30 percentage points lower among ELL students than among non-ELL students (Abedi and Dietel 2004). Studies using nationally representative assessment data clearly and consistently show a large achievement gap between ELL and non-ELL students in all subject areas (Abedi and Gándara 2006; Solano-Flores and Trumbull 2003; Wolf et al. 2008).
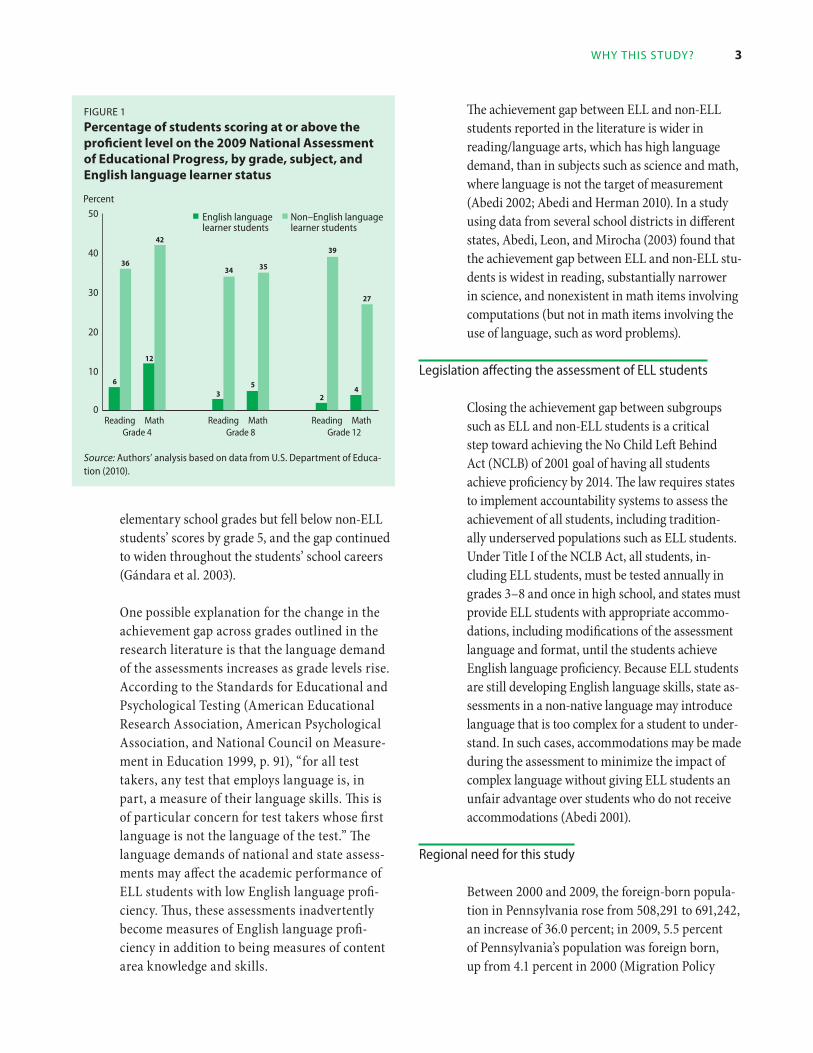
Recent scores on the National Assessment of Edu-cational Progress (NAEP) illustrate the achieve-ment gap between ELL and non-ELL students in reading and math at all grades tested (figure 1; U.S. Department of Education 2010). On the 2009 NAEP reading assessment, the achievement gap between ELL and non-ELL students was 30 per-centage points in grade 4, 31 percentage points in grade 8, and 37 percentage points in grade 12. On
the 2009 NAEP math assessment, the achievement gap was 30 percentage points in grades 4 and 8 and 23 percentage points in grade 12.
Other studies have illustrated the widening achievement gap in reading/language arts and math between ELL and non-ELL students at higher grades. National studies using 2005 NAEP math data (Fry 2007) and Stanford 9 reading data (Abedi 2002) found wider gaps between ELL and non-ELL students in middle and high school than in elementary school. State data yielded similar results: 2001 Stanford 9 reading data for Califor-nia (Gándara et al. 2003) and 2010 New England Common Assessment Program reading data for Rhode Island (Rhode Island KIDS COUNT 2011). A state-level cohort analysis of a group of Califor-nia students from 1998 to 2001 found that ELL students’ assessment scores tended to be com-parable to non-ELL students’ scores in the early
Why ThiS STudy? 3
figure 1 Percentage of students scoring at or above the proficient level on the 2009 national Assessment of Educational Progress, by grade, subject, and English language learner status
0
10
20
30
40
50
MathReadingMathReadingMathReading
Percent
LEP Non-LEP
Grade 12Grade 8Grade 4
42
53
12
6
27
39
3534
42
36
English language Non–English languagelearner students learner students
Source: Authors’ analysis based on data from U.S. Department of Educa-tion (2010).
elementary school grades but fell below non-ELL students’ scores by grade 5, and the gap continued to widen throughout the students’ school careers (Gándara et al. 2003).
One possible explanation for the change in the achievement gap across grades outlined in the research literature is that the language demand of the assessments increases as grade levels rise. According to the Standards for Educational and Psychological Testing (American Educational Research Association, American Psychological Association, and National Council on Measure-ment in Education 1999, p. 91), “for all test takers, any test that employs language is, in part, a measure of their language skills. This is of particular concern for test takers whose first language is not the language of the test.” The language demands of national and state assess-ments may affect the academic performance of ELL students with low English language profi-ciency. Thus, these assessments inadvertently become measures of English language profi-ciency in addition to being measures of content area knowledge and skills.
The achievement gap between ELL and non-ELL students reported in the literature is wider in reading/language arts, which has high language demand, than in subjects such as science and math, where language is not the target of measurement (Abedi 2002; Abedi and Herman 2010). In a study using data from several school districts in different states, Abedi, Leon, and Mirocha (2003) found that the achievement gap between ELL and non-ELL stu-dents is widest in reading, substantially narrower in science, and nonexistent in math items involving computations (but not in math items involving the use of language, such as word problems).
Legislation affecting the assessment of ELL students
Closing the achievement gap between subgroups such as ELL and non-ELL students is a critical step toward achieving the No Child Left Behind Act (NCLB) of 2001 goal of having all students achieve proficiency by 2014. The law requires states to implement accountability systems to assess the achievement of all students, including tradition-ally underserved populations such as ELL students. Under Title I of the NCLB Act, all students, in-cluding ELL students, must be tested annually in grades 3–8 and once in high school, and states must provide ELL students with appropriate accommo-dations, including modifications of the assessment language and format, until the students achieve English language proficiency. Because ELL students are still developing English language skills, state as-sessments in a non-native language may introduce language that is too complex for a student to under-stand. In such cases, accommodations may be made during the assessment to minimize the impact of complex language without giving ELL students an unfair advantage over students who do not receive accommodations (Abedi 2001).
Regional need for this study
Between 2000 and 2009, the foreign-born popula-tion in Pennsylvania rose from 508,291 to 691,242, an increase of 36.0 percent; in 2009, 5.5 percent of Pennsylvania’s population was foreign born, up from 4.1 percent in 2000 (Migration Policy
4 enrollmenT and achievemenT among limiTed engliSh proficienT STudenTS in pennSylvania
Institute 2010b). The number of foreign-born residents who obtained permanent legal resident status in Pennsylvania also rose—from 17,970 in 2000 to 24,105 in 2009, an increase of 34.1 percent (U.S. Department of Homeland Security 2010).
In 2009, the Pennsylvania Department of Educa-tion made a request to Regional Educational Labo-ratory (REL) Mid-Atlantic for a “comprehensive de-mographic analysis of the state’s ELL population,” including “typical growth trends for this group by language, etc.”2 Also requested was “an analysis of various achievement indicators for ELL students.”
Research questions
This study addresses two research questions:
• How did the enrollment of ELL students in Pennsylvania public schools change between 2002/03 and 2008/09?
• How did performance (the percentage scoring at the proficient or advanced level) on state assessments in reading, math, and writing in grades 3–8 and 11 compare between ELL and non-ELL students in Pennsylvania public schools from 2004/05 to 2008/09?
The study data are described in box 2 and in greater detail in appendix A.
trEnds in EnrollmEnt of Ell studEnts
The number of ELL students in Pennsylvania increased 24.7 percent between 2002/03 and 2008/09, but the changes were not consistent over time (table 1). ELL student enrollment increased steadily from 2002/03 to 2005/06, decreased from 2005/06 to 2006/07, and increased again from 2006/07 to 2008/09.3 The percentage of ELL students in the total student population increased
box 2
Data sources
This study draws from student enroll-ment and assessment data in Penn-sylvania. Both sets of data include all public school students in Pennsylva-nia in grades K–12 (regular and char-ter schools); students from nonpublic private or parochial schools are not included.
Enrollment data are from the Penn-sylvania Department of Education (2007, 2008, 2009a, 2009b). These data were used to track total enroll-ment and English language learner (ELL) student enrollment and to identify the languages spoken by the highest number of ELL students. ELL student enrollment by grade level was not available through the state website and is not examined. The 2002/03 school year was selected as the base year because that was the
first year that states were required to disaggregate and report data on tra-ditionally underserved populations under the No Child Left Behind Act of 2001. The 2008/09 school year was the most recent year for which data were available.
State assessment data were used to track the performance of ELL and non-ELL students on statewide reading, math, and writing assess-ments over time. These data —f rom the Pennsylvania System of School Assessment (PSSA)—show changes in achievement among both groups of students. The authors computed the non-ELL performance using ELL and total student assessment data. The number of non-ELL students who scored at the proficient or advanced level was computed by subtracting the number of ELL students who scored at the proficient or advanced level from the total number of
students who scored at the proficient or advanced level.
The PSSA reading and math data for grades 3, 5, 8, and 11 span 2004/05–2008/09, and the PSSA reading and math data for grades 4, 6, and 7 span 2005/06–2008/09. Reading and math results for grades 3, 5, 8, and 11 for 2004/05 and later are not comparable to those before 2004/05 because of new test blueprints, test items, assess-ment anchors, and item distribution; thus, 2004/05 was selected as the base year for the analyses of achievement data. In 2005/06, the Pennsylvania Department of Education added reading and math assessments in grades 4, 6, and 7. The PSSA writ-ing data span 2005/06–2008/09. The writing assessment was first admin-istered in grades 5 and 8 in 2005/06. The focus, format, and scoring of the writing assessment for grade 11 changed in 2005/06.

TrendS in enrollmenT of ell STudenTS 5
Table 1
total and Ell student enrollment in Pennsylvania public schools, 2002/03–2008/09
Total enrollment ell student enrollment
year
percent change from the
previous yearnumber number
percent changefrom the
previous yearpercent of total
enrollment
2002/03 1,816,747 na 38,288 na 2.1
2003/04 1,821,146 0.2 41,612 8.7 2.3
2004/05 1,820,935 < –0.1 42,802 2.9 2.4
2005/06 1,821,894 0.1 45,993 7.5 2.5
2006/07 1,810,430 –0.6 45,307 –1.5 2.5
2007/08 1,789,270 –1.2 46,793 3.3 2.6
2008/09 1,773,062 –0.9 47,726 2.0 2.7
na is not applicable
Source: Pennsylvania Department of Education 2007, 2008, 2009a, 2009b.
steadily from 2.1 percent in 2002/03 to 2.7 percent in 2008/09. Total student enrollment increased 0.3 percent from 2002/03 to 2005/06 and de-creased 2.7 percent from 2005/06 to 2008/09, for a net decrease of 2.4 percent between 2002/03 and 2008/09.
The number of languages spoken by ELL students increased by 73, from 138 in 2002/03 to 211 in 2008/09, with the largest increases from 2002/03 to 2003/04 (19.6 percent) and from 2006/07 to 2007/08 (11.0 percent; table 2).4
Table 2
number of native languages spoken by Ell students in Pennsylvania public schools, 2002/03–2008/09
yearnumber of languages
percent change from the previous year
2002/03 138 na
2003/04 165 19.6
2004/05 175 6.1
2005/06 172 –1.7
2006/07 182 5.8
2007/08 202 11.0
2008/09 211 4.5
na is not applicable
Source: Pennsylvania Department of Education 2007, 2008, 2009b.
In 2008/09, Spanish speakers accounted for the largest percentage of ELL students (57.6 per-cent), followed by speakers of “other” languages (12.2 percent), English dialects (7.0 percent), Chinese (3.6 percent), Vietnamese (3.2 percent), Arabic (2.6 percent), and Russian (2.3 percent; table 3).
The number and percentage of ELL students speaking each language fluctuated over 2002/03–2008/09. The number and percentage of ELL students speaking Spanish, English dialects, Creoles and Pidgins, Gujarati, French, Turkish, and Malayalam increased between 2002/03 and 2008/09, but the changes were not consistent over time. From 2002/03 to 2008/09, the year-to-year change in the number of ELL students speaking Spanish ranged from an increase of 2,702 stu-dents (2002/03 to 2003/04) to a decrease of 1,051 students (2006/07 to 2007/08). From 2002/03 to 2008/09, the year-to-year change in the number of students speaking English dialects ranged from an increase of 3,048 students (2006/07 to 2007/08) to a decrease of 664 students (2007/08 to 2008/09).5
Between 2002/03 and 2008/09, the number and percentage of ELL students speaking Vietnamese, Russian, Cambodian (Khmer), Korean, Albanian, Ukrainian, and “other” languages decreased, but

6 enrollmenT and achievemenT among limiTed engliSh proficienT STudenTS in pennSylvania
Table 3
number and percentage of Ell students in Pennsylvania public schools, by native language, 2002/03–2008/09
2002/03 2003/04 2004/05 2005/06 2006/07 2007/08 2008/09
Percent of the total number
of ELL students
Percent of the total number
of ELL students
Percent of the total number
of ELL students
Percent of the total number
of ELL students
Percent of the total number
of ELL students
Percent of the total number
of ELL students
Percent of the total number
of ELL students
Number of ELL
students
Number of ELL
students
Number of ELL
students
Number of ELL
students
Number of ELL
students
Number of ELL
students
Number of ELL
studentsnative language
Spanish 21,208 55.4 23,910 57.5 25,478 59.5 27,683 60.2 27,731 61.2 26,680 57.0 27,509 57.6
english dialectsa 205 0.5 692 1.7 390 0.9 414 0.9 959 2.1 4,007 8.6 3,343 7.0
chineseb 1,507 3.9 1,553 3.7 1,994 4.7 1,749 3.8 1,503 3.3 1,348 2.9 1,703 3.6
vietnamese 1,708 4.5 1,700 4.1 1,640 3.8 1,710 3.7 1,009 2.2 1,490 3.2 1,544 3.2
arabic 1,031 2.7 1,144 2.7 1,088 2.5 1,195 2.6 1,156 2.6 1,087 2.3 1,239 2.6
russian 1,295 3.4 1,323 3.2 1,495 3.5 1,585 3.4 1,330 2.9 1,140 2.4 1,097 2.3
creoles and pidginsc 379 1.0 493 1.2 563 1.3 583 1.3 640 1.4 661 1.4 808 1.7
cambodian (Khmer) 1,071 2.8 1,144 2.7 918 2.1 934 2.0 883 1.9 715 1.5 766 1.6
Korean 1,118 2.9 1,087 2.6 1,150 2.7 1,142 2.5 969 2.1 822 1.8 753 1.6
gujarati (india) 406 1.1 431 1.0 418 1.0 502 1.1 565 1.2 519 1.1 609 1.3
french 307 0.8 374 0.9 400 0.9 486 1.1 474 1.0 473 1.0 568 1.2
urdu 255 0.7 290 0.7 321 0.7 296 0.6 324 0.7 304 0.6 340 0.7
albanian 429 1.1 443 1.1 452 1.1 423 0.9 383 0.8 355 0.8 311 0.7
ukrainian 377 1.0 450 1.1 416 1.0 445 1.0 1,021 2.3 324 0.7 305 0.6
bengali 234 0.6 189 0.5 117 0.3 145 0.3 155 0.3 263 0.6 283 0.6
portuguese 234 0.6 263 0.6 290 0.7 323 0.7 305 0.7 271 0.6 259 0.5
Turkish 127 0.3 120 0.3 172 0.4 220 0.5 277 0.6 245 0.5 258 0.5
malayalam 112 0.3 189 0.5 204 0.5 264 0.6 260 0.6 223 0.5 224 0.5
other 6,285 16.5 5,817 14.0 5,296 12.3 5,894 12.8 5,363 11.8 5,866 12.5 5,807 12.2
Total number of ell students 38,288 41,612 42,802 45,993 45,307 46,793 47,726
ELL is English language learner.
Note: Components may not sum to 100 percent because of rounding.
a. Includes English (Barbados), English (Guyana), English (Jamaican), English (Trinidad), and Liberian English.
b. Includes Chinese Mandarin, Hakka, Yue/Cantonese, and Minnan Fukiene.
c. Includes Haitian Creole, Jamaican Creole, Creole and Pidgin English-based, French-based, Portuguese-based, and other languages.
Source: Pennsylvania Department of Education 2007, 2008, 2009b.
the changes were not consistent over time. The number of ELL students speaking Chinese, Arabic, Portuguese, Urdu, and Bengali increased from 2002/03 to 2008/09, but the percentage of ELL
students speaking Chinese, Arabic, and Portu-guese in total ELL student enrollment decreased, while the percentage of ELL students speaking Urdu and Bengali did not change.
TrendS in performance of ell STudenTS 7
trEnds in PErformAncE of Ell studEnts
Under Title I of the NCLB Act, all students, includ-ing ELL students, are required to participate in their state’s annual standards-based assessment program in reading/language arts, math, and as of 2008, science.6
The following sections compare the performance (the percentage scoring at the proficient or advanced level) of ELL and non-ELL students on the Pennsylvania System of School Assessment (PSSA; the Pennsylvania assessment program is described in box 3). The percentage of students
who scored at the proficient or advanced level on each assessment from 2004/05 to 2008/09 is listed in appendix D.
Reading
Grade 3. Between 2004/05 and 2008/09, ELL stu-dents’ performance on the grade 3 reading assess-ment increased 14.6 percentage points, whereas non-ELL students’ performance increased 8.9 per-centage points (figure 2). As a result, the achieve-ment gap between ELL and non-ELL students nar-rowed 5.7 percentage points, from 41.2 percentage points in 2004/05 to 35.5 in 2008/09.
box 3
Pennsylvania assessment program
The Pennsylvania System of School Assessment (PSSA) measures academic achievement in reading and math in grades 3–8 and 11,1 in writing in grades 5, 8, and 11, and in science in grades 4, 8, and 11.2 For each assessment, scores in each content area are reported as scale scores (raw scores converted to a common scale that allows numerical comparison of test results over time). The proficiency levels associated with score ranges are:
• Below basic — indicates little understanding and minimal dis-play of the skills included in the Pennsylvania Academic Content Standards.
• Basic — indicates a partial under-standing and limited display of the skills included in the Pennsyl-vania Academic Content Stan-dards. This work is approaching satisfactory performance but does not reach it.
• Proficient — indicates a solid understanding and adequate dis-play of the skills included in the Pennsylvania Academic Content Standards.
• Advanced — indicates an in-depth understanding and exemplary display of the skills included in the Pennsylvania Academic Content Standards (Pennsylvania Department of Education 2011).
Scores at the below basic and basic levels are considered below the state minimum of proficiency and indicate a need for additional instructional support. Complete state definitions of the proficiency levels for each assess-ment are in appendix B, and the score ranges for each proficiency level are in appendix C.
All students in Pennsylvania must take all four tests of the PSSA. The only exception is for English language learner (ELL) students who are in their first year in a U.S. school; they do not have to take the reading and writing tests, but they
must take the math and science tests, with accommodations as appropriate.
For all assessments, ELL students are permitted to have setting accommoda-tions (for example, taking the test in a location separate from peers) and timing accommodations (for example, additional time to complete the test). Three types of accommodations are permitted for the math and science tests only: word-to word translation dictionaries, without definitions and without pictures; qualified interpret-ers or sight translators; and Spanish/English bilingual versions of the tests.3
Notes1. The Pennsylvania Department of Educa-
tion added reading and math assessments in grades 4, 6, and 7 to the required as-sessments in 2005/06.
2. The science assessment was introduced in 2007/08 and is not described in this report.
3. Spanish/English bilingual versions of the math and science tests contain directions and questions in both languages. When the test booklet is open, one page has the directions and questions in Spanish, and the facing page has the same directions and questions in English.

8 enrollmenT and achievemenT among limiTed engliSh proficienT STudenTS in pennSylvania
figure 2 Percentage of students scoring at the proficient or advanced level on the grade 3 Pennsylvania system of school Assessment in reading, by English language learner status, 2004/05–2008/09
0
25
50
75
100
2008/092007/082006/072005/062004/05
Percent
42.639.5
35.4
29.028.0
78.177.973.8
70.269.2
English language learner students
Non–English language learner students
Note: For non–English language learner students, n = 122,586 in 2004/05, n = 120,994 in 2005/06, n = 121,935 in 2006/07, n = 122,897 in 2007/08, and n = 123,124 in 2008/09. For English language learner stu-dents, n = 3,575 in 2004/05, n = 3,668 in 2005/06, n = 3,409 in 2006/07, n = 3,498 in 2007/08, and n = 4,030 in 2008/09.
Source: Pennsylvania Department of Education 2009c.
figure 3 Percentage of students scoring at the proficient or advanced level on the grade 4 Pennsylvania system of school Assessment in reading, by English language learner status, 2005/06–2008/09
0
25
50
75
100
2008/092007/082006/072005/06
Percent
29.728.228.726.1
73.771.171.269.2
English language learner students
Non–English language learner students
Note: The grade 4 reading assessment was first administered in 2005/06. For non–English language learner students, n = 124,509 in 2005/06, n = 122,820 in 2006/07, n = 123,299 in 2007/08, and n = 124,317 in 2008/09. For English language learner students, n = 3,171 in 2005/06, n = 3,161 in 2006/07, n = 2,981 in 2007/08, and n = 3,202 in 2008/09.
Source: Pennsylvania Department of Education 2009c.
Grade 4. Between 2005/06 and 2008/09, ELL and non-ELL students’ performance on the grade 4 reading assessment followed a similar trend (figure 3). ELL students’ performance increased 2.6 percentage points from 2005/06 to 2006/07, decreased 0.5 percentage point from 2006/07 to 2007/09, and increased 1.5 percentage points from 2007/08 to 2008/09, for a net increase of 3.6 per-centage points. Non-ELL students’ performance increased 2.0 percentage points from 2005/06 to 2006/07, decreased 0.1 percentage point from 2006/07 to 2007/08, and increased 2.6 percentage points from 2007/08 to 2008/09, for a net increase of 4.5 percentage points. As a result, the achieve-ment gap between ELL and non-ELL students widened 0.9 percentage point, from 43.1 percent-age points in 2005/06 to 44.0 in 2008/09.
Grade 5. ELL students’ and non-ELL students’ performance on the grade 5 reading assess-ment followed a similar downward trend from 2004/05 to 2006/07 then diverged from 2006/07 to 2008/09 (figure 4). ELL students’ performance
decreased 9.5 percentage points between 2004/05 and 2008/09, whereas non-ELL students’ perfor-mance decreased 4.1 percentage points between 2004/05 and 2006/07 but increased 4.7 percent-age points between 2006/07 and 2008/09, for a net increase of 0.6 percentage point. As a result, the achievement gap between ELL and non-ELL students widened 10.1 percentage points, from 40.1 percentage points in 2004/05 to 50.2 in 2008/09.
Grade 6. ELL students’ performance on the grade 6 reading assessment decreased from 2005/06 to 2008/09, whereas non-ELL students’ performance decreased from 2005/06 to 2006/07 but increased from 2006/07 to 2008/09 (figure 5). Between 2005/06 and 2008/09, ELL students’ performance decreased 8.2 percentage points, whereas non-ELL students’ performance increased 1.9 percentage points. As a result, the achievement gap between ELL and non-ELL students widened 10.1 percent-age points, from 44.9 percentage points in 2005/06 to 55.0 in 2008/09.

TrendS in performance of ell STudenTS 9
figure 4
Percentage of students scoring at the proficient or advanced level on the grade 5 Pennsylvania system of school Assessment in reading, by English language learner status, 2004/05–2008/09
0
25
50
75
100
2008/092007/082006/072005/062004/05
Percent
15.416.921.5
24.9
15.8
65.662.660.961.5
65.0
English language learner students
Non–English language learner students
Note: For non–English language learner students, n = 131,376 in 2004/05, n = 128,627 in 2005/06, n = 126,860 in 2006/07, n = 124,459 in 2007/08, and n = 124,575 in 2008/09. For English language learner stu-dents, n = 2,766 in 2004/05, n = 2,861 in 2005/06, n = 2,733 in 2006/07, n = 2,752 in 2007/08, and n = 2,855 in 2008/09.
Source: Pennsylvania Department of Education 2009c.
Grade 7. ELL students’ performance on the grade 7 reading assessment decreased 1.0 percentage point from 2005/06 to 2006/07, increased by less than 1 percentage point from 2006/07 to 2007/08, and decreased 3.7 percentage points from 2007/08 to 2008/09, for a net decrease of 4.1 percentage points between 2005/06 and 2008/09 (figure 6). Non-ELL students’ performance decreased 1.3 percentage points from 2005/06 to 2006/07 and increased 4.8 percentage points from 2006/07 to 2008/09, for a net increase of 3.5 percentage points between 2005/06 and 2008/09. As a result, the achievement gap between ELL and non-ELL students widened 7.6 percentage points, from 46.5 percentage points in 2005/06 to 54.1 in 2008/09.
Grade 8. Between 2004/05 and 2008/09, ELL students’ performance on the grade 8 reading assessment increased 10.8 percentage points, whereas non-ELL students’ performance in-creased 16.5 percentage points (figure 7). As a result, the achievement gap between ELL and non-ELL students widened 5.7 percentage points,
figure 5
Percentage of students scoring at the proficient or advanced level on the grade 6 Pennsylvania system of school Assessment in reading, by English language learner status, 2005/06–2008/09
0
25
50
75
100
2008/092007/082006/072005/06
Percent
13.717.6
21.917.1
68.767.864.3
66.8
English language learner students
Non–English language learner students
Note: The grade 6 reading assessment was first administered in 2005/06. For non–English language learner students, n = 133,324 in 2005/06, n = 131,128 in 2006/07, n = 128,344 in 2007/08, and n = 125,677 in 2008/09. For English language learner students, n = 2,590 in 2005/06, n = 2,271 in 2006/07, n = 2,362 in 2007/08, and n = 2,607 in 2008/09.
Source: Pennsylvania Department of Education 2009c.
figure 6
Percentage of students scoring at the proficient or advanced level on the grade 7 Pennsylvania system of school Assessment in reading, by English language learner status, 2005/06–2008/09
0
25
50
75
100
2008/092007/082006/072005/06
Percent
18.321.422.4 22.0
72.470.867.668.9
English language learner students
Non–English language learner students
Note: The grade 7 reading assessment was first administered in 2005/06. For non–English language learner students, n = 138,651 in 2005/06, n = 136,356 in 2006/07, n = 133,541 in 2007/08, and n = 130,224 in 2008/09. For English language learner students, n = 2,361 in 2005/06, n = 2,254 in 2006/07, n = 2,128 in 2007/08, and n = 2,417 in 2008/09.
Source: Pennsylvania Department of Education 2009c.
10 enrollmenT and achievemenT among limiTed engliSh proficienT STudenTS in pennSylvania
figure 7 Percentage of students scoring at the proficient or advanced level on the grade 8 Pennsylvania system of school Assessment in reading, by English language learner status, 2004/05–2008/09
0
25
50
75
100
2008/092007/082006/072005/062004/05
Percent
29.229.3
23.423.818.4
81.379.075.8
71.3
64.8
English language learner students
Non–English language learner students
Note: For non–English language learner students, n = 143,664 in 2004/05, n = 141,211 in 2005/06, n = 139,058 in 2006/07, n = 136,343 in 2007/08, and n = 133,561 in 2008/09. For English language learner stu-dents, n = 2,088 in 2004/05, n = 2,190 in 2005/06, n = 2,135 in 2006/07, n = 2,034 in 2007/08, and n = 2,178 in 2008/09.
Source: Pennsylvania Department of Education 2009c.
figure 8 Percentage of students scoring at the proficient or advanced level on the grade 11 Pennsylvania system of school Assessment in reading, by English language learner status, 2004/05–2008/09
0
25
50
75
100
2008/092007/082006/072005/062004/05
Percent
13.510.614.215.6
19.3
66.865.366.065.665.5
English language learner students
Non–English language learner students
Note: For non–English language learner students, n = 128,276 in 2004/05, n = 131,132 in 2005/06, n = 133,817 in 2006/07, n = 133,645 in 2007/08, and n = 132,155 in 2008/09. For English language learner stu-dents, n = 1,417 in 2004/05, n = 1,302 in 2005/06, n = 1,547 in 2006/07, n = 1,370 in 2007/08, and n = 1,598 in 2008/09.
Source: Pennsylvania Department of Education 2009c.
from 46.4 percentage points in 2004/05 to 52.1 in 2008/09.
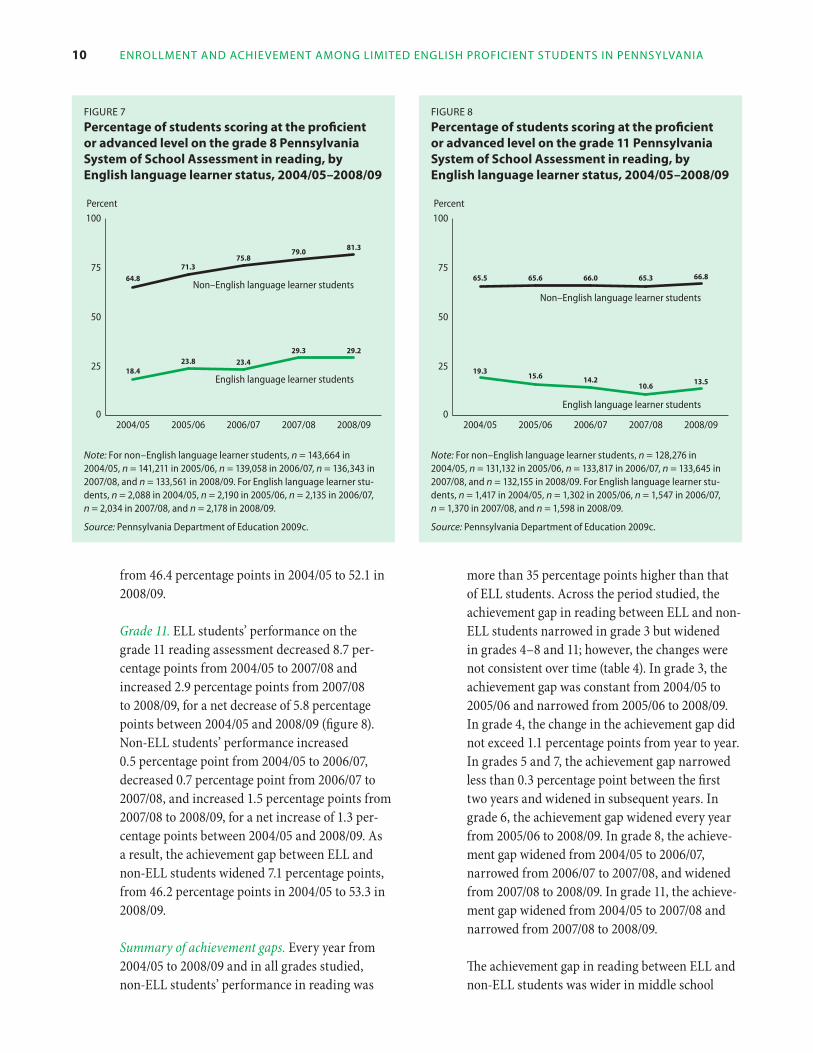
Grade 11. ELL students’ performance on the grade 11 reading assessment decreased 8.7 per-centage points from 2004/05 to 2007/08 and increased 2.9 percentage points from 2007/08 to 2008/09, for a net decrease of 5.8 percentage points between 2004/05 and 2008/09 (figure 8). Non-ELL students’ performance increased 0.5 percentage point from 2004/05 to 2006/07, decreased 0.7 percentage point from 2006/07 to 2007/08, and increased 1.5 percentage points from 2007/08 to 2008/09, for a net increase of 1.3 per-centage points between 2004/05 and 2008/09. As a result, the achievement gap between ELL and non-ELL students widened 7.1 percentage points, from 46.2 percentage points in 2004/05 to 53.3 in 2008/09.
Summary of achievement gaps. Every year from 2004/05 to 2008/09 and in all grades studied, non-ELL students’ performance in reading was
more than 35 percentage points higher than that of ELL students. Across the period studied, the achievement gap in reading between ELL and non-ELL students narrowed in grade 3 but widened in grades 4–8 and 11; however, the changes were not consistent over time (table 4). In grade 3, the achievement gap was constant from 2004/05 to 2005/06 and narrowed from 2005/06 to 2008/09. In grade 4, the change in the achievement gap did not exceed 1.1 percentage points from year to year. In grades 5 and 7, the achievement gap narrowed less than 0.3 percentage point between the first two years and widened in subsequent years. In grade 6, the achievement gap widened every year from 2005/06 to 2008/09. In grade 8, the achieve-ment gap widened from 2004/05 to 2006/07, narrowed from 2006/07 to 2007/08, and widened from 2007/08 to 2008/09. In grade 11, the achieve-ment gap widened from 2004/05 to 2007/08 and narrowed from 2007/08 to 2008/09.
The achievement gap in reading between ELL and non-ELL students was wider in middle school

TrendS in performance of ell STudenTS 11
Table 4
Achievement gap in reading on the Pennsylvania system of school Assessment between Ell and non-Ell students, by grade, 2004/05–2008/09
grade 2004/05 2005/06 2006/07 2007/08 2008/09average across years studied
3 41.2 41.2 38.4 38.4 35.5 38.9
4 na 43.1 42.5 42.9 44.0 43.1
5 40.1 40.0 44.0 46.8 50.2 44.2
6 na 44.9 46.7 50.7 55.0 49.3
7 na 46.5 46.2 48.8 54.1 48.9
8 46.4 47.5 52.4 49.7 52.1 49.6
11 46.2 50.0 51.8 54.7 53.3 51.2
na is not applicable because the reading assessment was first administered in that grade in 2005/06.
Note: The achievement gap was calculated by subtracting the percentage of ELL students scoring at the proficient or advanced level from the percentage of non-ELL students scoring at the proficient or advanced level.
Source: Pennsylvania Department of Education 2009c.
(grades 6–8) and high school (grade 11) than in el-ementary school (grades 3–5) for all years studied. The average annual achievement gap across the period studied was widest in grade 11 (51.2 per-centage points) and narrowest in grade 3 (38.9 per-centage points). By 2008/09, the achievement gap was 35–50 percentage points in grades 3–5 and 52–55 percentage points in grades 6–8 and 11.
Math
Grade 3. From 2004/05 to 2008/09, ELL and non-ELL students’ performance on the grade 3 math assessment followed a similar pattern (figure 9). ELL students’ performance increased 3.0 percent-age points from 2004/05 to 2005/06, decreased 6.9 percentage points from 2005/06 to 2006/07, and increased 5.9 percentage points from 2006/07 to 2008/09, though not to the 2005/06 level, for a net increase of 2.0 percentage points. Non-ELL students’ performance increased 2.0 percentage points from 2004/05 to 2005/06, decreased 4.5 percentage points from 2005/06 to 2006/07, and increased 3.3 percentage points from 2006/07 to 2008/09, though not to the 2005/06 level, for a net increase of 0.8 percentage point. As a result, the achievement gap between ELL and non-ELL stu-dents narrowed 1.2 percentage points, from 28.8 percentage points in 2004/05 to 27.6 in 2008/09.
figure 9
Percentage of students scoring at the proficient or advanced levels on the grade 3 Pennsylvania system of school Assessment in math, by English language learner status, 2004/05−2008/09
0
25
50
75
100
2008/092007/082006/072005/062004/05
Percent
55.050.449.1
56.053.0
82.681.479.383.881.8
English language learner students
Non–English language learner students
Note: For non–English language learner students, n = 122,947 in 2004/05, n = 121,288 in 2005/06, n = 122,084 in 2006/07, n = 123,033 in 2007/08, and n = 123,219 in 2008/09. For English language learner stu-dents, n = 3,630 in 2004/05, n = 3,716 in 2005/06, n = 3,449 in 2006/07, n = 3,519 in 2007/08, and n = 4,049 in 2008/09.
Source: Pennsylvania Department of Education 2009c.
Grade 4. ELL students’ performance on the grade 4 math assessment decreased from 2005/06 to 2006/07 and increased from 2006/07 to 2008/09, whereas non-ELL students’ performance increased

12 enrollmenT and achievemenT among limiTed engliSh proficienT STudenTS in pennSylvania
figure 10 Percentage of students scoring at the proficient or advanced level on the grade 4 Pennsylvania system of school Assessment in math, by English language learner status, 2005/06−2008/09
0
25
50
75
100
2008/092007/082006/072005/06
Percent
52.046.948.2 49.7
82.680.378.877.9
English language learner students
Non–English language learner students
Note: The grade 4 math assessment was first administered in 2005/06. For non–English language learner students, n = 124,747 in 2005/06, n = 122,956 in 2006/07, n = 123,410 in 2007/08, and n = 124,384 in 2008/09. For English language learner students, n = 3,212 in 2005/06, n = 3,198 in 2006/07, n = 3,005 in 2007/08, and n = 3,217 in 2008/09.
Source: Pennsylvania Department of Education 2009c.
figure 11 Percentage of students scoring at the proficient or advanced level on the grade 5 Pennsylvania system of school Assessment in math, by English language learner status, 2004/05−2008/09
0
25
50
75
100
2008/092007/082006/072005/062004/05
Percent
36.036.234.637.539.0
74.474.071.867.669.6
English language learner students
Non–English language learner students
Note: For non–English language learner students, n = 131,513 in 2004/05, n = 128,810 in 2005/06, n = 127,005 in 2006/07, n = 124,557 in 2007/08, and n = 124,680 in 2008/09. For English language learner stu-dents, n = 2,809 in 2004/05, n = 2,892 in 2005/06, n = 2,776 in 2006/07, n = 2,767 in 2007/08, and n = 2,864 in 2008/09.
Source: Pennsylvania Department of Education 2009c.
from 2005/06 to 2008/09 (figure 10). From 2005/06 to 2008/09, ELL students’ performance increased 3.8 percentage points, whereas non-ELL students’ performance increased 4.7 percentage points. As a result, the achievement gap between ELL and non-ELL students widened 0.9 percentage point, from 29.7 percentage points in 2005/06 to 30.6 in 2008/09.
Grade 5. ELL students’ performance on the grade 5 math assessment decreased 4.4 percentage points from 2004/05 to 2006/07 and increased 1.4 per-centage points between 2006/07 and 2008/09, for a net decrease of 3.0 percentage points from 2004/05 to 2008/09 (figure 11). Non-ELL students’ performance decreased 2.0 percentage points from 2004/05 to 2005/06 and increased 6.8 percentage points between 2005/06 and 2008/09, for a net increase of 4.8 percentage points from 2004/05 to 2008/09. As a result, the achievement gap between ELL and non-ELL students widened 7.8 percentage points, from 30.6 percentage points in 2004/05 to 38.4 in 2008/09.
Grade 6. Between 2005/06 and 2008/09, ELL and non-ELL students’ performance on the grade 6 math assessment increased (figure 12). ELL students’ performance decreased 0.9 percentage point from 2005/06 to 2006/07 and increased 2.8 percentage points from 2006/07 to 2008/09, for a net increase of 1.9 percentage points. Non-ELL students’ performance increased 7.8 percent-age points from 2005/06 to 2008/09. As a result, the achievement gap between ELL and non-ELL students widened 5.9 percentage points, from 34.9 percentage points in 2005/06 to 40.8 in 2008/09.
Grade 7. Between 2005/06 and 2008/09, ELL and non-ELL students’ performance on the grade 7 math assessment increased (figure 13). ELL students’ performance decreased 4.0 percentage points from 2005/06 to 2006/07 and increased 5.4 percentage points from 2006/07 to 2008/09, for a net increase of 1.4 percentage points. Non-ELL students’ performance increased 8.9 percentage points. As a result, the achievement gap between

TrendS in performance of ell STudenTS 13
figure 12 Percentage of students scoring at the proficient or advanced level on the grade 6 Pennsylvania system of school Assessment in math, by English language learner status, 2005/06−2008/09
0
25
50
75
100
2008/092007/082006/072005/06
Percent
35.732.933.8 34.4
76.573.070.268.7
English language learner students
Non–English language learner students
Note: The grade 6 math assessment was first administered in 2005/06. For non–English language learner students, n = 133,567 in 2005/06, n = 131,299 in 2006/07, n = 128,471 in 2007/08, and n = 125,788 in 2008/09. For English language learner students, n = 2,619 in 2005/06, n = 2,311 in 2006/07, n = 2,380 in 2007/08, and n = 2,633 in 2008/09.
Source: Pennsylvania Department of Education 2009c.
ELL and non-ELL students widened 7.5 percentage points, from 32.9 percentage points in 2005/06 to 40.4 in 2008/09.
Grade 8. Between 2004/05 and 2008/09, ELL and non-ELL students’ performance on the grade 8 math assessment followed a similar trend (figure 14). ELL students’ performance decreased 1.0 percentage point from 2004/05 to 2005/06 and increased 4.2 percentage points from 2005/06 to 2008/09, for a net increase of 3.2 percentage points. Non-ELL students’ per-formance decreased 0.7 percentage point from 2004/05 to 2005/06 and increased 9.2 percent-age points from 2005/06 to 2008/09, for a net increase of 8.5 percentage points. As a result, the achievement gap widened 5.3 percentage points, from 33.6 percentage points in 2004/05 to 38.9 in 2008/09.
Grade 11. ELL students’ performance on the grade 11 math assessment decreased 6.1 percent-age points from 2004/05 to 2007/08 and increased
figure 13 Percentage of students scoring at the proficient or advanced level on the grade 7 Pennsylvania system of school Assessment in math, by English language learner status, 2005/06−2008/09
0
25
50
75
100
2008/092007/082006/072005/06
Percent
35.630.2
34.2 32.4
76.071.2
67.867.1
English language learner students
Non–English language learner students
Note: The grade 7 math assessment was first administered in 2005/06. For non–English language learner students, n = 138,910 in 2005/06, n = 136,547 in 2006/07, n = 133,669 in 2007/08, and n = 130,362 in 2008/09. For English language learner students, n = 2,390 in 2005/06, n = 2,291 in 2006/07, n = 2,136 in 2007/08, and n = 2,441 in 2008/09.
Source: Pennsylvania Department of Education 2009c.
figure 14 Percentage of students scoring at the proficient or advanced level on the grade 8 Pennsylvania system of school Assessment in math, by English language learner status, 2004/05−2008/09
0
25
50
75
100
2008/092007/082006/072005/062004/05
Percent
33.032.330.928.829.8
71.970.968.5
62.763.4
English language learner students
Non–English language learner students
Note: For non–English language learner students, n =143,895 in 2004/05, n = 141,524 in 2005/06, n = 139,292 in 2006/07, n = 136,535 in 2007/08, and n = 133,715 in 2008/09. For English language learner stu-dents, n = 2,104 in 2004/05, n = 2,225 in 2005/06, n = 2,159 in 2006/07, n = 2,045 in 2007/08, and n = 2,194 in 2008/09.
Source: Pennsylvania Department of Education 2009c.
14 enrollmenT and achievemenT among limiTed engliSh proficienT STudenTS in pennSylvania
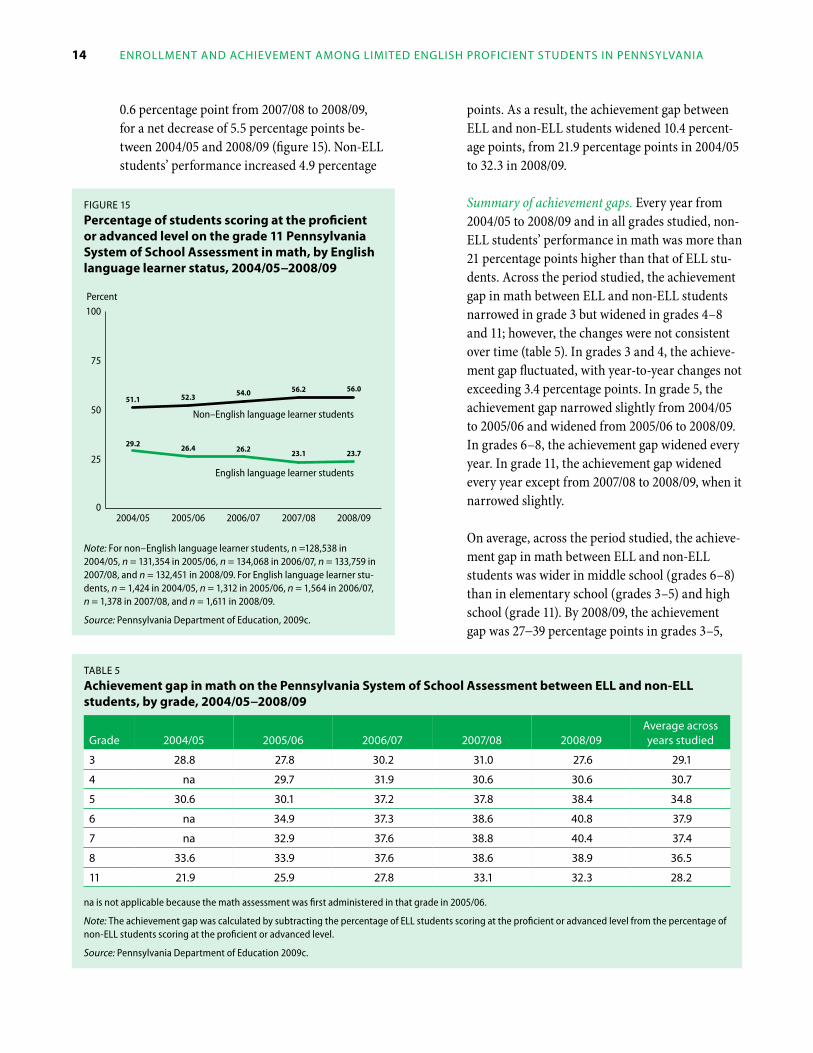
0.6 percentage point from 2007/08 to 2008/09, for a net decrease of 5.5 percentage points be-tween 2004/05 and 2008/09 (figure 15). Non-ELL students’ performance increased 4.9 percentage
points. As a result, the achievement gap between ELL and non-ELL students widened 10.4 percent-age points, from 21.9 percentage points in 2004/05 to 32.3 in 2008/09.
Summary of achievement gaps. Every year from 2004/05 to 2008/09 and in all grades studied, non-ELL students’ performance in math was more than 21 percentage points higher than that of ELL stu-dents. Across the period studied, the achievement gap in math between ELL and non-ELL students narrowed in grade 3 but widened in grades 4–8 and 11; however, the changes were not consistent over time (table 5). In grades 3 and 4, the achieve-ment gap fluctuated, with year-to-year changes not exceeding 3.4 percentage points. In grade 5, the achievement gap narrowed slightly from 2004/05 to 2005/06 and widened from 2005/06 to 2008/09. In grades 6–8, the achievement gap widened every year. In grade 11, the achievement gap widened every year except from 2007/08 to 2008/09, when it narrowed slightly.
On average, across the period studied, the achieve-ment gap in math between ELL and non-ELL students was wider in middle school (grades 6–8) than in elementary school (grades 3–5) and high school (grade 11). By 2008/09, the achievement gap was 27−39 percentage points in grades 3–5,
figure 15
Percentage of students scoring at the proficient or advanced level on the grade 11 Pennsylvania system of school Assessment in math, by English language learner status, 2004/05−2008/09
0
25
50
75
100
2008/092007/082006/072005/062004/05
Percent
23.723.126.226.429.2
56.056.254.052.351.1
English language learner students
Non–English language learner students
Note: For non–English language learner students, n =128,538 in 2004/05, n = 131,354 in 2005/06, n = 134,068 in 2006/07, n = 133,759 in 2007/08, and n = 132,451 in 2008/09. For English language learner stu-dents, n = 1,424 in 2004/05, n = 1,312 in 2005/06, n = 1,564 in 2006/07, n = 1,378 in 2007/08, and n = 1,611 in 2008/09.
Source: Pennsylvania Department of Education, 2009c.
Table 5
Achievement gap in math on the Pennsylvania system of school Assessment between Ell and non-Ell students, by grade, 2004/05−2008/09
grade 2004/05 2005/06 2006/07 2007/08 2008/09average across years studied
3 28.8 27.8 30.2 31.0 27.6 29.1
4 na 29.7 31.9 30.6 30.6 30.7
5 30.6 30.1 37.2 37.8 38.4 34.8
6 na 34.9 37.3 38.6 40.8 37.9
7 na 32.9 37.6 38.8 40.4 37.4
8 33.6 33.9 37.6 38.6 38.9 36.5
11 21.9 25.9 27.8 33.1 32.3 28.2
na is not applicable because the math assessment was first administered in that grade in 2005/06.
Note: The achievement gap was calculated by subtracting the percentage of ELL students scoring at the proficient or advanced level from the percentage of non-ELL students scoring at the proficient or advanced level.
Source: Pennsylvania Department of Education 2009c.
TrendS in performance of ell STudenTS 15
38–41 percentage points in grades 6–8, and 32.3 percentage points in grade 11. The average annual achievement gap across the period studied was narrowest in grade 11 (28.2 percentage points) and widest in grade 6 (37.9 percentage points) and grade 7 (37.4 percentage points).
Writing
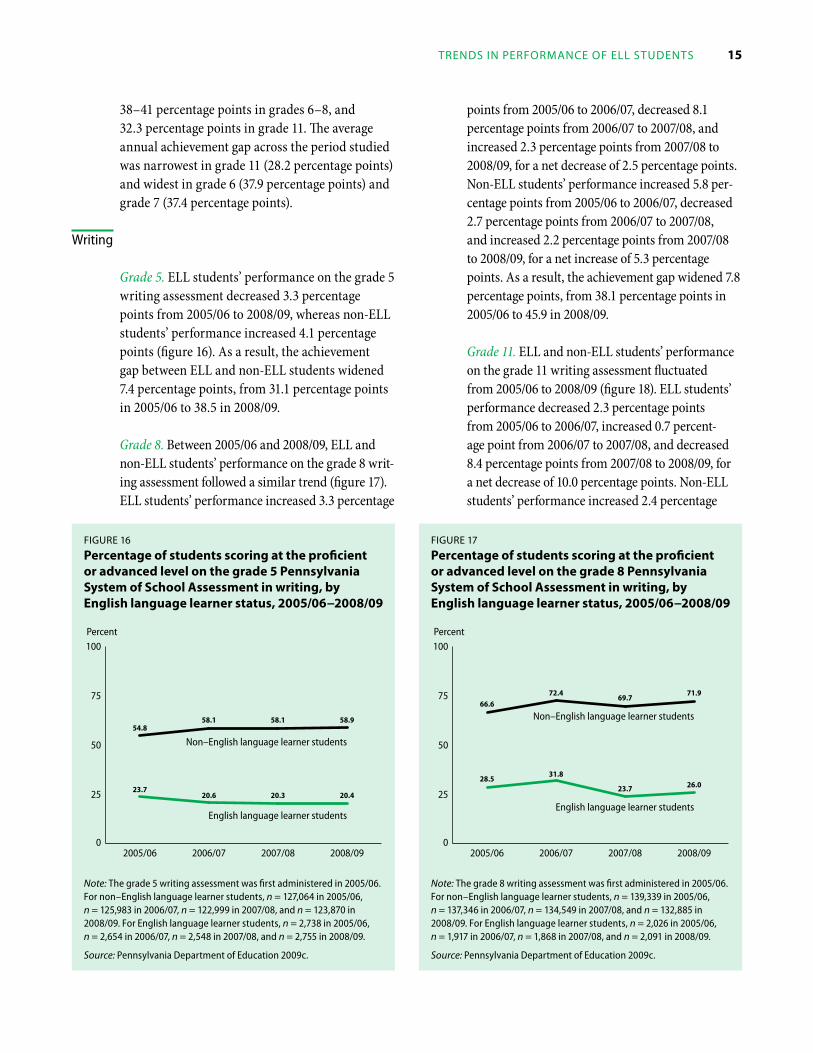
Grade 5. ELL students’ performance on the grade 5 writing assessment decreased 3.3 percentage points from 2005/06 to 2008/09, whereas non-ELL students’ performance increased 4.1 percentage points (figure 16). As a result, the achievement gap between ELL and non-ELL students widened 7.4 percentage points, from 31.1 percentage points in 2005/06 to 38.5 in 2008/09.
Grade 8. Between 2005/06 and 2008/09, ELL and non-ELL students’ performance on the grade 8 writ-ing assessment followed a similar trend (figure 17). ELL students’ performance increased 3.3 percentage
points from 2005/06 to 2006/07, decreased 8.1 percentage points from 2006/07 to 2007/08, and increased 2.3 percentage points from 2007/08 to 2008/09, for a net decrease of 2.5 percentage points. Non-ELL students’ performance increased 5.8 per-centage points from 2005/06 to 2006/07, decreased 2.7 percentage points from 2006/07 to 2007/08, and increased 2.2 percentage points from 2007/08 to 2008/09, for a net increase of 5.3 percentage points. As a result, the achievement gap widened 7.8 percentage points, from 38.1 percentage points in 2005/06 to 45.9 in 2008/09.
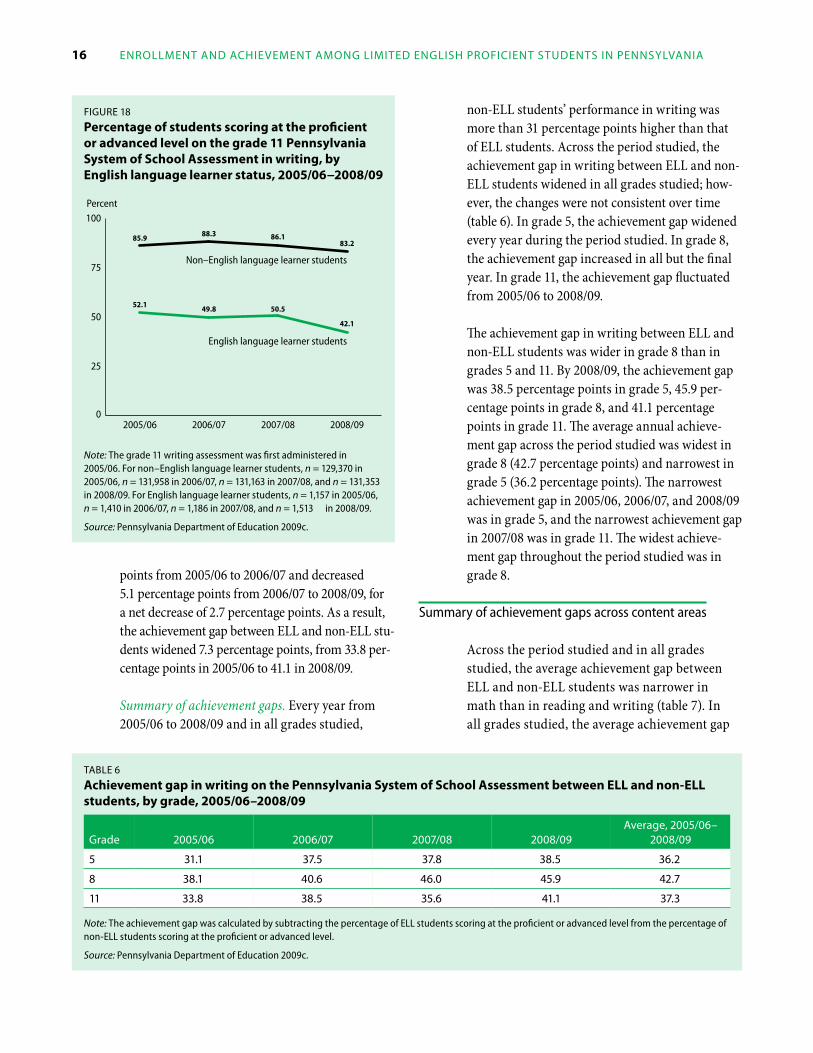
Grade 11. ELL and non-ELL students’ performance on the grade 11 writing assessment fluctuated from 2005/06 to 2008/09 (figure 18). ELL students’ performance decreased 2.3 percentage points from 2005/06 to 2006/07, increased 0.7 percent-age point from 2006/07 to 2007/08, and decreased 8.4 percentage points from 2007/08 to 2008/09, for a net decrease of 10.0 percentage points. Non-ELL students’ performance increased 2.4 percentage
figure 16
Percentage of students scoring at the proficient or advanced level on the grade 5 Pennsylvania system of school Assessment in writing, by English language learner status, 2005/06−2008/09
0
25
50
75
100
2008/092007/082006/072005/06
Percent
20.420.623.7
20.3
58.958.158.154.8
English language learner students
Non–English language learner students
Note: The grade 5 writing assessment was first administered in 2005/06. For non–English language learner students, n = 127,064 in 2005/06, n = 125,983 in 2006/07, n = 122,999 in 2007/08, and n = 123,870 in 2008/09. For English language learner students, n = 2,738 in 2005/06, n = 2,654 in 2006/07, n = 2,548 in 2007/08, and n = 2,755 in 2008/09.
Source: Pennsylvania Department of Education 2009c.
figure 17
Percentage of students scoring at the proficient or advanced level on the grade 8 Pennsylvania system of school Assessment in writing, by English language learner status, 2005/06−2008/09
0
25
50
75
100
2008/092007/082006/072005/06
Percent
26.031.8
28.523.7
71.969.7
72.466.6
English language learner students
Non–English language learner students
Note: The grade 8 writing assessment was first administered in 2005/06. For non–English language learner students, n = 139,339 in 2005/06, n = 137,346 in 2006/07, n = 134,549 in 2007/08, and n = 132,885 in 2008/09. For English language learner students, n = 2,026 in 2005/06, n = 1,917 in 2006/07, n = 1,868 in 2007/08, and n = 2,091 in 2008/09.
Source: Pennsylvania Department of Education 2009c.
16 enrollmenT and achievemenT among limiTed engliSh proficienT STudenTS in pennSylvania
figure 18
Percentage of students scoring at the proficient or advanced level on the grade 11 Pennsylvania system of school Assessment in writing, by English language learner status, 2005/06−2008/09
0
25
50
75
100
2008/092007/082006/072005/06
Percent
42.1
49.852.1 50.5
83.286.188.385.9
English language learner students
Non–English language learner students
Note: The grade 11 writing assessment was first administered in 2005/06. For non–English language learner students, n = 129,370 in 2005/06, n = 131,958 in 2006/07, n = 131,163 in 2007/08, and n = 131,353 in 2008/09. For English language learner students, n = 1,157 in 2005/06, n = 1,410 in 2006/07, n = 1,186 in 2007/08, and n = 1,513 in 2008/09.
Source: Pennsylvania Department of Education 2009c.
points from 2005/06 to 2006/07 and decreased 5.1 percentage points from 2006/07 to 2008/09, for a net decrease of 2.7 percentage points. As a result, the achievement gap between ELL and non-ELL stu-dents widened 7.3 percentage points, from 33.8 per-centage points in 2005/06 to 41.1 in 2008/09.
Summary of achievement gaps. Every year from 2005/06 to 2008/09 and in all grades studied,
non-ELL students’ performance in writing was more than 31 percentage points higher than that of ELL students. Across the period studied, the achievement gap in writing between ELL and non-ELL students widened in all grades studied; how-ever, the changes were not consistent over time (table 6). In grade 5, the achievement gap widened every year during the period studied. In grade 8, the achievement gap increased in all but the final year. In grade 11, the achievement gap fluctuated from 2005/06 to 2008/09.
The achievement gap in writing between ELL and non-ELL students was wider in grade 8 than in grades 5 and 11. By 2008/09, the achievement gap was 38.5 percentage points in grade 5, 45.9 per-centage points in grade 8, and 41.1 percentage points in grade 11. The average annual achieve-ment gap across the period studied was widest in grade 8 (42.7 percentage points) and narrowest in grade 5 (36.2 percentage points). The narrowest achievement gap in 2005/06, 2006/07, and 2008/09 was in grade 5, and the narrowest achievement gap in 2007/08 was in grade 11. The widest achieve-ment gap throughout the period studied was in grade 8.
Summary of achievement gaps across content areas
Across the period studied and in all grades studied, the average achievement gap between ELL and non-ELL students was narrower in math than in reading and writing (table 7). In all grades studied, the average achievement gap
Table 6
Achievement gap in writing on the Pennsylvania system of school Assessment between Ell and non-Ell students, by grade, 2005/06–2008/09
grade 2005/06 2006/07 2007/08 2008/09average, 2005/06–
2008/09
5 31.1 37.5 37.8 38.5 36.2
8 38.1 40.6 46.0 45.9 42.7
11 33.8 38.5 35.6 41.1 37.3
Note: The achievement gap was calculated by subtracting the percentage of ELL students scoring at the proficient or advanced level from the percentage of non-ELL students scoring at the proficient or advanced level.
Source: Pennsylvania Department of Education 2009c.
STudy limiTaTionS 17
Table 7 Average achievement gap on the Pennsylvania system of school Assessment between Ell and non-Ell students, by grade and subject, 2004/05–2008/09
grade
reading(2004/05–2008/09)
math(2004/05–2008/09)
Writing(2005/06–2008/09)
3 38.9 29.1 na
4 43.1 30.7 na
5 44.2 34.8 36.2
6 49.3 37.9 na
7 48.9 37.4 na
8 49.6 36.5 42.7
11 51.2 28.2 37.3
na is not applicable because the Pennsylvania System of School Assess-ment in writing is administered in grades 5, 8, and 11 only.
Note: The achievement gap was calculated by subtracting the percent-age of ELL students scoring at the proficient or advanced level from the percentage of non-ELL students scoring at the proficient or advanced level.
Source: Pennsylvania Department of Education 2009c.
between ELL and non-ELL students was wider in reading than in writing. The greatest difference in the average achievement gap between reading and math and between writing and math was in grade 11.
On average, across the period studied and in all grades studied, non-ELL students’ performance in reading, math, and writing was more than 28 per-centage points higher than that of ELL students. The average annual achievement gap in reading and writing between ELL and non-ELL students was wider in middle school (grades 6–8) and high school (grade 11) than in elementary school (grades 3–5). The average achievement gap in math between ELL and non-ELL students was wider in middle school (grades 6–8) than in elementary school (grades 3–5) and high school (grade 11). Across the period studied, the average achievement gap in high school was wider than the average achievement gap in all other grades in reading, narrower than the average achievement gap in all other grades in math, and between the average achievement gaps in middle school and elementary school in writing.
study limitAtions
This study has several limitations:
• The study is purely descriptive. It does not explain changes in proficiency rates or the achievement gap between ELL and non-ELL students.
• The study used cross-sectional state-level data, not longitudinal student-level data. Therefore, data trends represent different students across time as opposed to longitudinal trends of the same students.
• ELL student enrollment data by grade level were unavailable. The analysis of patterns of ELL student enrollment by grade would demonstrate whether ELL student enrollment changed progressively by grade. Such data would have allowed exploration of the extent to which growth in the ELL student popula-tion can be attributed to earlier versus later grades.
• The study reports scores for ELL and non-ELL students from 2004/05 to 2008/09, but scores in reading and math for some grades were available only from 2005/06 to 2008/09. Scores in reading and math in 2004/05 are not com-parable to those before 2004/05 because of new test blueprints, test items, assessment an-chors, and item distribution. Therefore, read-ing and math scores before 2004/05 were not included in the trend analyses. In 2005/06, the writing assessment changed in focus, format, and scoring, making scores from 2005/06 on-ward not comparable to those before 2005/06. Therefore, writing scores before 2005/06 were not included in the trend analyses.
• The achievement levels of former ELL students (those who have exited a language assistance program) are unknown. The patterns of as-sessment scores observed over time and across grades are influenced by the reclassification of ELL students as former ELL students. Former
18 enrollmenT and achievemenT among limiTed engliSh proficienT STudenTS in pennSylvania
ELL students have higher English language proficiency than ELL students, which has a larger im-pact on the ELL population than on the non-ELL population due to their relative sizes. The remain-ing ELL students could be among the lower performing students on the state assessments, with lower English language proficiency (Abedi 2004; Abedi, Courtney, and Leon 2003). Research in-dicates that English language proficiency is positively associated with academic achievement (Beal,
Adams, and Cohen 2010; Garcia-Vazquez et al. 1997; Genesee et al. 2005). Thus, former ELL students may contribute to the declines in proficiency observed in the ELL population across grades.
Data on ELL students from the Pennsylvania English language proficiency assessment were not available. Such data would have enabled the au-thors to link ELL students’ English language profi-ciency levels to their performance on subject area assessments. Research suggests that content as-sessments in English may not produce reliable and valid outcomes for ELL students at the lower level of English language proficiency, particularly in content areas with high language demand (see, for example, Abedi and Herman 2010; Solano-Flores and Trumbull 2003). In math, English language proficiency levels are associated with performance on solving word problems (Abedi, Leon, and Mi-rocha 2003). The linguistic complexity of the math assessment increases with each subsequent grade, as more word problems are included as test items.7 The linguistic complexities of the math test of the PSSA in middle school may have contributed to the achievement gap between ELL and non-ELL students, particularly for students with low levels of English language proficiency.
• Data on accommodations for ELL students were unavailable. While the analysis does not include math assessments administered in
Spanish, some of the accommodations used by Pennsylvania, such as additional time to take the assessments, might have affected the comparability of assessment outcomes for ELL and non-ELL students (Durán 2008).
conclusion
Statewide ELL student enrollment data illustrate the changing demographics of Pennsylvania’s student population from 2002/03 to 2008/09. Al-though total enrollment decreased across the state, ELL student enrollment increased. The number of languages spoken by ELL students also increased, with Spanish speakers accounting for the largest percentage of ELL students.
The assessment data from the Pennsylvania Department of Education indicate that, for stu-dents enrolled in public schools from 2004/05 to 2008/09, ELL students’ performance in reading increased in grades 3, 4, and 8 but decreased in grades 5, 6, 7, and 11. ELL students’ performance in math increased in grades 3, 4, 6, 7, and 8 but de-creased in grades 5 and 11. ELL students’ perfor-mance in writing decreased in all grades reported (grades 5, 8, and 11). Across the period studied and in all grades studied, non-ELL students’ performance in reading, math, and writing was 21–55 percentage points higher than that of ELL students.
Across the period studied, the average achieve-ment gap between ELL and non-ELL students was narrower in math than in reading and writing. This is consistent with the research literature showing that the achievement gap between ELL and non-ELL students is widest in reading/language arts, because test items on those assess-ments use complex language, and narrowest in content areas such as math, where language is not the target of measurement (Abedi 2002).
Except in grade 11 math and writing, the average achievement gap for all subject areas increased from elementary school to middle and high school,
from 2004/05 to 2008/09, Ell students’ performance increased in grades 3, 4, and 8 but decreased in grades 5, 6, 7, and 11 in reading; increased in grades 3, 4, 6, 7, and 8 but decreased in grades 5 and 11 in math; and decreased in all grades reported (grades 5, 8, and 11) in writing

concluSion 19
a finding consistent with the literature (Abedi 2002; Fry 2007; Gándara et al. 2003; Rhode Island KIDS COUNT 2011). One possible explanation for the increase in the achievement gap across grades is the increase in the language demand of the assessments in middle and high school. In math, English proficiency levels are associated with performance on solving word problems (Beal, Adams, and Cohen 2010), and the assessments in middle and high school include greater emphasis on word problems than computational exercises. The addition of word problems on the math as-sessment increases the linguistic complexity of the assessment. Thus, it is possible that the linguistic complexity of assessments may interfere with ELL students’ ability to present a valid picture of what they know and are able to do. Students with content area knowledge in math will be unlikely to score at the proficient or advanced level if they cannot interpret the vocabulary and linguistic structure of the test (Abedi 2004).
The average achievement gap in all subject areas increased from elementary school to middle and high school, except in grade 11 math and writ-ing. The smaller achievement gaps in grade 11 than in middle school in these two subject areas are inconsistent with some of the research lit-erature (Gándara et al. 2003). Yet, these results are comparable to those from the 2009 grade NAEP math assessment for grades 4, 8, and 12
(U.S. Department of Education 2010). A possible explanation for the narrower gap in performance between ELL and non-ELL students in grade 11 is the nature of the assessment. Both grade 8 and grade 11 math assessments are divided into three sections and contain 72 multiple-choice items and 4 open-ended items. However, 38–42 percent of grade 11 items pertain to algebraic concepts, compared with 25–30 percent of grade 8 items. In addition, 12–18 percent of grade 11 items pertain to geometry, compared with 15–20 percent of grade 8 items. Based on the nature of the math content, the linguistic complexity of the grade 11 math assessment could be lower than that of the grade 8 math assessment.
Another possible explanation for the lower achievement gap among grade 11 students is the accommodations that were used during testing. As previously mentioned, ELL students are allowed to have setting and timing accommodations on all assessments (reading, math, and writing). How-ever, three types of accommodations are permitted for all ELL students for the math assessment only, including word-to-word translation dictionaries, interpreters and sight translators, and Spanish/English bilingual versions of the assessment. Without data on accommodations for ELL stu-dents, it is unknown whether the type of accom-modations used among grade 11 ELL students may have contributed to this anomaly.
20 enrollmenT and achievemenT among limiTed engliSh proficienT STudenTS in pennSylvania
APPEndix A dAtA And mEthodology
This appendix describes the data and methodology used in this study.
Data
This study used both enrollment and assessment data.
Enrollment data. Enrollment data on English language learner (ELL) students in Pennsylvania were accessed from the Pennsylvania Depart-ment of Education website (total ELL student enrollment for 2002/03–2006/07 and languages with the greatest number of ELL speakers for 2002/03–2006/07) and from Pennsylvania De-partment of Education Excel files (total student enrollment for 2002/03–2008/09, total ELL student enrollment for 2007/08–2008/09, and languages with the highest number of ELL speak-ers for 2007/08–2008/09).
ELL enrollment by grade level was not available through the state website and is not examined in this report. The 2002/03 school year was selected as the base year because it was the first year that states were required to disaggregate and report data on traditionally underserved populations under the No Child Left Behind Act of 2001 (NCLB).
The enrollment data included information from all public elementary, middle, and high schools (regular and charter schools). Enrollment data did not include information from nonpublic private or parochial schools.
Assessment data. Assessment data were accessed from Pennsylvania System of School Assessment (PSSA) reports on the Pennsylvania Department of Education website (PSSA scores in reading and math for grades 3, 5, 8, and 11 for 2004/05–2008/09; PSSA scores in reading and math for grades 4, 6, and 7 for 2005/06–2008/09; and
PSSA scores in writing for grades 5, 8, and 11 for 2005/06–2008/09).
Reading and math results for grades 3, 5, 8, and 11 for 2004/05 and later are not comparable to those before 2004/05 because of new test blueprints, test items, assessment anchors, and item distribu-tion; thus, 2004/05 was selected as the base year for the analyses of performance data. In 2005/06, the Pennsylvania Department of Education added reading and math assessments in grades 4, 6, and 7. The writing assessment was not administered in grades 5 and 8 until 2005/06. The focus, format, and scoring of the writing assessment for grade 11 changed in 2005/06.
As with the enrollment data, the assessment data included information from all public elementary, middle, and high schools (regular and charter schools). Assessment data did not include informa-tion from nonpublic private or parochial schools.
All students in Pennsylvania must take all four tests of the PSSA. The only exception is for ELL students who are in their first year in a U.S. school; they do not have to take the reading and writing tests, but they must take the math and science tests, with accommodations as appropriate.
Methodology
Descriptive analyses were conducted on the enroll-ment and assessment data. For the enrollment data, the growth of the ELL student population (as a percentage of total student enrollment) was tracked across time. In addition, the languages with the highest number of ELL student speakers were presented.
Assessment data were used to present the aca-demic achievement of ELL and non-ELL students on the reading, math, and writing tests across time. The percentage of ELL and non-ELL stu-dents who scored at the proficient or advanced level (referred to as “performance” in the analy-sis) was used to measure student achievement,

appendix a. daTa and meThodology 21
because that is what Pennsylvania uses to measure accountability for NCLB.9 No tests of statistical significance were conducted between ELL and non-ELL students.
Prior to analysis, the non-ELL assessment data were calculated using the data for the total student population (“all students”) for 2004/05–2008/09.
The number of non-ELL students was computed by subtracting the number of ELL students from the “all students” total. The number of non-ELL students who scored at the proficient or advanced level was computed by subtracting the number of ELL students who scored at the proficient or advanced level from the number of “all students” who scored at those levels.

22 enrollmenT and achievemenT among limiTed engliSh proficienT STudenTS in pennSylvania
APPEndix b PErformAncE-lEvEl dEscriPtions of thE PEnnsylvAniA systEm of school AssEssmEnt
This appendix presents the Pennsylvania De-partment of Education’s knowledge and skills required for each performance level on the state assessments.
Table b1
Performance-level descriptors for the Pennsylvania system of school Assessment, reading, by grade
grade below basic basic proficient advanced
3 a student scoring at the below basic level demonstrates competency with below grade-level text only and requires exten-sive support to comprehend and interpret fiction and nonfiction.
a student scoring at the basic level generally uses some reading strategies to compre-hend grade-level appropri-ate fiction and nonfiction. a student scoring at this level:
• identifies some word meanings, including synonyms and antonyms for common words, using context clues.
• identifies details in sup-port of a conclusion.
• identifies stated main ideas.
• attempts to summarize text.
• attempts to make within or among text-to-text connections.
• identifies purpose of text (such as narrative).
• identifies some literary ele-ments (such as character).
• locates headings and subheadings in text.
• recognizes simple orga-nizational patterns of text (such as sequencing, com-parison and contrast).
• recognizes that authors use language in different ways to communicate meaning.
• identifies factual statements.
• identifies some steps in a list of directions.
• recognizes graphics and charts.
a student scoring at the proficient level routinely uses a variety of reading strategies to comprehend and interpret grade-level appropriate fic-tion and nonfiction. a student scoring at this level:
• identifies word meanings, including synonyms and antonyms, using context clues and word parts.
• makes inferences and draws conclusions, using textual support.
• identifies stated or implied main ideas and relevant details.
• Summarizes text.
• makes within and among text-to-text connections.
• identifies purpose of text (narrative and informational).
• identifies literary elements (character, setting, and plot).
• identifies figurative lan-guage (personification).
• identifies fact and opinion and the use of exaggera-tion (bias) in nonfiction.
• identifies organizational patterns of text (such as sequencing, com-parison and contrast) and sequence of steps in a list of directions.
• interprets graphics, charts, and headings.
a student scoring at the advanced level consistently uses sophisticated strategies to comprehend and interpret complex fiction and nonfic-tion. a student scoring at this level:
• identifies word meanings and shades of meaning, using context as support.
• makes inferences and draws conclusions, using textual support.
• relates supporting details to main idea.
• effectively summarizes all ideas within text.
• describes within and among text-to-text connections.
• explains purpose of text (such as narrative).
• explains the use of figura-tive language (such as personification, simile) and literary elements (such as character).
• explains the use of fact and opinion and exaggera-tion (bias) in nonfiction.
• identifies and explains organizational patterns of text (such as sequenc-ing, comparison and contrast) and the proper sequence of steps in a list of directions.
• applies information in graphics, charts, and head-ings to support text.
(conTinued)
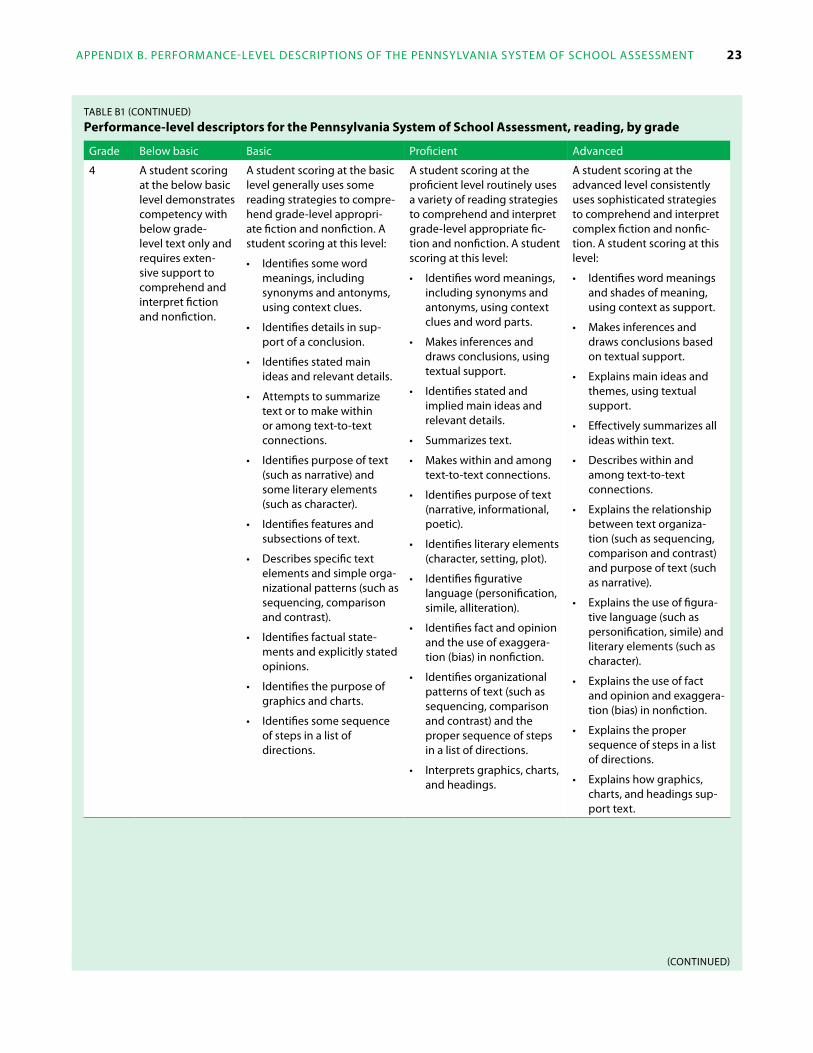
appendix b. performance-level deScripTionS of The pennSylvania SySTem of School aSSeSSmenT 23
Table b1 (conTinued)
Performance-level descriptors for the Pennsylvania system of school Assessment, reading, by grade
grade below basic basic proficient advanced
4 a student scoring at the below basic level demonstrates competency with below grade-level text only and requires exten-sive support to comprehend and interpret fiction and nonfiction.
a student scoring at the basic level generally uses some reading strategies to compre-hend grade-level appropri-ate fiction and nonfiction. a student scoring at this level:
• identifies some word meanings, including synonyms and antonyms, using context clues.
• identifies details in sup-port of a conclusion.
• identifies stated main ideas and relevant details.
• attempts to summarize text or to make within or among text-to-text connections.
• identifies purpose of text (such as narrative) and some literary elements (such as character).
• identifies features and subsections of text.
• describes specific text elements and simple orga-nizational patterns (such as sequencing, comparison and contrast).
• identifies factual state-ments and explicitly stated opinions.
• identifies the purpose of graphics and charts.
• identifies some sequence of steps in a list of directions.
a student scoring at the proficient level routinely uses a variety of reading strategies to comprehend and interpret grade-level appropriate fic-tion and nonfiction. a student scoring at this level:
• identifies word meanings, including synonyms and antonyms, using context clues and word parts.
• makes inferences and draws conclusions, using textual support.
• identifies stated and implied main ideas and relevant details.
• Summarizes text.
• makes within and among text-to-text connections.
• identifies purpose of text (narrative, informational, poetic).
• identifies literary elements (character, setting, plot).
• identifies figurative language (personification, simile, alliteration).
• identifies fact and opinion and the use of exaggera-tion (bias) in nonfiction.
• identifies organizational patterns of text (such as sequencing, comparison and contrast) and the proper sequence of steps in a list of directions.
• interprets graphics, charts, and headings.
a student scoring at the advanced level consistently uses sophisticated strategies to comprehend and interpret complex fiction and nonfic-tion. a student scoring at this level:
• identifies word meanings and shades of meaning, using context as support.
• makes inferences and draws conclusions based on textual support.
• explains main ideas and themes, using textual support.
• effectively summarizes all ideas within text.
• describes within and among text-to-text connections.
• explains the relationship between text organiza-tion (such as sequencing, comparison and contrast) and purpose of text (such as narrative).
• explains the use of figura-tive language (such as personification, simile) and literary elements (such as character).
• explains the use of fact and opinion and exaggera-tion (bias) in nonfiction.
• explains the proper sequence of steps in a list of directions.
• explains how graphics, charts, and headings sup-port text.
(conTinued)
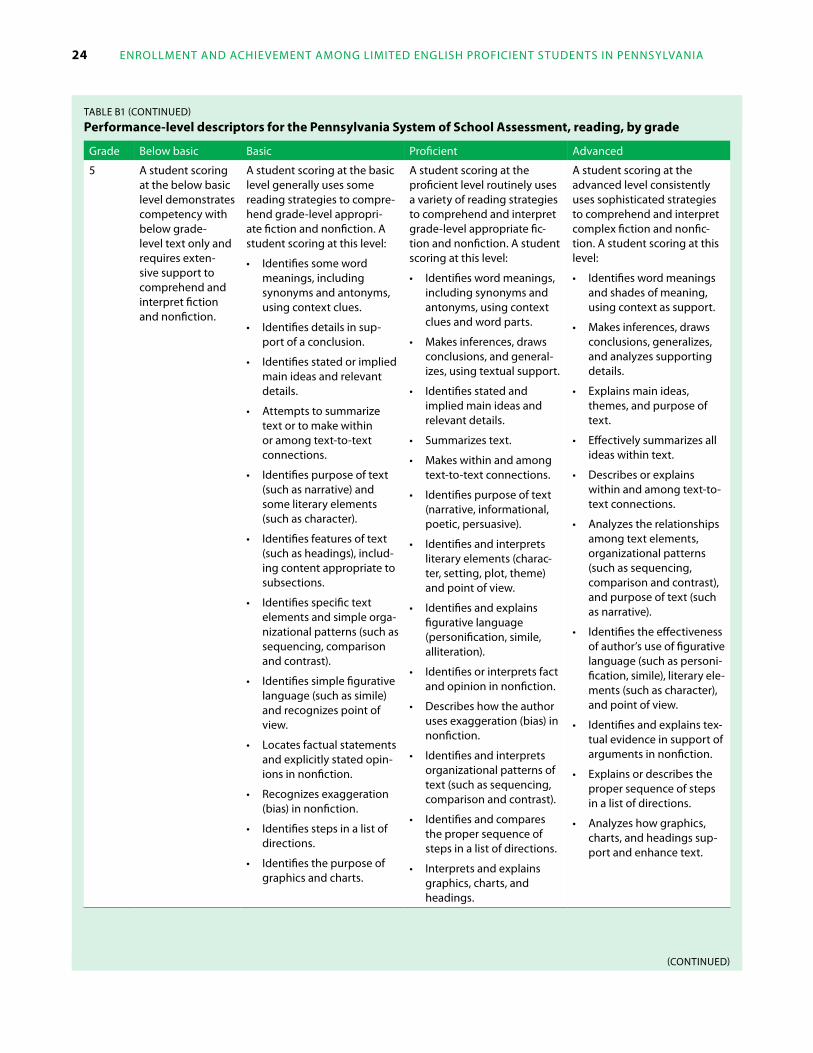
24 enrollmenT and achievemenT among limiTed engliSh proficienT STudenTS in pennSylvania
Table b1 (conTinued)
Performance-level descriptors for the Pennsylvania system of school Assessment, reading, by grade
grade below basic basic proficient advanced
5 a student scoring at the below basic level demonstrates competency with below grade-level text only and requires exten-sive support to comprehend and interpret fiction and nonfiction.
a student scoring at the basic level generally uses some reading strategies to compre-hend grade-level appropri-ate fiction and nonfiction. a student scoring at this level:
• identifies some word meanings, including synonyms and antonyms, using context clues.
• identifies details in sup-port of a conclusion.
• identifies stated or implied main ideas and relevant details.
• attempts to summarize text or to make within or among text-to-text connections.
• identifies purpose of text (such as narrative) and some literary elements (such as character).
• identifies features of text (such as headings), includ-ing content appropriate to subsections.
• identifies specific text elements and simple orga-nizational patterns (such as sequencing, comparison and contrast).
• identifies simple figurative language (such as simile) and recognizes point of view.
• locates factual statements and explicitly stated opin-ions in nonfiction.
• recognizes exaggeration (bias) in nonfiction.
• identifies steps in a list of directions.
• identifies the purpose of graphics and charts.
a student scoring at the proficient level routinely uses a variety of reading strategies to comprehend and interpret grade-level appropriate fic-tion and nonfiction. a student scoring at this level:
• identifies word meanings, including synonyms and antonyms, using context clues and word parts.
• makes inferences, draws conclusions, and general-izes, using textual support.
• identifies stated and implied main ideas and relevant details.
• Summarizes text.
• makes within and among text-to-text connections.
• identifies purpose of text (narrative, informational, poetic, persuasive).
• identifies and interprets literary elements (charac-ter, setting, plot, theme) and point of view.
• identifies and explains figurative language (personification, simile, alliteration).
• identifies or interprets fact and opinion in nonfiction.
• describes how the author uses exaggeration (bias) in nonfiction.
• identifies and interprets organizational patterns of text (such as sequencing, comparison and contrast).
• identifies and compares the proper sequence of steps in a list of directions.
• interprets and explains graphics, charts, and headings.
a student scoring at the advanced level consistently uses sophisticated strategies to comprehend and interpret complex fiction and nonfic-tion. a student scoring at this level:
• identifies word meanings and shades of meaning, using context as support.
• makes inferences, draws conclusions, generalizes, and analyzes supporting details.
• explains main ideas, themes, and purpose of text.
• effectively summarizes all ideas within text.
• describes or explains within and among text-to-text connections.
• analyzes the relationships among text elements, organizational patterns (such as sequencing, comparison and contrast), and purpose of text (such as narrative).
• identifies the effectiveness of author’s use of figurative language (such as personi-fication, simile), literary ele-ments (such as character), and point of view.
• identifies and explains tex-tual evidence in support of arguments in nonfiction.
• explains or describes the proper sequence of steps in a list of directions.
• analyzes how graphics, charts, and headings sup-port and enhance text.
(conTinued)
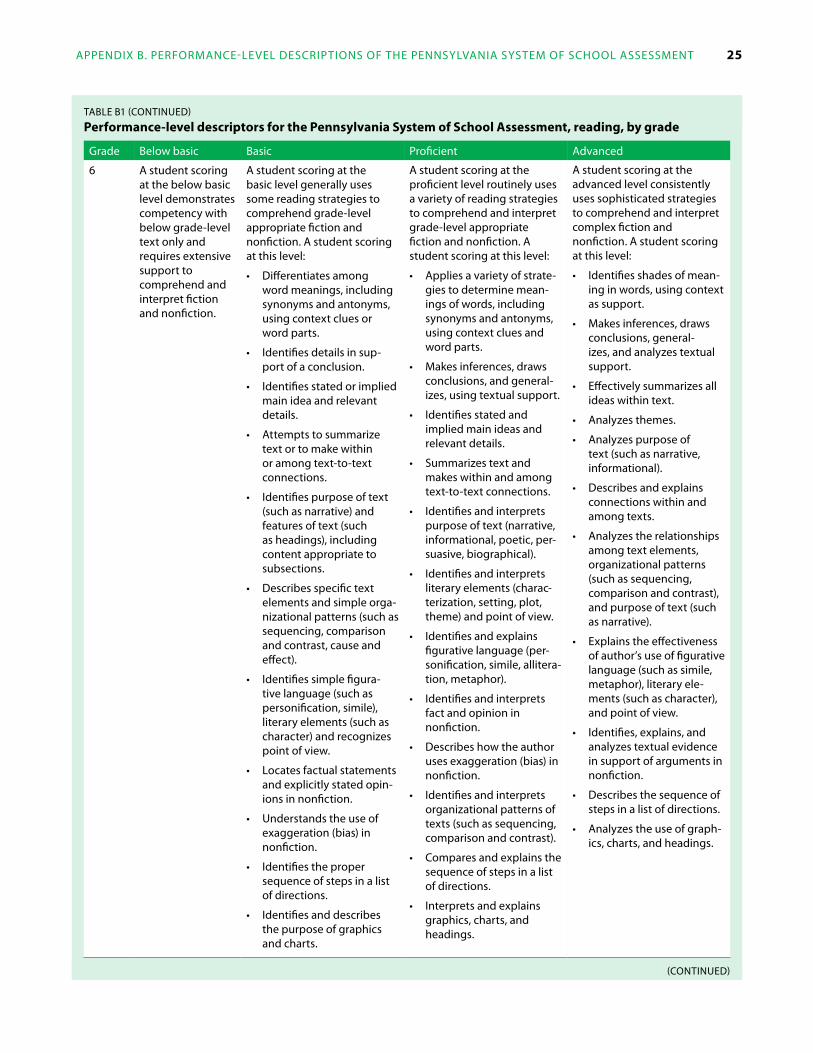
appendix b. performance-level deScripTionS of The pennSylvania SySTem of School aSSeSSmenT 25
Table b1 (conTinued)
Performance-level descriptors for the Pennsylvania system of school Assessment, reading, by grade
grade below basic basic proficient advanced
6 a student scoring at the below basic level demonstrates competency with below grade-level text only and requires extensive support to comprehend and interpret fiction and nonfiction.
a student scoring at the basic level generally uses some reading strategies to comprehend grade-level appropriate fiction and nonfiction. a student scoring at this level:
• differentiates among word meanings, including synonyms and antonyms, using context clues or word parts.
• identifies details in sup-port of a conclusion.
• identifies stated or implied main idea and relevant details.
• attempts to summarize text or to make within or among text-to-text connections.
• identifies purpose of text (such as narrative) and features of text (such as headings), including content appropriate to subsections.
• describes specific text elements and simple orga-nizational patterns (such as sequencing, comparison and contrast, cause and effect).
• identifies simple figura-tive language (such as personification, simile), literary elements (such as character) and recognizes point of view.
• locates factual statements and explicitly stated opin-ions in nonfiction.
• understands the use of exaggeration (bias) in nonfiction.
• identifies the proper sequence of steps in a list of directions.
• identifies and describes the purpose of graphics and charts.
a student scoring at the proficient level routinely uses a variety of reading strategies to comprehend and interpret grade-level appropriate fiction and nonfiction. a student scoring at this level:
• applies a variety of strate-gies to determine mean-ings of words, including synonyms and antonyms, using context clues and word parts.
• makes inferences, draws conclusions, and general-izes, using textual support.
• identifies stated and implied main ideas and relevant details.
• Summarizes text and makes within and among text-to-text connections.
• identifies and interprets purpose of text (narrative, informational, poetic, per-suasive, biographical).
• identifies and interprets literary elements (charac-terization, setting, plot, theme) and point of view.
• identifies and explains figurative language (per-sonification, simile, allitera-tion, metaphor).
• identifies and interprets fact and opinion in nonfiction.
• describes how the author uses exaggeration (bias) in nonfiction.
• identifies and interprets organizational patterns of texts (such as sequencing, comparison and contrast).
• compares and explains the sequence of steps in a list of directions.
• interprets and explains graphics, charts, and headings.
a student scoring at the advanced level consistently uses sophisticated strategies to comprehend and interpret complex fiction and nonfiction. a student scoring at this level:
• identifies shades of mean-ing in words, using context as support.
• makes inferences, draws conclusions, general-izes, and analyzes textual support.
• effectively summarizes all ideas within text.
• analyzes themes.
• analyzes purpose of text (such as narrative, informational).
• describes and explains connections within and among texts.
• analyzes the relationships among text elements, organizational patterns (such as sequencing, comparison and contrast), and purpose of text (such as narrative).
• explains the effectiveness of author’s use of figurative language (such as simile, metaphor), literary ele-ments (such as character), and point of view.
• identifies, explains, and analyzes textual evidence in support of arguments in nonfiction.
• describes the sequence of steps in a list of directions.
• analyzes the use of graph-ics, charts, and headings.
(conTinued)
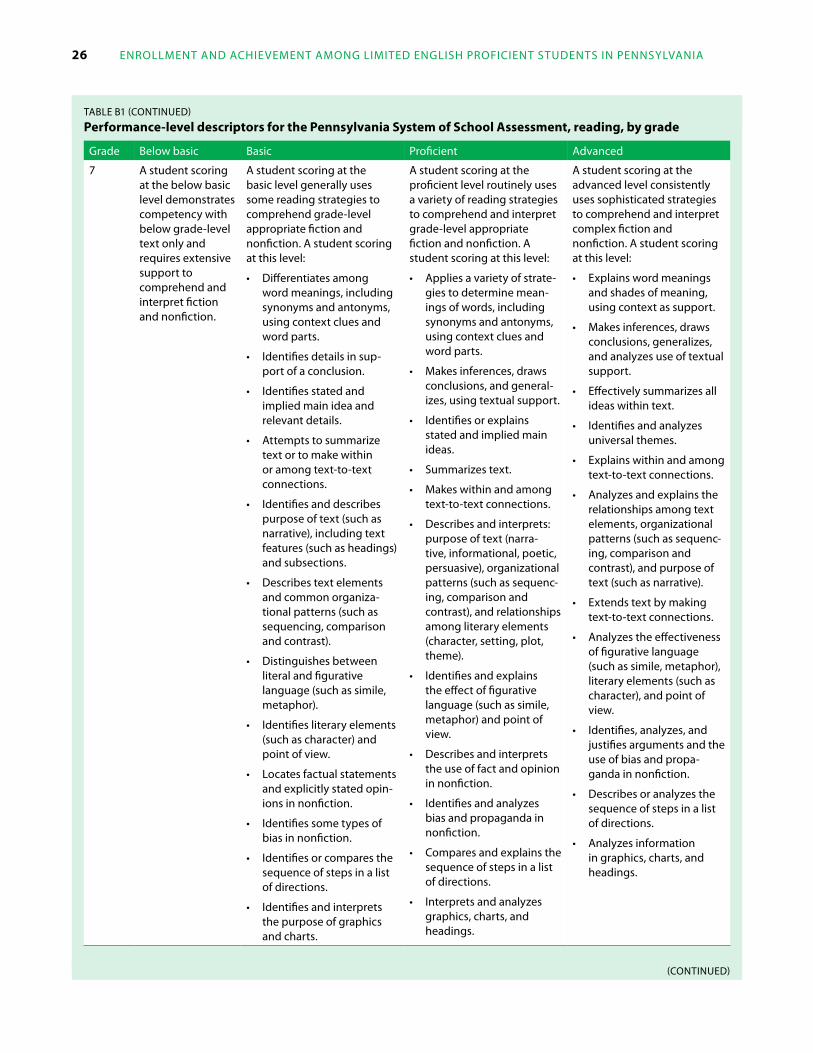
26 enrollmenT and achievemenT among limiTed engliSh proficienT STudenTS in pennSylvania
Table b1 (conTinued)
Performance-level descriptors for the Pennsylvania system of school Assessment, reading, by grade
grade below basic basic proficient advanced
7 a student scoring at the below basic level demonstrates competency with below grade-level text only and requires extensive support to comprehend and interpret fiction and nonfiction.
a student scoring at the basic level generally uses some reading strategies to comprehend grade-level appropriate fiction and nonfiction. a student scoring at this level:
• differentiates among word meanings, including synonyms and antonyms, using context clues and word parts.
• identifies details in sup-port of a conclusion.
• identifies stated and implied main idea and relevant details.
• attempts to summarize text or to make within or among text-to-text connections.
• identifies and describes purpose of text (such as narrative), including text features (such as headings) and subsections.
• describes text elements and common organiza-tional patterns (such as sequencing, comparison and contrast).
• distinguishes between literal and figurative language (such as simile, metaphor).
• identifies literary elements (such as character) and point of view.
• locates factual statements and explicitly stated opin-ions in nonfiction.
• identifies some types of bias in nonfiction.
• identifies or compares the sequence of steps in a list of directions.
• identifies and interprets the purpose of graphics and charts.
a student scoring at the proficient level routinely uses a variety of reading strategies to comprehend and interpret grade-level appropriate fiction and nonfiction. a student scoring at this level:
• applies a variety of strate-gies to determine mean-ings of words, including synonyms and antonyms, using context clues and word parts.
• makes inferences, draws conclusions, and general-izes, using textual support.
• identifies or explains stated and implied main ideas.
• Summarizes text.
• makes within and among text-to-text connections.
• describes and interprets: purpose of text (narra-tive, informational, poetic, persuasive), organizational patterns (such as sequenc-ing, comparison and contrast), and relationships among literary elements (character, setting, plot, theme).
• identifies and explains the effect of figurative language (such as simile, metaphor) and point of view.
• describes and interprets the use of fact and opinion in nonfiction.
• identifies and analyzes bias and propaganda in nonfiction.
• compares and explains the sequence of steps in a list of directions.
• interprets and analyzes graphics, charts, and headings.
a student scoring at the advanced level consistently uses sophisticated strategies to comprehend and interpret complex fiction and nonfiction. a student scoring at this level:
• explains word meanings and shades of meaning, using context as support.
• makes inferences, draws conclusions, generalizes, and analyzes use of textual support.
• effectively summarizes all ideas within text.
• identifies and analyzes universal themes.
• explains within and among text-to-text connections.
• analyzes and explains the relationships among text elements, organizational patterns (such as sequenc-ing, comparison and contrast), and purpose of text (such as narrative).
• extends text by making text-to-text connections.
• analyzes the effectiveness of figurative language (such as simile, metaphor), literary elements (such as character), and point of view.
• identifies, analyzes, and justifies arguments and the use of bias and propa-ganda in nonfiction.
• describes or analyzes the sequence of steps in a list of directions.
• analyzes information in graphics, charts, and headings.
(conTinued)

appendix b. performance-level deScripTionS of The pennSylvania SySTem of School aSSeSSmenT 27
Table b1 (conTinued)
Performance-level descriptors for the Pennsylvania system of school Assessment, reading, by grade
grade below basic basic proficient advanced
8 a student scoring at the below basic level demonstrates competency with below grade-level text only and requires extensive support to comprehend and interpret fiction and nonfiction.
a student scoring at the basic level generally uses some reading strategies to comprehend grade-level appropriate fiction and nonfiction. a student scoring at this level:
• differentiates among word meanings, including synonyms and antonyms, using context clues and word parts.
• identifies and interprets details in support of a conclusion.
• identifies stated and implied main ideas and relevant details.
• attempts to summarize text or to make within or among text-to-text connections.
• identifies and describes features of text (such as headings), including content appropriate to subsections.
• describes specific text ele-ments, common organi-zational patterns (such as sequencing, comparison and contrast), and purpose of text (such as narrative).
• identifies and interprets figurative language (such as simile, metaphor), liter-ary elements (such as char-acter), and point of view.
• differentiates between factual statements and explicitly stated opinions in nonfiction.
• identifies and describes bias in nonfiction.
• compares or explains the sequence of steps in a list of directions.
• identifies and explains the purpose of graphics and charts.
a student scoring at the proficient level routinely uses a variety of reading strategies to comprehend and interpret grade-level appropriate fiction and nonfiction. a student scoring at this level:
• applies a variety of strate-gies to determine mean-ings of words, including synonyms and antonyms, using context clues and word parts.
• makes inferences, draws conclusions, and general-izes, using textual support.
• identifies or explains stated and implied main ideas.
• Summarizes text.
• makes within and among text-to-text connections.
• interprets and analyzes: purpose of text (such as narrative, informational), organizational patterns (such as sequencing, comparison and contrast), and relationships among literary elements (charac-ter, setting, plot, theme).
• identifies and explains the effect of figurative language (such as simile, metaphor) and point of view.
• interprets and analyzes the use of facts and opinions in nonfiction.
• identifies and analyzes bias and propaganda in nonfiction.
• describes and analyzes the sequence of steps in a list of directions.
• interprets and analyzes graphics and charts.
a student scoring at the advanced level consistently uses sophisticated strategies to comprehend and interpret complex fiction and nonfiction. a student scoring at this level:
• analyzes and explains the use of word meanings and shades of meaning.
• makes inferences, draws conclusions, generalizes, and evaluates supporting details.
• effectively summarizes all ideas within text.
• Summarizes or evaluates abstract themes.
• analyzes and explains within and among text-to-text connections.
• analyzes and explains differences among the features and the purposes of different texts.
• analyzes and evaluates the relationships among text elements, organizational patterns (such as sequenc-ing, comparison and contrast), and purpose of text (such as narrative).
• analyzes the effect of figu-rative language (such as simile, metaphor), literary elements (such as charac-ter), and point of view.
• identifies, analyzes, and evaluates textual evidence supporting multiple argu-ments and the use of bias and propaganda.
• analyzes and explains the connection between text and graphics.
(conTinued)
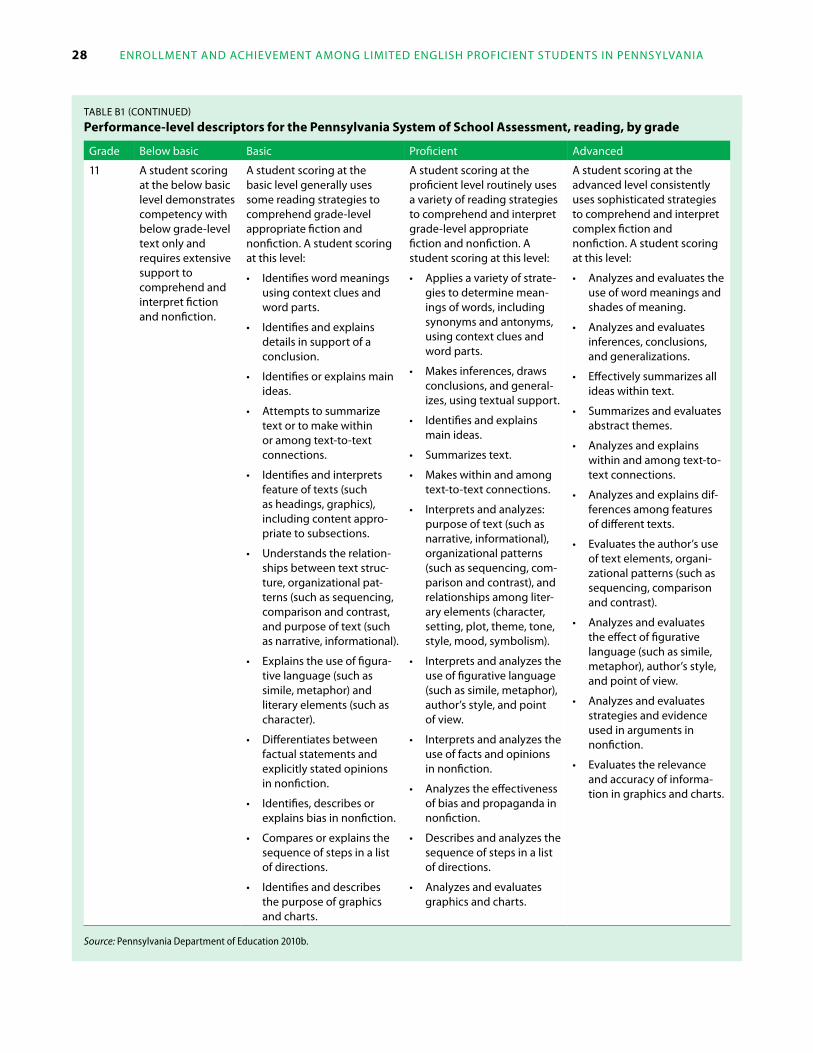
28 enrollmenT and achievemenT among limiTed engliSh proficienT STudenTS in pennSylvania
Table b1 (conTinued)
Performance-level descriptors for the Pennsylvania system of school Assessment, reading, by grade
grade below basic basic proficient advanced
11 a student scoring at the below basic level demonstrates competency with below grade-level text only and requires extensive support to comprehend and interpret fiction and nonfiction.
a student scoring at the basic level generally uses some reading strategies to comprehend grade-level appropriate fiction and nonfiction. a student scoring at this level:
• identifies word meanings using context clues and word parts.
• identifies and explains details in support of a conclusion.
• identifies or explains main ideas.
• attempts to summarize text or to make within or among text-to-text connections.
• identifies and interprets feature of texts (such as headings, graphics), including content appro-priate to subsections.
• understands the relation-ships between text struc-ture, organizational pat-terns (such as sequencing, comparison and contrast, and purpose of text (such as narrative, informational).
• explains the use of figura-tive language (such as simile, metaphor) and literary elements (such as character).
• differentiates between factual statements and explicitly stated opinions in nonfiction.
• identifies, describes or explains bias in nonfiction.
• compares or explains the sequence of steps in a list of directions.
• identifies and describes the purpose of graphics and charts.
a student scoring at the proficient level routinely uses a variety of reading strategies to comprehend and interpret grade-level appropriate fiction and nonfiction. a student scoring at this level:
• applies a variety of strate-gies to determine mean-ings of words, including synonyms and antonyms, using context clues and word parts.
• makes inferences, draws conclusions, and general-izes, using textual support.
• identifies and explains main ideas.
• Summarizes text.
• makes within and among text-to-text connections.
• interprets and analyzes: purpose of text (such as narrative, informational), organizational patterns (such as sequencing, com-parison and contrast), and relationships among liter-ary elements (character, setting, plot, theme, tone, style, mood, symbolism).
• interprets and analyzes the use of figurative language (such as simile, metaphor), author’s style, and point of view.
• interprets and analyzes the use of facts and opinions in nonfiction.
• analyzes the effectiveness of bias and propaganda in nonfiction.
• describes and analyzes the sequence of steps in a list of directions.
• analyzes and evaluates graphics and charts.
a student scoring at the advanced level consistently uses sophisticated strategies to comprehend and interpret complex fiction and nonfiction. a student scoring at this level:
• analyzes and evaluates the use of word meanings and shades of meaning.
• analyzes and evaluates inferences, conclusions, and generalizations.
• effectively summarizes all ideas within text.
• Summarizes and evaluates abstract themes.
• analyzes and explains within and among text-to-text connections.
• analyzes and explains dif-ferences among features of different texts.
• evaluates the author’s use of text elements, organi-zational patterns (such as sequencing, comparison and contrast).
• analyzes and evaluates the effect of figurative language (such as simile, metaphor), author’s style, and point of view.
• analyzes and evaluates strategies and evidence used in arguments in nonfiction.
• evaluates the relevance and accuracy of informa-tion in graphics and charts.
Source: Pennsylvania Department of Education 2010b.
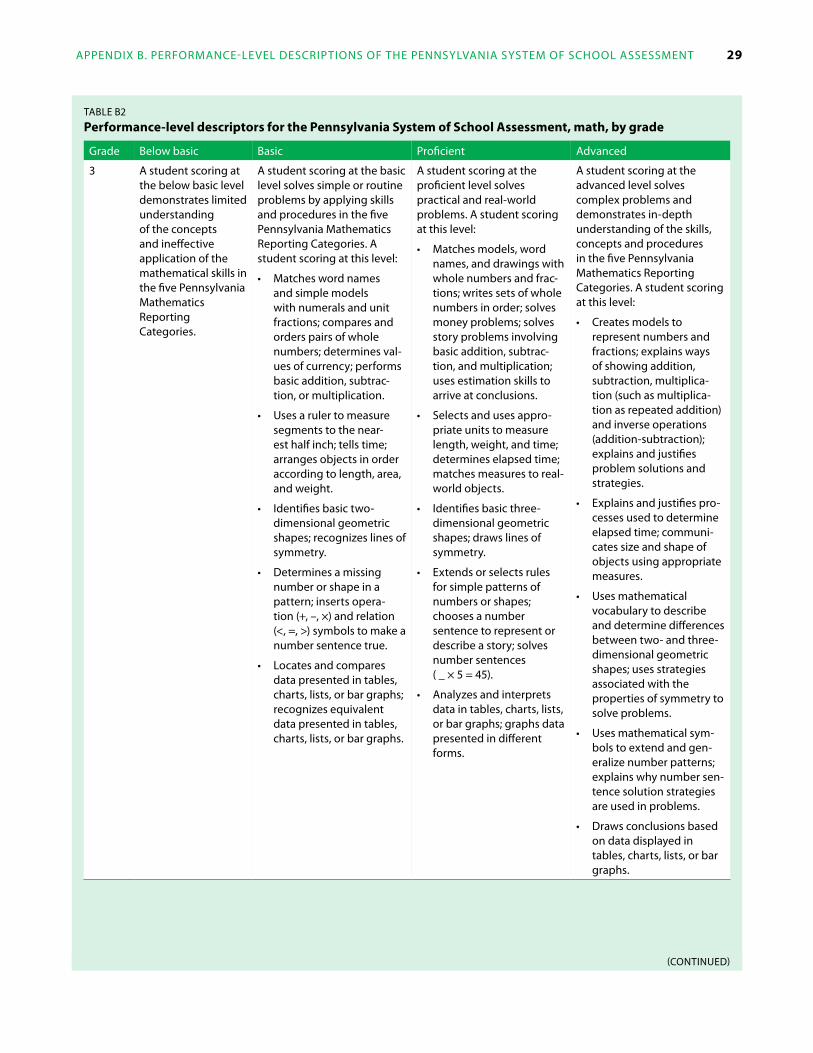
appendix b. performance-level deScripTionS of The pennSylvania SySTem of School aSSeSSmenT 29
Table b2
Performance-level descriptors for the Pennsylvania system of school Assessment, math, by grade
grade below basic basic proficient advanced
3 a student scoring at the below basic level demonstrates limited understanding of the concepts and ineffective application of the mathematical skills in the five pennsylvania mathematics reporting categories.
a student scoring at the basic level solves simple or routine problems by applying skills and procedures in the five pennsylvania mathematics reporting categories. a student scoring at this level:
• matches word names and simple models with numerals and unit fractions; compares and orders pairs of whole numbers; determines val-ues of currency; performs basic addition, subtrac-tion, or multiplication.
• uses a ruler to measure segments to the near-est half inch; tells time; arranges objects in order according to length, area, and weight.
• identifies basic two-dimensional geometric shapes; recognizes lines of symmetry.
• determines a missing number or shape in a pattern; inserts opera-tion (+, –, ×) and relation (<, =, >) symbols to make a number sentence true.
• locates and compares data presented in tables, charts, lists, or bar graphs; recognizes equivalent data presented in tables, charts, lists, or bar graphs.
a student scoring at the proficient level solves practical and real-world problems. a student scoring at this level:
• matches models, word names, and drawings with whole numbers and frac-tions; writes sets of whole numbers in order; solves money problems; solves story problems involving basic addition, subtrac-tion, and multiplication; uses estimation skills to arrive at conclusions.
• Selects and uses appro-priate units to measure length, weight, and time; determines elapsed time; matches measures to real-world objects.
• identifies basic three- dimensional geometric shapes; draws lines of symmetry.
• extends or selects rules for simple patterns of numbers or shapes; chooses a number sentence to represent or describe a story; solves number sentences ( _ × 5 = 45).
• analyzes and interprets data in tables, charts, lists, or bar graphs; graphs data presented in different forms.
a student scoring at the advanced level solves complex problems and demonstrates in-depth understanding of the skills, concepts and procedures in the five pennsylvania mathematics reporting categories. a student scoring at this level:
• creates models to represent numbers and fractions; explains ways of showing addition, subtraction, multiplica-tion (such as multiplica-tion as repeated addition) and inverse operations (addition-subtraction); explains and justifies problem solutions and strategies.
• explains and justifies pro-cesses used to determine elapsed time; communi-cates size and shape of objects using appropriate measures.
• uses mathematical vocabulary to describe and determine differences between two- and three-dimensional geometric shapes; uses strategies associated with the properties of symmetry to solve problems.
• uses mathematical sym-bols to extend and gen-eralize number patterns; explains why number sen-tence solution strategies are used in problems.
• draws conclusions based on data displayed in tables, charts, lists, or bar graphs.
(conTinued)
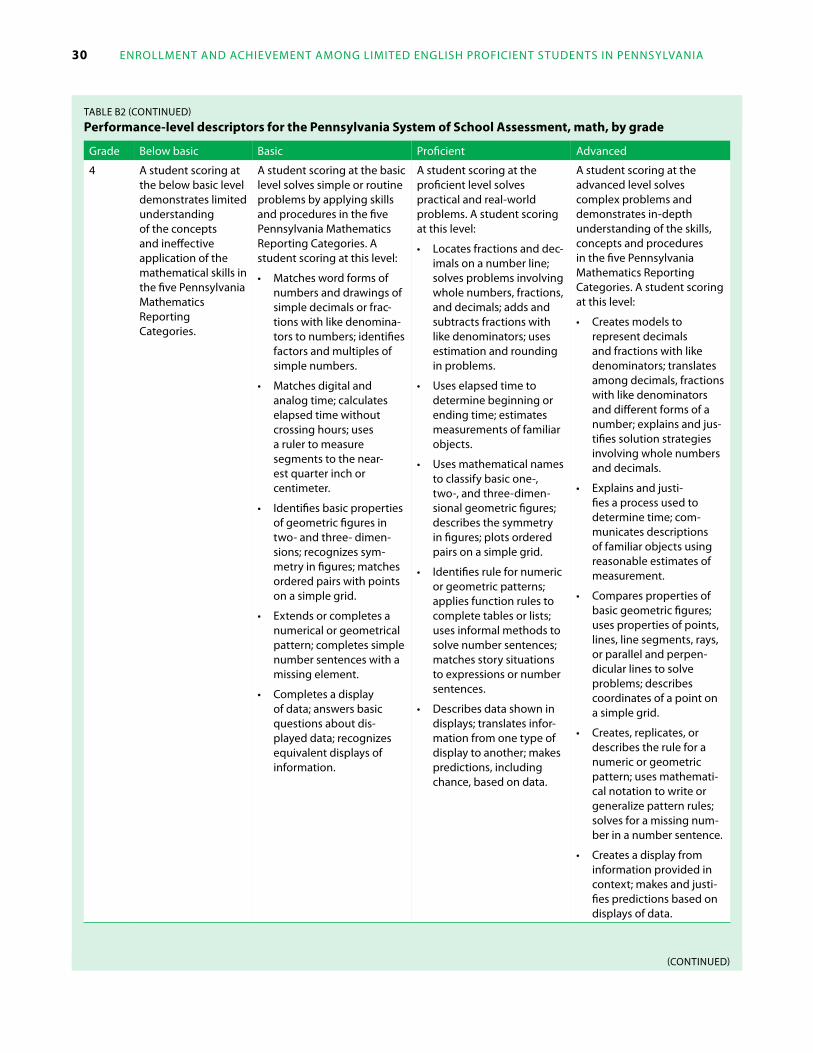
30 enrollmenT and achievemenT among limiTed engliSh proficienT STudenTS in pennSylvania
Table b2 (conTinued)
Performance-level descriptors for the Pennsylvania system of school Assessment, math, by grade
grade below basic basic proficient advanced
4 a student scoring at the below basic level demonstrates limited understanding of the concepts and ineffective application of the mathematical skills in the five pennsylvania mathematics reporting categories.
a student scoring at the basic level solves simple or routine problems by applying skills and procedures in the five pennsylvania mathematics reporting categories. a student scoring at this level:
• matches word forms of numbers and drawings of simple decimals or frac-tions with like denomina-tors to numbers; identifies factors and multiples of simple numbers.
• matches digital and analog time; calculates elapsed time without crossing hours; uses a ruler to measure segments to the near-est quarter inch or centimeter.
• identifies basic properties of geometric figures in two- and three- dimen-sions; recognizes sym-metry in figures; matches ordered pairs with points on a simple grid.
• extends or completes a numerical or geometrical pattern; completes simple number sentences with a missing element.
• completes a display of data; answers basic questions about dis-played data; recognizes equivalent displays of information.
a student scoring at the proficient level solves practical and real-world problems. a student scoring at this level:
• locates fractions and dec-imals on a number line; solves problems involving whole numbers, fractions, and decimals; adds and subtracts fractions with like denominators; uses estimation and rounding in problems.
• uses elapsed time to determine beginning or ending time; estimates measurements of familiar objects.
• uses mathematical names to classify basic one-, two-, and three-dimen-sional geometric figures; describes the symmetry in figures; plots ordered pairs on a simple grid.
• identifies rule for numeric or geometric patterns; applies function rules to complete tables or lists; uses informal methods to solve number sentences; matches story situations to expressions or number sentences.
• describes data shown in displays; translates infor-mation from one type of display to another; makes predictions, including chance, based on data.
a student scoring at the advanced level solves complex problems and demonstrates in-depth understanding of the skills, concepts and procedures in the five pennsylvania mathematics reporting categories. a student scoring at this level:
• creates models to represent decimals and fractions with like denominators; translates among decimals, fractions with like denominators and different forms of a number; explains and jus-tifies solution strategies involving whole numbers and decimals.
• explains and justi-fies a process used to determine time; com-municates descriptions of familiar objects using reasonable estimates of measurement.
• compares properties of basic geometric figures; uses properties of points, lines, line segments, rays, or parallel and perpen-dicular lines to solve problems; describes coordinates of a point on a simple grid.
• creates, replicates, or describes the rule for a numeric or geometric pattern; uses mathemati-cal notation to write or generalize pattern rules; solves for a missing num-ber in a number sentence.
• creates a display from information provided in context; makes and justi-fies predictions based on displays of data.
(conTinued)

appendix b. performance-level deScripTionS of The pennSylvania SySTem of School aSSeSSmenT 31
Table b2 (conTinued)
Performance-level descriptors for the Pennsylvania system of school Assessment, math, by grade
grade below basic basic proficient advanced
5 a student scoring at the below basic level demonstrates limited understand-ing of the concepts and ineffective application of the mathematical skills in the five pennsylvania mathematics report-ing categories.
a student scoring at the basic level solves simple or routine problems by applying skills and procedures in the five pennsylvania mathematics reporting categories. a stu-dent scoring at this level:
• matches whole numbers with equivalent expanded notations; uses circle graphs, base 10 blocks, and the like to model basic fractions; rounds, compares, and computes with whole numbers and decimals; orders decimals; solves problems involving elementary addition, sub-traction, or multiplication.
• Selects and uses appro-priate units to measure elementary examples of weight (mass), capacity, length, perimeter, or area; converts measurements within the same system.
• identifies properties of basic one- and two-dimensional figures; iden-tifies simple translations, reflections, and rotations; locates and identifies points on a grid.
• determines a missing element in a basic pattern of numbers or geometric shapes; matches a simple story situation to an equa-tion or expression.
• makes elementary interpretations of data displays; determines the degree of likelihood of a clearly defined event.
a student scoring at the pro-ficient level solves practical and real world problems. a student scoring at this level:
• Writes rational numbers, including decimals, in word form or expanded form; locates integers on a number line; lists factors and multiples of whole numbers; solves real-world problems involving whole numbers and deci-mals without a calculator, including whole number division; uses estimation to solve problems; identi-fies prime and composite numbers.
• estimates, calculates, or compares perimeters and areas of polygons or fig-ures, with or without a grid; solves real-world problems involving measures, includ-ing time, temperature, and conversions within the metric system.
• uses properties of one-, two-, and three dimen-sional figures; describes translations, reflections, rotations, and lines of symmetry; plots points in the first quadrant of a grid.
• extends patterns of num-bers or geometric shapes using samples or rules; writes a rule to describe a pattern; selects an inequality, table, or graph to describe a realistic situation; solves simple number sentences with or without variables.
• interprets data in different display formats, including pictographs, tallies, tables, charts, line graphs, or bar graphs; determines mean, median, range, and prob-ability of a simple event.
a student scoring at the ad-vanced level solves complex problems and demonstrates in-depth understanding of the skills, concepts and pro-cedures in the five pennsyl-vania mathematics reporting categories. a student scoring at this level:
• creates equivalent repre-sentations and regions or sets of rational numbers; explains and justifies solution strategies involv-ing rational numbers, including integers; applies concepts of prime and composite numbers.
• explains methods used to estimate areas of irregular figures; communicates and compares results of measurements using appropriate form and units; uses and justifies solution strategies for complex measurement problems.
• uses mathematical terminology to compare and explain relation-ships between pairs of quadrilaterals or common three-dimensional figures; creates examples of trans-lations, reflections, rota-tions, and symmetries.
• Writes a rule for complex patterns of numbers or geometric shapes; describes strategies to solve problems and explains reasoning.
• creates and evaluates different types of data displays; describes data using mean, median, range, and probability.
(conTinued)

32 enrollmenT and achievemenT among limiTed engliSh proficienT STudenTS in pennSylvania
Table b2 (conTinued)
Performance-level descriptors for the Pennsylvania system of school Assessment, math, by grade
grade below basic basic proficient advanced
6 a student scoring at the below basic level demonstrates limited understand-ing of the concepts and ineffective application of the mathematical skills in the five pennsylvania mathematics report-ing categories.
a student scoring at the basic level solves simple or routine problems by applying skills and procedures in the five pennsylvania mathematics reporting categories. a stu-dent scoring at this level:
• Writes simplified forms of fractions and decimals in order; recognizes or selects common percents when presented as draw-ings, graphs, and the like; uses operations on frac-tions, decimals, and whole numbers to solve basic problems.
• determines elapsed times in noncomplex settings; classifies angles in basic categories (acute, right, and the like); uses a ruler to make measurements to the nearest sixteenth of an inch or millimeter.
• identifies basic charac-teristics and properties of polygons, including num-ber of sides, number of angles, and relative lengths of sides; uses angle and side relationships within triangles to solve simple problems; recognizes basic relationships (parallel, per-pendicular, and intersect-ing) between pairs of lines or segments in a plane.
• recognizes simple whole number patterns found in charts, tables, graphs, or lists; identifies inverse relationships between addition and subtraction and between multiplica-tion and division.
• identifies and draws conclusions from basic dis-plays of data; recognizes the mean, median, mode, or range calculated from groups of data; finds prob-ability of simple events.
a student scoring at the pro-ficient level solves practical and real-world problems. a student scoring at this level:
• Writes or recognizes percents, fractions, and decimals in equivalent forms; uses divisibility tests and determines factors and multiples of numbers; solves multistep problems with fractions, decimals, and whole numbers; uses estimation to solve problems.
• determines and compares elapsed times in problem-solving situations; uses a protractor to measure angles; determines the perimeters of polygons.
• determines the diameter or radius of a circle when one or the other is given; uses basic properties of sides and angles to iden-tify or classify polygons; labels drawings of two- and three-dimensional models illustrating rela-tionships of lines or line segments; plots points on the coordinate plane.
• determines a rule to describe a pattern; uses inverse-operation strate-gies to solve one-step equations; recognizes expressions, equations, or inequalities that model verbal math situations.
• analyzes data displayed in a variety of forms; shows data in graphs, tables, or line plots; determines mean, median, mode, and range using data of up to two digits; determines combinations from sets of data.
a student scoring at the ad-vanced level solves complex problems and demonstrates in-depth understanding of the skills, concepts and pro-cedures in the five pennsyl-vania mathematics reporting categories. a student scoring at this level:
• creates models to repre-sent percents; analyzes and uses properties of equations; justifies solu-tion techniques and solu-tions to complex prob-lems involving rational numbers.
• Solves problems involving measurements of geo-metric figures; describes, identifies, and selects geometric figures based on their angle and linear measures.
• uses geometric properties to describe characteristics of polygons; draws or describes basic geometric figures on a coordinate plane; solves and justifies solutions to problems involving geometric properties of circles and polygons.
• creates a rule-based pattern in a visual display; uses mathematical lan-guage to describe a rule for a pattern; develops mathematical representa-tions of complex problem settings.
• creates and defends appropriate representa-tions for sets of data; evaluates data based on graphical displays and measures of central tendency; creates and describes strategies used to analyze simple events.
(conTinued)
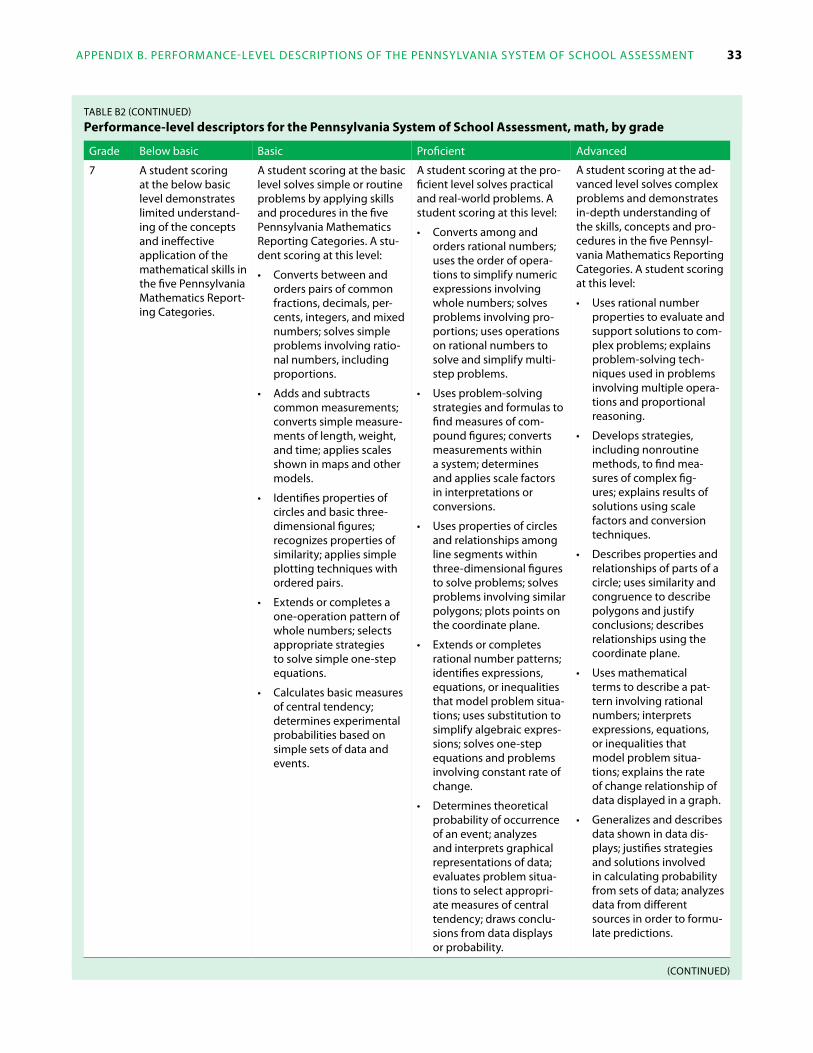
appendix b. performance-level deScripTionS of The pennSylvania SySTem of School aSSeSSmenT 33
Table b2 (conTinued)
Performance-level descriptors for the Pennsylvania system of school Assessment, math, by grade
grade below basic basic proficient advanced
7 a student scoring at the below basic level demonstrates limited understand-ing of the concepts and ineffective application of the mathematical skills in the five pennsylvania mathematics report-ing categories.
a student scoring at the basic level solves simple or routine problems by applying skills and procedures in the five pennsylvania mathematics reporting categories. a stu-dent scoring at this level:
• converts between and orders pairs of common fractions, decimals, per-cents, integers, and mixed numbers; solves simple problems involving ratio-nal numbers, including proportions.
• adds and subtracts common measurements; converts simple measure-ments of length, weight, and time; applies scales shown in maps and other models.
• identifies properties of circles and basic three-dimensional figures; recognizes properties of similarity; applies simple plotting techniques with ordered pairs.
• extends or completes a one-operation pattern of whole numbers; selects appropriate strategies to solve simple one-step equations.
• calculates basic measures of central tendency; determines experimental probabilities based on simple sets of data and events.
a student scoring at the pro-ficient level solves practical and real-world problems. a student scoring at this level:
• converts among and orders rational numbers; uses the order of opera-tions to simplify numeric expressions involving whole numbers; solves problems involving pro-portions; uses operations on rational numbers to solve and simplify multi-step problems.
• uses problem-solving strategies and formulas to find measures of com-pound figures; converts measurements within a system; determines and applies scale factors in interpretations or conversions.
• uses properties of circles and relationships among line segments within three-dimensional figures to solve problems; solves problems involving similar polygons; plots points on the coordinate plane.
• extends or completes rational number patterns; identifies expressions, equations, or inequalities that model problem situa-tions; uses substitution to simplify algebraic expres-sions; solves one-step equations and problems involving constant rate of change.
• determines theoretical probability of occurrence of an event; analyzes and interprets graphical representations of data; evaluates problem situa-tions to select appropri-ate measures of central tendency; draws conclu-sions from data displays or probability.
a student scoring at the ad-vanced level solves complex problems and demonstrates in-depth understanding of the skills, concepts and pro-cedures in the five pennsyl-vania mathematics reporting categories. a student scoring at this level:
• uses rational number properties to evaluate and support solutions to com-plex problems; explains problem-solving tech-niques used in problems involving multiple opera-tions and proportional reasoning.
• develops strategies, including nonroutine methods, to find mea-sures of complex fig-ures; explains results of solutions using scale factors and conversion techniques.
• describes properties and relationships of parts of a circle; uses similarity and congruence to describe polygons and justify conclusions; describes relationships using the coordinate plane.
• uses mathematical terms to describe a pat-tern involving rational numbers; interprets expressions, equations, or inequalities that model problem situa-tions; explains the rate of change relationship of data displayed in a graph.
• generalizes and describes data shown in data dis-plays; justifies strategies and solutions involved in calculating probability from sets of data; analyzes data from different sources in order to formu-late predictions.
(conTinued)
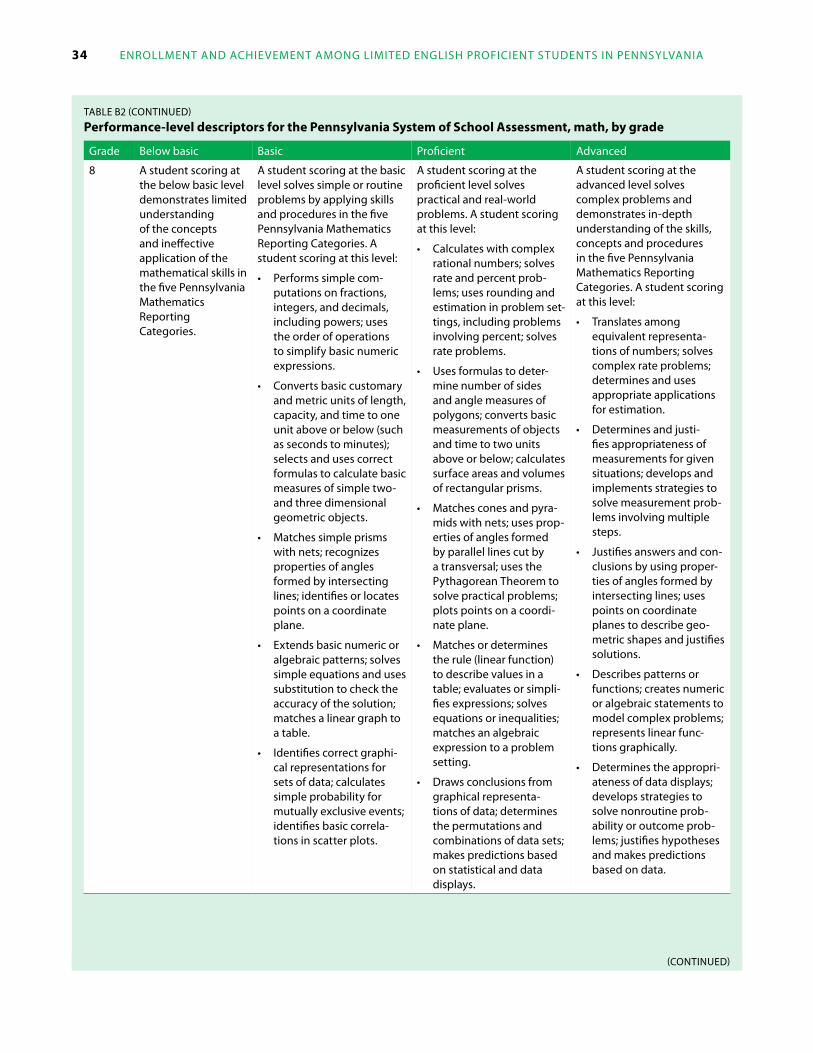
34 enrollmenT and achievemenT among limiTed engliSh proficienT STudenTS in pennSylvania
Table b2 (conTinued)
Performance-level descriptors for the Pennsylvania system of school Assessment, math, by grade
grade below basic basic proficient advanced
8 a student scoring at the below basic level demonstrates limited understanding of the concepts and ineffective application of the mathematical skills in the five pennsylvania mathematics reporting categories.
a student scoring at the basic level solves simple or routine problems by applying skills and procedures in the five pennsylvania mathematics reporting categories. a student scoring at this level:
• performs simple com-putations on fractions, integers, and decimals, including powers; uses the order of operations to simplify basic numeric expressions.
• converts basic customary and metric units of length, capacity, and time to one unit above or below (such as seconds to minutes); selects and uses correct formulas to calculate basic measures of simple two- and three dimensional geometric objects.
• matches simple prisms with nets; recognizes properties of angles formed by intersecting lines; identifies or locates points on a coordinate plane.
• extends basic numeric or algebraic patterns; solves simple equations and uses substitution to check the accuracy of the solution; matches a linear graph to a table.
• identifies correct graphi-cal representations for sets of data; calculates simple probability for mutually exclusive events; identifies basic correla-tions in scatter plots.
a student scoring at the proficient level solves practical and real-world problems. a student scoring at this level:
• calculates with complex rational numbers; solves rate and percent prob-lems; uses rounding and estimation in problem set-tings, including problems involving percent; solves rate problems.
• uses formulas to deter-mine number of sides and angle measures of polygons; converts basic measurements of objects and time to two units above or below; calculates surface areas and volumes of rectangular prisms.
• matches cones and pyra-mids with nets; uses prop-erties of angles formed by parallel lines cut by a transversal; uses the pythagorean Theorem to solve practical problems; plots points on a coordi-nate plane.
• matches or determines the rule (linear function) to describe values in a table; evaluates or simpli-fies expressions; solves equations or inequalities; matches an algebraic expression to a problem setting.
• draws conclusions from graphical representa-tions of data; determines the permutations and combinations of data sets; makes predictions based on statistical and data displays.
a student scoring at the advanced level solves complex problems and demonstrates in-depth understanding of the skills, concepts and procedures in the five pennsylvania mathematics reporting categories. a student scoring at this level:
• Translates among equivalent representa-tions of numbers; solves complex rate problems; determines and uses appropriate applications for estimation.
• determines and justi-fies appropriateness of measurements for given situations; develops and implements strategies to solve measurement prob-lems involving multiple steps.
• Justifies answers and con-clusions by using proper-ties of angles formed by intersecting lines; uses points on coordinate planes to describe geo-metric shapes and justifies solutions.
• describes patterns or functions; creates numeric or algebraic statements to model complex problems; represents linear func-tions graphically.
• determines the appropri-ateness of data displays; develops strategies to solve nonroutine prob-ability or outcome prob-lems; justifies hypotheses and makes predictions based on data.
(conTinued)
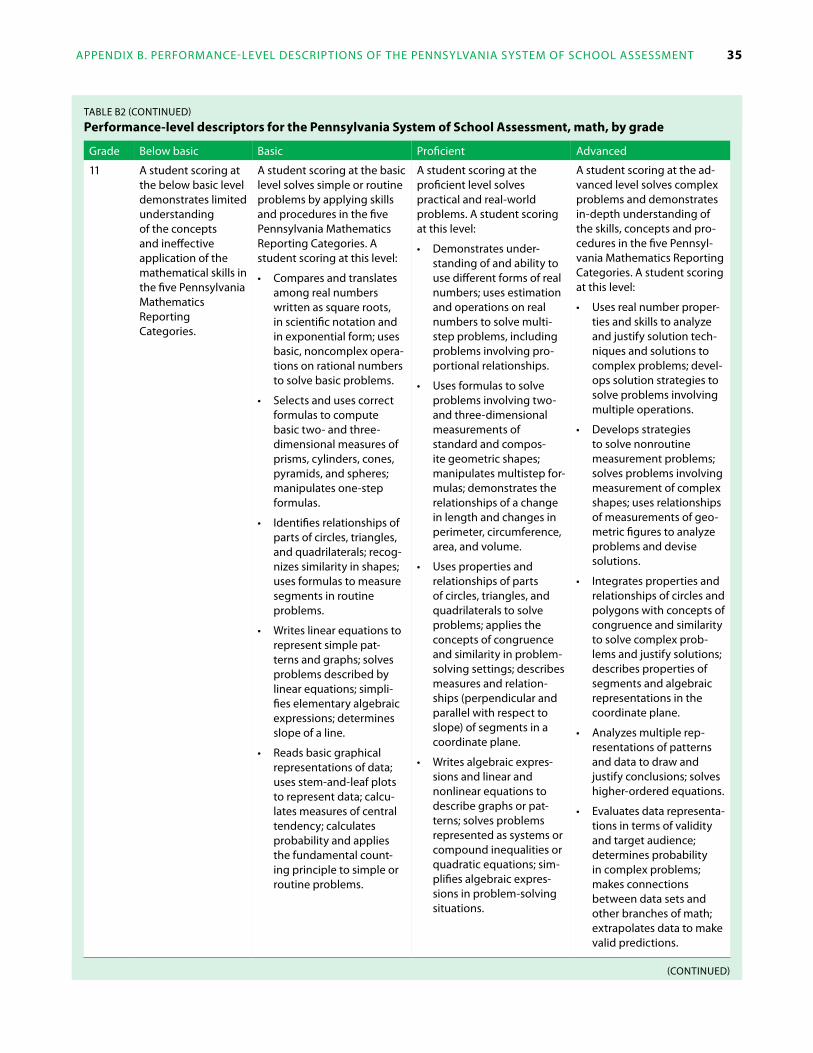
appendix b. performance-level deScripTionS of The pennSylvania SySTem of School aSSeSSmenT 35
Table b2 (conTinued)
Performance-level descriptors for the Pennsylvania system of school Assessment, math, by grade
grade below basic basic proficient advanced
11 a student scoring at the below basic level demonstrates limited understanding of the concepts and ineffective application of the mathematical skills in the five pennsylvania mathematics reporting categories.
a student scoring at the basic level solves simple or routine problems by applying skills and procedures in the five pennsylvania mathematics reporting categories. a student scoring at this level:
• compares and translates among real numbers written as square roots, in scientific notation and in exponential form; uses basic, noncomplex opera-tions on rational numbers to solve basic problems.
• Selects and uses correct formulas to compute basic two- and three-dimensional measures of prisms, cylinders, cones, pyramids, and spheres; manipulates one-step formulas.
• identifies relationships of parts of circles, triangles, and quadrilaterals; recog-nizes similarity in shapes; uses formulas to measure segments in routine problems.
• Writes linear equations to represent simple pat-terns and graphs; solves problems described by linear equations; simpli-fies elementary algebraic expressions; determines slope of a line.
• reads basic graphical representations of data; uses stem-and-leaf plots to represent data; calcu-lates measures of central tendency; calculates probability and applies the fundamental count-ing principle to simple or routine problems.
a student scoring at the proficient level solves practical and real-world problems. a student scoring at this level:
• demonstrates under-standing of and ability to use different forms of real numbers; uses estimation and operations on real numbers to solve multi-step problems, including problems involving pro-portional relationships.
• uses formulas to solve problems involving two- and three-dimensional measurements of standard and compos-ite geometric shapes; manipulates multistep for-mulas; demonstrates the relationships of a change in length and changes in perimeter, circumference, area, and volume.
• uses properties and relationships of parts of circles, triangles, and quadrilaterals to solve problems; applies the concepts of congruence and similarity in problem-solving settings; describes measures and relation-ships (perpendicular and parallel with respect to slope) of segments in a coordinate plane.
• Writes algebraic expres-sions and linear and nonlinear equations to describe graphs or pat-terns; solves problems represented as systems or compound inequalities or quadratic equations; sim-plifies algebraic expres-sions in problem-solving situations.
a student scoring at the ad-vanced level solves complex problems and demonstrates in-depth understanding of the skills, concepts and pro-cedures in the five pennsyl-vania mathematics reporting categories. a student scoring at this level:
• uses real number proper-ties and skills to analyze and justify solution tech-niques and solutions to complex problems; devel-ops solution strategies to solve problems involving multiple operations.
• develops strategies to solve nonroutine measurement problems; solves problems involving measurement of complex shapes; uses relationships of measurements of geo-metric figures to analyze problems and devise solutions.
• integrates properties and relationships of circles and polygons with concepts of congruence and similarity to solve complex prob-lems and justify solutions; describes properties of segments and algebraic representations in the coordinate plane.
• analyzes multiple rep-resentations of patterns and data to draw and justify conclusions; solves higher-ordered equations.
• evaluates data representa-tions in terms of validity and target audience; determines probability in complex problems; makes connections between data sets and other branches of math; extrapolates data to make valid predictions.
(conTinued)
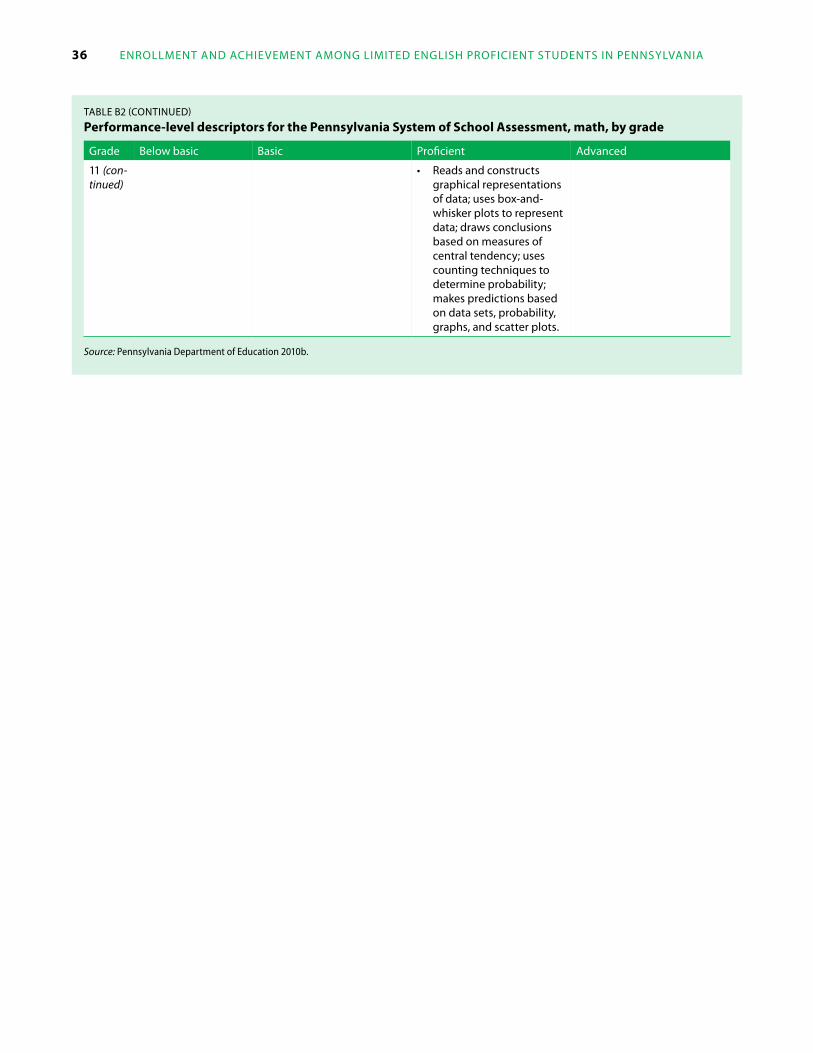
36 enrollmenT and achievemenT among limiTed engliSh proficienT STudenTS in pennSylvania
Table b2 (conTinued)
Performance-level descriptors for the Pennsylvania system of school Assessment, math, by grade
grade below basic basic proficient advanced
11 (con-tinued)
• reads and constructs graphical representations of data; uses box-and-whisker plots to represent data; draws conclusions based on measures of central tendency; uses counting techniques to determine probability; makes predictions based on data sets, probability, graphs, and scatter plots.
Source: Pennsylvania Department of Education 2010b.
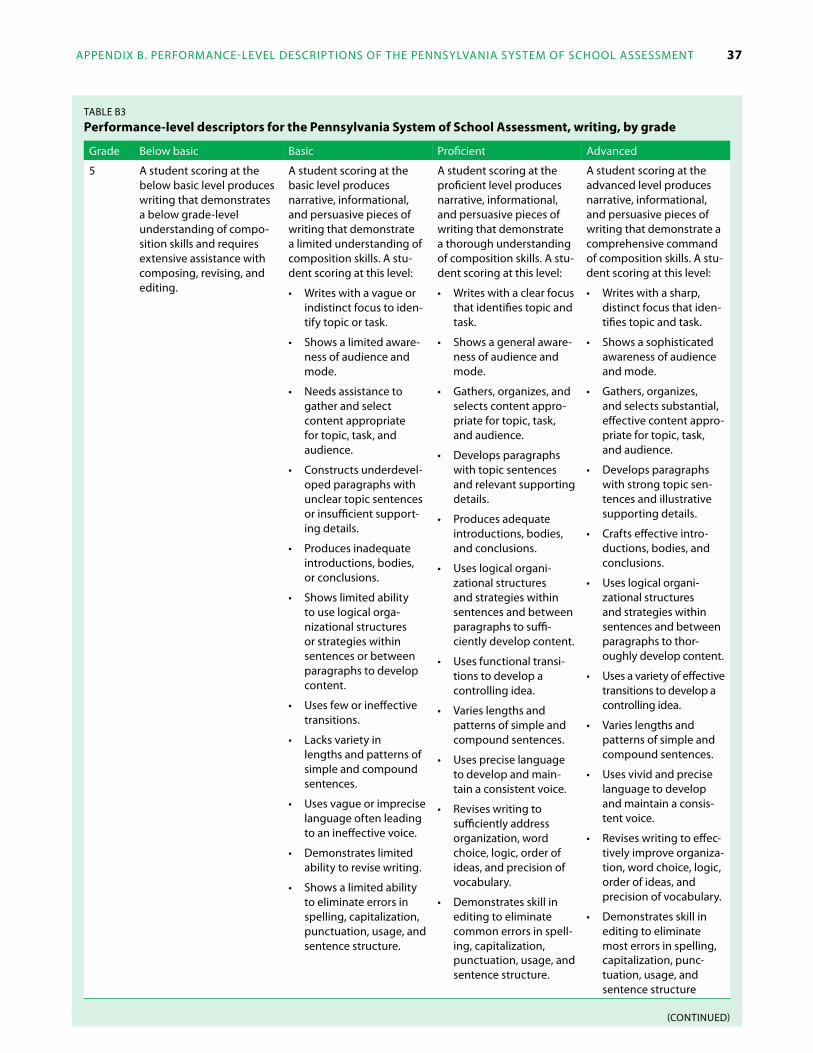
appendix b. performance-level deScripTionS of The pennSylvania SySTem of School aSSeSSmenT 37
Table b3
Performance-level descriptors for the Pennsylvania system of school Assessment, writing, by grade
grade below basic basic proficient advanced
5 a student scoring at the below basic level produces writing that demonstrates a below grade-level understanding of compo-sition skills and requires extensive assistance with composing, revising, and editing.
a student scoring at the basic level produces narrative, informational, and persuasive pieces of writing that demonstrate a limited understanding of composition skills. a stu-dent scoring at this level:
• Writes with a vague or indistinct focus to iden-tify topic or task.
• Shows a limited aware-ness of audience and mode.
• needs assistance to gather and select content appropriate for topic, task, and audience.
• constructs underdevel-oped paragraphs with unclear topic sentences or insufficient support-ing details.
• produces inadequate introductions, bodies, or conclusions.
• Shows limited ability to use logical orga-nizational structures or strategies within sentences or between paragraphs to develop content.
• uses few or ineffective transitions.
• lacks variety in lengths and patterns of simple and compound sentences.
• uses vague or imprecise language often leading to an ineffective voice.
• demonstrates limited ability to revise writing.
• Shows a limited ability to eliminate errors in spelling, capitalization, punctuation, usage, and sentence structure.
a student scoring at the proficient level produces narrative, informational, and persuasive pieces of writing that demonstrate a thorough understanding of composition skills. a stu-dent scoring at this level:
• Writes with a clear focus that identifies topic and task.
• Shows a general aware-ness of audience and mode.
• gathers, organizes, and selects content appro-priate for topic, task, and audience.
• develops paragraphs with topic sentences and relevant supporting details.
• produces adequate introductions, bodies, and conclusions.
• uses logical organi-zational structures and strategies within sentences and between paragraphs to suffi-ciently develop content.
• uses functional transi-tions to develop a controlling idea.
• varies lengths and patterns of simple and compound sentences.
• uses precise language to develop and main-tain a consistent voice.
• revises writing to sufficiently address organization, word choice, logic, order of ideas, and precision of vocabulary.
• demonstrates skill in editing to eliminate common errors in spell-ing, capitalization, punctuation, usage, and sentence structure.
a student scoring at the advanced level produces narrative, informational, and persuasive pieces of writing that demonstrate a comprehensive command of composition skills. a stu-dent scoring at this level:
• Writes with a sharp, distinct focus that iden-tifies topic and task.
• Shows a sophisticated awareness of audience and mode.
• gathers, organizes, and selects substantial, effective content appro-priate for topic, task, and audience.
• develops paragraphs with strong topic sen-tences and illustrative supporting details.
• crafts effective intro-ductions, bodies, and conclusions.
• uses logical organi-zational structures and strategies within sentences and between paragraphs to thor-oughly develop content.
• uses a variety of effective transitions to develop a controlling idea.
• varies lengths and patterns of simple and compound sentences.
• uses vivid and precise language to develop and maintain a consis-tent voice.
• revises writing to effec-tively improve organiza-tion, word choice, logic, order of ideas, and precision of vocabulary.
• demonstrates skill in editing to eliminate most errors in spelling,capitalization, punc-tuation, usage, and sentence structure
(conTinued)

38 enrollmenT and achievemenT among limiTed engliSh proficienT STudenTS in pennSylvania
Table b3 (conTinued)
Performance-level descriptors for the Pennsylvania system of school Assessment, writing, by grade
grade below basic basic proficient advanced
8 a student scoring at the below basic level produces writing that demonstrates a below grade-level understanding of composition skills and requires extensive assistance with composing, revising, and editing.
a student scoring at the basic level produces narrative, informational, and persuasive pieces of writing that demonstrate a limited understanding of composition skills. a student scoring at this level:
• Writes with a vague or indistinct focus to iden-tify topic or task.
• Shows a limited aware-ness of audience and mode.
• may not establish a single point of view.
• needs assistance to gather valid or reliable information and orga-nize content appropri-ate for topic.
• may employ ineffective format for purpose or audience.
• constructs underdevel-oped paragraphs with insufficient supporting details.
• produces inadequate introductions or conclusions.
• Shows limited ability to use logical organiza-tional strategies within sentences or between paragraphs.
• uses few or ineffective transitions.
• lacks variety in lengths and patterns of simple, compound, or complex sentences.
• uses vague or imprecise language often leading to an ineffective voice or tone.
• demonstrates limited ability to revise writing.
a student scoring at the proficient level produces narrative, informational, and persuasive pieces of writing that demonstrate a thorough understanding of composition skills. a student scoring at this level:
• Writes with a clear focus that identifies topic and task.
• Shows a general aware-ness of audience and mode.
• establishes a single point of view when appropriate.
• gathers valid or reliable information and orga-nizes content appropri-ate for topic.
• employs effective format for purpose and audience.
• develops paragraphs with supporting rel-evant details specific to the topic and relevant to the focus.
• produces adequate introductions that establish topic and purpose; produces adequate conclusions that reiterate topic and purpose.
• uses logical organi-zational structures and strategies within sentences and between paragraphs to suffi-ciently develop content.
• uses functional transi-tions to develop a controlling idea.
• varies lengths and patterns of simple, com-pound, and complex sentences.
a student scoring at the advanced level produces narrative, informational, and persuasive pieces of writing that demonstrate a comprehensive command of composition skills. a student scoring at this level:
• Writes with a sharp, distinct focus that iden-tifies topic and task.
• Shows a sophisticated awareness of audience and mode.
• establishes a single point of view when appropriate.
• gathers valid and reli-able information and organizes substantial, effective content appro-priate for topic.
• employs most effective format for purpose and audience.
• develops paragraphs with illustrative sup-porting details specific to the topic and rel-evant to the focus.
• crafts effective intro-ductions that establish topic and purpose; crafts effective conclu-sions that reiterate topic and purpose.
• uses logical and sophis-ticated organizational structures and strate-gies within sentences and between para-graphs to thoroughly develop content.
• uses a variety of effective transitions to develop a controlling idea.
• varies lengths and patterns of simple,
(conTinued)
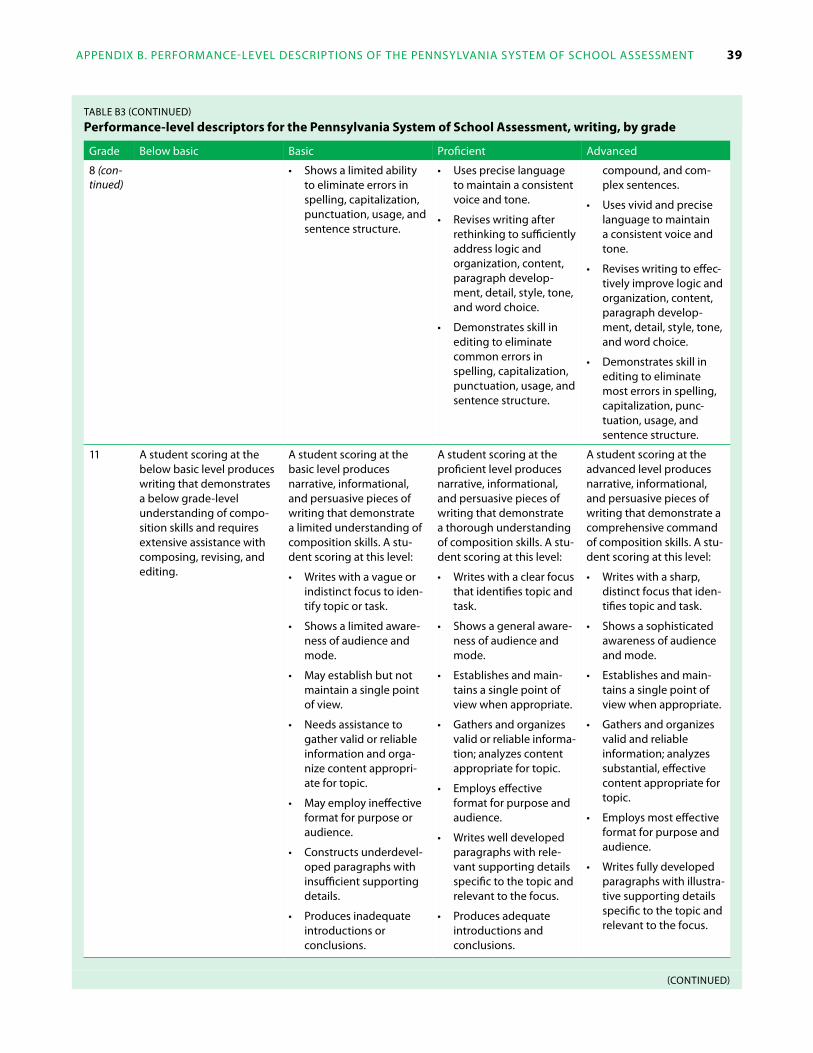
appendix b. performance-level deScripTionS of The pennSylvania SySTem of School aSSeSSmenT 39
Table b3 (conTinued)
Performance-level descriptors for the Pennsylvania system of school Assessment, writing, by grade
grade below basic basic proficient advanced
8 (con-tinued)
• Shows a limited ability to eliminate errors in spelling, capitalization, punctuation, usage, and sentence structure.
• uses precise language to maintain a consistent voice and tone.
• revises writing after rethinking to sufficiently address logic and organization, content, paragraph develop-ment, detail, style, tone, and word choice.
• demonstrates skill in editing to eliminate common errors in spelling, capitalization, punctuation, usage, and sentence structure.
compound, and com-plex sentences.
• uses vivid and precise language to maintain a consistent voice and tone.
• revises writing to effec-tively improve logic and organization, content, paragraph develop-ment, detail, style, tone, and word choice.
• demonstrates skill in editing to eliminate most errors in spelling, capitalization, punc-tuation, usage, and sentence structure.
11 a student scoring at the below basic level produceswriting that demonstrates a below grade-level understanding of compo-sition skills and requires extensive assistance with composing, revising, and editing.
a student scoring at the basic level produces narrative, informational, and persuasive pieces of writing that demonstrate a limited understanding of composition skills. a stu-dent scoring at this level:
• Writes with a vague or indistinct focus to iden-tify topic or task.
• Shows a limited aware-ness of audience and mode.
• may establish but not maintain a single point of view.
• needs assistance to gather valid or reliable information and orga-nize content appropri-ate for topic.
• may employ ineffective format for purpose or audience.
• constructs underdevel-oped paragraphs with insufficient supporting details.
• produces inadequate introductions or conclusions.
a student scoring at the proficient level produces narrative, informational, and persuasive pieces of writing that demonstrate a thorough understanding of composition skills. a stu-dent scoring at this level:
• Writes with a clear focus that identifies topic and task.
• Shows a general aware-ness of audience and mode.
• establishes and main-tains a single point of view when appropriate.
• gathers and organizes valid or reliable informa-tion; analyzes content appropriate for topic.
• employs effective format for purpose and audience.
• Writes well developed paragraphs with rele-vant supporting details specific to the topic and relevant to the focus.
• produces adequate introductions and conclusions.
a student scoring at the advanced level produces narrative, informational, and persuasive pieces of writing that demonstrate a comprehensive command of composition skills. a stu-dent scoring at this level:
• Writes with a sharp, distinct focus that iden-tifies topic and task.
• Shows a sophisticated awareness of audience and mode.
• establishes and main-tains a single point of view when appropriate.
• gathers and organizes valid and reliable information; analyzes substantial, effective content appropriate for topic.
• employs most effective format for purpose and audience.
• Writes fully developed paragraphs with illustra-tive supporting details specific to the topic and relevant to the focus.
(conTinued)
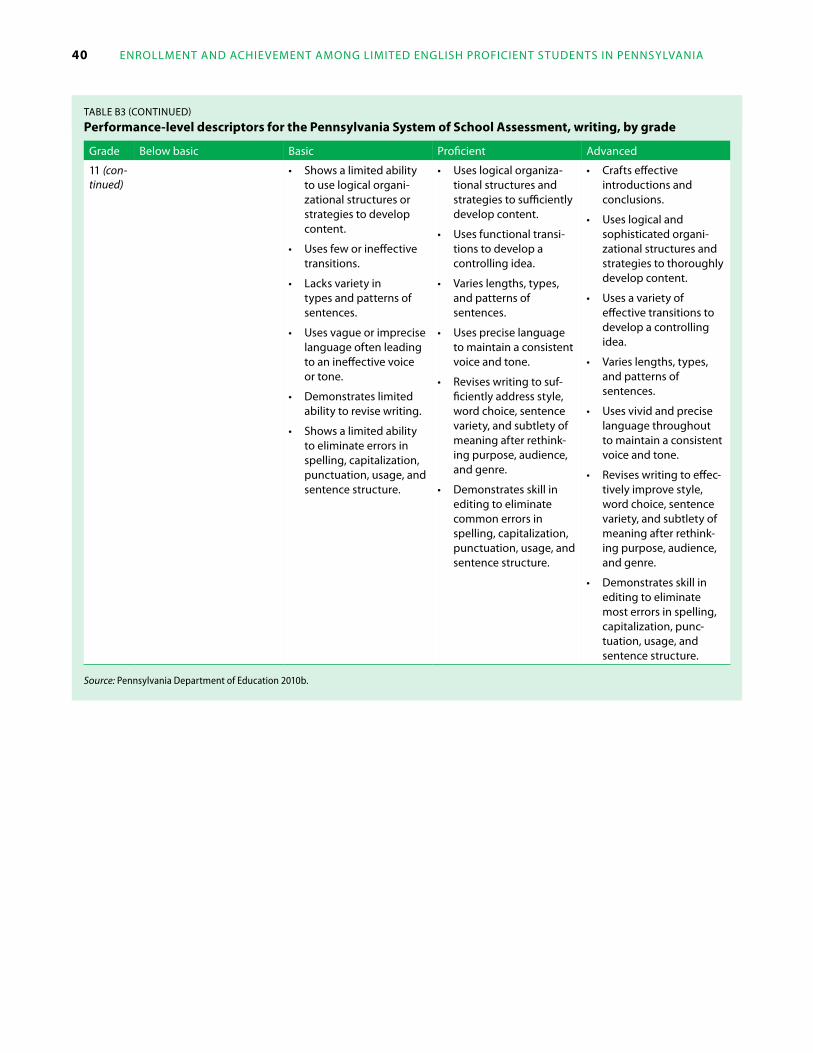
40 enrollmenT and achievemenT among limiTed engliSh proficienT STudenTS in pennSylvania
Table b3 (conTinued)
Performance-level descriptors for the Pennsylvania system of school Assessment, writing, by grade
grade below basic basic proficient advanced
11 (con-tinued)
• Shows a limited ability to use logical organi-zational structures or strategies to develop content.
• uses few or ineffective transitions.
• lacks variety in types and patterns of sentences.
• uses vague or imprecise language often leading to an ineffective voice or tone.
• demonstrates limited ability to revise writing.
• Shows a limited ability to eliminate errors in spelling, capitalization, punctuation, usage, and sentence structure.
• uses logical organiza-tional structures and strategies to sufficiently develop content.
• uses functional transi-tions to develop a controlling idea.
• varies lengths, types, and patterns of sentences.
• uses precise language to maintain a consistent voice and tone.
• revises writing to suf-ficiently address style, word choice, sentence variety, and subtlety of meaning after rethink-ing purpose, audience, and genre.
• demonstrates skill in editing to eliminate common errors in spelling, capitalization, punctuation, usage, and sentence structure.
• crafts effective introductions and conclusions.
• uses logical and sophisticated organi-zational structures and strategies to thoroughly develop content.
• uses a variety of effective transitions to develop a controlling idea.
• varies lengths, types, and patterns of sentences.
• uses vivid and precise language throughout to maintain a consistent voice and tone.
• revises writing to effec-tively improve style, word choice, sentence variety, and subtlety of meaning after rethink-ing purpose, audience, and genre.
• demonstrates skill in editing to eliminate most errors in spelling, capitalization, punc-tuation, usage, and sentence structure.
Source: Pennsylvania Department of Education 2010b.
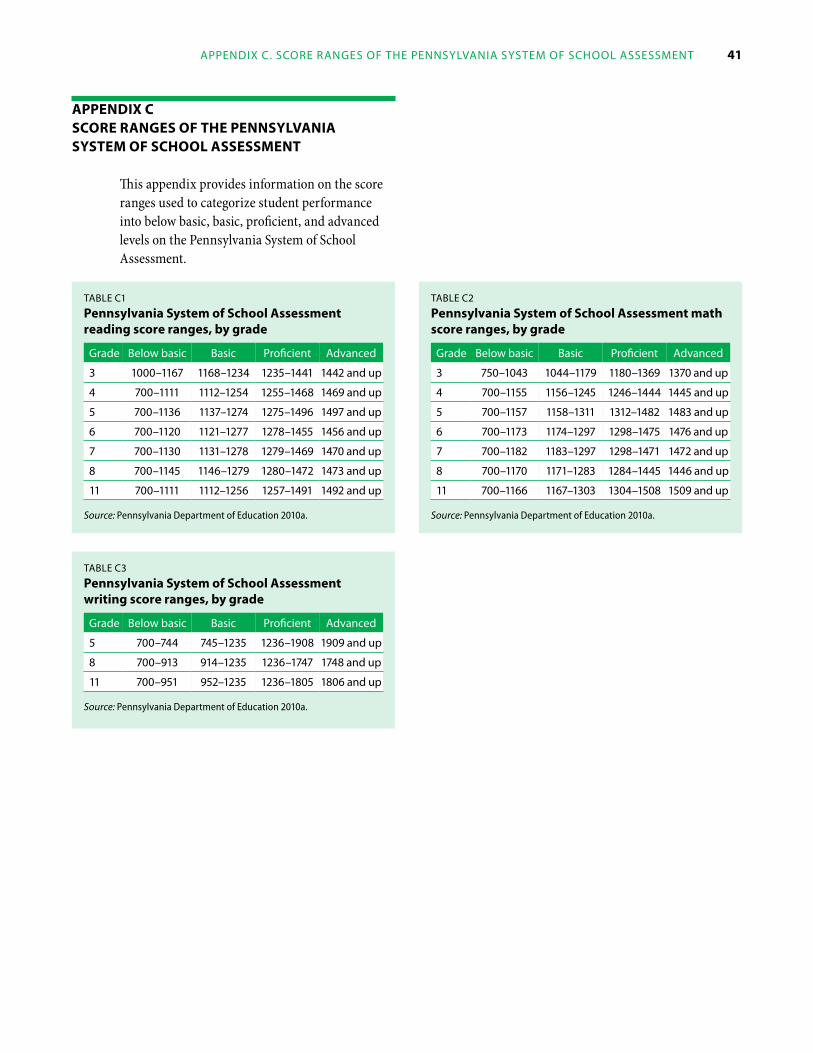
appendix c. Score rangeS of The pennSylvania SySTem of School aSSeSSmenT 41
APPEndix c scorE rAngEs of thE PEnnsylvAniA systEm of school AssEssmEnt
This appendix provides information on the score ranges used to categorize student performance into below basic, basic, proficient, and advanced levels on the Pennsylvania System of School Assessment.
Table c1
Pennsylvania system of school Assessment reading score ranges, by grade
grade below basic basic proficient advanced
3 1000–1167 1168–1234 1235–1441 1442 and up
4 700–1111 1112–1254 1255–1468 1469 and up
5 700–1136 1137–1274 1275–1496 1497 and up
6 700–1120 1121–1277 1278–1455 1456 and up
7 700–1130 1131–1278 1279–1469 1470 and up
8 700–1145 1146–1279 1280–1472 1473 and up
11 700–1111 1112–1256 1257–1491 1492 and up
Source: Pennsylvania Department of Education 2010a.
Table c3
Pennsylvania system of school Assessment writing score ranges, by grade
grade below basic basic proficient advanced
5 700–744 745–1235 1236–1908 1909 and up
8 700–913 914–1235 1236–1747 1748 and up
11 700–951 952–1235 1236–1805 1806 and up
Source: Pennsylvania Department of Education 2010a.
Table c2
Pennsylvania system of school Assessment math score ranges, by grade
grade below basic basic proficient advanced
3 750–1043 1044–1179 1180–1369 1370 and up
4 700–1155 1156–1245 1246–1444 1445 and up
5 700–1157 1158–1311 1312–1482 1483 and up
6 700–1173 1174–1297 1298–1475 1476 and up
7 700–1182 1183–1297 1298–1471 1472 and up
8 700–1170 1171–1283 1284–1445 1446 and up
11 700–1166 1167–1303 1304–1508 1509 and up
Source: Pennsylvania Department of Education 2010a.
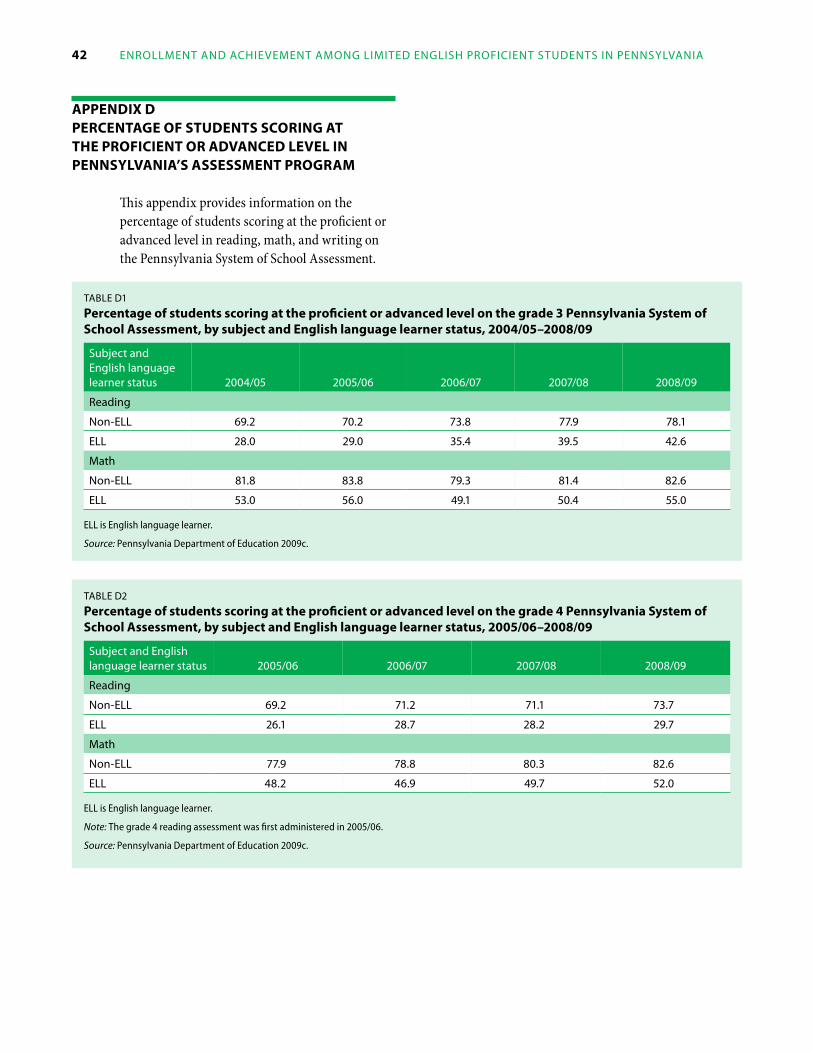
42 enrollmenT and achievemenT among limiTed engliSh proficienT STudenTS in pennSylvania
APPEndix d PErcEntAgE of studEnts scoring At thE ProficiEnt or AdvAncEd lEvEl in PEnnsylvAniA’s AssEssmEnt ProgrAm
This appendix provides information on the percentage of students scoring at the proficient or advanced level in reading, math, and writing on the Pennsylvania System of School Assessment.
Table d1
Percentage of students scoring at the proficient or advanced level on the grade 3 Pennsylvania system of school Assessment, by subject and English language learner status, 2004/05–2008/09
Subject and english language learner status 2004/05 2005/06 2006/07 2007/08 2008/09
reading
non-ell 69.2 70.2 73.8 77.9 78.1
ell 28.0 29.0 35.4 39.5 42.6
math
non-ell 81.8 83.8 79.3 81.4 82.6
ell 53.0 56.0 49.1 50.4 55.0
ELL is English language learner.
Source: Pennsylvania Department of Education 2009c.
Table d2
Percentage of students scoring at the proficient or advanced level on the grade 4 Pennsylvania system of school Assessment, by subject and English language learner status, 2005/06–2008/09
Subject and english language learner status 2005/06 2006/07 2007/08 2008/09
reading
non-ell 69.2 71.2 71.1 73.7
ell 26.1 28.7 28.2 29.7
math
non-ell 77.9 78.8 80.3 82.6
ell 48.2 46.9 49.7 52.0
ELL is English language learner.
Note: The grade 4 reading assessment was first administered in 2005/06.
Source: Pennsylvania Department of Education 2009c.
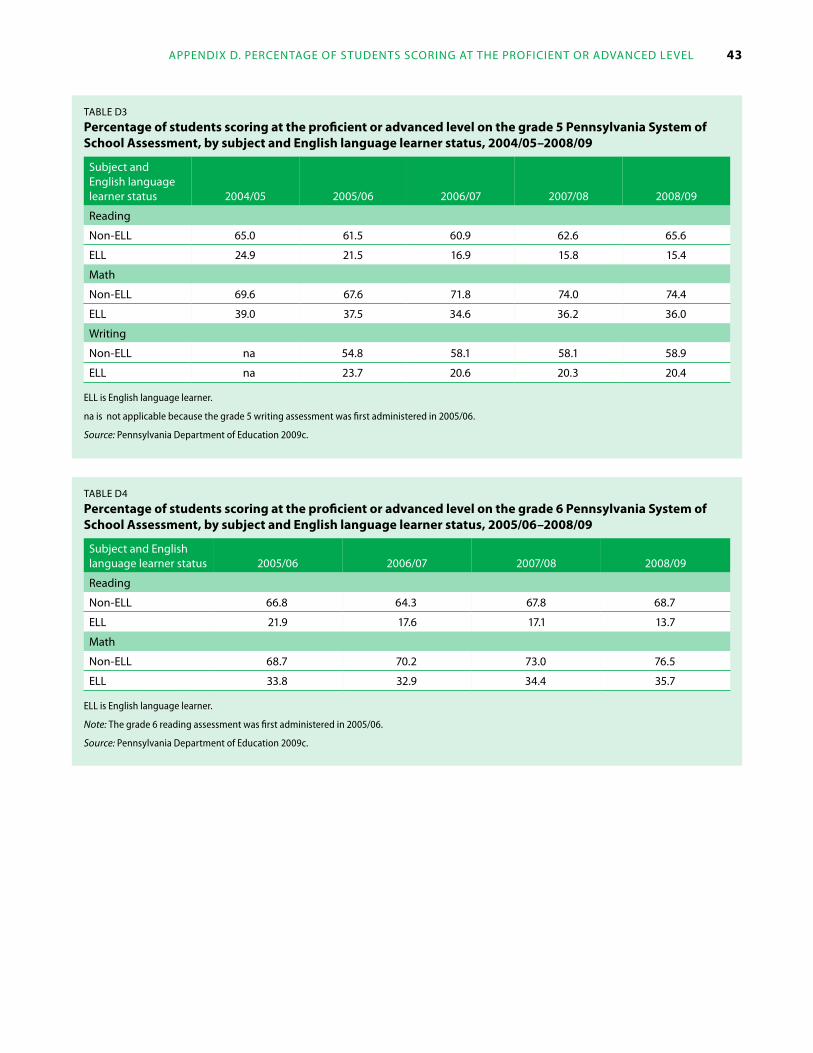
appendix d. percenTage of STudenTS Scoring aT The proficienT or advanced level 43
Table d3
Percentage of students scoring at the proficient or advanced level on the grade 5 Pennsylvania system of school Assessment, by subject and English language learner status, 2004/05–2008/09
Subject and english language learner status 2004/05 2005/06 2006/07 2007/08 2008/09
reading
non-ell 65.0 61.5 60.9 62.6 65.6
ell 24.9 21.5 16.9 15.8 15.4
math
non-ell 69.6 67.6 71.8 74.0 74.4
ell 39.0 37.5 34.6 36.2 36.0
Writing
non-ell na 54.8 58.1 58.1 58.9
ell na 23.7 20.6 20.3 20.4
ELL is English language learner.
na is not applicable because the grade 5 writing assessment was first administered in 2005/06.
Source: Pennsylvania Department of Education 2009c.
Table d4
Percentage of students scoring at the proficient or advanced level on the grade 6 Pennsylvania system of school Assessment, by subject and English language learner status, 2005/06–2008/09
Subject and english language learner status 2005/06 2006/07 2007/08 2008/09
reading
non-ell 66.8 64.3 67.8 68.7
ell 21.9 17.6 17.1 13.7
math
non-ell 68.7 70.2 73.0 76.5
ell 33.8 32.9 34.4 35.7
ELL is English language learner.
Note: The grade 6 reading assessment was first administered in 2005/06.
Source: Pennsylvania Department of Education 2009c.
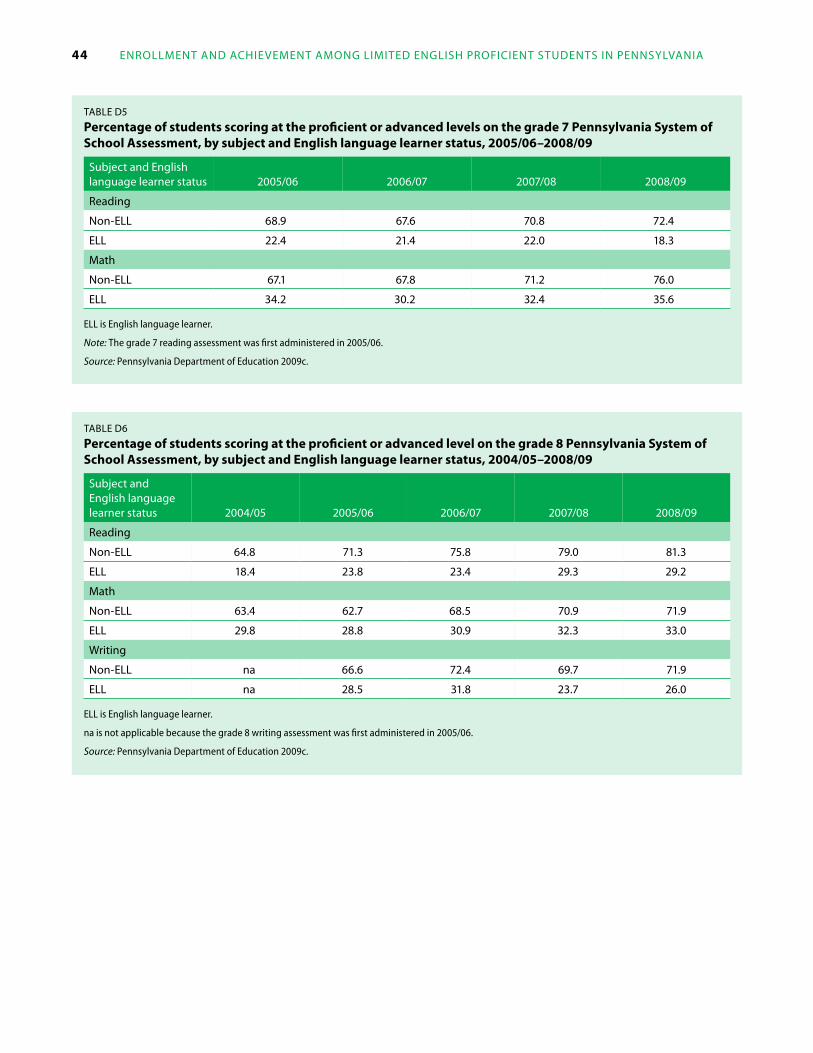
44 enrollmenT and achievemenT among limiTed engliSh proficienT STudenTS in pennSylvania
Table d5
Percentage of students scoring at the proficient or advanced levels on the grade 7 Pennsylvania system of school Assessment, by subject and English language learner status, 2005/06–2008/09
Subject and english language learner status 2005/06 2006/07 2007/08 2008/09
reading
non-ell 68.9 67.6 70.8 72.4
ell 22.4 21.4 22.0 18.3
math
non-ell 67.1 67.8 71.2 76.0
ell 34.2 30.2 32.4 35.6
ELL is English language learner.
Note: The grade 7 reading assessment was first administered in 2005/06.
Source: Pennsylvania Department of Education 2009c.
Table d6
Percentage of students scoring at the proficient or advanced level on the grade 8 Pennsylvania system of school Assessment, by subject and English language learner status, 2004/05–2008/09
Subject and english language learner status 2004/05 2005/06 2006/07 2007/08 2008/09
reading
non-ell 64.8 71.3 75.8 79.0 81.3
ell 18.4 23.8 23.4 29.3 29.2
math
non-ell 63.4 62.7 68.5 70.9 71.9
ell 29.8 28.8 30.9 32.3 33.0
Writing
non-ell na 66.6 72.4 69.7 71.9
ell na 28.5 31.8 23.7 26.0
ELL is English language learner.
na is not applicable because the grade 8 writing assessment was first administered in 2005/06.
Source: Pennsylvania Department of Education 2009c.
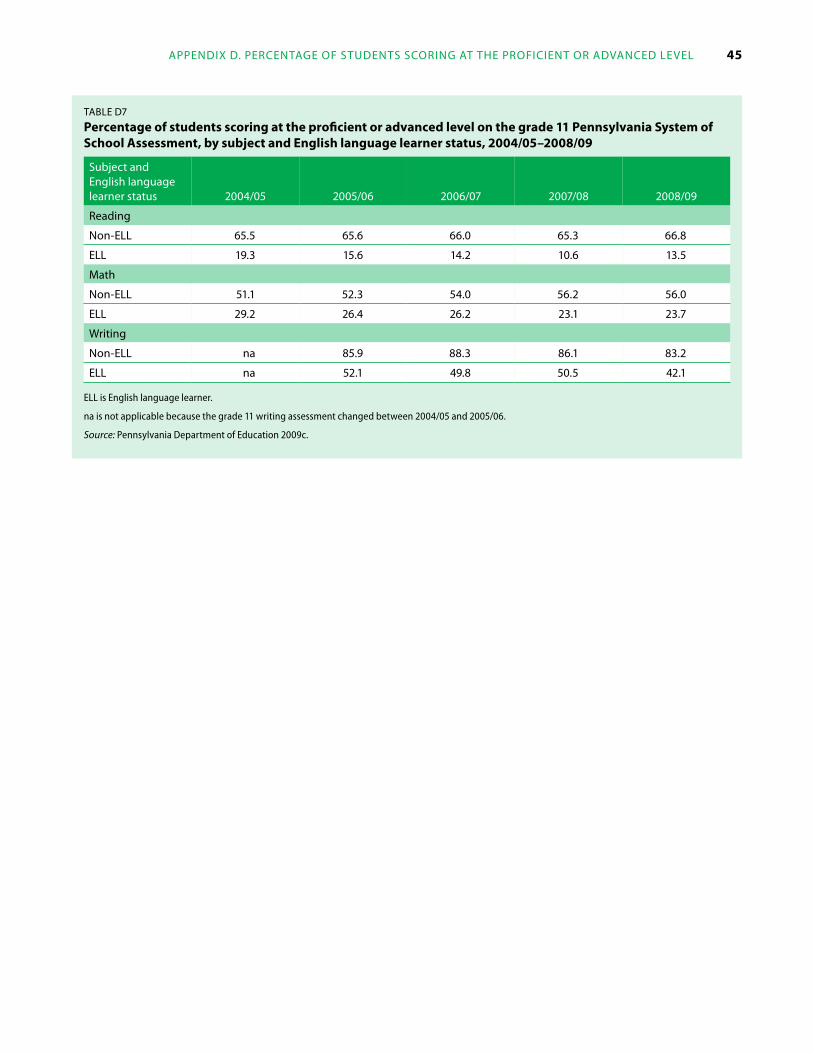
appendix d. percenTage of STudenTS Scoring aT The proficienT or advanced level 45
Table d7
Percentage of students scoring at the proficient or advanced level on the grade 11 Pennsylvania system of school Assessment, by subject and English language learner status, 2004/05–2008/09
Subject and english language learner status 2004/05 2005/06 2006/07 2007/08 2008/09
reading
non-ell 65.5 65.6 66.0 65.3 66.8
ell 19.3 15.6 14.2 10.6 13.5
math
non-ell 51.1 52.3 54.0 56.2 56.0
ell 29.2 26.4 26.2 23.1 23.7
Writing
non-ell na 85.9 88.3 86.1 83.2
ell na 52.1 49.8 50.5 42.1
ELL is English language learner.
na is not applicable because the grade 11 writing assessment changed between 2004/05 and 2005/06.
Source: Pennsylvania Department of Education 2009c.
46 enrollmenT and achievemenT among limiTed engliSh proficienT STudenTS in pennSylvania
notEs
1. Students whose first language is not English and who are in the process of learning English are referred to using different terms across the United States, such as English language learner (ELL) or limited English proficient (LEP) students. This report refers to such students as ELL students to remain consistent with the Pennsylvania state terminology.
2. The request came to Ask A REL, which is a collaborative reference desk service of the 10 Regional Educational Laboratories that pro-vides references, referrals, and brief responses in the form of citations on research-based education questions. More information can be found at http://ies.ed.gov/ncee/edlabs/askarel/index.asp.
3. The reason for the large increase in ELL stu-dent enrollment from 2002/03 to 2003/04 and from 2004/05 to 2005/06 is unknown to the study authors.
4. The reason for the large increase in the number of languages spoken from 2002/03 to 2003/04 and from 2006/07 to 2007/08 is unknown to the study authors.
5. The reason for the large increase in the num-ber of ELL students speaking English dialects from 2006/07 to 2007/08 is unknown to the study authors.
6. Because Pennsylvania did not administer sci-ence assessments in grades 4, 8, and 11 until 2007/08, science results are not described in this report.
7. The nature of the grade 11 PSSA math assess-ment may account for the relatively strong performance of ELL students in grade 11 math compared with that in earlier grades. More information is presented in the conclu-sion section.
8. Mean scale scores were not disaggregated by ELL status and thus were not used in this study.
referenceS 47
rEfErEncEs
Abedi, J. (2001). Assessment and accommodations for Eng-lish Language Learners: issues and recommendations (CRESST Policy Brief 4). Los Angeles, CA: University of California, National Center for Research on Evaluation, Standards, and Student Testing.
Abedi, J. (2002). Standardized achievement tests and Eng-lish language learners: psychometrics issues. Educa-tional Assessment, 8(3), 231–257.
Abedi, J. (2004). The No Child Left Behind Act and English language learners: assessment and accountability is-sues. Educational Researcher, 33(1), 4–14.
Abedi, J., Courtney, M., and Leon, S. (2003). Research-sup-ported accommodation for English language learners in NAEP (CSE Technical Report 586). Los Angeles, CA: University of California, National Center for Research on Evaluation, Standards, and Student Testing.
Abedi, J., and Dietel, R. (2004). Challenges in the No Child Left Behind Act for English-language learners. Phi Delta Kappan, 85(10), 782–785.
Abedi, J., and Gándara, P. (2006). Performance of English language learners as a subgroup in large-scale assess-ment: interaction of research and policy. Educational Measurement: Issues and Practices, 26(5), 36–46.
Abedi, J., and Herman, J. L. (2010). Assessing English language learners’ opportunity to learn mathematics: Issues and limitations. Teacher’s College Record, 112(3), 723–746.
Abedi, J., Leon, S., and Mirocha, J. (2003). Impact of student language background on content-based performance: analyses of extant data (CSE Report 603). Los Angeles, CA: University of California, National Center for Re-search on Evaluation, Standards, and Student Testing.
American Educational Research Association, American Psychological Association, and National Council on Measurement in Education. (1999). Standards for educational and psychological testing. Washington, DC: American Psychological Association.
Beal, C. R., Adams, N., and Cohen, P. R. (2010). Reading profi-ciency and mathematics problem solving by high school English Language Learners. Urban Education, 44, 58–74.
Durán, R.P. (2008). Assessing English-language learners’ achievement. Review of Research in Education, 32, 292–327.
Flannery, M.E. (2009). A new look at America’s English language learners [Electronic version]. NEA Today (2009, January). Retrieved March 18, 2009, from www.nea.org/home/29160.htm.
Fry, R. (2007). How far behind in math and reading are English language learners? Washington, DC: Pew Hispanic Center. Retrieved May 21, 2011, from http://pewhispanic.org/files/reports/76.pdf.
Gándara, P., Rumberger, R., Maxwell-Jolly, J., and Callahan, R. (2003). English learners in California schools: un-equal resources, unequal outcomes. Educational Policy Analysis Archives, 11. Retrieved July 15, 2010, from http://epaa.asu.edu/ojs/article/viewFile/264/390.
Garcia-Vazquez, E., Vazquez, L. A., Lopez, I. C., and Ward, W. (1997). Language proficiency and academic success: relationships between proficiency in two languages and achievement among Mexican American students. Bilingual Research Journal, 21(4), 334–347.
Genesee, F., Lindholm-Leary, K., Saunders, W., and Christian, D. (2005). English language learners in U.S. schools: an overview of research findings. Journal of Education for Students Placed at Risk, 10(4), 363–385.
Migration Policy Institute (MPI). (2010a). MPI data hub: migration facts, stats, and maps. States ranked by number of foreign born: 1990, 2000, 2007, 2008. Washington, DC. Retrieved May 26, 2010, from www.migrationinformation.org/datahub/files/MPIDataHub_ACS_2008-NumberForeignBorn.xls.
Migration Policy Institute (MPI). (2010b). MPI data hub: Pennsylvania fact sheet. Social and demographic char-acteristics. Washington, DC. Retrieved May 26, 2010, from www.migrationinformation.org/DataHub/state.cfm?ID=PA.
48 enrollmenT and achievemenT among limiTed engliSh proficienT STudenTS in pennSylvania
National Clearinghouse for English Language Acquisi-tion and Language Instruction Educational Programs (NCELA). (2011). The growing numbers of English learner students: 1998/99–2008/09. Washington, DC. Retrieved August 19, 2011, from www.ncela.gwu.edu/files/uploads/9/growingLEP_0809.pdf.
No Child Left Behind Act of 2001, Pub. L. No. 107–110. (2001). Retrieved December 15, 2008, from http://www2.ed.gov/policy/elsec/leg/esea02/107–110.pdf.
No Child Left Behind (NCLB) Glossary. (2001). Retrieved May 14, 2011, from http://www2.ed.gov/nclb/index/az/glossary.html?src=az#2.
Pennsylvania Department of Education. (2007). LEP statis-tics (2002–2007). LEP student count information and language breakdown information and top ten lan-guages. Harrisburg, PA. Retrieved April 8, 2011, from www.portal.state.pa.us/portal/server.pt/community/program_statistics/7532.
Pennsylvania Department of Education. (2008). Language breakdown information for school year 2007/08 [Data file]. Harrisburg, PA: Pennsylvania Department of Education.
Pennsylvania Department of Education. (2009a). State-wide enrollment projections: actual total enrollment (2002/03–2008/09) [Data file]. Harrisburg, PA: Penn-sylvania Department of Education.
Pennsylvania Department of Education. (2009b). Language breakdown information for school year 2008/09 [Data file]. Harrisburg, PA: Pennsylvania Department of Education.
Pennsylvania Department of Education. (2009c). PSSA results (2004–09). Harrisburg, PA. Retrieved Decem-ber 3, 2009, from www.pde.state.pa.us/portal/server.pt/community/school_assessments/7442.
Pennsylvania Department of Education. (2010a). PSSA and PSSA-M performance level cut scores. Harrisburg, PA. Retrieved September 20, 2010, from www.portal.state.pa.us/portal/http;//www.portal.state.pa.us;80/portal/server.pt/gateway/PTARGS_0_123031_853692_0_0_18/PSSA_Cut_Scores_All_Subjects_2010.pdf.
Pennsylvania Department of Education. (2010b). PSSA grade- and subject-specific performance level descrip-tors. Harrisburg, PA. Retrieved September 20, 2010, from www.portal.state.pa.us/portal/server.pt?open=514 &objID=507629&mode=2.
Pennsylvania Department of Education. (2010c). PSSA and PSSA-M accommodations guidelines for English lan-guage learners. Harrisburg, PA. Retrieved September 20, 2010, from www.portal.state.pa.us/portal/server.pt/gateway/PTARGS_0_123031_890903_0_0_18/PSSA_Accommodations_for_ELLs_2010.pdf.
Pennsylvania Department of Education. (2011). Penn-sylvania’s general performance level descriptors for the Pennsylvania System of School Assessment (PSSA). Harrisburg, PA. Retrieved March 18, 2011, from http://www.portal.state.pa.us/portal/http;//www.portal.state.pa.us;80/portal/server.pt/gateway/PTARGS_0_123031_880006_0_0_18/PSSA_General_Performance_Level_Descriptors.pdf.
Rhode Island KIDS COUNT. (2011). 2011 Rhode Island Kids Count factbook: English Language Learners indi-cator. Retrieved May 21, 2011, from www.rikidscount.org/matriarch/documents/11_Factbook_Indicator_52.pdf.
Shin, H.B., and Bruno, R. (2003). Language use and English-speaking ability: 2000. Washington, DC: U.S. Census Bureau. Retrieved July 30, 2010, from www.census.gov/prod/2003pubs/c2kbr-29.pdf.
Shin, H.B., and Kominski, R.A. (2010). Language use in the United States: 2007, American Community Survey reports, ACS-12. Washington, DC: U.S. Census Bureau. Retrieved August 19, 2011, from www.census.gov/prod/2010pubs/acs-12.pdf.
Solano-Flores, G., and Trumbull, E. (2003). Examining language in context: the need for new research and practice paradigms in the testing of English-language learners. Educational Researcher, 32(2), 3–13.
Strickland, D. S., and Alvermann, D. E. (2004). Bridging the literacy achievement gap grades 4–12. New York, NY: Teacher’s College Press.
referenceS 49
U.S. Department of Education, National Center for Educa-tion Statistics (NCES). (2010). The nation’s report card: 2009 reading and mathematics results. Washington, DC: U.S. Department of Education. Retrieved May 26, 2010, from http://nationsreportcard.gov/.
U.S. Department of Homeland Security. (2010). Yearbook of immigration statistics: 2009. Washington, DC: U.S. Department of Homeland Security. Retrieved May 26,
2010, from www.dhs.gov/files/statistics/publications/yearbook.shtm.
Wolf, M. K., Herman, J. L., Kim, J., Abedi, J., Leon, S., Griffin, N., Bachman, P. L., Chang, S. M., Farnsworth, T., Jung, H., Nollner, J., and Shin, H. W. (2008). Providing validity evidence to improve the assessment of English language learners (CSE Technical Report 738). Los Angeles, CA: University of California, National Center for Research on Evaluation, Standards, and Student Testing.