Embed Size (px)
Citation preview

A Descriptive Analysis of Medical Assessment Units in NSW
Francis Group International (FGI)
MAU Forum
23 September 2016

Agenda
Project Overview
Methodology and Approach
Analytical Study
Qualitative Analysis
Key Findings and Focus Areas
Questions

Background to the Project
Evaluation of 29 units in 2012
Concluded that the full potential benefits of the MAU model not realised at that time
The ACI undertook a broader consultation resulting in the publication of an MAU Model of Care in 2014.
The Emergency Treatment Performance Target (ETP) and winter pressures have reinforced the requirement to improve patient flow.
The NSW Premier and the Minister of Health have highlighted the potential of the MAU model of care to enhance patient flow – now PAT focus.
Timely to refresh the previous MAU during 2016

Objectives
Understand which patients/patient cohorts are using the MAUs (DRG/Age) and the effect on Average Length of Stay (ALOS)
Determine impact of MAU usage on access block, current emergency department key performance indicators, hospital efficiency and financial resources
Describe the current MAU profile(s) against the 2014 MAU model of care, including consideration of the development of MAUs across NSW since the 2011 evaluation.
Measure the MAU patient experience in comparison to other inpatients.

Methodology and Approach
Two key work streams streams of work: Qualitative analysis
Targeted series of stakeholder interviews MAU Site visits (5) Metro and Regional MAU Survey of MAU unit staff to determine the staffing profile / skill
mix (21/33 responses received) NSW Adult Inpatient Survey MAU Self Assessment results
Analytical Study Data sample spanning 7 financial years: 1 July 2008 – 30 June
2015. Task to replicate (at minimum) the analysis produced in the
2012 report Key deliverable is a report document which includes:
Literature review findings (update from 2011). Details of the project findings
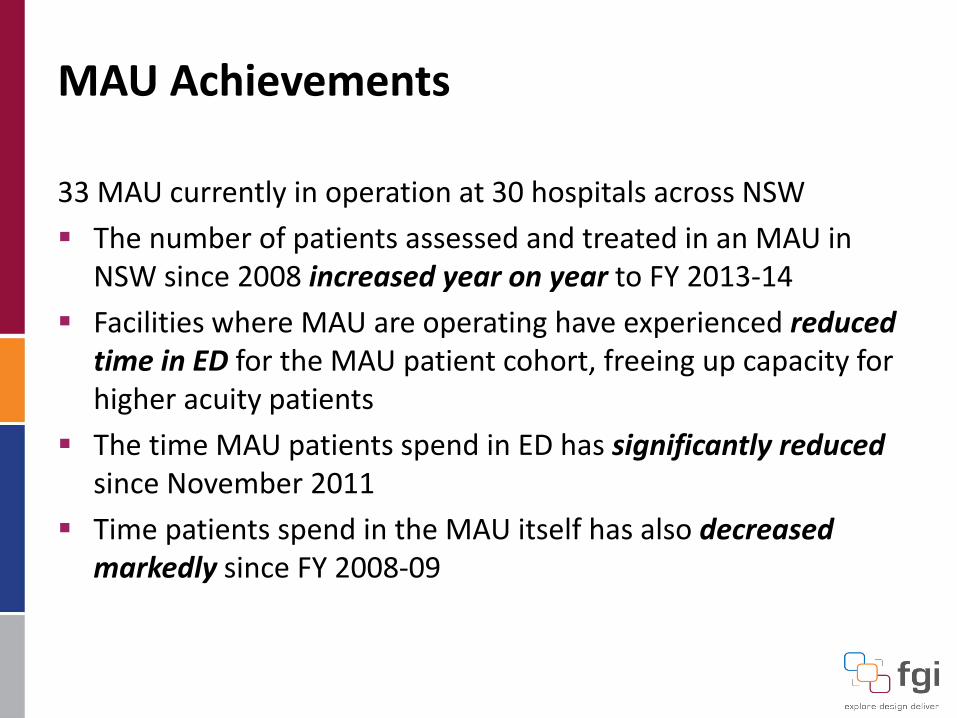
MAU Achievements
33 MAU currently in operation at 30 hospitals across NSW
The number of patients assessed and treated in an MAU in NSW since 2008 increased year on year to FY 2013-14
Facilities where MAU are operating have experienced reduced time in ED for the MAU patient cohort, freeing up capacity for higher acuity patients
The time MAU patients spend in ED has significantly reducedsince November 2011
Time patients spend in the MAU itself has also decreased markedly since FY 2008-09

ANALYTICAL STUDY

MAU Patient Cohort
Majority of MAU usage is by patient over 65 years of age

Why is this important for the future?
* Source: http://www.aihw.gov.au/australias-welfare/2015/growing-older/

MAU Separations 1 July 2008 – 30 June 2015
MAU separations decreased between 2013-14 and 2014-15

MAU Separations 1 July 2008 – 30 June 2015
• Growth in 4 step-changes in system performance, lengthening periods of process stability
• System operating in current parameters since March 2013

MAU Average Length of StayHowever Average MAU ALOS Increased
between 2013-14 and 2014-15

MAU Average Length of Stay
12,464
37,151
43,65347,104
50,62954,229 53,550
21,493
63,680
72,63777,051
82,960
89,507 91,674
0
10,000
20,000
30,000
40,000
50,000
60,000
70,000
80,000
90,000
100,000
2008/09 2009/10 2010/11 2011/12 2012/13 2013/14 2014/15
Coun
t of E
piso
des
& S
um o
f Cos
t Wei
ghts
Episodes Cost Weights
… Therefore the cost of MAU activity has risen year on year

Comparison of the MAU and non MAU Cohort
MAU Non - MAU
Average ALOS 2013-14 5.3 5.8
Average ALOS 2014-15 5.4 5.7
MAU Non-MAU2013-14 5.1 5.0 0.1
2014-15 5.0 5.0 0.0
2013-14 4.1 4.4 -0.3
2014-15 4.3 4.3 0.0
2013-14 7.5 6.2 1.3
2014-15 7.6 6.2 1.4
2013-14 4.0 3.9 0.1
2014-15 4.0 3.9 0.1
2013-14 6.9 7.2 -0.3
2014-15 7.1 7.3 -0.2
ALOS (Days)Major Diagnostic Code Year Var
DRGs for NERVOUS SYSTEM
DRGs for DIGESTIVE SYSTEM
DRGs for MUSCULOSKELETAL SYS & CONN TISSUE
DRGs for CIRCULATORY SYSTEM
DRGs for RESPIRATORY SYSTEM
Complexity Level Percentage for MAU Percentage for Non-MAU
A 32.2% 12.9%
B 47.9% 27.7%
C 4.9% 7.1%
D 0.2% 16.3%
Z 14.7% 36.0%
MAU Usage seems to reduce ALOS ….
But this varies by clinical area …
MAU patients are in general more complex

Direct Admissions to MAU:1 July 2008 – 30 June 2015
• 2 step-changes reflect declining system performance, another step change pending for Q1 FY 2015-16 (i.e. next 3 data points…)
• System operating in current parameters since July 2012

Time MAU Patients Spend in ED
• Since Nov 2012, series of step-changes reflects improving process performance• Average ED LOS still too high circa 5.8 hours, ETP is 4 hours• System operating in current parameters since Sept 2013

Time Patients spend in MAU
• Average MAU LOS still over just over 48 hours• System operating in current parameters since Nov 2012

Patient Destination Post MAU
• 54% discharged home• 41% transferred to another inpatient ward• 4% transferred to another facility• 0.7% died

Unplanned Readmissions MAU Patients1 July 2008 – 30 June 2015
0%
2%
4%
6%
8%
10%
12%
14%
16%20
08/0
7
2008
/10
2009
/01
2009
/04
2009
/07
2009
/10
2010
/01
2010
/04
2010
/07
2010
/10
2011
/01
2011
/04
2011
/07
2011
/10
2012
/01
2012
/04
2012
/07
2012
/10
2013
/01
2013
/04
2013
/07
2013
/10
2014
/01
2014
/04
2014
/07
2014
/10
2015
/01
2015
/04
Unp
lann
ed R
eadm
issio
n Ra
te (%
)
No change in readmission rates over the 7 year period studied

QUALITATIVE ANALYSIS

MAU Success Factors
Governance Business Rules Designated patient placement authority Performance monitoring Governance committee
Patient Journey and Care Location: MAU close to ED Interdisciplinary approach Relationships
Staffing
Dedicated MAU staff Positive MAU culture Consistent access

Key Findings
Variety of MAU models are currently operation, each reflective of local context
MAU are seeing and treating the target patient cohorts in line with the 2014 Model of Care
Good evidence of appropriate patient selection, however 1/3 of MAU have outlier occupancy rate >= 10%. Often attributed to loss of control of bed base after hours
Almost all responding MAUs had visibility over ED patient information screens (e.g. FirstNet, EDIS), a significant increase from 47% in 2011
Site visits and survey responses evidence strong positive MAU culture: Environment conducive to MDT operation Encourages staff using advanced scopes of practice Patient centric / innovative practice Higher rates of staff retention

Key Findings
Indications are that the current system has reached capacity –i.e. plateau of activity volumes and ALOS and rising cost of care.
System will likely continue to perform as currently without any additional change / intervention
Possibility that downward indicators could firm into trends
Adherence to the 48 hour timeframe has relaxed, diluting the ability of the MAU to enhance patient flow
Two-thirds of survey respondents (14/21) reported that direct MAU admissions are not accepted
Business rules harder to enforce Out of Hours
Reported lack of external understanding of MAU and its role

Focus Areas for Improvement
Stronger Governance required to ensure MAU business rules are applied consistently throughout facilities
Availability of senior consultant-led medical governance to support timely clinical decision making
Ensure staffing availability (i.e. Allied Health) is aligned with activity, especially Out Of Hours
Align MAU purpose with facility / LHD strategy
Consumer engagement to better understand patient experience
Direct MAU admissions (Primary and Community Care)
Develop and concise, meaningful set of KPIs
Next Steps for the Project
Draft report circulated to the MAU Reference Group and LHDs for review and feedback
Finalise the report and confirm the recommendations
Feedback data to participating facilities / LHDs
Handover of data model to MoH/ACI information leads

Your Questions