Embed Size (px)
Citation preview

A Design Workshop
GEOGRIDS IN ROADWAY AND PAVEMENT SYSTEMS
Conducted by:
Barry R. Christopher, Ph.D., P.E.
Sponsors: NAUE GmbH & Co. KG, and 23 Nov. – 1 Dec., 2010 Global Synthetics Pty Ltd

ii
Geogrids in Roadway and Pavement Systems
Course Agenda
LESSON TOPIC
1 Introduction & Course Objectives
2 Geogrids used in Roadway Design and Construction
3 Applications & Design Principles
4 Design Guidelines for Permanent Roads - Stabilization
- Base reinforcement
- Mechanistic-Empirical design
- Life cycle cost benefit
5 Construction Protocol
Wrap Up And Discussion
iii
Reference Material
From: Holtz, R.D., Christopher, B.R., and Berg, R.R., 2008. Geosynthetic Design and
Construction Guidelines, Participant Notebook, FHWA Publication No. FHWA HI -07-092, Federal Highway Administration, Washington, D.C., 592 p.
With supporting papers by:
Christopher, B.R. And Perkins, S.W., 2008. “Full Scale Testing of Geogrids to Evaluate Junction Strength Requirements for Reinforced Roadway Base Design,” Proceedings of the Fourth European Geosynthetics Conference, Edinburgh, United Kingdom, International Geosynthetics Society.
Cuelho, E.G. and Perkins, S.W., 2009. Field Investigation of Geosynthetics used for subgrade
Stabilization, Summary Report 8193, Montana Department of Transportation, 4 p. (http://www.mdt.mt.gov/research/projects/geotech/subgrade.shtml).
Perkins, S.W., Christopher B.R., Cuelho, E.G., Eiksund, G. R., Schwartz, C.S., and Svanø,
G., 2009. “A Mechanistic-Empirical Model for Base-Reinforced Flexible Pavements,” International Journal of Pavement Engineering, Vol. 10, No. 2, Taylor & Francis, London, United Kingdom, pp. 101–114.
Perkins, S.W., Christopher, B.R., Thom, N., Montestruque, G., Korkial-Tanttu, L. and Want,
A., 2010. “Geosynthetics in Pavement Reinforcement Applications,” Proceedings of the 9th International Conference on Geosynthetics, Guaruja, Brazil, The International Geosynthetics Society, pp 165-192.
iv
Abstract
Geogrids in Roadway and Pavement Systems Geogrids have been used in pavement design for the past 25 yrs. Geogrid reinforcement is used in permanent paved roadways in two major application areas – base reinforcement and subgrade stabilization. In base reinforcement applications, the geogrids are placed within or at the bottom of unbound layers of a flexible pavement system and improve the load-carrying capacity of the pavement under repeated traffic. In subgrade stabilization applications, the geogrids are used to build a construction platform over weak subgrades to carry equipment and facilitate the construction of the pavement system without excessive deformations of the subgrade. The design of geogrids in paved and unpaved roads has been largely based on empirical design methods with some theoretical support based on bearing capacity theory. Geogrids are widely recognized for improvement of pavement support layers (base/subbase and/or subgrade) through reinforcement of base/subbase course layers in flexible pavements and unpaved roads. However the implementation of these proven technologies is limited by the lack of direct incorporation of materials in pavement design. A major initiative in pavement design was the development and implementation of the Mechanistic-Empirical (M-E) methods. While the M-E Pavement Design Guides (MEPDG) have been officially adopted (e.g., Australia, 2004 and AASHTO, 2008), these guides do not include the evaluation of pavement performance when geosynthetics are used in the flexible pavements and unpaved roads for improved layer support through either stabilization of soft subgrades or reinforcement of base/subbase course layers. In this workshop, the current design practice and the recent developments for the use of geogrids in stabilization and base reinforcement applications will be reviewed. Both empirical and M-E design approaches will be presented. The development of a design method within the framework of the mechanistic-empirical design method will address. The implications of these design approaches in relation to long-term pavement performance will be discussed. The life cycle cost benefit for each of these applications will be examined. Upon completing this workshop, the participants will be able to:
• Restate soil conditions where geogrids are applicable. • Identify geogrid functions in road stabilization applications. • Discuss primary mechanism for reinforced base applications and locate design methods
including developments in mechanistic empirical design. • Identify the qualitative cost-benefit of using geogrids in roadway sections and locate
methods for quantitative evaluation. • Discuss construction requirements for geogrids in roadway applications.
after FHWA NHI-07-092 Roadways and Pavements Geosynthetics Engineering 1 August 2008
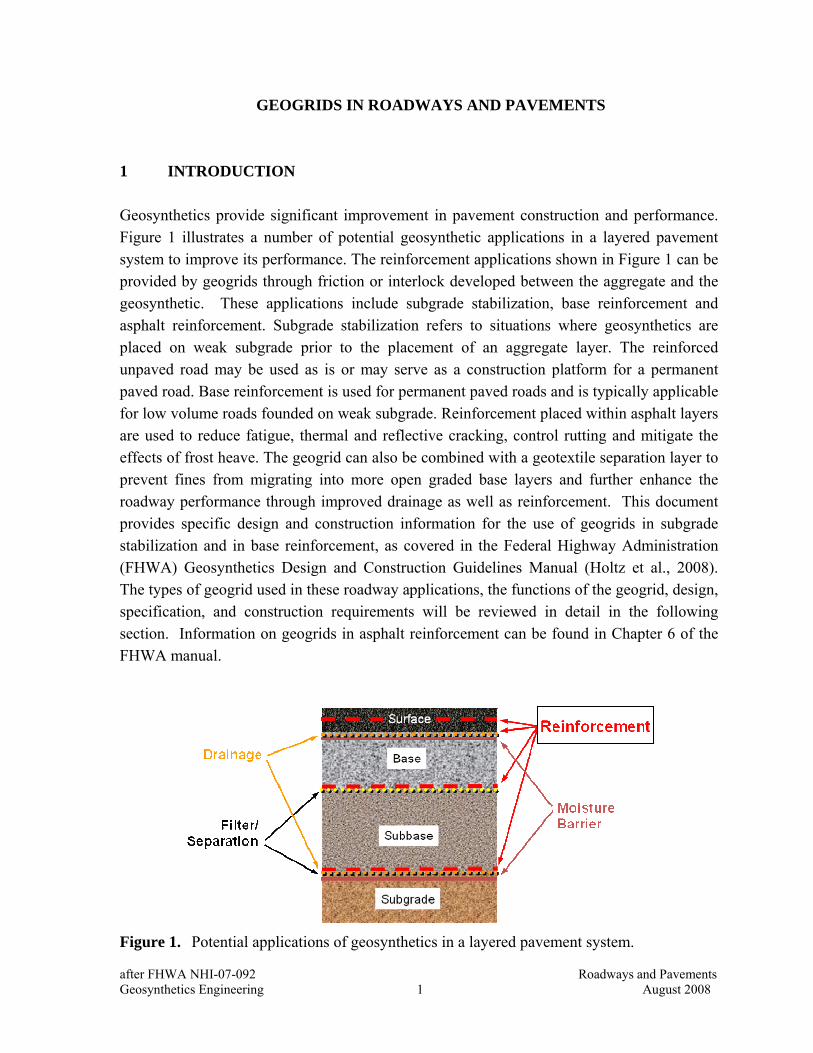
GEOGRIDS IN ROADWAYS AND PAVEMENTS 1 INTRODUCTION Geosynthetics provide significant improvement in pavement construction and performance. Figure 1 illustrates a number of potential geosynthetic applications in a layered pavement system to improve its performance. The reinforcement applications shown in Figure 1 can be provided by geogrids through friction or interlock developed between the aggregate and the geosynthetic. These applications include subgrade stabilization, base reinforcement and asphalt reinforcement. Subgrade stabilization refers to situations where geosynthetics are placed on weak subgrade prior to the placement of an aggregate layer. The reinforced unpaved road may be used as is or may serve as a construction platform for a permanent paved road. Base reinforcement is used for permanent paved roads and is typically applicable for low volume roads founded on weak subgrade. Reinforcement placed within asphalt layers are used to reduce fatigue, thermal and reflective cracking, control rutting and mitigate the effects of frost heave. The geogrid can also be combined with a geotextile separation layer to prevent fines from migrating into more open graded base layers and further enhance the roadway performance through improved drainage as well as reinforcement. This document provides specific design and construction information for the use of geogrids in subgrade stabilization and in base reinforcement, as covered in the Federal Highway Administration (FHWA) Geosynthetics Design and Construction Guidelines Manual (Holtz et al., 2008). The types of geogrid used in these roadway applications, the functions of the geogrid, design, specification, and construction requirements will be reviewed in detail in the following section. Information on geogrids in asphalt reinforcement can be found in Chapter 6 of the FHWA manual. Figure 1. Potential applications of geosynthetics in a layered pavement system.
after FHWA NHI-07-092 Roadways and Pavements Geosynthetics Engineering 2 August 2008
2 DEFINITIONS, MANUFACTURING PROCESSES, AND IDENTIFICATION ASTM (2006) D 4439 defines a geosynthetic as a planar product manufactured from a polymeric material used with soil, rock, earth, or other geotechnical-related material as an integral part of a civil engineering project, structure, or system. A number of geosynthetics are available, including geotextiles, geogrids, geomembranes, geonets, geomeshes, geowebs, and geocomposites. Geogrids are formed by a regular network of tensile elements with apertures of sufficient size to interlock with surrounding fill material. Geogrids are primarily used for reinforcement. Geogrids may be combined with geotextiles to provide the best attributes of each material. These products are called geocomposites. Geogrids are made from synthetic polymers, and of these, polypropylene, polyester, and polyethylene are by far the most common. These polymers are normally highly resistant to biological and chemical degradation. Less-frequently-used polymers include fiber glass for the grid structure. Polyvinyl chloride (PVC) is also used for coating some geogrids. Natural fibers such as cotton, jute, etc., could also be used to make materials that are similar to geogrids. Because these products are biodegradable, they are only for temporary applications. Natural fiber geogrid type materials have not been widely utilized in the U.S. For additional information about the polymeric composition of geosynthetics, see Koerner (2006). Geogrids can be manufactured with integral junctions are manufactured by extruding and orienting sheets of polyolefins (polyethylene or polypropylene). These types of geogrids are often called extruded or integral geogrids. Geogrids may also be manufactured of multifilament polyester yarns, joined at the crossover points by a knitting or weaving process, and then encased with a polymer-based, plasticized coating. These types of geogrids are often called woven or flexible geogrids. A third type, a welded geogrid manufactured, as the name implies, by welding polymeric strips together at their cross over points. All these manufacturing techniques allow geogrids to be oriented such that the principal strength is in one direction, called uniaxial geogrids, or in both directions (but not necessarily the same), called biaxial geogrids.
after FHWA NHI-07-092 Roadways and Pavements Geosynthetics Engineering 3 August 2008
Geogrids, as with all geosynthetics, are generically identified by:
1. polymer (descriptive terms, e.g., high density, low density, etc. should be included);
2. type of element (e.g., strand, rib, coated rib);
3. distinctive manufacturing process (e.g., woven, extruded, knitted, welded, uniaxial, biaxial);
4. primary type of geosynthetic (i.e., geogrid);
5. mass per unit area ; and
6. any additional information or physical properties necessary to describe the material in relation to specific applications (e.g., opening size).
For example:
• polypropylene extruded biaxial geogrid, with 1 in. x 1 in. (25 mm x 25 mm) openings;
• PVC coated polyester woven biaxial geogrid with 0.5 in. x 1 in. (12.5 mm x 25 mm) • polypropylene welded biaxial geogrid/needlepunched nonwoven geotextile
geocomposite, with 1.2 in. x 1.2 in. (30 mm x 30 mm) openings and a 5 oz/yd2 (150 g/m2) geotextile mechanically bonded between the cross laid reinforcement ribs.
3 SPECIFICATIONS When highway engineers first started using geosynthetics, their specifications were very simple: use Brand X or equal. That approach was probably OK when there were only a few products available, but today, with literally hundreds of different geosynthetics on the market with a wide variety of properties, specifications should be based on the specific geosynthetic properties required for design, installation, and durability. The use of “standard” geosynthetics may result in uneconomical or unsafe designs. Specifying a particular type of geosynthetic or its equivalent can also be very misleading. What is equivalent? A contractor may select a product that has completely different properties than intended by the designer. Specifications can be classified as generic, performance, approved list, and approved supplier. For most routine applications, generic specifications are preferred because they are based on the geosynthetic properties required by the design, installation and construction conditions, and durability requirements of the project. Performance specifications require testing of the geosynthetic together with soils from the project. (Recall that the engineer is responsible for performance tests, not the contractor or manufacturer.) Thus the agency or
after FHWA NHI-07-092 Roadways and Pavements Geosynthetics Engineering 4 August 2008
owner has to pre-select geosynthetics based on experience or index tests and then obtain representative samples of soils from the project. In some situations, it may be better to require the contractor to submit, in advance of construction, samples of the proposed geosynthetics and soils from the project site or from a proposed borrow area to the engineer for testing. Realistically, performance testing takes time, often weeks, so the contract must clearly specify how far in advance of product installation that the samples must be submitted to the engineer for testing and approval. All geosynthetic specifications should include:
• general requirements • specific geosynthetic properties • seams and overlaps • placement procedures • repairs, and • acceptance and rejection criteria
General requirements include the product type(s), acceptable polymeric materials, mass per unit area, roll dimensions if relevant, etc. Geosynthetic manufacturers and representatives are good sources of information on these characteristics. Other items that should be specified in this section are instructions on storage and handling so products can be protected from ultraviolet exposure, dust, mud, or any other elements that may affect performance. Guidelines concerning on-site storage and handling of geotextiles are contained in ASTM D 4873, Standard Guide for Identification, Storage, and Handling of Geotextiles. Finally, certification requirements also should be included in this section. Specific geosynthetic physical, index, and performance properties as required by the design must be listed. Properties should be given in terms of minimum (or maximum) average roll values (MARVs), along with the required test methods. MARVs are simply the smallest (or largest) anticipated average value that would be obtained for any roll tested (ASTM D 4439; Koerner, 2006). This average property value must exceed the minimum (or be less than the maximum) value specified for that property based on a particular standard test. Ordinarily it is possible to obtain a manufacturer's certification for MARVs. Seam and overlap requirements should be clearly specified. Geogrids may be overlapped or connected by mechanical fasteners, though the connection may be either structural or a construction aid (i.e., when strength perpendicular to the seam length is not required). Minimum overlap must be specified and if mechanical fasteners are used, the minimum strength required for the seam should also be specified. For designs where wide width tests are used (e.g., reinforced embankments on soft foundations), the required seam strength is a
after FHWA NHI-07-092 Roadways and Pavements Geosynthetics Engineering 5 August 2008
calculated design value required for stability. Therefore, seam strengths should never be specified as a percent of the geosynthetic strength. Also, for structurally connected geogrids, the seaming material (fastener) should consist of polymeric materials that have the same or greater durability as the geosynthetic being seamed. Placement procedures should be given in detail in the specifications and on the construction drawings. These procedures should include grading and ground-clearing requirements, aggregate specifications, minimum aggregate lift thickness, and equipment requirements. These requirements are especially important if the geosynthetic was selected on the basis of survivability. Orientation and direction of geosynthetic placement should also be clearly specified on the construction drawings. Detailed placement procedures are described in each application chapter. Repair procedures for damaged sections of geosynthetics (i.e., failed ribs, rips and tears) should be detailed. Included are requirements for seams or complete replacement of the damaged product. For overlap repairs, the geosynthetic should extend the minimum of the overlap length requirement from all edges of the tear or rip (i.e., if a 1 foot (0.3 m) overlap is required, the patch should extend at least 1 foot (0.3 m) from all edges of the tear). In reinforcement applications, it is best that the specifications require complete replacement of a damaged section. Finally, the contract documents should very clearly state that final approval of the repairs is determined by the engineer, and that payment for repairs is the responsibility of the contractor. Acceptance and rejection criteria for the geosynthetic materials should be clearly stated in the specifications. It is very important that all installations be observed by a designer’s representative who is knowledgeable about geogrid placement procedures and who is aware of design requirements. Sampling (e.g., ASTM D 4354, Standard Practice for Sampling of Geosynthetics for Testing) and testing requirements for quality assurance that are required during construction should also be specified. Guidelines for acceptance and rejection of geosynthetic shipments are given in ASTM D 4759, Standard Practice for Determining the Specification Conformance of Geosynthetics. For small projects, the cost of ASTM acceptance/rejection criterion testing is often a significant portion of the total project cost and may even exceed the cost of the geosynthetic itself. In such cases, a certification by the manufacturer should be required. In this case, collect a few samples from the rolls for future evaluation and confirmation, if required.
Example specifications for geogrids and geocomposites in roadway applications will be covered later in Section 9.
after FHWA NHI-07-092 Roadways and Pavements Geosynthetics Engineering 6 August 2008
4 APPLICABILTY AND BENEFITS OF GEOSYNTHETICS IN ROADWAYS Roads and highways are broadly classified into two categories: permanent and temporary, depending on their service life, traffic applications, or desired performance. Permanent roads include both paved and unpaved systems which usually remain in service 10 years or more. Permanent roads may be subjected to more than a million load applications during their design lives. On the other hand, temporary roads are, in most cases, unpaved. They remain in service for only short periods of time (often less than 1 year), and are usually subjected to fewer than 10,000 load applications during their services lives. Temporary roads include detours, haul and access roads, construction platforms, and stabilized working tables required for the construction of permanent roads, as well as embankments over soft foundations. 4-1 Temporary Roads and Working Platforms Geosynthetics are used in temporary roads to reduce rutting of the gravel surface and/or to decrease the amount of gravel required to support the anticipated traffic. Furthermore, the geosynthetic helps to maintain the aggregate thickness over the life of the temporary road. Where the soils are normally too weak to support the initial construction work, geosynthetics in combination with gravel provide a working platform to allow construction equipment access to sites. This is one of the more important uses of geosynthetics. Even if the finished roadway can be supported by the subgrade, it may be virtually impossible to begin construction of the embankment or roadway. Such sites require stabilization by dewatering, demucking, excavation and replacement with select granular materials, utilization of stabilization aggregate, chemical stabilization, etc. Geosynthetics can often be a cost-effective alternate to these expensive foundation treatment procedures. 4-2 Permanent Paved and Unpaved Roads For permanent road construction, a temporary working platform can be constructed to provide an improved roadbed using geogrid reinforcements with an aggregate layer to provide a form of mechanical stabilization. This mechanically stabilized aggregate layer enables contractors to meet minimum compaction specifications for the first two or three aggregate lifts. This is especially true on very soft, wet subgrades, where the use of ordinary compaction equipment is very difficult or even impossible. Long term, a geogrid or, in some cases, a geocomposite acts to maintain the roadway design section and the base course material integrity. Thus, the geosynthetic will ultimately increase the life of the roadway. Another geogrid application in roadways is to place the geogrid or geocomposite at the bottom of or within the base course to provide reinforcement through lateral confinement of the aggregate layer. Lateral confinement arises from the development of interface shear
after FHWA NHI-07-092 Roadways and Pavements Geosynthetics Engineering 7 August 2008
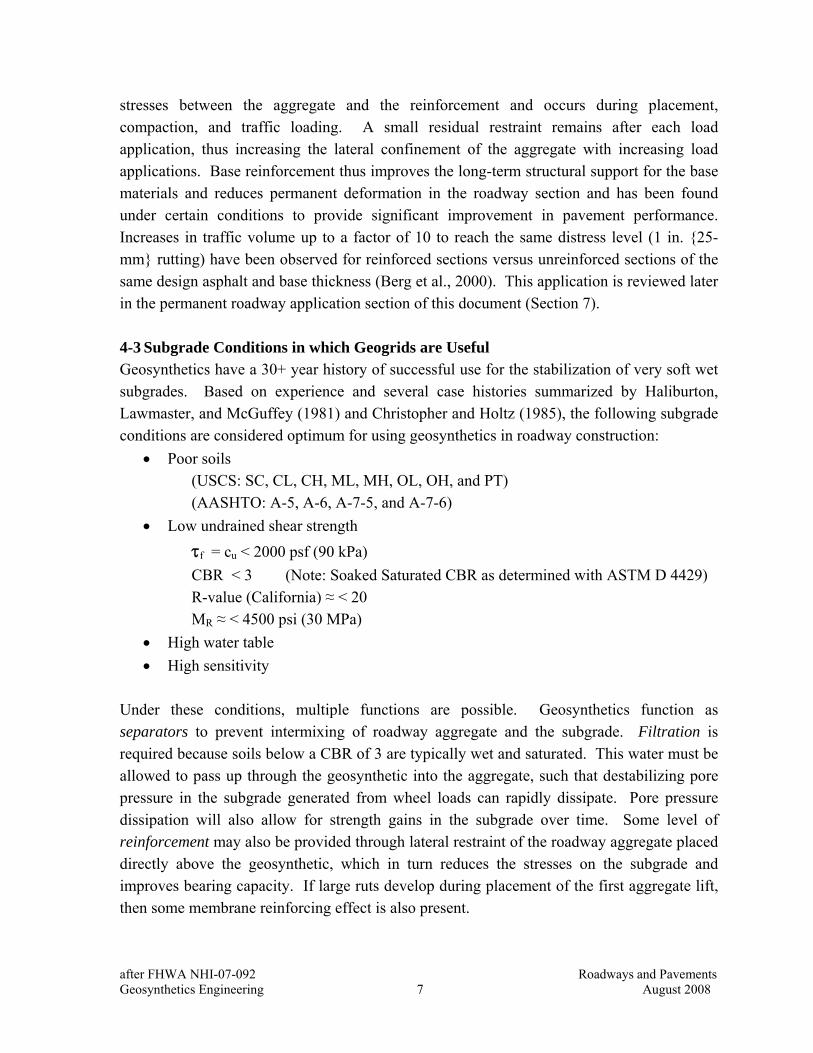
stresses between the aggregate and the reinforcement and occurs during placement, compaction, and traffic loading. A small residual restraint remains after each load application, thus increasing the lateral confinement of the aggregate with increasing load applications. Base reinforcement thus improves the long-term structural support for the base materials and reduces permanent deformation in the roadway section and has been found under certain conditions to provide significant improvement in pavement performance. Increases in traffic volume up to a factor of 10 to reach the same distress level (1 in. {25-mm} rutting) have been observed for reinforced sections versus unreinforced sections of the same design asphalt and base thickness (Berg et al., 2000). This application is reviewed later in the permanent roadway application section of this document (Section 7). 4-3 Subgrade Conditions in which Geogrids are Useful Geosynthetics have a 30+ year history of successful use for the stabilization of very soft wet subgrades. Based on experience and several case histories summarized by Haliburton, Lawmaster, and McGuffey (1981) and Christopher and Holtz (1985), the following subgrade conditions are considered optimum for using geosynthetics in roadway construction:
• Poor soils (USCS: SC, CL, CH, ML, MH, OL, OH, and PT) (AASHTO: A-5, A-6, A-7-5, and A-7-6)
• Low undrained shear strength τf = cu < 2000 psf (90 kPa) CBR < 3 (Note: Soaked Saturated CBR as determined with ASTM D 4429) R-value (California) ≈ < 20 MR ≈ < 4500 psi (30 MPa)
• High water table • High sensitivity
Under these conditions, multiple functions are possible. Geosynthetics function as separators to prevent intermixing of roadway aggregate and the subgrade. Filtration is required because soils below a CBR of 3 are typically wet and saturated. This water must be allowed to pass up through the geosynthetic into the aggregate, such that destabilizing pore pressure in the subgrade generated from wheel loads can rapidly dissipate. Pore pressure dissipation will also allow for strength gains in the subgrade over time. Some level of reinforcement may also be provided through lateral restraint of the roadway aggregate placed directly above the geosynthetic, which in turn reduces the stresses on the subgrade and improves bearing capacity. If large ruts develop during placement of the first aggregate lift, then some membrane reinforcing effect is also present.
after FHWA NHI-07-092 Roadways and Pavements Geosynthetics Engineering 8 August 2008
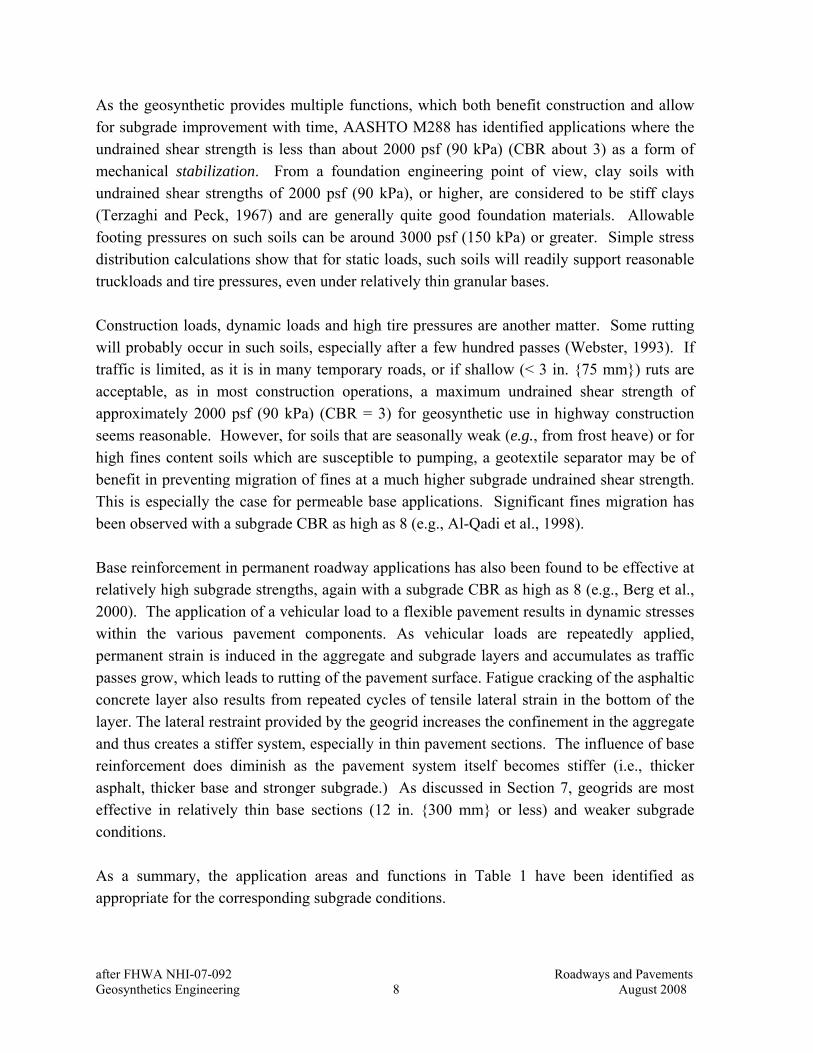
As the geosynthetic provides multiple functions, which both benefit construction and allow for subgrade improvement with time, AASHTO M288 has identified applications where the undrained shear strength is less than about 2000 psf (90 kPa) (CBR about 3) as a form of mechanical stabilization. From a foundation engineering point of view, clay soils with undrained shear strengths of 2000 psf (90 kPa), or higher, are considered to be stiff clays (Terzaghi and Peck, 1967) and are generally quite good foundation materials. Allowable footing pressures on such soils can be around 3000 psf (150 kPa) or greater. Simple stress distribution calculations show that for static loads, such soils will readily support reasonable truckloads and tire pressures, even under relatively thin granular bases. Construction loads, dynamic loads and high tire pressures are another matter. Some rutting will probably occur in such soils, especially after a few hundred passes (Webster, 1993). If traffic is limited, as it is in many temporary roads, or if shallow (< 3 in. {75 mm}) ruts are acceptable, as in most construction operations, a maximum undrained shear strength of approximately 2000 psf (90 kPa) (CBR = 3) for geosynthetic use in highway construction seems reasonable. However, for soils that are seasonally weak (e.g., from frost heave) or for high fines content soils which are susceptible to pumping, a geotextile separator may be of benefit in preventing migration of fines at a much higher subgrade undrained shear strength. This is especially the case for permeable base applications. Significant fines migration has been observed with a subgrade CBR as high as 8 (e.g., Al-Qadi et al., 1998). Base reinforcement in permanent roadway applications has also been found to be effective at relatively high subgrade strengths, again with a subgrade CBR as high as 8 (e.g., Berg et al., 2000). The application of a vehicular load to a flexible pavement results in dynamic stresses within the various pavement components. As vehicular loads are repeatedly applied, permanent strain is induced in the aggregate and subgrade layers and accumulates as traffic passes grow, which leads to rutting of the pavement surface. Fatigue cracking of the asphaltic concrete layer also results from repeated cycles of tensile lateral strain in the bottom of the layer. The lateral restraint provided by the geogrid increases the confinement in the aggregate and thus creates a stiffer system, especially in thin pavement sections. The influence of base reinforcement does diminish as the pavement system itself becomes stiffer (i.e., thicker asphalt, thicker base and stronger subgrade.) As discussed in Section 7, geogrids are most effective in relatively thin base sections (12 in. {300 mm} or less) and weaker subgrade conditions. As a summary, the application areas and functions in Table 1 have been identified as appropriate for the corresponding subgrade conditions.
after FHWA NHI-07-092 Roadways and Pavements Geosynthetics Engineering 9 August 2008
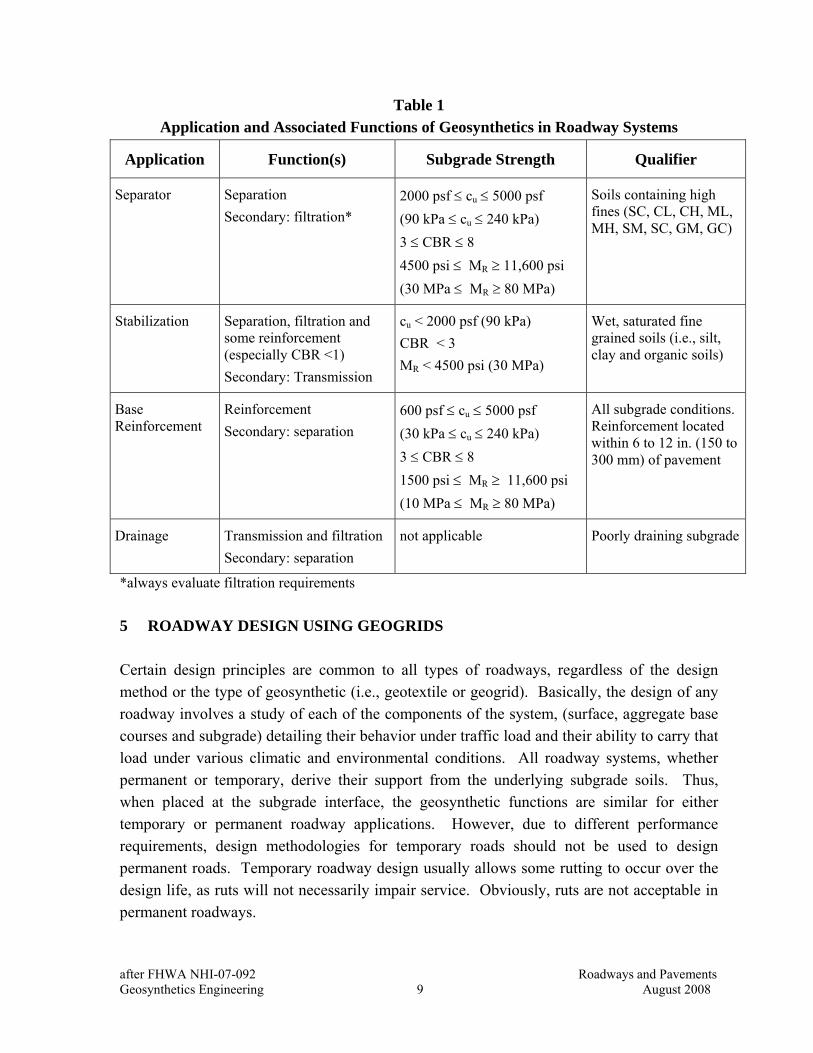
Table 1 Application and Associated Functions of Geosynthetics in Roadway Systems
Application Function(s) Subgrade Strength Qualifier
Separator Separation Secondary: filtration*
2000 psf ≤ cu ≤ 5000 psf (90 kPa ≤ cu ≤ 240 kPa) 3 ≤ CBR ≤ 8 4500 psi ≤ MR ≥ 11,600 psi (30 MPa ≤ MR ≥ 80 MPa)
Soils containing high fines (SC, CL, CH, ML, MH, SM, SC, GM, GC)
Stabilization Separation, filtration and some reinforcement (especially CBR <1) Secondary: Transmission
cu < 2000 psf (90 kPa) CBR < 3 MR < 4500 psi (30 MPa)
Wet, saturated fine grained soils (i.e., silt, clay and organic soils)
Base Reinforcement
Reinforcement Secondary: separation
600 psf ≤ cu ≤ 5000 psf (30 kPa ≤ cu ≤ 240 kPa) 3 ≤ CBR ≤ 8 1500 psi ≤ MR ≥ 11,600 psi (10 MPa ≤ MR ≥ 80 MPa)
All subgrade conditions. Reinforcement located within 6 to 12 in. (150 to 300 mm) of pavement
Drainage Transmission and filtration Secondary: separation
not applicable Poorly draining subgrade
*always evaluate filtration requirements 5 ROADWAY DESIGN USING GEOGRIDS Certain design principles are common to all types of roadways, regardless of the design method or the type of geosynthetic (i.e., geotextile or geogrid). Basically, the design of any roadway involves a study of each of the components of the system, (surface, aggregate base courses and subgrade) detailing their behavior under traffic load and their ability to carry that load under various climatic and environmental conditions. All roadway systems, whether permanent or temporary, derive their support from the underlying subgrade soils. Thus, when placed at the subgrade interface, the geosynthetic functions are similar for either temporary or permanent roadway applications. However, due to different performance requirements, design methodologies for temporary roads should not be used to design permanent roads. Temporary roadway design usually allows some rutting to occur over the design life, as ruts will not necessarily impair service. Obviously, ruts are not acceptable in permanent roadways.
after FHWA NHI-07-092 Roadways and Pavements Geosynthetics Engineering 10 August 2008
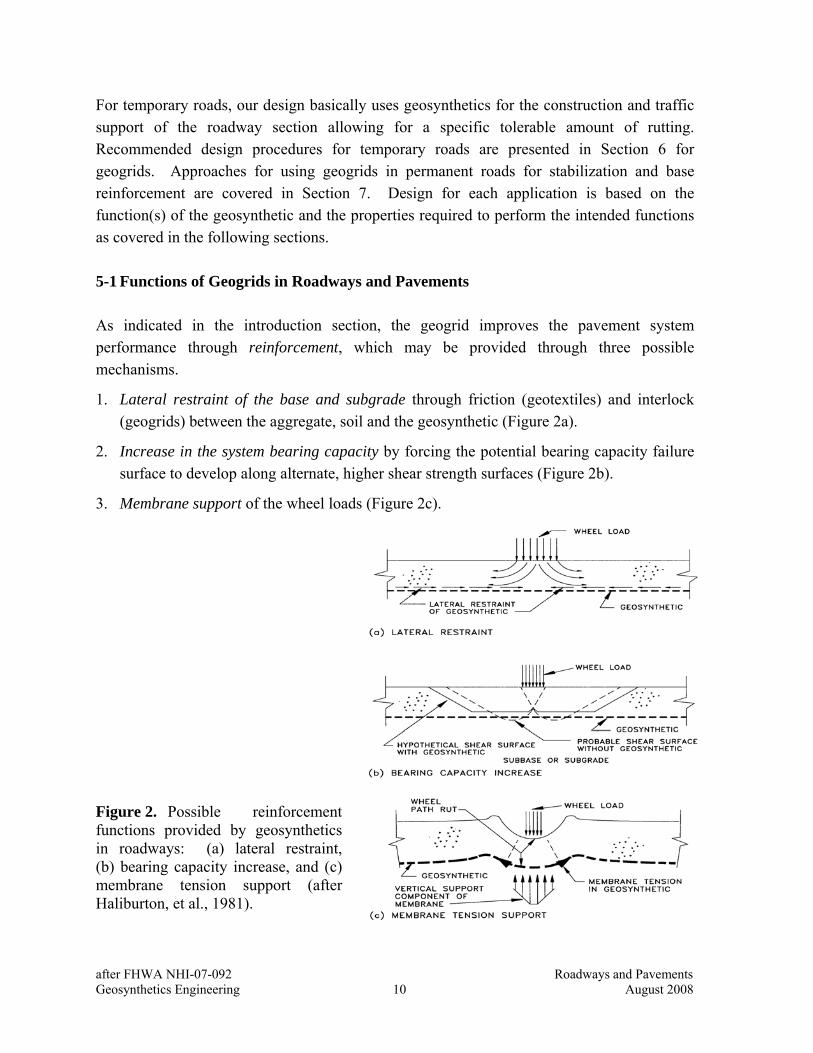
For temporary roads, our design basically uses geosynthetics for the construction and traffic support of the roadway section allowing for a specific tolerable amount of rutting. Recommended design procedures for temporary roads are presented in Section 6 for geogrids. Approaches for using geogrids in permanent roads for stabilization and base reinforcement are covered in Section 7. Design for each application is based on the function(s) of the geosynthetic and the properties required to perform the intended functions as covered in the following sections. 5-1 Functions of Geogrids in Roadways and Pavements As indicated in the introduction section, the geogrid improves the pavement system performance through reinforcement, which may be provided through three possible mechanisms.
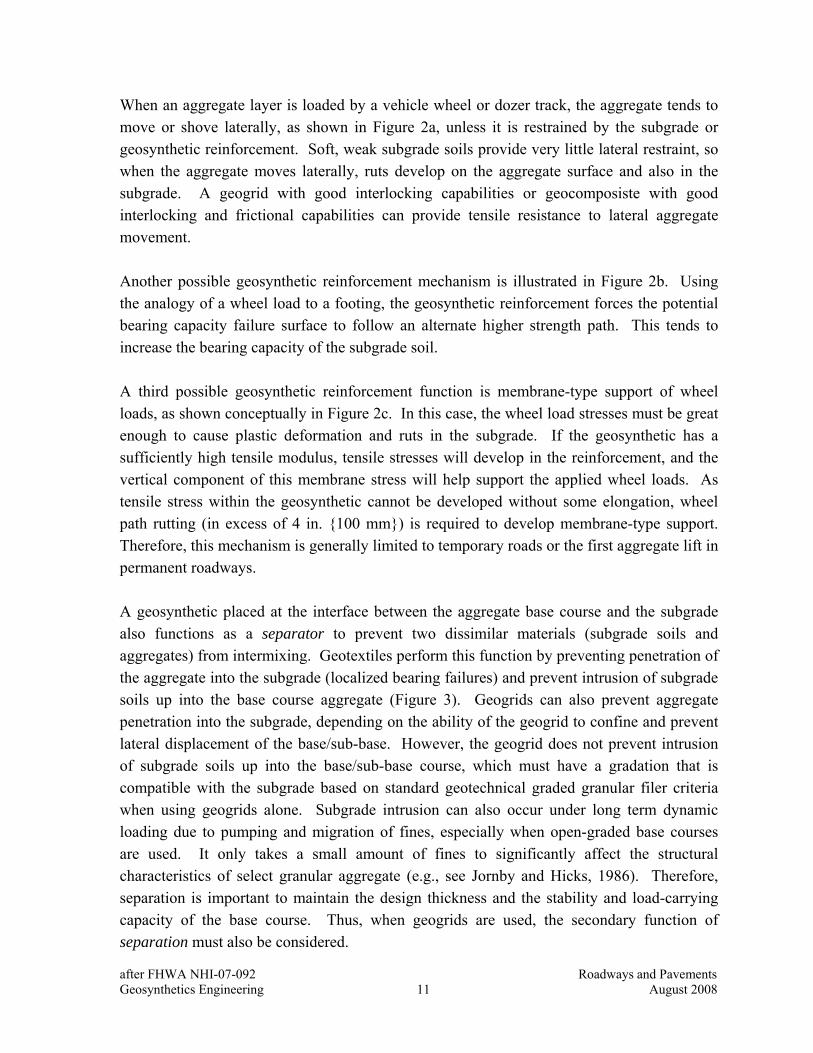
1. Lateral restraint of the base and subgrade through friction (geotextiles) and interlock (geogrids) between the aggregate, soil and the geosynthetic (Figure 2a).
2. Increase in the system bearing capacity by forcing the potential bearing capacity failure surface to develop along alternate, higher shear strength surfaces (Figure 2b).
3. Membrane support of the wheel loads (Figure 2c). Figure 2. Possible reinforcement functions provided by geosynthetics in roadways: (a) lateral restraint, (b) bearing capacity increase, and (c) membrane tension support (after Haliburton, et al., 1981).
after FHWA NHI-07-092 Roadways and Pavements Geosynthetics Engineering 11 August 2008
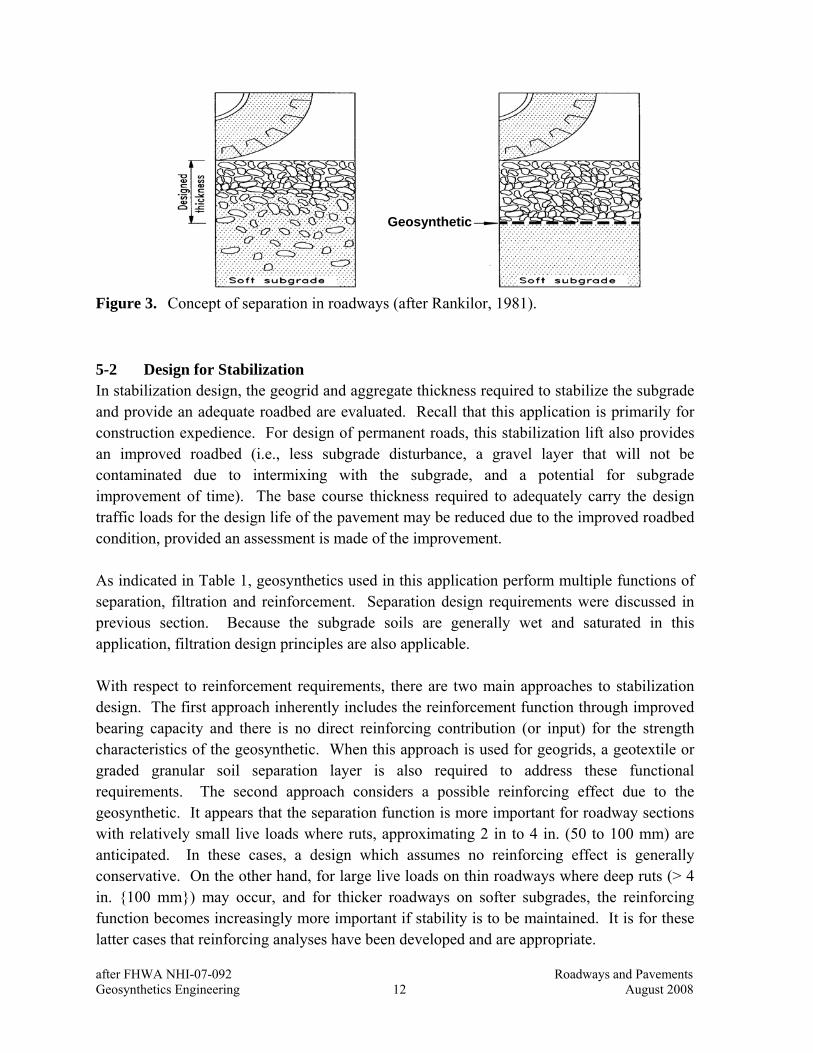
When an aggregate layer is loaded by a vehicle wheel or dozer track, the aggregate tends to move or shove laterally, as shown in Figure 2a, unless it is restrained by the subgrade or geosynthetic reinforcement. Soft, weak subgrade soils provide very little lateral restraint, so when the aggregate moves laterally, ruts develop on the aggregate surface and also in the subgrade. A geogrid with good interlocking capabilities or geocomposiste with good interlocking and frictional capabilities can provide tensile resistance to lateral aggregate movement. Another possible geosynthetic reinforcement mechanism is illustrated in Figure 2b. Using the analogy of a wheel load to a footing, the geosynthetic reinforcement forces the potential bearing capacity failure surface to follow an alternate higher strength path. This tends to increase the bearing capacity of the subgrade soil. A third possible geosynthetic reinforcement function is membrane-type support of wheel loads, as shown conceptually in Figure 2c. In this case, the wheel load stresses must be great enough to cause plastic deformation and ruts in the subgrade. If the geosynthetic has a sufficiently high tensile modulus, tensile stresses will develop in the reinforcement, and the vertical component of this membrane stress will help support the applied wheel loads. As tensile stress within the geosynthetic cannot be developed without some elongation, wheel path rutting (in excess of 4 in. {100 mm}) is required to develop membrane-type support. Therefore, this mechanism is generally limited to temporary roads or the first aggregate lift in permanent roadways. A geosynthetic placed at the interface between the aggregate base course and the subgrade also functions as a separator to prevent two dissimilar materials (subgrade soils and aggregates) from intermixing. Geotextiles perform this function by preventing penetration of the aggregate into the subgrade (localized bearing failures) and prevent intrusion of subgrade soils up into the base course aggregate (Figure 3). Geogrids can also prevent aggregate penetration into the subgrade, depending on the ability of the geogrid to confine and prevent lateral displacement of the base/sub-base. However, the geogrid does not prevent intrusion of subgrade soils up into the base/sub-base course, which must have a gradation that is compatible with the subgrade based on standard geotechnical graded granular filer criteria when using geogrids alone. Subgrade intrusion can also occur under long term dynamic loading due to pumping and migration of fines, especially when open-graded base courses are used. It only takes a small amount of fines to significantly affect the structural characteristics of select granular aggregate (e.g., see Jornby and Hicks, 1986). Therefore, separation is important to maintain the design thickness and the stability and load-carrying capacity of the base course. Thus, when geogrids are used, the secondary function of separation must also be considered.
after FHWA NHI-07-092 Roadways and Pavements Geosynthetics Engineering 12 August 2008
Figure 3. Concept of separation in roadways (after Rankilor, 1981). 5-2 Design for Stabilization In stabilization design, the geogrid and aggregate thickness required to stabilize the subgrade and provide an adequate roadbed are evaluated. Recall that this application is primarily for construction expedience. For design of permanent roads, this stabilization lift also provides an improved roadbed (i.e., less subgrade disturbance, a gravel layer that will not be contaminated due to intermixing with the subgrade, and a potential for subgrade improvement of time). The base course thickness required to adequately carry the design traffic loads for the design life of the pavement may be reduced due to the improved roadbed condition, provided an assessment is made of the improvement. As indicated in Table 1, geosynthetics used in this application perform multiple functions of separation, filtration and reinforcement. Separation design requirements were discussed in previous section. Because the subgrade soils are generally wet and saturated in this application, filtration design principles are also applicable. With respect to reinforcement requirements, there are two main approaches to stabilization design. The first approach inherently includes the reinforcement function through improved bearing capacity and there is no direct reinforcing contribution (or input) for the strength characteristics of the geosynthetic. When this approach is used for geogrids, a geotextile or graded granular soil separation layer is also required to address these functional requirements. The second approach considers a possible reinforcing effect due to the geosynthetic. It appears that the separation function is more important for roadway sections with relatively small live loads where ruts, approximating 2 in to 4 in. (50 to 100 mm) are anticipated. In these cases, a design which assumes no reinforcing effect is generally conservative. On the other hand, for large live loads on thin roadways where deep ruts (> 4 in. {100 mm}) may occur, and for thicker roadways on softer subgrades, the reinforcing function becomes increasingly more important if stability is to be maintained. It is for these latter cases that reinforcing analyses have been developed and are appropriate.
Geosynthetic
after FHWA NHI-07-092 Roadways and Pavements Geosynthetics Engineering 13 August 2008
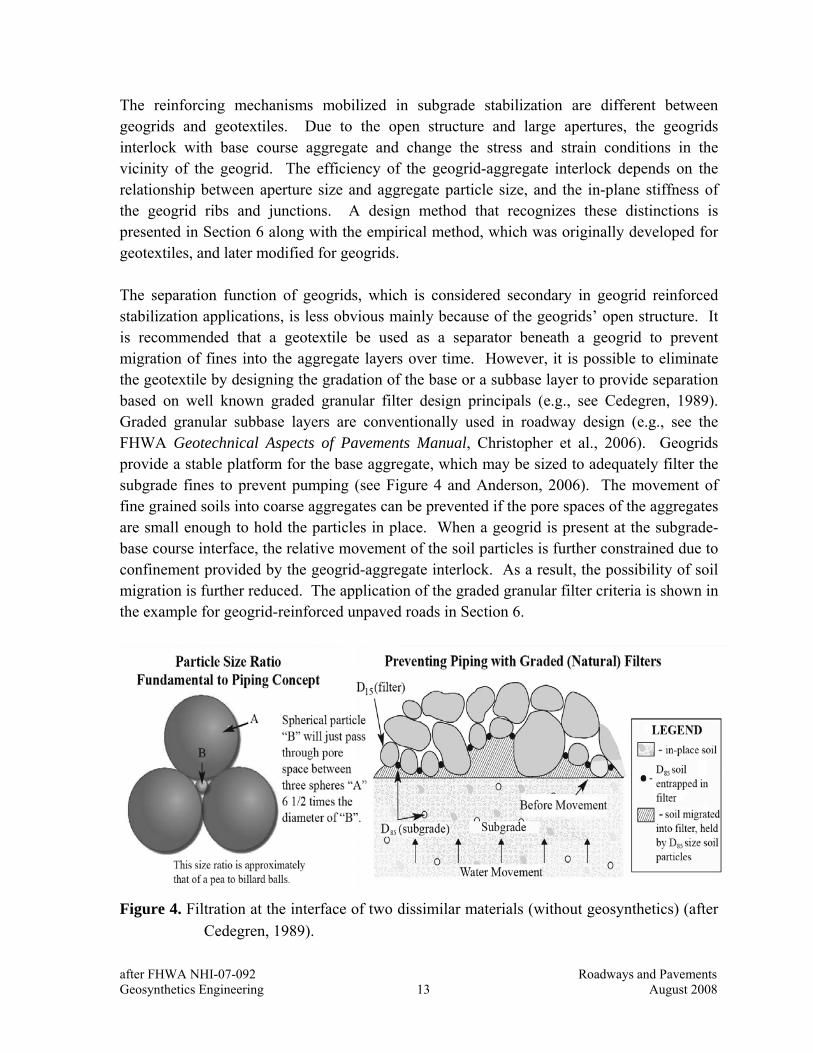
The reinforcing mechanisms mobilized in subgrade stabilization are different between geogrids and geotextiles. Due to the open structure and large apertures, the geogrids interlock with base course aggregate and change the stress and strain conditions in the vicinity of the geogrid. The efficiency of the geogrid-aggregate interlock depends on the relationship between aperture size and aggregate particle size, and the in-plane stiffness of the geogrid ribs and junctions. A design method that recognizes these distinctions is presented in Section 6 along with the empirical method, which was originally developed for geotextiles, and later modified for geogrids. The separation function of geogrids, which is considered secondary in geogrid reinforced stabilization applications, is less obvious mainly because of the geogrids’ open structure. It is recommended that a geotextile be used as a separator beneath a geogrid to prevent migration of fines into the aggregate layers over time. However, it is possible to eliminate the geotextile by designing the gradation of the base or a subbase layer to provide separation based on well known graded granular filter design principals (e.g., see Cedegren, 1989). Graded granular subbase layers are conventionally used in roadway design (e.g., see the FHWA Geotechnical Aspects of Pavements Manual, Christopher et al., 2006). Geogrids provide a stable platform for the base aggregate, which may be sized to adequately filter the subgrade fines to prevent pumping (see Figure 4 and Anderson, 2006). The movement of fine grained soils into coarse aggregates can be prevented if the pore spaces of the aggregates are small enough to hold the particles in place. When a geogrid is present at the subgrade-base course interface, the relative movement of the soil particles is further constrained due to confinement provided by the geogrid-aggregate interlock. As a result, the possibility of soil migration is further reduced. The application of the graded granular filter criteria is shown in the example for geogrid-reinforced unpaved roads in Section 6.
Figure 4. Filtration at the interface of two dissimilar materials (without geosynthetics) (after Cedegren, 1989).
after FHWA NHI-07-092 Roadways and Pavements Geosynthetics Engineering 14 August 2008
5-3 Reinforced Base/Subbase Design Geogrids have been used for reinforcement of aggregate layers within the pavement system since their introduction in the early 1980s. The predominant reinforcing mechanism associated with this application is base course lateral restraint (Figure 2a). The base course lateral restraint develops through interlock between the aggregate, soil and the geogrid because four reinforcement effects: (1) prevention of lateral spreading of aggregate; (2) confinement of aggregate resulting in increased strength/stiffness of aggregate in the vicinity of the geogrid; (3) reduction of vertical stresses on top of the subgrade; and (4) reduction of shear stress on the subgrade. Despite many successful projects and research it is recognized that the use of geogrid reinforcement in paved roadways is relatively limited compared to other geosynthetics applications. Berg et al. (2000), Perkins et al. (2005c), and Gabr et al. (2006) indicated the following major reasons for the relatively limited used of geogrids in base reinforcement applications: 1. Lack of an accepted design method. Currently the use of base reinforcement applications
is based on prior experience and empirically based design approaches which are limited to the conditions of the related experiments.
2. Existing numerical models for pavement design without geosynthetics are complicated (NCHRP, 2002) and the perception is that the inclusion of geosynthetics will complicate them further. A recent movement toward adoption of a mechanistic-empirical design approach recognized that this will allow quantification of the geogrid benefits in a rational and consistent way.
3. Few studies provide comparison for the full range of available geogrids (i.e., woven vs. extruded, different aperture stiffness/stability, etc.), and some types of geogrids have been studied more often than others.
4. Geogrids (and geosynthetics in general) are perceived as special materials that are considered only if problem areas need to be fixed (Gabr et al., 2006).
5. Lack of a uniform method for cost-benefit analysis. It is recognized that the development of a design method within the framework of the mechanistic-empirical design method will address the limitations of the current design approaches and lead to a broader use of geosynthetics in base reinforcement applications. Two approaches are presented for base reinforcement in Section 7. The first uses an empirical procedure based on current AASHTO and the improved traffic benefit derived from using the geosynthetic. The other method is based on the AASHTO mechanistic-empirical design approach (AASHTO, 2008).
after FHWA NHI-07-092 Roadways and Pavements Geosynthetics Engineering 15 August 2008
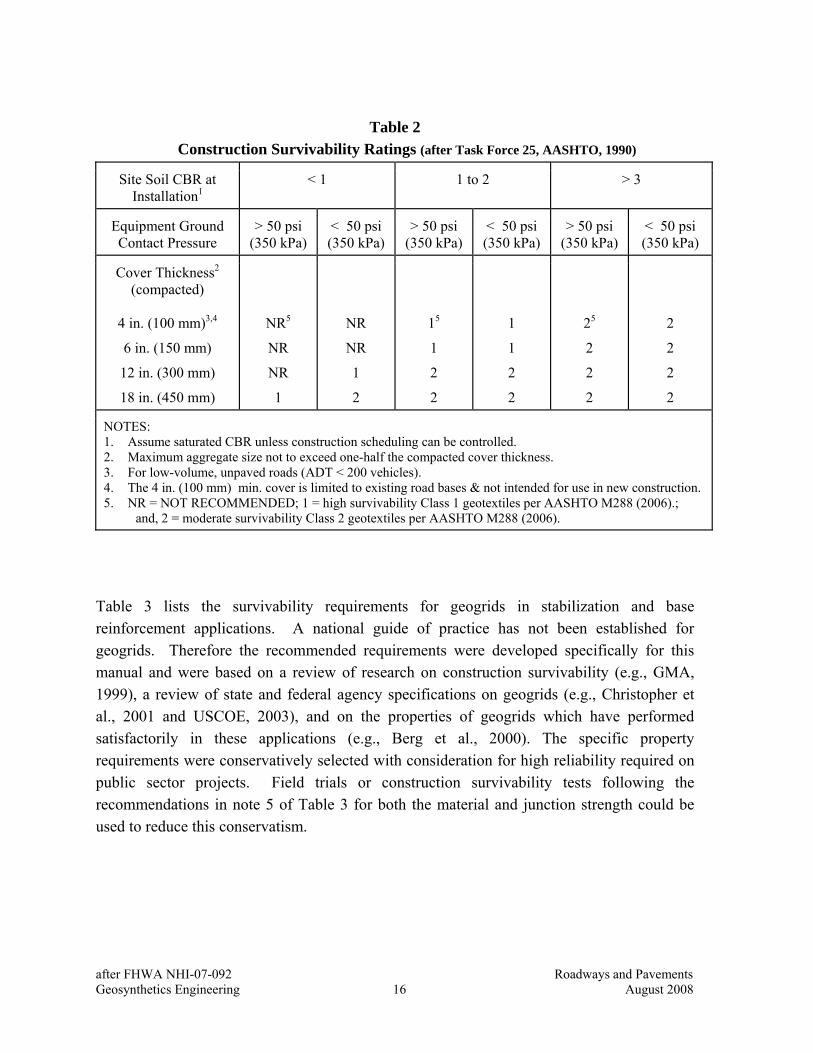
5-6 Material Properties used in Design As with any geosynthetic applications, the material properties required for design are based on the properties required to perform the primary and secondary function(s) for the specific application over the life of the system and the properties required to survive installation. Some strength is, of course, required for the reinforcing function, which is based on the requirements in the specific design approach. The separation function is related to opening characteristics and are determined based on the gradation of the adjacent layers (i.e., subgrade, base and/or subbase layers). If the roadway system is designed correctly, then the stress at the top of the subgrade due to the weight of the aggregate and the traffic load should be less than the bearing capacity of the soil plus a safety factor, which is generally a relatively low value compared to the strength of most geosynthetics. However, the stresses applied to the subgrade and the geosynthetic during construction may be much greater than those applied in-service. Therefore, the strength of the geosynthetic in roadway applications is usually governed by the anticipated construction stresses and the required level of performance. This is the concept of geosynthetic survivability -- the geosynthetic must survive the construction operations if it is to perform its intended function. Table 2 relates the elements of construction (i.e., equipment, aggregate characteristics, subgrade preparation, and subgrade shear strength) to the severity of the loading imposed on the geosynthetic. If one or more of these items falls within a particular severity category (i.e., moderate or high), then geosynthetics meeting those survivability requirements should be selected. For the high category in Table 2, geosynthetics that can survive the most severe conditions anticipated during construction should be used and are designated as Class 1 geosynthetics in the following geosynthetic property requirements tables. Geosynthetics that can survive normal construction conditions are Class 2 geosynthetics and may be considered for the moderate category. Variable combinations indicating a NOT RECOMMENDED rating suggests that one or more variables should be modified to assure a successful installation. Some judgment is required in using these criteria.
after FHWA NHI-07-092 Roadways and Pavements Geosynthetics Engineering 16 August 2008
Table 2
Construction Survivability Ratings (after Task Force 25, AASHTO, 1990)
Site Soil CBR at Installation1
< 1 1 to 2 > 3
Equipment Ground Contact Pressure
> 50 psi (350 kPa)
< 50 psi (350 kPa)
> 50 psi (350 kPa)
< 50 psi (350 kPa)
> 50 psi (350 kPa)
< 50 psi (350 kPa)
Cover Thickness2
(compacted)
4 in. (100 mm)3,4
6 in. (150 mm)
12 in. (300 mm)
18 in. (450 mm)
NR5
NR
NR
1
NR
NR
1
2
15
1
2
2
1
1
2
2
25
2
2
2
2
2
2
2
NOTES: 1. Assume saturated CBR unless construction scheduling can be controlled. 2. Maximum aggregate size not to exceed one-half the compacted cover thickness. 3. For low-volume, unpaved roads (ADT < 200 vehicles). 4. The 4 in. (100 mm) min. cover is limited to existing road bases & not intended for use in new construction. 5. NR = NOT RECOMMENDED; 1 = high survivability Class 1 geotextiles per AASHTO M288 (2006).;
and, 2 = moderate survivability Class 2 geotextiles per AASHTO M288 (2006).
Table 3 lists the survivability requirements for geogrids in stabilization and base reinforcement applications. A national guide of practice has not been established for geogrids. Therefore the recommended requirements were developed specifically for this manual and were based on a review of research on construction survivability (e.g., GMA, 1999), a review of state and federal agency specifications on geogrids (e.g., Christopher et al., 2001 and USCOE, 2003), and on the properties of geogrids which have performed satisfactorily in these applications (e.g., Berg et al., 2000). The specific property requirements were conservatively selected with consideration for high reliability required on public sector projects. Field trials or construction survivability tests following the recommendations in note 5 of Table 3 for both the material and junction strength could be used to reduce this conservatism.

after FHWA NHI-07-092 Roadways and Pavements Geosynthetics Engineering 17 August 2008
Table 3 Geogrid Survivability Property Requirements1,2,3 For Stabilization and Base Reinforcement Applications
Property Test Method
Units Requirement
SURVIVABILITY
Geogrid Class
CLASS 14 CLASS 2 CLASS 3
Ultimate Multi-Rib Tensile Strength
ASTM D 6637
lb/ft (kN/m) 1230 (18) 820 (12) 820 (12)
Junction Strength5 GSI GRI GG2 lb (N) 255 (1105) 25 (110) 8 (35)
Ultraviolet Stability (Retained Strength)
ASTM D 4355 % 50% after 500 hours of exposure
OPENING CHARACTERISTICS
Aperture Size Direct measure in. (mm)
0.5 to 3 in. (12.5 to 75 mm) and Aperture Size ≥ D50 of aggregate above geogrid
Aperture Size ≤ 2⋅D85 of aggregate above geogrid
Separation ASTM D 422 Mm D15 of aggregate above geogrid < 5⋅D85 subgrade
Otherwise use separation geotextile with geogrid
NOTES: 1. Acceptance of geogrid material shall be based on ASTM D 4759. 2. Acceptance shall be based upon testing of either conformance samples obtained using Procedure A of
ASTM D 4354, or based on manufacturer’s certifications and testing of quality assurance samples obtained using Procedure B of ASTM D 4354.
3. Minimum; use value in weaker principal direction. All numerical values represent minimum average roll value (i.e., test results from any sampled roll in a lot shall meet or exceed the minimum values in the table). Lot samples according to ASTM D 4354.
4. Default geogrid selection. The engineer may specify a Class 2 or 3 geogrid for moderate survivability conditions, see Table 2, based on one or more of the following: a) The Engineer has found the class of geogrid to have sufficient survivability based on field experience. b) The Engineer has found the class of geogrid to have sufficient survivability based on laboratory testing
and visual inspection of a geogrid sample removed from a field test section constructed under anticipated field conditions (see note 5).
5. Junction strength requirements have not been fully supported by data, and until such data is established, manufacturers shall submit data from full scale installation damage tests in accordance with ASTM D 5818 documenting integrity of junctions. For soft soil applications, a minimum of 6 in. (150 mm) of cover aggregate shall be placed over the geogrid and a loaded dump truck used to traverse the section a minimum number of passes to achieve 4 in. (100 mm) of rutting. A photographic record of the geogrid after exhumation shall be provided, which clearly shows that junctions have not been displaced or otherwise damaged during the installation process.

after FHWA NHI-07-092 Roadways and Pavements Geosynthetics Engineering 18 August 2008
Survivability of geogrids for major projects should be verified by conducting field tests under site-specific conditions. These field tests should involve trial sections using several geosynthetics on typical subgrades at the project site and implementing various types of construction equipment. After placement of the geosynthetics and aggregate, the geosynthetics are exhumed to see how well or how poorly they tolerated the imposed construction stresses. These tests could be performed during design or after the contract was let. In the latter case, the contractor is required to demonstrate that the proposed subgrade condition, equipment, and aggregate placement will not significantly damage the geogrid. If necessary, additional subgrade preparation, increased lift thickness, and/or different construction equipment could be utilized. In rare cases, the contractor may even have to supply a different geosynthetic. 6 DESIGN GUIDELINES FOR USE OF GEOGRIDS IN TEMPORARY AND
UNPAVED ROADS Geogrids are commonly used to facilitate the construction and improve the performance of unpaved low-volume roads on weak subgrades. As previously indicated in Section 5-1, the primary function of the geogrid in this application is reinforcement leading to reduced amount of aggregate needed, less maintenance, extended service life or a combination of these. A secondary function is aggregate fill/subgrade separation. The benefits of geogrids in unpaved low-volume roads have been shown in numerous laboratory and full-scale experiments (e.g., Haas et al., 1988; Webster, 1993; Collin et al., 1996; Fannin and Sigurdsson, 1996; Knapton and Austin, 1996; Gabr et al., 2001; and, Leng and Gabr, 2002). Some experimental programs investigated the performance of different geogrids (extruded, woven or welded) and the results showed that the stiffer geogrids performed better (Webster, 1993; Collin et al., 1996). These experiments served as a basis for the development of the empirical design methods for geogrid-reinforced unpaved low-volume roads. Historically the geogrids were introduced to the market in the early 1980s and by that time geotextiles were used at the base-subgrade interface for separation, filtration and some reinforcement. As a result, the first empirical design procedures of Barenberg et al. (1975) and Steward et al. (1977) were developed for geotextiles-reinforced unpaved roads using solutions based on the limit equilibrium bearing capacity theory. The solution of Steward et al. (1977) was modified by Tingle and Webster (2003) for geogrid reinforcement and the proposed modification was adopted in the COE method for design of geotextile- and geogrid-reinforced unpaved roads (USCOE, 2003). This approach is described in Section 6-1.

after FHWA NHI-07-092 Roadways and Pavements Geosynthetics Engineering 19 August 2008
Utilizing previous research, Giroud and Han (2004) developed a theoretically based and experimentally calibrated design method for geogrid-reinforced unpaved roads that reflects the improvements due to the geogrid-aggregate interlock. The method can also be utilized for analysis of unreinforced and geogrid-reinforced unpaved roads, or temporary platforms. This approach will be presented in Section 6-2. 6-1 Empirical Design Method: Modified Steward et al. (1977) Tingle and Webster (2003) used full-scale experiments to evaluate the applicability of the design procedure for geogrid-reinforced unpaved roads. Their analysis concluded that the bearing capacity factor of 2.8, used in the Steward et al. method for unreinforced roads was acceptable. For the geogrid-reinforced case they suggested a bearing capacity factor of 5.8 and recommended the use of geotextile as a separator. Application of the modified Steward et al. (1977) design method to geogrid-reinforced unpaved roads is presented in this section as follows. The following design method was developed by Steward, Williamson, and Mohney (1977) for the U.S. Forest Service (USFS). It allows the designer to consider:
• vehicle passes; • equivalent axle loads; • axle configurations; • tire pressures; • subgrade strengths; and • rut depths.
The following limitations apply:
• the aggregate layer must be a) high quality fill (e.g., laboratory CBR based on ASTM D 1883 ≥ 80), b) cohesionless (nonplastic);
• vehicle passes less than 10,000; • geogrid survivability criteria must be considered; and • subgrade undrained shear strength less than about 2000 psf (90 kPa) (CBR < 3).
As discussed in Section 4-3, for subgrades stronger than about 2000 psf (90 kPa) (CBR > 3), geogrids are rarely required for stabilization, although some long-term base reinforcement benefit may apply.
after FHWA NHI-07-092 Roadways and Pavements Geosynthetics Engineering 20 August 2008
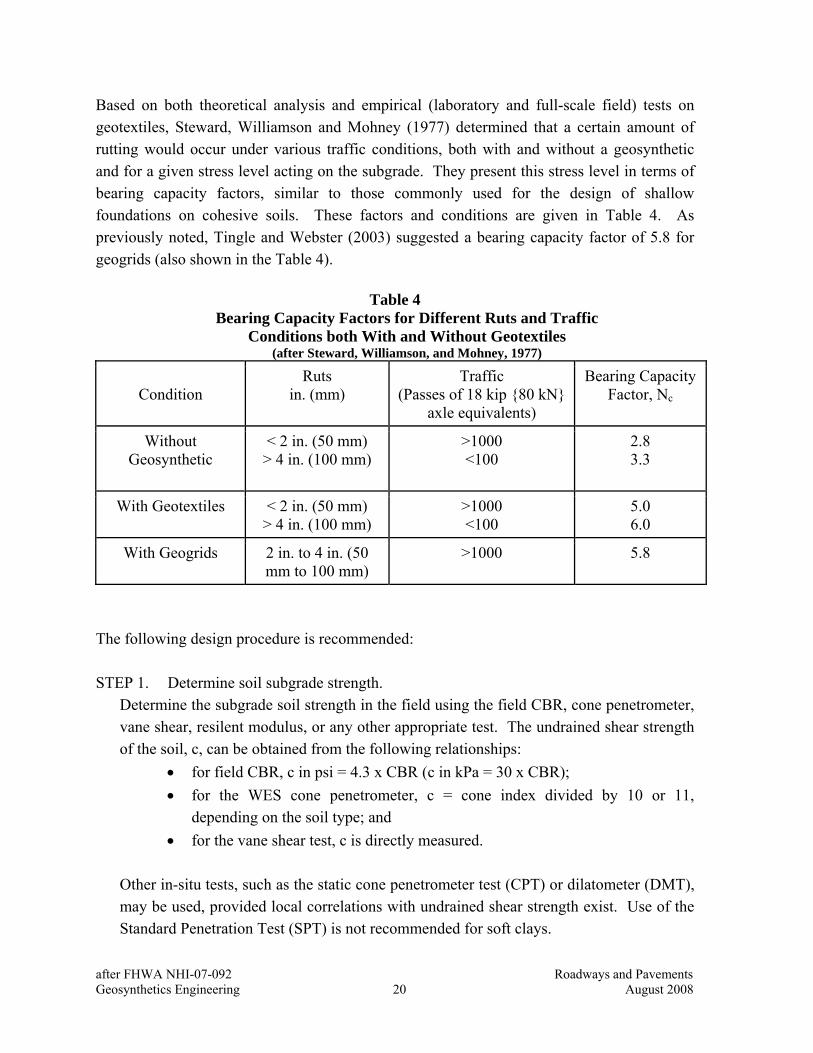
Based on both theoretical analysis and empirical (laboratory and full-scale field) tests on geotextiles, Steward, Williamson and Mohney (1977) determined that a certain amount of rutting would occur under various traffic conditions, both with and without a geosynthetic and for a given stress level acting on the subgrade. They present this stress level in terms of bearing capacity factors, similar to those commonly used for the design of shallow foundations on cohesive soils. These factors and conditions are given in Table 4. As previously noted, Tingle and Webster (2003) suggested a bearing capacity factor of 5.8 for geogrids (also shown in the Table 4).
Table 4
Bearing Capacity Factors for Different Ruts and Traffic Conditions both With and Without Geotextiles (after Steward, Williamson, and Mohney, 1977)
Condition
Ruts in. (mm)
Traffic (Passes of 18 kip {80 kN}
axle equivalents)
Bearing Capacity Factor, Nc
Without Geosynthetic
< 2 in. (50 mm) > 4 in. (100 mm)
>1000 <100
2.8 3.3
With Geotextiles
< 2 in. (50 mm) > 4 in. (100 mm)
>1000 <100
5.0 6.0
With Geogrids 2 in. to 4 in. (50 mm to 100 mm)
>1000 5.8
The following design procedure is recommended: STEP 1. Determine soil subgrade strength.
Determine the subgrade soil strength in the field using the field CBR, cone penetrometer, vane shear, resilent modulus, or any other appropriate test. The undrained shear strength of the soil, c, can be obtained from the following relationships:
• for field CBR, c in psi = 4.3 x CBR (c in kPa = 30 x CBR); • for the WES cone penetrometer, c = cone index divided by 10 or 11,
depending on the soil type; and • for the vane shear test, c is directly measured.
Other in-situ tests, such as the static cone penetrometer test (CPT) or dilatometer (DMT), may be used, provided local correlations with undrained shear strength exist. Use of the Standard Penetration Test (SPT) is not recommended for soft clays.

after FHWA NHI-07-092 Roadways and Pavements Geosynthetics Engineering 21 August 2008
Determine subgrade strength at several locations and at different times of the year. Make strength determinations at several locations where the subgrade appears to be the weakest. Strengths should be evaluated at depth of 0 in. to 8 in. (0 to 200 mm) and from 8 in. to 20 in. (200 - 500 mm); six to ten strength measurements are recommended at each location to obtain a good average value. Tests should also be performed when the soils are in their weakest condition, when the water table is the highest, etc. Alternatively, a saturated soaked laboratory CBR test (ASTM D1883) could be performed to model wet conditions in the field (e.g., for compacted soils that will be exposed to wet conditions).
STEP 2. Determine wheel loading.
Determine the maximum single wheel load, maximum dual wheel load, and the maximum dual tandem wheel load anticipated for the roadway during the design period. For example, a 10 yd3 (7.6 m3) dump truck with tandem axles will have a dual wheel load of approximately 8,000 lbf (35 kN). A motor grader has a wheel load of 5,000 to 10,000 lbf (22 to 44 kN).
STEP 3. Estimate amount of traffic. Estimate the maximum amount of traffic anticipated for each design vehicle class.
STEP 4. Establish tolerable rutting.
Establish the amount of tolerable rutting during the design life of the roadway. For example, a rut of 2 in. to 3 in. (50 to 75 mm) is generally acceptable during construction.
STEP 5. Obtain bearing capacity factor(s).
Obtain appropriate subgrade stress level in terms of the bearing capacity factors in Table 4. Values may be obtained for both the conditions with geogrid and without geogrid for estimating the cost effectiveness of using a geogrid.
STEP 6. Determine required aggregate thickness(es).
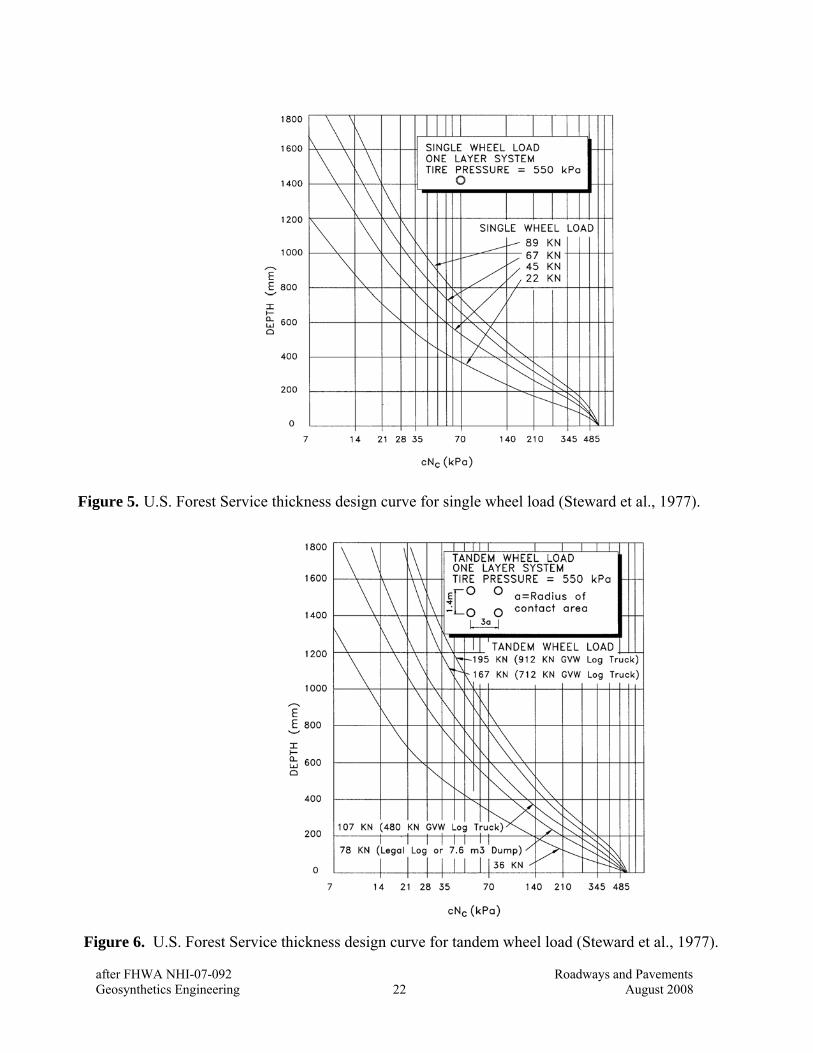
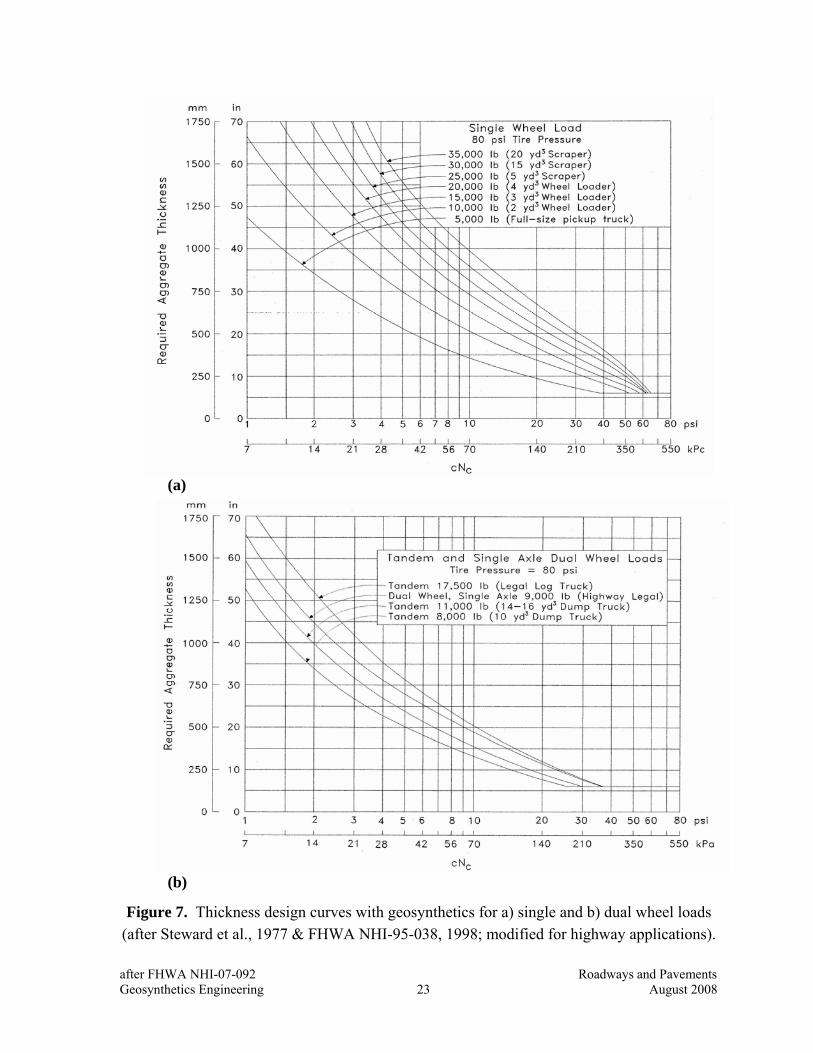
Determine the required aggregate thickness(es) from the USFS design chart (Figures 5, 6 or 7) for each maximum loading. Enter the curve with appropriate bearing capacity factors (Nc) multiplied by the design subgrade undrained shear strength (c) to evaluate each required stress level (cNc).
STEP 7. Select design thickness(es).
Select the design thickness based on the design requirements (e.g., for the maximum loading condition, with and without geogrid, as required). The design thickness(es) should be given to the next higher 1 in. (25 mm).
after FHWA NHI-07-092 Roadways and Pavements Geosynthetics Engineering 22 August 2008
Figure 5. U.S. Forest Service thickness design curve for single wheel load (Steward et al., 1977).
Figure 6. U.S. Forest Service thickness design curve for tandem wheel load (Steward et al., 1977).
after FHWA NHI-07-092 Roadways and Pavements Geosynthetics Engineering 23 August 2008
(a)
(b)
Figure 7. Thickness design curves with geosynthetics for a) single and b) dual wheel loads (after Steward et al., 1977 & FHWA NHI-95-038, 1998; modified for highway applications).
after FHWA NHI-07-092 Roadways and Pavements Geosynthetics Engineering 24 August 2008
STEP 8. Check separation requirements. Check the gradation of the aggregate layer (i.e., base, subbase or working platform)
adjacent to the subgrade. The following filter criteria apply (Cedergren, 1989):
5Subgrade 85
fill aggregate 15
DD ≤ and 25
Subgrade 50
fill aggregate 50D
D ≤
For a separation geotextile used with geogrid, check the geotextile drainage and filtration requirements. Use the gradation and permeability of the subgrade, the water table conditions, and the retention and permeability criteria (from Holtz et al., 2008), which are:
AOS < D85subgrade (Wovens) (Eq. 2-3) AOS < 1.8 D85subgrade (Nonwovens) (Eq. 2-4) kgeotextile > ksubgrade (Eq. 2-7a) ψ < 0.1 sec-1 (Eq. 2-8c) STEP 9. Determine geogrid survivability requirements.
Check the geogrid survivability strength requirements as discussed in Section 5-6, Tables 2 and 3.
STEP 10. Specify geogrid property requirements. Specify geogrids that meet or exceed the survivability criteria from Step 9.
STEP 11. Specify construction requirements. (Follow the procedures in Section 8.) 6-2 Empirical Design Method of Giroud and Han (2004) Giroud and Han (2004) developed a theoretically based and empirically calibrated design method specifically designed for geogrid-reinforced unpaved roads and areas. They built upon earlier design methods developed by Giroud and Noiray (1981) and Giroud et al. (1985) using recent field and laboratory test data. Giroud and Noiray (1981) developed an empirical solution for unreinforced unpaved roads using field test data and quantified the benefits resulting from geogrid reinforcement. The solution was based on the limit equilibrium bearing capacity theory with a modification to consider the benefit of the tension membrane effect. The Giroud-Han theoretical formulation takes into account the distribution of stresses, strength of base course material, geogrid-aggregate interlock, and geogrid in-plane stiffness in addition to conditions considered in earlier methods (traffic volume, wheel loads, tire pressure, subgrade strength, rut depth and influence of reinforcing geosynthetics of the failure mode of unpaved roads). The influence of different factors on the theoretical formulations, the assumptions and the limitations of the Giroud-Han design method are briefly presented below.
after FHWA NHI-07-092 Roadways and Pavements Geosynthetics Engineering 25 August 2008
The properties of the base course material are considered in the solution which is an advancement compared to previous methods. The base course material is characterized by its CBR using the AASHTO chart for correlation with the resilient modulus for subbase (AASHTO, 1993). The subgrade soil is assumed to be saturated and exhibit undrained behavior under traffic loading. The subgrade soil modulus is used based on correlation between the field CBR and the field resilient modulus for fine grained soils (Heukelom and Klomp, 1962). Other relationships can also be used to derive the resilient modulus of the subgrade soil. In the formulation of the design equation, the ratio of the resilient modulus of base course to subgrade soil is limited to 5. Additional data are necessary to justify the use of higher values for stiff geogrids which appear to improve the compaction of base course material even on very soft subgrades. Serviceability Criterion Based on Rut Depth. Failure of the unpaved roads is assumed to be controlled by the shear failure or the excessive deformation of the subgrade. The formulation of the design method is based on a typical surface rut depth of 3 in. (75 mm) which is a serviceability criterion. It allows for rut depths between 2 and 4 in. (50 and 100 mm) to be analyzed. Additional field data are needed to support the use of the method beyond these limits. Characterization of Geogrid Reinforcement. The properties of geogrids relate to their ability to interlock with the base course material and provide confinement. Based on research by Kinney (1995) and Collin et al. (1996), the aperture stability modulus was the stiffness property selected, based on correlation with measured performance in roads. The aperture stability modulus is obtained by measuring the in-plane torsional behavior directly across the junction of a biaxial geogrid. It is a direct measure of the in-plane stiffness and stability of the ribs and junctions of the geogrid. The method was calibrated using data for stiff biaxial geogrids with aperture stability modulus of 0.32 and 0.65 N-m/deg (Kinney, 2000). In the design method the aperture stability modulus can vary from zero to a maximum value based on the data used in the calibration (Giroud and Han, 2004b). A draft test method for determining the aperture stability modulus of a geogrid has been developed by Kinney (2000) and a standard method is currently under development by ASTM. Bearing Capacity Factors. The bearing capacity factors for unreinforced unpaved roads as presented in Section 6.1 ranged from 2.8 to 3.3. Giroud and Han (2004a) adopted a bearing capacity factor of 3.14 (i.e., π) which is the value of the elastic limit for saturated undrained subgrade soil for plain-strain and axisymmetric conditions and zero interface shear stress. As
after FHWA NHI-07-092 Roadways and Pavements Geosynthetics Engineering 26 August 2008
discussed earlier the strike through and the interlock at the geogrid-reinforced interface resists the lateral movement at the top of the subgrade, and creates inward shear stresses on the subgrade. The theoretical value of the ultimate bearing capacity factor for axisymmetric conditions and maximum inward shear stress of 5.71 (i.e., 3π/2) is adopted for the geogrid-reinforced unpaved roads. For the case when the base course is separated by a geotextile and there is no interlock, Giroud and Han adopted the value of 5.14 (i.e., π+2) initially proposed by Giroud and Noiray (1981), which is the ultimate bearing capacity factor for plain-strain conditions and zero shear stress at the base-subgrade interface. Equation for Required Thickness of Base Course. The thickness of the base course material was determined on the basis of the bearing capacity theory to prevent the development of rut depths exceeding the predetermined serviceability criterion. The deformation of the subgrade depends on the stresses applied at the base-subgrade interface and the development of the rut depth as a function of the stresses at the base-subgrade interface and the bearing capacity of the subgrade. The influence of traffic, properties of base course material, and geogrid properties are expressed through two important parameters – the Bearing Capacity Mobilization Coefficient (m), and the Stress Distribution Angle (α). The Bearing Capacity Mobilization Coefficient defines the level of mobilized bearing capacity, which depends on the deflection at the top of subgrade when the surface rutting reaches the allowable rut depth. The Stress Distribution Angle defines the capability of the base course material to transfer traffic loads to the subgrade. The effect of traffic and geogrid on the rate of change of stress distribution angle as the unpaved roads deteriorate under repeated loading is considered in the formulation. The following design equation for base course thickness was developed through calibration and verification with laboratory and field data (Giroud and Han, 2004b):
(1)
where: (0.661-1.006 J2) > 0
h = required base course thickness (in. or m) J = aperture stability modulus in metric units (N-m/degree) P = wheel load (lbs or kN) r = radius of tire print (in. or m)
( )[ ] r
CBRfNefs
rP
R
NhrJ
h
sgcchr
s
E
⎟⎟⎟⎟⎟⎟⎟
⎠
⎞
⎜⎜⎜⎜⎜⎜⎜
⎝
⎛
−
⎥⎥
⎦
⎤
⎢⎢
⎣
⎡−
−+
⎟⎠⎞
⎜⎝⎛−+
=⎭⎬⎫
⎩⎨⎧−
1
9.011204.01
log)006.1661.0(868.0
2
2
5.12
π
after FHWA NHI-07-092 Roadways and Pavements Geosynthetics Engineering 27 August 2008
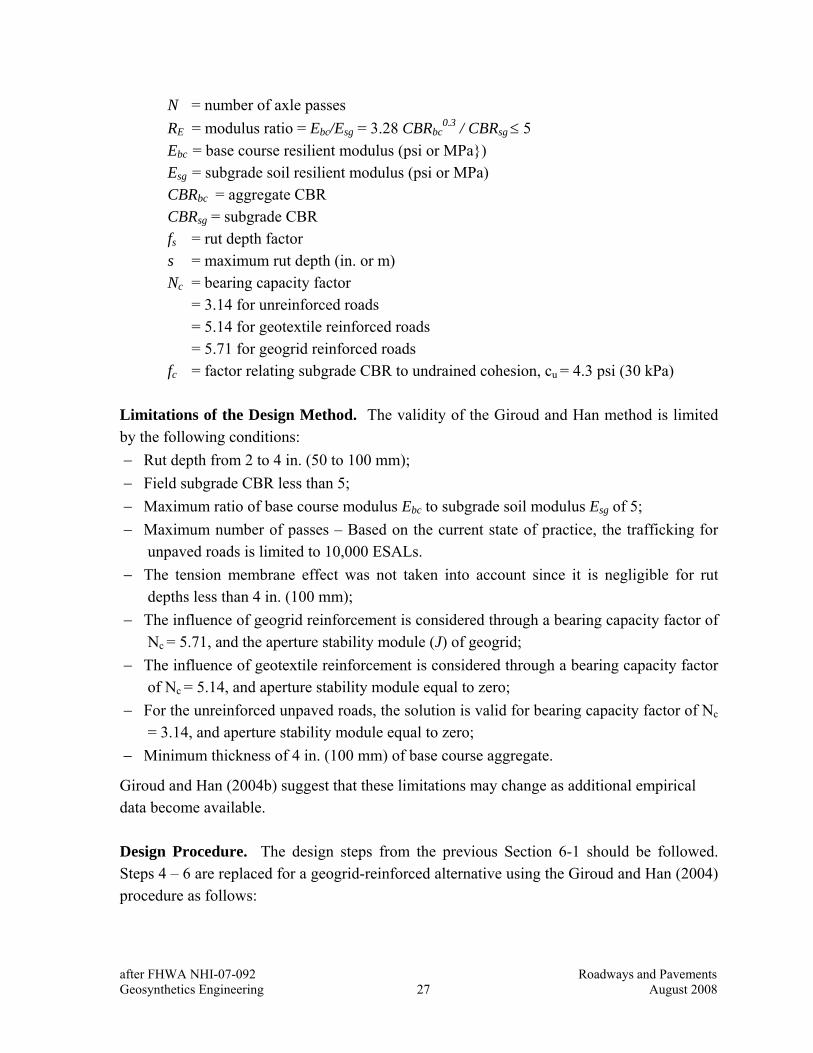
N = number of axle passes RE = modulus ratio = Ebc/Esg = 3.28 CBRbc
0.3 / CBRsg ≤ 5 Ebc = base course resilient modulus (psi or MPa}) Esg = subgrade soil resilient modulus (psi or MPa) CBRbc = aggregate CBR CBRsg = subgrade CBR fs = rut depth factor s = maximum rut depth (in. or m) Nc = bearing capacity factor = 3.14 for unreinforced roads = 5.14 for geotextile reinforced roads = 5.71 for geogrid reinforced roads fc = factor relating subgrade CBR to undrained cohesion, cu = 4.3 psi (30 kPa)
Limitations of the Design Method. The validity of the Giroud and Han method is limited by the following conditions: − Rut depth from 2 to 4 in. (50 to 100 mm); − Field subgrade CBR less than 5; − Maximum ratio of base course modulus Ebc to subgrade soil modulus Esg of 5; − Maximum number of passes – Based on the current state of practice, the trafficking for
unpaved roads is limited to 10,000 ESALs. − The tension membrane effect was not taken into account since it is negligible for rut
depths less than 4 in. (100 mm); − The influence of geogrid reinforcement is considered through a bearing capacity factor of
Nc = 5.71, and the aperture stability module (J) of geogrid; − The influence of geotextile reinforcement is considered through a bearing capacity factor
of Nc = 5.14, and aperture stability module equal to zero; − For the unreinforced unpaved roads, the solution is valid for bearing capacity factor of Nc
= 3.14, and aperture stability module equal to zero; − Minimum thickness of 4 in. (100 mm) of base course aggregate.
Giroud and Han (2004b) suggest that these limitations may change as additional empirical data become available. Design Procedure. The design steps from the previous Section 6-1 should be followed. Steps 4 – 6 are replaced for a geogrid-reinforced alternative using the Giroud and Han (2004) procedure as follows:
after FHWA NHI-07-092 Roadways and Pavements Geosynthetics Engineering 28 August 2008
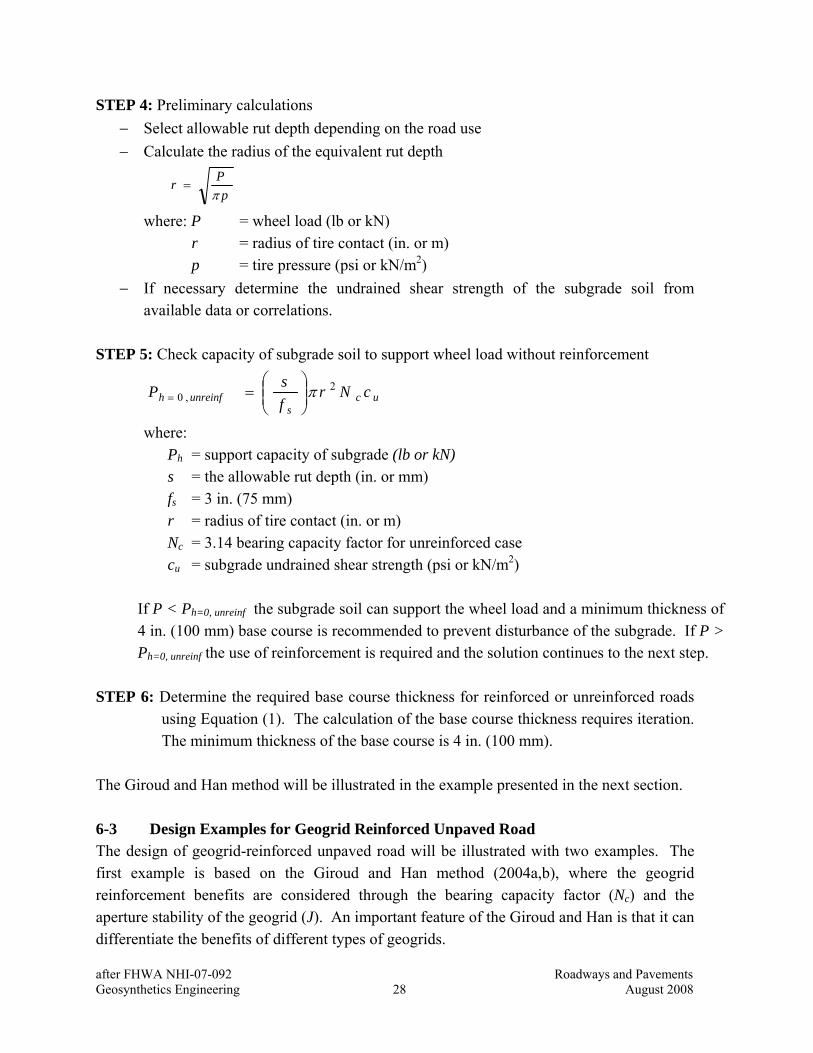
STEP 4: Preliminary calculations − Select allowable rut depth depending on the road use − Calculate the radius of the equivalent rut depth
pPrπ
=
where: P = wheel load (lb or kN) r = radius of tire contact (in. or m) p = tire pressure (psi or kN/m2)
− If necessary determine the undrained shear strength of the subgrade soil from available data or correlations.
STEP 5: Check capacity of subgrade soil to support wheel load without reinforcement
ucs
unreinfh cNrfsP 2
,0 π⎟⎟⎠
⎞⎜⎜⎝
⎛==
where: Ph = support capacity of subgrade (lb or kN) s = the allowable rut depth (in. or mm) fs = 3 in. (75 mm) r = radius of tire contact (in. or m) Nc = 3.14 bearing capacity factor for unreinforced case cu = subgrade undrained shear strength (psi or kN/m2)
If P < Ph=0, unreinf the subgrade soil can support the wheel load and a minimum thickness of 4 in. (100 mm) base course is recommended to prevent disturbance of the subgrade. If P > Ph=0, unreinf the use of reinforcement is required and the solution continues to the next step.
STEP 6: Determine the required base course thickness for reinforced or unreinforced roads
using Equation (1). The calculation of the base course thickness requires iteration. The minimum thickness of the base course is 4 in. (100 mm).
The Giroud and Han method will be illustrated in the example presented in the next section. 6-3 Design Examples for Geogrid Reinforced Unpaved Road The design of geogrid-reinforced unpaved road will be illustrated with two examples. The first example is based on the Giroud and Han method (2004a,b), where the geogrid reinforcement benefits are considered through the bearing capacity factor (Nc) and the aperture stability of the geogrid (J). An important feature of the Giroud and Han is that it can differentiate the benefits of different types of geogrids.

after FHWA NHI-07-092 Roadways and Pavements Geosynthetics Engineering 29 August 2008
The second example is based on the Modified Steward et al., 1977 method (USCOE, 2003), where the geogrid reinforcement benefits are considered only through the bearing capacity factor, Nc = 5.8, derived from empirical studies for extruded biaxial geogrids under laid with a geotextile separator. DESIGN EXAMPLE 1: GIROUD AND HAN METHOD (2004 a, b) PART I: GEOGRID REINFORCEMENT Determine an appropriate aggregate thickness for a haul road over weak subgrade that is required for a highway construction project. Investigate a conventional unreinforced solution and a geogrid-reinforced alternative, using the Giroud and Han method (2004 a, b) for the given set of design parameters. DESIGN INPUT Traffic Load:
Axle load = 18 kip (80 kN) Tire pressure = 80 psi (550 kPa) Number of axle passes = 5000
Failure Criteria: Maximum rut depth = 3 in. (75 mm)
Aggregate and Subgrade Soil Strength: Aggregate fill CBR = 15 Field subgrade CBR = 1
Geosynthetic Reinforcement: Extruded Biaxial Geogrid with Aperture Stability Modulus, J = 0.32 N-m/degree
Bearing capacity factors: Nc = 3.14 for unreinforced road section Nc = 5.71 for geogrid-reinforced road section
DESIGN CALCULATIONS STEP 4: PRELIMINARY CALCULATIONS
Wheel load, P = 9,000 lbs (40 kN) Allowable rut depth, s = 3 in. (75 mm)
Radius of tire contact: 55014.3
40x
r = = 0.152 m = 6 in.
Ratio of base course modulus to subgrade modulus:
( )( )( ) 58.7
0.11548.348.3 3.03.0
>===sg
bc
sg
bc
CBRCBR
EE
The ratio of base course modulus to subgrade modulus of 5 is used in the calculations.
after FHWA NHI-07-092 Roadways and Pavements Geosynthetics Engineering 30 August 2008
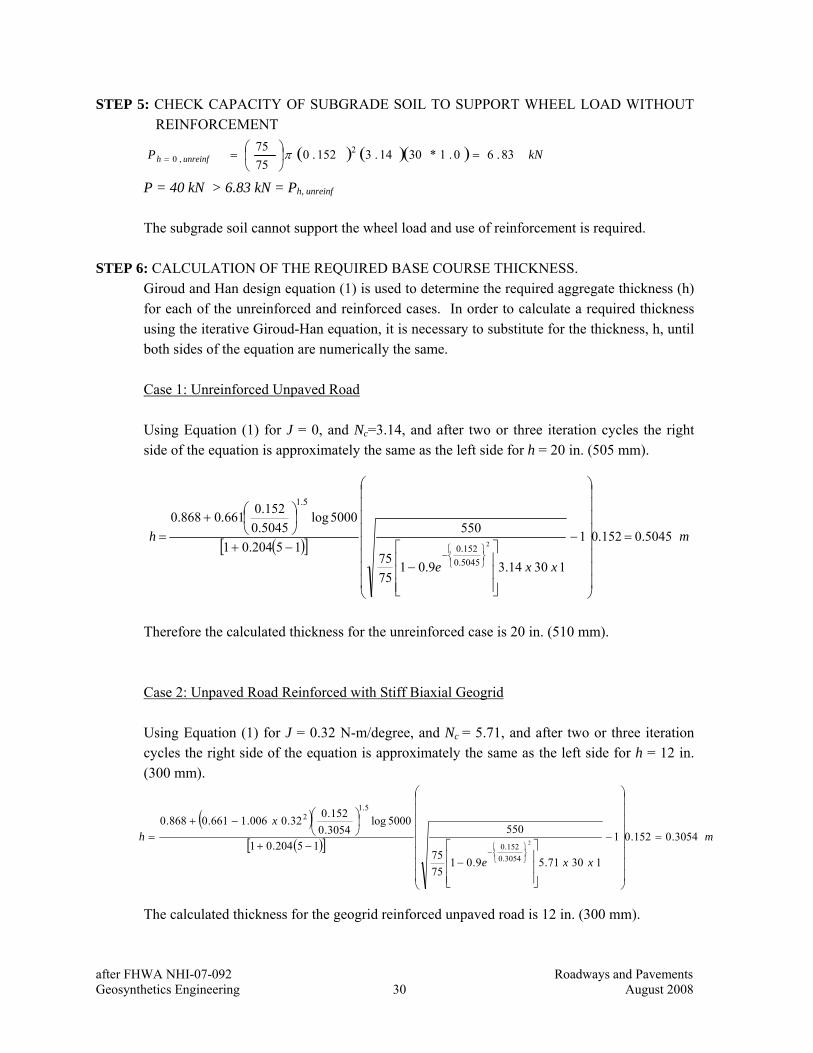
STEP 5: CHECK CAPACITY OF SUBGRADE SOIL TO SUPPORT WHEEL LOAD WITHOUT REINFORCEMENT
( ) ( )( ) kNP unreinfh 83.60.1*3014.3152.07575 2
,0 =⎟⎠⎞
⎜⎝⎛== π
P = 40 kN > 6.83 kN = Ph, unreinf
The subgrade soil cannot support the wheel load and use of reinforcement is required. STEP 6: CALCULATION OF THE REQUIRED BASE COURSE THICKNESS.
Giroud and Han design equation (1) is used to determine the required aggregate thickness (h) for each of the unreinforced and reinforced cases. In order to calculate a required thickness using the iterative Giroud-Han equation, it is necessary to substitute for the thickness, h, until both sides of the equation are numerically the same. Case 1: Unreinforced Unpaved Road Using Equation (1) for J = 0, and Nc=3.14, and after two or three iteration cycles the right side of the equation is approximately the same as the left side for h = 20 in. (505 mm). Therefore the calculated thickness for the unreinforced case is 20 in. (510 mm). Case 2: Unpaved Road Reinforced with Stiff Biaxial Geogrid Using Equation (1) for J = 0.32 N-m/degree, and Nc = 5.71, and after two or three iteration cycles the right side of the equation is approximately the same as the left side for h = 12 in. (300 mm).
The calculated thickness for the geogrid reinforced unpaved road is 12 in. (300 mm).
( )( )[ ] m
xxe
xh 3054.0152.01
13071.59.017575
55015204.01
5000log3054.0152.032.0006.1661.0868.0
2
3054.0152.0
5.12
=
⎟⎟⎟⎟⎟⎟⎟⎟
⎠
⎞
⎜⎜⎜⎜⎜⎜⎜⎜
⎝
⎛
−
⎥⎥⎥
⎦
⎤
⎢⎢⎢
⎣
⎡−
−+
⎟⎠⎞
⎜⎝⎛−+
=
⎭⎬⎫
⎩⎨⎧−
( )[ ] m
xxe
h 5045.0152.01
13014.39.017575
55015204.01
5000log5045.0152.0661.0868.0
2
5045.0152.0
5.1
=
⎟⎟⎟⎟⎟⎟⎟⎟
⎠
⎞
⎜⎜⎜⎜⎜⎜⎜⎜
⎝
⎛
−
⎥⎥⎥
⎦
⎤
⎢⎢⎢
⎣
⎡−
−+
⎟⎠⎞
⎜⎝⎛+
=
⎭⎬⎫
⎩⎨⎧−
after FHWA NHI-07-092 Roadways and Pavements Geosynthetics Engineering 31 August 2008
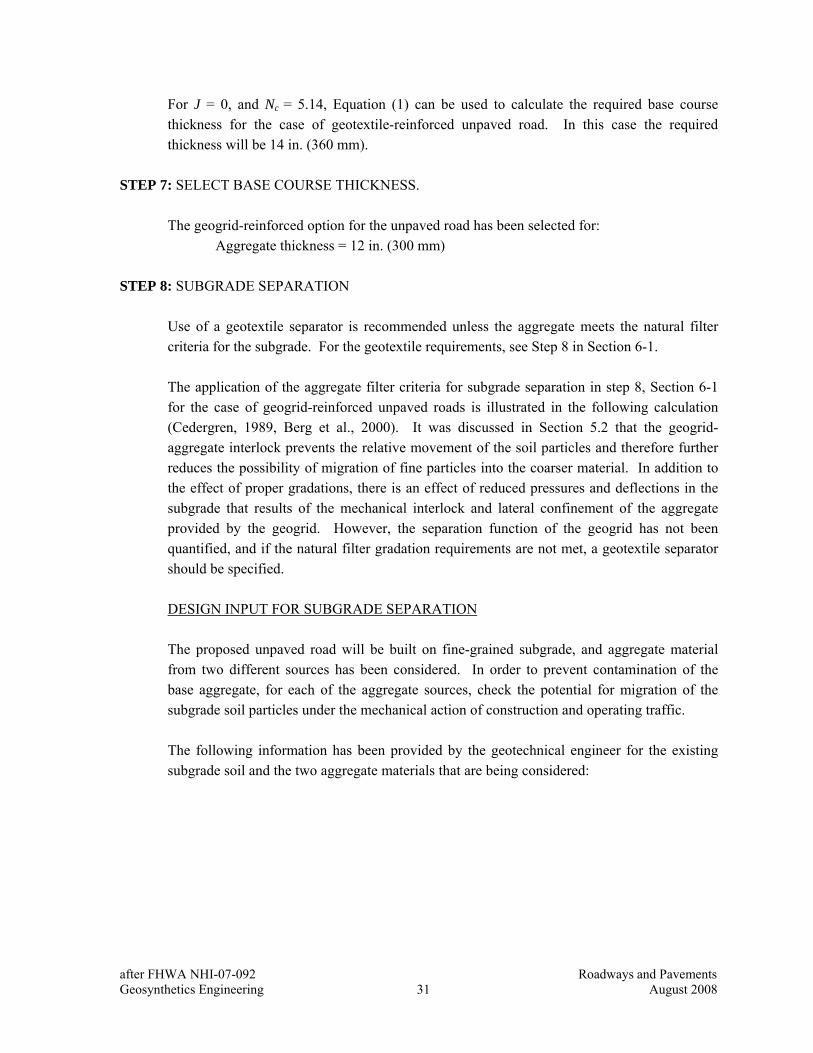
For J = 0, and Nc = 5.14, Equation (1) can be used to calculate the required base course thickness for the case of geotextile-reinforced unpaved road. In this case the required thickness will be 14 in. (360 mm).
STEP 7: SELECT BASE COURSE THICKNESS.
The geogrid-reinforced option for the unpaved road has been selected for: Aggregate thickness = 12 in. (300 mm)
STEP 8: SUBGRADE SEPARATION
Use of a geotextile separator is recommended unless the aggregate meets the natural filter criteria for the subgrade. For the geotextile requirements, see Step 8 in Section 6-1. The application of the aggregate filter criteria for subgrade separation in step 8, Section 6-1 for the case of geogrid-reinforced unpaved roads is illustrated in the following calculation (Cedergren, 1989, Berg et al., 2000). It was discussed in Section 5.2 that the geogrid-aggregate interlock prevents the relative movement of the soil particles and therefore further reduces the possibility of migration of fine particles into the coarser material. In addition to the effect of proper gradations, there is an effect of reduced pressures and deflections in the subgrade that results of the mechanical interlock and lateral confinement of the aggregate provided by the geogrid. However, the separation function of the geogrid has not been quantified, and if the natural filter gradation requirements are not met, a geotextile separator should be specified. DESIGN INPUT FOR SUBGRADE SEPARATION
The proposed unpaved road will be built on fine-grained subgrade, and aggregate material from two different sources has been considered. In order to prevent contamination of the base aggregate, for each of the aggregate sources, check the potential for migration of the subgrade soil particles under the mechanical action of construction and operating traffic. The following information has been provided by the geotechnical engineer for the existing subgrade soil and the two aggregate materials that are being considered:
after FHWA NHI-07-092 Roadways and Pavements Geosynthetics Engineering 32 August 2008
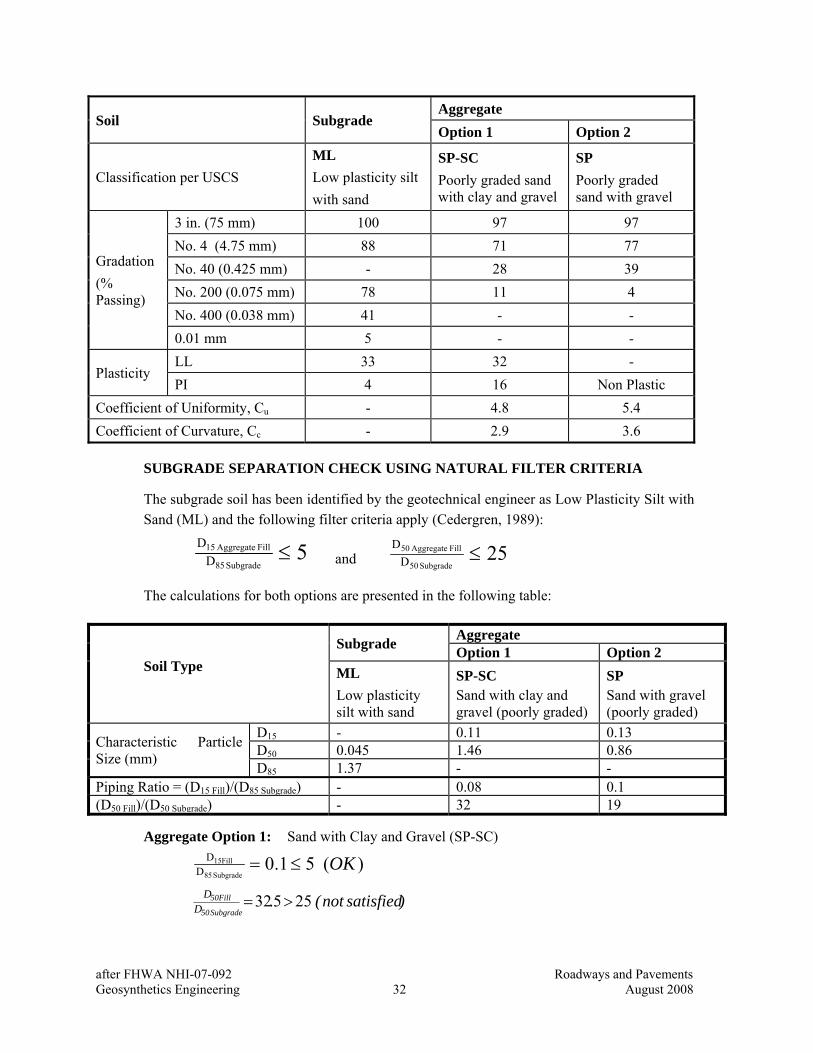
Soil Subgrade Aggregate Option 1 Option 2
Classification per USCS ML Low plasticity silt with sand
SP-SC Poorly graded sand with clay and gravel
SP Poorly graded sand with gravel
Gradation (% Passing)
3 in. (75 mm) 100 97 97 No. 4 (4.75 mm) 88 71 77 No. 40 (0.425 mm) - 28 39 No. 200 (0.075 mm) 78 11 4 No. 400 (0.038 mm) 41 - - 0.01 mm 5 - -
Plasticity LL 33 32 - PI 4 16 Non Plastic
Coefficient of Uniformity, Cu - 4.8 5.4 Coefficient of Curvature, Cc - 2.9 3.6
SUBGRADE SEPARATION CHECK USING NATURAL FILTER CRITERIA
The subgrade soil has been identified by the geotechnical engineer as Low Plasticity Silt with Sand (ML) and the following filter criteria apply (Cedergren, 1989):
5Subgrade 85
Fill Aggregate 15D
D ≤ and 25Subgrade 50
Fill Aggregate 50
DD ≤
The calculations for both options are presented in the following table:
Soil Type
Subgrade Aggregate Option 1 Option 2
ML Low plasticity silt with sand
SP-SC Sand with clay and gravel (poorly graded)
SP Sand with gravel (poorly graded)
Characteristic Particle Size (mm)
D15 - 0.11 0.13 D50 0.045 1.46 0.86 D85 1.37 - -
Piping Ratio = (D15 Fill)/(D85 Subgrade) - 0.08 0.1 (D50 Fill)/(D50 Subgrade) - 32 19
Aggregate Option 1: Sand with Clay and Gravel (SP-SC)
)(51.0Subgrade 85
15FillD
D OK≤=
)satisfiednot(. Subgrade50
50FillD
D 25532 >=

after FHWA NHI-07-092 Roadways and Pavements Geosynthetics Engineering 33 August 2008
The calculation for Aggregate Option 1 indicates that the filter gradation requirements are not satisfied and there is a potential for migration of fine particles from the silty soil subgrade into the aggregate layer. If this material is selected, a layer of filter fabric meeting the requirements of the AASHTO M288 specification is recommended for separation. Aggregate Option 2: Sand with Gravel (SP)
)(51.0Subgrade 85
15FillD
D OK≤=
)OK(. Subgrade50
50FillD
D 25019 <=
The calculation for Aggregate Option 2 indicates that the filter gradation requirements are satisfied and migration of fine particles into the aggregate layer will not occur. SELECTED AGGREGATE
Based on the above analysis, Aggregate Option 2, the sand with gravel (SP) is selected. Additional measures for subgrade separation are not required.
STEPS 9 and 10: SPECIFY GEOGRID PROPERTIES.
See Table 3 and Section 9-1.
STEP 11: SPECIFY CONSTRUCTION REQUIREMENTS. (See Section 8)
DESIGN EXAMPLE 2: MODIFIED STEWART ET AL. (1977) BASED ON USCOE (2003) DEFINITION OF DESIGN EXAMPLE
• Project Description: A haul road over wet, soft soils is required for a highway construction project.
• Type of Structure: temporary unpaved road
• Type of Application: geogrid for stabilization of subgrade (functions reinforcement
and possibly separartion)
• Alternatives :i) excavate unsuitable material and increased aggregate thickness ii.) geogrid between aggregate and subgrade iii.) use an estimated depth of aggregate and maintain as required

after FHWA NHI-07-092 Roadways and Pavements Geosynthetics Engineering 34 August 2008
GIVEN DATA • subgrade - cohesive subgrade soils
- high water table - average undrained shear strength about 600 psf (30 kPa) or CBR = 1
• traffic - approximately 5000 passes - 20,000 lbf (90 kN) single axle truck
- 80 psi (550 kPa) tire pressure • ruts - maximum of 2 in to 4 in. (50 to 100 mm)
REQUIRED Design the roadway section. Consider: 1) design without a geogrid; and, 2) alternate with geogrid. DEFINE A. Geogrid function(s): B. Geogrid properties required: C. Geogrid specification: D: Separation requirements: SOLUTION A. Geogrid function(s): Primary - reinforcement Secondary - separation B. Geogrid properties required: survivability Aperture opening size DESIGN Design roadway with and without geogrid inclusion. Compare options. STEP 1. DETERMINE SOIL SUBGRADE STRENGTH given - CBR ≈ 1
Assume that CBR ≈ 1 is taken from area(s) where the subgrade appears to be the weakest. STEP 2. DETERMINE WHEEL LOADING given - 20,000 lbf (90 kN) single-axle truck, with 80 psi (550 kPa) tire pressure - therefore, 10,000 lbf (45 kN) single wheel load
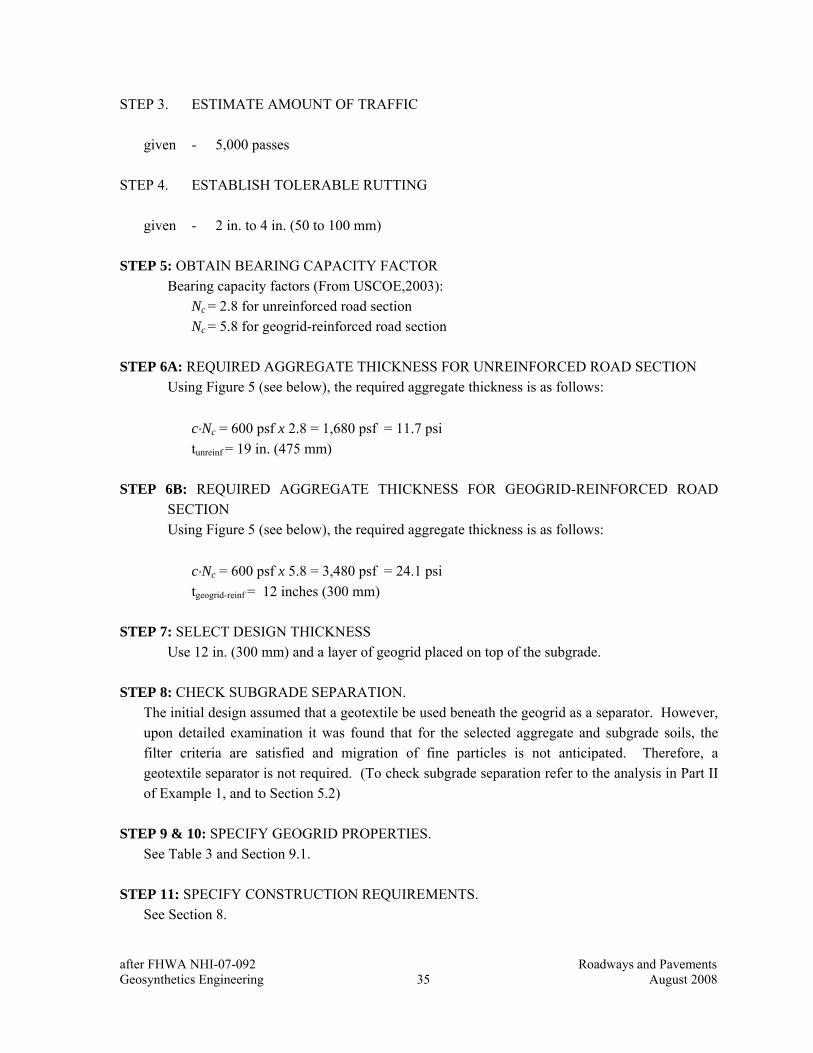
after FHWA NHI-07-092 Roadways and Pavements Geosynthetics Engineering 35 August 2008
STEP 3. ESTIMATE AMOUNT OF TRAFFIC given - 5,000 passes STEP 4. ESTABLISH TOLERABLE RUTTING given - 2 in. to 4 in. (50 to 100 mm) STEP 5: OBTAIN BEARING CAPACITY FACTOR
Bearing capacity factors (From USCOE,2003): Nc = 2.8 for unreinforced road section Nc = 5.8 for geogrid-reinforced road section
STEP 6A: REQUIRED AGGREGATE THICKNESS FOR UNREINFORCED ROAD SECTION
Using Figure 5 (see below), the required aggregate thickness is as follows: c⋅Nc = 600 psf x 2.8 = 1,680 psf = 11.7 psi tunreinf = 19 in. (475 mm)
STEP 6B: REQUIRED AGGREGATE THICKNESS FOR GEOGRID-REINFORCED ROAD
SECTION Using Figure 5 (see below), the required aggregate thickness is as follows: c⋅Nc = 600 psf x 5.8 = 3,480 psf = 24.1 psi tgeogrid-reinf = 12 inches (300 mm)
STEP 7: SELECT DESIGN THICKNESS Use 12 in. (300 mm) and a layer of geogrid placed on top of the subgrade.
STEP 8: CHECK SUBGRADE SEPARATION.
The initial design assumed that a geotextile be used beneath the geogrid as a separator. However, upon detailed examination it was found that for the selected aggregate and subgrade soils, the filter criteria are satisfied and migration of fine particles is not anticipated. Therefore, a geotextile separator is not required. (To check subgrade separation refer to the analysis in Part II of Example 1, and to Section 5.2)
STEP 9 & 10: SPECIFY GEOGRID PROPERTIES.
See Table 3 and Section 9.1.
STEP 11: SPECIFY CONSTRUCTION REQUIREMENTS. See Section 8.
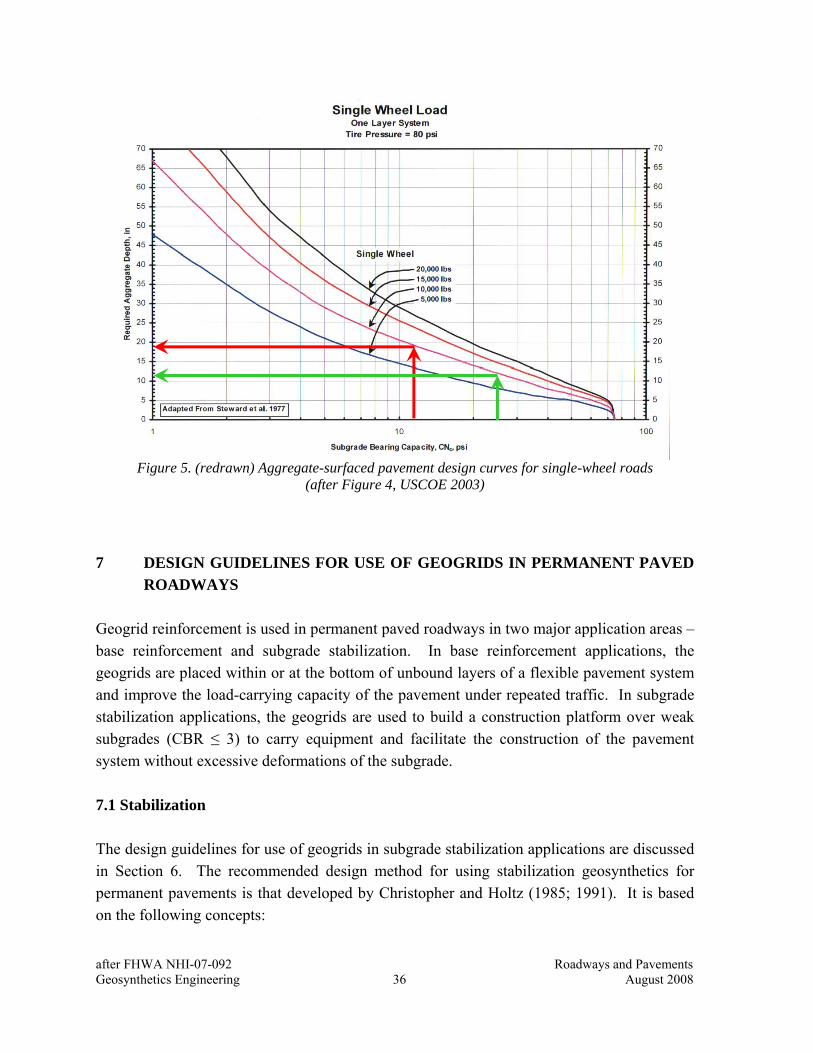
after FHWA NHI-07-092 Roadways and Pavements Geosynthetics Engineering 36 August 2008
Figure 5. (redrawn) Aggregate-surfaced pavement design curves for single-wheel roads (after Figure 4, USCOE 2003)
7 DESIGN GUIDELINES FOR USE OF GEOGRIDS IN PERMANENT PAVED
ROADWAYS Geogrid reinforcement is used in permanent paved roadways in two major application areas – base reinforcement and subgrade stabilization. In base reinforcement applications, the geogrids are placed within or at the bottom of unbound layers of a flexible pavement system and improve the load-carrying capacity of the pavement under repeated traffic. In subgrade stabilization applications, the geogrids are used to build a construction platform over weak subgrades (CBR ≤ 3) to carry equipment and facilitate the construction of the pavement system without excessive deformations of the subgrade. 7.1 Stabilization The design guidelines for use of geogrids in subgrade stabilization applications are discussed in Section 6. The recommended design method for using stabilization geosynthetics for permanent pavements is that developed by Christopher and Holtz (1985; 1991). It is based on the following concepts:
after FHWA NHI-07-092 Roadways and Pavements Geosynthetics Engineering 37 August 2008
1. Standard methods are used to design the pavement system (i.e., AASHTO, CBR, R-value, resilient modulus, etc.).
2. The geosynthetic is assumed to provide no structural support, therefore, no reduction is allowed in aggregate thickness required for structural support.
3. Aggregate savings is achieved through a reduction in the stabilization aggregate required for construction and possibly through improved subgrade conditions.
4. The recommended method is used to design the first construction lift, which is called the stabilization lift since it sufficiently stabilizes the subgrade to allow access by normal construction equipment.
5. Once the stabilizer lift is completed, construction proceeds using the stabilized lift as the roadbed surface layer.
The conventional design method assumes that the stabilizer lift is an unpaved road which will be exposed to relatively few vehicle passes (i.e., construction equipment only) and which can tolerate 2 in to 3 in. (50 to 75 mm) of rutting under the equipment loads. A key feature of this method is the assumption that the structural pavement design is not modified at all in the procedure. The pavement design proceeds exactly according to standard procedures as if the geogrid was not present. The geosynthetic instead replaces additional unbound material that might be placed to support construction operations, and replaces no part of the pavement section itself. However, this unbound layer will provide some additional support. If the soil has a CBR of less than 3 and the aggregate thickness is determined based on a low rutting criteria in the following steps (i.e., rutting < 2 in. {50 mm} using an Nc = 5.0), the support for the composite system is theoretically equivalent to a CBR = 3 (resilient modulus ≈ 4500 psi {30 MPa}). The equivalent CBR = 3 is based on a conservative soil strength value in Figures 5, 6 and 7, where low rutting would be anticipated with a geogrid and no gravel. As with thick aggregate fill used for stabilization, the support value should be confirmed though field testing using for example, a plate load test or FWD to verify that a minimum composite subgrade modulus has been achieved. Note that the FHWA procedure is controlled by soil CBR as measured using ASTM D 4429 “Bearing Ratio of Soils In-Place,” which should be performed on the wettest, weakest soil condition anticipated during construction, or a saturated soaked laboratory CBR test (ASTM D1883) for predicting the performance of soils that will likely be wet during construction.
after FHWA NHI-07-092 Roadways and Pavements Geosynthetics Engineering 38 August 2008
7.2 Base Reinforcement The current design practice and the recent developments for the use of geogrids in base reinforcement applications are discussed in this section (Holtz et al., 1998; Berg et al., 2000; AASHTO, 2001; Perkins et al., 2005a; Gabr et al., 2006). The state of practice for design of geogrid-reinforced base courses in flexible pavements is in accordance with the AASHTO Guide for Design of Pavement Structures (1993 or earlier editions) and the AASHTO Provisional Standard PP 46-01 “Recommended Practice for Geosynthetic Reinforcement of the Aggregate Base Course of Flexible Pavement Structures” (2001). The AASHTO (1993) method, and its regional adaptations, is widely used by pavement designers in various public agencies and private companies. It is empirically-based and models the flexible pavement as a series of layers which have a combined structural capacity to carry a certain number of traffic loads (ESAL’s) with pre-determined minimum levels of serviceability and statistical confidence. Based on the AASHTO, 1993 design guide, the overall structural contribution of geosynthetic reinforcement is considered in the design through either of the following factors that are derived from empirical product-specific data: − Traffic Benefit Ratio (TBR) – the ratio of the number of load applications necessary to
reach a specific failure state in a geosynthetic-reinforced pavement to the number of load applications required to reach the same failure state in an unreinforced section (i.e., the same pavement section but without reinforcement).
− Base Course Reduction Factor (BCR) – the percent reduction in the thickness of base or subbase material in a reinforced pavement compared to an unreinforced one, given that the trafficking capacity for a defined failure state remains the same.
To assess and characterize the appropriate TBR or BCR values, the user is advised to refer to product-specific studies and test sections that demonstrate the value added by the geosynthetic reinforcement in pavement structures. The base course reinforcement specifications established by the Federal Aviation Administration (FAA, 1994) recommend evaluation of alternative materials based on full-scale trials, independent certified test results for performance based geogrid properties, and successful performance demonstrated in projects of comparable size and application, and verified after a minimum of one year of service life. As discussed earlier, the lack of such data often limits the use of geogrid reinforcement in flexible pavements. A major initiative in the area of pavement design was the AASHTO decision to develop and subsequently adopt a mechanistic-empirical (M-E) method for design of pavement systems. The initiative was conceived in the early 1990’s and led by AASHTO committees with the

after FHWA NHI-07-092 Roadways and Pavements Geosynthetics Engineering 39 August 2008
help of research institutions. While the M-E Pavement Design Guide (MEPDG) has recently been officially adopted by AASHTO (2008), some work is still ongoing (NCHRP, 2008). In the original scope of the M-E Design Guide, geosynthetics materials have not been included but the opportunity to utilize the M-E concept to rationalize the design has been recognized by the geosynthetics community. A series of research projects designed to define and quantify the benefits of geosynthetics within the M-E design framework had been initiated and the results to date are promising (Perkins et al., 2004; Perkins et al., 2005b; Kwon et al., 2005; Al-Qadi et al., 2007; Al-Qadi et al., 2008). The AASHTO PP 46-01 guidelines for use of geosynthetic reinforcement in aggregate base courses of flexible pavements, and the recent developments based on the M-E concept are presented in the subsequent section. 7-3 Empirical Design Method from AASHTO PP 46-01 (2001) AASHTO PP 46-01 (2001) provides guidelines for design of geogrid-reinforced base courses in flexible pavements. The guidelines are empirical in nature and the design steps follow a procedure that was initially reported by Berg et al. (2000). In the AASHTO, 1993 Guide, pavement design is based on a reference to the serviceability of the pavement system expressed through measurements of roughness and different types of distress (cracking, rutting, etc.). The load carrying capacity of a pavement is expressed with the number of equivalent standard axial loads (ESALs) at which the permanent deformation at the surface reaches specific value (allowable rut depth). The number of equivalent standard axial loads (ESALs) is calculated using the AASHTO, 1993 equation shown below.
(2)
Where:
W18 = Allowable trafficking (ESAL’s) ZR = Standard Normal Deviate; based on Table 4.1 in Part I of the AASHTO
(1993) guidelines, for a Reliability of 95%, the Standard Normal Deviate, ZR = -1.282.
So = Standard Deviation = 0.49 SN = Structural Number ΔPSI = Change in present Serviceability Index MR = Resilient Modulus of subgrade or base being considered (psi)
07.8log32.2
)1(109440.0
5.12.4log
20.0)1(log36.9)(log 10
19.5
10
101810 −+
++
⎥⎦⎤
⎢⎣⎡
−Δ
+−++= RoR M
SN
PSI
SNSZW
after FHWA NHI-07-092 Roadways and Pavements Geosynthetics Engineering 40 August 2008
Using Equation 2, the Traffic Benefit Ratio (TBR) can be applied directly to the calculated number of ESALs or can be used to adjust the structural number. The Base Course Reduction Factor (BCR) is used to directly reduce the required thickness of the unreinforced base course. It is recommended that agencies with limited experience with geosynthetic reinforcement primarily use the reinforcement to improve the service life of pavement structures, and limit reduction of the structural section until more experience is gained (Berg et al., 2000). Design Procedure The design steps for use of geosynthetic base reinforcement for flexible pavements are outlined below. For details refer to Berg et al. (2000). Step 1: Initial assessment of geosynthetic applicability
Requires assessment of: subgrade strength, aggregate thickness required for unreinforced section, characteristic of base/subbase materials, seasonal variation in moisture levels, reinforcing mechanisms and value added by geosynthetics.
Step 2: Design of unreinforced pavement section
Using an established method for design of unreinforced pavements, the structural layers, the type of material, and the thicknesses are determined for a pavement section without geosynthetics.
Step 3: Investigate potential benefits of using geosynthetics reinforcement
Requires review of available data to define potential and target benefits for the specific project. The conditions for which various geosynthetic products should be considered for this application are summarized in Table 5.
Step 4: Define reinforcement benefits in terms of Traffic Benefit Ratio (TBR) or Base Course
Reduction Factor (BCR) Requires review of successful applications, field studies, and lab test results.
Step 5: Design of reinforced pavement section
The use of the Traffic Benefit Ratio (TBR) for design of reinforced pavement section based on AASHTO, 1993 Guide is illustrated in the design example, Section 7-5.
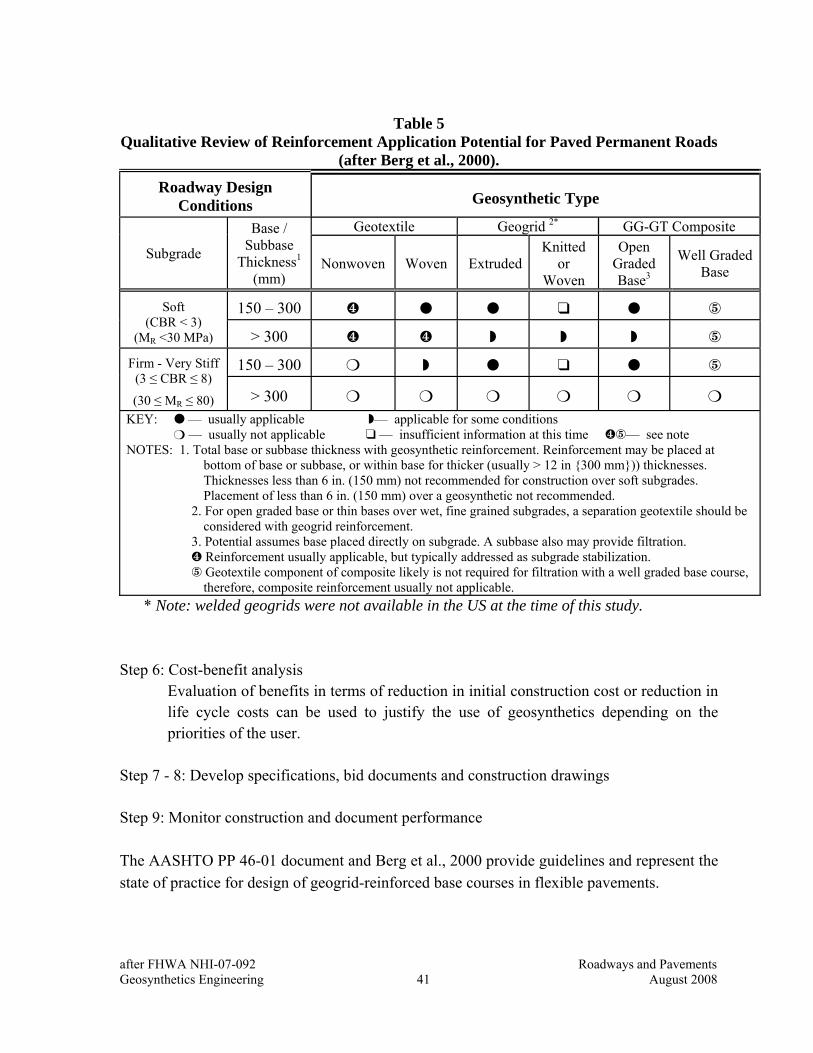
after FHWA NHI-07-092 Roadways and Pavements Geosynthetics Engineering 41 August 2008
Table 5
Qualitative Review of Reinforcement Application Potential for Paved Permanent Roads (after Berg et al., 2000).
Roadway Design Conditions Geosynthetic Type
Subgrade
Base / Subbase
Thickness1 (mm)
Geotextile Geogrid 2* GG-GT Composite
Nonwoven Woven Extruded Knitted
or Woven
Open Graded Base3
Well Graded Base
Soft (CBR < 3)
(MR <30 MPa)
150 – 300 Û “ Ò
> 300 Û Û ™ ™ ™ Ò Firm - Very Stiff
(3 ≤ CBR ≤ 8)
(30 ≤ MR ≤ 80)
150 – 300 ™ “ Ò
> 300
KEY: — usually applicable ™— applicable for some conditions — usually not applicable “ — insufficient information at this time ÛÒ— see note
NOTES: 1. Total base or subbase thickness with geosynthetic reinforcement. Reinforcement may be placed at bottom of base or subbase, or within base for thicker (usually > 12 in {300 mm})) thicknesses. Thicknesses less than 6 in. (150 mm) not recommended for construction over soft subgrades. Placement of less than 6 in. (150 mm) over a geosynthetic not recommended.
2. For open graded base or thin bases over wet, fine grained subgrades, a separation geotextile should be considered with geogrid reinforcement.
3. Potential assumes base placed directly on subgrade. A subbase also may provide filtration. Û Reinforcement usually applicable, but typically addressed as subgrade stabilization. Ò Geotextile component of composite likely is not required for filtration with a well graded base course,
therefore, composite reinforcement usually not applicable.
* Note: welded geogrids were not available in the US at the time of this study.
Step 6: Cost-benefit analysis Evaluation of benefits in terms of reduction in initial construction cost or reduction in life cycle costs can be used to justify the use of geosynthetics depending on the priorities of the user.
Step 7 - 8: Develop specifications, bid documents and construction drawings
Step 9: Monitor construction and document performance The AASHTO PP 46-01 document and Berg et al., 2000 provide guidelines and represent the state of practice for design of geogrid-reinforced base courses in flexible pavements.
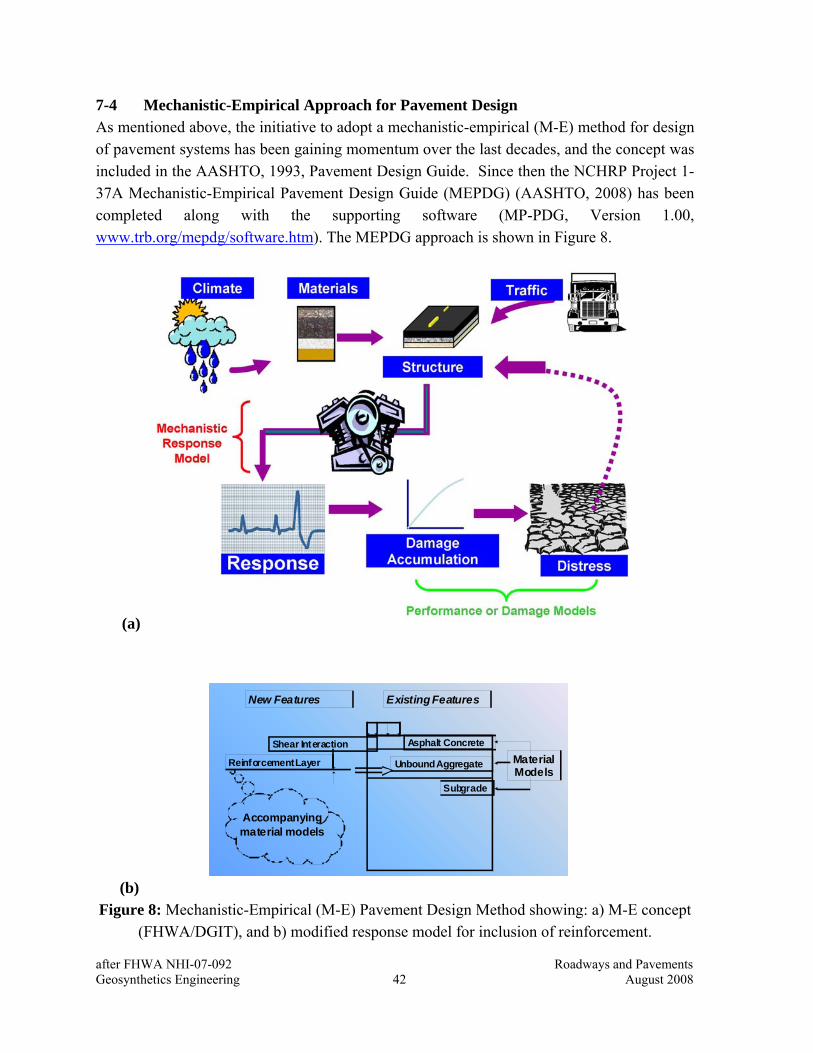
after FHWA NHI-07-092 Roadways and Pavements Geosynthetics Engineering 42 August 2008
7-4 Mechanistic-Empirical Approach for Pavement Design As mentioned above, the initiative to adopt a mechanistic-empirical (M-E) method for design of pavement systems has been gaining momentum over the last decades, and the concept was included in the AASHTO, 1993, Pavement Design Guide. Since then the NCHRP Project 1-37A Mechanistic-Empirical Pavement Design Guide (MEPDG) (AASHTO, 2008) has been completed along with the supporting software (MP-PDG, Version 1.00, www.trb.org/mepdg/software.htm). The MEPDG approach is shown in Figure 8.
(a) (b) Figure 8: Mechanistic-Empirical (M-E) Pavement Design Method showing: a) M-E concept
(FHWA/DGIT), and b) modified response model for inclusion of reinforcement.
Accompanying material models
Asphalt Concrete
Unbound Aggregate
Subgrade
Material Models
Reinforcement Layer
Shear Interaction
New Features Existing Features

after FHWA NHI-07-092 Roadways and Pavements Geosynthetics Engineering 43 August 2008
The major steps of the MEPDG are (AASHTO, 2008):
− Selection of pavement structure (layers, type of materials, thicknesses);
− Characterization of climate, traffic, and materials for the specific project location;
− Analysis of the mechanistic model of the pavement structure
− Calculation of critical responses (stresses, strains)
− Evaluation of the accumulated damage and associated distress with reference to preset criteria.
− The design may require several iterations considering different pavement structures. Design is completed when for a specific section the distress levels do not exceed the acceptable levels for the design life of the structure.
Important components of the MEPDG method are (1) a mechanistic model to calculate the critical responses of the system, and (2) empirical performance or damage models that relate the critical responses to the accumulated damage and distress levels. The development of a mechanistic response model based on the finite element method that account for the influence of reinforcement on the surrounding base aggregate has been the focus of several studies. Recently FHWA sponsored a study at Montana State University in cooperation with the Finnish, Norwegian and Swedish National Road Administrations to develop an interface for including geosynthetic base reinforcement in mechanistic empirical design, consistent with the MEPDG model (Perkins et al., 2004). The mechanistic model developed from this study consists of a compaction module and three subsequent trafficking response modules to describe the effect of geogrid reinforcement during the initial construction operations and in-service traffic loading. An empirical damage model was first developed for the permanent deformation accumulation of the unbound aggregate layer within a zone influenced by the geogrid reinforcement. The compaction module treated the developed lateral stress due to geogrid reinforcement as the stress developed in the presence of the permanent interface shear stress (Perkins and Svano, 2004). Then, the finite element response models were utilized at several damage steps to account for the effect of increasing lateral confinement with increasing traffic load repetitions. The combined use of these response models with the empirical damage model resulted in a rational method for showing the benefit of geogrid reinforcement and evaluating the performance of reinforced pavements. Important feature of the developed mechanistic model is that it has been partially calibrated using available full scale test data and is based on laboratory test methods that are under development by ASTM (Perkins et al., 2005).
after FHWA NHI-07-092 Roadways and Pavements Geosynthetics Engineering 44 August 2008
Another mechanistic response model that accounts for the confinement effects in geogrid-reinforced flexible pavements was developed by a research team at the University of Illinois (Kwon et al., 2005 and 2007, Al-Qadi et al., 2008). The effects of interlock between the aggregate and geogrid were simulated by considering locked-in horizontal residual stresses in the granular base as initial stresses in the pavement response analysis. Increased confinement resulted in this stiffening effect above and below the geogrid reinforcement and the predicted modulus values were shown to increase significantly especially around the geogrid. The developed mechanistic model can be used as main structural analysis model for mechanistic based design of base reinforcement as well as for FWD back calculation. The developed mechanistic model has been partially calibrated using available test data (Al-Qadi et al., 2007 and 2008). The distress models are the other major component of the M-E based solution and they relate the critical responses to the accumulated damage and distress levels. The development of distress models requires instrumented full-scale sections that are trafficked until failure. Perkins et al., (2005) reported that several research groups have conducted studies and significant progress has been made in some areas; however, the calibration of performance models requires significant investments in order to advance the implementation of the M-E design procedure in base course reinforcement applications. 7.5 Design Example for Geogrid Reinforced Paved Roadway DEFINITION OF DESIGN EXAMPLE • Project Description:
A 30-mile (48 km) section of a two-lane state highway is scheduled for reconstruction. The initial traffic estimates indicated 1,000,000 equivalent single axle loads (ESALs) over the 20 year performance period based on a 2% growth factor. The geotechnical evaluation indicates that the subgrade soil is low plastic clay (CL) with CBR= 4, Mr = 6000 psi (40 MPa). Due to budget constraints, high cost of local aggregate and environmental concerns, the owner is considering the use of geogrid reinforcement to either reduce the thickness of the base course or extend the performance period of the pavement structure. The type of application proposed for consideration is geogrid base reinforcement. A 1-mile (1.6 km) section is scheduled for reconstruction to help establish the design criteria for the future reconstruction of the entire roadway section.

after FHWA NHI-07-092 Roadways and Pavements Geosynthetics Engineering 45 August 2008
• Design Alternatives: (I) Unreinforced conventional roadway section with a 20 year design life
(II) Geogrid reinforcement in the base layer to extend the performance period. (III) Geogrid reinforcement in the base layer to reduce the initial cost of construction by
reducing the required base course thickness (20 year design life). REQUIRED Design of flexible pavement section for the three alternatives based on AASHTO, 1993 Design Guide and AASHTO PP 46-01 Standard of Practice, Geosynthetic Reinforcement of the Aggregate Base Course of Flexible Pavement Structures. DESIGN STEP 1. INITIAL ASSESSMENT OF BASE REINFORCEMENT APPLICABILITY.
A. In-situ strength of subgrade soil: Low plastic clay (CL)
CBR= 4, Mr = 6000 psi (40 MPa), moderate strength.
B. Typical thickness of unreinforced base course for local conditions. C. Estimated thickness of geogrid reinforced base course for comparable conditions.
D. Evaluation of separation and drainage conditions.
E. Upon detailed examination it was found that for aggregates from local sources and subgrade
soils, the filter criteria are satisfied and migration of fine particles is unlikely. Therefore, a geotextile separator is not required. (For subgrade separation design, refer to the analysis in Part II of Example 1 in Section 6-3 and to Section 5-2). For the local conditions and free draining aggregated base, the drainage coefficient is m = 1.2.
F. From Table 1 and Table 5, for a CBR of 4, extruded geogrid reinforcement is selected for this
application. STEP 2. DESIGN OF THE UNREINFORCED PAVEMENT SECTION – ALTERNATIVE I.
The unreinforced pavement design cross section will be evaluated using the equation from the AASHTO, 1993 design guide.
07.8log32.2
)1(109440.0
5.12.4log
20.0)1(log36.9)(log 10
19.5
10
101810 −+
++
⎥⎦⎤
⎢⎣⎡
−Δ
+−++= RoR M
SN
PSI
SNSZW
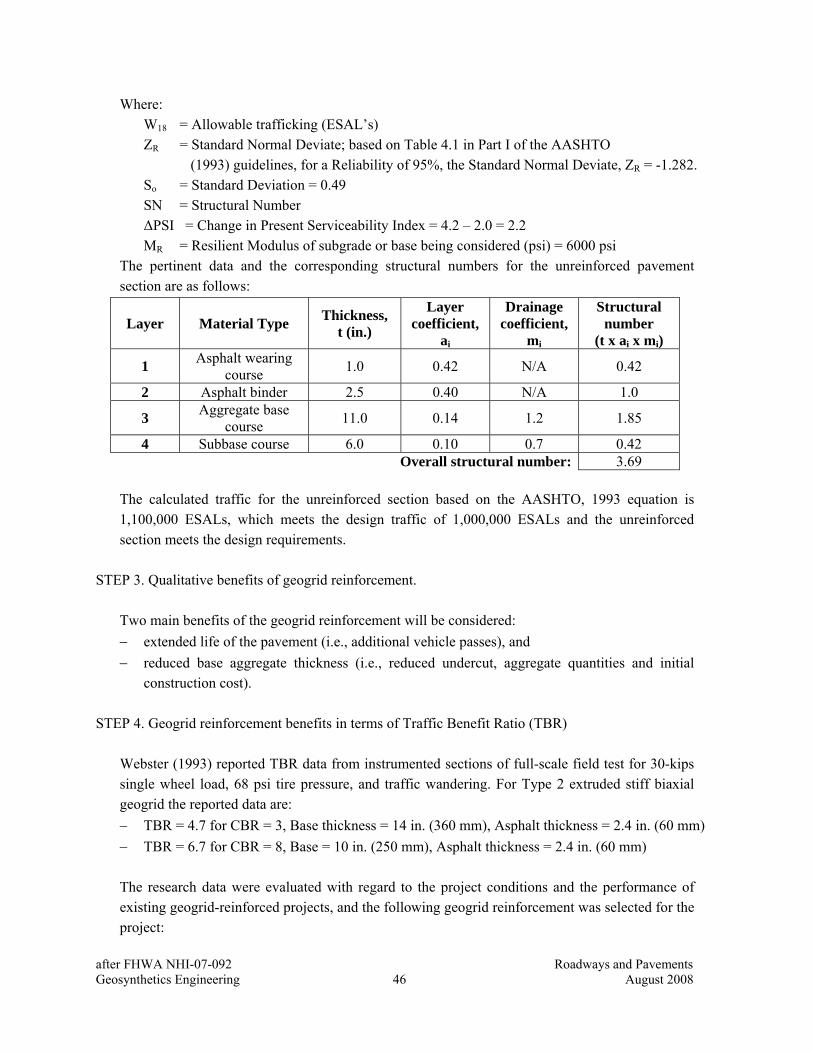
after FHWA NHI-07-092 Roadways and Pavements Geosynthetics Engineering 46 August 2008
Where: W18 = Allowable trafficking (ESAL’s) ZR = Standard Normal Deviate; based on Table 4.1 in Part I of the AASHTO
(1993) guidelines, for a Reliability of 95%, the Standard Normal Deviate, ZR = -1.282. So = Standard Deviation = 0.49 SN = Structural Number ΔPSI = Change in Present Serviceability Index = 4.2 – 2.0 = 2.2 MR = Resilient Modulus of subgrade or base being considered (psi) = 6000 psi
The pertinent data and the corresponding structural numbers for the unreinforced pavement section are as follows:
Layer Material Type Thickness, t (in.)
Layer coefficient,
ai
Drainage coefficient,
mi
Structural number
(t x ai x mi)
1 Asphalt wearing course 1.0 0.42 N/A 0.42
2 Asphalt binder 2.5 0.40 N/A 1.0
3 Aggregate base course 11.0 0.14 1.2 1.85
4 Subbase course 6.0 0.10 0.7 0.42 Overall structural number: 3.69
The calculated traffic for the unreinforced section based on the AASHTO, 1993 equation is 1,100,000 ESALs, which meets the design traffic of 1,000,000 ESALs and the unreinforced section meets the design requirements.
STEP 3. Qualitative benefits of geogrid reinforcement.
Two main benefits of the geogrid reinforcement will be considered: − extended life of the pavement (i.e., additional vehicle passes), and − reduced base aggregate thickness (i.e., reduced undercut, aggregate quantities and initial
construction cost).
STEP 4. Geogrid reinforcement benefits in terms of Traffic Benefit Ratio (TBR) Webster (1993) reported TBR data from instrumented sections of full-scale field test for 30-kips single wheel load, 68 psi tire pressure, and traffic wandering. For Type 2 extruded stiff biaxial geogrid the reported data are: − TBR = 4.7 for CBR = 3, Base thickness = 14 in. (360 mm), Asphalt thickness = 2.4 in. (60 mm) − TBR = 6.7 for CBR = 8, Base = 10 in. (250 mm), Asphalt thickness = 2.4 in. (60 mm) The research data were evaluated with regard to the project conditions and the performance of existing geogrid-reinforced projects, and the following geogrid reinforcement was selected for the project:
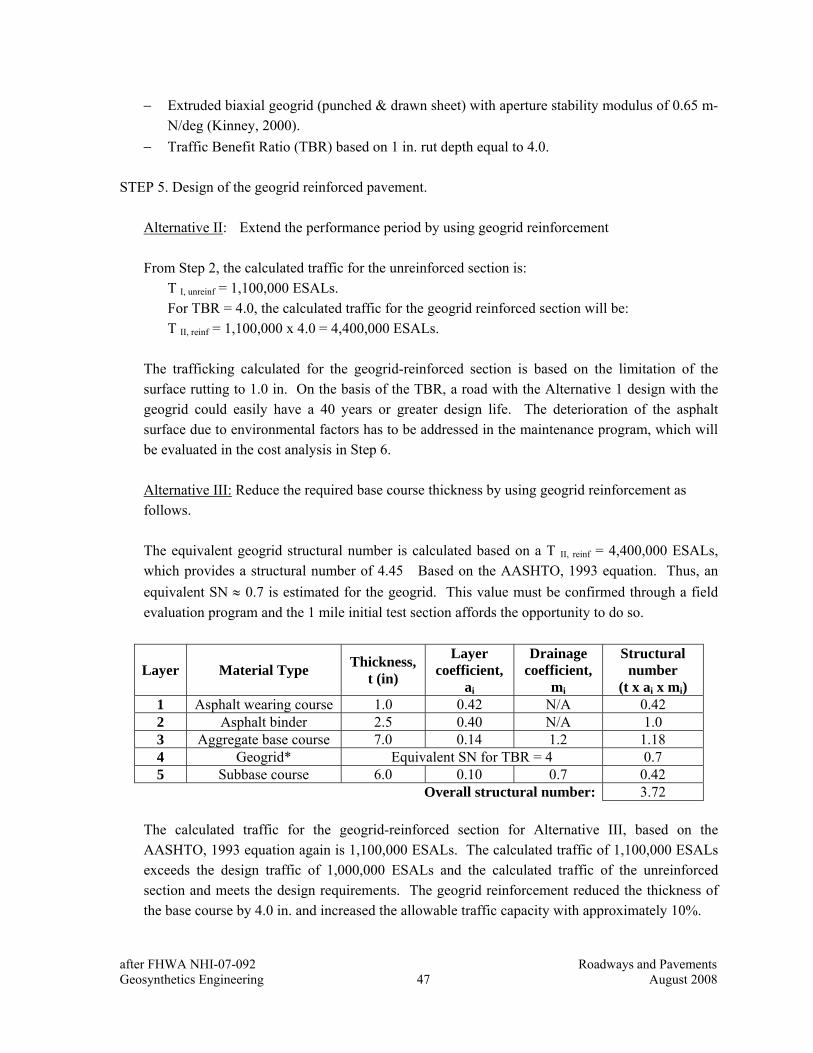
after FHWA NHI-07-092 Roadways and Pavements Geosynthetics Engineering 47 August 2008
− Extruded biaxial geogrid (punched & drawn sheet) with aperture stability modulus of 0.65 m-N/deg (Kinney, 2000).
− Traffic Benefit Ratio (TBR) based on 1 in. rut depth equal to 4.0. STEP 5. Design of the geogrid reinforced pavement.
Alternative II: Extend the performance period by using geogrid reinforcement From Step 2, the calculated traffic for the unreinforced section is: T I, unreinf = 1,100,000 ESALs.
For TBR = 4.0, the calculated traffic for the geogrid reinforced section will be: T II, reinf = 1,100,000 x 4.0 = 4,400,000 ESALs. The trafficking calculated for the geogrid-reinforced section is based on the limitation of the surface rutting to 1.0 in. On the basis of the TBR, a road with the Alternative 1 design with the geogrid could easily have a 40 years or greater design life. The deterioration of the asphalt surface due to environmental factors has to be addressed in the maintenance program, which will be evaluated in the cost analysis in Step 6.
Alternative III: Reduce the required base course thickness by using geogrid reinforcement as follows. The equivalent geogrid structural number is calculated based on a T II, reinf = 4,400,000 ESALs, which provides a structural number of 4.45 Based on the AASHTO, 1993 equation. Thus, an equivalent SN ≈ 0.7 is estimated for the geogrid. This value must be confirmed through a field evaluation program and the 1 mile initial test section affords the opportunity to do so.
Layer Material Type Thickness, t (in)
Layer coefficient,
ai
Drainage coefficient,
mi
Structural number
(t x ai x mi) 1 Asphalt wearing course 1.0 0.42 N/A 0.42 2 Asphalt binder 2.5 0.40 N/A 1.0 3 Aggregate base course 7.0 0.14 1.2 1.18 4 Geogrid* Equivalent SN for TBR = 4 0.7 5 Subbase course 6.0 0.10 0.7 0.42
Overall structural number: 3.72 The calculated traffic for the geogrid-reinforced section for Alternative III, based on the AASHTO, 1993 equation again is 1,100,000 ESALs. The calculated traffic of 1,100,000 ESALs exceeds the design traffic of 1,000,000 ESALs and the calculated traffic of the unreinforced section and meets the design requirements. The geogrid reinforcement reduced the thickness of the base course by 4.0 in. and increased the allowable traffic capacity with approximately 10%.

after FHWA NHI-07-092 Roadways and Pavements Geosynthetics Engineering 48 August 2008
STEP 6. Cost-Benefit Analysis.
INITIAL CONSTRUCTION COSTS
The comparison of the initial construction costs for Alternative I (unreinforced road) and Alternative II and III (geogrid-reinforced road) is done for the following cost of materials based on local sources:
Layer Material Type Cost* ($/ton)
Cost ($/cy)
1 Asphalt wearing course 55.00 107.70 2 Asphalt binder 55.00 107.70 3 Aggregate base course 22.00 35.60 4 Subbase course 12.00 21.80
5 Biaxial Geogrid (incl. installation cost) $4.25 /SY
* Average cost in 2008 from a Southeast DOT
Summary of initial construction costs for 1-mile of road for Alternatives I, II and III.
Expenses Alternative I: Unreinforced
Alternative II: Geogrid-reinforced
Alternative III: Geogrid-reinforced
Asphalt $260,400 $260,400 $260,400 Aggregate base $291,700 $291,700 $185,600
Subbase $69,500 $69,500 $69,500 Geogrid $0.0 $67,100 $67,100
Undercut/Fill $0.0 $0.0 $0.0 Total Costs $621,600 $688,700 $582,600 Unit Costs $42.40/SY $47.00/SY $39.70/SY
The analysis of the initial construction costs indicate that the geogrid-reinforced alternative (III) leads to overall savings of 6.4 % relative to the unreinforced one (I). LONG-TERM COSTS
The benefits of extended design life of Alternative II vs. Alternative I and III can be evaluated by life-cycle cost analyses for the unreinforced and reinforced pavement using the FHWA program RealCost available at:
http://www.fhwa.dot.gov/infrastructure/asstmgmt/lccasoft.cfm
or other software.
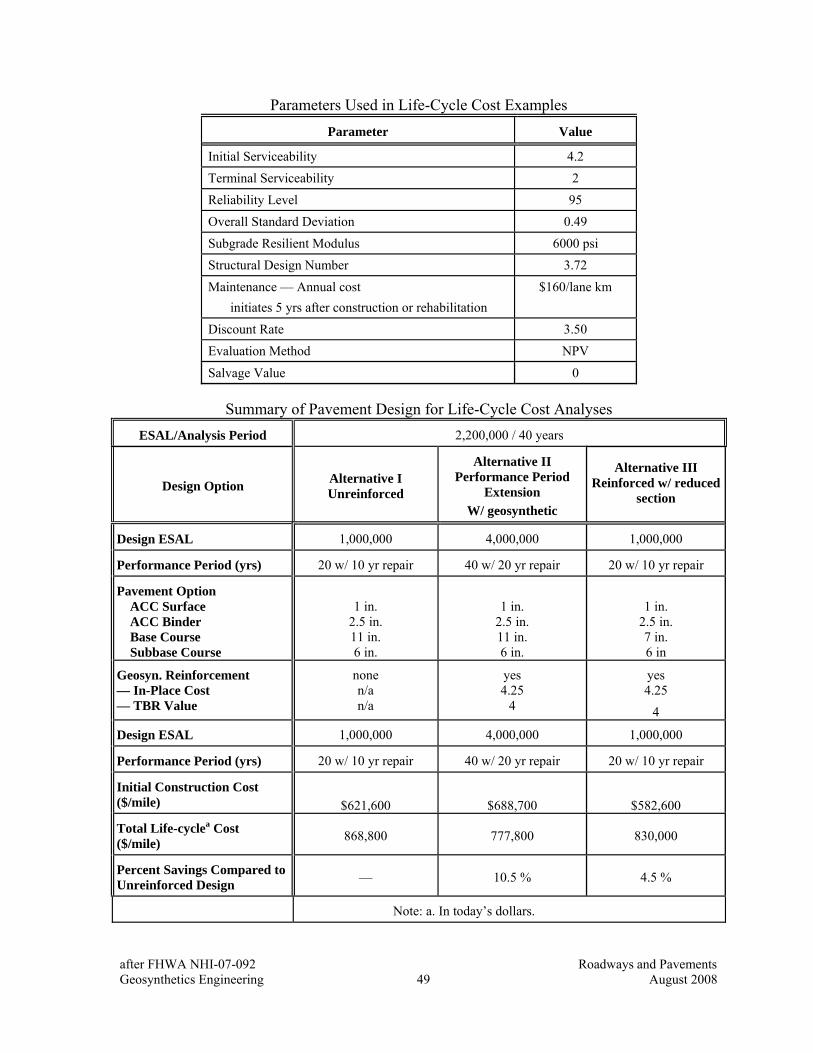
after FHWA NHI-07-092 Roadways and Pavements Geosynthetics Engineering 49 August 2008
Parameters Used in Life-Cycle Cost Examples Parameter Value
Initial Serviceability 4.2 Terminal Serviceability 2 Reliability Level 95 Overall Standard Deviation 0.49 Subgrade Resilient Modulus 6000 psi Structural Design Number 3.72 Maintenance — Annual cost
initiates 5 yrs after construction or rehabilitation $160/lane km
Discount Rate 3.50 Evaluation Method NPV
Salvage Value 0
Summary of Pavement Design for Life-Cycle Cost Analyses ESAL/Analysis Period 2,200,000 / 40 years
Design Option Alternative I Unreinforced
Alternative II Performance Period
Extension W/ geosynthetic
Alternative III Reinforced w/ reduced
section
Design ESAL 1,000,000 4,000,000 1,000,000
Performance Period (yrs) 20 w/ 10 yr repair 40 w/ 20 yr repair 20 w/ 10 yr repair
Pavement Option ACC Surface ACC Binder Base Course Subbase Course
1 in.
2.5 in. 11 in. 6 in.
1 in.
2.5 in. 11 in. 6 in.
1 in.
2.5 in. 7 in. 6 in
Geosyn. Reinforcement — In-Place Cost — TBR Value
none n/a n/a
yes 4.25
4
yes 4.25
4
Design ESAL 1,000,000 4,000,000 1,000,000
Performance Period (yrs) 20 w/ 10 yr repair 40 w/ 20 yr repair 20 w/ 10 yr repair
Initial Construction Cost ($/mile) $621,600 $688,700 $582,600
Total Life-cyclea Cost ($/mile) 868,800 777,800 830,000
Percent Savings Compared to Unreinforced Design — 10.5 % 4.5 %
Note: a. In today’s dollars.
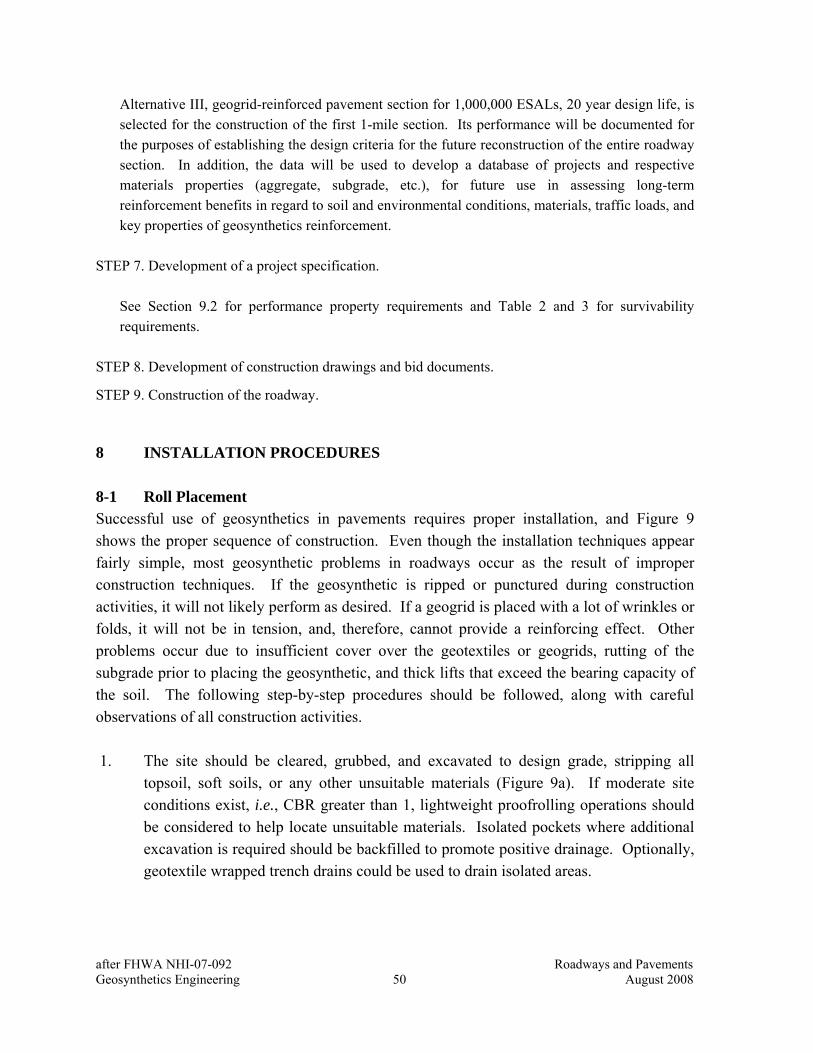
after FHWA NHI-07-092 Roadways and Pavements Geosynthetics Engineering 50 August 2008
Alternative III, geogrid-reinforced pavement section for 1,000,000 ESALs, 20 year design life, is selected for the construction of the first 1-mile section. Its performance will be documented for the purposes of establishing the design criteria for the future reconstruction of the entire roadway section. In addition, the data will be used to develop a database of projects and respective materials properties (aggregate, subgrade, etc.), for future use in assessing long-term reinforcement benefits in regard to soil and environmental conditions, materials, traffic loads, and key properties of geosynthetics reinforcement.
STEP 7. Development of a project specification. See Section 9.2 for performance property requirements and Table 2 and 3 for survivability
requirements. STEP 8. Development of construction drawings and bid documents.
STEP 9. Construction of the roadway. 8 INSTALLATION PROCEDURES 8-1 Roll Placement Successful use of geosynthetics in pavements requires proper installation, and Figure 9 shows the proper sequence of construction. Even though the installation techniques appear fairly simple, most geosynthetic problems in roadways occur as the result of improper construction techniques. If the geosynthetic is ripped or punctured during construction activities, it will not likely perform as desired. If a geogrid is placed with a lot of wrinkles or folds, it will not be in tension, and, therefore, cannot provide a reinforcing effect. Other problems occur due to insufficient cover over the geotextiles or geogrids, rutting of the subgrade prior to placing the geosynthetic, and thick lifts that exceed the bearing capacity of the soil. The following step-by-step procedures should be followed, along with careful observations of all construction activities. 1. The site should be cleared, grubbed, and excavated to design grade, stripping all
topsoil, soft soils, or any other unsuitable materials (Figure 9a). If moderate site conditions exist, i.e., CBR greater than 1, lightweight proofrolling operations should be considered to help locate unsuitable materials. Isolated pockets where additional excavation is required should be backfilled to promote positive drainage. Optionally, geotextile wrapped trench drains could be used to drain isolated areas.
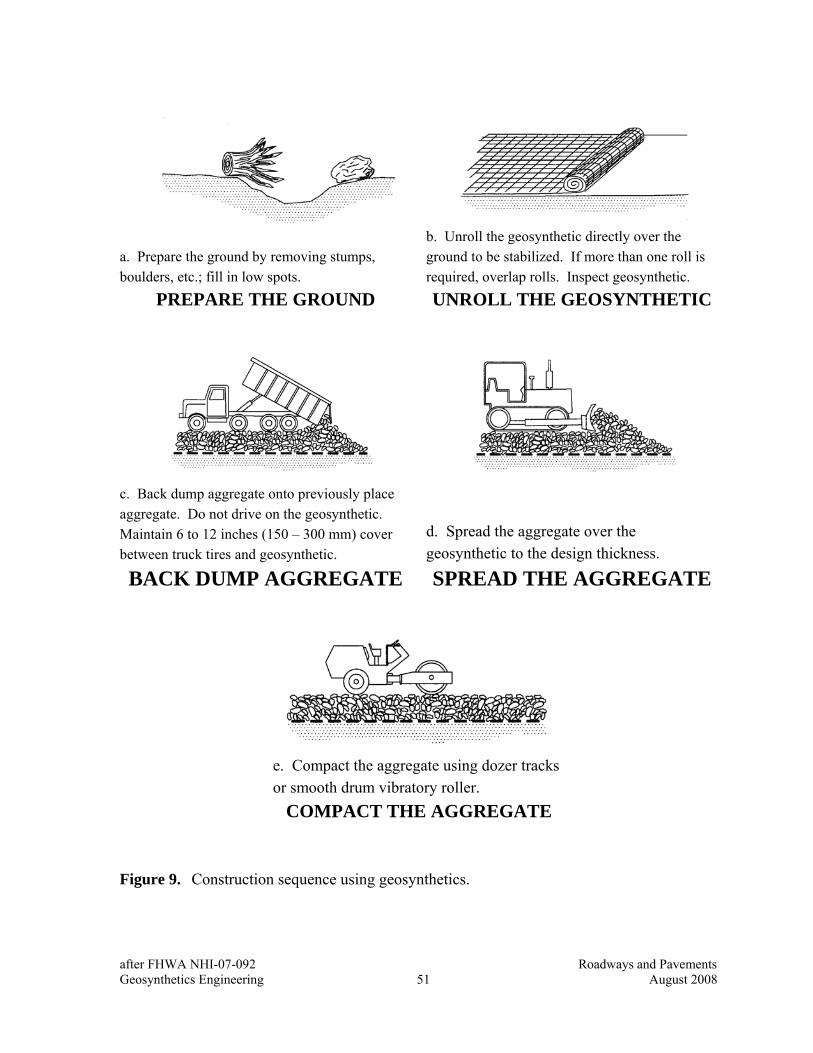
after FHWA NHI-07-092 Roadways and Pavements Geosynthetics Engineering 51 August 2008
a. Prepare the ground by removing stumps, boulders, etc.; fill in low spots.
b. Unroll the geosynthetic directly over the ground to be stabilized. If more than one roll is required, overlap rolls. Inspect geosynthetic.
PREPARE THE GROUND UNROLL THE GEOSYNTHETIC
c. Back dump aggregate onto previously place aggregate. Do not drive on the geosynthetic. Maintain 6 to 12 inches (150 – 300 mm) cover between truck tires and geosynthetic.
d. Spread the aggregate over the geosynthetic to the design thickness.
BACK DUMP AGGREGATE SPREAD THE AGGREGATE
e. Compact the aggregate using dozer tracks
or smooth drum vibratory roller.
COMPACT THE AGGREGATE Figure 9. Construction sequence using geosynthetics.
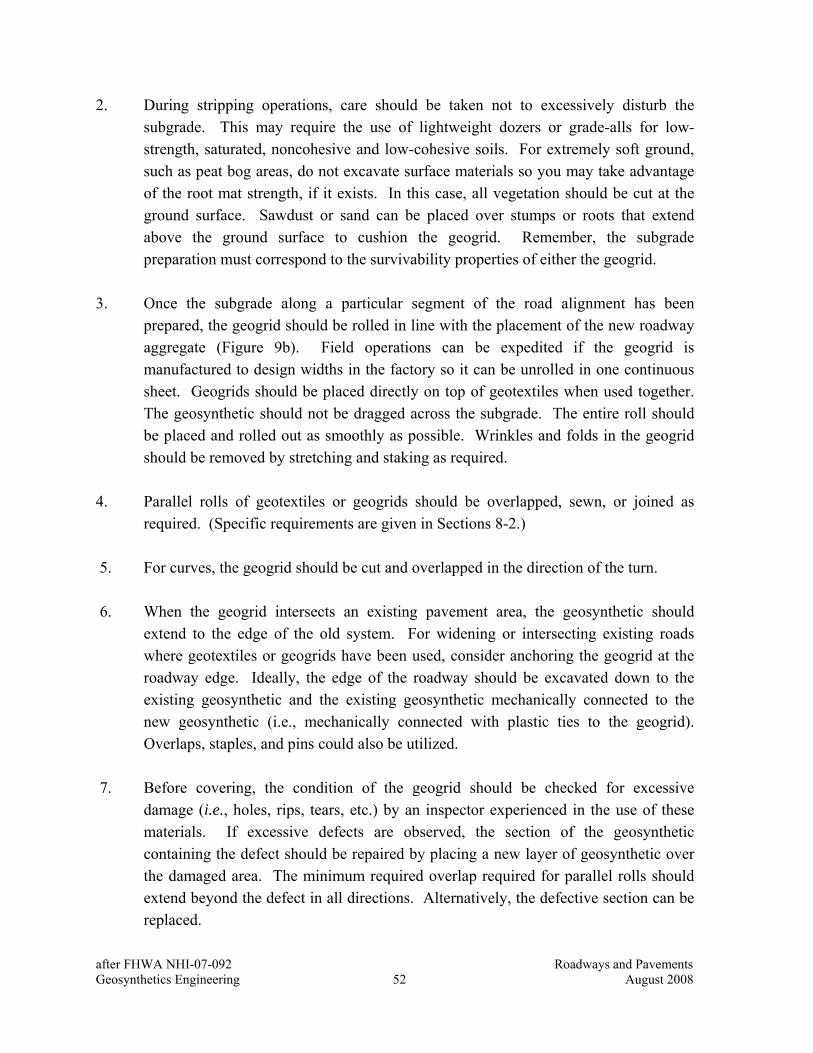
after FHWA NHI-07-092 Roadways and Pavements Geosynthetics Engineering 52 August 2008
2. During stripping operations, care should be taken not to excessively disturb the subgrade. This may require the use of lightweight dozers or grade-alls for low-strength, saturated, noncohesive and low-cohesive soils. For extremely soft ground, such as peat bog areas, do not excavate surface materials so you may take advantage of the root mat strength, if it exists. In this case, all vegetation should be cut at the ground surface. Sawdust or sand can be placed over stumps or roots that extend above the ground surface to cushion the geogrid. Remember, the subgrade preparation must correspond to the survivability properties of either the geogrid.
3. Once the subgrade along a particular segment of the road alignment has been
prepared, the geogrid should be rolled in line with the placement of the new roadway aggregate (Figure 9b). Field operations can be expedited if the geogrid is manufactured to design widths in the factory so it can be unrolled in one continuous sheet. Geogrids should be placed directly on top of geotextiles when used together. The geosynthetic should not be dragged across the subgrade. The entire roll should be placed and rolled out as smoothly as possible. Wrinkles and folds in the geogrid should be removed by stretching and staking as required.
4. Parallel rolls of geotextiles or geogrids should be overlapped, sewn, or joined as
required. (Specific requirements are given in Sections 8-2.) 5. For curves, the geogrid should be cut and overlapped in the direction of the turn. 6. When the geogrid intersects an existing pavement area, the geosynthetic should
extend to the edge of the old system. For widening or intersecting existing roads where geotextiles or geogrids have been used, consider anchoring the geogrid at the roadway edge. Ideally, the edge of the roadway should be excavated down to the existing geosynthetic and the existing geosynthetic mechanically connected to the new geosynthetic (i.e., mechanically connected with plastic ties to the geogrid). Overlaps, staples, and pins could also be utilized.
7. Before covering, the condition of the geogrid should be checked for excessive
damage (i.e., holes, rips, tears, etc.) by an inspector experienced in the use of these materials. If excessive defects are observed, the section of the geosynthetic containing the defect should be repaired by placing a new layer of geosynthetic over the damaged area. The minimum required overlap required for parallel rolls should extend beyond the defect in all directions. Alternatively, the defective section can be replaced.
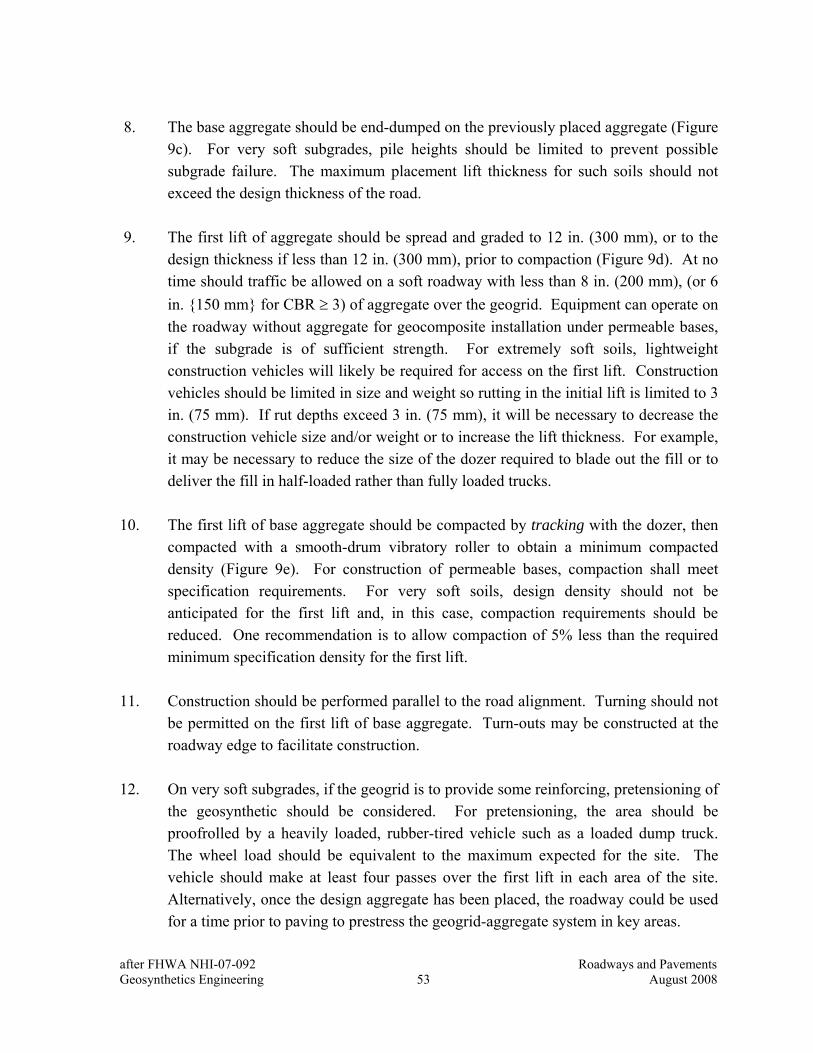
after FHWA NHI-07-092 Roadways and Pavements Geosynthetics Engineering 53 August 2008
8. The base aggregate should be end-dumped on the previously placed aggregate (Figure
9c). For very soft subgrades, pile heights should be limited to prevent possible subgrade failure. The maximum placement lift thickness for such soils should not exceed the design thickness of the road.
9. The first lift of aggregate should be spread and graded to 12 in. (300 mm), or to the
design thickness if less than 12 in. (300 mm), prior to compaction (Figure 9d). At no time should traffic be allowed on a soft roadway with less than 8 in. (200 mm), (or 6 in. {150 mm} for CBR ≥ 3) of aggregate over the geogrid. Equipment can operate on the roadway without aggregate for geocomposite installation under permeable bases, if the subgrade is of sufficient strength. For extremely soft soils, lightweight construction vehicles will likely be required for access on the first lift. Construction vehicles should be limited in size and weight so rutting in the initial lift is limited to 3 in. (75 mm). If rut depths exceed 3 in. (75 mm), it will be necessary to decrease the construction vehicle size and/or weight or to increase the lift thickness. For example, it may be necessary to reduce the size of the dozer required to blade out the fill or to deliver the fill in half-loaded rather than fully loaded trucks.
10. The first lift of base aggregate should be compacted by tracking with the dozer, then
compacted with a smooth-drum vibratory roller to obtain a minimum compacted density (Figure 9e). For construction of permeable bases, compaction shall meet specification requirements. For very soft soils, design density should not be anticipated for the first lift and, in this case, compaction requirements should be reduced. One recommendation is to allow compaction of 5% less than the required minimum specification density for the first lift.
11. Construction should be performed parallel to the road alignment. Turning should not
be permitted on the first lift of base aggregate. Turn-outs may be constructed at the roadway edge to facilitate construction.
12. On very soft subgrades, if the geogrid is to provide some reinforcing, pretensioning of
the geosynthetic should be considered. For pretensioning, the area should be proofrolled by a heavily loaded, rubber-tired vehicle such as a loaded dump truck. The wheel load should be equivalent to the maximum expected for the site. The vehicle should make at least four passes over the first lift in each area of the site. Alternatively, once the design aggregate has been placed, the roadway could be used for a time prior to paving to prestress the geogrid-aggregate system in key areas.
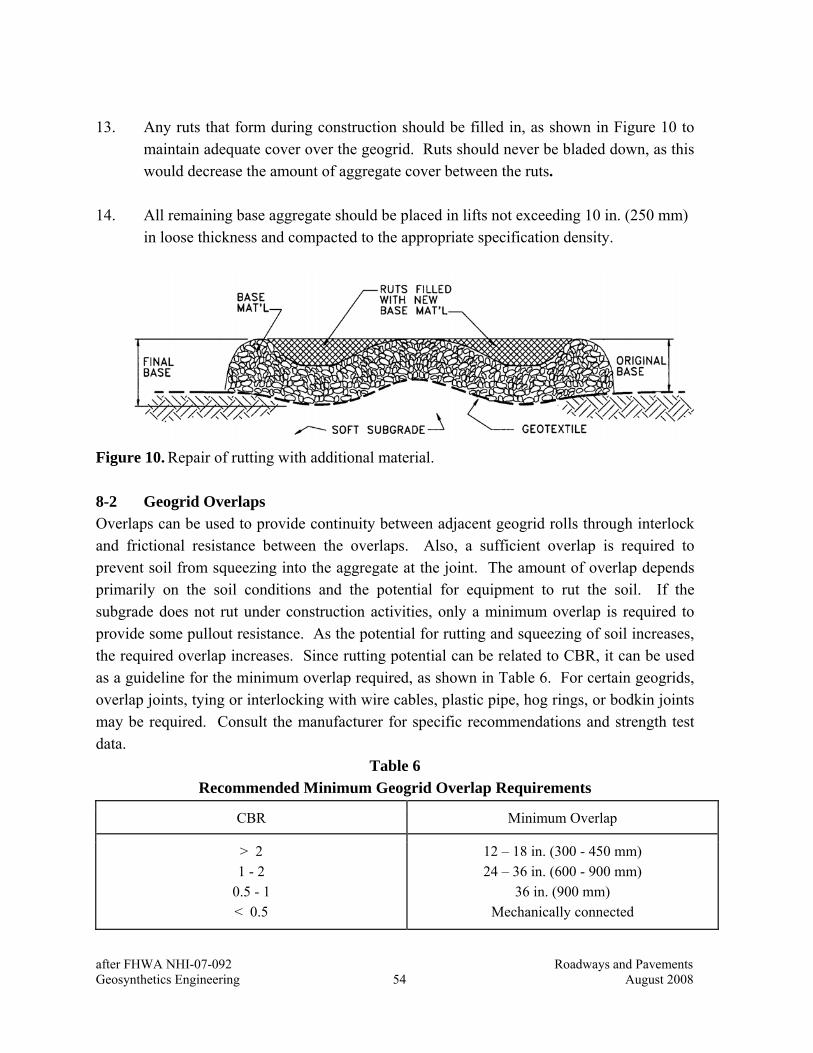
after FHWA NHI-07-092 Roadways and Pavements Geosynthetics Engineering 54 August 2008
13. Any ruts that form during construction should be filled in, as shown in Figure 10 to
maintain adequate cover over the geogrid. Ruts should never be bladed down, as this would decrease the amount of aggregate cover between the ruts.
14. All remaining base aggregate should be placed in lifts not exceeding 10 in. (250 mm)
in loose thickness and compacted to the appropriate specification density. Figure 10. Repair of rutting with additional material. 8-2 Geogrid Overlaps Overlaps can be used to provide continuity between adjacent geogrid rolls through interlock and frictional resistance between the overlaps. Also, a sufficient overlap is required to prevent soil from squeezing into the aggregate at the joint. The amount of overlap depends primarily on the soil conditions and the potential for equipment to rut the soil. If the subgrade does not rut under construction activities, only a minimum overlap is required to provide some pullout resistance. As the potential for rutting and squeezing of soil increases, the required overlap increases. Since rutting potential can be related to CBR, it can be used as a guideline for the minimum overlap required, as shown in Table 6. For certain geogrids, overlap joints, tying or interlocking with wire cables, plastic pipe, hog rings, or bodkin joints may be required. Consult the manufacturer for specific recommendations and strength test data.
Table 6 Recommended Minimum Geogrid Overlap Requirements
CBR Minimum Overlap
> 2 1 - 2
0.5 - 1 < 0.5
12 – 18 in. (300 - 450 mm) 24 – 36 in. (600 - 900 mm)
36 in. (900 mm) Mechanically connected
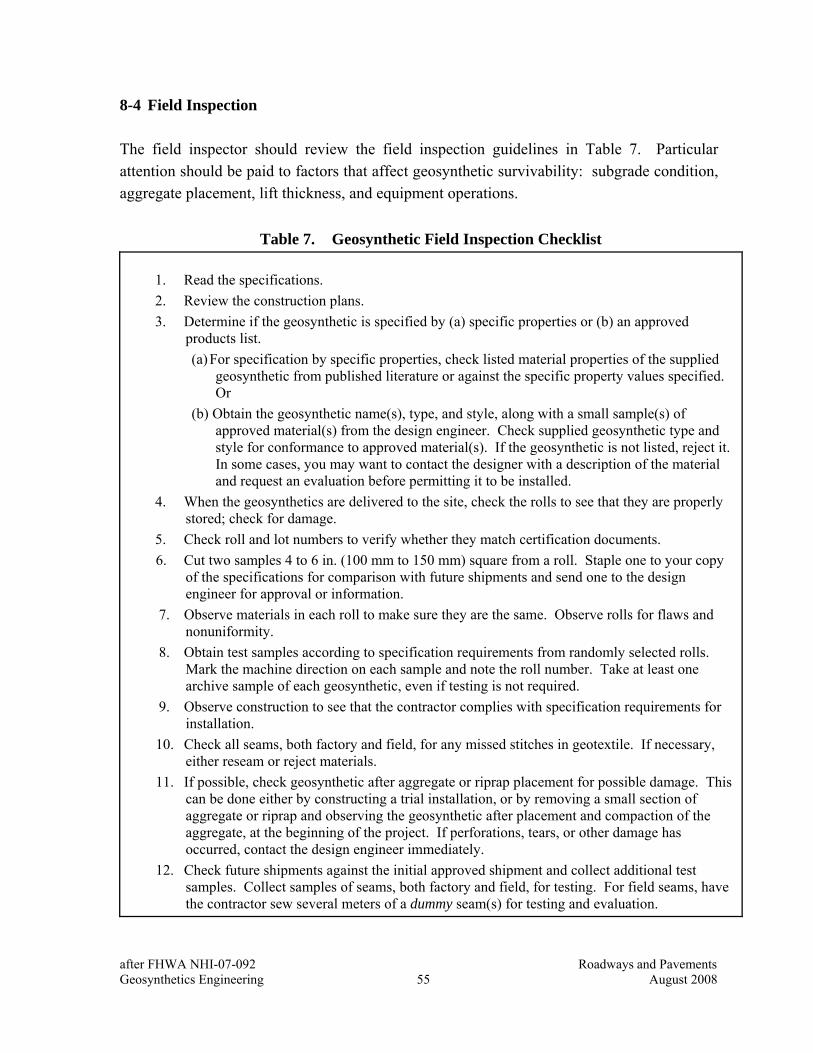
after FHWA NHI-07-092 Roadways and Pavements Geosynthetics Engineering 55 August 2008
8-4 Field Inspection The field inspector should review the field inspection guidelines in Table 7. Particular attention should be paid to factors that affect geosynthetic survivability: subgrade condition, aggregate placement, lift thickness, and equipment operations.
Table 7. Geosynthetic Field Inspection Checklist
1. Read the specifications. 2. Review the construction plans. 3. Determine if the geosynthetic is specified by (a) specific properties or (b) an approved
products list. (a) For specification by specific properties, check listed material properties of the supplied
geosynthetic from published literature or against the specific property values specified. Or
(b) Obtain the geosynthetic name(s), type, and style, along with a small sample(s) of approved material(s) from the design engineer. Check supplied geosynthetic type and style for conformance to approved material(s). If the geosynthetic is not listed, reject it. In some cases, you may want to contact the designer with a description of the material and request an evaluation before permitting it to be installed.
4. When the geosynthetics are delivered to the site, check the rolls to see that they are properly stored; check for damage.
5. Check roll and lot numbers to verify whether they match certification documents. 6. Cut two samples 4 to 6 in. (100 mm to 150 mm) square from a roll. Staple one to your copy
of the specifications for comparison with future shipments and send one to the design engineer for approval or information.
7. Observe materials in each roll to make sure they are the same. Observe rolls for flaws and nonuniformity.
8. Obtain test samples according to specification requirements from randomly selected rolls. Mark the machine direction on each sample and note the roll number. Take at least one archive sample of each geosynthetic, even if testing is not required.
9. Observe construction to see that the contractor complies with specification requirements for installation.
10. Check all seams, both factory and field, for any missed stitches in geotextile. If necessary, either reseam or reject materials.
11. If possible, check geosynthetic after aggregate or riprap placement for possible damage. This can be done either by constructing a trial installation, or by removing a small section of aggregate or riprap and observing the geosynthetic after placement and compaction of the aggregate, at the beginning of the project. If perforations, tears, or other damage has occurred, contact the design engineer immediately.
12. Check future shipments against the initial approved shipment and collect additional test samples. Collect samples of seams, both factory and field, for testing. For field seams, have the contractor sew several meters of a dummy seam(s) for testing and evaluation.
after FHWA NHI-07-092 Roadways and Pavements Geosynthetics Engineering 56 August 2008
9 SPECIFICATIONS Specifications should generally follow the guidelines in Section 3. The main considerations include the minimum geosynthetic requirements for design and those obtained from the survivability and separation (Sections 5-6), as well as the construction requirements covered in Section 8. As with other applications, it is very important that an engineer's representative be on site during placement to observe that the correct geosynthetic has been delivered, that the specified construction sequence is being followed in detail, and that no damage to the geogrid is occurring. Specifications are provided in this section for geotextiles in separation and stabilization applications, geogrids in stabilization applications and geosynthetics in base reinforcement applications. 9-1 Geogrids for Subgrade Stabilization AASHTO (i.e., AASHTO Provisional Standard PP 46-01, 2001) and the US Army Corp of Engineers (UFGS-02375) have established geogrid specification for base stabilization applications. The following specification was developed based on the attributes of these two specifications with modifications to conform to the definitions and design methods presented in this manual.
Standard Specification for
Geogrid Subgrade Stabilization of Pavement Structures for Highway Applications 1. SCOPE 1.1 This is a material specification covering the use of a geogrid between aggregate cover soil (e.g., subbase or construction platform) and soft subgrade soils (typically wet and saturated) to provide the coincident functions of separation by preventing aggregate intrusion into the subgrade and reinforcement of the aggregate layer to restrain subgrade movement (i.e., mechanical stabilization application). This is a material purchasing specification and design review of use is recommended.
1.2 The stabilization application is appropriate for subgrade soils which are saturated due to a high groundwater table or due to prolonged periods of wet weather. Stabilization is applicable to pavement structures constructed over soils with a CBR between one and three (1 < CBR <3) (shear strength between approximately 600 psf {30 kPa} and 2000 psf {90 kPa}). This specification is not appropriate for embankment reinforcement where stress conditions may cause global subgrade foundation or stability failure. Reinforcement of the pavement section is a site-specific design issue. 1.2 This is not a construction specification. This specification is based on required geogrid properties defined by subgrade stabilization design and by geogrid survivability from installation stresses.
after FHWA NHI-07-092 Roadways and Pavements Geosynthetics Engineering 57 August 2008
2. REFERENCED DOCUMENTS 2.1 ASTM Standards:1
ASTM D 4355 (2005) Deterioration of Geotextiles from Exposure to Light, Moisture and Heat in a Xenon-Arc Type Apparatus
ASTM D 4873 Identification, Storage, and Handling of Geosynthetic Rolls and Samples ASTM D 5818 Obtaining Samples of Geosynthetics from a Test Section for Assessment of
Installation Damage ASTM D 6637 Tensile Properties of Geogrids by the Single or Multi-Rib Tensile Method
2.2 GRI Standards:2 GSI GRI GG1 Geogrid Rib Tensile Strength GSI GRI GG2 Individual Geogrid Junction Strength GSI GRI GG4a Determination of the Long-Term Design Strength of Stiff Geogrids GSI GRI GG4b
Determination of the Long-Term Design Strength of Flexible Geogrids
GSI GRI GG6 Grip Types for Use in Wide Width Testing of Geotextiles and Geogrids 2.3 U.S. Army Corps of Engineers CW-00215 Test Method for Determining Percent Open Area
(Modified for Geogrids) 3. PHYSICAL REQUIREMENTS 3.1 Polymers used in the manufacture of geogrids shall consist of long-chain synthetic polymers, composed of at least 95 percent by weight of polyolefins, polyesters, or polyamides. They shall be formed into a stable network such that the ribs, filaments or yarns retain their dimensional stability relative to each other, including selvages. 3.2 Geogrids used for subgrade stabilization shall conform to the physical requirements of Section 7. 3.3 All property values, with the exception of the coefficient of interaction, coefficient of direct shear, and ultraviolet stability, in these specifications represent minimum average roll values (MARV) in the weakest principle direction (i.e., average test results of any roll in a lot sampled for conformance or quality assurance testing shall meet or exceed the minimum values provided herein). 4. CERTIFICATION AND SUBMITTAL 4.1 The contractor shall provide to the Engineer, a certificate stating the name of the manufacturer, product name, style number, chemical composition of the geogrid product and physical properties applicable to this specification.
1 Available from ASTM, 100 Barr Harbor Drive, West Conshohocken, PA 19428. 2 Available from Geosynthetic Research Institute, Drexel University, Philadelphia, PA.
after FHWA NHI-07-092 Roadways and Pavements Geosynthetics Engineering 58 August 2008
4.2 The Manufacturer is responsible for establishing and maintaining a quality control program to assure compliance with the requirements of the specification. Documentation describing the quality control program shall be made available upon request. 4.3 The Manufacturer’s certificate shall state that the furnished geogrid meets MARV requirements of the specification as evaluated under the Manufacturer’s quality control program. The certificate shall be attested to by a person having legal authority to bind the Manufacturer. 4.4 Either mislabeling or misrepresentation of materials shall be reason to reject those geogrids. 4.5 The contractor shall provide approximately ___ of the aggregate cover layer (e.g., subbase) for the agency to test.
Note: The approximate amounts of subbase required by test are: gradation 18 lb (8.0 kg) for 1.5 in. (38 mm) max size, 130 lb (60.0 kg) for 3 in, (75 mm) max size; proctor (6 in. {152 mm} diameter) 65 lb (29 kg); lab CBR 65 lb (29 kg); and moisture 11 lb (5 kg).
5. SAMPLING, TESTING, AND ACCEPTANCE 5.1 Geogrids shall be subject to sampling and testing to verify conformance with this specification. Sampling for testing shall be in accordance with ASTM D 4354. Acceptance shall be based on testing of either conformance samples obtained using Procedure A of ASTM D 4354, or based on manufacturer’s certifications and testing of quality assurance samples obtained using Procedure B of ASTM D 4354. A lot size for conformance or quality assurance sampling shall be considered to be the shipment quantity of the given product or a truckload of the given product, whichever is smaller. 5.2 Testing shall be performed in accordance with the methods referenced in this specification for the indicated application. The number of specimens to test per sample is specified by each test method. Geogrid product acceptance shall be based on ASTM D 4759. Product acceptance is determined by comparing the average test results of all specimens within a given sample to the specification MARV. Refer to ASTM D 4759 for more detail regarding geogrid acceptance procedures. 6. SHIPMENT AND STORAGE 6.1 Geogrids labeling, shipment, and storage shall follow ASTM D 4873. Product labels shall clearly show the manufacturer or supplier name, style name, and roll number. Each shipping document shall include a notation certifying that the material is in accordance with the manufacturer’s certificate. 6.2 During storage, geogrid rolls shall be elevated off the ground and adequately covered to protect them from the following: site construction damage, precipitation, extended ultraviolet radiation including sunlight, chemicals that are strong acids or strong bases, flames including welding sparks, temperatures in excess of 71EC (160EF), and any other environmental condition that may damage the physical property values of the geogrid.
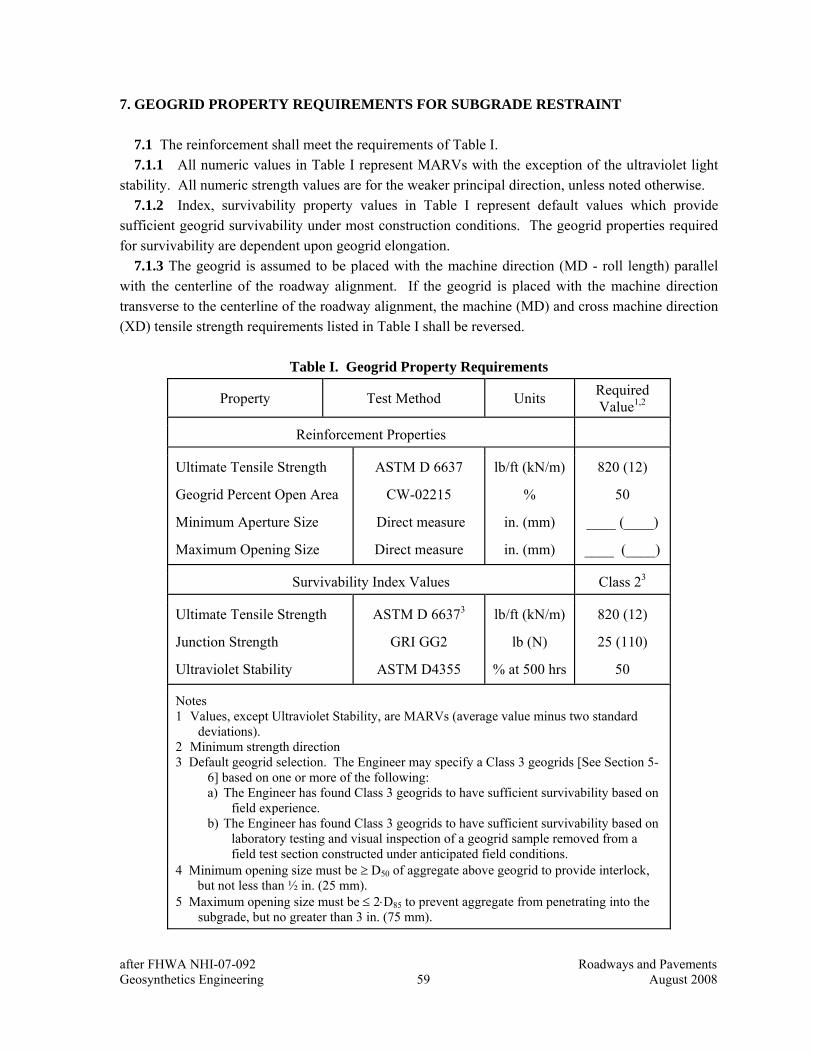
after FHWA NHI-07-092 Roadways and Pavements Geosynthetics Engineering 59 August 2008
7. GEOGRID PROPERTY REQUIREMENTS FOR SUBGRADE RESTRAINT 7.1 The reinforcement shall meet the requirements of Table I. 7.1.1 All numeric values in Table I represent MARVs with the exception of the ultraviolet light stability. All numeric strength values are for the weaker principal direction, unless noted otherwise. 7.1.2 Index, survivability property values in Table I represent default values which provide sufficient geogrid survivability under most construction conditions. The geogrid properties required for survivability are dependent upon geogrid elongation. 7.1.3 The geogrid is assumed to be placed with the machine direction (MD - roll length) parallel with the centerline of the roadway alignment. If the geogrid is placed with the machine direction transverse to the centerline of the roadway alignment, the machine (MD) and cross machine direction (XD) tensile strength requirements listed in Table I shall be reversed.
Table I. Geogrid Property Requirements
Property Test Method Units Required Value1,2
Reinforcement Properties
Ultimate Tensile Strength
Geogrid Percent Open Area
Minimum Aperture Size
Maximum Opening Size
ASTM D 6637
CW-02215
Direct measure
Direct measure
lb/ft (kN/m)
%
in. (mm)
in. (mm)
820 (12)
50
____ (____)
____ (____)
Survivability Index Values Class 23
Ultimate Tensile Strength
Junction Strength
Ultraviolet Stability
ASTM D 66373
GRI GG2
ASTM D4355
lb/ft (kN/m)
lb (N)
% at 500 hrs
820 (12)
25 (110)
50
Notes 1 Values, except Ultraviolet Stability, are MARVs (average value minus two standard
deviations). 2 Minimum strength direction 3 Default geogrid selection. The Engineer may specify a Class 3 geogrids [See Section 5-
6] based on one or more of the following: a) The Engineer has found Class 3 geogrids to have sufficient survivability based on
field experience. b) The Engineer has found Class 3 geogrids to have sufficient survivability based on
laboratory testing and visual inspection of a geogrid sample removed from a field test section constructed under anticipated field conditions.
4 Minimum opening size must be ≥ D50 of aggregate above geogrid to provide interlock, but not less than ½ in. (25 mm).
5 Maximum opening size must be ≤ 2⋅D85 to prevent aggregate from penetrating into the subgrade, but no greater than 3 in. (75 mm).
after FHWA NHI-07-092 Roadways and Pavements Geosynthetics Engineering 60 August 2008
9-2 Geosynthetics for Base Reinforcement of Pavement Structures Specifications for base reinforcement in pavement structures have also been established by AASHTO. A typical, generic type material specification for geosynthetic reinforcement for pavements will be difficult to develop because of: the proprietary nature (i.e., current product patents) of biaxial geogrids and some geocomposites; a lack of a thorough understanding of the mechanistic benefits of geosynthetic reinforcement; lack of performance documentation; and inability to measure contribution of geosynthetic reinforcement to pavement structure with non-destructive testing methods. A geosynthetic reinforcement specification should allow use of other geosynthetic products that either: (i) meet the physical properties defined by the key property requirements; or (ii) by demonstrating performance equivalency through full-scale laboratory testing, in-ground testing of pavements, and prior projects. The following Specification is from AASHTO 4E and can be used for geogrids, geotextiles or geogrid-geotextile composites used in base reinforcement applications.
Standard Specification
for Geosynthetic Base Reinforcement of Pavement Structures for Highway Applications 1. SCOPE 1.1 This is a material specification covering [geogrid] [geotextile] [geogrid-geotextile composite] geosynthetics for use as reinforcement of base OR subbase layers of pavement structures. This is a material purchasing specification and design review of use is recommended. __________________________ NOTE: Eliminate non applicable geosynthetic type(s) in [ ] throughout specification. 1.2 This is not a construction specification. This specification is based on required geosynthetic properties defined by pavement design and by geosynthetic survivability from installation stresses. 2. REFERENCED DOCUMENTS 2.1 ASTM Standards:1
Add references as required 2.2 GRI Standards:2 Add references as required 2.3 U.S. Army Corps of Engineers
_____ Add references as required ____________________ 1. Available from ASTM, 100 Barr Harbor Drive, West Conshohocken, PA 19428. 2. Available from Geosynthetic Research Institute, Drexel University, Philadelphia, PA.
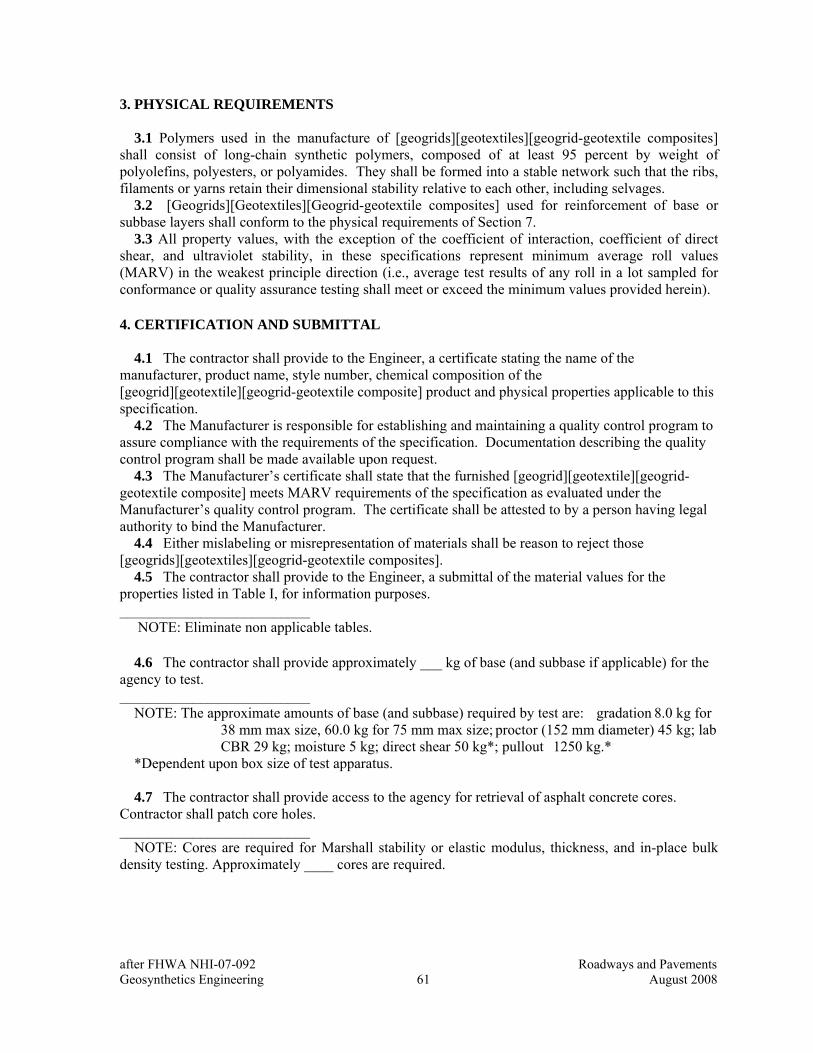
after FHWA NHI-07-092 Roadways and Pavements Geosynthetics Engineering 61 August 2008
3. PHYSICAL REQUIREMENTS 3.1 Polymers used in the manufacture of [geogrids][geotextiles][geogrid-geotextile composites] shall consist of long-chain synthetic polymers, composed of at least 95 percent by weight of polyolefins, polyesters, or polyamides. They shall be formed into a stable network such that the ribs, filaments or yarns retain their dimensional stability relative to each other, including selvages. 3.2 [Geogrids][Geotextiles][Geogrid-geotextile composites] used for reinforcement of base or subbase layers shall conform to the physical requirements of Section 7. 3.3 All property values, with the exception of the coefficient of interaction, coefficient of direct shear, and ultraviolet stability, in these specifications represent minimum average roll values (MARV) in the weakest principle direction (i.e., average test results of any roll in a lot sampled for conformance or quality assurance testing shall meet or exceed the minimum values provided herein). 4. CERTIFICATION AND SUBMITTAL 4.1 The contractor shall provide to the Engineer, a certificate stating the name of the manufacturer, product name, style number, chemical composition of the [geogrid][geotextile][geogrid-geotextile composite] product and physical properties applicable to this specification. 4.2 The Manufacturer is responsible for establishing and maintaining a quality control program to assure compliance with the requirements of the specification. Documentation describing the quality control program shall be made available upon request. 4.3 The Manufacturer’s certificate shall state that the furnished [geogrid][geotextile][geogrid-geotextile composite] meets MARV requirements of the specification as evaluated under the Manufacturer’s quality control program. The certificate shall be attested to by a person having legal authority to bind the Manufacturer. 4.4 Either mislabeling or misrepresentation of materials shall be reason to reject those [geogrids][geotextiles][geogrid-geotextile composites]. 4.5 The contractor shall provide to the Engineer, a submittal of the material values for the properties listed in Table I, for information purposes. __________________________ NOTE: Eliminate non applicable tables. 4.6 The contractor shall provide approximately ___ kg of base (and subbase if applicable) for the agency to test. __________________________ NOTE: The approximate amounts of base (and subbase) required by test are: gradation 8.0 kg for
38 mm max size, 60.0 kg for 75 mm max size; proctor (152 mm diameter) 45 kg; lab CBR 29 kg; moisture 5 kg; direct shear 50 kg*; pullout 1250 kg.*
*Dependent upon box size of test apparatus. 4.7 The contractor shall provide access to the agency for retrieval of asphalt concrete cores. Contractor shall patch core holes. __________________________ NOTE: Cores are required for Marshall stability or elastic modulus, thickness, and in-place bulk density testing. Approximately ____ cores are required.

after FHWA NHI-07-092 Roadways and Pavements Geosynthetics Engineering 62 August 2008
Table Ia. Geogrid Property Submittal Requirements for Base Reinforcement of Pavements
Property
Test Method
Units
Value1
Reinforcement Properties3 MD2 XD2
2% & 5 % secant moduli Coef of Pullout Interact. Coef of Direct Shear Aperture Size Percent Open Area
ASTM D6637 GRI GG5 ASTM D5321 Direct measure COE CW-02215
lb/ft (kN/m) –4 degrees in. (mm) %
Survivability Index Values
Ult Tensile Strength Junction Strength Ultraviolet Stability
ASTM D6637 GRI GG2 ASTM D4355
lb/ft (kN/m) lb (kN) %
Notes: 1 Values, except Ultraviolet Stability, Aperture Size, and Coefs are MARVs. 2 MD - machine, or roll, direction; XD - cross machine, or roll, direction 3 The stiffness properties of flexural rigidity and aperture stability are currently
being evaluated by the geosynthetic industry, in regards to this application. 4 Dimensionless.
Table Ib. Geogrid-Geotextile Composite Property Submittal Requirements for Base Reinforcement of Flexible Pavements
Property
Test Method
Units
Required Value1
Reinforcement Properties3 MD2 XD2
2% & 5 % Secant Moduli Flexural Rigidity Coef of Pullout Interact. Coef of Direct Shear Permittivity Apparent Opening Size
ASTM D45954 ASTM D57324 GRI GG5 ASTM D5321 ASTM D4491 ASTM D4751
lb/ft (kN/m) oz/in.2 (mg/cm2) –5 degrees in. (mm) sec-1
Survivability Index Values
Elong < 50%
Elong > 50%
Ult Tensile Strength Junction Strength Ultraviolet Stability
ASTM D45954 GRI GG2 ASTM D 4355
lb (N) lb (kN) %
>__%, ___ hrs
Notes 1 Values, except Ultraviolet Stability, Apparent Opening Size, ____ and ____, are
MARVs (average value minus two standard deviations). 2 MD - machine, or roll, direction; XD - cross machine, or roll, direction 3 The stiffness properties of flexural rigidity and aperture stability are currently
being evaluated by the geosynthetic industry, in regards to this application. 4 Modified test method. 5 Dimensionless.
after FHWA NHI-07-092 Roadways and Pavements Geosynthetics Engineering 63 August 2008
5. SAMPLING, TESTING, AND ACCEPTANCE 5.1 [Geogrids][Geotextiles][Geogrid-geotextile composites] shall be subject to sampling and testing to verify conformance with this specification. Sampling for testing shall be in accordance with ASTM D 4354. Acceptance shall be based on testing of either conformance samples obtained using Procedure A of ASTM D 4354, or based on manufacturer’s certifications and testing of quality assurance samples obtained using Procedure B of ASTM D 4354. A lot size for conformance or quality assurance sampling shall be considered to be the shipment quantity of the given product or a truckload of the given product, whichever is smaller. 5.2 Testing shall be performed in accordance with the methods referenced in this specification for the indicated application. The number of specimens to test per sample is specified by each test method. [Geogrid][Geotextile][Geogrid-geotextile composite] product acceptance shall be based on ASTM D 4759. Product acceptance is determined by comparing the average test results of all specimens within a given sample to the specification MARV. Refer to ASTM D 4759 for more detail regarding acceptance procedures. 6. SHIPMENT AND STORAGE 6.1 [Geogrids][Geotextiles][Geogrid-geotextile composites] labeling, shipment, and storage shall follow ASTM D 4873. Product labels shall clearly show the manufacturer or supplier name, style name, and roll number. Each shipping document shall include a notation certifying that the material is in accordance with the manufacturer’s certificate.[For geotextiles and geocomposites, each roll shall be wrapped with a material that will protect the geotextile from damage due to shipment, water, sunlight, and contaminants. The protective wrapping shall be maintained during periods of shipment an storage.] 6.2 During storage, [geogrid][geotextile][geogrid-geotextile composite] rolls shall be elevated off the ground and adequately covered to protect them from the following: site construction damage, precipitation, extended ultraviolet radiation including sunlight, chemicals that are strong acids or strong bases, flames including welding sparks, temperatures in excess of 71EC (160EF), and any other environmental condition that may damage the physical property values of the [geogrid][geotextile][geogrid-geotextile composite]. 7. [GEOGRID][GEOTEXTILE][GEOGRID-GEOTEXTILE COMPOSITE] PROPERTY
REQUIREMENTS FOR BASE REINFORCEMENT ****************************************************** Two approaches to specification may be used. An approved products list should be used for designs based upon product-specific data. Generic material specification should be used for designs based upon generic properties. Approved products list approach is presented. ****************************************************** 7.1 The [geogrid][geotextile][geogrid-geotextile composite] reinforcements approved for use on this project are listed in Table I. 7.2 Equivalent Products
7.2.1 Products submitted as equivalent for approval to use shall have documented equivalent, or better, performance in base reinforcement or subgrade restraint in laboratory tests, full-scale field tests, and completed project experience for the project conditions (base course material and thickness, failure criterion, subgrade strength, etc). 7.2.2 Products submitted as equivalent shall have a documented TBR value equal or greater than ___, BCR value equal or greater than ___, or LCR value equal or greater than ___, for the project conditions: base course thickness = ___, subbase thickness = ___, asphalt thickness = ___, failure criterion = ___ mm rut depth, and subgrade strength = ___ CBR.

after FHWA NHI-07-092 Roadways and Pavements Geosynthetics Engineering 64 August 2008
Table II. Approved [geogrid][geotextile][geogrid-geotextile composite] Reinforcement Products
Manufacturer or Distributor Specific Product Name
****************************************************** Equivalent material description (Table II) may not be desired, or required. Particularly if more than one [geogrid][geotextile][geogrid-geotextile composite] is listed on the approved product list, or if a single [geogrid][geotextile][geogrid-geotextile composite] is bid against a thicker unreinforced pavement structure option. ***************************************************** 5.9-4 Selection Considerations For a geosynthetic to perform its intended function in a roadway, it must be able to tolerate the stresses imposed on it during construction; i.e., the geosynthetic must have sufficient survivability to tolerate the anticipated construction operations. Geogrid selection for roadways is usually controlled by survivability, and the guidelines given in Section 5-6 are important in this regard. The specific geogrid property values given in Table 3 are minimums. For important projects, you are strongly encouraged to conduct your own field trials, as described in Section 5-6. 5.10 COST CONSIDERATIONS Estimation of construction costs and benefit-cost ratios for geosynthetic-stabilized road construction is straight-forward and basically the same as that required for alternative pavement designs. Primary factors include the following:
1. cost of the geosynthetic; 2. cost of constructing the conventional design versus a geosynthetic design (i.e.,
stabilization requirements for conventional design versus geosynthetic design), including
a) stabilization aggregate requirements, b) excavation and replacement requirements, c) operational and technical feasibility, and d) construction equipment and time requirements;
3. cost of conventional maintenance during pavement service life versus improved service anticipated by using geosynthetic (estimated through pavement management programs); and
4. regional experience.
after FHWA NHI-07-092 Roadways and Pavements Geosynthetics Engineering 65 August 2008
Annual cost formulas, such as the Baldock method (Illinois DOT, 1982), can be applied with an appropriate present worth factor to obtain the present worth of future expenditures. Cost tradeoffs should also be evaluated for different construction and geosynthetic combinations. This should include subgrade preparation and equipment control versus geosynthetic survivability. In general, higher-cost geosynthetics with a higher survivability on the existing subgrade will be less expensive than the additional subgrade preparation necessary to use lower-survivability geosynthetics. With the significant history of use and advancement of geosynthetics, numerous research efforts are ongoing to quantify the cost-benefit life cycle ratio of using geosynthetics in permanent roadway systems (e.g., Yang, 2006). In any case, the in-place cost of stabilization geosynthetics is typically on the order of 1 to 3 $/yd2 (1.20 to 3.60 $/m2) and reinforcement geosynthetics on the order of 2 to 5 $/yd2 (2.40 to 6.00 $/m2). The cost of the pavement section is generally $25/yd2 ($30/m2) to $100/yd2 ($120/m2), which implies that the geosynthetic cost ranges from less than 1% to up to 5% of the initial construction cost. For any of these applications, the geosynthetic easily extends the life of a pavement by more than 5% and will more than make up for the cost of the geosynthetic. The ability of a geosynthetic to prevent premature failure of the subgrade, prevent contamination of the base and/or provided improved base support provides a low-cost insurance that planned surface rehabilitations can be performed and design pavement life reached. Again, it is noted that competent subgrade/base support is critical to realizing life-cycle cost benefits of surface rehabilitations over the life of a pavement structure. 5.11 REFERENCES AASHTO (1972). Interim Guide for the Design of Pavement Structures, American
Association of State Transportation and Highway Officials, Washington, D.C. AASHTO (1986). AASHTO Guide for Design of Pavement Structures, American
Association of State Highway and Transportation Officials, Washington, D.C. AASHTO (1990). Task Force 25 Report — Guide Specifications and Test Procedures for
Geotextiles, Subcommittee on New Highway Materials, American Association of State Transportation and Highway Officials, Washington, D.C.
AASHTO (1993). AASHTO Guide for Design of Pavement Structures, American
Association of State Highway and Transportation Officials, Washington, D.C.
after FHWA NHI-07-092 Roadways and Pavements Geosynthetics Engineering 66 August 2008
AASHTO (2001). Geosynthetic Reinforcement of the Aggregate Base Course of Flexible Pavement Structures – PP 46-01, Standard Specifications for Transportation Materials and Methods of Sampling and Testing, 26th Edition, and Provisional Standards, American Association of State Transportation and Highway Officials, Washington, D.C.
AASHTO (2006). Standard Specifications for Geotextiles - M 288, Standard Specifications
for Transportation Materials and Methods of Sampling and Testing, 26th Edition, American Association of State Transportation and Highway Officials, Washington, D.C.
AASHTO (2008). Mechanistic-Empirical Pavement Design Guide, Interim Edition: A
Manual of Practice, the AASHTO Mechanistic-Empirical Pavement Design Guide, Interim Edition. American Association of State Transportation and Highway Officials, Washington, D.C. https://bookstore.transportation.org/item_details.aspx?ID=1249
Al-Qadi, I. L. and Appea, A. K. (2003). Eight-Year Field Performance of A Secondary Road
Incorporating Geosynthetics at the Subgrade-Base Interface, Transportation Research Board-82nd Annual Meeting, January 12-16, Washington, D.C.
Al-Qadi, I.L., Brandon, TlL., Bhutta, S.A., and Appea, A.K. (1998). Geosynthetics
Effectiveness in Flexible Secondary Road Pavements, The Charles E. Via Department of Civil Engineering, Virginia Polytechnic Institute and State University, Blacksburg, VA.
Al-Qadi, I. L., Brandon, T. L., Valentine, R. J., Lacina, B. A., and Smith, T. E. (1994).
Laboratory Evaluation of Geosynthetic-Reinforced Pavement Sections, Transportation Research Record 1439, TRB, National Research Council, Washington, D. C., pp. 25-31.
Al-Qadi, I.L., Tutumluer, E., Dessouky, S. and Kwon, J. (2007). Responses of geogrid-
reinforced flexible pavement to accelerated loading, Proceedings of the International Conference on Advanced Characterization of Pavement and Soil Engineering Materials, Athens, Greece.
Al-Qadi, I.L., Tutumluer, E., Dessouky, S., and Kwon, J. (2007). Mechanistic response
measurements of geogrid reinforced flexible pavements to vehicular loading. In CD-ROM Proceedings of the Geosynthetics 2007 Conference, Washington, D.C.
Al-Qadi, I., Tutumluer, E., Kwon, J., and Dessouky, S., (2008). Geogrid in Flexible
Pavements: Validated Mechanism, Accepted for publication of Transportation Research Board, Washington, D.C.
Anderson, R.P. (2006). Geogrid Separation, Proceedings of the International Conference on
New Developments in Geoenvironmental and Geotechnical Engineering, Incheon, South Korea, pp.472-480.
Austin, D. N. and Coleman, D. M. (1993). A Field Evaluation of Geosynthetic-Reinforced
Haul Roads Over Soft Foundation Soils, Geosynthetics 93’, Vancouver, Canada, pp. 65-80.
after FHWA NHI-07-092 Roadways and Pavements Geosynthetics Engineering 67 August 2008
ASTM (2006). Annual Books of ASTM Standards, ASTM International, West Conshohocken, Pennsylvania:
Volume 4.08 (I), Soil and Rock, Volume 4.09 (II), Soil and Rock; Geosynthetics, and Volume 4.13 Geosynthetics
Barenberg, E.J., Hales, J., and Dowland, J. (1975). Evaluation of Soil-Aggregate Systems
with MIRAFI Fabrics, UILU-ENG-75-2020 Report for Celanese Fibers Marketing Company, University of Illinois, Urbana.
Barksdale, R.D., Brown, S.F. and Chan, F. (1989). Potential Benefits of Geosynthetics in
Flexible Pavement Systems, National Cooperative Highway Research Program Report 315, Transportation Research Board, Washington, D.C., 56 p.
Baumgartner, R.H. (1994). Geotextile Design Guidelines for Permeable Bases, Federal
Highway Administration, June, 33 p. Berg, R.R., Christopher, B.R. and Perkins, S.W. (2000). Geosynthetic Reinforcement of the
Aggregate Base/Subbase Courses of Pavement Structures GMA White Paper II, Geosynthetic Materials Association, Roseville, MN, 176 p.
(www.gmanow.com/pdf/WPIIFINALGMA.pdf). Bhutta, S.A. (1998). Mechanistic-Empirical Pavement Design Procedure for
Geosynthetically Stabilized Flexible Pavements, Ph.D. Thesis, Virginia Polytechnic Institute and State University, Blacksburg, VA. (http://www.vtti.vt.edu).
Cedergren, H.R. (1987). Drainage of Highway and Airfield Pavements, Krieger, 289 p. Cedergen, H.R. (1989). Seepage, Drainage, and Flow Nets, John Wiley & Sons, New York,
pp. 153-156. Chan, F., Barksdale, R.D. and Brown, S.F. (1989). Aggregate Base Reinforcement of
Surface Pavements, Geotextiles and Geomembranes, Vol. 8, No. 3, pp. 165-189. Christopher, B.R., Berg, R.R., Perkins, S.W. (2001). Geosynthetic Reinforcements in
Roadway Sections National Cooperative Highway Research Program, NCHRP Project 20-7, Task 112, FY2000, Transportation Research Board, National Academy Press, Washington, D.C.
Christopher, B.R. and Holtz, R.D. (1985). Geotextile Engineering Manual, Federal Highway
Administration, FHWA-TS-86/203, March, 1044 p. Christopher, B.R. and Holtz, R.D. (1989). Geotextile Design and Construction Guidelines,
U.S. Department of Transportation, Federal Highway Administration, Washington DC, Report No. HI-89-050, 265 p.
after FHWA NHI-07-092 Roadways and Pavements Geosynthetics Engineering 68 August 2008
Christopher, B.R. and Holtz, R.D. (1991). Geotextiles for Subgrade Stabilization in Permanent Roads and Highways, Proceedings of Geosynthetics '91, Atlanta, GA, Vol. 2, pp. 701-713.
Christopher, B.R. and Lacina, B. (2008). Roadway Subgrade Stabilization Study,
Proceedings of GeoAmericas 2008, Cancun, Mexico, pp. 1013 -1021. Christopher, B.R., Schwartz, C., Boudreau, R. (2006). Geotechnical Aspects of Pavements,
U.S. Department of Transportation, National Highway Institute, Federal Highway Administration, Washington DC, FHWA-NHI-05-037, 874 p.
Collin, J.G., Kinney, T.C., and Fu, X. (1996). Full Scale Highway Load Test of Flexible
Pavement Systems with Geogrid Reinforced Base Courses, Geosynthetics International, 3(4), pp. 537-549.
ERES Consultants, Inc. (1999). Pavement Subsurface Drainage Design, Participants
Reference Manual for NHI Course Number 131026, National Highway Institute, Federal Highway Administration, Washington, DC.
FAA (1994). Engineering Brief No. 49, Geogrid Reinforced Base Course, Federal Aviation
Administration, U.S. Department of Transportation. Fannin, R.J. and Sigurdsson, O. (1996). Field Observations on Stabilization of Unpaved
Roads with Geosynthetics, Journal of Geotechnical Engineering, 122(7), pp. 544-553. FHWA (1999). Pavement Subsurface Drainage Design, Participants Reference Manual for
NHI Course Number 131026, National Highway Institute, FHWA, ERES.
Gabr, M., Robinson, B., Collin, J.G. and Berg, R.R. (2006). Promoting Geosynthetics Use on Federal Lands Highway Projects, Federal Highway Administration, Central Federal Lands Highway Division, Lakewood, Colorado, FHWA-CFL/TD-06-009, p. 116.
Gabr, M. Leng, J. and Ju, T.J. (2001). Response and Characteristics of Geogrid-Reinforced
Aggregate Under Cyclic Plate Load, Research Report Submitted to Tensar Earth Technologies, NC State University, 40 pp.
GeoServices, Inc. (1989). Geotextile Design Examples, Federal Highway Adminstration,
FHWA Contract No. DTFH-86-R-00102. Giroud, J.P. and Bonaparte, R. (1985). Design of Unpaved Roads and Trafficed Areas with
Geogrids, Foundations for Roads and Loaded Areas, Polymer Grid Reinforcement, Thomas Telford Ltd., London, pp. 116-127.
Giroud, J.P. and Noiray, L. (1981). Geotextile-Reinforced Unpaved Roads, Journal of the
Geotechnical Engineering Division, American Society of Civil Engineers, Vol. 107, No GT 9, pp. 1233-1254.
after FHWA NHI-07-092 Roadways and Pavements Geosynthetics Engineering 69 August 2008
Giroud, J.P. and Han, J. (2004a). Design Method for Geogrid-Reinforced Unpaved Roads: I Development of Design Method, Journal of Geotechnical and GeoEnvironmental Engineering, Vol. 130, No. 8, pp. 775- 786.
Giroud, J.P. and Han, J. (2004b). Design Method for Geogrid-Reinforced Unpaved Roads:
II Calibration and Applications, Journal of Geotechnical and GeoEnvironmental Engineering, Vol. 130, No. 8, pp. 787- 797.
GMA (1999). Geosynthetics in Pavement Systems Applications, Section One: Geogrids,
Section Two: Geotextiles, prepared for AASHTO, Geosynthetics Materials Association, Roseville, MN, 46 p.
Haas, R., Walls, J. and Carroll, R.G. (1988). Geogrid Reinforcement of Granular Base in
Flexible Pavements, presented at the 67th Annual Meeting, Transportation Research Board, Washington, D.C.
Haliburton, T.A., Lawmaster, J.D. and McGuffey, V.C. (1981). Use of Engineering Fabrics
in Transportation Related Applications, Federal Highway Administration, FHWA DTFH61-80-C-00094.
Hamilton, J.S. and Pearce, R.A. (1981). Guidelines for Design of Flexible Pavements using
Mirafi Woven Stabilization Fabrics, Law Engineering Testing Co. Report to Celanese Corp., 47 p.
Heukelom, W. and Klomp, A.J.G. (1962). Dynamic Testing as a Means of Controlling
Pavements during and after Construction, Proceedings, 1st Int. Conf. on Structural Design of Asphalt Pavement, Univ. of Michigan, pp. 667-679.
Helwany, S., Dyer, J., and Leidy, J. (1998). Finite Element Analyses of Flexible Pavements,
Journal of Transportation Engineering, Vol. 124, No. 5, pp. 491-499. Holtz, R.D., Christopher, B.R. and Berg, R.R. (1998). Geosynthetic Design and
Construction Guidelines, FHWA-HI-98-038, U.S. Department of Transportation, Federal Highway Administration, Washington, D.C., pp. 460.
Illinois Department of Transportation (1982). Design Manual - Section 7: Pavement
Design, I-82-2, Bureau of Design, Springfield. Jorenby, B.N. and Hicks, R.G. (1986). Base Coarse Contamination Limits, Transportation
Research Record, No. 1095, Washington, D.C. Kinney, T.C. and Xiaolin, Y. (1995). Geogrid Aperture Rigidity by In-Plane Rotation,
Proceedings of Geosynthetics ’95, Nashville, TN, pp. 525 537. Kinney, T.C. (2000). Standard Test Method for Determining the Aperture Stability Modulus
of a Geogrid, Shannon & Wilson, Seattle, WA.
after FHWA NHI-07-092 Roadways and Pavements Geosynthetics Engineering 70 August 2008
Knapton, J. and Austin, R.A. (1996). Laboratory testing of reinforced unpaved roads, Earth Reinforcement, H. Ochiai, N. Yasufuku, and K. Omine eds., Balkema, Rotterdam, The Netherlands, pp. 615-618.
Koerner, R.M. (1990). Editor, The Seaming of Geosynthetics, Special Issue, Geotextiles and
Geomembranes, Vol. 9, Nos. 4-6, pp. 281-564. Koerner, R.M. (1994). Designing With Geosynthetics, 3rd Edition, Prentice-Hall Inc.,
Englewood Cliffs, NJ, 783p. Koerner, R.M. (2006). Designing With Geosynthetics, 5th Edition, Prentice-Hall Inc.,
Englewood Cliffs, NJ, 796p. Kwon, J., Tutumluer, E., and Kim, M. (2005). Development of a Mechanistic Model for
Geogrid Reinforced Flexible Pavements. Geosynthetics International, 12:6, pp. 310-320. Kwon, J., Tutumluer, E., and Konietzky, H. (2007). Aggregate Base Residual Stresses
Affecting Geogrid Reinforced Flexible Pavement Response, International Journal of Pavement Engineering.
Leng, J. and Gabr, M. (2002). Characteristics of Geogrid-Reinforced Aggregate under
Cyclic Load, Journal of Transportation Research Board, No. 1786, National Research Council, Washington, D.C., pp. 29-35.
Mery, J. (1995) Field Studies on the Mechanical Behavior of Geosynthetic-Reinforced
Unpaved Roads, 6th International Conf. on Low Volume Roads, Vol. 2, pp. 234-239. Miuara, N., Sakai, A., Taesiri, Y., Yamanouchi, T. and Yasuhara, K. (1990). Polymer Grid
Reinforced Pavement on Soft Clay Grounds, Geotextiles and Geomembranes, Vol. 9, No. 1, pp. 99-123.
NCHRP (2002). Design Guide – Design of New and Rehabilitated Pavement Structures,
NCHRP 1-37A Project, Draft Final Report, Part 1 – Introduction and Part 2 – Design Inputs, Prepared for the National Cooperative Highway Research Program by ERES Division of ARA.
NCRHP (2008). NCHRP Research Field 1–Pavements, the National Cooperative Highway
Research Program, Transportation Research Board, Washington, D.C. http://www.trb.org/CRP/NCHRP/NCHRPProjects.asp
Perkins, S.W. (1999). Geosynthetics Stabilization of Flexible Pavements: Laboratory Based
Pavement Test Sections, FHWA Report Reference Number MT-99-001/8138, 140 p. Perkins, S.W., Bowders, J.J., Christopher, B.R., and Berg, R.R. (2005a). Advances in
Geosynthetic Reinforcement in Pavement Systems, Proceedings of the GeoFrontiers Conference, Austin, Texas.
after FHWA NHI-07-092 Roadways and Pavements Geosynthetics Engineering 71 August 2008
Perkins, S.W., Bowders, J.J., Christopher, B.R., and Berg, R.R. (2005c). Geosynthetic Reinforcement for Pavement Systems: US Perspectives, Geotechnical Special Publication 141, Proceedings of the GeoFrontiers Conference, Austin, Texas.
Perkins, S.W., Christopher, B.R., Cuelho, E.L., Eiksund, G.R., Hoff, I., Schwartz, C.W.,
Svanø, G., and Want, A. (2004). Development of Design Methods for Geosynthetic Reinforced Flexible Pavements, FHWA Report Reference Number DTFH61-01-X-00068, 63p. (http://www.coe.montana.edu/wti/wti/pdf/426202_Final_Report.pdf)
Perkins, S.W., Christopher, B.R., Eiksund, G.R., Schwartz, C.W., and Svano, G. (2005b).
Modeling Effects of Reinforcement on Lateral Confinement of Roadway Aggregate, Geotechnical Special Publication 130, GeoFrontiers 2005, pp. 283-296.
Perkins, S.W. and Salvano, G. (2004). Assessment of Interface Shear Growth from
Measured Geosynthetic Strains in a Reinforced Pavement Subject to Repeated Loads, Proceedings of the 8th International Conference on Geosynthetics, Yokahama, Japan.
Rankilor, P.R (1981). Membranes in Ground Engineering, John Wiley & Sons, Inc.,
Chichester, England, 377 p. Steward, J., Williamson, R. and Mohney, J. (1977). Guidelines for Use of Fabrics in
Construction and Maintenance of Low-Volume Roads, USDA, Forest Service, Portland, OR. Also reprinted as Report No. FHWA-TS-78-205.
Terzaghi, K. and Peck, R.B. (1967). Soil Mechanics in Engineering Practice, John Wiley &
Sons, New York, 729p. Tingle, J.S. and Webster, S.L. (2003). Review of Corps of Engineers Design of Geosynthetc
Reinforced Unpaved Roads, Annual meeting CD-ROM, TRB, Washington, D.C. Tsai, W. (1995). Evaluation of Geotextiles as Separators in Roadways, Ph.D. Thesis,
University of Washington, Seattle, Washington, 172 p.
United States Army Corps of Engineers (2003). Use of Geogrids in Pavement Construction, ETL 1110-1-189, Department of the Army, U.S. Army Corps of Engineers, Washington, D.C., 37 p.
Webster, S.L. (1993). Geogrid Reinforced Base Courses for Flexible Pavements for Light
Aircraft: Test Section Construction, Behavior Under Traffic, Laboratory Tests, and Design Criteria, USAE Waterways Experiment Station, Vicksburg, MS, Technical Report DOT/FAA/RD-92/25, 100 p.
Yang, S.H. (2006). Effectiveness of Using Geotextiles in Flexible Pavements: Life-Cycle
Cost Analysis, MSCE Thesis, Virginia Polytechnic Institute and State University, Blacksburg, VA.
Yoder, E.J. and Witczak, M.W. (1975). Principles of Pavement Design, Second Edition,
Wiley, 711 p.

after FHWA NHI-07-092 Roadways and Pavements Geosynthetics Engineering 72 August 2008
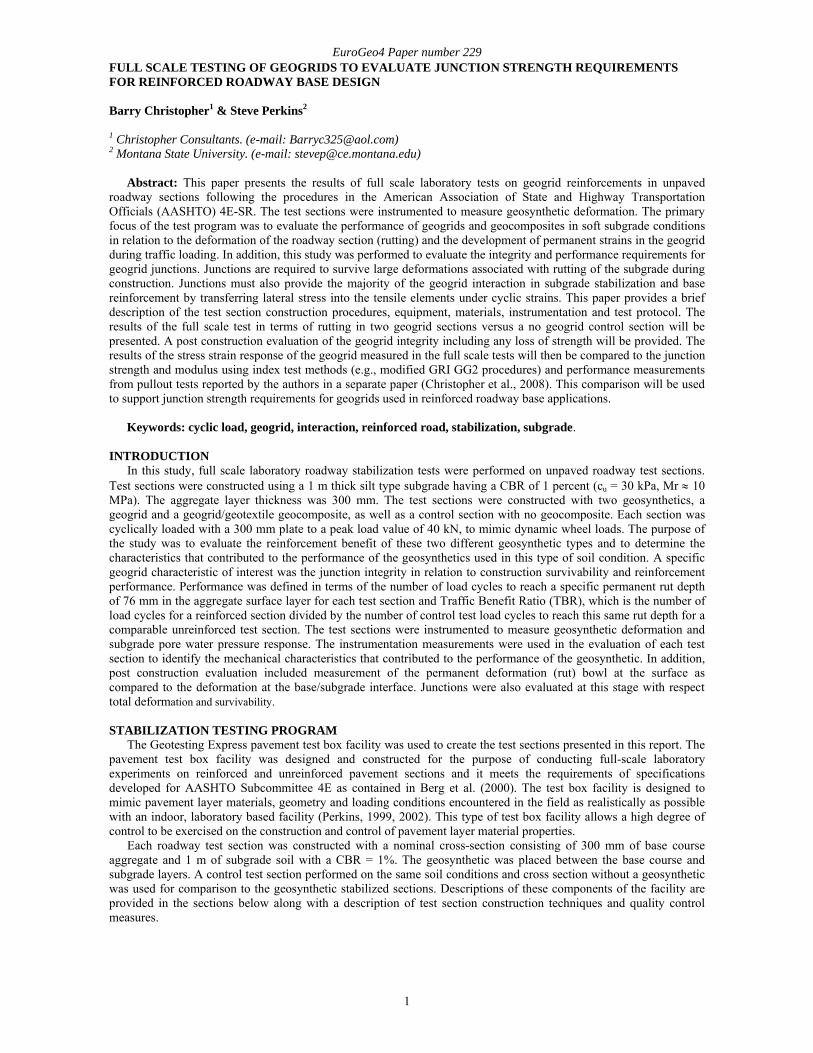
EuroGeo4 Paper number 229
1
FULL SCALE TESTING OF GEOGRIDS TO EVALUATE JUNCTION STRENGTH REQUIREMENTS FOR REINFORCED ROADWAY BASE DESIGN Barry Christopher1 & Steve Perkins2 1 Christopher Consultants. (e-mail: [email protected]) 2 Montana State University. (e-mail: [email protected])
Abstract: This paper presents the results of full scale laboratory tests on geogrid reinforcements in unpaved roadway sections following the procedures in the American Association of State and Highway Transportation Officials (AASHTO) 4E-SR. The test sections were instrumented to measure geosynthetic deformation. The primary focus of the test program was to evaluate the performance of geogrids and geocomposites in soft subgrade conditions in relation to the deformation of the roadway section (rutting) and the development of permanent strains in the geogrid during traffic loading. In addition, this study was performed to evaluate the integrity and performance requirements for geogrid junctions. Junctions are required to survive large deformations associated with rutting of the subgrade during construction. Junctions must also provide the majority of the geogrid interaction in subgrade stabilization and base reinforcement by transferring lateral stress into the tensile elements under cyclic strains. This paper provides a brief description of the test section construction procedures, equipment, materials, instrumentation and test protocol. The results of the full scale test in terms of rutting in two geogrid sections versus a no geogrid control section will be presented. A post construction evaluation of the geogrid integrity including any loss of strength will be provided. The results of the stress strain response of the geogrid measured in the full scale tests will then be compared to the junction strength and modulus using index test methods (e.g., modified GRI GG2 procedures) and performance measurements from pullout tests reported by the authors in a separate paper (Christopher et al., 2008). This comparison will be used to support junction strength requirements for geogrids used in reinforced roadway base applications.
Keywords: cyclic load, geogrid, interaction, reinforced road, stabilization, subgrade.
INTRODUCTION In this study, full scale laboratory roadway stabilization tests were performed on unpaved roadway test sections.
Test sections were constructed using a 1 m thick silt type subgrade having a CBR of 1 percent (cu = 30 kPa, Mr ≈ 10 MPa). The aggregate layer thickness was 300 mm. The test sections were constructed with two geosynthetics, a geogrid and a geogrid/geotextile geocomposite, as well as a control section with no geocomposite. Each section was cyclically loaded with a 300 mm plate to a peak load value of 40 kN, to mimic dynamic wheel loads. The purpose of the study was to evaluate the reinforcement benefit of these two different geosynthetic types and to determine the characteristics that contributed to the performance of the geosynthetics used in this type of soil condition. A specific geogrid characteristic of interest was the junction integrity in relation to construction survivability and reinforcement performance. Performance was defined in terms of the number of load cycles to reach a specific permanent rut depth of 76 mm in the aggregate surface layer for each test section and Traffic Benefit Ratio (TBR), which is the number of load cycles for a reinforced section divided by the number of control test load cycles to reach this same rut depth for a comparable unreinforced test section. The test sections were instrumented to measure geosynthetic deformation and subgrade pore water pressure response. The instrumentation measurements were used in the evaluation of each test section to identify the mechanical characteristics that contributed to the performance of the geosynthetic. In addition, post construction evaluation included measurement of the permanent deformation (rut) bowl at the surface as compared to the deformation at the base/subgrade interface. Junctions were also evaluated at this stage with respect total deformation and survivability.
STABILIZATION TESTING PROGRAM
The Geotesting Express pavement test box facility was used to create the test sections presented in this report. The pavement test box facility was designed and constructed for the purpose of conducting full-scale laboratory experiments on reinforced and unreinforced pavement sections and it meets the requirements of specifications developed for AASHTO Subcommittee 4E as contained in Berg et al. (2000). The test box facility is designed to mimic pavement layer materials, geometry and loading conditions encountered in the field as realistically as possible with an indoor, laboratory based facility (Perkins, 1999, 2002). This type of test box facility allows a high degree of control to be exercised on the construction and control of pavement layer material properties.
Each roadway test section was constructed with a nominal cross-section consisting of 300 mm of base course aggregate and 1 m of subgrade soil with a CBR = 1%. The geosynthetic was placed between the base course and subgrade layers. A control test section performed on the same soil conditions and cross section without a geosynthetic was used for comparison to the geosynthetic stabilized sections. Descriptions of these components of the facility are provided in the sections below along with a description of test section construction techniques and quality control measures.
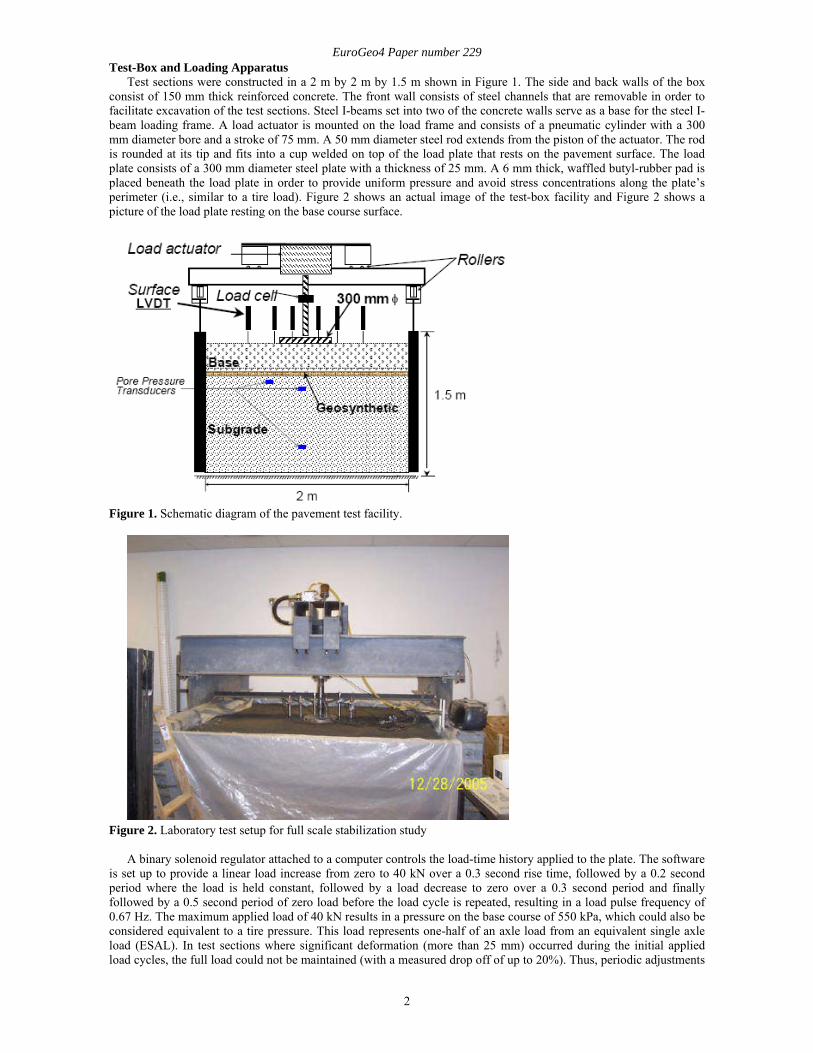
EuroGeo4 Paper number 229
2
Test-Box and Loading Apparatus Test sections were constructed in a 2 m by 2 m by 1.5 m shown in Figure 1. The side and back walls of the box
consist of 150 mm thick reinforced concrete. The front wall consists of steel channels that are removable in order to facilitate excavation of the test sections. Steel I-beams set into two of the concrete walls serve as a base for the steel I-beam loading frame. A load actuator is mounted on the load frame and consists of a pneumatic cylinder with a 300 mm diameter bore and a stroke of 75 mm. A 50 mm diameter steel rod extends from the piston of the actuator. The rod is rounded at its tip and fits into a cup welded on top of the load plate that rests on the pavement surface. The load plate consists of a 300 mm diameter steel plate with a thickness of 25 mm. A 6 mm thick, waffled butyl-rubber pad is placed beneath the load plate in order to provide uniform pressure and avoid stress concentrations along the plate’s perimeter (i.e., similar to a tire load). Figure 2 shows an actual image of the test-box facility and Figure 2 shows a picture of the load plate resting on the base course surface.
Figure 1. Schematic diagram of the pavement test facility.
Figure 2. Laboratory test setup for full scale stabilization study A binary solenoid regulator attached to a computer controls the load-time history applied to the plate. The software
is set up to provide a linear load increase from zero to 40 kN over a 0.3 second rise time, followed by a 0.2 second period where the load is held constant, followed by a load decrease to zero over a 0.3 second period and finally followed by a 0.5 second period of zero load before the load cycle is repeated, resulting in a load pulse frequency of 0.67 Hz. The maximum applied load of 40 kN results in a pressure on the base course of 550 kPa, which could also be considered equivalent to a tire pressure. This load represents one-half of an axle load from an equivalent single axle load (ESAL). In test sections where significant deformation (more than 25 mm) occurred during the initial applied load cycles, the full load could not be maintained (with a measured drop off of up to 20%). Thus, periodic adjustments
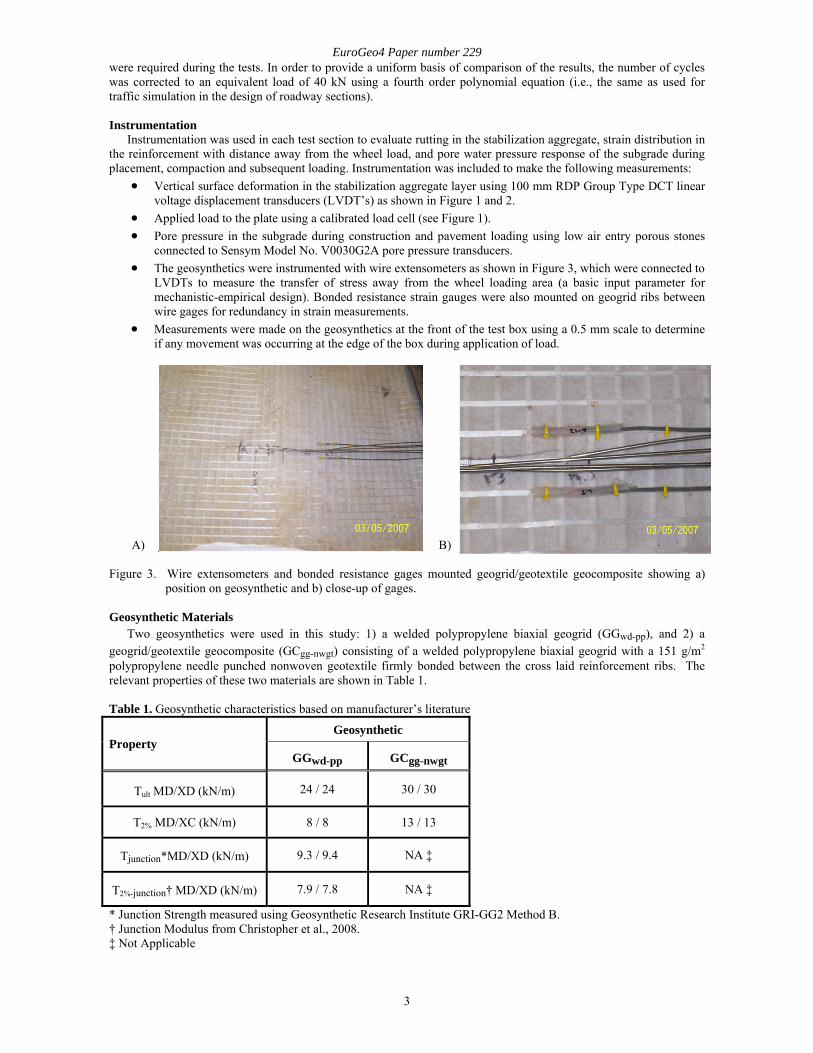
EuroGeo4 Paper number 229
3
were required during the tests. In order to provide a uniform basis of comparison of the results, the number of cycles was corrected to an equivalent load of 40 kN using a fourth order polynomial equation (i.e., the same as used for traffic simulation in the design of roadway sections).
Instrumentation
Instrumentation was used in each test section to evaluate rutting in the stabilization aggregate, strain distribution in the reinforcement with distance away from the wheel load, and pore water pressure response of the subgrade during placement, compaction and subsequent loading. Instrumentation was included to make the following measurements:
• Vertical surface deformation in the stabilization aggregate layer using 100 mm RDP Group Type DCT linear voltage displacement transducers (LVDT’s) as shown in Figure 1 and 2.
• Applied load to the plate using a calibrated load cell (see Figure 1). • Pore pressure in the subgrade during construction and pavement loading using low air entry porous stones
connected to Sensym Model No. V0030G2A pore pressure transducers. • The geosynthetics were instrumented with wire extensometers as shown in Figure 3, which were connected to
LVDTs to measure the transfer of stress away from the wheel loading area (a basic input parameter for mechanistic-empirical design). Bonded resistance strain gauges were also mounted on geogrid ribs between wire gages for redundancy in strain measurements.
• Measurements were made on the geosynthetics at the front of the test box using a 0.5 mm scale to determine if any movement was occurring at the edge of the box during application of load.
A) B) Figure 3. Wire extensometers and bonded resistance gages mounted geogrid/geotextile geocomposite showing a)
position on geosynthetic and b) close-up of gages. Geosynthetic Materials
Two geosynthetics were used in this study: 1) a welded polypropylene biaxial geogrid (GGwd-pp), and 2) a geogrid/geotextile geocomposite (GCgg-nwgt) consisting of a welded polypropylene biaxial geogrid with a 151 g/m2 polypropylene needle punched nonwoven geotextile firmly bonded between the cross laid reinforcement ribs. The relevant properties of these two materials are shown in Table 1.
Table 1. Geosynthetic characteristics based on manufacturer’s literature
Property Geosynthetic
GGwd-pp GCgg-nwgt
Tult MD/XD (kN/m) 24 / 24 30 / 30
T2% MD/XC (kN/m) 8 / 8 13 / 13
Tjunction*MD/XD (kN/m) 9.3 / 9.4 NA ‡
T2%-junction† MD/XD (kN/m) 7.9 / 7.8 NA ‡
* Junction Strength measured using Geosynthetic Research Institute GRI-GG2 Method B. † Junction Modulus from Christopher et al., 2008. ‡ Not Applicable
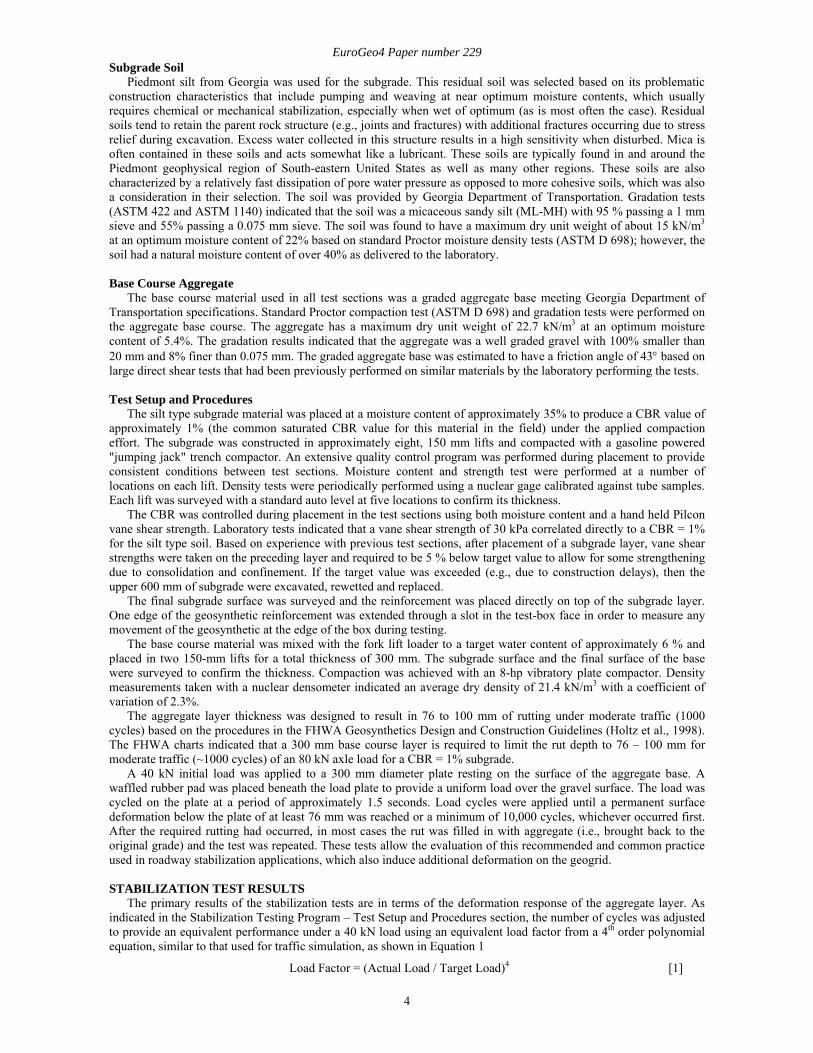
EuroGeo4 Paper number 229
4
Subgrade Soil Piedmont silt from Georgia was used for the subgrade. This residual soil was selected based on its problematic
construction characteristics that include pumping and weaving at near optimum moisture contents, which usually requires chemical or mechanical stabilization, especially when wet of optimum (as is most often the case). Residual soils tend to retain the parent rock structure (e.g., joints and fractures) with additional fractures occurring due to stress relief during excavation. Excess water collected in this structure results in a high sensitivity when disturbed. Mica is often contained in these soils and acts somewhat like a lubricant. These soils are typically found in and around the Piedmont geophysical region of South-eastern United States as well as many other regions. These soils are also characterized by a relatively fast dissipation of pore water pressure as opposed to more cohesive soils, which was also a consideration in their selection. The soil was provided by Georgia Department of Transportation. Gradation tests (ASTM 422 and ASTM 1140) indicated that the soil was a micaceous sandy silt (ML-MH) with 95 % passing a 1 mm sieve and 55% passing a 0.075 mm sieve. The soil was found to have a maximum dry unit weight of about 15 kN/m3 at an optimum moisture content of 22% based on standard Proctor moisture density tests (ASTM D 698); however, the soil had a natural moisture content of over 40% as delivered to the laboratory. Base Course Aggregate
The base course material used in all test sections was a graded aggregate base meeting Georgia Department of Transportation specifications. Standard Proctor compaction test (ASTM D 698) and gradation tests were performed on the aggregate base course. The aggregate has a maximum dry unit weight of 22.7 kN/m3 at an optimum moisture content of 5.4%. The gradation results indicated that the aggregate was a well graded gravel with 100% smaller than 20 mm and 8% finer than 0.075 mm. The graded aggregate base was estimated to have a friction angle of 43° based on large direct shear tests that had been previously performed on similar materials by the laboratory performing the tests. Test Setup and Procedures
The silt type subgrade material was placed at a moisture content of approximately 35% to produce a CBR value of approximately 1% (the common saturated CBR value for this material in the field) under the applied compaction effort. The subgrade was constructed in approximately eight, 150 mm lifts and compacted with a gasoline powered "jumping jack" trench compactor. An extensive quality control program was performed during placement to provide consistent conditions between test sections. Moisture content and strength test were performed at a number of locations on each lift. Density tests were periodically performed using a nuclear gage calibrated against tube samples. Each lift was surveyed with a standard auto level at five locations to confirm its thickness.
The CBR was controlled during placement in the test sections using both moisture content and a hand held Pilcon vane shear strength. Laboratory tests indicated that a vane shear strength of 30 kPa correlated directly to a CBR = 1% for the silt type soil. Based on experience with previous test sections, after placement of a subgrade layer, vane shear strengths were taken on the preceding layer and required to be 5 % below target value to allow for some strengthening due to consolidation and confinement. If the target value was exceeded (e.g., due to construction delays), then the upper 600 mm of subgrade were excavated, rewetted and replaced.
The final subgrade surface was surveyed and the reinforcement was placed directly on top of the subgrade layer. One edge of the geosynthetic reinforcement was extended through a slot in the test-box face in order to measure any movement of the geosynthetic at the edge of the box during testing.
The base course material was mixed with the fork lift loader to a target water content of approximately 6 % and placed in two 150-mm lifts for a total thickness of 300 mm. The subgrade surface and the final surface of the base were surveyed to confirm the thickness. Compaction was achieved with an 8-hp vibratory plate compactor. Density measurements taken with a nuclear densometer indicated an average dry density of 21.4 kN/m3 with a coefficient of variation of 2.3%.
The aggregate layer thickness was designed to result in 76 to 100 mm of rutting under moderate traffic (1000 cycles) based on the procedures in the FHWA Geosynthetics Design and Construction Guidelines (Holtz et al., 1998). The FHWA charts indicated that a 300 mm base course layer is required to limit the rut depth to 76 – 100 mm for moderate traffic (~1000 cycles) of an 80 kN axle load for a CBR = 1% subgrade.
A 40 kN initial load was applied to a 300 mm diameter plate resting on the surface of the aggregate base. A waffled rubber pad was placed beneath the load plate to provide a uniform load over the gravel surface. The load was cycled on the plate at a period of approximately 1.5 seconds. Load cycles were applied until a permanent surface deformation below the plate of at least 76 mm was reached or a minimum of 10,000 cycles, whichever occurred first. After the required rutting had occurred, in most cases the rut was filled in with aggregate (i.e., brought back to the original grade) and the test was repeated. These tests allow the evaluation of this recommended and common practice used in roadway stabilization applications, which also induce additional deformation on the geogrid.
STABILIZATION TEST RESULTS
The primary results of the stabilization tests are in terms of the deformation response of the aggregate layer. As indicated in the Stabilization Testing Program – Test Setup and Procedures section, the number of cycles was adjusted to provide an equivalent performance under a 40 kN load using an equivalent load factor from a 4th order polynomial equation, similar to that used for traffic simulation, as shown in Equation 1
Load Factor = (Actual Load / Target Load)4 [1]
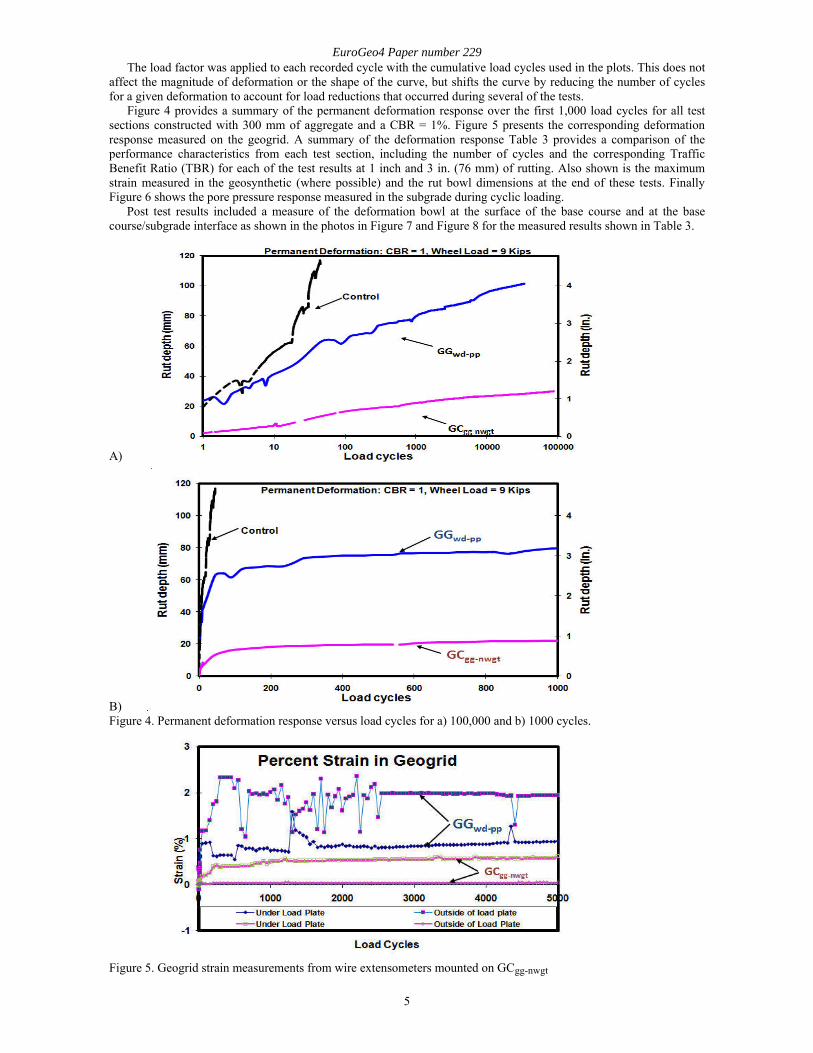
EuroGeo4 Paper number 229
5
The load factor was applied to each recorded cycle with the cumulative load cycles used in the plots. This does not affect the magnitude of deformation or the shape of the curve, but shifts the curve by reducing the number of cycles for a given deformation to account for load reductions that occurred during several of the tests.
Figure 4 provides a summary of the permanent deformation response over the first 1,000 load cycles for all test sections constructed with 300 mm of aggregate and a CBR = 1%. Figure 5 presents the corresponding deformation response measured on the geogrid. A summary of the deformation response Table 3 provides a comparison of the performance characteristics from each test section, including the number of cycles and the corresponding Traffic Benefit Ratio (TBR) for each of the test results at 1 inch and 3 in. (76 mm) of rutting. Also shown is the maximum strain measured in the geosynthetic (where possible) and the rut bowl dimensions at the end of these tests. Finally Figure 6 shows the pore pressure response measured in the subgrade during cyclic loading.
Post test results included a measure of the deformation bowl at the surface of the base course and at the base course/subgrade interface as shown in the photos in Figure 7 and Figure 8 for the measured results shown in Table 3.
A)
B) Figure 4. Permanent deformation response versus load cycles for a) 100,000 and b) 1000 cycles. Figure 5. Geogrid strain measurements from wire extensometers mounted on GCgg-nwgt
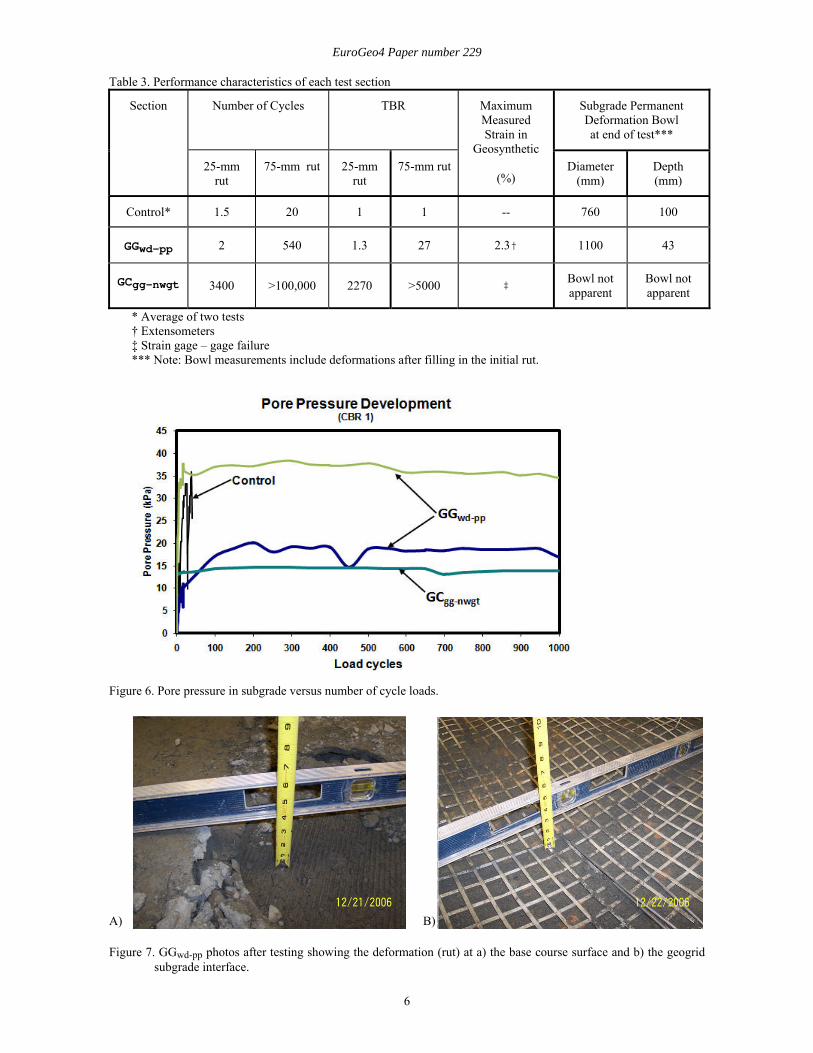
EuroGeo4 Paper number 229
6
Table 3. Performance characteristics of each test section
Section Number of Cycles TBR
Maximum Measured Strain in
Geosynthetic
(%)
Subgrade Permanent Deformation Bowl at end of test***
25-mm rut
75-mm rut 25-mm rut
75-mm rut Diameter (mm)
Depth (mm)
Control* 1.5 20 1 1 -- 760 100
GGwd-pp 2 540 1.3 27 2.3† 1100 43
GCgg-nwgt 3400 >100,000 2270 >5000 ‡ Bowl not apparent
Bowl not apparent
* Average of two tests † Extensometers ‡ Strain gage – gage failure *** Note: Bowl measurements include deformations after filling in the initial rut.
Figure 6. Pore pressure in subgrade versus number of cycle loads. A) B) Figure 7. GGwd-pp photos after testing showing the deformation (rut) at a) the base course surface and b) the geogrid
subgrade interface.
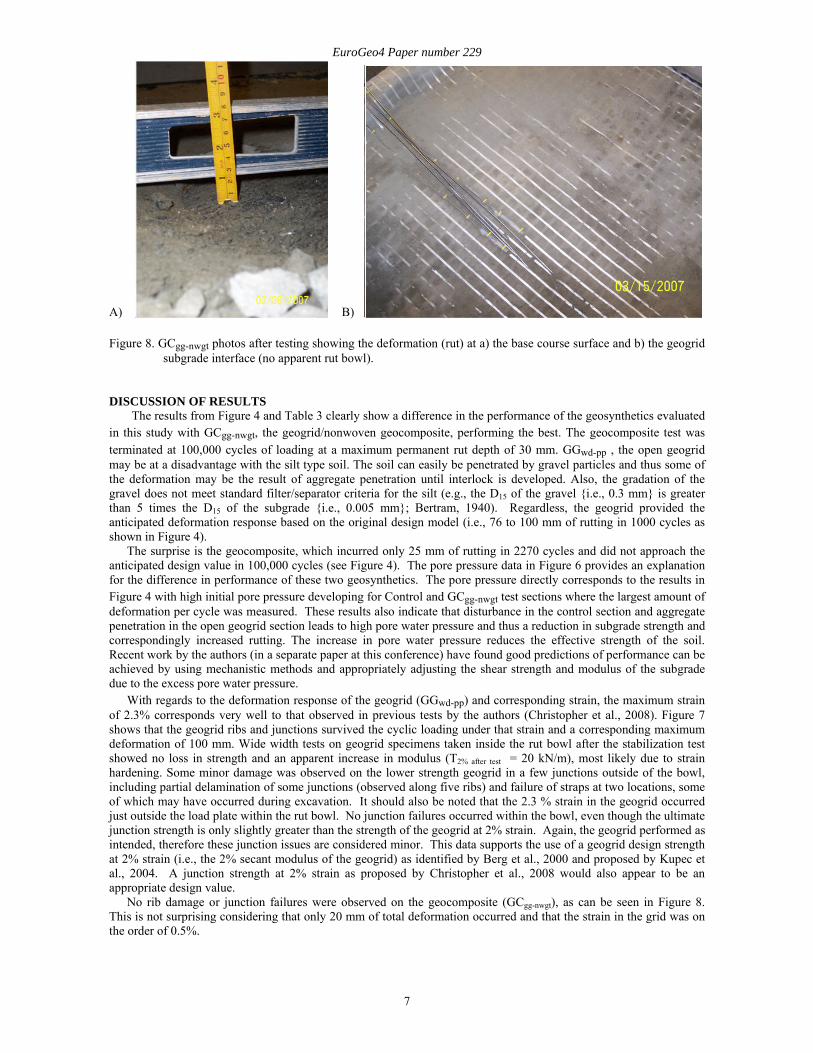
EuroGeo4 Paper number 229
7
A) B) Figure 8. GCgg-nwgt photos after testing showing the deformation (rut) at a) the base course surface and b) the geogrid
subgrade interface (no apparent rut bowl).
DISCUSSION OF RESULTS The results from Figure 4 and Table 3 clearly show a difference in the performance of the geosynthetics evaluated
in this study with GCgg-nwgt, the geogrid/nonwoven geocomposite, performing the best. The geocomposite test was terminated at 100,000 cycles of loading at a maximum permanent rut depth of 30 mm. GGwd-pp , the open geogrid may be at a disadvantage with the silt type soil. The soil can easily be penetrated by gravel particles and thus some of the deformation may be the result of aggregate penetration until interlock is developed. Also, the gradation of the gravel does not meet standard filter/separator criteria for the silt (e.g., the D15 of the gravel {i.e., 0.3 mm} is greater than 5 times the D15 of the subgrade {i.e., 0.005 mm}; Bertram, 1940). Regardless, the geogrid provided the anticipated deformation response based on the original design model (i.e., 76 to 100 mm of rutting in 1000 cycles as shown in Figure 4).
The surprise is the geocomposite, which incurred only 25 mm of rutting in 2270 cycles and did not approach the anticipated design value in 100,000 cycles (see Figure 4). The pore pressure data in Figure 6 provides an explanation for the difference in performance of these two geosynthetics. The pore pressure directly corresponds to the results in Figure 4 with high initial pore pressure developing for Control and GCgg-nwgt test sections where the largest amount of deformation per cycle was measured. These results also indicate that disturbance in the control section and aggregate penetration in the open geogrid section leads to high pore water pressure and thus a reduction in subgrade strength and correspondingly increased rutting. The increase in pore water pressure reduces the effective strength of the soil. Recent work by the authors (in a separate paper at this conference) have found good predictions of performance can be achieved by using mechanistic methods and appropriately adjusting the shear strength and modulus of the subgrade due to the excess pore water pressure.
With regards to the deformation response of the geogrid (GGwd-pp) and corresponding strain, the maximum strain of 2.3% corresponds very well to that observed in previous tests by the authors (Christopher et al., 2008). Figure 7 shows that the geogrid ribs and junctions survived the cyclic loading under that strain and a corresponding maximum deformation of 100 mm. Wide width tests on geogrid specimens taken inside the rut bowl after the stabilization test showed no loss in strength and an apparent increase in modulus (T2% after test = 20 kN/m), most likely due to strain hardening. Some minor damage was observed on the lower strength geogrid in a few junctions outside of the bowl, including partial delamination of some junctions (observed along five ribs) and failure of straps at two locations, some of which may have occurred during excavation. It should also be noted that the 2.3 % strain in the geogrid occurred just outside the load plate within the rut bowl. No junction failures occurred within the bowl, even though the ultimate junction strength is only slightly greater than the strength of the geogrid at 2% strain. Again, the geogrid performed as intended, therefore these junction issues are considered minor. This data supports the use of a geogrid design strength at 2% strain (i.e., the 2% secant modulus of the geogrid) as identified by Berg et al., 2000 and proposed by Kupec et al., 2004. A junction strength at 2% strain as proposed by Christopher et al., 2008 would also appear to be an appropriate design value.
No rib damage or junction failures were observed on the geocomposite (GCgg-nwgt), as can be seen in Figure 8. This is not surprising considering that only 20 mm of total deformation occurred and that the strain in the grid was on the order of 0.5%.
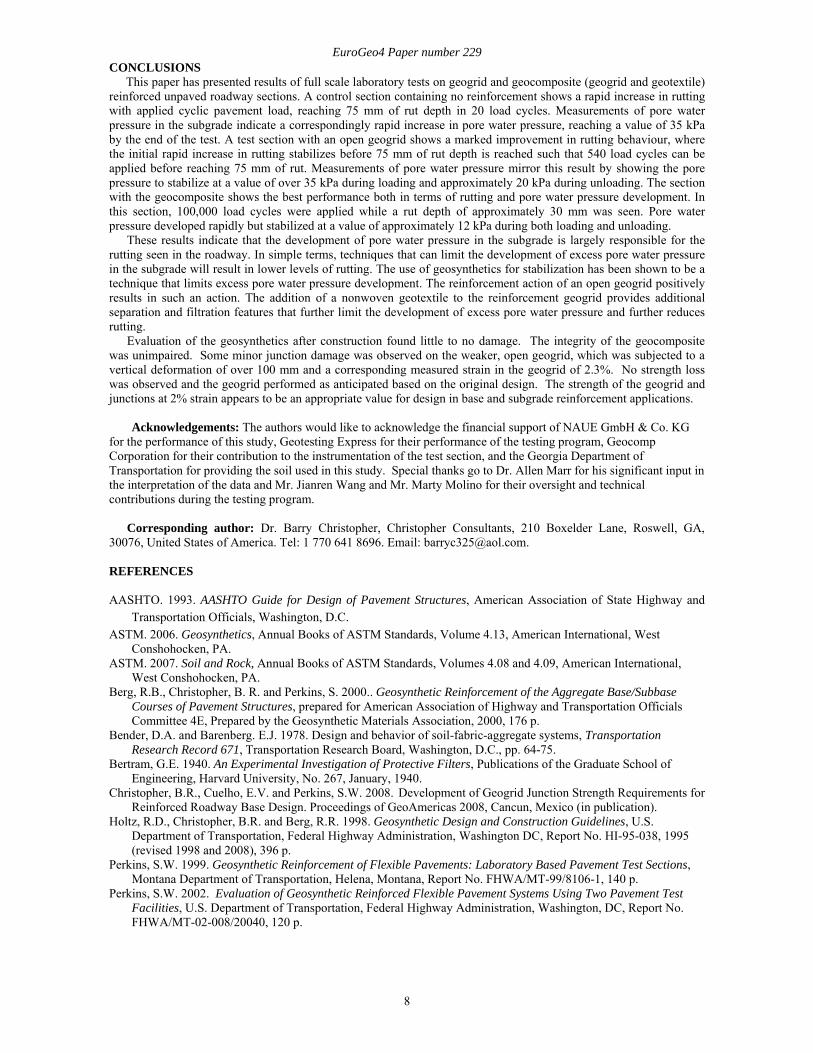
EuroGeo4 Paper number 229
8
CONCLUSIONS This paper has presented results of full scale laboratory tests on geogrid and geocomposite (geogrid and geotextile)
reinforced unpaved roadway sections. A control section containing no reinforcement shows a rapid increase in rutting with applied cyclic pavement load, reaching 75 mm of rut depth in 20 load cycles. Measurements of pore water pressure in the subgrade indicate a correspondingly rapid increase in pore water pressure, reaching a value of 35 kPa by the end of the test. A test section with an open geogrid shows a marked improvement in rutting behaviour, where the initial rapid increase in rutting stabilizes before 75 mm of rut depth is reached such that 540 load cycles can be applied before reaching 75 mm of rut. Measurements of pore water pressure mirror this result by showing the pore pressure to stabilize at a value of over 35 kPa during loading and approximately 20 kPa during unloading. The section with the geocomposite shows the best performance both in terms of rutting and pore water pressure development. In this section, 100,000 load cycles were applied while a rut depth of approximately 30 mm was seen. Pore water pressure developed rapidly but stabilized at a value of approximately 12 kPa during both loading and unloading.
These results indicate that the development of pore water pressure in the subgrade is largely responsible for the rutting seen in the roadway. In simple terms, techniques that can limit the development of excess pore water pressure in the subgrade will result in lower levels of rutting. The use of geosynthetics for stabilization has been shown to be a technique that limits excess pore water pressure development. The reinforcement action of an open geogrid positively results in such an action. The addition of a nonwoven geotextile to the reinforcement geogrid provides additional separation and filtration features that further limit the development of excess pore water pressure and further reduces rutting.
Evaluation of the geosynthetics after construction found little to no damage. The integrity of the geocomposite was unimpaired. Some minor junction damage was observed on the weaker, open geogrid, which was subjected to a vertical deformation of over 100 mm and a corresponding measured strain in the geogrid of 2.3%. No strength loss was observed and the geogrid performed as anticipated based on the original design. The strength of the geogrid and junctions at 2% strain appears to be an appropriate value for design in base and subgrade reinforcement applications. Acknowledgements: The authors would like to acknowledge the financial support of NAUE GmbH & Co. KG for the performance of this study, Geotesting Express for their performance of the testing program, Geocomp Corporation for their contribution to the instrumentation of the test section, and the Georgia Department of Transportation for providing the soil used in this study. Special thanks go to Dr. Allen Marr for his significant input in the interpretation of the data and Mr. Jianren Wang and Mr. Marty Molino for their oversight and technical contributions during the testing program.
Corresponding author: Dr. Barry Christopher, Christopher Consultants, 210 Boxelder Lane, Roswell, GA,
30076, United States of America. Tel: 1 770 641 8696. Email: [email protected].
REFERENCES AASHTO. 1993. AASHTO Guide for Design of Pavement Structures, American Association of State Highway and
Transportation Officials, Washington, D.C. ASTM. 2006. Geosynthetics, Annual Books of ASTM Standards, Volume 4.13, American International, West
Conshohocken, PA. ASTM. 2007. Soil and Rock, Annual Books of ASTM Standards, Volumes 4.08 and 4.09, American International,
West Conshohocken, PA. Berg, R.B., Christopher, B. R. and Perkins, S. 2000.. Geosynthetic Reinforcement of the Aggregate Base/Subbase
Courses of Pavement Structures, prepared for American Association of Highway and Transportation Officials Committee 4E, Prepared by the Geosynthetic Materials Association, 2000, 176 p.
Bender, D.A. and Barenberg. E.J. 1978. Design and behavior of soil-fabric-aggregate systems, Transportation Research Record 671, Transportation Research Board, Washington, D.C., pp. 64-75.
Bertram, G.E. 1940. An Experimental Investigation of Protective Filters, Publications of the Graduate School of Engineering, Harvard University, No. 267, January, 1940.
Christopher, B.R., Cuelho, E.V. and Perkins, S.W. 2008. Development of Geogrid Junction Strength Requirements for Reinforced Roadway Base Design. Proceedings of GeoAmericas 2008, Cancun, Mexico (in publication).
Holtz, R.D., Christopher, B.R. and Berg, R.R. 1998. Geosynthetic Design and Construction Guidelines, U.S. Department of Transportation, Federal Highway Administration, Washington DC, Report No. HI-95-038, 1995 (revised 1998 and 2008), 396 p.
Perkins, S.W. 1999. Geosynthetic Reinforcement of Flexible Pavements: Laboratory Based Pavement Test Sections, Montana Department of Transportation, Helena, Montana, Report No. FHWA/MT-99/8106-1, 140 p.
Perkins, S.W. 2002. Evaluation of Geosynthetic Reinforced Flexible Pavement Systems Using Two Pavement Test Facilities, U.S. Department of Transportation, Federal Highway Administration, Washington, DC, Report No. FHWA/MT-02-008/20040, 120 p.
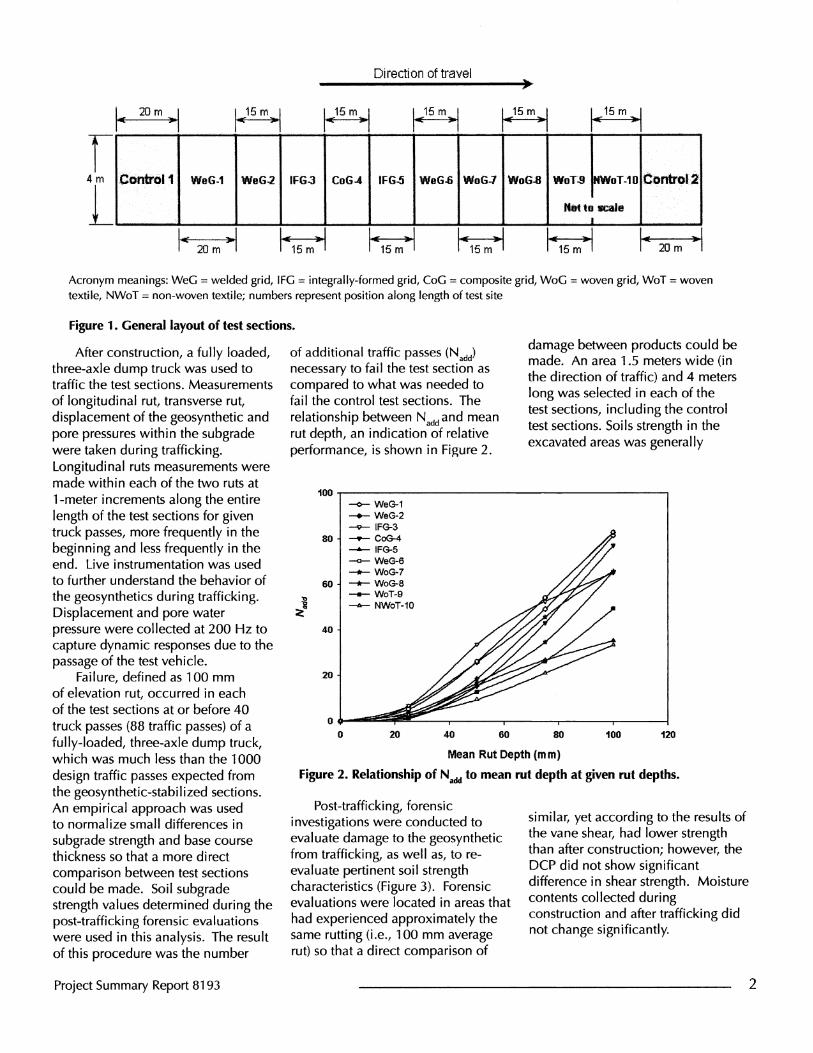
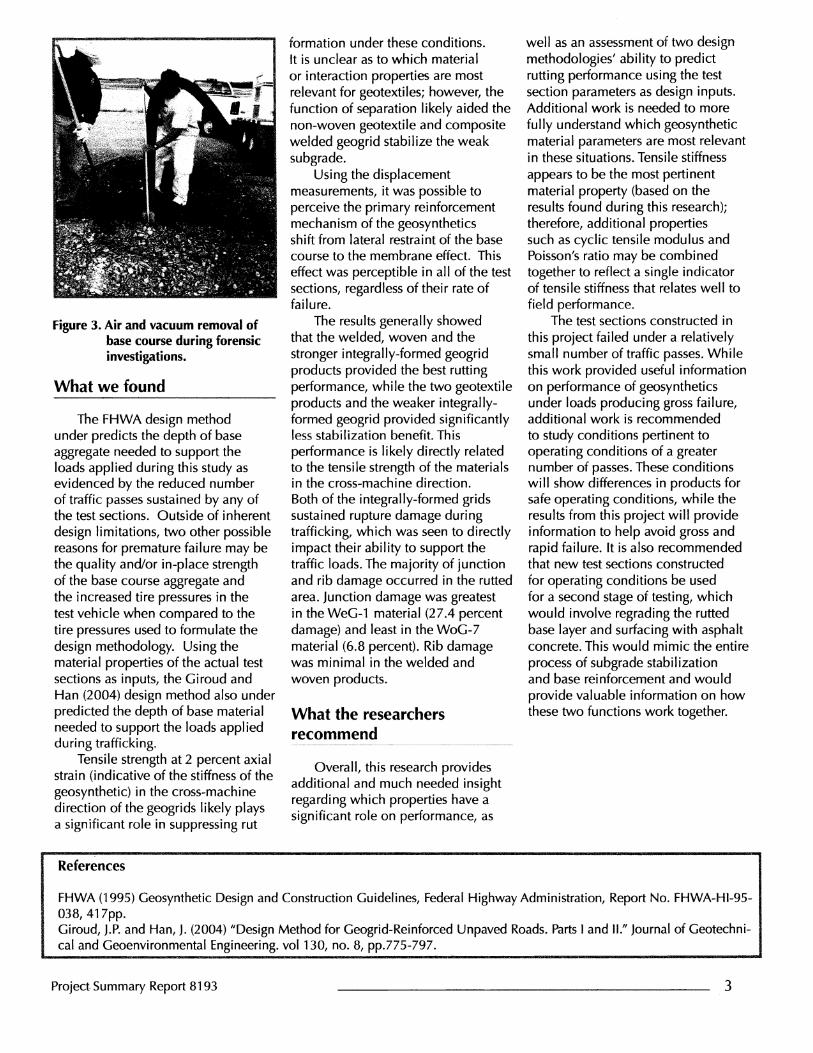

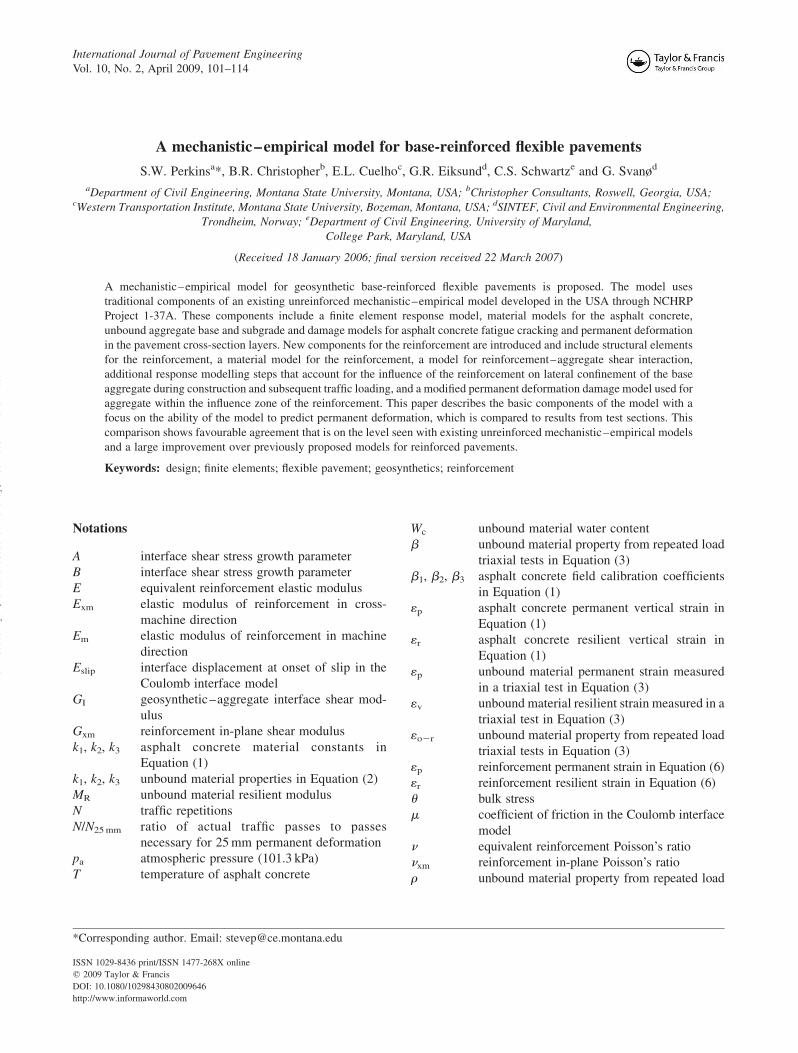
A mechanistic–empirical model for base-reinforced flexible pavements
S.W. Perkinsa*, B.R. Christopherb, E.L. Cuelhoc, G.R. Eiksundd, C.S. Schwartze and G. Svanød
aDepartment of Civil Engineering, Montana State University, Montana, USA; bChristopher Consultants, Roswell, Georgia, USA;cWestern Transportation Institute, Montana State University, Bozeman, Montana, USA; dSINTEF, Civil and Environmental Engineering,
Trondheim, Norway; eDepartment of Civil Engineering, University of Maryland,
College Park, Maryland, USA
(Received 18 January 2006; final version received 22 March 2007)
A mechanistic–empirical model for geosynthetic base-reinforced flexible pavements is proposed. The model uses
traditional components of an existing unreinforced mechanistic–empirical model developed in the USA through NCHRP
Project 1-37A. These components include a finite element response model, material models for the asphalt concrete,
unbound aggregate base and subgrade and damage models for asphalt concrete fatigue cracking and permanent deformation
in the pavement cross-section layers. New components for the reinforcement are introduced and include structural elements
for the reinforcement, a material model for the reinforcement, a model for reinforcement–aggregate shear interaction,
additional response modelling steps that account for the influence of the reinforcement on lateral confinement of the base
aggregate during construction and subsequent traffic loading, and a modified permanent deformation damage model used for
aggregate within the influence zone of the reinforcement. This paper describes the basic components of the model with a
focus on the ability of the model to predict permanent deformation, which is compared to results from test sections. This
comparison shows favourable agreement that is on the level seen with existing unreinforced mechanistic–empirical models
and a large improvement over previously proposed models for reinforced pavements.
Keywords: design; finite elements; flexible pavement; geosynthetics; reinforcement
Notations
A interface shear stress growth parameter
B interface shear stress growth parameter
E equivalent reinforcement elastic modulus
Exm elastic modulus of reinforcement in cross-
machine direction
Em elastic modulus of reinforcement in machine
direction
Eslip interface displacement at onset of slip in the
Coulomb interface model
GI geosynthetic–aggregate interface shear mod-
ulus
Gxm reinforcement in-plane shear modulus
k1, k2, k3 asphalt concrete material constants in
Equation (1)
k1, k2, k3 unbound material properties in Equation (2)
MR unbound material resilient modulus
N traffic repetitions
N/N25 mm ratio of actual traffic passes to passes
necessary for 25 mm permanent deformation
pa atmospheric pressure (101.3 kPa)
T temperature of asphalt concrete
Wc unbound material water content
b unbound material property from repeated load
triaxial tests in Equation (3)
b1, b2, b3 asphalt concrete field calibration coefficients
in Equation (1)
1p asphalt concrete permanent vertical strain in
Equation (1)
1r asphalt concrete resilient vertical strain in
Equation (1)
1p unbound material permanent strain measured
in a triaxial test in Equation (3)
1v unbound material resilient strain measured in a
triaxial test in Equation (3)
1o2r unbound material property from repeated load
triaxial tests in Equation (3)
1p reinforcement permanent strain in Equation (6)
1r reinforcement resilient strain in Equation (6)
u bulk stress
m coefficient of friction in the Coulomb interface
model
n equivalent reinforcement Poisson’s ratio
nxm reinforcement in-plane Poisson’s ratio
r unbound material property from repeated load
ISSN 1029-8436 print/ISSN 1477-268X online
q 2009 Taylor & Francis
DOI: 10.1080/10298430802009646
http://www.informaworld.com
*Corresponding author. Email: [email protected]
International Journal of Pavement Engineering
Vol. 10, No. 2, April 2009, 101–114
Downloaded By: [Montana State University] At: 15:54 2 March 2009
triaxial tests in Equation (3)
toct octahedral shear stress
tr residual shear stress on interface
tt transient shear stress on interface
1. Introduction
A recent survey of US state transportation agencies has
shown that the principal reason for the under-utilisation of
geosynthetics for base-reinforcement of flexible pavements
is due to the absence of a nationally recognised, non-
proprietary design method that can be used to establish cost–
benefit for particular design situations (Perkins et al. 2005a).
Historically acceptable empirical design methods for
conventional unreinforced pavements have proven to be
inadequate for reinforced pavements due to complexities
involving the introduction of new materials for which a
database of performance is not available. Given the complex
nature of a geosynthetic reinforced flexible pavement and the
introduction of a host of new variables associated with the
reinforcement, a procedure based in part on mechanistic
principles is ideally suited and even essential for providing a
design method that is both generic and comprehensive.
Central to mechanistic–empirical design methods are
mechanistic pavement response models and empirical
damage models that relate pavement response to pavement
performance.
Finite element response models previously developed
for geosynthetic base-reinforced flexible pavements
include Burd and Houlsby (1986), Barksdale et al.
(1989), Burd and Brocklehurst (1990), Miura et al. (1990),
Dondi (1994), Wathugala et al. (1996), Perkins and Edens
(2003a,b) and Kwon et al. (2005). The studies of Burd and
Houlsby (1986), Burd and Brocklehurst (1990), Miura
et al. (1990), Dondi (1994) and Wathugala et al. (1996)
showed modest reductions of vertical stress and strain in
the top of the subgrade due to the reinforcement but did not
explore transfer functions needed to extend these measures
to pavement performance. The model developed by Kwon
et al. (2005) was used to demonstrate features associated
with the material model used for the geosynthetic
aggregate interface.
Barksdale et al. (1989) and Perkins and Edens
(2003a,b) developed empirical damage models that
provided a means to relate single cycle load response to
reinforcement benefit, which is commonly defined after
many load cycles have been applied. The method of
Barksdale et al. (1989) appears to predict a relatively small
level of reinforcement benefit. The benefit values predicted
by Perkins and Edens (2003a,b) are comparatively higher
but are still conservative with respect to values observed
in test sections (see Berg et al. 2000, for a summary of
benefits observed in test sections).
This paper describes the development of a mechan-
istic–empirical model for geosynthetic base-reinforced
flexible pavements. The motivation for this study has
come by recognising from previous work (Perkins et al.
2005b) that fundamental mechanisms and processes
involved in reinforced pavements are absent in a simple
static, single load cycle response model analysis like the
types used in the studies cited above. In particular,
processes involving interaction of the reinforcement
with surrounding pavement materials during construction
and compaction of the base aggregate layer, and
during repeated loading by vehicular traffic is absent
from a simple analysis of the reinforced pavement.
These processes lead towards the development of lateral
confinement of the base aggregate layer, which have been
accounted for in this study.
The model uses traditional components of an existing
unreinforced mechanistic–empirical model developed in
the USA through NCHRP Project 1-37A (NCHRP 2004).
These components include a finite element response
model, material models for the asphalt concrete, unbound
aggregate base and subgrade and damage models for
asphalt concrete fatigue cracking and permanent defor-
mation in the pavement cross-section layers. This has been
done to create a reinforced design model that can be
readily incorporated into existing or soon-to-be developed
design guides for unreinforced pavements having a
nationally accepted basis.
New components for the reinforcement are introduced
and include structural elements for the reinforcement,
material models for the reinforcement and the reinforce-
ment aggregate shear interaction, additional response
modelling steps that account for the influence of the
reinforcement on lateral confinement of the base aggregate
during construction and subsequent traffic loading, and a
modified permanent deformation damage model used for
aggregate within the influence zone of the reinforcement.
This paper describes the basic components of the model
with a focus on the ability of the model to predict
permanent deformation, which is compared to results from
test sections.
The next section of this paper (Section 2) describes the
components of the proposed mechanistic–empirical
model for reinforced pavements. Section 3 describes the
test sections to which the model has been compared.
Sections 4 and 5 provide predictions of permanent
deformation for these test sections and compares the
results to the field measurements.
2. Proposed mechanistic–empirical model
Whereas NCHRP Project 1-37A provides a mechanistic–
empirical model for conventional unreinforced flexible
pavements, the purpose of this paper is to describe a
model for base-reinforced flexible pavements. The model
proposed for base-reinforced flexible pavements has
two main components, one dealing with the material and
S.W. Perkins et al.102
Downloaded By: [Montana State University] At: 15:54 2 March 2009
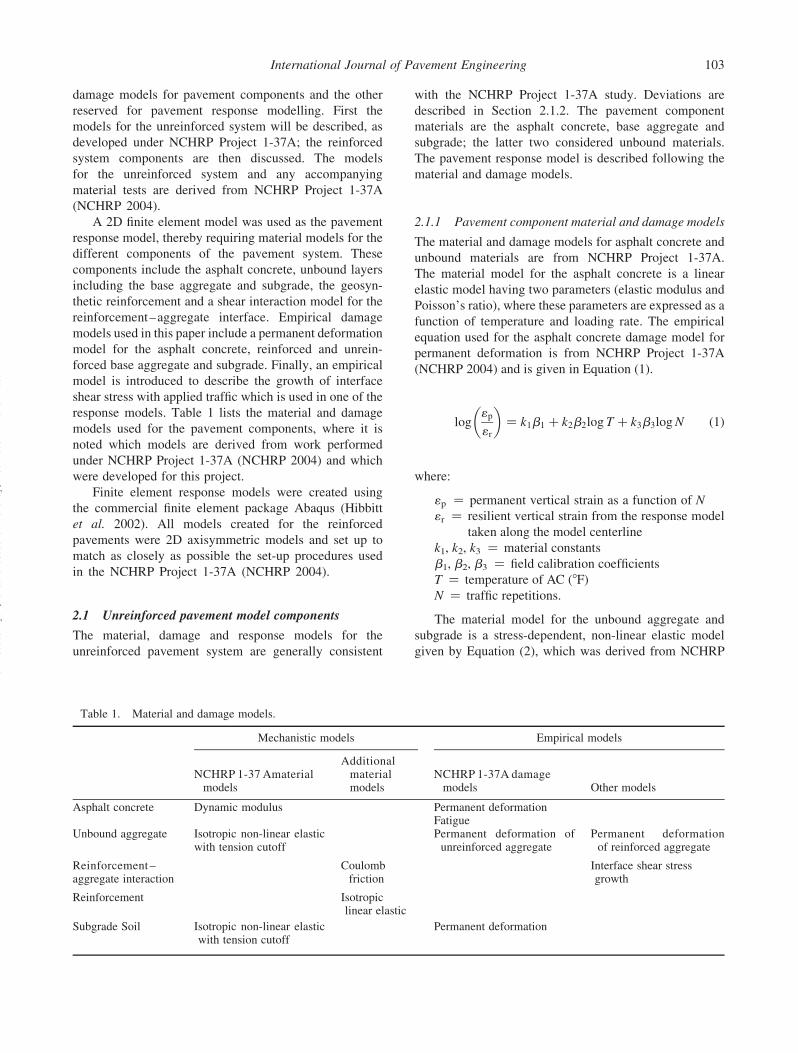
damage models for pavement components and the other
reserved for pavement response modelling. First the
models for the unreinforced system will be described, as
developed under NCHRP Project 1-37A; the reinforced
system components are then discussed. The models
for the unreinforced system and any accompanying
material tests are derived from NCHRP Project 1-37A
(NCHRP 2004).
A 2D finite element model was used as the pavement
response model, thereby requiring material models for the
different components of the pavement system. These
components include the asphalt concrete, unbound layers
including the base aggregate and subgrade, the geosyn-
thetic reinforcement and a shear interaction model for the
reinforcement–aggregate interface. Empirical damage
models used in this paper include a permanent deformation
model for the asphalt concrete, reinforced and unrein-
forced base aggregate and subgrade. Finally, an empirical
model is introduced to describe the growth of interface
shear stress with applied traffic which is used in one of the
response models. Table 1 lists the material and damage
models used for the pavement components, where it is
noted which models are derived from work performed
under NCHRP Project 1-37A (NCHRP 2004) and which
were developed for this project.
Finite element response models were created using
the commercial finite element package Abaqus (Hibbitt
et al. 2002). All models created for the reinforced
pavements were 2D axisymmetric models and set up to
match as closely as possible the set-up procedures used
in the NCHRP Project 1-37A (NCHRP 2004).
2.1 Unreinforced pavement model components
The material, damage and response models for the
unreinforced pavement system are generally consistent
with the NCHRP Project 1-37A study. Deviations are
described in Section 2.1.2. The pavement component
materials are the asphalt concrete, base aggregate and
subgrade; the latter two considered unbound materials.
The pavement response model is described following the
material and damage models.
2.1.1 Pavement component material and damage models
The material and damage models for asphalt concrete and
unbound materials are from NCHRP Project 1-37A.
The material model for the asphalt concrete is a linear
elastic model having two parameters (elastic modulus and
Poisson’s ratio), where these parameters are expressed as a
function of temperature and loading rate. The empirical
equation used for the asphalt concrete damage model for
permanent deformation is from NCHRP Project 1-37A
(NCHRP 2004) and is given in Equation (1).
log1p
1r
� �¼ k1b1 þ k2b2log T þ k3b3logN ð1Þ
where:
1p ¼ permanent vertical strain as a function of N
1r ¼ resilient vertical strain from the response model
taken along the model centerline
k1, k2, k3 ¼ material constants
b1, b2, b3 ¼ field calibration coefficients
T ¼ temperature of AC (8F)
N ¼ traffic repetitions.
The material model for the unbound aggregate and
subgrade is a stress-dependent, non-linear elastic model
given by Equation (2), which was derived from NCHRP
Table 1. Material and damage models.
Mechanistic models Empirical models
NCHRP 1-37 Amaterialmodels
Additionalmaterialmodels
NCHRP 1-37A damagemodels Other models
Asphalt concrete Dynamic modulus Permanent deformationFatigue
Unbound aggregate Isotropic non-linear elasticwith tension cutoff
Permanent deformation ofunreinforced aggregate
Permanent deformationof reinforced aggregate
Reinforcement –aggregate interaction
Coulombfriction
Interface shear stressgrowth
Reinforcement Isotropiclinear elastic
Subgrade Soil Isotropic non-linear elasticwith tension cutoff
Permanent deformation
International Journal of Pavement Engineering 103
Downloaded By: [Montana State University] At: 15:54 2 March 2009
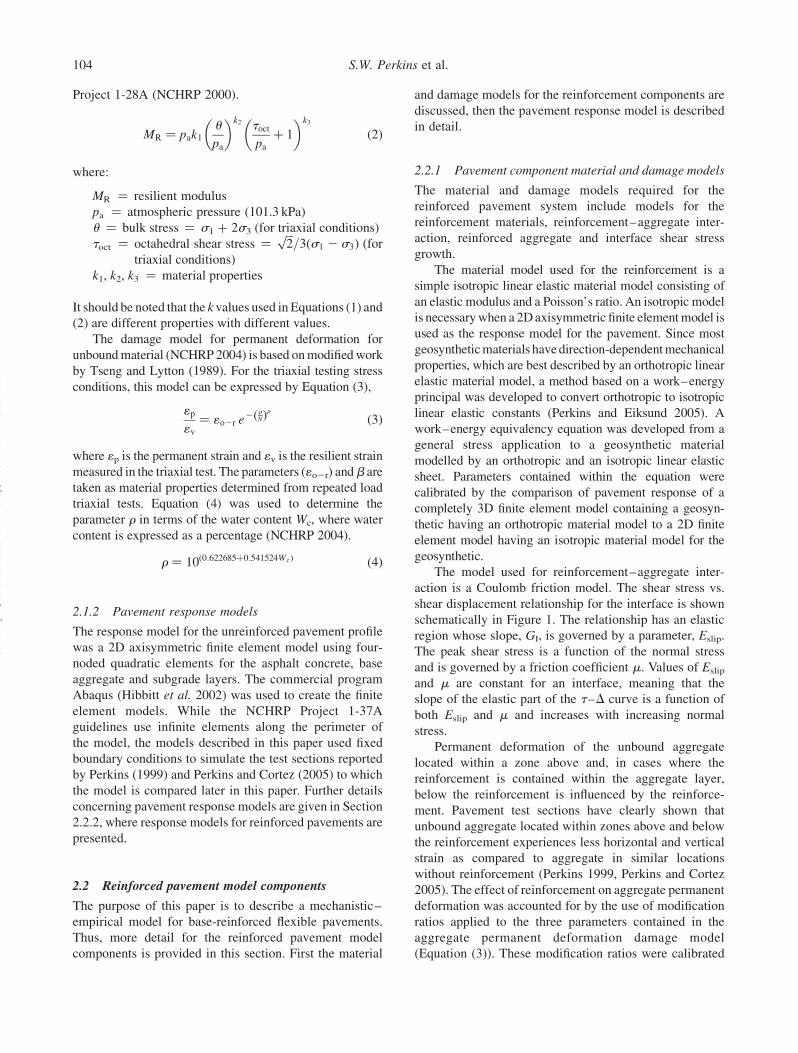
Project 1-28A (NCHRP 2000).
MR ¼ pak1
u
pa
� �k2 toct
pa
þ 1
� �k3
ð2Þ
where:
MR ¼ resilient modulus
pa ¼ atmospheric pressure (101.3 kPa)
u ¼ bulk stress ¼ s1 þ 2s3 (for triaxial conditions)
toct ¼ octahedral shear stress ¼ffiffiffi2
p=3ðs1 2 s3Þ (for
triaxial conditions)
k1, k2, k3 ¼ material properties
It should be noted that the k values used in Equations (1) and
(2) are different properties with different values.
The damage model for permanent deformation for
unbound material (NCHRP 2004) is based on modified work
by Tseng and Lytton (1989). For the triaxial testing stress
conditions, this model can be expressed by Equation (3),
1p
1v
¼ 1o2r e2
r
Nð Þr
ð3Þ
where 1p is the permanent strain and 1v is the resilient strain
measured in the triaxial test. The parameters (1o2r) andb are
taken as material properties determined from repeated load
triaxial tests. Equation (4) was used to determine the
parameter r in terms of the water content Wc, where water
content is expressed as a percentage (NCHRP 2004).
r ¼ 10ð0:622685þ0:541524WcÞ ð4Þ
2.1.2 Pavement response models
The response model for the unreinforced pavement profile
was a 2D axisymmetric finite element model using four-
noded quadratic elements for the asphalt concrete, base
aggregate and subgrade layers. The commercial program
Abaqus (Hibbitt et al. 2002) was used to create the finite
element models. While the NCHRP Project 1-37A
guidelines use infinite elements along the perimeter of
the model, the models described in this paper used fixed
boundary conditions to simulate the test sections reported
by Perkins (1999) and Perkins and Cortez (2005) to which
the model is compared later in this paper. Further details
concerning pavement response models are given in Section
2.2.2, where response models for reinforced pavements are
presented.
2.2 Reinforced pavement model components
The purpose of this paper is to describe a mechanistic–
empirical model for base-reinforced flexible pavements.
Thus, more detail for the reinforced pavement model
components is provided in this section. First the material
and damage models for the reinforcement components are
discussed, then the pavement response model is described
in detail.
2.2.1 Pavement component material and damage models
The material and damage models required for the
reinforced pavement system include models for the
reinforcement materials, reinforcement–aggregate inter-
action, reinforced aggregate and interface shear stress
growth.
The material model used for the reinforcement is a
simple isotropic linear elastic material model consisting of
an elastic modulus and a Poisson’s ratio. An isotropic model
is necessary when a 2D axisymmetric finite element model is
used as the response model for the pavement. Since most
geosynthetic materials have direction-dependent mechanical
properties, which are best described by an orthotropic linear
elastic material model, a method based on a work–energy
principal was developed to convert orthotropic to isotropic
linear elastic constants (Perkins and Eiksund 2005). A
work–energy equivalency equation was developed from a
general stress application to a geosynthetic material
modelled by an orthotropic and an isotropic linear elastic
sheet. Parameters contained within the equation were
calibrated by the comparison of pavement response of a
completely 3D finite element model containing a geosyn-
thetic having an orthotropic material model to a 2D finite
element model having an isotropic material model for the
geosynthetic.
The model used for reinforcement–aggregate inter-
action is a Coulomb friction model. The shear stress vs.
shear displacement relationship for the interface is shown
schematically in Figure 1. The relationship has an elastic
region whose slope, GI, is governed by a parameter, Eslip.
The peak shear stress is a function of the normal stress
and is governed by a friction coefficient m. Values of Eslip
and m are constant for an interface, meaning that the
slope of the elastic part of the t–D curve is a function of
both Eslip and m and increases with increasing normal
stress.
Permanent deformation of the unbound aggregate
located within a zone above and, in cases where the
reinforcement is contained within the aggregate layer,
below the reinforcement is influenced by the reinforce-
ment. Pavement test sections have clearly shown that
unbound aggregate located within zones above and below
the reinforcement experiences less horizontal and vertical
strain as compared to aggregate in similar locations
without reinforcement (Perkins 1999, Perkins and Cortez
2005). The effect of reinforcement on aggregate permanent
deformation was accounted for by the use of modification
ratios applied to the three parameters contained in the
aggregate permanent deformation damage model
(Equation (3)). These modification ratios were calibrated
S.W. Perkins et al.104
Downloaded By: [Montana State University] At: 15:54 2 March 2009

from large-scale repeated-load triaxial tests described later
in this paper.
Experimental data from test sections where geosyn-
thetics have been instrumented with strain gauges (Perkins
1999, Perkins and Cortez 2005) shows the development of
permanent radial strain in the reinforcement with
traffic load applications. Experimental data and theoretical
considerations with simplifying approximations have been
used to show the equality between the ratio of permanent
to resilient strain in the reinforcement to the ratio of
residual to transient shear stress on the reinforcement–
aggregate interface (Perkins and Svanø 2006). This leads
to Equations (5) and (6) describing the residual shear stress
on the interface as a function of traffic passes. This
information is used in subsequent response models to
describe the effect of these residual stresses on the build-
up of confinement in the aggregate as traffic is applied to
the roadway.
tr ¼ tt
1p
1r
ð5Þ
log1p
1r
� �¼ logðAÞ þ B log
N
N25 mm
� �ð6Þ
where:
tr ¼ residual shear stress on interface
tt ¼ transient shear stress on interface
1p ¼ permanent strain in the reinforcement
1r ¼ resilient strain in the reinforcement
N/N25 mm ¼ ratio of actual traffic passes to
passes necessary for 25 mm permanent
deformation.
A, B ¼ geosynthetic strain growth parameters
2.2.2 Pavement response models
The response models for reinforced pavements incorpor-
ates the material models described above and provides
information that is used in the above described damage
models. In order to describe the effects of reinforcement
during compaction and traffic loading, a series of response
models were developed that are used both in succession
and iteratively.
Previously developed finite element response models
for reinforced pavements have typically consisted of a
conventional approach involving the direct inclusion of
structural elements for the reinforcement sheet and contact
surfaces between the reinforcement and surrounding
materials. Perkins et al. (2005b) have shown the inability
of this simple and conventional method for modelling
reinforcement and point to the need for additional
considerations for reinforced response models.
Response model modules were created to simulate
certain construction and traffic loading effects that the
reinforcement has on the pavement system. The non-linear
elastic material model used for the base aggregate and
subgrade imposes certain limitations in rigorously
modelling the effects of the reinforcement. This relatively
simple constitutive model is insufficient for exactly
describing the full sequential process of construction
followed by the application of many repetitions of
vehicular traffic. Since the material model for the base
aggregate shows improved performance through an
increased elastic modulus arising from an increase in
mean stress, the response model modules have been
developed to yield an increase in aggregate confinement
during compaction and traffic loading.
While it is commonly purported that geosynthetic base
reinforcement results from confinement and restraint of the
aggregate, no direct measurements of horizontal stress have
been made to show increased confinement within the
relatively localised zone of the reinforcement. Selig (1987)
made horizontal residual stress measurements in a
laboratory two-layered aggregate/subgrade system and
showed substantial increases in horizontal stress during
simulated traffic loading. Uzan (1985) measured horizontal
residual stresses as high as 14–35 kPa. Given the lack of
direct experimental measurements pertaining to reinforced
systems, the response model modules developed in this
paper showing an increase in horizontal stress in the
aggregate have a reasonable physical basis, yet the
modelling methods used are partially physically artificial
Figure 1. Schematic of the Coulomb interface friction model.
International Journal of Pavement Engineering 105
Downloaded By: [Montana State University] At: 15:54 2 March 2009
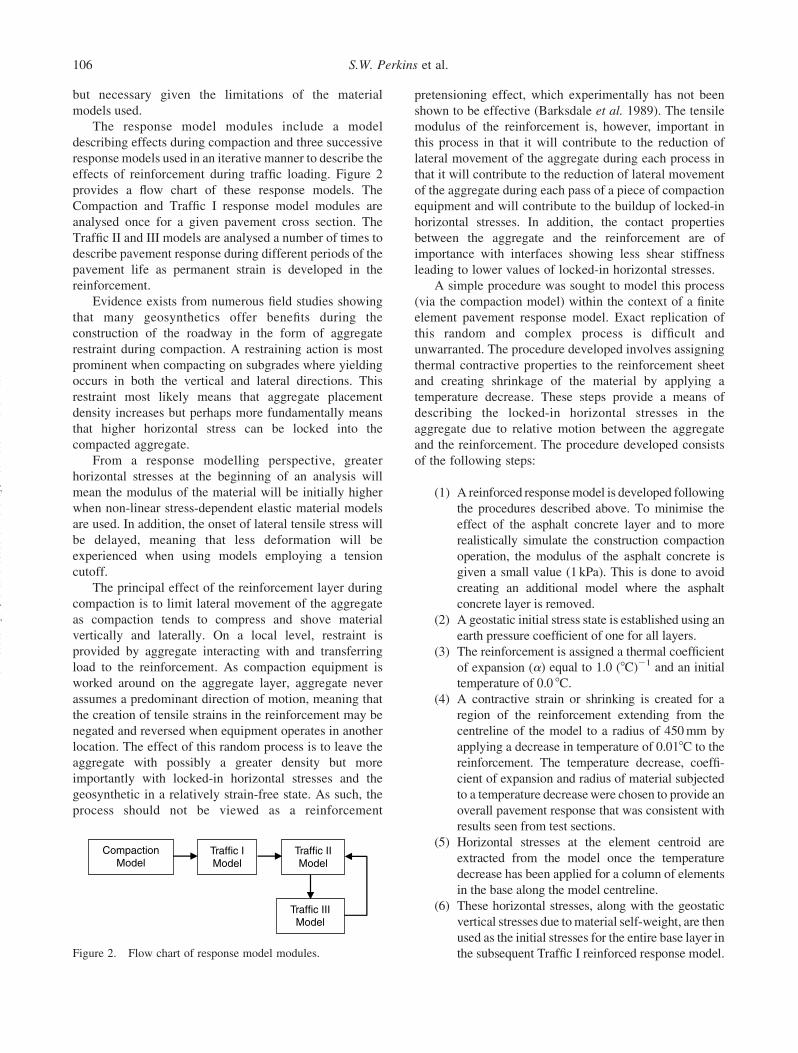
but necessary given the limitations of the material
models used.
The response model modules include a model
describing effects during compaction and three successive
response models used in an iterative manner to describe the
effects of reinforcement during traffic loading. Figure 2
provides a flow chart of these response models. The
Compaction and Traffic I response model modules are
analysed once for a given pavement cross section. The
Traffic II and III models are analysed a number of times to
describe pavement response during different periods of the
pavement life as permanent strain is developed in the
reinforcement.
Evidence exists from numerous field studies showing
that many geosynthetics offer benefits during the
construction of the roadway in the form of aggregate
restraint during compaction. A restraining action is most
prominent when compacting on subgrades where yielding
occurs in both the vertical and lateral directions. This
restraint most likely means that aggregate placement
density increases but perhaps more fundamentally means
that higher horizontal stress can be locked into the
compacted aggregate.
From a response modelling perspective, greater
horizontal stresses at the beginning of an analysis will
mean the modulus of the material will be initially higher
when non-linear stress-dependent elastic material models
are used. In addition, the onset of lateral tensile stress will
be delayed, meaning that less deformation will be
experienced when using models employing a tension
cutoff.
The principal effect of the reinforcement layer during
compaction is to limit lateral movement of the aggregate
as compaction tends to compress and shove material
vertically and laterally. On a local level, restraint is
provided by aggregate interacting with and transferring
load to the reinforcement. As compaction equipment is
worked around on the aggregate layer, aggregate never
assumes a predominant direction of motion, meaning that
the creation of tensile strains in the reinforcement may be
negated and reversed when equipment operates in another
location. The effect of this random process is to leave the
aggregate with possibly a greater density but more
importantly with locked-in horizontal stresses and the
geosynthetic in a relatively strain-free state. As such, the
process should not be viewed as a reinforcement
pretensioning effect, which experimentally has not been
shown to be effective (Barksdale et al. 1989). The tensile
modulus of the reinforcement is, however, important in
this process in that it will contribute to the reduction of
lateral movement of the aggregate during each process in
that it will contribute to the reduction of lateral movement
of the aggregate during each pass of a piece of compaction
equipment and will contribute to the buildup of locked-in
horizontal stresses. In addition, the contact properties
between the aggregate and the reinforcement are of
importance with interfaces showing less shear stiffness
leading to lower values of locked-in horizontal stresses.
A simple procedure was sought to model this process
(via the compaction model) within the context of a finite
element pavement response model. Exact replication of
this random and complex process is difficult and
unwarranted. The procedure developed involves assigning
thermal contractive properties to the reinforcement sheet
and creating shrinkage of the material by applying a
temperature decrease. These steps provide a means of
describing the locked-in horizontal stresses in the
aggregate due to relative motion between the aggregate
and the reinforcement. The procedure developed consists
of the following steps:
(1) A reinforced response model is developed following
the procedures described above. To minimise the
effect of the asphalt concrete layer and to more
realistically simulate the construction compaction
operation, the modulus of the asphalt concrete is
given a small value (1 kPa). This is done to avoid
creating an additional model where the asphalt
concrete layer is removed.
(2) A geostatic initial stress state is established using an
earth pressure coefficient of one for all layers.
(3) The reinforcement is assigned a thermal coefficient
of expansion (a) equal to 1.0 (8C)21 and an initial
temperature of 0.0 8C.
(4) A contractive strain or shrinking is created for a
region of the reinforcement extending from the
centreline of the model to a radius of 450 mm by
applying a decrease in temperature of 0.018C to the
reinforcement. The temperature decrease, coeffi-
cient of expansion and radius of material subjected
to a temperature decrease were chosen to provide an
overall pavement response that was consistent with
results seen from test sections.
(5) Horizontal stresses at the element centroid are
extracted from the model once the temperature
decrease has been applied for a column of elements
in the base along the model centreline.
(6) These horizontal stresses, along with the geostatic
vertical stresses due to material self-weight, are then
used as the initial stresses for the entire base layer in
the subsequent Traffic I reinforced response model.Figure 2. Flow chart of response model modules.
S.W. Perkins et al.106
Downloaded By: [Montana State University] At: 15:54 2 March 2009

Step 4 creates tensile load in the reinforcement and an
increase in lateral stress in the aggregate through shear
interaction between the reinforcement and the aggregate.
This procedure essentially models in reverse and in a
simplified way the complex effect of aggregate being shoved
laterally back and forth. The introduction of a tensile strain
in the reinforcement through a temperature decrease should
be viewed as an artifact of the approach taken to describe
the effect of aggregate moving relative to the reinforcement.
In addition to an increased horizontal stress due to
compaction of aggregate on top of a layer of reinforce-
ment, lateral confinement of the aggregate base layer
develops during vehicular loading of the roadway.
Additional lateral confinement is due to the development
of interface shear stresses between the aggregate and the
reinforcement, which in turn transfers load to the
reinforcement. Perkins (1999) has provided data showing
the development of tensile strain in the reinforcement
during traffic loading while Perkins and Svanø (2006)
have described how this is related to horizontal stress
increase in the base layer.
As a cycle of traffic load is applied, there is both a
transient or cyclic shear stress and a residual shear stress
that exists when the traffic load is removed. The residual
interface shear stress continues to grow as repeated traffic
loads are applied, meaning that the lateral confinement of
the aggregate base layer becomes greater with increasing
traffic load repetitions. The Traffic I response model
module is used to provide data for the transient interface
shear stress distribution (tt) between the reinforcement and
the surrounding materials, which is then used in Equation
(5). The Traffic I response model module is a reinforced
model having an identical cross-section and material
properties as the compaction model with the following
exceptions:
a. The asphalt concrete layer is given elastic properties
pertaining to the design problem.
b. Pavement load is applied as a load step.
c. Initial stresses for the aggregate base layer are set
equal to those determined from the compaction model.
From this model, the interface shear stresses for both
interface surfaces are extracted when full pavement load is
applied. These interface shear stress distributions are
summed and taken as the values for tt as a function of model
radius. The shear stresses for both interfaces are summed
and used for tt in Equation (5) since both sets of shear
stresses lead to the development of strain in the
reinforcement.
The resulting shear stress distribution is then scaled by
selected values of 1p/1r leading to new shear stress
distribution curves representing different periods in the life
of the pavement. Equivalent nodal forces are then
calculated from the distribution of the shear stresses over
the contributory area of each node and used in the
subsequent Traffic II model to examine the effects of this
shear stress distribution.
The Traffic II response model module gives the
elevated horizontal stresses in the base due to compaction
effects and for the additional locked in stresses due to the
increasing tensile strains in the reinforcement with
increasing traffic. This is accomplished by applying the
nodal forces due to the residual interface shear stresses for
a particular pavement life period from the Traffic I model
to an unreinforced model having an identical cross-section
and pavement layer properties.
The Traffic II model starts with an initial state of stress
that comes from that determined in the Compaction model.
In the unreinforced Traffic II model, the nodes having the
same locations as those in the reinforced model are
common nodes for material above and below this
horizontal line. The full value of the nodal force is
therefore used since it is resisted by material above and
below the level of the nodes. Once these nodal forces have
been applied, the horizontal stresses at element centroids
for the column of base aggregate elements along the model
centreline are extracted. These horizontal stresses along
with the geostatic vertical stresses are then taken as initial
stresses in the subsequent and final Traffic III response
model module.
The analysis using the Traffic II model is repeated for
the number of 1p/1r ratios selected to determine equivalent
nodal forces. The Traffic II analysis provides a means of
assessing the effect of residual interface shear stresses on
lateral stresses developed in the base aggregate layer for
different periods in the life of the pavement within the
context of a finite element response model.
The Traffic III model uses the same pavement response
model as the Traffic I model but uses the horizontal
stresses determined from the Traffic II model along with
the geostatic vertical stresses as initial stresses. This model
is run for the same number of times as the Traffic II model
evaluations. From each model, the distribution of vertical
strain vs. depth along the model centreline is extracted and
used in conjunction with the damage models for
permanent deformation to determine permanent surface
deformation for the load cycles that apply to the period for
which the 1p/1r ratios apply. A cumulative surface
deformation curve is then computed by taking deformation
that occurs for each period and accumulating it over the
number of analysis periods.
3. Material properties and model parametersfor unreinforced and reinforced models
3.1 Comparison test sections
Test sections constructed at Montana State University
(MSU) (Perkins 1999) and at the US Army Corp of
Engineers Cold Regions Research and Engineering
International Journal of Pavement Engineering 107
Downloaded By: [Montana State University] At: 15:54 2 March 2009
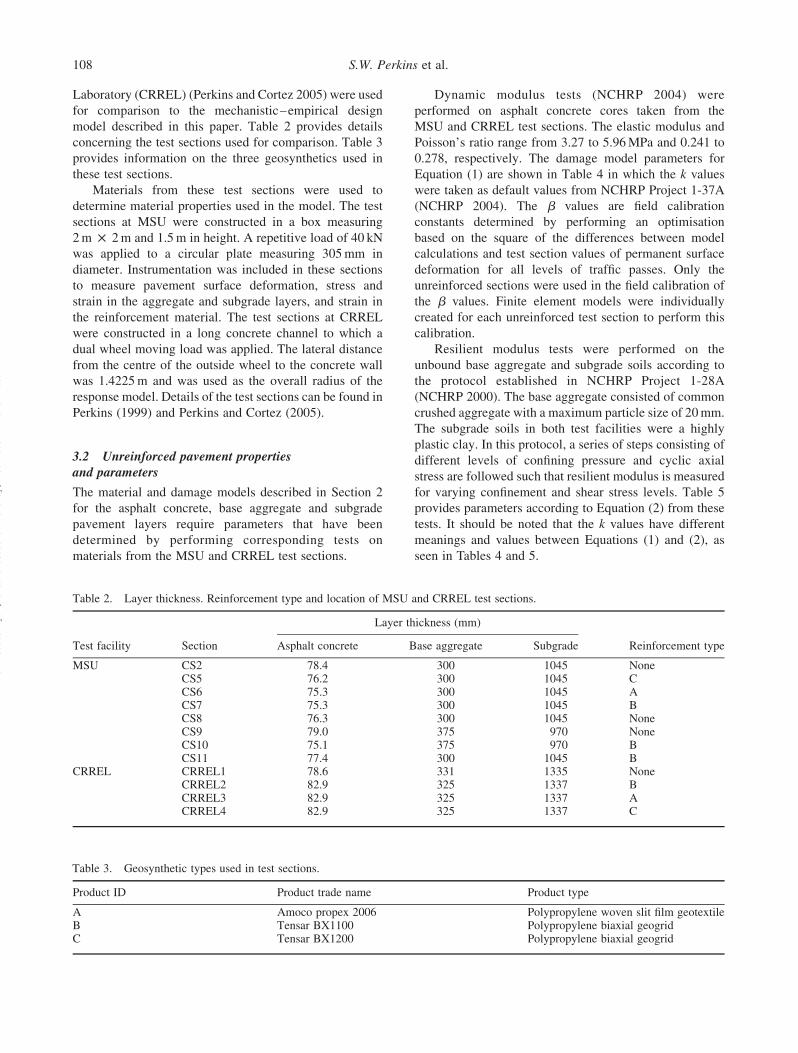
Laboratory (CRREL) (Perkins and Cortez 2005) were used
for comparison to the mechanistic–empirical design
model described in this paper. Table 2 provides details
concerning the test sections used for comparison. Table 3
provides information on the three geosynthetics used in
these test sections.
Materials from these test sections were used to
determine material properties used in the model. The test
sections at MSU were constructed in a box measuring
2 m £ 2 m and 1.5 m in height. A repetitive load of 40 kN
was applied to a circular plate measuring 305 mm in
diameter. Instrumentation was included in these sections
to measure pavement surface deformation, stress and
strain in the aggregate and subgrade layers, and strain in
the reinforcement material. The test sections at CRREL
were constructed in a long concrete channel to which a
dual wheel moving load was applied. The lateral distance
from the centre of the outside wheel to the concrete wall
was 1.4225 m and was used as the overall radius of the
response model. Details of the test sections can be found in
Perkins (1999) and Perkins and Cortez (2005).
3.2 Unreinforced pavement propertiesand parameters
The material and damage models described in Section 2
for the asphalt concrete, base aggregate and subgrade
pavement layers require parameters that have been
determined by performing corresponding tests on
materials from the MSU and CRREL test sections.
Dynamic modulus tests (NCHRP 2004) were
performed on asphalt concrete cores taken from the
MSU and CRREL test sections. The elastic modulus and
Poisson’s ratio range from 3.27 to 5.96 MPa and 0.241 to
0.278, respectively. The damage model parameters for
Equation (1) are shown in Table 4 in which the k values
were taken as default values from NCHRP Project 1-37A
(NCHRP 2004). The b values are field calibration
constants determined by performing an optimisation
based on the square of the differences between model
calculations and test section values of permanent surface
deformation for all levels of traffic passes. Only the
unreinforced sections were used in the field calibration of
the b values. Finite element models were individually
created for each unreinforced test section to perform this
calibration.
Resilient modulus tests were performed on the
unbound base aggregate and subgrade soils according to
the protocol established in NCHRP Project 1-28A
(NCHRP 2000). The base aggregate consisted of common
crushed aggregate with a maximum particle size of 20 mm.
The subgrade soils in both test facilities were a highly
plastic clay. In this protocol, a series of steps consisting of
different levels of confining pressure and cyclic axial
stress are followed such that resilient modulus is measured
for varying confinement and shear stress levels. Table 5
provides parameters according to Equation (2) from these
tests. It should be noted that the k values have different
meanings and values between Equations (1) and (2), as
seen in Tables 4 and 5.
Table 2. Layer thickness. Reinforcement type and location of MSU and CRREL test sections.
Layer thickness (mm)
Test facility Section Asphalt concrete Base aggregate Subgrade Reinforcement type
MSU CS2 78.4 300 1045 NoneCS5 76.2 300 1045 CCS6 75.3 300 1045 ACS7 75.3 300 1045 BCS8 76.3 300 1045 NoneCS9 79.0 375 970 NoneCS10 75.1 375 970 BCS11 77.4 300 1045 B
CRREL CRREL1 78.6 331 1335 NoneCRREL2 82.9 325 1337 BCRREL3 82.9 325 1337 ACRREL4 82.9 325 1337 C
Table 3. Geosynthetic types used in test sections.
Product ID Product trade name Product type
A Amoco propex 2006 Polypropylene woven slit film geotextileB Tensar BX1100 Polypropylene biaxial geogridC Tensar BX1200 Polypropylene biaxial geogrid
S.W. Perkins et al.108
Downloaded By: [Montana State University] At: 15:54 2 March 2009
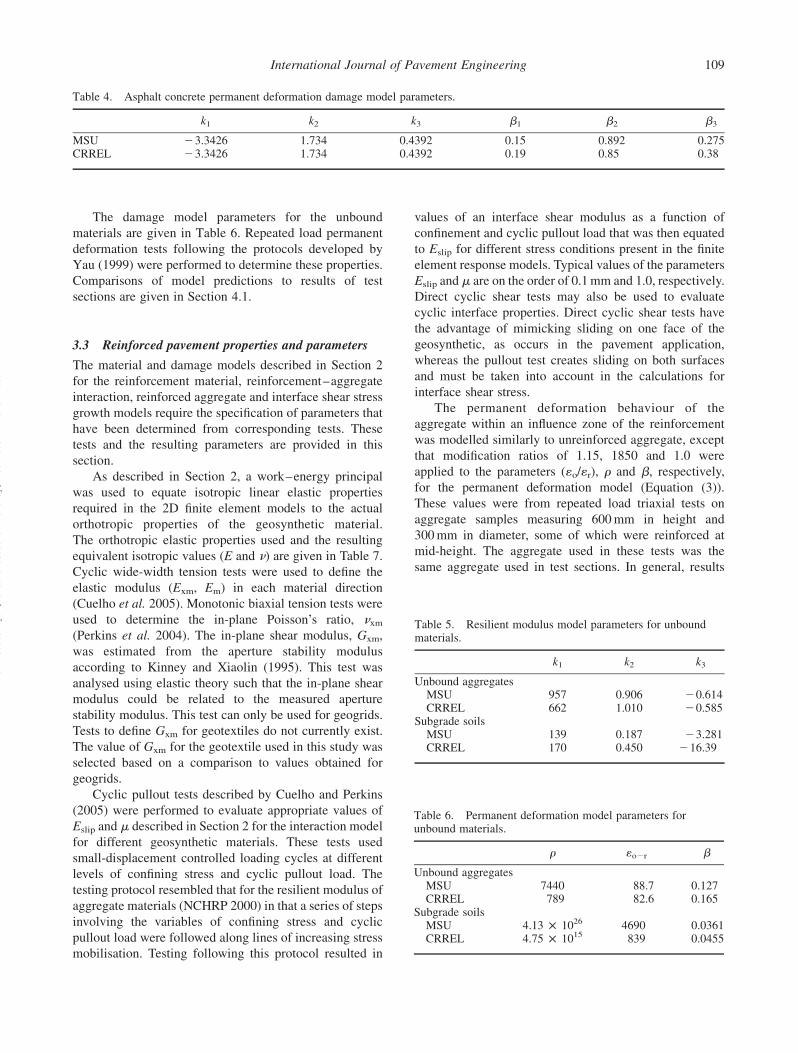
The damage model parameters for the unbound
materials are given in Table 6. Repeated load permanent
deformation tests following the protocols developed by
Yau (1999) were performed to determine these properties.
Comparisons of model predictions to results of test
sections are given in Section 4.1.
3.3 Reinforced pavement properties and parameters
The material and damage models described in Section 2
for the reinforcement material, reinforcement–aggregate
interaction, reinforced aggregate and interface shear stress
growth models require the specification of parameters that
have been determined from corresponding tests. These
tests and the resulting parameters are provided in this
section.
As described in Section 2, a work–energy principal
was used to equate isotropic linear elastic properties
required in the 2D finite element models to the actual
orthotropic properties of the geosynthetic material.
The orthotropic elastic properties used and the resulting
equivalent isotropic values (E and n) are given in Table 7.
Cyclic wide-width tension tests were used to define the
elastic modulus (Exm, Em) in each material direction
(Cuelho et al. 2005). Monotonic biaxial tension tests were
used to determine the in-plane Poisson’s ratio, nxm
(Perkins et al. 2004). The in-plane shear modulus, Gxm,
was estimated from the aperture stability modulus
according to Kinney and Xiaolin (1995). This test was
analysed using elastic theory such that the in-plane shear
modulus could be related to the measured aperture
stability modulus. This test can only be used for geogrids.
Tests to define Gxm for geotextiles do not currently exist.
The value of Gxm for the geotextile used in this study was
selected based on a comparison to values obtained for
geogrids.
Cyclic pullout tests described by Cuelho and Perkins
(2005) were performed to evaluate appropriate values of
Eslip and m described in Section 2 for the interaction model
for different geosynthetic materials. These tests used
small-displacement controlled loading cycles at different
levels of confining stress and cyclic pullout load. The
testing protocol resembled that for the resilient modulus of
aggregate materials (NCHRP 2000) in that a series of steps
involving the variables of confining stress and cyclic
pullout load were followed along lines of increasing stress
mobilisation. Testing following this protocol resulted in
values of an interface shear modulus as a function of
confinement and cyclic pullout load that was then equated
to Eslip for different stress conditions present in the finite
element response models. Typical values of the parameters
Eslip and m are on the order of 0.1 mm and 1.0, respectively.
Direct cyclic shear tests may also be used to evaluate
cyclic interface properties. Direct cyclic shear tests have
the advantage of mimicking sliding on one face of the
geosynthetic, as occurs in the pavement application,
whereas the pullout test creates sliding on both surfaces
and must be taken into account in the calculations for
interface shear stress.
The permanent deformation behaviour of the
aggregate within an influence zone of the reinforcement
was modelled similarly to unreinforced aggregate, except
that modification ratios of 1.15, 1850 and 1.0 were
applied to the parameters (1o/1r), r and b, respectively,
for the permanent deformation model (Equation (3)).
These values were from repeated load triaxial tests on
aggregate samples measuring 600 mm in height and
300 mm in diameter, some of which were reinforced at
mid-height. The aggregate used in these tests was the
same aggregate used in test sections. In general, results
Table 5. Resilient modulus model parameters for unboundmaterials.
k1 k2 k3
Unbound aggregatesMSU 957 0.906 20.614CRREL 662 1.010 20.585
Subgrade soilsMSU 139 0.187 23.281CRREL 170 0.450 216.39
Table 6. Permanent deformation model parameters forunbound materials.
r 1o2r b
Unbound aggregatesMSU 7440 88.7 0.127CRREL 789 82.6 0.165
Subgrade soilsMSU 4.13 £ 1026 4690 0.0361CRREL 4.75 £ 1015 839 0.0455
Table 4. Asphalt concrete permanent deformation damage model parameters.
k1 k2 k3 b1 b2 b3
MSU 23.3426 1.734 0.4392 0.15 0.892 0.275CRREL 23.3426 1.734 0.4392 0.19 0.85 0.38
International Journal of Pavement Engineering 109
Downloaded By: [Montana State University] At: 15:54 2 March 2009
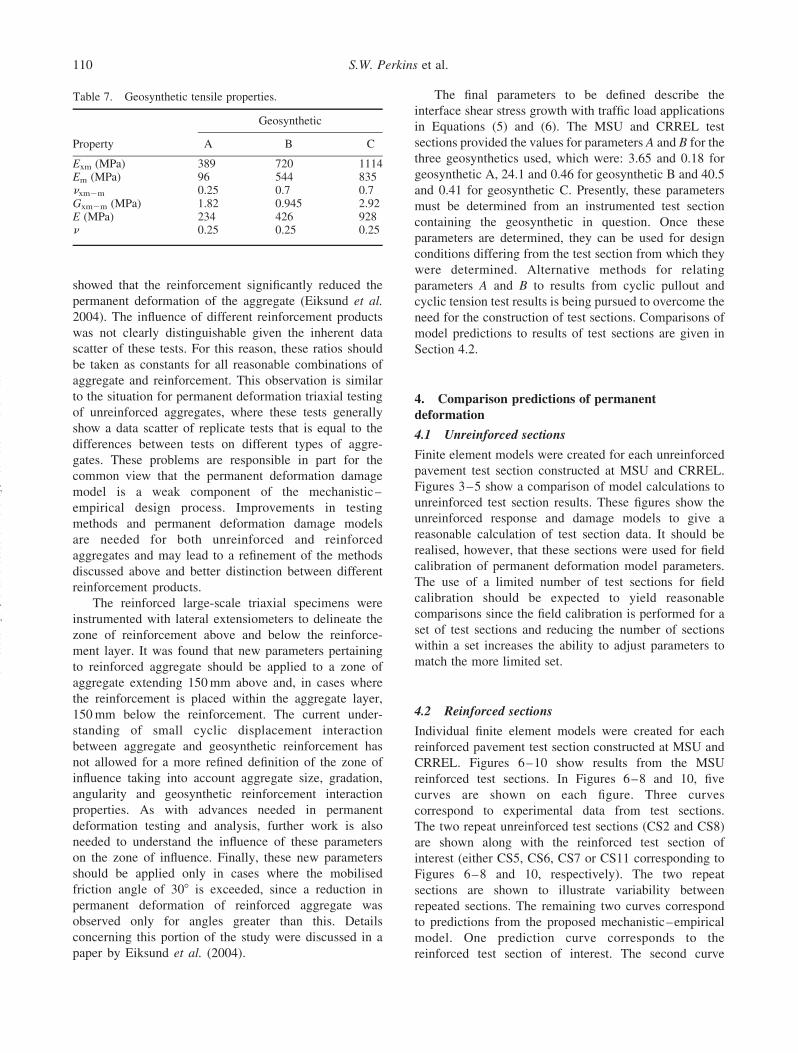
showed that the reinforcement significantly reduced the
permanent deformation of the aggregate (Eiksund et al.
2004). The influence of different reinforcement products
was not clearly distinguishable given the inherent data
scatter of these tests. For this reason, these ratios should
be taken as constants for all reasonable combinations of
aggregate and reinforcement. This observation is similar
to the situation for permanent deformation triaxial testing
of unreinforced aggregates, where these tests generally
show a data scatter of replicate tests that is equal to the
differences between tests on different types of aggre-
gates. These problems are responsible in part for the
common view that the permanent deformation damage
model is a weak component of the mechanistic–
empirical design process. Improvements in testing
methods and permanent deformation damage models
are needed for both unreinforced and reinforced
aggregates and may lead to a refinement of the methods
discussed above and better distinction between different
reinforcement products.
The reinforced large-scale triaxial specimens were
instrumented with lateral extensiometers to delineate the
zone of reinforcement above and below the reinforce-
ment layer. It was found that new parameters pertaining
to reinforced aggregate should be applied to a zone of
aggregate extending 150 mm above and, in cases where
the reinforcement is placed within the aggregate layer,
150 mm below the reinforcement. The current under-
standing of small cyclic displacement interaction
between aggregate and geosynthetic reinforcement has
not allowed for a more refined definition of the zone of
influence taking into account aggregate size, gradation,
angularity and geosynthetic reinforcement interaction
properties. As with advances needed in permanent
deformation testing and analysis, further work is also
needed to understand the influence of these parameters
on the zone of influence. Finally, these new parameters
should be applied only in cases where the mobilised
friction angle of 308 is exceeded, since a reduction in
permanent deformation of reinforced aggregate was
observed only for angles greater than this. Details
concerning this portion of the study were discussed in a
paper by Eiksund et al. (2004).
The final parameters to be defined describe the
interface shear stress growth with traffic load applications
in Equations (5) and (6). The MSU and CRREL test
sections provided the values for parameters A and B for the
three geosynthetics used, which were: 3.65 and 0.18 for
geosynthetic A, 24.1 and 0.46 for geosynthetic B and 40.5
and 0.41 for geosynthetic C. Presently, these parameters
must be determined from an instrumented test section
containing the geosynthetic in question. Once these
parameters are determined, they can be used for design
conditions differing from the test section from which they
were determined. Alternative methods for relating
parameters A and B to results from cyclic pullout and
cyclic tension test results is being pursued to overcome the
need for the construction of test sections. Comparisons of
model predictions to results of test sections are given in
Section 4.2.
4. Comparison predictions of permanent
deformation
4.1 Unreinforced sections
Finite element models were created for each unreinforced
pavement test section constructed at MSU and CRREL.
Figures 3–5 show a comparison of model calculations to
unreinforced test section results. These figures show the
unreinforced response and damage models to give a
reasonable calculation of test section data. It should be
realised, however, that these sections were used for field
calibration of permanent deformation model parameters.
The use of a limited number of test sections for field
calibration should be expected to yield reasonable
comparisons since the field calibration is performed for a
set of test sections and reducing the number of sections
within a set increases the ability to adjust parameters to
match the more limited set.
4.2 Reinforced sections
Individual finite element models were created for each
reinforced pavement test section constructed at MSU and
CRREL. Figures 6–10 show results from the MSU
reinforced test sections. In Figures 6–8 and 10, five
curves are shown on each figure. Three curves
correspond to experimental data from test sections.
The two repeat unreinforced test sections (CS2 and CS8)
are shown along with the reinforced test section of
interest (either CS5, CS6, CS7 or CS11 corresponding to
Figures 6–8 and 10, respectively). The two repeat
sections are shown to illustrate variability between
repeated sections. The remaining two curves correspond
to predictions from the proposed mechanistic–empirical
model. One prediction curve corresponds to the
reinforced test section of interest. The second curve
Table 7. Geosynthetic tensile properties.
Geosynthetic
Property A B C
Exm (MPa) 389 720 1114Em (MPa) 96 544 835nxm2m 0.25 0.7 0.7Gxm2m (MPa) 1.82 0.945 2.92E (MPa) 234 426 928n 0.25 0.25 0.25
S.W. Perkins et al.110
Downloaded By: [Montana State University] At: 15:54 2 March 2009
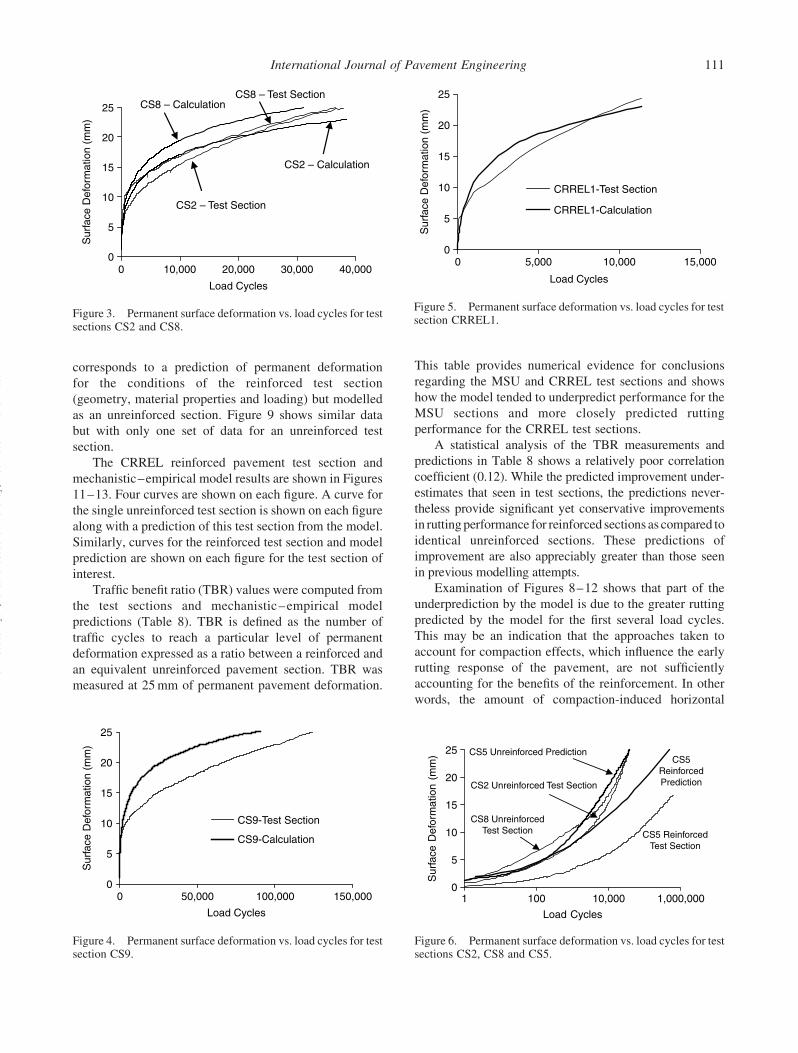
corresponds to a prediction of permanent deformation
for the conditions of the reinforced test section
(geometry, material properties and loading) but modelled
as an unreinforced section. Figure 9 shows similar data
but with only one set of data for an unreinforced test
section.
The CRREL reinforced pavement test section and
mechanistic–empirical model results are shown in Figures
11–13. Four curves are shown on each figure. A curve for
the single unreinforced test section is shown on each figure
along with a prediction of this test section from the model.
Similarly, curves for the reinforced test section and model
prediction are shown on each figure for the test section of
interest.
Traffic benefit ratio (TBR) values were computed from
the test sections and mechanistic–empirical model
predictions (Table 8). TBR is defined as the number of
traffic cycles to reach a particular level of permanent
deformation expressed as a ratio between a reinforced and
an equivalent unreinforced pavement section. TBR was
measured at 25 mm of permanent pavement deformation.
This table provides numerical evidence for conclusions
regarding the MSU and CRREL test sections and shows
how the model tended to underpredict performance for the
MSU sections and more closely predicted rutting
performance for the CRREL test sections.
A statistical analysis of the TBR measurements and
predictions in Table 8 shows a relatively poor correlation
coefficient (0.12). While the predicted improvement under-
estimates that seen in test sections, the predictions never-
theless provide significant yet conservative improvements
in rutting performance for reinforced sections as compared to
identical unreinforced sections. These predictions of
improvement are also appreciably greater than those seen
in previous modelling attempts.
Examination of Figures 8–12 shows that part of the
underprediction by the model is due to the greater rutting
predicted by the model for the first several load cycles.
This may be an indication that the approaches taken to
account for compaction effects, which influence the early
rutting response of the pavement, are not sufficiently
accounting for the benefits of the reinforcement. In other
words, the amount of compaction-induced horizontal
Figure 5. Permanent surface deformation vs. load cycles for testsection CRREL1.
Figure 3. Permanent surface deformation vs. load cycles for testsections CS2 and CS8.
Figure 4. Permanent surface deformation vs. load cycles for testsection CS9.
Figure 6. Permanent surface deformation vs. load cycles for testsections CS2, CS8 and CS5.
International Journal of Pavement Engineering 111
Downloaded By: [Montana State University] At: 15:54 2 March 2009
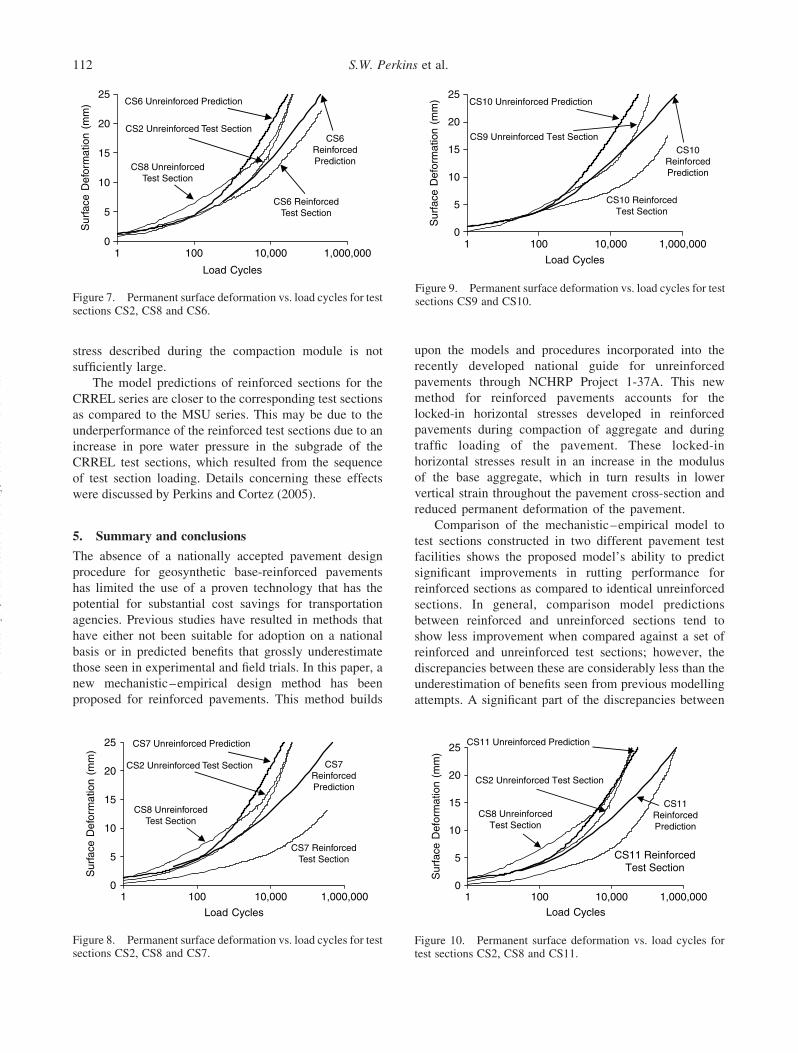
stress described during the compaction module is not
sufficiently large.
The model predictions of reinforced sections for the
CRREL series are closer to the corresponding test sections
as compared to the MSU series. This may be due to the
underperformance of the reinforced test sections due to an
increase in pore water pressure in the subgrade of the
CRREL test sections, which resulted from the sequence
of test section loading. Details concerning these effects
were discussed by Perkins and Cortez (2005).
5. Summary and conclusions
The absence of a nationally accepted pavement design
procedure for geosynthetic base-reinforced pavements
has limited the use of a proven technology that has the
potential for substantial cost savings for transportation
agencies. Previous studies have resulted in methods that
have either not been suitable for adoption on a national
basis or in predicted benefits that grossly underestimate
those seen in experimental and field trials. In this paper, a
new mechanistic–empirical design method has been
proposed for reinforced pavements. This method builds
upon the models and procedures incorporated into the
recently developed national guide for unreinforced
pavements through NCHRP Project 1-37A. This new
method for reinforced pavements accounts for the
locked-in horizontal stresses developed in reinforced
pavements during compaction of aggregate and during
traffic loading of the pavement. These locked-in
horizontal stresses result in an increase in the modulus
of the base aggregate, which in turn results in lower
vertical strain throughout the pavement cross-section and
reduced permanent deformation of the pavement.
Comparison of the mechanistic–empirical model to
test sections constructed in two different pavement test
facilities shows the proposed model’s ability to predict
significant improvements in rutting performance for
reinforced sections as compared to identical unreinforced
sections. In general, comparison model predictions
between reinforced and unreinforced sections tend to
show less improvement when compared against a set of
reinforced and unreinforced test sections; however, the
discrepancies between these are considerably less than the
underestimation of benefits seen from previous modelling
attempts. A significant part of the discrepancies between
Figure 9. Permanent surface deformation vs. load cycles for testsections CS9 and CS10.Figure 7. Permanent surface deformation vs. load cycles for test
sections CS2, CS8 and CS6.
Figure 8. Permanent surface deformation vs. load cycles for testsections CS2, CS8 and CS7.
Figure 10. Permanent surface deformation vs. load cycles fortest sections CS2, CS8 and CS11.
S.W. Perkins et al.112
Downloaded By: [Montana State University] At: 15:54 2 March 2009
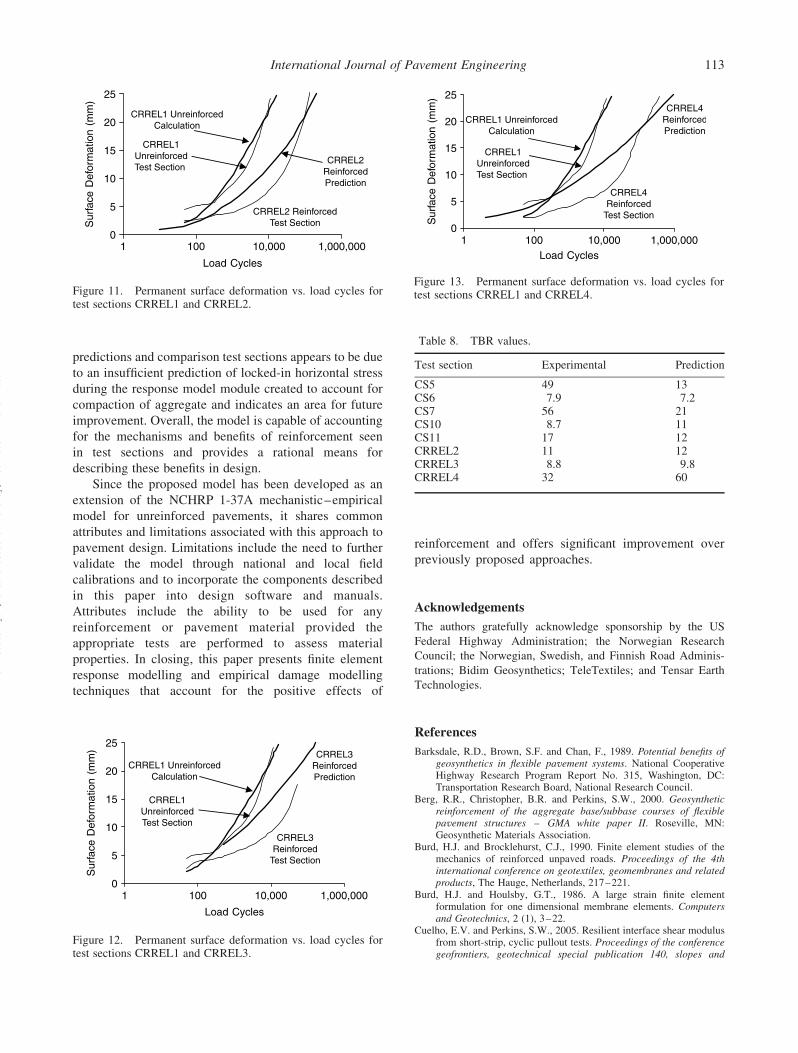
predictions and comparison test sections appears to be due
to an insufficient prediction of locked-in horizontal stress
during the response model module created to account for
compaction of aggregate and indicates an area for future
improvement. Overall, the model is capable of accounting
for the mechanisms and benefits of reinforcement seen
in test sections and provides a rational means for
describing these benefits in design.
Since the proposed model has been developed as an
extension of the NCHRP 1-37A mechanistic–empirical
model for unreinforced pavements, it shares common
attributes and limitations associated with this approach to
pavement design. Limitations include the need to further
validate the model through national and local field
calibrations and to incorporate the components described
in this paper into design software and manuals.
Attributes include the ability to be used for any
reinforcement or pavement material provided the
appropriate tests are performed to assess material
properties. In closing, this paper presents finite element
response modelling and empirical damage modelling
techniques that account for the positive effects of
reinforcement and offers significant improvement over
previously proposed approaches.
Acknowledgements
The authors gratefully acknowledge sponsorship by the US
Federal Highway Administration; the Norwegian Research
Council; the Norwegian, Swedish, and Finnish Road Adminis-
trations; Bidim Geosynthetics; TeleTextiles; and Tensar Earth
Technologies.
References
Barksdale, R.D., Brown, S.F. and Chan, F., 1989. Potential benefits ofgeosynthetics in flexible pavement systems. National CooperativeHighway Research Program Report No. 315, Washington, DC:Transportation Research Board, National Research Council.
Berg, R.R., Christopher, B.R. and Perkins, S.W., 2000. Geosyntheticreinforcement of the aggregate base/subbase courses of flexiblepavement structures – GMA white paper II. Roseville, MN:Geosynthetic Materials Association.
Burd, H.J. and Brocklehurst, C.J., 1990. Finite element studies of themechanics of reinforced unpaved roads. Proceedings of the 4thinternational conference on geotextiles, geomembranes and relatedproducts, The Hauge, Netherlands, 217–221.
Burd, H.J. and Houlsby, G.T., 1986. A large strain finite elementformulation for one dimensional membrane elements. Computersand Geotechnics, 2 (1), 3–22.
Cuelho, E.V. and Perkins, S.W., 2005. Resilient interface shear modulusfrom short-strip, cyclic pullout tests. Proceedings of the conferencegeofrontiers, geotechnical special publication 140, slopes and
Figure 13. Permanent surface deformation vs. load cycles fortest sections CRREL1 and CRREL4.
Table 8. TBR values.
Test section Experimental Prediction
CS5 49 13CS6 7.9 7.2CS7 56 21CS10 8.7 11CS11 17 12CRREL2 11 12CRREL3 8.8 9.8CRREL4 32 60
Figure 11. Permanent surface deformation vs. load cycles fortest sections CRREL1 and CRREL2.
Figure 12. Permanent surface deformation vs. load cycles fortest sections CRREL1 and CRREL3.
International Journal of Pavement Engineering 113
Downloaded By: [Montana State University] At: 15:54 2 March 2009
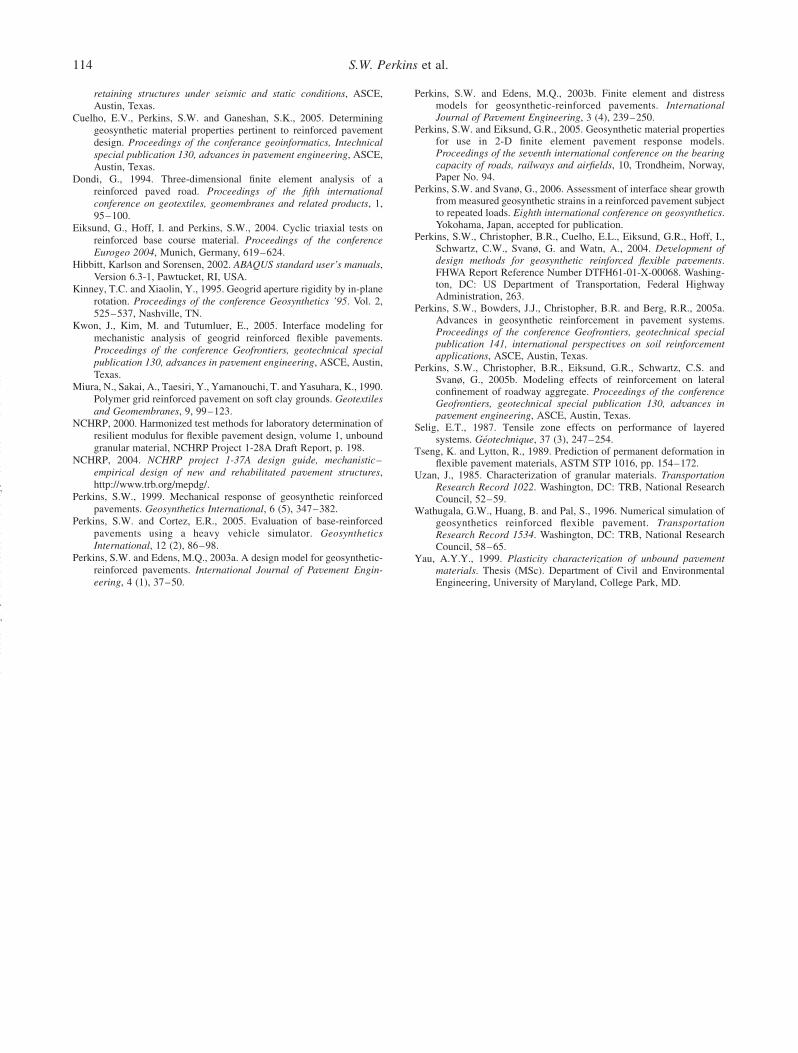
retaining structures under seismic and static conditions, ASCE,Austin, Texas.
Cuelho, E.V., Perkins, S.W. and Ganeshan, S.K., 2005. Determininggeosynthetic material properties pertinent to reinforced pavementdesign. Proceedings of the conferance geoinformatics, Intechnicalspecial publication 130, advances in pavement engineering, ASCE,Austin, Texas.
Dondi, G., 1994. Three-dimensional finite element analysis of areinforced paved road. Proceedings of the fifth internationalconference on geotextiles, geomembranes and related products, 1,95–100.
Eiksund, G., Hoff, I. and Perkins, S.W., 2004. Cyclic triaxial tests onreinforced base course material. Proceedings of the conferenceEurogeo 2004, Munich, Germany, 619–624.
Hibbitt, Karlson and Sorensen, 2002. ABAQUS standard user’s manuals,Version 6.3-1, Pawtucket, RI, USA.
Kinney, T.C. and Xiaolin, Y., 1995. Geogrid aperture rigidity by in-planerotation. Proceedings of the conference Geosynthetics ’95. Vol. 2,525–537, Nashville, TN.
Kwon, J., Kim, M. and Tutumluer, E., 2005. Interface modeling formechanistic analysis of geogrid reinforced flexible pavements.Proceedings of the conference Geofrontiers, geotechnical specialpublication 130, advances in pavement engineering, ASCE, Austin,Texas.
Miura, N., Sakai, A., Taesiri, Y., Yamanouchi, T. and Yasuhara, K., 1990.Polymer grid reinforced pavement on soft clay grounds. Geotextilesand Geomembranes, 9, 99–123.
NCHRP, 2000. Harmonized test methods for laboratory determination ofresilient modulus for flexible pavement design, volume 1, unboundgranular material, NCHRP Project 1-28A Draft Report, p. 198.
NCHRP, 2004. NCHRP project 1-37A design guide, mechanistic–empirical design of new and rehabilitated pavement structures,http://www.trb.org/mepdg/.
Perkins, S.W., 1999. Mechanical response of geosynthetic reinforcedpavements. Geosynthetics International, 6 (5), 347–382.
Perkins, S.W. and Cortez, E.R., 2005. Evaluation of base-reinforcedpavements using a heavy vehicle simulator. GeosyntheticsInternational, 12 (2), 86–98.
Perkins, S.W. and Edens, M.Q., 2003a. A design model for geosynthetic-reinforced pavements. International Journal of Pavement Engin-eering, 4 (1), 37–50.
Perkins, S.W. and Edens, M.Q., 2003b. Finite element and distressmodels for geosynthetic-reinforced pavements. InternationalJournal of Pavement Engineering, 3 (4), 239–250.
Perkins, S.W. and Eiksund, G.R., 2005. Geosynthetic material propertiesfor use in 2-D finite element pavement response models.Proceedings of the seventh international conference on the bearingcapacity of roads, railways and airfields, 10, Trondheim, Norway,Paper No. 94.
Perkins, S.W. and Svanø, G., 2006. Assessment of interface shear growthfrom measured geosynthetic strains in a reinforced pavement subjectto repeated loads. Eighth international conference on geosynthetics.Yokohama, Japan, accepted for publication.
Perkins, S.W., Christopher, B.R., Cuelho, E.L., Eiksund, G.R., Hoff, I.,Schwartz, C.W., Svanø, G. and Watn, A., 2004. Development ofdesign methods for geosynthetic reinforced flexible pavements.FHWA Report Reference Number DTFH61-01-X-00068. Washing-ton, DC: US Department of Transportation, Federal HighwayAdministration, 263.
Perkins, S.W., Bowders, J.J., Christopher, B.R. and Berg, R.R., 2005a.Advances in geosynthetic reinforcement in pavement systems.Proceedings of the conference Geofrontiers, geotechnical specialpublication 141, international perspectives on soil reinforcementapplications, ASCE, Austin, Texas.
Perkins, S.W., Christopher, B.R., Eiksund, G.R., Schwartz, C.S. andSvanø, G., 2005b. Modeling effects of reinforcement on lateralconfinement of roadway aggregate. Proceedings of the conferenceGeofrontiers, geotechnical special publication 130, advances inpavement engineering, ASCE, Austin, Texas.
Selig, E.T., 1987. Tensile zone effects on performance of layeredsystems. Geotechnique, 37 (3), 247–254.
Tseng, K. and Lytton, R., 1989. Prediction of permanent deformation inflexible pavement materials, ASTM STP 1016, pp. 154–172.
Uzan, J., 1985. Characterization of granular materials. TransportationResearch Record 1022. Washington, DC: TRB, National ResearchCouncil, 52–59.
Wathugala, G.W., Huang, B. and Pal, S., 1996. Numerical simulation ofgeosynthetics reinforced flexible pavement. TransportationResearch Record 1534. Washington, DC: TRB, National ResearchCouncil, 58–65.
Yau, A.Y.Y., 1999. Plasticity characterization of unbound pavementmaterials. Thesis (MSc). Department of Civil and EnvironmentalEngineering, University of Maryland, College Park, MD.
S.W. Perkins et al.114
Downloaded By: [Montana State University] At: 15:54 2 March 2009