Embed Size (px)
Citation preview

Research ArticleA Detection Algorithm for the BOC Signal Based onQuadrature Channel Correlation
Bo Qian Guolei Zheng and Yongxin Feng
School of Information Science and Engineering Shenyang Ligong University Shenyang 110159 China
Correspondence should be addressed to Yongxin Feng fengyongxin263net
Received 31 October 2017 Revised 11 February 2018 Accepted 22 February 2018 Published 1 April 2018
Academic Editor Iickho Song
Copyright copy 2018 Bo Qian et al This is an open access article distributed under the Creative Commons Attribution License whichpermits unrestricted use distribution and reproduction in any medium provided the original work is properly cited
In order to solve the problem of detecting a BOC signal which uses a long-period pseudo random sequence an algorithm ispresented based on quadrature channel correlation The quadrature channel correlation method eliminates the autocorrelationcomponent of the carrier wave allowing for the extraction of the absolute autocorrelation peaks of the BOC sequence If the samelag difference and height difference exist for the adjacent peaks the BOC signal can be detected effectively using a statistical analysisof themultiple autocorrelation peaksThe simulation results show that the interference of the carrier wave component is eliminatedand the autocorrelation peaks of the BOC sequence are obtained effectively without demodulationThe BOC signal can be detectedeffectively when the SNR is greater thanminus12 dBThe detection ability can be improved further by increasing the number of samplingpoints The higher the ratio of the square wave subcarrier speed to the pseudo random sequence speed is the greater the detectionability is with a lower SNR The algorithm presented in this paper is superior to the algorithm based on the spectral correlation
1 Introduction
The Binary Offset Carrier (BOC) signal is used in the globalnavigation satellite system (GNSS) and is characterized bymultiple peaks in its autocorrelation function and spectrumsplitting [1ndash3] By using a square wave to modulate again thesynchronization precision of the BOC signal is improved andthe interference of the same-frequency signals is decreased[4] On the other hand there are multiple side-peaks aroundthe main peak of autocorrelation function of the BOCsequence thus causing the ambiguity problem To deal withthe problem several unambiguous techniques have beenproposed [5 6] A novel cancellation technique of correlationside-peaks is proposed by employing a combination of thesubcorrelations making up the BOC autocorrelation [6]
The pseudo random sequence of the BOC signal has thecharacteristics of pseudo randomness and infinite periodsin a short time which is used in secret communicationsTherefore it is difficult to detect a BOC signal under non-cooperative conditions In addition by utilizing the directsequence spread spectrum (DSSS) the BOC signal can betransmitted under a negative signal to noise ratio (SNR)
and because the anti-interception ability is strong it is moredifficult to detect the signal
To date new methods of BOC signal recognition andparameter estimation have been proposed [7ndash11] The detec-tion methods are based on spectral correlation [7ndash9] and themethods for parameter estimation are based on autocorre-lation [10 11] The basis of the spectral correlation methodsis based on the cyclostationary characteristic of the BOCsignal so that the parameters of the carrier square wave andpseudo random sequence can be estimated However whenthe pseudo random sequence has an infinite period in a shorttime the methods based on spectral correlation cannot workeffectively
The autocorrelation methods are based on the character-istics of themultiple autocorrelation peaks of the BOC signalBased on demodulating the BOC signal the parameters canbe estimated effectively based on how the BOC signal cor-relates with the multiple autocorrelation peaks Consideringthat the BOC signal is transmitted under a negative SNR insecret communications demodulation is not easily achievedtherefore it is difficult to estimate the parameters in a real-lifeenvironment
HindawiJournal of Electrical and Computer EngineeringVolume 2018 Article ID 2436472 10 pageshttpsdoiorg10115520182436472
2 Journal of Electrical and Computer Engineering
times107minus15 minus1 minus05 0 05 1 15 2minus2
Frequency (Hz)
minus120
minus110
minus100
minus90
minus80
minus70
minus60
minus50
minus40
Pow
er sp
ectr
al d
ensit
y (d
BH
z)
BOC (15 25)BOC (10 10)BOC (10 5)
BOC (5 2)DS (10)
Figure 1 Power spectral density of the BOC signals
In this paper an algorithm for detecting the BOC signal ispresented using a long-period pseudo random sequenceTheautocorrelation component of the carrier wave in the BOCsignal is eliminated based on quadrature channel correlationBy detecting the autocorrelation peaks the BOC signal canbe detected
The outline of this paper is as follows In Section 2we study the characteristics of the BOC signal Section 3describes the analysis of the characteristics of the multipleautocorrelation peaks for the BOC signal and the algorithmfor detecting the BOC signal Section 4 provides simulationresults demonstrating the performance of the algorithmFinally Section 5 presents our conclusions and final com-ments
2 Characteristics of the BOC Signal
The BOC signal 119884(119905) modulated by BPSK is given by
119884 (119905) = 119860 sdot 119863 (119905) 119875 (119905) 119878119888 (119905) cos (2120587119891119905 + 120593) (1)
where 119860 is the carrier amplitude 119863(119905) is the baseband data119875(119905) is the pseudo random sequence 119878119888(119905) is the square wave
119891 is the carrier frequency and 120593 is the phase The frequencyof 119875(119905) is 119891119888 and the frequency of 119878119888(119905) is 119891119904
Firstly the spread spectrum sequence is obtained by XORbaseband data with the pseudo random sequence Then thespread spectrum sequence is XORed again with a squarewave to generate the BOC sequence Finally the BOC signalis generated by modulating the BOC sequence to the maincarrier The BOC signal is denoted as BOC (119873119904 119873119888) where119873119904 means the ratio of 119891119904 to the reference frequency 119891base and119873119888 means the ratio of 119891119888 to the reference frequency 119891base InGNSS systems the reference frequency 119891base = 1023MHz
The normalized power spectral density (PSD) of the BOCsignal can be expressed as [12]
119866BOC(119891119878119891119888) (119891)
=
119891119888 [ sin (1205871198912119891119904) sin (120587119891119891119888)120587119891 cos (1205871198912119891119904) ]2
119899 is an odd number
119891119888 [ sin (1205871198912119891119904) cos (120587119891119891119888)120587119891 cos (1205871198912119891119904) ]2
119899 is an even number(2)
where
119899 = 2119891119904119891119888 (3)
The distribution of the normalized power spectral densityfor the BOC signals is shown in Figure 1 where DS (10) isthe normalized power spectral density of the DSSS signals inwhich the frequency of the pseudo random sequence is tentimes as much as 119891base
As shown in Figure 1 the main lobe energy of theBOC signal is split into two lobes located at plusmn119891119904 fromthe central frequency The main lobe energy of the DSSSsignal is concentrated in the central frequencyTherefore theBOC signal and the DSSS signal can be transmitted on thesame frequency at the same time without interfering witheach other and the bandwidth efficiency is greatly improvedBecause of the wider bandwidth the BOC signal has a greaterantijamming capability than the DSSS signal Furthermore itis difficult to estimate the carrier frequency of the BOC signalbecause the two lobes are not located in the carrier frequency
The autocorrelation function of the BOC sequence can beexpressed as [13]
119877BOC (120591) =
1 120591 = 0(minus1)119897minus1 [119899 minus (119897 minus 1)]
119899 + (minus1)119897 [4119891119904 minus 119891119888 (2119897 minus 1)] sdot (120591 minus 119897 minus 12119891119904 ) (119897 minus 1)
2119891119904 lt 120591 le 11989721198911199040 lt 119897 le 119899 minus 1 119897 is integer
(minus1)119897 [119899 minus |119897|]119899 + (minus1)|119897|minus1 [4119891119904 minus 119891119888 (2 |119897| minus 1)] sdot (120591 + |119897|
2119891119904) |119897|2119891119904 lt 120591 le (|119897| minus 1)
2119891119904minus119899 + 1 le 119897 lt 0 119897 is integerminus 1119873 119879119888 lt |120591| le (119873 minus 1) 119879119888
(4)
Journal of Electrical and Computer Engineering 3
minus1
minus05
0
05
1
Auto
corr
elat
ion
func
tion
minus40 minus20 0 20 40 60minus60
BOC (15 25)BOC (10 10)BOC (10 5)
BOC (5 2)DS (10)
Code delay (sampling points)
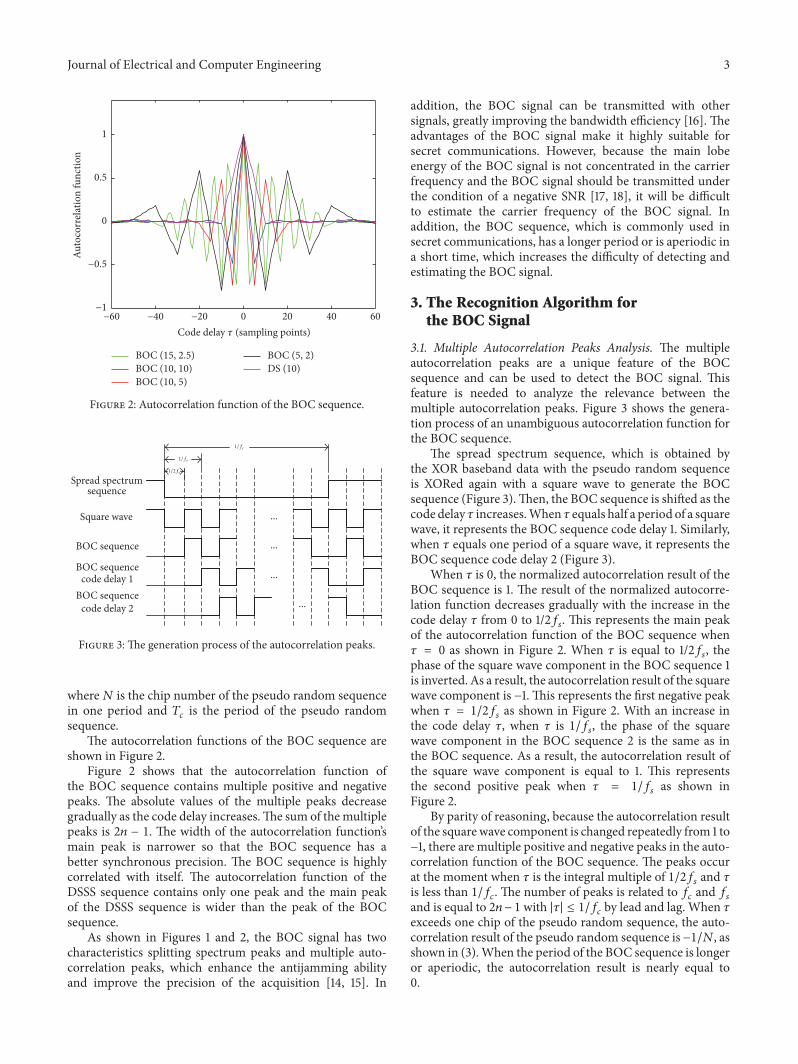
Figure 2 Autocorrelation function of the BOC sequence
Spread spectrumsequence
Square wave
BOC sequence
BOC sequencecode delay 1
BOC sequencecode delay 2
1fc
1fs
12fs
Figure 3 The generation process of the autocorrelation peaks
where119873 is the chip number of the pseudo random sequencein one period and 119879119888 is the period of the pseudo randomsequence
The autocorrelation functions of the BOC sequence areshown in Figure 2
Figure 2 shows that the autocorrelation function ofthe BOC sequence contains multiple positive and negativepeaks The absolute values of the multiple peaks decreasegradually as the code delay increasesThe sum of themultiplepeaks is 2119899 minus 1 The width of the autocorrelation functionrsquosmain peak is narrower so that the BOC sequence has abetter synchronous precision The BOC sequence is highlycorrelated with itself The autocorrelation function of theDSSS sequence contains only one peak and the main peakof the DSSS sequence is wider than the peak of the BOCsequence
As shown in Figures 1 and 2 the BOC signal has twocharacteristics splitting spectrum peaks and multiple auto-correlation peaks which enhance the antijamming abilityand improve the precision of the acquisition [14 15] In
addition the BOC signal can be transmitted with othersignals greatly improving the bandwidth efficiency [16] Theadvantages of the BOC signal make it highly suitable forsecret communications However because the main lobeenergy of the BOC signal is not concentrated in the carrierfrequency and the BOC signal should be transmitted underthe condition of a negative SNR [17 18] it will be difficultto estimate the carrier frequency of the BOC signal Inaddition the BOC sequence which is commonly used insecret communications has a longer period or is aperiodic ina short time which increases the difficulty of detecting andestimating the BOC signal
3 The Recognition Algorithm forthe BOC Signal
31 Multiple Autocorrelation Peaks Analysis The multipleautocorrelation peaks are a unique feature of the BOCsequence and can be used to detect the BOC signal Thisfeature is needed to analyze the relevance between themultiple autocorrelation peaks Figure 3 shows the genera-tion process of an unambiguous autocorrelation function forthe BOC sequence
The spread spectrum sequence which is obtained bythe XOR baseband data with the pseudo random sequenceis XORed again with a square wave to generate the BOCsequence (Figure 3)Then the BOC sequence is shifted as thecode delay 120591 increasesWhen 120591 equals half a period of a squarewave it represents the BOC sequence code delay 1 Similarlywhen 120591 equals one period of a square wave it represents theBOC sequence code delay 2 (Figure 3)
When 120591 is 0 the normalized autocorrelation result of theBOC sequence is 1 The result of the normalized autocorre-lation function decreases gradually with the increase in thecode delay 120591 from 0 to 12119891119904 This represents the main peakof the autocorrelation function of the BOC sequence when120591 = 0 as shown in Figure 2 When 120591 is equal to 12119891119904 thephase of the square wave component in the BOC sequence 1is inverted As a result the autocorrelation result of the squarewave component is minus1 This represents the first negative peakwhen 120591 = 12119891119904 as shown in Figure 2 With an increase inthe code delay 120591 when 120591 is 1119891119904 the phase of the squarewave component in the BOC sequence 2 is the same as inthe BOC sequence As a result the autocorrelation result ofthe square wave component is equal to 1 This representsthe second positive peak when 120591 = 1119891119904 as shown inFigure 2
By parity of reasoning because the autocorrelation resultof the squarewave component is changed repeatedly from 1 tominus1 there are multiple positive and negative peaks in the auto-correlation function of the BOC sequence The peaks occurat the moment when 120591 is the integral multiple of 12119891119904 and 120591is less than 1119891119888 The number of peaks is related to 119891119888 and 119891119904and is equal to 2119899 minus 1 with |120591| le 1119891119888 by lead and lag When 120591exceeds one chip of the pseudo random sequence the auto-correlation result of the pseudo random sequence is minus1119873 asshown in (3)When the period of the BOC sequence is longeror aperiodic the autocorrelation result is nearly equal to0
4 Journal of Electrical and Computer Engineering
times
times
LPF
LPF
times
times
times
times +
+
minus
Y (t)
2
cIM(2fFI=Ft + local)
SI(t)
SQ (t)
RII()
RQI()
RIQ()
RQQ()int
int
int
int
SUM()
SUB()
|( )12|| R()|
( )2
( )2
Figure 4 The overall process of the quadrature channel correlation
By analyzing the generation process of the autocorrela-tion function for the BOC sequence the values of the auto-correlation peaks can be expressed by
ℎ (119897) = (minus1)119897 (119899 minus |119897|)119899 119897 = 0 plusmn1 plusmn119899 minus 1 (5)
where ℎ(119897) is the value of the 119897-th peaks and 119897 is the sequencenumber of the peaks
When 119897 is equal to 0 ℎ(0) is the value of the main peak119897 is positive when 120591 gt 0 otherwise it is negative The valuesof the peaks decrease gradually as |119897| increases Further it isseen from (4) that the height difference between the 119897-th peakand the (119897 + 1)-th peak can be represented as
|Δℎ| = 10038161003816100381610038161003816100381610038161003816(119899 minus |119897|)
119899 minus (119899 minus |119897 + 1|)119899
10038161003816100381610038161003816100381610038161003816 =1119899 (6)
where Δℎ is the height differenceBecause the peaks always occur at the moment when 120591 is
the integral multiple of 12119891119904 the lag difference between the119897-th peak and the (119897+1)-th peak is 12119891119904 It can be representedas
Δ120591 = 12119891119904 (7)
where Δ120591 is the lag differenceAs shown in (5) and (6) the heights and lags of the
multiple autocorrelation peaks are related to 12119891119904 Thereason is mainly due to the second modulation by the squarewave Therefore we can detect the BOC signal by detectingmultiple autocorrelation peaks of the BOC sequence If therelevant rules shown in (5) and (6) are satisfied the BOCsignal will be detected
32 Quadrature Channel Correlation Because the BOC sig-nal is transmitted under the condition of a negative SNR andthere is a carrier wave component in the BOC signal it isdifficult to obtain multiple autocorrelation peaks of the BOCsequence
An improvedmethod based onquadrature channel corre-lation is presented to obtain multiple autocorrelation peaks
The overall process of the quadrature channel correlation isshown Figure 4
The received BOC signal can be expressed as
1198841015840 (119905) = 119860 sdot 1198751015840 (119905) 119878119888 (119905) cos (2120587119891119905 + 120593) + 119899 (119905) (8)
where1198751015840(119905) is the spread spectrum sequence1198751015840(119905) = 119863(119905)119875(119905)and 119899(119905) is the zero-mean gauss white noise with a two-sidedpower spectral density1198730
Firstly 1198841015840(119905) is multiplied by cos(2120587119891local119905 + 120593local) andsin(2120587119891local119905+120593local) respectively where119891local is the frequencyof the local oscillator and 120593local is the phase of the localoscillator
Next the high-frequency components are filtered by alow-pass filter We obtain
119878119868 (119905) = 1198602 sdot 1198751015840 (119905) 119878119888 (119905) cos [2120587Δ119891119905 + Δ120593] + 119899119868 (119905) (9)
119878119876 (119905) = minus1198602 sdot 1198751015840 (119905) 119878119888 (119905) sin [2120587Δ119891119905 + Δ120593] + 119899119876 (119905) (10)
where Δ119891 = 119891minus119891local Δ120593 = 120593minus120593local and 119899119868(119905) and 119899119876(119905) arethe noise components in the 119868 and 119876 channels after filtering
Subsequently the autocorrelation functions of 119878119868(119905) and119878119876(119905) are calculated with the code delay 120591 We take 119878119868(119905) asan example to study the autocorrelation and cross-correlationfunctions The autocorrelation function of 119878119868(119905) can beexpressed as
119877119868119868 (120591) = 119877119878119868119878119868 (120591) + 119877119878119868119899119868 (120591) + 119877119899119868119899119868 (120591) (11)
where 119877119878119868119878119868(120591) is the autocorrelation component of the BOCsignal 119877119878119868119899119868(120591) is the cross-correlation component betweenthe BOC signal and the noise and 119877119899119868119899119868(120591) is the autocorre-lation component of the noise
Because there is no correlation between the noise and theBOC signal119877119878119868119899119868(120591) is nearly equal to 0 with enough receiveddata Then formula (10) can be expressed as
119877119868119868 (120591) = 119877119878119868119878119868 (120591) + 119877119899119868119899119868 (120591) (12)
based on the assumption
119877119899119868119899119868 (120591) asymp 1198730120575 (120591) (13)
Journal of Electrical and Computer Engineering 5
The autocorrelation function 119877119878119868119878119868(120591) of the BOC signalin 119868 channel can be expressed as
119877119878119868119878119868 (120591) = 12119879 lim119879rarrinfin
int119879minus119879
119878119868 (119905) 119878119868 (119905 + 120591) 119889119905 = 12119879
sdot lim119879rarrinfin
int119879minus119879
11986028 119877PS (120591) sdot cos [2120587Δ119891 (2119905 + 120591) + 2Δ120593] 119889119905
+ 11986028 sdot cos (2120587Δ119891120591) sdot 119877PS (120591)
(14)
where
119877PS (120591) = 1198751015840 (119905) 119878119888 (119905) 1198751015840 (119905 + 120591) 119878119888 (119905 + 120591) (15)
is the autocorrelation function of the BOC sequenceThen 119877119868119868(120591) can be expressed as
119877119868119868 (120591) = 12119879
sdot lim119879rarrinfin
int119879minus119879
11986028 119877PS (120591) sdot cos [2120587Δ119891 (2119905 + 120591) + 2Δ120593] 119889119905
+ 11986028 cos (2120587Δ119891120591) sdot 119877PS (120591) + 119877119899119868119899119868 (120591)
(16)
Similarly the autocorrelation function of the 119876 channeland the cross-correlation function of the two channels arerepresented as
119877119876119876 (120591) = minus 12119879
sdot lim119879rarrinfin
int119879minus119879
11986028 119877PS (120591) sdot cos [2120587Δ119891 (2119905 + 120591) + 2Δ120593] 119889119905
+ 11986028 cos (2120587Δ119891120591) sdot 119877PS (120591) + 119877119899119876119899119876 (120591)
(17)
119877119868119876 (120591) = minus 12119879
sdot lim119879rarrinfin
int119879minus119879
11986028 119877PS (120591) sdot sin [2120587Δ119891 (2119905 + 120591) + 2Δ120593] 119889119905
minus 11986028 sin (2120587Δ119891120591) sdot 119877PS (120591) + 119877119899119868119899119876 (120591)
(18)
119877119876119868 (120591) = minus 12119879
sdot lim119879rarrinfin
int119879minus119879
11986028 119877PS (120591) sdot sin [2120587Δ119891 (2119905 + 120591) + 2Δ120593] 119889119905
+ 11986028 sin (2120587Δ119891120591) sdot 119877PS (120591) + 119877119899119876119899119868 (120591)
(19)
According to (15)sim(18) we obtainSUM (120591) = 119877119868119868 + 119877119876119876
=
11986024 cos (2120587Δ119891120591) sdot 119877PS (120591) 120591 = 011986024 + 1198730 120591 = 0
(20)
SUB (120591) = 119877119876119868 minus 119877119868119876
= 11986024 sin (2120587Δ119891120591) sdot 119877PS (120591) 120591 = 00 120591 = 0
(21)
2 (120591) = SUM2 (120591) + SUB2 (120591)
=
119860416 1198772PS (120591) 120591 = 0119860416 + 1198602
2 1198730 + 11987320 120591 = 0(22)
Then the absolute value of the normalized multipleautocorrelation peaks is obtained as shown in the following
10038161003816100381610038161003816 (120591)10038161003816100381610038161003816 = radic2 (120591) (23)
By using the quadrature channel correlation the autocor-relation of the carrier component in the BOC signal has beeneliminated and themultiple autocorrelation peaks of the BOCsequence are extracted
33 Detection of the Autocorrelation Peaks In order to detectthe BOC modulation signal it is necessary to detect theautocorrelation peaks By analyzing multiple autocorrelationpeaks of the BOC sequence as described in Section 2 weknow that the heights and lags of themultiple autocorrelationpeaks for the BOC sequence are related to 12119891119904 and that thesum of the multiple autocorrelation peaks is related to 119891119888 and119891119904
The absolute values of the normalized multiple autocor-relation peaks for the BOC sequence with different 119891119888 and 119891119904values are shown in Figure 5 The sampling frequency is 400times larger than for 119891base
The frequency of the square wave should be larger thanthe frequency of the pseudo random sequence to generate theBOC signal In Figure 5 the number of peaks for the BOC(10 10) signal is two with a gradual increase in 120591 from 0 to1119891119888 The main peak appears when 120591 = 0 and the secondarypeak appears at the 20th sample point Because one period ofthe square wave or the pseudo random sequence is sampled40 times when 120591 equals 20 sample points the normalizedautocorrelation result of the square wave is equal to minus1 Atthe same time the normalized autocorrelation result of thespread spectrum sequence is equal to 05 and the height ofthe secondary peak is equal to 05When 120591 exceeds 40 samplepoints the autocorrelation result of the spread spectrumsequence is nearly equal to 0 and there is no peak
For the BOC (10 5) signal the frequency of the squarewave is twice as much as the frequency of the pseudo random
6 Journal of Electrical and Computer Engineering
50 100 150 20000
02
04
06
08
1
The a
bsol
ute v
alue
of a
utoc
orre
latio
n pe
aks
BOC (15 25)BOC (10 10)BOC (10 5)
BOC (5 2)
Code delay (sampling points)
Figure 5 The absolute values of the autocorrelation peaks for the BOC sequence
sequence One period of the square wave is sampled 40 timesand one chip of the pseudo random sequence is sampled80 times When 120591 equals 20 sample points the normalizedautocorrelation result of the square wave is equal to minus1 Atthe same time the normalized autocorrelation result of thesquare wave is equal to 075 Therefore the absolute value ofthe normalized autocorrelation result for the BOC sequenceis equal to 075 This represents the secondary peak When120591 equals 40 sample points it represents the third peak andthe height of the peak is equal to 05 The last peak occursat 60 sample points and the height of the peak is equal to025 There is no peak when 120591 exceeds 80 sample pointsSimilarly for the BOC (5 2) signal the secondary peak occursat 40 sample points and the height of the peak is equal to08 For the BOC (15 25) signal the secondary peak occursat 13 sample points and the height of the peak is equal to087
By analyzing the multiple autocorrelation peaks of theBOC sequence described in Section 21 and Figure 5 thesecondary peak occurs at the moment that 120591 equals half aperiod of the square wave Therefore when 119891119888 is equal to 119891119904the height of the secondary peak is equal to 05 When 119891119904 islarger than 119891119888 the height of the secondary peak is larger than05 as shown in Figure 5 With a gradual increase in 120591 theheights of the peaks decrease gradually Because 119891119904 is not lessthan 119891119888 the height of the secondary peak is not less than 05Therefore the initial threshold for detecting the secondarypeaks can be equal to 05 The secondary peak is determinedby the absolute value of the normalized autocorrelation resultwhich is the largest peak except for the main peak and it isnot less than 05 If there is no peak it is not a BOC signalOtherwise according to the height and lag difference Δℎ andΔ120591 can be estimated We can determine the next peak withΔℎ and Δ120591 until the height is nearly equal to 0 If there aremultiple peaks this means it is a BOC signal
As shown in (21) there is an autocorrelation componentof the noise in 119910(120591) with 120591 = 0 When the SNR is low theautocorrelation component of the noise is large which willlead to greater errors for Δℎ and this has a large impact onthe ability to detect the BOC signal Therefore the absolutevalues of the normalizedmultiple autocorrelation peaks needto be adjusted Based on the least squares fitting method theautocorrelation results that are close to the main peak andare descending continuously are determined and the heightof the main peak is adjusted
The flow of the algorithm is shown in Figure 6
4 Simulation Results
We assume the following parameters for the simulations 119891119888= 2046MHz 119891119904 = 5115MHz 119891119904 = 2046MHz and 119891local =1023MHz The sampling frequency is 2046MHz and thenumber of sampled points is 25000
Figure 7 shows the absolute values of the autocorrelationpeaks for the BOC (5 2) signal with SNR = 10 dB It is evidentthat the autocorrelation component of the carrier wave iseliminated by using the quadrature channel correlation Themultiple autocorrelation peaks are easy to detect For theabsolute values of the normalized multiple autocorrelationpeaks (without the elimination of the autocorrelation compo-nent of the carrier wave) there aremore peaks that are causedby the carrier autocorrelation around the peaks of the BOCsequence This can interfere with the detection of the peaksFrom Figure 7 we can see that the multiple autocorrelationpeaks of the BOC sequence are obtained by the quadraturechannel correlation and the BOC signal does not requiredemodulation
Figure 8 shows the absolute values of the autocorrelationpeaks for the BOC (5 2) signal with different SNR valuesBecause there is a noise autocorrelation component that is
Journal of Electrical and Computer Engineering 7
Begin
Parameter initialization
Quadrature channelscorrelation and square-root
The secondary peakis larger than 05
End
There is BOC signal
Yes
No
Yes
No
No
Yes
Yes
No
Input received Y(t)
Amende | R()|
Calculate Δℎ and Δ
0 = 0 + Δ ℎ0 = ℎ0 minus Δℎ
POG = POG + 1
ℎ0 minus Δℎ gt 0
POG gt 0
R(0 + Δ)
asymp ℎ0 minus Δℎ
Figure 6 Flowchart of the proposed algorithm
8 Journal of Electrical and Computer Engineering
Without autocorrelation component of carrior waveWith autocorrelation component of carrior wave
20 40 60 80 10000
01
02
03
04
05
06
07
08
09
1
The a
bsol
ute v
alue
of a
utoc
orre
latio
n pe
aks
Code delay (sampling points)
Figure 7 The absolute value of the autocorrelation peaks with SNR = 10 dB
0
01
02
03
04
05
06
07
08
09
1
The a
bsol
ute v
alue
of a
utoc
orre
latio
n pe
aks
20 40 60 80 1000
Without noise32 = 10 >
32 = 0 >
32 = minus10 >
Code delay (sampling points)
(a) Autocorrelation results without adjusted values
20 40 60 80 10000
01
02
03
04
05
06
07
08
09
1
The a
bsol
ute v
alue
of a
utoc
orre
latio
n pe
aks
Without noise32 = 10 >
32 = 0 >
32 = minus10 >
Code delay (sampling points)
(b) Autocorrelation results with adjusted values
Figure 8 The absolute value of the autocorrelation peaks with different SNR
included in the main peaks as shown in (a) the main peaksincrease as the SNR gradually decreases Therefore the othernormalized autocorrelation peaks are lower with a lower SNRsuch as the secondary peak and the third peak The noiseautocorrelation component in the main peak is eliminatedafter the adjustment As a result the adjusted result for themultiple peaks is similar to the result under a noise-freecondition
Table 1 shows the results for the detection of the multiplepeaks It is evident that the heights of the peaks decrease grad-ually as 120591 increases For SNR = 10 dB there are the approx-imate height differences Δℎ and lag differences Δ120591 between
the adjacent peaks For lower values of the SNR the errorgradually increases
Figure 9 shows the performance of the proposed algo-rithm for different data lengths When the data length is25000 the BOC (5 2) signal can be detected effectively whenthe SNR is greater than minus12 dB When the data length is100000 the detection probability of the BOC (5 2) signalincreases to 1 dB The detection performance for the BOC (52) signal can be improved with an increase in the data lengthbecause the autocorrelation component of the noise is smallerwith a greater data length Therefore the detection ability ofthe proposed algorithm is higher at a lower SNR However
Journal of Electrical and Computer Engineering 9
N =100000N = 50000N = 25000
minus16 minus14 minus12 minus10 minus8 minus6 minus4 minus2 0minus18SNR (dB)
0
01
02
03
04
05
06
07
08
09
1
Det
ectio
n pr
obab
ility
Figure 9 Detection probability with different data lengths
minus16 minus14 minus12 minus10 minus8 minus6 minus4 minus2 0minus18SNR (dB)
BOC (15 25)BOC (5 2)BOC (10 5)
BOC (10 10)
0
01
02
03
04
05
06
07
08
09
1
Det
ectio
n pr
obab
ility
Figure 10 Detection probability for different values of 119891119888 and 119891119904
when the SNR is lower than minus15 dB the BOC signal cannotbe detected when the data length is 100000
Figure 10 shows the performance of the proposed algo-rithm for different values of 119891119888 and 119891119904 with a data length of100000When the ratio 119899 of119891119904 to119891119888 is larger the probability ofdetecting the BOC signal is higher for the same SNR becausethere are more peaks with a larger 119899 and the height of thesecondary peak is larger Therefore it is easy to detect thepeaks and detect the BOC signal
Figure 11 shows the performance of the proposed algo-rithm based on the quadrature channel correlation and thespectral correlation It is evident that the probability ofdetecting the BOC signal is higher for the quadrature channel
Based on quadrature channels correlationBased on spectral correlation
0
02
04
06
08
1
12
Det
ectio
n pr
obab
ility
minus16 minus14 minus12 minus10 minus8 minus6 minus4 minus2 0minus18SNR (dB)
Figure 11 Detection probability for different algorithms
Table 1 The results of the peak detection
SNRdB Number of peaks Height 120591sampled points Δℎ
10 dB
1 1 0 02 07992 20 020083 06021 40 019714 04122 60 018995 02197 80 01925
0 dB
1 1 0 02 07655 20 023453 05613 40 020424 04122 60 014915 0195 80 02172
minus10 dB1 1 0 02 07173 20 028273 05025 40 021484 03473 59 015525 02984 79 00489
correlation than for the spectral correlation algorithmUnderthe same conditions the detection probability for the BOCsignal is improved by about 2 dB
5 Conclusions
(1) The autocorrelation component of the carrier wave iseliminated by using the quadrature channel correlation If theadjacent autocorrelation peaks have the same lag differencesand height differences the BOC signal is detected effectivelyby detecting the absolute value of themultiple autocorrelationpeaks
(2) The ability to detect the BOC signal is related to thedata length and the ratio of 119891119904 to 119891119888 Larger values for the datalength and the ratio of119891119904 to119891119888 result in a higher probability to
10 Journal of Electrical and Computer Engineering
detect the BOC signal The algorithm presented in this paperis superior to the algorithm based on the spectral correlation
Conflicts of Interest
The authors declare that there are no conflicts of interestregarding the publication of this paper
Acknowledgments
This work is supported by the Science and Technology Foun-dation from Liaoning EducationDepartment (no L2015462)Shenyang Ligong University Liaoning Province InformationNetwork and Countermeasure Technology Key LaboratoryOpen Foundation (2015) and Shenyang Ligong UniversityPostdoctoral Science Foundation
References
[1] M Foucras J Leclere C Botteron et al ldquoStudy on the cross-correlation of GNSS signals and typical approximationsrdquo GPSSolutions vol 21 no 2 pp 293ndash306 2017
[2] B Tripathi R Tulsian and R C Jain ldquoPerformance Compar-ison of Sine and Cosine Phased BOC Signals Used for Radio-navigationrdquo in Proceedings of the IFAC vol 45 pp 223ndash2282012
[3] K Chae S R Lee H Liu and S Yoon ldquoAn unambiguous cor-relation function for generic sine-phased binary offset carriersignal trackingrdquo Computers and Electrical Engineering vol 49pp 161ndash172 2016
[4] Z Yanling L Xuejiao and W Xiaoqing ldquoAnalysis of satellitenavigation signal alternate binary offset carrier modulationrdquoJournal of Hubei University no 4 pp 334ndash339 2015
[5] Z Yao X CuiM Lu Z Feng and J Yang ldquoPseudo-correlation-function-based unambiguous tracking technique for sine-BOCsignalsrdquo IEEE Transactions on Aerospace and Electronic Systemsvol 46 no 4 pp 1782ndash1796 2010
[6] Y Lee D Chong I Song S Y Kim G-I Jee and S YoonldquoCancellation of correlation side-peaks for unambiguous BOCsignal trackingrdquo IEEE Communications Letters vol 16 no 5 pp569ndash572 2012
[7] A F Khalaf M I Owis and I A Yassine ldquoImage features ofspectral correlation function for arrhythmia classificationrdquo inProceedings of the 37th Annual International Conference of theIEEE Engineering inMedicine and Biology Society EMBC rsquo15 pp5199ndash5202 IEEE Milan Italy August 2015
[8] T Zhang D He S Chen and S Zhou ldquoSpectral correlation-based parameter estimation of BOCmodulation signalrdquo Journalof Huazhong University of Science and Technology vol 41 no 9pp 11ndash16 2013
[9] S Zhu D Zhao and F Wang ldquoHybrid prediction and fractalhyperspectral image compressionrdquo Mathematical Problems inEngineering vol 2015 Article ID 950357 10 pages 2015
[10] T Former ldquoPhase clustering based modulation classificationalgorithm for PSK signal over wireless environmentrdquo MobileInformation Systems vol 2016 Article ID 2398464 11 pages2016
[11] R Chen JWang R Lin and X Zhao ldquoSpectrum sensing basedon nonparametric autocorrelation in wireless communicationsystems under alpha stable noiserdquo Mobile Information Systemsvol 2016 Article ID 6753830 6 pages 2016
[12] F Guo Z Yao and M Lu ldquoBS-ACEBOC a generalizedlow-complexity dual-frequency constant-envelope multiplex-ingmodulation for GNSSrdquoGPS Solutions vol 21 no 2 pp 561ndash575 2017
[13] M S Yarlykov ldquoCorrelation functions of BOC and AltBOC sig-nals as the inverse Fourier transforms of energy spectrardquo Jour-nal of Communications Technology and Electronics vol 61 no8 pp 857ndash876 2016
[14] M S Yarlykov and S M Yarlykova ldquoCorrelation functions ofcomplete CBOC signals derived as the inverse Fourier trans-form of energy spectrardquo Journal of Communications Technologyand Electronics vol 62 no 2 pp 128ndash140 2017
[15] B Yin G Wang and Y Qi ldquoUnambiguous sine-phased binaryoffset carrier modulated signal tracking techniquerdquo Optik -International Journal for Light and Electron Optics vol 132 pp284ndash290 2017
[16] P Weichuan W Xue and H Chengyan ldquoResearch on corre-lation peaks detection algorithm for multiplex signal of navi-gation systemsrdquo Journal of Time and Frequency vol 38 no 3pp 163ndash170 2015
[17] F Liu and Y Feng ldquoA new acquisition algorithm with elimina-tion side peak for all BOC signalsrdquo Mathematical Problems inEngineering vol 2015 Article ID 140345 9 pages 2015
[18] K Chae S R Lee H Liu et al ldquoA novel unambiguous com-posite binary offset carrier (6 1 111) tracking based on partialcorrelationsrdquo Computers and Electrical Engineering vol 50 pp54ndash66 2016
International Journal of
AerospaceEngineeringHindawiwwwhindawicom Volume 2018
RoboticsJournal of
Hindawiwwwhindawicom Volume 2018
Hindawiwwwhindawicom Volume 2018
Active and Passive Electronic Components
VLSI Design
Hindawiwwwhindawicom Volume 2018
Hindawiwwwhindawicom Volume 2018
Shock and Vibration
Hindawiwwwhindawicom Volume 2018
Civil EngineeringAdvances in
Acoustics and VibrationAdvances in
Hindawiwwwhindawicom Volume 2018
Hindawiwwwhindawicom Volume 2018
Electrical and Computer Engineering
Journal of
Advances inOptoElectronics
Hindawiwwwhindawicom
Volume 2018
Hindawi Publishing Corporation httpwwwhindawicom Volume 2013Hindawiwwwhindawicom
The Scientific World Journal
Volume 2018
Control Scienceand Engineering
Journal of
Hindawiwwwhindawicom Volume 2018
Hindawiwwwhindawicom
Journal ofEngineeringVolume 2018
SensorsJournal of
Hindawiwwwhindawicom Volume 2018
International Journal of
RotatingMachinery
Hindawiwwwhindawicom Volume 2018
Modelling ampSimulationin EngineeringHindawiwwwhindawicom Volume 2018
Hindawiwwwhindawicom Volume 2018
Chemical EngineeringInternational Journal of Antennas and
Propagation
International Journal of
Hindawiwwwhindawicom Volume 2018
Hindawiwwwhindawicom Volume 2018
Navigation and Observation
International Journal of
Hindawi
wwwhindawicom Volume 2018
Advances in
Multimedia
Submit your manuscripts atwwwhindawicom

2 Journal of Electrical and Computer Engineering
times107minus15 minus1 minus05 0 05 1 15 2minus2
Frequency (Hz)
minus120
minus110
minus100
minus90
minus80
minus70
minus60
minus50
minus40
Pow
er sp
ectr
al d
ensit
y (d
BH
z)
BOC (15 25)BOC (10 10)BOC (10 5)
BOC (5 2)DS (10)
Figure 1 Power spectral density of the BOC signals
In this paper an algorithm for detecting the BOC signal ispresented using a long-period pseudo random sequenceTheautocorrelation component of the carrier wave in the BOCsignal is eliminated based on quadrature channel correlationBy detecting the autocorrelation peaks the BOC signal canbe detected
The outline of this paper is as follows In Section 2we study the characteristics of the BOC signal Section 3describes the analysis of the characteristics of the multipleautocorrelation peaks for the BOC signal and the algorithmfor detecting the BOC signal Section 4 provides simulationresults demonstrating the performance of the algorithmFinally Section 5 presents our conclusions and final com-ments
2 Characteristics of the BOC Signal
The BOC signal 119884(119905) modulated by BPSK is given by
119884 (119905) = 119860 sdot 119863 (119905) 119875 (119905) 119878119888 (119905) cos (2120587119891119905 + 120593) (1)
where 119860 is the carrier amplitude 119863(119905) is the baseband data119875(119905) is the pseudo random sequence 119878119888(119905) is the square wave
119891 is the carrier frequency and 120593 is the phase The frequencyof 119875(119905) is 119891119888 and the frequency of 119878119888(119905) is 119891119904
Firstly the spread spectrum sequence is obtained by XORbaseband data with the pseudo random sequence Then thespread spectrum sequence is XORed again with a squarewave to generate the BOC sequence Finally the BOC signalis generated by modulating the BOC sequence to the maincarrier The BOC signal is denoted as BOC (119873119904 119873119888) where119873119904 means the ratio of 119891119904 to the reference frequency 119891base and119873119888 means the ratio of 119891119888 to the reference frequency 119891base InGNSS systems the reference frequency 119891base = 1023MHz
The normalized power spectral density (PSD) of the BOCsignal can be expressed as [12]
119866BOC(119891119878119891119888) (119891)
=
119891119888 [ sin (1205871198912119891119904) sin (120587119891119891119888)120587119891 cos (1205871198912119891119904) ]2
119899 is an odd number
119891119888 [ sin (1205871198912119891119904) cos (120587119891119891119888)120587119891 cos (1205871198912119891119904) ]2
119899 is an even number(2)
where
119899 = 2119891119904119891119888 (3)
The distribution of the normalized power spectral densityfor the BOC signals is shown in Figure 1 where DS (10) isthe normalized power spectral density of the DSSS signals inwhich the frequency of the pseudo random sequence is tentimes as much as 119891base
As shown in Figure 1 the main lobe energy of theBOC signal is split into two lobes located at plusmn119891119904 fromthe central frequency The main lobe energy of the DSSSsignal is concentrated in the central frequencyTherefore theBOC signal and the DSSS signal can be transmitted on thesame frequency at the same time without interfering witheach other and the bandwidth efficiency is greatly improvedBecause of the wider bandwidth the BOC signal has a greaterantijamming capability than the DSSS signal Furthermore itis difficult to estimate the carrier frequency of the BOC signalbecause the two lobes are not located in the carrier frequency
The autocorrelation function of the BOC sequence can beexpressed as [13]
119877BOC (120591) =
1 120591 = 0(minus1)119897minus1 [119899 minus (119897 minus 1)]
119899 + (minus1)119897 [4119891119904 minus 119891119888 (2119897 minus 1)] sdot (120591 minus 119897 minus 12119891119904 ) (119897 minus 1)
2119891119904 lt 120591 le 11989721198911199040 lt 119897 le 119899 minus 1 119897 is integer
(minus1)119897 [119899 minus |119897|]119899 + (minus1)|119897|minus1 [4119891119904 minus 119891119888 (2 |119897| minus 1)] sdot (120591 + |119897|
2119891119904) |119897|2119891119904 lt 120591 le (|119897| minus 1)
2119891119904minus119899 + 1 le 119897 lt 0 119897 is integerminus 1119873 119879119888 lt |120591| le (119873 minus 1) 119879119888
(4)
Journal of Electrical and Computer Engineering 3
minus1
minus05
0
05
1
Auto
corr
elat
ion
func
tion
minus40 minus20 0 20 40 60minus60
BOC (15 25)BOC (10 10)BOC (10 5)
BOC (5 2)DS (10)
Code delay (sampling points)
Figure 2 Autocorrelation function of the BOC sequence
Spread spectrumsequence
Square wave
BOC sequence
BOC sequencecode delay 1
BOC sequencecode delay 2
1fc
1fs
12fs
Figure 3 The generation process of the autocorrelation peaks
where119873 is the chip number of the pseudo random sequencein one period and 119879119888 is the period of the pseudo randomsequence
The autocorrelation functions of the BOC sequence areshown in Figure 2
Figure 2 shows that the autocorrelation function ofthe BOC sequence contains multiple positive and negativepeaks The absolute values of the multiple peaks decreasegradually as the code delay increasesThe sum of themultiplepeaks is 2119899 minus 1 The width of the autocorrelation functionrsquosmain peak is narrower so that the BOC sequence has abetter synchronous precision The BOC sequence is highlycorrelated with itself The autocorrelation function of theDSSS sequence contains only one peak and the main peakof the DSSS sequence is wider than the peak of the BOCsequence
As shown in Figures 1 and 2 the BOC signal has twocharacteristics splitting spectrum peaks and multiple auto-correlation peaks which enhance the antijamming abilityand improve the precision of the acquisition [14 15] In
addition the BOC signal can be transmitted with othersignals greatly improving the bandwidth efficiency [16] Theadvantages of the BOC signal make it highly suitable forsecret communications However because the main lobeenergy of the BOC signal is not concentrated in the carrierfrequency and the BOC signal should be transmitted underthe condition of a negative SNR [17 18] it will be difficultto estimate the carrier frequency of the BOC signal Inaddition the BOC sequence which is commonly used insecret communications has a longer period or is aperiodic ina short time which increases the difficulty of detecting andestimating the BOC signal
3 The Recognition Algorithm forthe BOC Signal
31 Multiple Autocorrelation Peaks Analysis The multipleautocorrelation peaks are a unique feature of the BOCsequence and can be used to detect the BOC signal Thisfeature is needed to analyze the relevance between themultiple autocorrelation peaks Figure 3 shows the genera-tion process of an unambiguous autocorrelation function forthe BOC sequence
The spread spectrum sequence which is obtained bythe XOR baseband data with the pseudo random sequenceis XORed again with a square wave to generate the BOCsequence (Figure 3)Then the BOC sequence is shifted as thecode delay 120591 increasesWhen 120591 equals half a period of a squarewave it represents the BOC sequence code delay 1 Similarlywhen 120591 equals one period of a square wave it represents theBOC sequence code delay 2 (Figure 3)
When 120591 is 0 the normalized autocorrelation result of theBOC sequence is 1 The result of the normalized autocorre-lation function decreases gradually with the increase in thecode delay 120591 from 0 to 12119891119904 This represents the main peakof the autocorrelation function of the BOC sequence when120591 = 0 as shown in Figure 2 When 120591 is equal to 12119891119904 thephase of the square wave component in the BOC sequence 1is inverted As a result the autocorrelation result of the squarewave component is minus1 This represents the first negative peakwhen 120591 = 12119891119904 as shown in Figure 2 With an increase inthe code delay 120591 when 120591 is 1119891119904 the phase of the squarewave component in the BOC sequence 2 is the same as inthe BOC sequence As a result the autocorrelation result ofthe square wave component is equal to 1 This representsthe second positive peak when 120591 = 1119891119904 as shown inFigure 2
By parity of reasoning because the autocorrelation resultof the squarewave component is changed repeatedly from 1 tominus1 there are multiple positive and negative peaks in the auto-correlation function of the BOC sequence The peaks occurat the moment when 120591 is the integral multiple of 12119891119904 and 120591is less than 1119891119888 The number of peaks is related to 119891119888 and 119891119904and is equal to 2119899 minus 1 with |120591| le 1119891119888 by lead and lag When 120591exceeds one chip of the pseudo random sequence the auto-correlation result of the pseudo random sequence is minus1119873 asshown in (3)When the period of the BOC sequence is longeror aperiodic the autocorrelation result is nearly equal to0
4 Journal of Electrical and Computer Engineering
times
times
LPF
LPF
times
times
times
times +
+
minus
Y (t)
2
cIM(2fFI=Ft + local)
SI(t)
SQ (t)
RII()
RQI()
RIQ()
RQQ()int
int
int
int
SUM()
SUB()
|( )12|| R()|
( )2
( )2
Figure 4 The overall process of the quadrature channel correlation
By analyzing the generation process of the autocorrela-tion function for the BOC sequence the values of the auto-correlation peaks can be expressed by
ℎ (119897) = (minus1)119897 (119899 minus |119897|)119899 119897 = 0 plusmn1 plusmn119899 minus 1 (5)
where ℎ(119897) is the value of the 119897-th peaks and 119897 is the sequencenumber of the peaks
When 119897 is equal to 0 ℎ(0) is the value of the main peak119897 is positive when 120591 gt 0 otherwise it is negative The valuesof the peaks decrease gradually as |119897| increases Further it isseen from (4) that the height difference between the 119897-th peakand the (119897 + 1)-th peak can be represented as
|Δℎ| = 10038161003816100381610038161003816100381610038161003816(119899 minus |119897|)
119899 minus (119899 minus |119897 + 1|)119899
10038161003816100381610038161003816100381610038161003816 =1119899 (6)
where Δℎ is the height differenceBecause the peaks always occur at the moment when 120591 is
the integral multiple of 12119891119904 the lag difference between the119897-th peak and the (119897+1)-th peak is 12119891119904 It can be representedas
Δ120591 = 12119891119904 (7)
where Δ120591 is the lag differenceAs shown in (5) and (6) the heights and lags of the
multiple autocorrelation peaks are related to 12119891119904 Thereason is mainly due to the second modulation by the squarewave Therefore we can detect the BOC signal by detectingmultiple autocorrelation peaks of the BOC sequence If therelevant rules shown in (5) and (6) are satisfied the BOCsignal will be detected
32 Quadrature Channel Correlation Because the BOC sig-nal is transmitted under the condition of a negative SNR andthere is a carrier wave component in the BOC signal it isdifficult to obtain multiple autocorrelation peaks of the BOCsequence
An improvedmethod based onquadrature channel corre-lation is presented to obtain multiple autocorrelation peaks
The overall process of the quadrature channel correlation isshown Figure 4
The received BOC signal can be expressed as
1198841015840 (119905) = 119860 sdot 1198751015840 (119905) 119878119888 (119905) cos (2120587119891119905 + 120593) + 119899 (119905) (8)
where1198751015840(119905) is the spread spectrum sequence1198751015840(119905) = 119863(119905)119875(119905)and 119899(119905) is the zero-mean gauss white noise with a two-sidedpower spectral density1198730
Firstly 1198841015840(119905) is multiplied by cos(2120587119891local119905 + 120593local) andsin(2120587119891local119905+120593local) respectively where119891local is the frequencyof the local oscillator and 120593local is the phase of the localoscillator
Next the high-frequency components are filtered by alow-pass filter We obtain
119878119868 (119905) = 1198602 sdot 1198751015840 (119905) 119878119888 (119905) cos [2120587Δ119891119905 + Δ120593] + 119899119868 (119905) (9)
119878119876 (119905) = minus1198602 sdot 1198751015840 (119905) 119878119888 (119905) sin [2120587Δ119891119905 + Δ120593] + 119899119876 (119905) (10)
where Δ119891 = 119891minus119891local Δ120593 = 120593minus120593local and 119899119868(119905) and 119899119876(119905) arethe noise components in the 119868 and 119876 channels after filtering
Subsequently the autocorrelation functions of 119878119868(119905) and119878119876(119905) are calculated with the code delay 120591 We take 119878119868(119905) asan example to study the autocorrelation and cross-correlationfunctions The autocorrelation function of 119878119868(119905) can beexpressed as
119877119868119868 (120591) = 119877119878119868119878119868 (120591) + 119877119878119868119899119868 (120591) + 119877119899119868119899119868 (120591) (11)
where 119877119878119868119878119868(120591) is the autocorrelation component of the BOCsignal 119877119878119868119899119868(120591) is the cross-correlation component betweenthe BOC signal and the noise and 119877119899119868119899119868(120591) is the autocorre-lation component of the noise
Because there is no correlation between the noise and theBOC signal119877119878119868119899119868(120591) is nearly equal to 0 with enough receiveddata Then formula (10) can be expressed as
119877119868119868 (120591) = 119877119878119868119878119868 (120591) + 119877119899119868119899119868 (120591) (12)
based on the assumption
119877119899119868119899119868 (120591) asymp 1198730120575 (120591) (13)
Journal of Electrical and Computer Engineering 5
The autocorrelation function 119877119878119868119878119868(120591) of the BOC signalin 119868 channel can be expressed as
119877119878119868119878119868 (120591) = 12119879 lim119879rarrinfin
int119879minus119879
119878119868 (119905) 119878119868 (119905 + 120591) 119889119905 = 12119879
sdot lim119879rarrinfin
int119879minus119879
11986028 119877PS (120591) sdot cos [2120587Δ119891 (2119905 + 120591) + 2Δ120593] 119889119905
+ 11986028 sdot cos (2120587Δ119891120591) sdot 119877PS (120591)
(14)
where
119877PS (120591) = 1198751015840 (119905) 119878119888 (119905) 1198751015840 (119905 + 120591) 119878119888 (119905 + 120591) (15)
is the autocorrelation function of the BOC sequenceThen 119877119868119868(120591) can be expressed as
119877119868119868 (120591) = 12119879
sdot lim119879rarrinfin
int119879minus119879
11986028 119877PS (120591) sdot cos [2120587Δ119891 (2119905 + 120591) + 2Δ120593] 119889119905
+ 11986028 cos (2120587Δ119891120591) sdot 119877PS (120591) + 119877119899119868119899119868 (120591)
(16)
Similarly the autocorrelation function of the 119876 channeland the cross-correlation function of the two channels arerepresented as
119877119876119876 (120591) = minus 12119879
sdot lim119879rarrinfin
int119879minus119879
11986028 119877PS (120591) sdot cos [2120587Δ119891 (2119905 + 120591) + 2Δ120593] 119889119905
+ 11986028 cos (2120587Δ119891120591) sdot 119877PS (120591) + 119877119899119876119899119876 (120591)
(17)
119877119868119876 (120591) = minus 12119879
sdot lim119879rarrinfin
int119879minus119879
11986028 119877PS (120591) sdot sin [2120587Δ119891 (2119905 + 120591) + 2Δ120593] 119889119905
minus 11986028 sin (2120587Δ119891120591) sdot 119877PS (120591) + 119877119899119868119899119876 (120591)
(18)
119877119876119868 (120591) = minus 12119879
sdot lim119879rarrinfin
int119879minus119879
11986028 119877PS (120591) sdot sin [2120587Δ119891 (2119905 + 120591) + 2Δ120593] 119889119905
+ 11986028 sin (2120587Δ119891120591) sdot 119877PS (120591) + 119877119899119876119899119868 (120591)
(19)
According to (15)sim(18) we obtainSUM (120591) = 119877119868119868 + 119877119876119876
=
11986024 cos (2120587Δ119891120591) sdot 119877PS (120591) 120591 = 011986024 + 1198730 120591 = 0
(20)
SUB (120591) = 119877119876119868 minus 119877119868119876
= 11986024 sin (2120587Δ119891120591) sdot 119877PS (120591) 120591 = 00 120591 = 0
(21)
2 (120591) = SUM2 (120591) + SUB2 (120591)
=
119860416 1198772PS (120591) 120591 = 0119860416 + 1198602
2 1198730 + 11987320 120591 = 0(22)
Then the absolute value of the normalized multipleautocorrelation peaks is obtained as shown in the following
10038161003816100381610038161003816 (120591)10038161003816100381610038161003816 = radic2 (120591) (23)
By using the quadrature channel correlation the autocor-relation of the carrier component in the BOC signal has beeneliminated and themultiple autocorrelation peaks of the BOCsequence are extracted
33 Detection of the Autocorrelation Peaks In order to detectthe BOC modulation signal it is necessary to detect theautocorrelation peaks By analyzing multiple autocorrelationpeaks of the BOC sequence as described in Section 2 weknow that the heights and lags of themultiple autocorrelationpeaks for the BOC sequence are related to 12119891119904 and that thesum of the multiple autocorrelation peaks is related to 119891119888 and119891119904
The absolute values of the normalized multiple autocor-relation peaks for the BOC sequence with different 119891119888 and 119891119904values are shown in Figure 5 The sampling frequency is 400times larger than for 119891base
The frequency of the square wave should be larger thanthe frequency of the pseudo random sequence to generate theBOC signal In Figure 5 the number of peaks for the BOC(10 10) signal is two with a gradual increase in 120591 from 0 to1119891119888 The main peak appears when 120591 = 0 and the secondarypeak appears at the 20th sample point Because one period ofthe square wave or the pseudo random sequence is sampled40 times when 120591 equals 20 sample points the normalizedautocorrelation result of the square wave is equal to minus1 Atthe same time the normalized autocorrelation result of thespread spectrum sequence is equal to 05 and the height ofthe secondary peak is equal to 05When 120591 exceeds 40 samplepoints the autocorrelation result of the spread spectrumsequence is nearly equal to 0 and there is no peak
For the BOC (10 5) signal the frequency of the squarewave is twice as much as the frequency of the pseudo random
6 Journal of Electrical and Computer Engineering
50 100 150 20000
02
04
06
08
1
The a
bsol
ute v
alue
of a
utoc
orre
latio
n pe
aks
BOC (15 25)BOC (10 10)BOC (10 5)
BOC (5 2)
Code delay (sampling points)
Figure 5 The absolute values of the autocorrelation peaks for the BOC sequence
sequence One period of the square wave is sampled 40 timesand one chip of the pseudo random sequence is sampled80 times When 120591 equals 20 sample points the normalizedautocorrelation result of the square wave is equal to minus1 Atthe same time the normalized autocorrelation result of thesquare wave is equal to 075 Therefore the absolute value ofthe normalized autocorrelation result for the BOC sequenceis equal to 075 This represents the secondary peak When120591 equals 40 sample points it represents the third peak andthe height of the peak is equal to 05 The last peak occursat 60 sample points and the height of the peak is equal to025 There is no peak when 120591 exceeds 80 sample pointsSimilarly for the BOC (5 2) signal the secondary peak occursat 40 sample points and the height of the peak is equal to08 For the BOC (15 25) signal the secondary peak occursat 13 sample points and the height of the peak is equal to087
By analyzing the multiple autocorrelation peaks of theBOC sequence described in Section 21 and Figure 5 thesecondary peak occurs at the moment that 120591 equals half aperiod of the square wave Therefore when 119891119888 is equal to 119891119904the height of the secondary peak is equal to 05 When 119891119904 islarger than 119891119888 the height of the secondary peak is larger than05 as shown in Figure 5 With a gradual increase in 120591 theheights of the peaks decrease gradually Because 119891119904 is not lessthan 119891119888 the height of the secondary peak is not less than 05Therefore the initial threshold for detecting the secondarypeaks can be equal to 05 The secondary peak is determinedby the absolute value of the normalized autocorrelation resultwhich is the largest peak except for the main peak and it isnot less than 05 If there is no peak it is not a BOC signalOtherwise according to the height and lag difference Δℎ andΔ120591 can be estimated We can determine the next peak withΔℎ and Δ120591 until the height is nearly equal to 0 If there aremultiple peaks this means it is a BOC signal
As shown in (21) there is an autocorrelation componentof the noise in 119910(120591) with 120591 = 0 When the SNR is low theautocorrelation component of the noise is large which willlead to greater errors for Δℎ and this has a large impact onthe ability to detect the BOC signal Therefore the absolutevalues of the normalizedmultiple autocorrelation peaks needto be adjusted Based on the least squares fitting method theautocorrelation results that are close to the main peak andare descending continuously are determined and the heightof the main peak is adjusted
The flow of the algorithm is shown in Figure 6
4 Simulation Results
We assume the following parameters for the simulations 119891119888= 2046MHz 119891119904 = 5115MHz 119891119904 = 2046MHz and 119891local =1023MHz The sampling frequency is 2046MHz and thenumber of sampled points is 25000
Figure 7 shows the absolute values of the autocorrelationpeaks for the BOC (5 2) signal with SNR = 10 dB It is evidentthat the autocorrelation component of the carrier wave iseliminated by using the quadrature channel correlation Themultiple autocorrelation peaks are easy to detect For theabsolute values of the normalized multiple autocorrelationpeaks (without the elimination of the autocorrelation compo-nent of the carrier wave) there aremore peaks that are causedby the carrier autocorrelation around the peaks of the BOCsequence This can interfere with the detection of the peaksFrom Figure 7 we can see that the multiple autocorrelationpeaks of the BOC sequence are obtained by the quadraturechannel correlation and the BOC signal does not requiredemodulation
Figure 8 shows the absolute values of the autocorrelationpeaks for the BOC (5 2) signal with different SNR valuesBecause there is a noise autocorrelation component that is
Journal of Electrical and Computer Engineering 7
Begin
Parameter initialization
Quadrature channelscorrelation and square-root
The secondary peakis larger than 05
End
There is BOC signal
Yes
No
Yes
No
No
Yes
Yes
No
Input received Y(t)
Amende | R()|
Calculate Δℎ and Δ
0 = 0 + Δ ℎ0 = ℎ0 minus Δℎ
POG = POG + 1
ℎ0 minus Δℎ gt 0
POG gt 0
R(0 + Δ)
asymp ℎ0 minus Δℎ
Figure 6 Flowchart of the proposed algorithm
8 Journal of Electrical and Computer Engineering
Without autocorrelation component of carrior waveWith autocorrelation component of carrior wave
20 40 60 80 10000
01
02
03
04
05
06
07
08
09
1
The a
bsol
ute v
alue
of a
utoc
orre
latio
n pe
aks
Code delay (sampling points)
Figure 7 The absolute value of the autocorrelation peaks with SNR = 10 dB
0
01
02
03
04
05
06
07
08
09
1
The a
bsol
ute v
alue
of a
utoc
orre
latio
n pe
aks
20 40 60 80 1000
Without noise32 = 10 >
32 = 0 >
32 = minus10 >
Code delay (sampling points)
(a) Autocorrelation results without adjusted values
20 40 60 80 10000
01
02
03
04
05
06
07
08
09
1
The a
bsol
ute v
alue
of a
utoc
orre
latio
n pe
aks
Without noise32 = 10 >
32 = 0 >
32 = minus10 >
Code delay (sampling points)
(b) Autocorrelation results with adjusted values
Figure 8 The absolute value of the autocorrelation peaks with different SNR
included in the main peaks as shown in (a) the main peaksincrease as the SNR gradually decreases Therefore the othernormalized autocorrelation peaks are lower with a lower SNRsuch as the secondary peak and the third peak The noiseautocorrelation component in the main peak is eliminatedafter the adjustment As a result the adjusted result for themultiple peaks is similar to the result under a noise-freecondition
Table 1 shows the results for the detection of the multiplepeaks It is evident that the heights of the peaks decrease grad-ually as 120591 increases For SNR = 10 dB there are the approx-imate height differences Δℎ and lag differences Δ120591 between
the adjacent peaks For lower values of the SNR the errorgradually increases
Figure 9 shows the performance of the proposed algo-rithm for different data lengths When the data length is25000 the BOC (5 2) signal can be detected effectively whenthe SNR is greater than minus12 dB When the data length is100000 the detection probability of the BOC (5 2) signalincreases to 1 dB The detection performance for the BOC (52) signal can be improved with an increase in the data lengthbecause the autocorrelation component of the noise is smallerwith a greater data length Therefore the detection ability ofthe proposed algorithm is higher at a lower SNR However
Journal of Electrical and Computer Engineering 9
N =100000N = 50000N = 25000
minus16 minus14 minus12 minus10 minus8 minus6 minus4 minus2 0minus18SNR (dB)
0
01
02
03
04
05
06
07
08
09
1
Det
ectio
n pr
obab
ility
Figure 9 Detection probability with different data lengths
minus16 minus14 minus12 minus10 minus8 minus6 minus4 minus2 0minus18SNR (dB)
BOC (15 25)BOC (5 2)BOC (10 5)
BOC (10 10)
0
01
02
03
04
05
06
07
08
09
1
Det
ectio
n pr
obab
ility
Figure 10 Detection probability for different values of 119891119888 and 119891119904
when the SNR is lower than minus15 dB the BOC signal cannotbe detected when the data length is 100000
Figure 10 shows the performance of the proposed algo-rithm for different values of 119891119888 and 119891119904 with a data length of100000When the ratio 119899 of119891119904 to119891119888 is larger the probability ofdetecting the BOC signal is higher for the same SNR becausethere are more peaks with a larger 119899 and the height of thesecondary peak is larger Therefore it is easy to detect thepeaks and detect the BOC signal
Figure 11 shows the performance of the proposed algo-rithm based on the quadrature channel correlation and thespectral correlation It is evident that the probability ofdetecting the BOC signal is higher for the quadrature channel
Based on quadrature channels correlationBased on spectral correlation
0
02
04
06
08
1
12
Det
ectio
n pr
obab
ility
minus16 minus14 minus12 minus10 minus8 minus6 minus4 minus2 0minus18SNR (dB)
Figure 11 Detection probability for different algorithms
Table 1 The results of the peak detection
SNRdB Number of peaks Height 120591sampled points Δℎ
10 dB
1 1 0 02 07992 20 020083 06021 40 019714 04122 60 018995 02197 80 01925
0 dB
1 1 0 02 07655 20 023453 05613 40 020424 04122 60 014915 0195 80 02172
minus10 dB1 1 0 02 07173 20 028273 05025 40 021484 03473 59 015525 02984 79 00489
correlation than for the spectral correlation algorithmUnderthe same conditions the detection probability for the BOCsignal is improved by about 2 dB
5 Conclusions
(1) The autocorrelation component of the carrier wave iseliminated by using the quadrature channel correlation If theadjacent autocorrelation peaks have the same lag differencesand height differences the BOC signal is detected effectivelyby detecting the absolute value of themultiple autocorrelationpeaks
(2) The ability to detect the BOC signal is related to thedata length and the ratio of 119891119904 to 119891119888 Larger values for the datalength and the ratio of119891119904 to119891119888 result in a higher probability to
10 Journal of Electrical and Computer Engineering
detect the BOC signal The algorithm presented in this paperis superior to the algorithm based on the spectral correlation
Conflicts of Interest
The authors declare that there are no conflicts of interestregarding the publication of this paper
Acknowledgments
This work is supported by the Science and Technology Foun-dation from Liaoning EducationDepartment (no L2015462)Shenyang Ligong University Liaoning Province InformationNetwork and Countermeasure Technology Key LaboratoryOpen Foundation (2015) and Shenyang Ligong UniversityPostdoctoral Science Foundation
References
[1] M Foucras J Leclere C Botteron et al ldquoStudy on the cross-correlation of GNSS signals and typical approximationsrdquo GPSSolutions vol 21 no 2 pp 293ndash306 2017
[2] B Tripathi R Tulsian and R C Jain ldquoPerformance Compar-ison of Sine and Cosine Phased BOC Signals Used for Radio-navigationrdquo in Proceedings of the IFAC vol 45 pp 223ndash2282012
[3] K Chae S R Lee H Liu and S Yoon ldquoAn unambiguous cor-relation function for generic sine-phased binary offset carriersignal trackingrdquo Computers and Electrical Engineering vol 49pp 161ndash172 2016
[4] Z Yanling L Xuejiao and W Xiaoqing ldquoAnalysis of satellitenavigation signal alternate binary offset carrier modulationrdquoJournal of Hubei University no 4 pp 334ndash339 2015
[5] Z Yao X CuiM Lu Z Feng and J Yang ldquoPseudo-correlation-function-based unambiguous tracking technique for sine-BOCsignalsrdquo IEEE Transactions on Aerospace and Electronic Systemsvol 46 no 4 pp 1782ndash1796 2010
[6] Y Lee D Chong I Song S Y Kim G-I Jee and S YoonldquoCancellation of correlation side-peaks for unambiguous BOCsignal trackingrdquo IEEE Communications Letters vol 16 no 5 pp569ndash572 2012
[7] A F Khalaf M I Owis and I A Yassine ldquoImage features ofspectral correlation function for arrhythmia classificationrdquo inProceedings of the 37th Annual International Conference of theIEEE Engineering inMedicine and Biology Society EMBC rsquo15 pp5199ndash5202 IEEE Milan Italy August 2015
[8] T Zhang D He S Chen and S Zhou ldquoSpectral correlation-based parameter estimation of BOCmodulation signalrdquo Journalof Huazhong University of Science and Technology vol 41 no 9pp 11ndash16 2013
[9] S Zhu D Zhao and F Wang ldquoHybrid prediction and fractalhyperspectral image compressionrdquo Mathematical Problems inEngineering vol 2015 Article ID 950357 10 pages 2015
[10] T Former ldquoPhase clustering based modulation classificationalgorithm for PSK signal over wireless environmentrdquo MobileInformation Systems vol 2016 Article ID 2398464 11 pages2016
[11] R Chen JWang R Lin and X Zhao ldquoSpectrum sensing basedon nonparametric autocorrelation in wireless communicationsystems under alpha stable noiserdquo Mobile Information Systemsvol 2016 Article ID 6753830 6 pages 2016
[12] F Guo Z Yao and M Lu ldquoBS-ACEBOC a generalizedlow-complexity dual-frequency constant-envelope multiplex-ingmodulation for GNSSrdquoGPS Solutions vol 21 no 2 pp 561ndash575 2017
[13] M S Yarlykov ldquoCorrelation functions of BOC and AltBOC sig-nals as the inverse Fourier transforms of energy spectrardquo Jour-nal of Communications Technology and Electronics vol 61 no8 pp 857ndash876 2016
[14] M S Yarlykov and S M Yarlykova ldquoCorrelation functions ofcomplete CBOC signals derived as the inverse Fourier trans-form of energy spectrardquo Journal of Communications Technologyand Electronics vol 62 no 2 pp 128ndash140 2017
[15] B Yin G Wang and Y Qi ldquoUnambiguous sine-phased binaryoffset carrier modulated signal tracking techniquerdquo Optik -International Journal for Light and Electron Optics vol 132 pp284ndash290 2017
[16] P Weichuan W Xue and H Chengyan ldquoResearch on corre-lation peaks detection algorithm for multiplex signal of navi-gation systemsrdquo Journal of Time and Frequency vol 38 no 3pp 163ndash170 2015
[17] F Liu and Y Feng ldquoA new acquisition algorithm with elimina-tion side peak for all BOC signalsrdquo Mathematical Problems inEngineering vol 2015 Article ID 140345 9 pages 2015
[18] K Chae S R Lee H Liu et al ldquoA novel unambiguous com-posite binary offset carrier (6 1 111) tracking based on partialcorrelationsrdquo Computers and Electrical Engineering vol 50 pp54ndash66 2016
International Journal of
AerospaceEngineeringHindawiwwwhindawicom Volume 2018
RoboticsJournal of
Hindawiwwwhindawicom Volume 2018
Hindawiwwwhindawicom Volume 2018
Active and Passive Electronic Components
VLSI Design
Hindawiwwwhindawicom Volume 2018
Hindawiwwwhindawicom Volume 2018
Shock and Vibration
Hindawiwwwhindawicom Volume 2018
Civil EngineeringAdvances in
Acoustics and VibrationAdvances in
Hindawiwwwhindawicom Volume 2018
Hindawiwwwhindawicom Volume 2018
Electrical and Computer Engineering
Journal of
Advances inOptoElectronics
Hindawiwwwhindawicom
Volume 2018
Hindawi Publishing Corporation httpwwwhindawicom Volume 2013Hindawiwwwhindawicom
The Scientific World Journal
Volume 2018
Control Scienceand Engineering
Journal of
Hindawiwwwhindawicom Volume 2018
Hindawiwwwhindawicom
Journal ofEngineeringVolume 2018
SensorsJournal of
Hindawiwwwhindawicom Volume 2018
International Journal of
RotatingMachinery
Hindawiwwwhindawicom Volume 2018
Modelling ampSimulationin EngineeringHindawiwwwhindawicom Volume 2018
Hindawiwwwhindawicom Volume 2018
Chemical EngineeringInternational Journal of Antennas and
Propagation
International Journal of
Hindawiwwwhindawicom Volume 2018
Hindawiwwwhindawicom Volume 2018
Navigation and Observation
International Journal of
Hindawi
wwwhindawicom Volume 2018
Advances in
Multimedia
Submit your manuscripts atwwwhindawicom
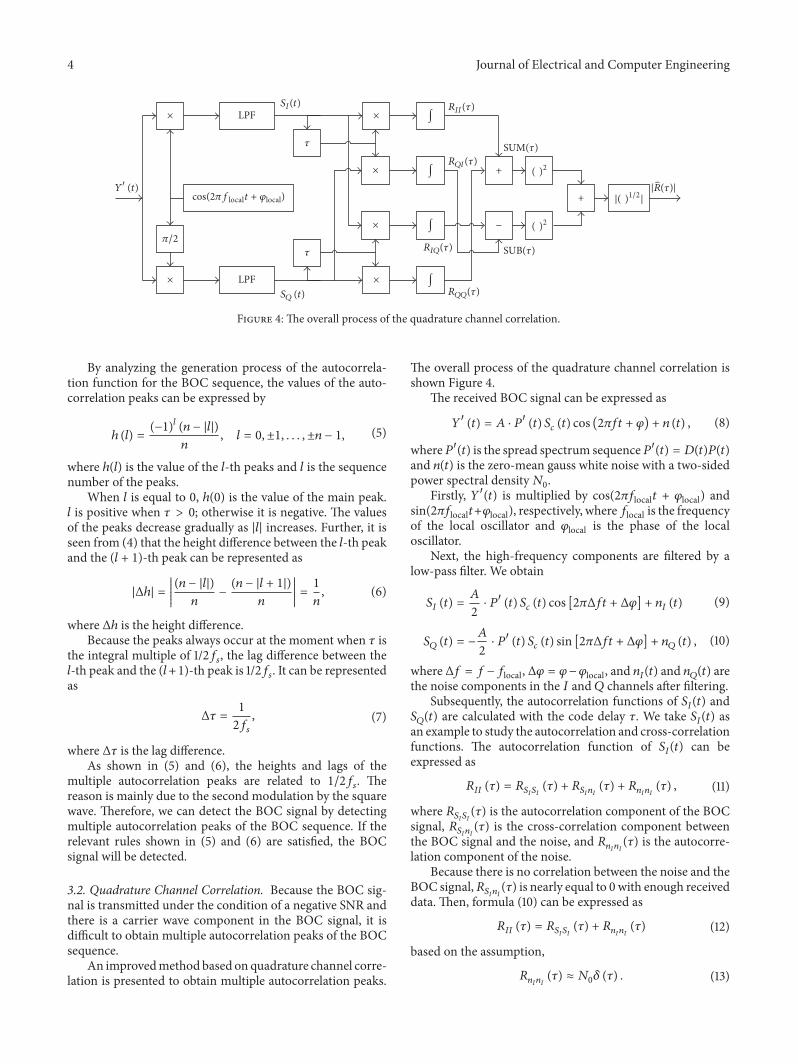
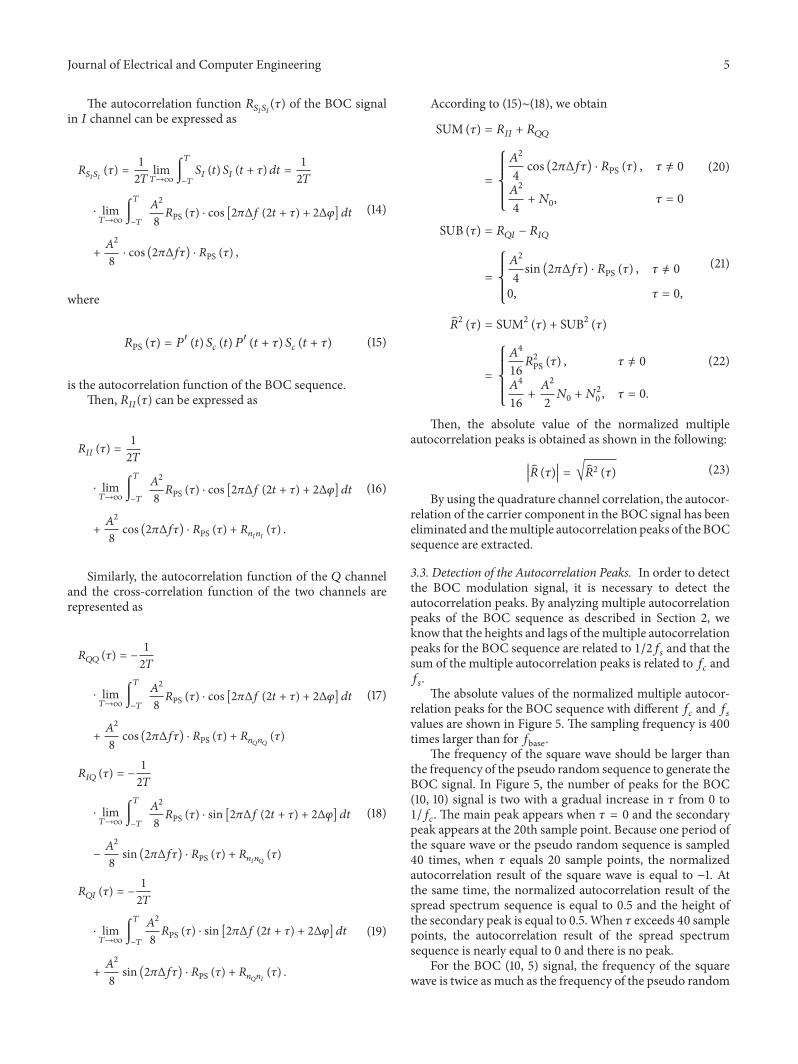
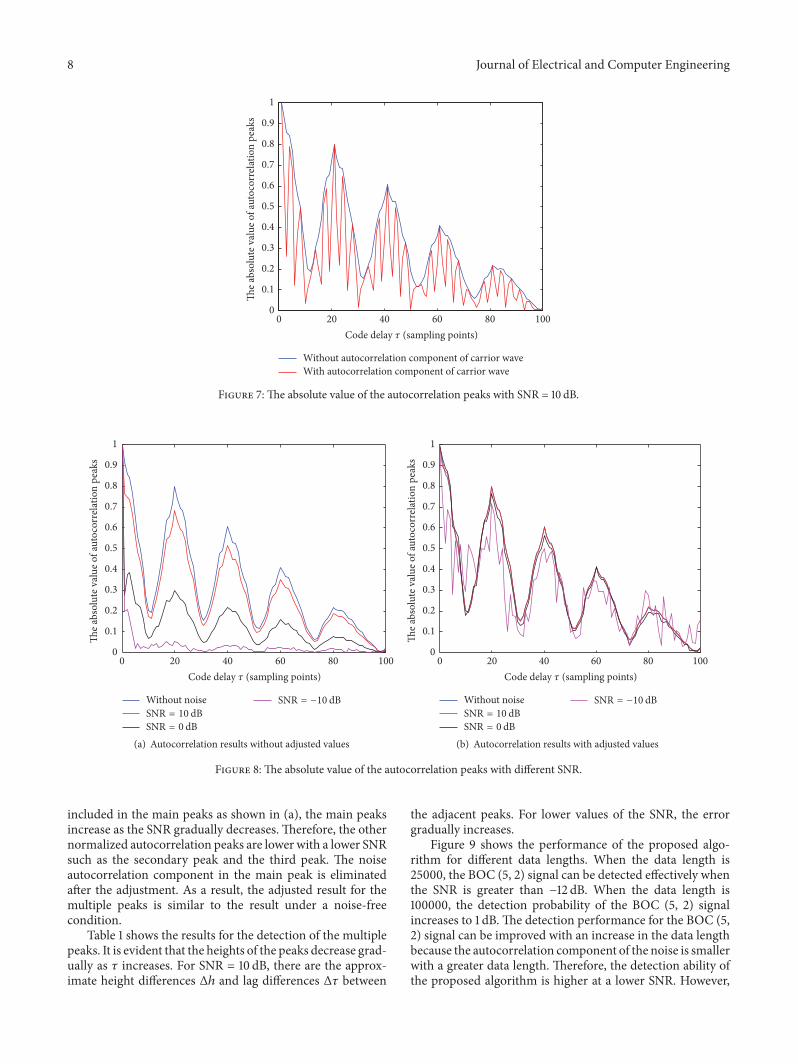
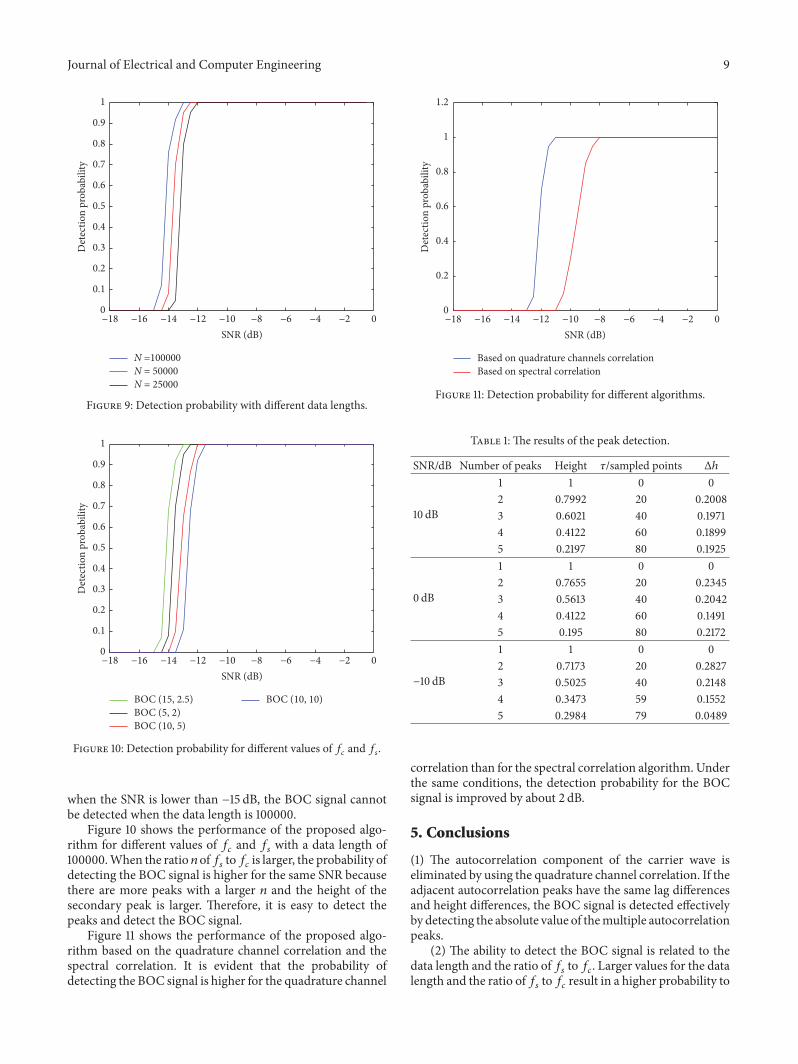

International Journal of
AerospaceEngineeringHindawiwwwhindawicom Volume 2018
RoboticsJournal of
Hindawiwwwhindawicom Volume 2018
Hindawiwwwhindawicom Volume 2018
Active and Passive Electronic Components
VLSI Design
Hindawiwwwhindawicom Volume 2018
Hindawiwwwhindawicom Volume 2018
Shock and Vibration
Hindawiwwwhindawicom Volume 2018
Civil EngineeringAdvances in
Acoustics and VibrationAdvances in
Hindawiwwwhindawicom Volume 2018
Hindawiwwwhindawicom Volume 2018
Electrical and Computer Engineering
Journal of
Advances inOptoElectronics
Hindawiwwwhindawicom
Volume 2018
Hindawi Publishing Corporation httpwwwhindawicom Volume 2013Hindawiwwwhindawicom
The Scientific World Journal
Volume 2018
Control Scienceand Engineering
Journal of
Hindawiwwwhindawicom Volume 2018
Hindawiwwwhindawicom
Journal ofEngineeringVolume 2018
SensorsJournal of
Hindawiwwwhindawicom Volume 2018
International Journal of
RotatingMachinery
Hindawiwwwhindawicom Volume 2018
Modelling ampSimulationin EngineeringHindawiwwwhindawicom Volume 2018
Hindawiwwwhindawicom Volume 2018
Chemical EngineeringInternational Journal of Antennas and
Propagation
International Journal of
Hindawiwwwhindawicom Volume 2018
Hindawiwwwhindawicom Volume 2018
Navigation and Observation
International Journal of
Hindawi
wwwhindawicom Volume 2018
Advances in
Multimedia
Submit your manuscripts atwwwhindawicom