Embed Size (px)
Citation preview
A Detector for Proton Computed Tomography
G.Blazey, S.Boi, G.Coutrakon, A.Dyshkant, L.Farnand, A.Gearhart, D.Hedin, E.Johnson, J.Kalnins, P.Salcido, S.Uzunyan, V.Zutshi, NICADD at NIU, USA
J.Rauch, P.Rubinov, G.Sellberg, P.Wilson, FNAL, USA
K. Lalwani, M. Naimuddin, University of Delhi, India
Submitted to the 13th Vienna conference on instrumentation February 2013.
Poster Session A, Board: 42
Preface: Radiation therapy is a widely recognized treatment for cancer. Energetic protons have distinct features that set them apart from photons and make them desirable for cancer therapy as well as medical imaging. The clinical interest in heavy ion therapy is due to the fact that ions deposit almost all of their energy in a sharp peak – the Bragg peak- at the very end of their path. Proton beams can be used to precisely localize a tumor and deliver an exact dose to the tumor with small doses to the surrounding tissue. Proton computed tomography (pCT) provides direct information on the location on the target tumor, and avoids position uncertainty caused by treatment planning based on imaging with X-ray CT. The pCT project goal is to measure and reconstruct the proton relative stopping power distribution directly in situ. To ensure the full advantage of cancer treatment with 200 MeV proton beams, pCT must be realized.
Introduction: In our pCT project the general idea is to use an approximately 2,200 channel system in a
low intensity beam to sample the trajectory of 200 MeV protons before and after passing through a
“Herman head” phantom, to fully reconstruct the proton tracks, and register each proton’s residual
energy in the range calorimeter. Proton exposure time 7.4 min with a gantry rotation speed of 0.1 RPM
(gantry is a structure to rotate the particle beam and guide it to the patient at chosen angles). 100 useful
protons are used per ~10 million voxels (for a 1.25x1 mm² voxel area).
A collection of such events is used to build a 3D-image of the density distribution inside the phantom.
The primary project goal is to record about one billion proton tracks and reconstruct the image in about
10 minutes. Our pCT project has extensive software and hardware sub-projects. The tracker and range
calorimeter information are collected by an ultra fast data acquisition system. DAQ rate needed ~3 MHz.
Detector resolution time is about ~100nsec and about ~25nsec between two events. The track and
energy information are used by a sophisticated reconstruction program on a dedicated CPU-GPU farm to
build a 3D-image of the tumor. This presentation will concentrate on the range calorimeter including the
frame-modular design, construction, extensive testing and optimization in the laboratory using
radioactive source, and the response to a 200 MeV proton beam.
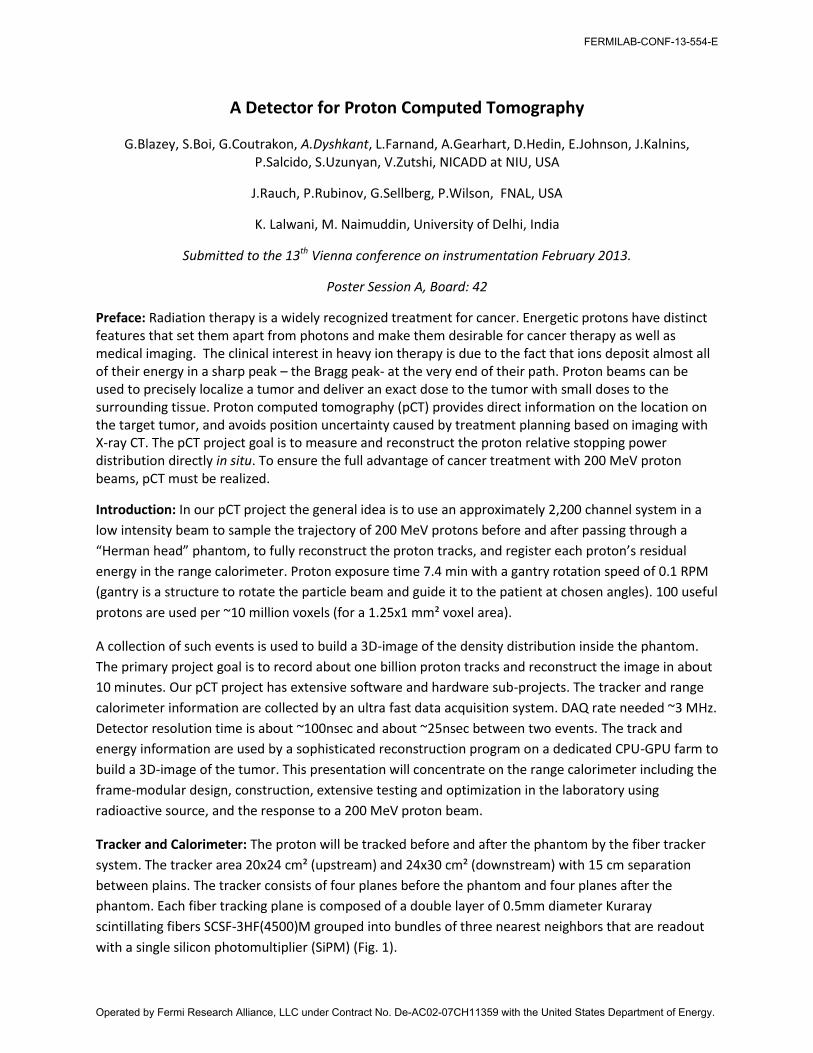
Tracker and Calorimeter: The proton will be tracked before and after the phantom by the fiber tracker
system. The tracker area 20x24 cm² (upstream) and 24x30 cm² (downstream) with 15 cm separation
between plains. The tracker consists of four planes before the phantom and four planes after the
phantom. Each fiber tracking plane is composed of a double layer of 0.5mm diameter Kuraray
scintillating fibers SCSF-3HF(4500)M grouped into bundles of three nearest neighbors that are readout
with a single silicon photomultiplier (SiPM) (Fig. 1).
FERMILAB-CONF-13-554-E
Operated by Fermi Research Alliance, LLC under Contract No. De-AC02-07CH11359 with the United States Department of Energy.

The purpose of the range detector is to determine the energy loss of a 200 MeV proton after passing
through the phantom. Ninety-six scintillating tiles with dimensions of 27cm width, 36 cm height, and
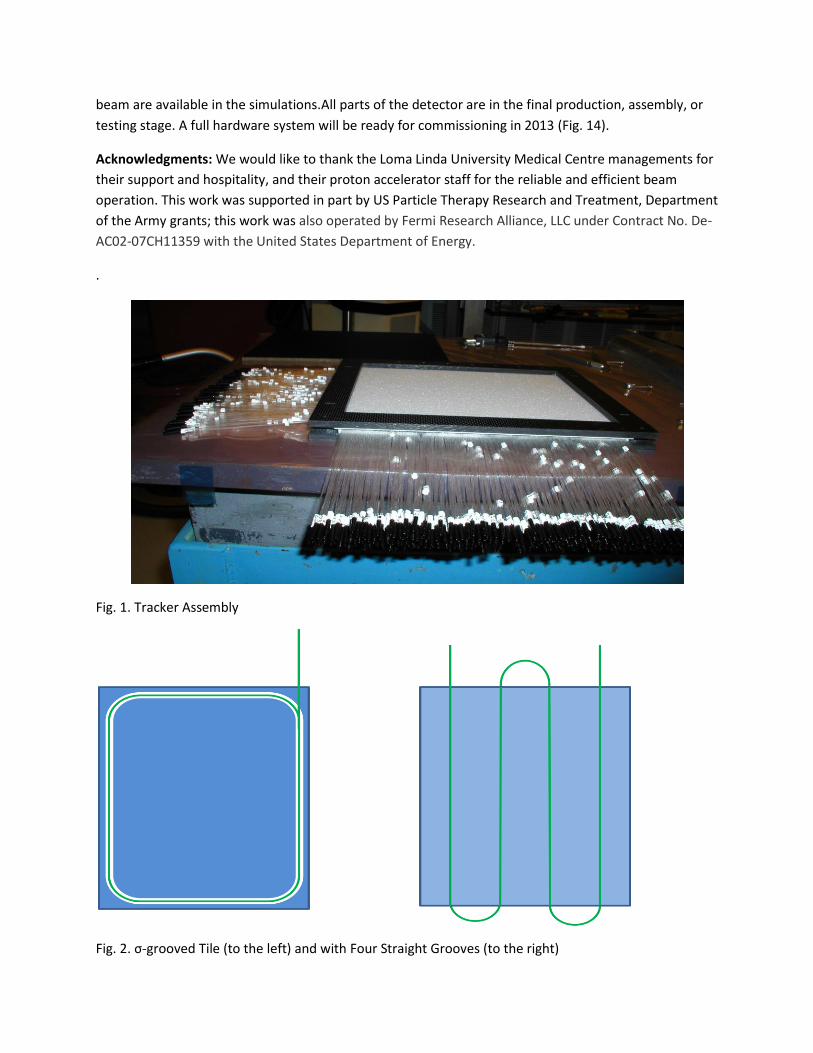
3.2mm thickness made of EJ-200 (similar to BC-408 or Pilot F) were used in the range stack. Plastic
scintillators were machined on one side to a thickness of 3.2mm with a tolerance within 0.05 mm. Each
scintillator tile has four strait “key” shaped shallow grooves embedding a single Kuraray Y11 1.2mm
diameter WLS fiber holding to the frame with collets for SiPM readout at both ends (Fig. 2, Fig. 9, Fig.
10). There is no glue in the range detector. CPTA-151-30 SiPMs (Metal-Resistor-Semiconductor Geiger
gain Avalanche Photo Diode) made in Russia are used for readout. The active area of the photo detector
is about 1.28 mm in diameter. Each SiPM consists of 796 pixels. The SiPM quantum efficiency is about
40% at λ=600nm.
Laboratory Study: The impacts of the groove shape, dimension, configuration, and position on light
output and uniformity were extensively studied in the laboratory using precision two dimensional tables
with a collimated Sr-90 radioactive source for scanning (Fig. 3). The impact of reflective wrapping
material on the light output and uniformity of response was studied to reduce the dead material
between scintillators (Fig. 4, Fig. 5, Fig. 6, Fig. 7, Fig. 8). A silicon photo detector connected to a Keithley
6487 picoammeter/voltage source was used for current measurements.
pCT Electronics and Event Size: The pCT electronics consists of the SiPM Interface Board (SIB) and the
amplifier digitizer board (PAD-E). There are two types of the detector interface boards; one for the fiber
tracker that is connected to 64 photo detectors and one for the range stack that can be connected to 32
or 16 photo detectors. The digitizer board uses four AD9276 chips, for a total of 32 channels, to measure
the amplitude vs. time as the signal develops. A single Xilinx XC6SLX16 “Spartan6” FPGA on the board
receives data from the digitizer and transfers only data appropriate for reconstruction of the proton
track. The board also includes a generator to adjust the individual bias voltage of each SiPM, a gigabit
DDR2 DRAM working memory, gigabit Ethernet interface, and two high speed serial links for distribution
of the clock signal and synchronization of data across the system. The fiber tracker data rate is 30MB/s
and the Scintillator Stack rate is 720 MB/s total at 10 M protons/sec. The data size for one event is about
800 bytes (Fig. 11).
Back-End DAQ System: We are developing the hardware and software framework for the Back-End Data
Acquisition system. The high pCT data collection and processing rates require six data collection work
stations connected with a 2Gbit/s internal network. Each workstation has four 1Gb/s input channels;
twelve 2.6GHz CPU cores; 64 GB RAM, and a solid state drive. The Back-End DAQ accumulates data from
the input streams and runs the reconstruction software as well. Tests indicate that the system can
collect data at about 50 MB/s with a data loss rate less than 0.06% (Fig. 12).
Comments: The design prototypes of our range stack frames were tested at Loma Linda University
Medical Center (California, USA) in a 200 MeV proton beam. The light output is adequate and
demonstrates the possibility of designing the range stack without light shields, thereby reducing the
dead material (Fig. 13). A full GEANT4 simulation of the pCT detector has been developed. The QGSP
BERT model, based on the Bertini cascade model, is used. Two types of phantoms and two types of
beam are available in the simulations.All parts of the detector are in the final production, assembly, or
testing stage. A full hardware system will be ready for commissioning in 2013 (Fig. 14).
Acknowledgments: We would like to thank the Loma Linda University Medical Centre managements for
their support and hospitality, and their proton accelerator staff for the reliable and efficient beam
operation. This work was supported in part by US Particle Therapy Research and Treatment, Department
of the Army grants; this work was also operated by Fermi Research Alliance, LLC under Contract No. De-
AC02-07CH11359 with the United States Department of Energy.
.
Fig. 1. Tracker Assembly
Fig. 2. σ-grooved Tile (to the left) and with Four Straight Grooves (to the right)
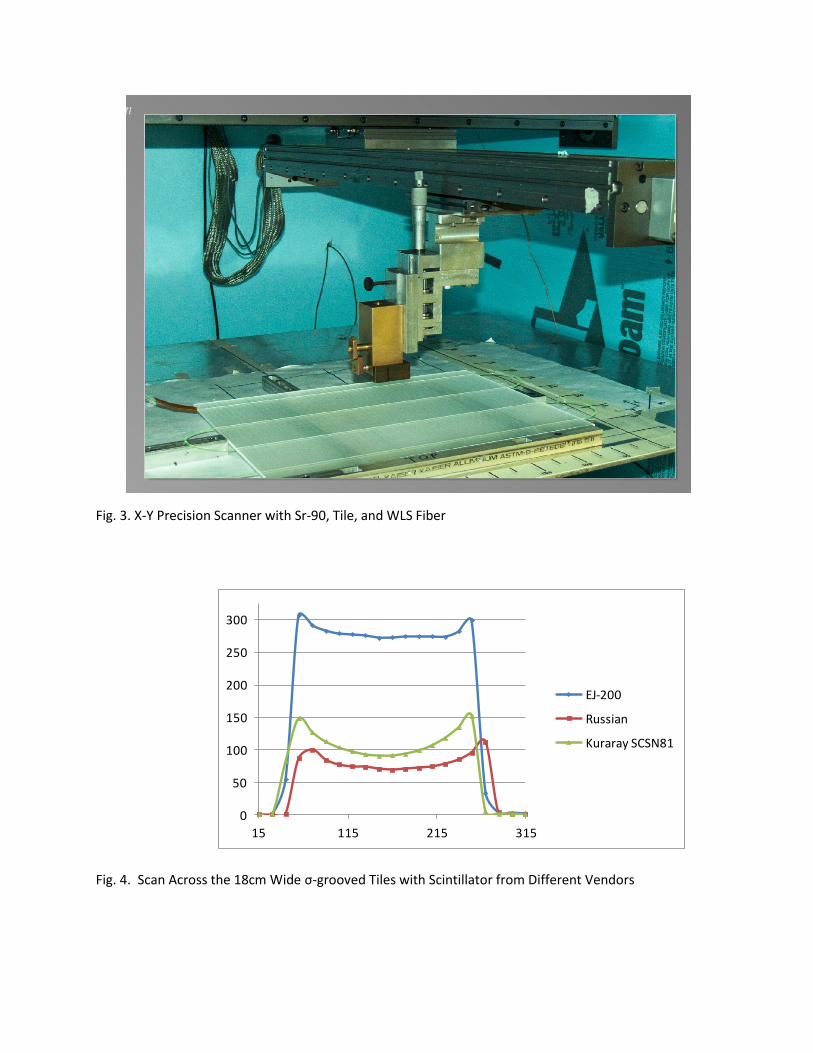
Fig. 3. X-Y Precision Scanner with Sr-90, Tile, and WLS Fiber
Fig. 4. Scan Across the 18cm Wide σ-grooved Tiles with Scintillator from Different Vendors
0
50
100
150
200
250
300
15 115 215 315
EJ-200
Russian
Kuraray SCSN81
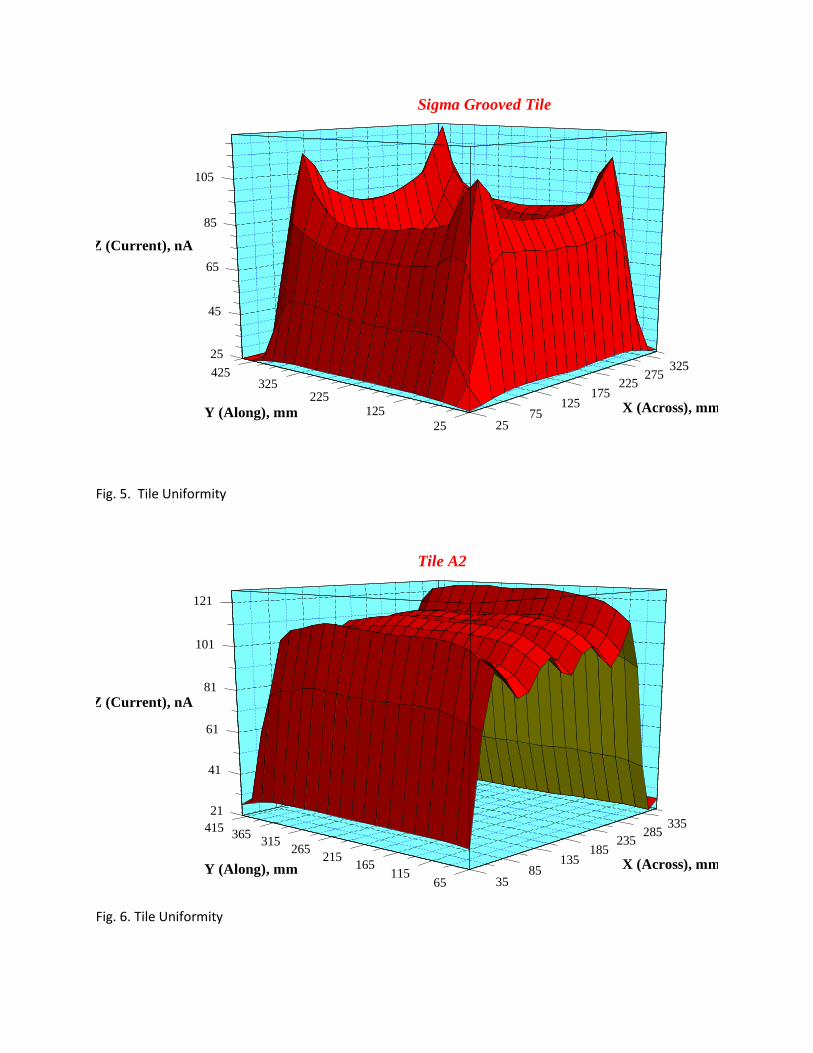
Fig. 5. Tile Uniformity
Fig. 6. Tile Uniformity
Sigma Grooved Tile
X (Across), mmY (Along), mm
Z (Current), nA
2575
125175
225275
325
25
125225
325425
25
45
65
85
105
Tile A2
X (Across), mmY (Along), mm
Z (Current), nA
3585
135185
235285
335
65115
165215
265315
365415
21
41
61
81
101
121
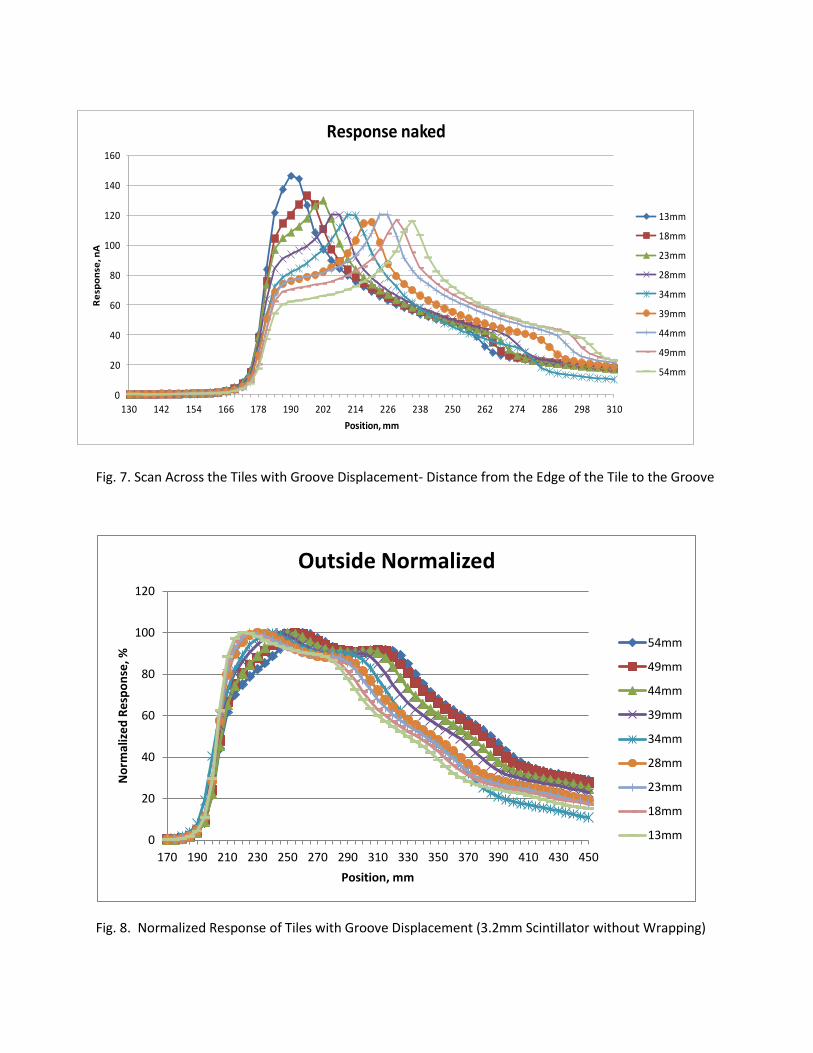
Fig. 7. Scan Across the Tiles with Groove Displacement- Distance from the Edge of the Tile to the Groove
Fig. 8. Normalized Response of Tiles with Groove Displacement (3.2mm Scintillator without Wrapping)
0
20
40
60
80
100
120
170 190 210 230 250 270 290 310 330 350 370 390 410 430 450
No
rmal
ize
d R
esp
on
se, %
Position, mm
Outside Normalized
54mm
49mm
44mm
39mm
34mm
28mm
23mm
18mm
13mm
0
20
40
60
80
100
120
140
160
130 142 154 166 178 190 202 214 226 238 250 262 274 286 298 310
Re
spo
nse
, nA
Position, mm
Response naked
13mm
18mm
23mm
28mm
34mm
39mm
44mm
49mm
54mm
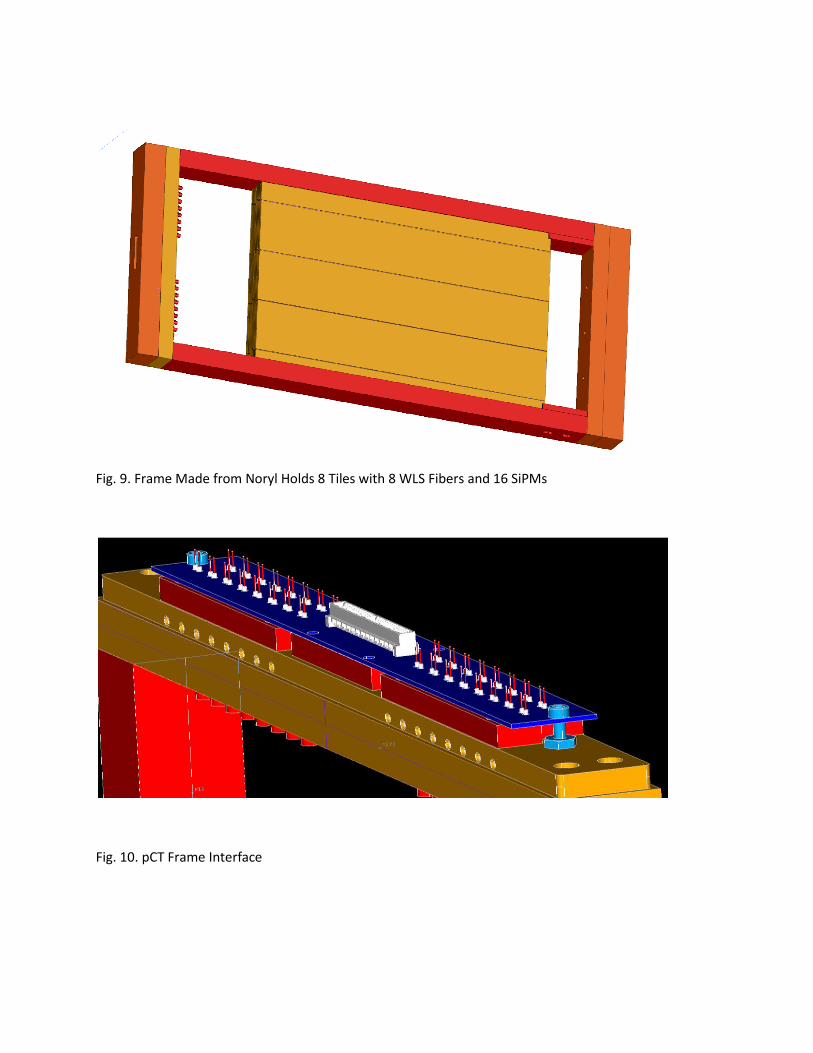
Fig. 9. Frame Made from Noryl Holds 8 Tiles with 8 WLS Fibers and 16 SiPMs
Fig. 10. pCT Frame Interface
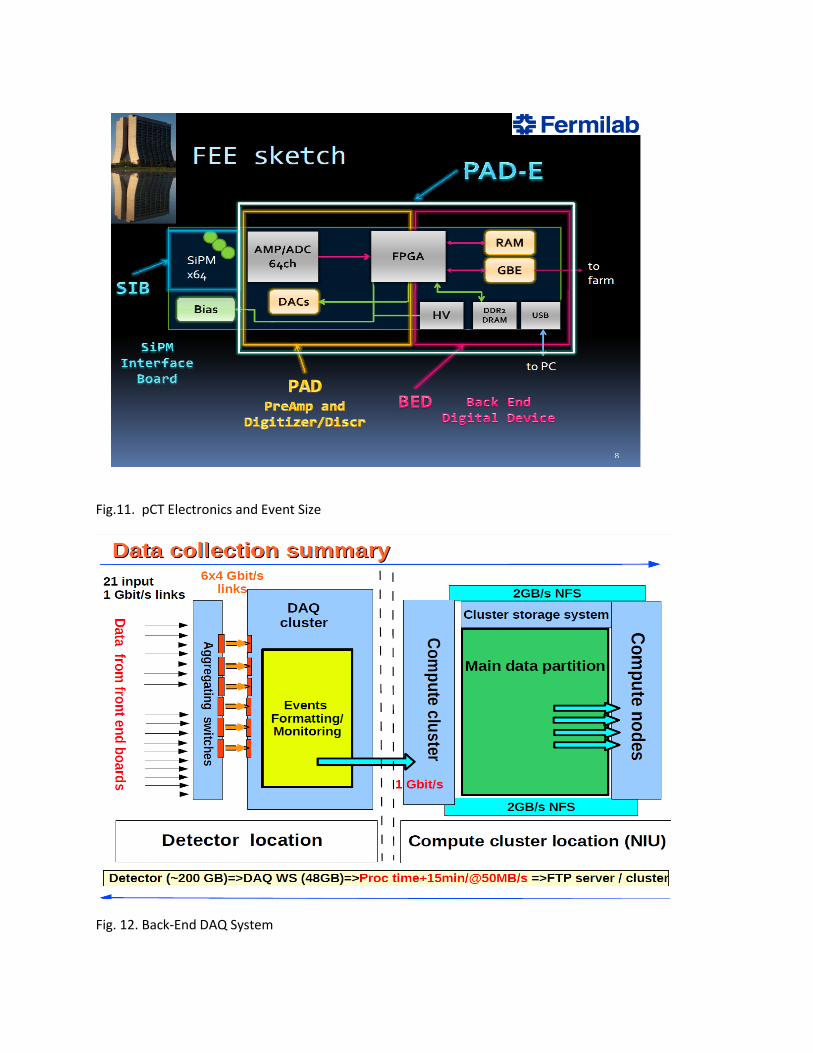
Fig.11. pCT Electronics and Event Size
Fig. 12. Back-End DAQ System
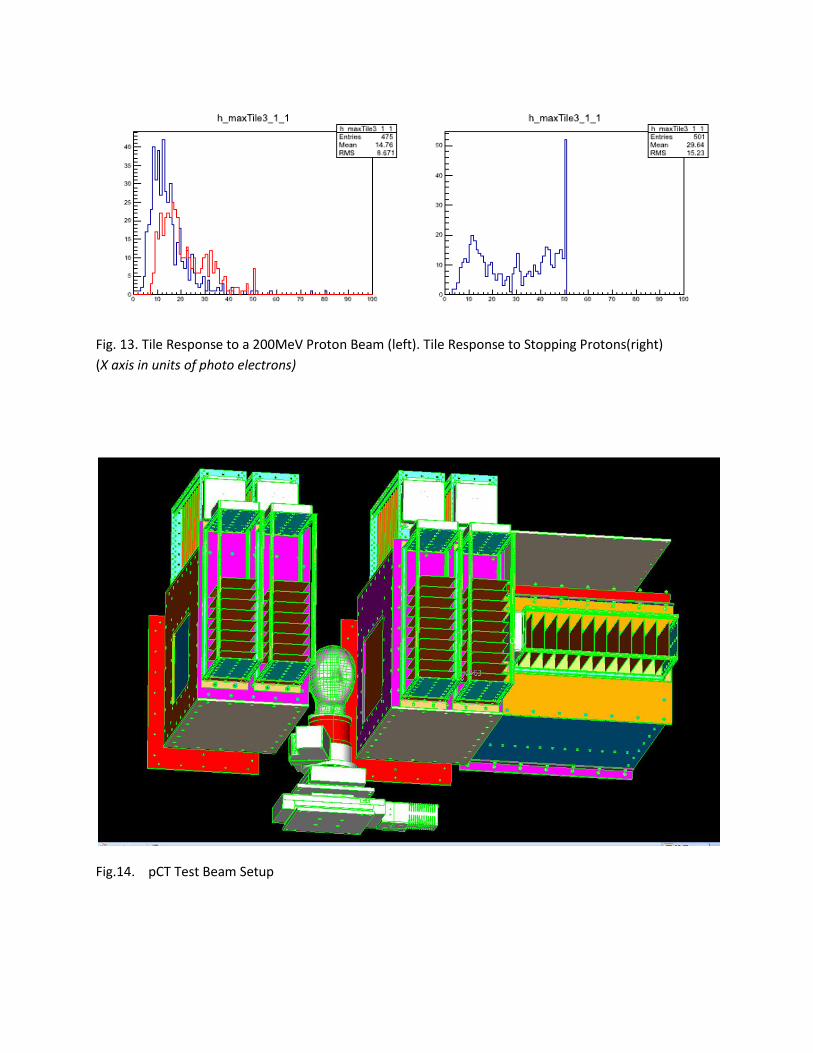
Fig. 13. Tile Response to a 200MeV Proton Beam (left). Tile Response to Stopping Protons(right)
(X axis in units of photo electrons)
Fig.14. pCT Test Beam Setup