Embed Size (px)
Citation preview
INTERNATIONAL JOURNAL OF CLIMATOLOGY
Int. J. Climatol. 18: 1223–1236 (1998)
A DETERMINATION OF CHARACTER AND FREQUENCY CHANGESIN AIR MASSES USING A SPATIAL SYNOPTIC CLASSIFICATION
LAURENCE S. KALKSTEIN*, SCOTT C. SHERIDAN and DANIEL Y. GRAYBEALCenter for Climatic Research, Uni6ersity of Delaware, Newark, DE 19716, USA
Recei6ed 3 No6ember 1997Re6ised 18 March 1998
Accepted 19 March 1998
ABSTRACT
Of the numerous climate change studies which have been performed, few of these have analyzed recent trends usingan air mass-based approach. The air mass approach is superior to simple trend analysis, as it can identify patternswhich may be too subtle to influence the entire climate record. The recently-developed ‘spatial synoptic classification’(SSC) is thus used to identify trends over the contiguous United States for summer and winter seasons from 1948 to1993. Both trends in air mass frequency and character have been assessed.
The most noteworthy trend in frequency is a decline in air mass transitional days (TR) during both seasons. Inwinter, decreases of up to 1% per decade are noted in parts of the central U.S. Other notable trends include a decreasein moist tropical (MT) air in winter, and an increase in MT in summer over the southeastern states.
Numerous national and local air mass character changes have been uncovered. A large overall upward trend incloudiness is noted in summer. All air masses feature an overnight increase, yet afternoon cloudiness increases aregenerally limited to the three ‘dry air masses’. Also in summer, a significant warming and increase in dew point ofMT air has occurred at many locales. The most profound winter trend is a large decrease in dew point (up to 1.5°Cper decade) in the dry polar (DP) air mass over much of the eastern states. © 1998 Royal Meteorological Society.
KEY WORDS: synoptic climatology; USA; climate change; climate trends; air mass frequency; air mass character; spatial synopticclassification
1. INTRODUCTION
Recent climate trends have been analyzed using a number of distinct methods. The ubiquitous meanannual global temperature trendline (IPCC, 1996) shows an irregular rise of less than 1°C in temperatureover the past 130 years. Numerous other studies have produced mean temperature trends for parts of theglobe or parts of the year, with differing results (Hansen and Lebedeff, 1987; Jones, 1988; Spencer andChristy, 1990; Balling and Christy, 1996). Karl et al. (1993) split the temperature record into maximumand minimum temperature components, and discovered a significant increase in minimum temperaturewith a lesser change in maximum temperature. Using a different data set, Michaels et al. (1988) analyzedtrends in upper-level heights over the North American Arctic for a 40-year period and suggested nostatistically significant trend over time.
Few studies have been conducted which attempt to assess recent climate trends using a synopticclimatological method. The synoptic approach to evaluate climate change has distinct advantages overutilizing raw or adjusted long-term temperature data. For example, the character of some air massesmight be undergoing alteration conducive to warming, but these changes might be too subtle to bedetected through evaluation of mean annual temperatures, which does not discriminate between airmasses (Ye et al., 1995). Kalkstein et al. (1990), using a clustering analysis (TSI) routine, analyzed data
* Correspondence to: Center for Climatic Research, University of Delaware, Newark, DE 19716, USA; tel.: +1 302 8318269; fax:+1 302 8316654; e-mail: [email protected]
Contract grant sponsor: U.S. Environmental Protection Agency; Contract grant number: Cooperative Agreement CR-824404
CCC 0899–8418/98/111223–14$17.50© 1998 Royal Meteorological Society
L.S. KALKSTEIN ET AL.1224
for four stations in the Yukon and Alaska, where some of the highest mean temperature increases havebeen reported. They noted that the frequency of the warmest air masses increased at the expense of thecolder air masses. Also, the coldest air masses were shown to be warming during the 1953–1986 periodof study. An updated study (Ye et al., 1995), which included several Russian Arctic stations as well, andaccounted for ‘residence time’ of air masses, produced significant results at fewer stations. Schwartz (1995)developed a synoptic classification scheme based on 850 hPa temperature and dew point data for stationsin the north central U.S. using data from 1958 to 1992. He discovered several frequency and characterchanges over the region in all seasons, and he suggested that increased frequency of 500 hPa troughs inthe western U.S. has led to a slight but steady increase in hot, humid conditions over the region duringthe warm season.
The goal of this paper is to evaluate character and frequency changes in air masses for over 100 citiesin the United States for the period 1948–1993 using a newly developed air mass-based synopticclassification. This new classification identifies the same air masses over a continental-sized region,something that our previous scheme (the TSI) was not able to do. Thus, direct comparisons betweenregions are now possible, and systematic changes in character and frequency over large areas can be notedif such changes, in fact, do exist.
2. DATA AND METHODOLOGY
The Spatial Synoptic Classification (SSC) utilized in this research (Kalkstein et al., 1996) is an airmass-based system which is concerned more with the meteorological characteristics of the air mass ratherthan the geographical source region. Unlike most existing air mass-based techniques such as the TSI, theSSC requires initial identification of the major air masses that traverse the nation, as well as their typicalmeteorological characteristics. The final result is identification of more air masses than the four historicalcategories (mT, mP, cT, and cP) developed by Bergeron (1930). For example, air mass characteristics ofdry, adiabatically warmed Pacific air on the lee side of the Rocky Mountains represents an importantcategory in the SSC, although its character at the source region is much different.
The SSC thus defines six air mass types for the continental United States, although some are notpresent at certain stations at particular times of the year. They are:
(i) DP (dry polar) is synonymous with the traditional cP air mass classification. This air mass isgenerally advected from Canada through circulation around a cold-core anticyclone, and is usuallyassociated with the lowest temperatures observed in a region for a particular time of year, as well asclear, dry conditions;
(ii) the DT (dry tropical) air mass is generally the same as the cT air mass; it represents the hottest anddriest conditions found at any location. There are two modes of development for this air mass: eitherit is advected from the southwestern U.S. or Sonoran Desert of Mexico, or it is produced by rapidlydescending air, such as the Chinook or Santa Ana winds;
(iii) DM (dry moderate) air is mild and dry. It is typically found in the eastern and central U.S.associated with zonal flow aloft, when adiabatically-warmed and dried air moves eastward aftercrossing the Rocky Mountains. It may also be found in the southeastern U.S. when polar air isadvected around a surface anticyclone with a long trajectory over the Atlantic Ocean;
(iv) MP (moist polar) air is a large subset of the mP air mass; weather conditions are typically cloudy,humid, and cool. MP air appears either by inland transport from a cool ocean, or as a result offrontal overrunning well to the south of the region;
(v) MM (moist temperate) air is considerably warmer and more humid than MP. The MM air masstypically appears in a zone south of MP air, still in an area of overrunning, but with the responsiblefront much nearer. This air mass may persist for many days if frontal movement is particularlylethargic;
© 1998 Royal Meteorological Society Int. J. Climatol. 18: 1223–1236 (1998)
CHARACTER AND FREQUENCY CHANGES IN AIR MASSES 1225
(vi) MT (moist tropical), analogous to mT, is warm and very humid. It is typically found in warm sectorsof frontal cyclones or in a gulf return flow on the western side of an anticyclone in the eastern andcentral U.S.
The foundation for the development of the SSC is the proper selection of ‘seed days’ for each of the airmasses above. A seed day for each air mass represents a day with the typical meteorological character ofeach air mass at a location; seed days are employed to classify all other days within an air mass category.Criteria are set up to ensure that each seed day belongs in that category; there are limits to the diurnalrange of several parameters (e.g. dew point) to eliminate days of air mass transition, and there are limitsto values of certain parameters whose characteristics for a given air mass are generally established (e.g.afternoon temperature less than a certain threshold for a dry polar air mass).
Discriminant function analysis is then used to produce equations for each air mass based on the chosenseed days. These equations evaluate each day in a given record, and assign a classification based on whichgroup the day resembles most from a meteorological standpoint. Air mass transition days are initiallyincorrectly assigned by this system, and a second seed day procedure is then done to separate transitionfrom non-transition days. Days which are not transitional retain their original assignment; those whichare, become reclassified as Transition (TR). Thus, every day in the period of record is classified as one ofthe major air mass types or as a transition situation. Please refer to Kalkstein et al. (1996) for a muchmore detailed explanation of SSC development.
In this study, trends in air mass frequency and character are evaluated to determine statisticallysignificant changes through time. The data used in this project are 6-hourly airport observations oftemperature, dew point, cloud cover, sea level pressure, and u- and 6-components of the wind. A total of118 stations for summer and 109 stations for winter have been examined (selection is based oncompleteness of record; refer to Figure 4 (summer) and Figure 6 (winter) for station location). Allavailable days from the months June–August (summer) and December through February (winter) from1948–1993 have been included in the frequency and character evaluations. However, in the trend data,only years in which greater than 80% of the data are available have been included in the calculations. Alltrends are determined using a standard least squares regression formula, and the level of statisticalsignificance is a=0.05.
3. RESULTS
3.1. Air mass frequency: patterns and trends
An evaluation of air mass frequencies for the period 1948–1993 reveals spatial coherence andsystematic changes across the country. Some of these have been documented previously for the easternU.S. using the SSC (Kalkstein et al., 1996), and have been expanded for the entire country here (Figures1 and 2).
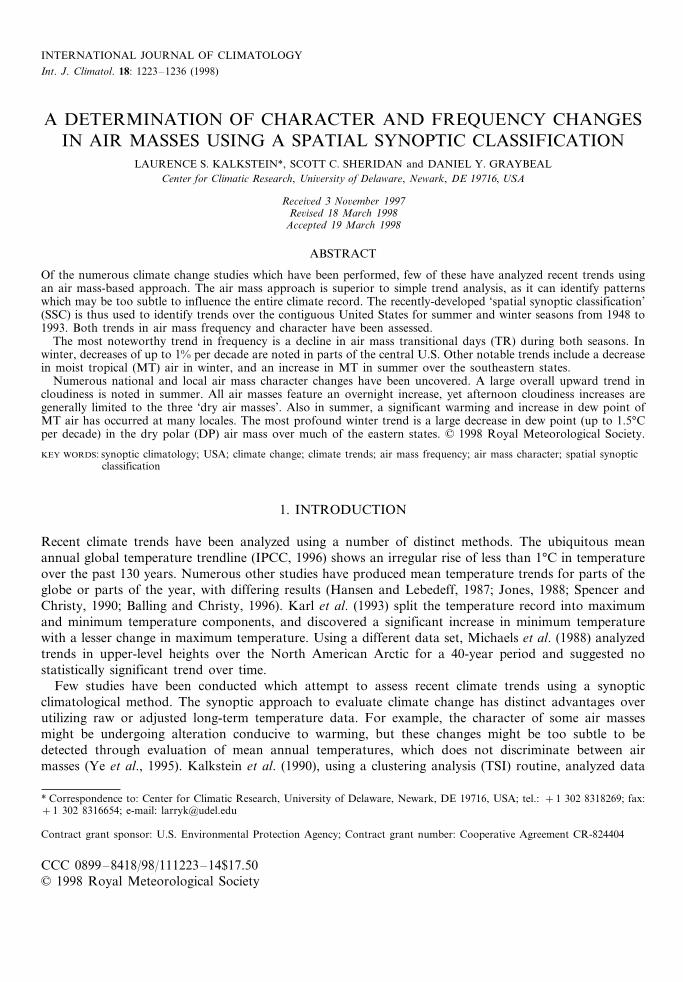
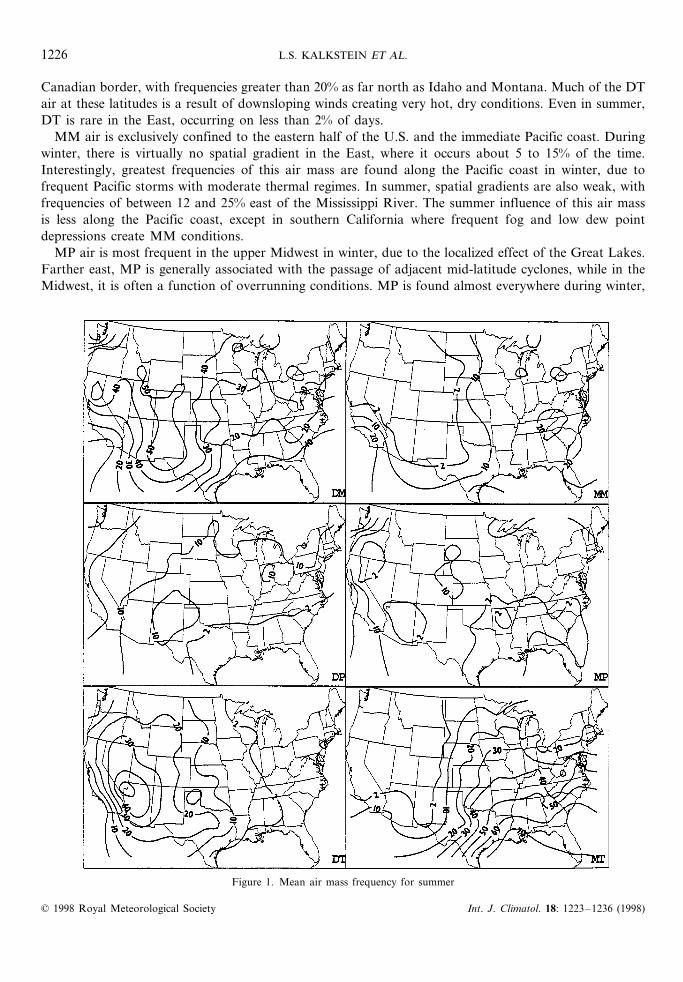
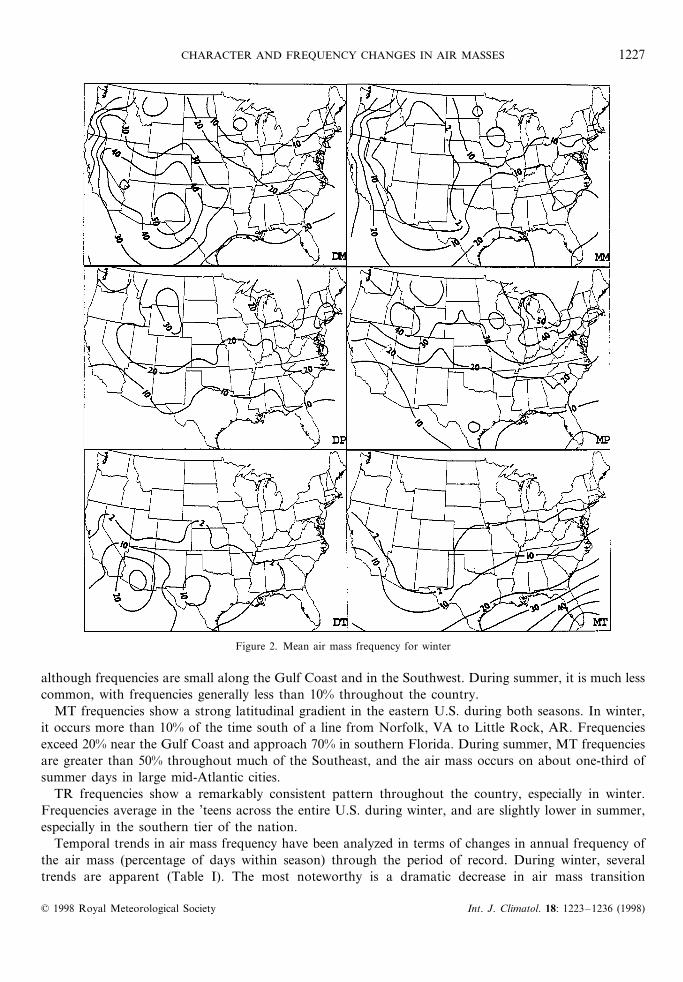
During both summer and winter, DM air is most prevalent in and directly east of the RockyMountains. Mean winter frequencies range from 25–50% in this area, with slightly higher values insummer. Much of the southeastern U.S. is influenced by this air mass between 20 and 30% of the timein winter, but it occurs considerably less frequently in summer, when weak upper level flow diminishes thepossibility of its intrusion. However, farther north, DM air is more prevalent in summer, and frequenciesin the Northeast and Midwest can exceed 30% during this season.
DP air shows a pronounced north-south frequency gradient during both seasons. In winter, a markeddecrease in DP frequency occurs around the Great Lakes, a result of frequent overcast conditions andassociated low dew point depressions. In summer, DP air occurs less than 20% of the time almosteverywhere, and is absent along the Gulf Coast and Florida.
The DT air mass has a range generally limited to the western United States. During winter, it is mostcommon in an area from the Desert Southwest eastward to Texas. Frequencies exceed 30% in the deserts,and diminish to around 10% in parts of Texas. During summer, DT air extends northward to the
© 1998 Royal Meteorological Society Int. J. Climatol. 18: 1223–1236 (1998)
L.S. KALKSTEIN ET AL.1226
Canadian border, with frequencies greater than 20% as far north as Idaho and Montana. Much of the DTair at these latitudes is a result of downsloping winds creating very hot, dry conditions. Even in summer,DT is rare in the East, occurring on less than 2% of days.
MM air is exclusively confined to the eastern half of the U.S. and the immediate Pacific coast. Duringwinter, there is virtually no spatial gradient in the East, where it occurs about 5 to 15% of the time.Interestingly, greatest frequencies of this air mass are found along the Pacific coast in winter, due tofrequent Pacific storms with moderate thermal regimes. In summer, spatial gradients are also weak, withfrequencies of between 12 and 25% east of the Mississippi River. The summer influence of this air massis less along the Pacific coast, except in southern California where frequent fog and low dew pointdepressions create MM conditions.
MP air is most frequent in the upper Midwest in winter, due to the localized effect of the Great Lakes.Farther east, MP is generally associated with the passage of adjacent mid-latitude cyclones, while in theMidwest, it is often a function of overrunning conditions. MP is found almost everywhere during winter,
Figure 1. Mean air mass frequency for summer
© 1998 Royal Meteorological Society Int. J. Climatol. 18: 1223–1236 (1998)
CHARACTER AND FREQUENCY CHANGES IN AIR MASSES 1227
Figure 2. Mean air mass frequency for winter
although frequencies are small along the Gulf Coast and in the Southwest. During summer, it is much lesscommon, with frequencies generally less than 10% throughout the country.
MT frequencies show a strong latitudinal gradient in the eastern U.S. during both seasons. In winter,it occurs more than 10% of the time south of a line from Norfolk, VA to Little Rock, AR. Frequenciesexceed 20% near the Gulf Coast and approach 70% in southern Florida. During summer, MT frequenciesare greater than 50% throughout much of the Southeast, and the air mass occurs on about one-third ofsummer days in large mid-Atlantic cities.
TR frequencies show a remarkably consistent pattern throughout the country, especially in winter.Frequencies average in the ’teens across the entire U.S. during winter, and are slightly lower in summer,especially in the southern tier of the nation.
Temporal trends in air mass frequency have been analyzed in terms of changes in annual frequency ofthe air mass (percentage of days within season) through the period of record. During winter, severaltrends are apparent (Table I). The most noteworthy is a dramatic decrease in air mass transition
© 1998 Royal Meteorological Society Int. J. Climatol. 18: 1223–1236 (1998)
L.S. KALKSTEIN ET AL.1228
Table I. Trends in air mass frequency over the continental U.S. 1948–1993
Winter Summer
+ − D + − D
DM 10 5 0.36 3 21 −0.16DP 6 1 0.30 0 5 −0.32DT 1 0 −0.08 5 0 0.18MM 2 1 0.05 5 1 0.58MP 12 7 0.20 5 1 −0.79MT 0 7 −0.53 15 3 0.37TR 0 24 −0.62 0 12 −0.71
+ and − represent the total no. of statistically significant increases and decreases, respectively, ata=0.05.D indicates mean change in frequency in % per decade at all stations, weighted by frequency.
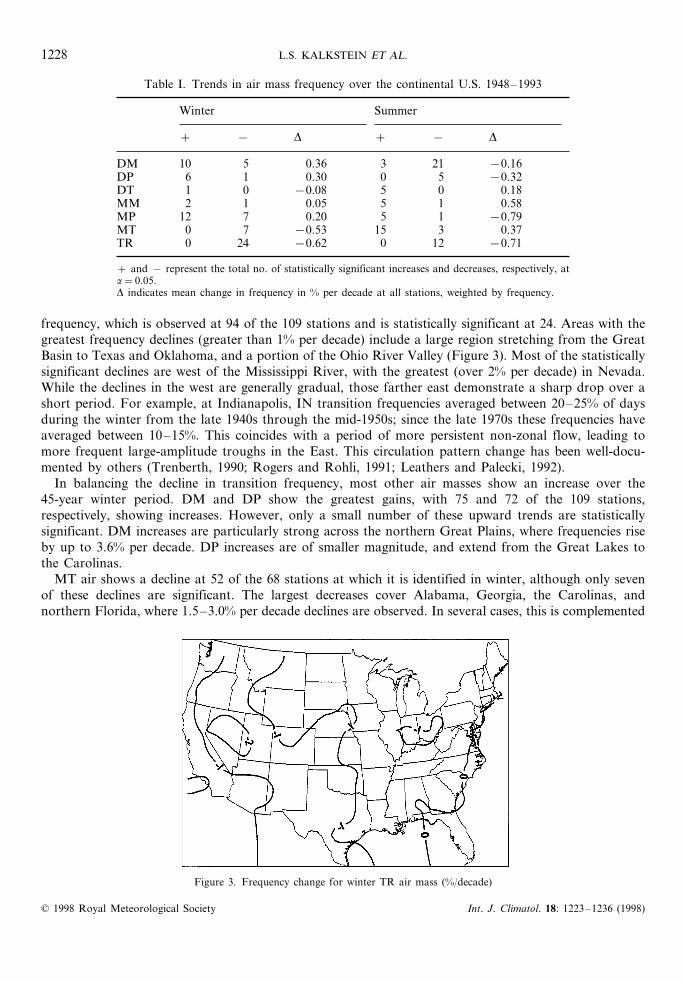
frequency, which is observed at 94 of the 109 stations and is statistically significant at 24. Areas with thegreatest frequency declines (greater than 1% per decade) include a large region stretching from the GreatBasin to Texas and Oklahoma, and a portion of the Ohio River Valley (Figure 3). Most of the statisticallysignificant declines are west of the Mississippi River, with the greatest (over 2% per decade) in Nevada.While the declines in the west are generally gradual, those farther east demonstrate a sharp drop over ashort period. For example, at Indianapolis, IN transition frequencies averaged between 20–25% of daysduring the winter from the late 1940s through the mid-1950s; since the late 1970s these frequencies haveaveraged between 10–15%. This coincides with a period of more persistent non-zonal flow, leading tomore frequent large-amplitude troughs in the East. This circulation pattern change has been well-docu-mented by others (Trenberth, 1990; Rogers and Rohli, 1991; Leathers and Palecki, 1992).
In balancing the decline in transition frequency, most other air masses show an increase over the45-year winter period. DM and DP show the greatest gains, with 75 and 72 of the 109 stations,respectively, showing increases. However, only a small number of these upward trends are statisticallysignificant. DM increases are particularly strong across the northern Great Plains, where frequencies riseby up to 3.6% per decade. DP increases are of smaller magnitude, and extend from the Great Lakes tothe Carolinas.
MT air shows a decline at 52 of the 68 stations at which it is identified in winter, although only sevenof these declines are significant. The largest decreases cover Alabama, Georgia, the Carolinas, andnorthern Florida, where 1.5–3.0% per decade declines are observed. In several cases, this is complemented
Figure 3. Frequency change for winter TR air mass (%/decade)
© 1998 Royal Meteorological Society Int. J. Climatol. 18: 1223–1236 (1998)
CHARACTER AND FREQUENCY CHANGES IN AIR MASSES 1229
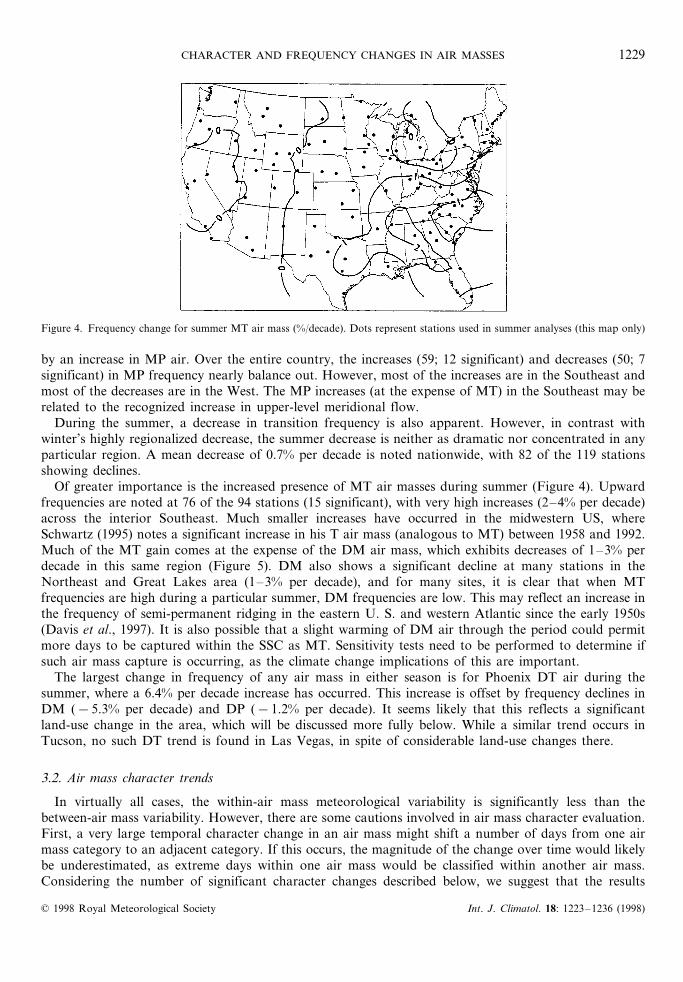
Figure 4. Frequency change for summer MT air mass (%/decade). Dots represent stations used in summer analyses (this map only)
by an increase in MP air. Over the entire country, the increases (59; 12 significant) and decreases (50; 7significant) in MP frequency nearly balance out. However, most of the increases are in the Southeast andmost of the decreases are in the West. The MP increases (at the expense of MT) in the Southeast may berelated to the recognized increase in upper-level meridional flow.
During the summer, a decrease in transition frequency is also apparent. However, in contrast withwinter’s highly regionalized decrease, the summer decrease is neither as dramatic nor concentrated in anyparticular region. A mean decrease of 0.7% per decade is noted nationwide, with 82 of the 119 stationsshowing declines.
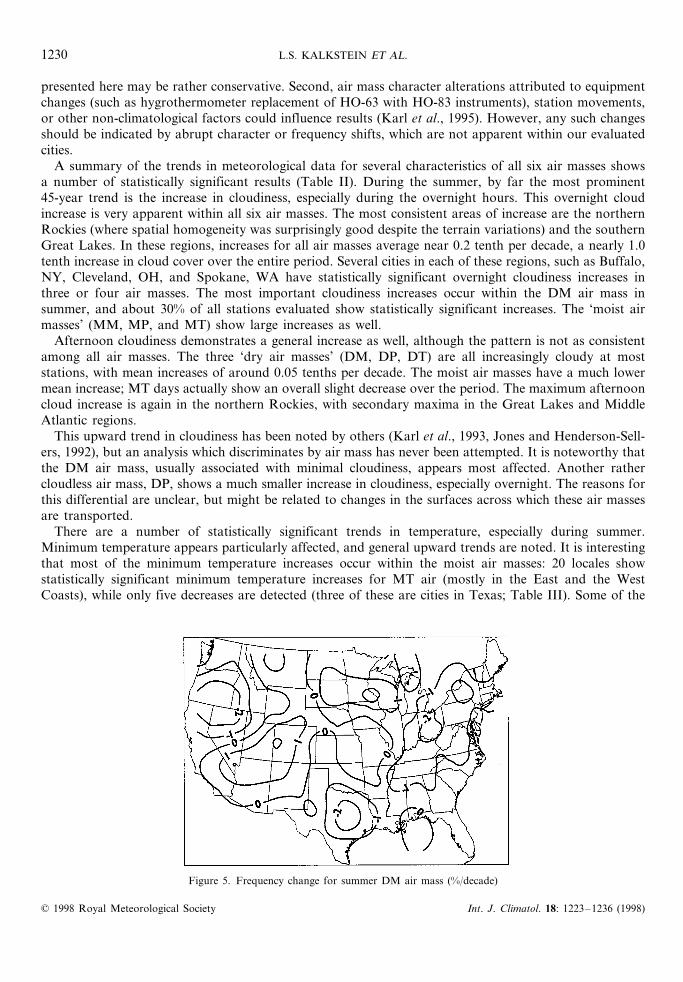
Of greater importance is the increased presence of MT air masses during summer (Figure 4). Upwardfrequencies are noted at 76 of the 94 stations (15 significant), with very high increases (2–4% per decade)across the interior Southeast. Much smaller increases have occurred in the midwestern US, whereSchwartz (1995) notes a significant increase in his T air mass (analogous to MT) between 1958 and 1992.Much of the MT gain comes at the expense of the DM air mass, which exhibits decreases of 1–3% perdecade in this same region (Figure 5). DM also shows a significant decline at many stations in theNortheast and Great Lakes area (1–3% per decade), and for many sites, it is clear that when MTfrequencies are high during a particular summer, DM frequencies are low. This may reflect an increase inthe frequency of semi-permanent ridging in the eastern U. S. and western Atlantic since the early 1950s(Davis et al., 1997). It is also possible that a slight warming of DM air through the period could permitmore days to be captured within the SSC as MT. Sensitivity tests need to be performed to determine ifsuch air mass capture is occurring, as the climate change implications of this are important.
The largest change in frequency of any air mass in either season is for Phoenix DT air during thesummer, where a 6.4% per decade increase has occurred. This increase is offset by frequency declines inDM (−5.3% per decade) and DP (−1.2% per decade). It seems likely that this reflects a significantland-use change in the area, which will be discussed more fully below. While a similar trend occurs inTucson, no such DT trend is found in Las Vegas, in spite of considerable land-use changes there.
3.2. Air mass character trends
In virtually all cases, the within-air mass meteorological variability is significantly less than thebetween-air mass variability. However, there are some cautions involved in air mass character evaluation.First, a very large temporal character change in an air mass might shift a number of days from one airmass category to an adjacent category. If this occurs, the magnitude of the change over time would likelybe underestimated, as extreme days within one air mass would be classified within another air mass.Considering the number of significant character changes described below, we suggest that the results
© 1998 Royal Meteorological Society Int. J. Climatol. 18: 1223–1236 (1998)
L.S. KALKSTEIN ET AL.1230
presented here may be rather conservative. Second, air mass character alterations attributed to equipmentchanges (such as hygrothermometer replacement of HO-63 with HO-83 instruments), station movements,or other non-climatological factors could influence results (Karl et al., 1995). However, any such changesshould be indicated by abrupt character or frequency shifts, which are not apparent within our evaluatedcities.
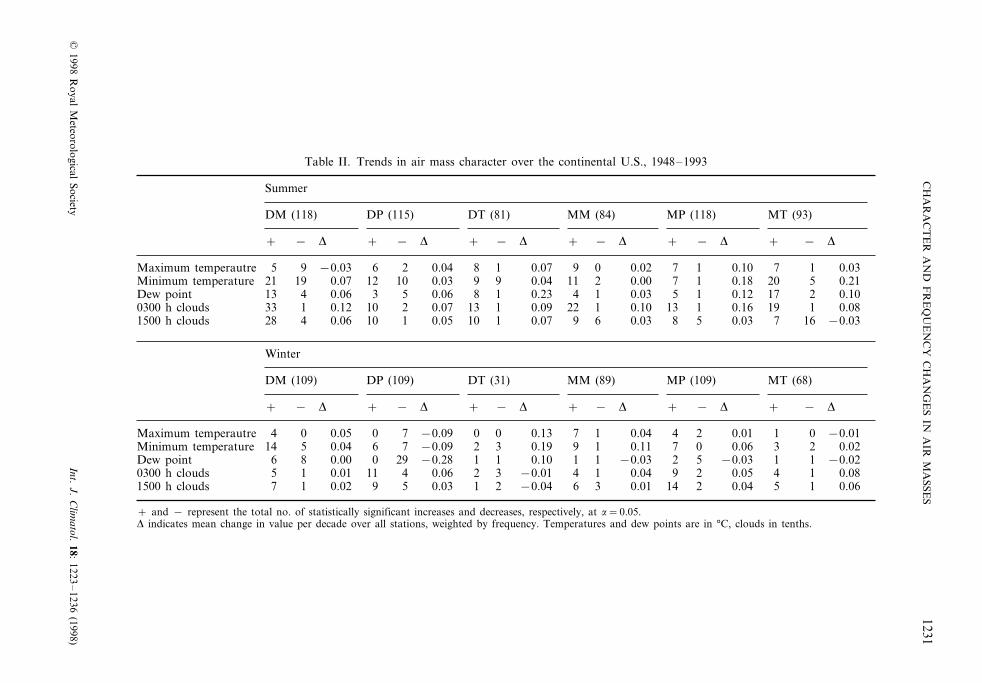
A summary of the trends in meteorological data for several characteristics of all six air masses showsa number of statistically significant results (Table II). During the summer, by far the most prominent45-year trend is the increase in cloudiness, especially during the overnight hours. This overnight cloudincrease is very apparent within all six air masses. The most consistent areas of increase are the northernRockies (where spatial homogeneity was surprisingly good despite the terrain variations) and the southernGreat Lakes. In these regions, increases for all air masses average near 0.2 tenth per decade, a nearly 1.0tenth increase in cloud cover over the entire period. Several cities in each of these regions, such as Buffalo,NY, Cleveland, OH, and Spokane, WA have statistically significant overnight cloudiness increases inthree or four air masses. The most important cloudiness increases occur within the DM air mass insummer, and about 30% of all stations evaluated show statistically significant increases. The ‘moist airmasses’ (MM, MP, and MT) show large increases as well.
Afternoon cloudiness demonstrates a general increase as well, although the pattern is not as consistentamong all air masses. The three ‘dry air masses’ (DM, DP, DT) are all increasingly cloudy at moststations, with mean increases of around 0.05 tenths per decade. The moist air masses have a much lowermean increase; MT days actually show an overall slight decrease over the period. The maximum afternooncloud increase is again in the northern Rockies, with secondary maxima in the Great Lakes and MiddleAtlantic regions.
This upward trend in cloudiness has been noted by others (Karl et al., 1993, Jones and Henderson-Sell-ers, 1992), but an analysis which discriminates by air mass has never been attempted. It is noteworthy thatthe DM air mass, usually associated with minimal cloudiness, appears most affected. Another rathercloudless air mass, DP, shows a much smaller increase in cloudiness, especially overnight. The reasons forthis differential are unclear, but might be related to changes in the surfaces across which these air massesare transported.
There are a number of statistically significant trends in temperature, especially during summer.Minimum temperature appears particularly affected, and general upward trends are noted. It is interestingthat most of the minimum temperature increases occur within the moist air masses: 20 locales showstatistically significant minimum temperature increases for MT air (mostly in the East and the WestCoasts), while only five decreases are detected (three of these are cities in Texas; Table III). Some of the
Figure 5. Frequency change for summer DM air mass (%/decade)
© 1998 Royal Meteorological Society Int. J. Climatol. 18: 1223–1236 (1998)
CH
AR
AC
TE
RA
ND
FR
EQ
UE
NC
YC
HA
NG
ES
INA
IRM
ASSE
S1231
©1998
Royal
Meteorological
SocietyInt.
J.C
limatol.
18:1223
–1236
(1998)
Table II. Trends in air mass character over the continental U.S., 1948–1993
Summer
DT (81) MM (84) MP (118) MT (93)DM (118) DP (115)
+ − D + − D + − D + − D + − D+ − D
2 0.04 8 1 0.07 9 0 0.02 7−0.03 16 0.10 7 1 0.0395Maximum temperautre12Minimum temperature 10 0.03 9 9 0.04 11 2 0.00 7 1 0.18 20 5 0.2121 19 0.07
5 0.06 8 1 0.23 4 1 0.03 53 10.06 0.12 17 2 0.10Dew point 13 42 0.07 13 1 0.09 22 1 0.10 13 1 0.160300 h clouds 19 1 0.0833 1 0.12 101 0.05 10 1 0.07 9 6 0.03 8 510 0.03 7 16 −0.031500 h clouds 28 0.064
Winter
MP (109) MT (68)DM (109) DP (109) DT (31) MM (89)
− D + − D + − D + − D + − D+ − D +
7 −0.09 0 0 0.13 7 1 0.04 40.05 20 0.01 1 0 −0.0104Maximum temperautre7 −0.09 2 3 0.19Minimum temperature 9 1 0.11 7 0 0.06 3 2 0.0214 5 0.04 6
29 −0.28 1 1 0.10 1 1 −0.03 20 50.00 −0.03 1 1 −0.02Dew point 6 84 0.06 2 3 −0.01 4 1 0.04 9 2 0.05 4 10300 h clouds 0.085 1 0.01 115 0.03 1 2 −0.04 6 3 0.01 14 2 0.04 59 1 0.061500 h clouds 7 1 0.02
+ and − represent the total no. of statistically significant increases and decreases, respectively, at a=0.05.D indicates mean change in value per decade over all stations, weighted by frequency. Temperatures and dew points are in °C, clouds in tenths.
L.S. KALKSTEIN ET AL.1232
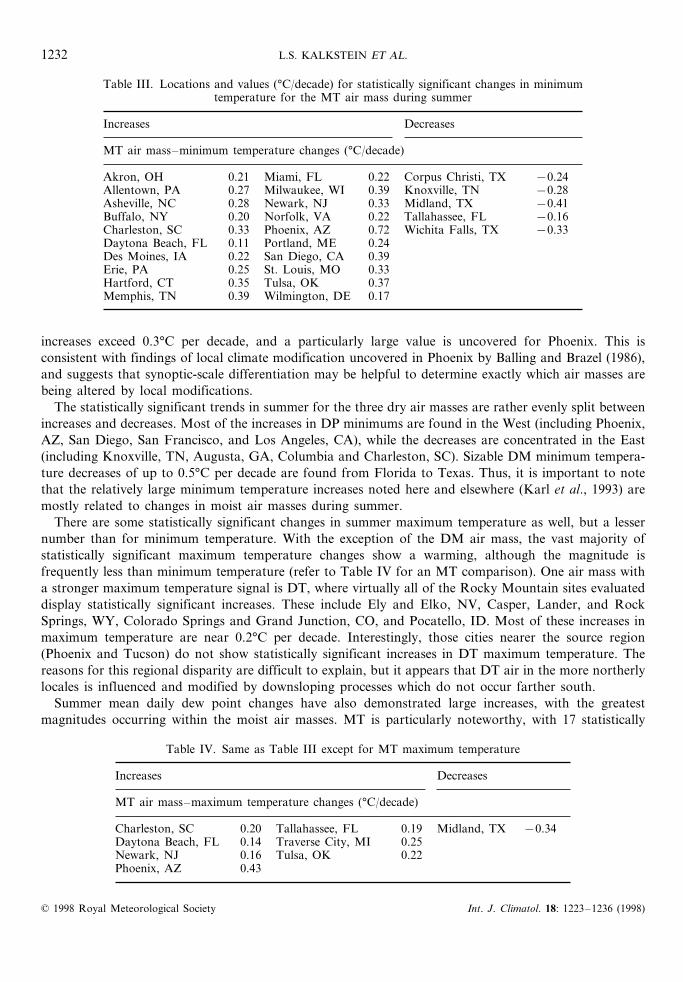
Table III. Locations and values (°C/decade) for statistically significant changes in minimumtemperature for the MT air mass during summer
Increases Decreases
MT air mass–minimum temperature changes (°C/decade)
Akron, OH 0.21 Miami, FL 0.22 Corpus Christi, TX −0.24Allentown, PA 0.27 Milwaukee, WI 0.39 Knoxville, TN −0.28Asheville, NC 0.28 Newark, NJ 0.33 Midland, TX −0.41Buffalo, NY 0.20 Norfolk, VA 0.22 Tallahassee, FL −0.16Charleston, SC 0.33 Phoenix, AZ 0.72 Wichita Falls, TX −0.33Daytona Beach, FL 0.11 Portland, ME 0.24Des Moines, IA 0.22 San Diego, CA 0.39Erie, PA 0.25 St. Louis, MO 0.33Hartford, CT 0.35 Tulsa, OK 0.37Memphis, TN 0.39 Wilmington, DE 0.17
increases exceed 0.3°C per decade, and a particularly large value is uncovered for Phoenix. This isconsistent with findings of local climate modification uncovered in Phoenix by Balling and Brazel (1986),and suggests that synoptic-scale differentiation may be helpful to determine exactly which air masses arebeing altered by local modifications.
The statistically significant trends in summer for the three dry air masses are rather evenly split betweenincreases and decreases. Most of the increases in DP minimums are found in the West (including Phoenix,AZ, San Diego, San Francisco, and Los Angeles, CA), while the decreases are concentrated in the East(including Knoxville, TN, Augusta, GA, Columbia and Charleston, SC). Sizable DM minimum tempera-ture decreases of up to 0.5°C per decade are found from Florida to Texas. Thus, it is important to notethat the relatively large minimum temperature increases noted here and elsewhere (Karl et al., 1993) aremostly related to changes in moist air masses during summer.
There are some statistically significant changes in summer maximum temperature as well, but a lessernumber than for minimum temperature. With the exception of the DM air mass, the vast majority ofstatistically significant maximum temperature changes show a warming, although the magnitude isfrequently less than minimum temperature (refer to Table IV for an MT comparison). One air mass witha stronger maximum temperature signal is DT, where virtually all of the Rocky Mountain sites evaluateddisplay statistically significant increases. These include Ely and Elko, NV, Casper, Lander, and RockSprings, WY, Colorado Springs and Grand Junction, CO, and Pocatello, ID. Most of these increases inmaximum temperature are near 0.2°C per decade. Interestingly, those cities nearer the source region(Phoenix and Tucson) do not show statistically significant increases in DT maximum temperature. Thereasons for this regional disparity are difficult to explain, but it appears that DT air in the more northerlylocales is influenced and modified by downsloping processes which do not occur farther south.
Summer mean daily dew point changes have also demonstrated large increases, with the greatestmagnitudes occurring within the moist air masses. MT is particularly noteworthy, with 17 statistically
Table IV. Same as Table III except for MT maximum temperature
DecreasesIncreases
MT air mass–maximum temperature changes (°C/decade)
0.20 Tallahassee, FL 0.19Charleston, SC Midland, TX −0.34Daytona Beach, FL 0.14 Traverse City, MI 0.25
0.16 Tulsa, OKNewark, NJ 0.220.43Phoenix, AZ
© 1998 Royal Meteorological Society Int. J. Climatol. 18: 1223–1236 (1998)
CHARACTER AND FREQUENCY CHANGES IN AIR MASSES 1233
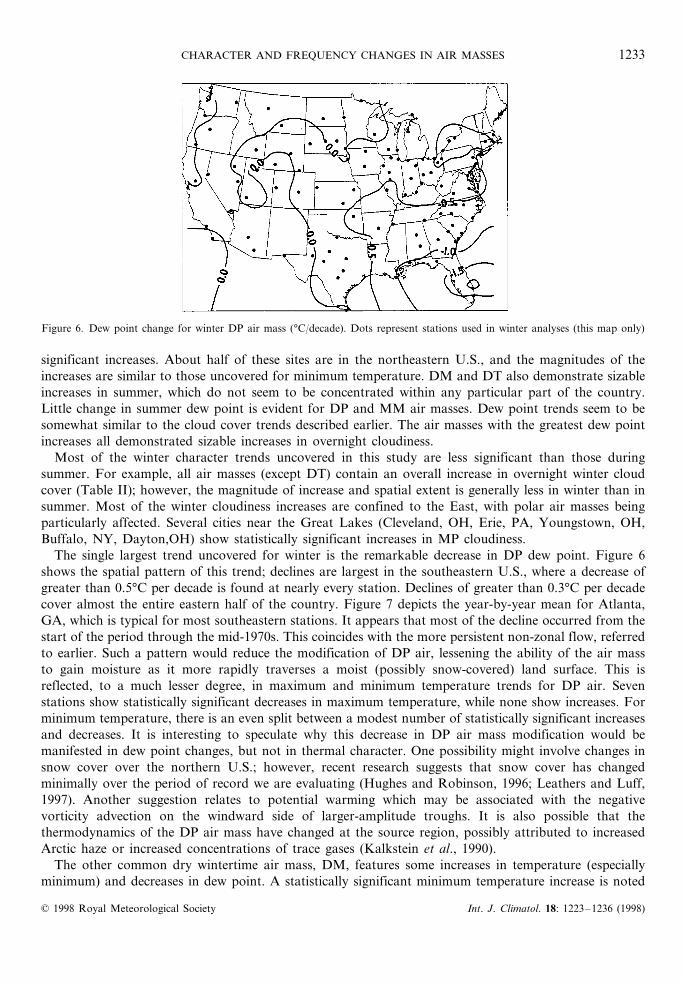
Figure 6. Dew point change for winter DP air mass (°C/decade). Dots represent stations used in winter analyses (this map only)
significant increases. About half of these sites are in the northeastern U.S., and the magnitudes of theincreases are similar to those uncovered for minimum temperature. DM and DT also demonstrate sizableincreases in summer, which do not seem to be concentrated within any particular part of the country.Little change in summer dew point is evident for DP and MM air masses. Dew point trends seem to besomewhat similar to the cloud cover trends described earlier. The air masses with the greatest dew pointincreases all demonstrated sizable increases in overnight cloudiness.
Most of the winter character trends uncovered in this study are less significant than those duringsummer. For example, all air masses (except DT) contain an overall increase in overnight winter cloudcover (Table II); however, the magnitude of increase and spatial extent is generally less in winter than insummer. Most of the winter cloudiness increases are confined to the East, with polar air masses beingparticularly affected. Several cities near the Great Lakes (Cleveland, OH, Erie, PA, Youngstown, OH,Buffalo, NY, Dayton,OH) show statistically significant increases in MP cloudiness.
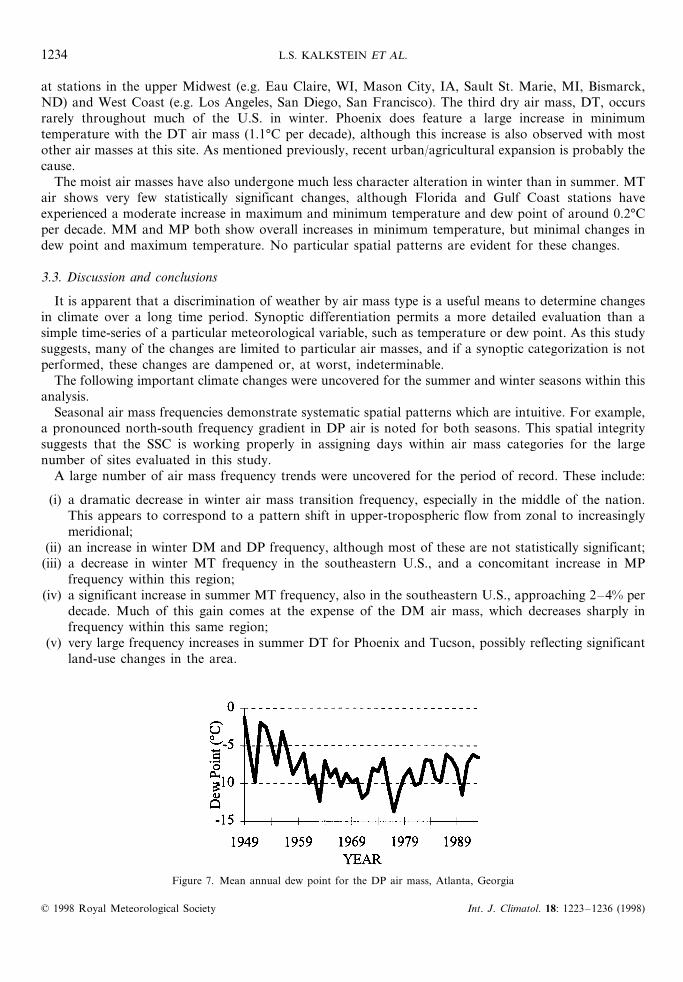
The single largest trend uncovered for winter is the remarkable decrease in DP dew point. Figure 6shows the spatial pattern of this trend; declines are largest in the southeastern U.S., where a decrease ofgreater than 0.5°C per decade is found at nearly every station. Declines of greater than 0.3°C per decadecover almost the entire eastern half of the country. Figure 7 depicts the year-by-year mean for Atlanta,GA, which is typical for most southeastern stations. It appears that most of the decline occurred from thestart of the period through the mid-1970s. This coincides with the more persistent non-zonal flow, referredto earlier. Such a pattern would reduce the modification of DP air, lessening the ability of the air massto gain moisture as it more rapidly traverses a moist (possibly snow-covered) land surface. This isreflected, to a much lesser degree, in maximum and minimum temperature trends for DP air. Sevenstations show statistically significant decreases in maximum temperature, while none show increases. Forminimum temperature, there is an even split between a modest number of statistically significant increasesand decreases. It is interesting to speculate why this decrease in DP air mass modification would bemanifested in dew point changes, but not in thermal character. One possibility might involve changes insnow cover over the northern U.S.; however, recent research suggests that snow cover has changedminimally over the period of record we are evaluating (Hughes and Robinson, 1996; Leathers and Luff,1997). Another suggestion relates to potential warming which may be associated with the negativevorticity advection on the windward side of larger-amplitude troughs. It is also possible that thethermodynamics of the DP air mass have changed at the source region, possibly attributed to increasedArctic haze or increased concentrations of trace gases (Kalkstein et al., 1990).
The other common dry wintertime air mass, DM, features some increases in temperature (especiallyminimum) and decreases in dew point. A statistically significant minimum temperature increase is noted
© 1998 Royal Meteorological Society Int. J. Climatol. 18: 1223–1236 (1998)
L.S. KALKSTEIN ET AL.1234
at stations in the upper Midwest (e.g. Eau Claire, WI, Mason City, IA, Sault St. Marie, MI, Bismarck,ND) and West Coast (e.g. Los Angeles, San Diego, San Francisco). The third dry air mass, DT, occursrarely throughout much of the U.S. in winter. Phoenix does feature a large increase in minimumtemperature with the DT air mass (1.1°C per decade), although this increase is also observed with mostother air masses at this site. As mentioned previously, recent urban/agricultural expansion is probably thecause.
The moist air masses have also undergone much less character alteration in winter than in summer. MTair shows very few statistically significant changes, although Florida and Gulf Coast stations haveexperienced a moderate increase in maximum and minimum temperature and dew point of around 0.2°Cper decade. MM and MP both show overall increases in minimum temperature, but minimal changes indew point and maximum temperature. No particular spatial patterns are evident for these changes.
3.3. Discussion and conclusions
It is apparent that a discrimination of weather by air mass type is a useful means to determine changesin climate over a long time period. Synoptic differentiation permits a more detailed evaluation than asimple time-series of a particular meteorological variable, such as temperature or dew point. As this studysuggests, many of the changes are limited to particular air masses, and if a synoptic categorization is notperformed, these changes are dampened or, at worst, indeterminable.
The following important climate changes were uncovered for the summer and winter seasons within thisanalysis.
Seasonal air mass frequencies demonstrate systematic spatial patterns which are intuitive. For example,a pronounced north-south frequency gradient in DP air is noted for both seasons. This spatial integritysuggests that the SSC is working properly in assigning days within air mass categories for the largenumber of sites evaluated in this study.
A large number of air mass frequency trends were uncovered for the period of record. These include:
(i) a dramatic decrease in winter air mass transition frequency, especially in the middle of the nation.This appears to correspond to a pattern shift in upper-tropospheric flow from zonal to increasinglymeridional;
(ii) an increase in winter DM and DP frequency, although most of these are not statistically significant;(iii) a decrease in winter MT frequency in the southeastern U.S., and a concomitant increase in MP
frequency within this region;(iv) a significant increase in summer MT frequency, also in the southeastern U.S., approaching 2–4% per
decade. Much of this gain comes at the expense of the DM air mass, which decreases sharply infrequency within this same region;
(v) very large frequency increases in summer DT for Phoenix and Tucson, possibly reflecting significantland-use changes in the area.
Figure 7. Mean annual dew point for the DP air mass, Atlanta, Georgia
© 1998 Royal Meteorological Society Int. J. Climatol. 18: 1223–1236 (1998)
CHARACTER AND FREQUENCY CHANGES IN AIR MASSES 1235
Significant summer character changes were found, and one of the most important was the large increasein cloud cover for most air masses. Overnight cloud cover increases were particularly notable for the DMair mass, although large increases were also apparent for MM and MT air. Afternoon cloudiness, whileshowing a general increase, was less affected. Most of the afternoon increases were confined to the threedry air masses.
Summer minimum temperature showed large increases, but these were generally confined to the moistair masses. MT air was particularly affected, with some increases exceeding 0.3°C per decade. In fact, theSSC has isolated moist air masses as the major contributor to general increases in minimum temperature.
Summer maximum temperature also demonstrated increases, but these were less dramatic than forminimums. The most important summer maximum increases were noted for DT air, especially in theRocky Mountains (not in Phoenix or Tucson). Summer dew points showed large increases, especiallywithin the MT air mass. Many of the statistically significant increases occurred in the northeastern U.S.
Winter air mass character trends were, in general, less significant than those during summer. The mostimportant trend was the striking decrease in DP dew point. In the southeastern U.S., these decreasesgenerally exceeded 0.5°C per decade. Most of the decline occurred before the mid-1970s, and corre-sponded with a period of greater meridional flow at upper altitudes. Interestingly, thermal character ofDP air did not show a persistent trend.
Although it has been attempted to discuss some possible reasons for the numerous changes noted in airmass character and frequency, the authors are quite uncertain about the physical explanations underlyingmost of these changes. Some are clearly related to phase changes in upper level flow, but further analysisis necessary to determine whether surface features, such as snow cover or surface moisture content, areresponsible for many of these changes. In addition, it is not certain whether human-induced climatechange plays a major role in these long-term trends. The strong increases in summer minimumtemperature within the moist air masses, changes in cloud cover, summer dew point increases, and winterDP dew point decreases are all provocative findings, but the role of anthropogenic activities in possiblyaffecting these changes needs much further investigation. It is also important to develop the SSC forspring and fall so an annual continuum of changes can be assessed. This task is currently beingundertaken.
It is also uncertain how increasing urbanization may have biased these results. However, it isnoteworthy that there is spatial continuity in the findings, even though the first order weather station sitesare at locations exhibiting various levels of urbanization. This spatial cohesiveness suggests that urbaniza-tion is not playing a significant role in altering these results; nevertheless, more research is necessary in thecomparative evaluation of urban-rural air mass differences.
It is clear that a synoptic evaluation reveals much more about climate change than does a trend analysisof various meteorological variables. Most of the character and frequency changes occur within particularair masses, and these have been isolated. It is hoped to expand this analysis to a number of additionalsites in North America. The authors are also interested in the possible role that ENSO events, andassociated teleconnections, might play in altering air mass character and frequency. In addition, it isplanned to determine, in a more quantitative manner, the relationship between air mass changes andupper tropospheric flow patterns. If air mass character alterations appear to occur independently ofchanges in zonality (thus eliminating transport speed and associated modification, as well as vorticityinfluences, as major reasons for air mass character changes), this might implicate anthropogenic factorsmore directly.
ACKNOWLEDGEMENTS
The authors would like to express appreciation to the United States Environmental Protection Agencywhich has funded this research under Cooperative Agreement CR-824404. In addition, Dr Daniel J.Leathers, who has offered many useful suggestions, is thanked. Finally, the work of the initial SSCcodevelopers: Dr. J. Scott Greene, Mr. C. David Barthel, and Mr. Michael C.Nichols, is acknowledged.
© 1998 Royal Meteorological Society Int. J. Climatol. 18: 1223–1236 (1998)
L.S. KALKSTEIN ET AL.1236
REFERENCES
Balling, R.C. and Brazel, S.W. 1986. ‘Temporal analysis of summertime weather stress levels in Phoenix, Arizona’, Arch. Meteorol.,Geophys, Biometeorol. Series B, 36, 331–342.
Balling, R.C. and Christy, J.R. 1996. ‘Analysis of satellite-based estimates of tropospheric diurnal temperature range’, J. Geophys.Res., 101(8), 12827–12832.
Bergeron, T. 1930. ‘Richtlinien einer dynamischen klimatologie’, Meteorol. Z., 47, 246–262.Davis, R.E., Hayden, B.P., Gay, D.A. Phillips, W.L. and Jones, G.V. 1997. ‘The North Atlantic subtropical anticyclone’, J. Climate,
10(4), 728–744.Hansen, J. and Lebedeff, S. 1987. ‘Global trends of measured surface air temperature’, J. Geophys. Res., 92,13345–13372.Hughes, M.G. and Robinson, D.A. 1996. ‘Historical snow cover variability in the Great Plains Region of the United States: 1910
through 1993’, Int. J. Clim., 16(9), 1005–1018.Intergovernmental Panel on Climate Change (IPCC) 1996. Climate Change 1995: Impacts, Adaptations and Mitigation of Climate
Change: Scientific-Technical Analysis, Cambridge University Press, New York, p. 878.Jones, P.A. and Henderson-Sellers, A. 1992. ‘Historical records of cloudiness and sunshine in Australia’, J. Climate, 5, 260–267.Jones, P.D. 1988. ‘Hemispheric surface air temperature variations: Recent trends and an update to 1987’, J. Climate, 1, 654–660.Kalkstein, L.S., Dunne, P. and Vose, R. 1990. ‘Detection of climatic change in the western North American Arctic using a synoptic
climatological approach’, J. Climate, 3(10), 1153–1167.Kalkstein, L.S.,Nichols, M.C., Barthel, C.D. and Greene, J.S. 1996. ‘A new spatial synoptic classification: application to air-mass
analysis’, Int. J. Climatol., 16, 983–1004.Karl, T.R., Jones, P.D., Knight, R.W., Kukla, G., Plummer, N., Razuvayuv, V., Gallo, K.P., Lindseay, J., Charlson, R.J. and
Peterson, T.C. 1993. ‘Asymmetric trends of daily maximum and minimum temperature’, Bul. Am. Meteorol. Soc., 74(6),1007–1023.
Karl, T.R., Derr, V.E., Easterling, D.R., Folland, C.K. Hofmann, D.J. Levitus, S., Nicholls, N., Parker, D.E. and Withee, G.W.1995. ‘Critical issues for long-term climate monitoring’, Clim. Change, 31, 185–221.
Leathers, D.J. and Luff, B.L. 1997. ‘Characteristics of snow cover duration across the northeast United States’, Int. J. Climatol., 17,1535–1547.
Leathers, D.J. and Palecki, M.A. 1992. ‘The Pacific/North American teleconnection pattern and United States climate. Part II:Temporal characteristics and index specification’, J. Climate, 5, 707–715.
Michaels, P.J., Sappington, D.E. and Stooksbury, D.E. 1988. ‘Anthropogenic warming in North Alaska?’, J. Climate, 1, 942–945.Rogers, J.C. and Rohli, R.V. 1991. ‘Florida citrus freezes and polar anticyclones in the Great Plains’, J. Climate, 4(11), 1103–1113.Schwartz, M.D. 1995. ‘Detecting structural climate change: an air mass-based approach in the North Central United States,
1948-1992’, Ann. Assoc. Am. Geogr., 85, 553–568.Spencer, R.W. and Christy, J.R. 1990. ‘Precise monitoring of global temperature trends from satellites’, Science, 247, 1558–1562.Trenberth, K. 1990. ‘Recent observed interdecadal climate changes in the Northern Hemisphere’, Bul. Am. Meteor. Soc., 71,
988–993.Ye, H., Kalkstein, L.S. and Greene, J.S. 1995. ‘The detection of climate change in the Arctic: An updated report’, Atmos. Res.,
37(1–3), 163–173.
© 1998 Royal Meteorological Society Int. J. Climatol. 18: 1223–1236 (1998)