Embed Size (px)
Citation preview

"
..... .:; -' :.
::.>~'.;:~
'" ' " '
"
"
," < ...
: , ...... t
: '. '~~;':.~ , , . >~···i
. " ",'" .. ;,~"i.~
! ~,
0'~
./., ~ -~.-- .
A PROPOSED INCIPIENT FIRE AND TOXIC GAS CAUTION AND WARNING SYSTEM FOR SHUTTLE
A. C. Krupnick
NASA, Marshall Space Flight Center Huntsvi lie, Alabama
261
J
.. ~-
https://ntrs.nasa.gov/search.jsp?R=19710026728 2018-05-21T23:54:14+00:00Z

~-' .' ....-;- ,.. . ~,
I • :._". ~ ,,~.~: ~~~'> •
:.::,' .t, >.' .• j;
" '1 '.' f l
.," ~
, '1 .. ',
, '::'1 . :~
" , , " '
'.~'" .;, " .:: ',i
::;
.t,': ..... , "
, .'
"~::" .','
. ~ ..
. . ,~.,:;
,"'" r
,-.;:.~: . ''-:-~:.::~ J
, "
A PROPOSED INCIPIENT ,FIRE AND TOXIC GAS CAUTION AND WARNING SYSTEM FOR SHUTTLE
Introduction
Fire detection in the pre-Shuttle era has been on an after the fact basis. This situation has not only plagued the Aerospace industry, but has been the norm in almost every facet of industrial technology. While great strides have been made in the past fifteen years in the fire prevention area by the development of non-flammable materials, there are still many cases in engineering and design which precludes the use of non-flammable materials., While the fire hazard is markedly reduced it still exists. Therefore, both the designer and engineer must give careful considerations to the what, where, and how materials are used in any system whether I for earth or space use. In fire prevention, one must consider how to control the fuels, that is, its non-flammability in the anticipated environment. Electrical shorts and other ignition sources must be minimized. In addition, the amounts and placement of flammable materials must be adjusted so that if a fire does occur, catastrophic events are prevented • As long as the designer and engineer are cognizant of these factors for ground system use, he can generally accept some calculated risks. Or, if he wishes to go one step further he might add a fire warning and control system which will provide an additional time factor in order to react to put out the fire, since pre-combustion and combustion times are generally of longer duration on earth. However, in space, it is another matter to both control and prevent fires since secondary problems of smoke, toxicity, and escape become major factors in personnel logistics. Therefore, along with trying to have the best non-ignitable materials and configuration, your ultimate goal in space is to buy time for the crew to react in case a fire is about to occur. The problem of buying time at present has no easy solution because technology has lagged in this area. 1'm sure that my previous statement may be cause for sorne heated discussion; however, when all of the factors are taken into account, all fire and smoke warning devices have vulnerable spots. Even those devices now available which call themselves fire precursor warning methods are subject to question. All tb2 devices in both categories mentioned are either non-specific, that is, subject to interferences or they are insensitive. Thus the false alarm nature of these techniques markedly decrease their usefulness because in space we cannot afford to cry Wolf.
262
J \.
)
.)

:'.'" f"
. r::' .~ I" r; :/ I •
,I .'
'. L .... ; i·i,,:':'
... ~\~~
: . ~'! .. ~:. "
i .. ~~.~ .< .. ,:"
I' .....
; ~~t.~.;~·_.~.~" ~,..; .. ' ....
~ Vi
.' , .. _ .~ •• l ~ .
Discussion
NASA has been ~ooking into the area of Hre caution. and warning systems quite carefully in the past few years. While we donlt claim any panacea in this area, we are looking at some rather interesting techniques which could result in a possible breakthrough in the area of buying tblle for either the Shuttle or Space Station crews (Figure 1). We have classified fire detectors as primary and secondary types. While several of the systCJns that are called out have obviously been around for some time, they are worthy of consideration for certain applications. In addition, we believe that in-depth testing is required to uncover their advantages and disadvantages. This re-evaluation is being clone to probe through the slnoke laid down by our sometimes over zealous salesmen. I do not intend to cover the world of detection but rather address myself to one rather interesting system which we at MSFC have been studying for the past two years. That is the correlation spectrometer/interferometer technology as it applies to fire precursor and toxic gas detection for Shuttle.
Figure 2 shows a typical fire curve. Primarily for some undefined time, depending upon conditions, the ignitor and fuel tend to heat up. During this process, pyrolysis products are formed which vaporize into environment. As the material continues to increase in temperature, prior to its reaching its autoignition temperature, smoke is produced giving a possible visible indication of impending fire. At the material's autoignition point, th.e vapor being produced will burst into flame accompanied by an increase in heat and pressure. Figure 3 compares the fire risk in space versus earth.
The major problem facing the successful implementation of rerr}.ote' optical detection is the rejection of background spectra. While suitable sensitivity is available for the gases of interest, the large number, and at present totally unknown concentrations of other gases in the Shuttle, drive the instrument design toward the ultimate available specificity. A difficult route to follow since there is insufficient criteria for how good the system needs to be. However, this' chasm does not seem to be unbridgeable based upon in-house studies at MSFC and the available results of Contract NAS8-26l97 with Arthur D. Little, Incorporated. From these data, it appeares that correlation spectrometer / interferometer techniques is one of the most promising of all available systems (Figure 4).
While the ultimate in sophistication would be a scanning correlation interferometer with computer data reduction and readout, this concept cannot be developed within the time frame of the Shuttle. In order to obtain the maximum in specificity and sensitivity, keep the packaging, and power consumption to a minimum with high degree reliability, it was decided that the best approach to home in on,for the immediate future, was
263
J \

,"' .' ~ :-;. - • ."";,: 1. : " ' .• ~": ,.. ." • .: '. ,:.. • ~ .' " •• : .;, '. •
~" -.... ~~~ ........... ·~~~~:2,~~"_ ~:~~~~, ~~~_~"'''''.t,~.''''." ,~~!:" .~'" ~~ :;""A~ ~~. _ ~ .. _ .... ~ .. ... ~ .: ~ ~ '.~ . .. '
.' . . " , ~
" .', . ' .?-
'. ): " " .. ~
· ': · .,.
. '.
...... l · .
:'
". > .
.'. ~ .' '.'
-:-.;
..... :.'
. ,,' ,':::'.:
.. ' . .......... .,. : " .. ' ..... ~." .
PRIMARY TYPES
CONDENSATION NUCLEI COUNTER
IONIZATION DETECTORS.
SMOKE DETECTORS
CORRELATION SPECTROMETER/INTERFEROMETER
uv/m DETECTORS
CONTINUOUS WIRE THERMISTORS
TEMPERATURE SENSITIVE PAINTS
TRACER ELEMENTS
SECONDARY TYPES
THERMAL CONDUCTIVITY BRIDGE
CATALYTIC WIRE BRIDGE
MASS SPECTROMETER
GAS CHROMATOGRAPHY
R. F,. DETECTORS
Figure 1. Types of Fire Detectors
264
-
J ,
)

.N 0' U1
. :'.
. '-~- '. :~';:1<~~~:~;'.~~-l;:;':':.~.~~i~;:;fi:L~C.{{:'~~:~:~~:;;~i~~}~,,;';," .:.'d.\;:fi":,z . ,-·.~~.:;:'::l"~;~.:~' ~ '~~:Z~:,;..,.;· . '. ~:' 'i~~.~. ~ ~. ~r~'.r<:"/·:;rf; }?r---.~\ .' ,
t MAJOR HAZARD
I
~ 'v
FIGURE 2 - Typical fi re curve.
......... ~:.::>.~~ --.~
I;' .... ;' .. .
r' .. . . .
. ,~ , .;
t,· ~'
r \ ' , .. ii,', "
i· ,.;.. ~, ~ .
. . . . ,~: ..
~.
~ . , ~ .. ;-, ... t·
1 i';: . " ... ~ : '.
i ~' ~
e.>', f '
t', l.. ,
~'.
, I ' r .... , t .
r' .-~ . .,
t '.
,. ~ ~ ,.
~. ~

.,. . .... ,' , J~ • <~ •• :: ~ ," ;:'~:_~.J;:.::~j:;'~::''', '-' .. ·.:.~I·.,~_ ' .. , ..... ".:~ ~,~ .. ~ • : ~ ';I .~. .,' .. , "'. ...... ,,:.t' ... :-' l: .• -~"
Figure 3. Comparative Considerations of Fire Risks in Space vs Earth
.- ~ '...i ~: "L,,'!?C~'diL
v':: t" .. ~:s 1'( .... { .' . t -~ .. ~.
t t " ~ .
i' ".~'. ; . , "::~ r . , .
f··.· . j' '.
I~- '. :' .
~ .~' "
t ",."; 1-: I '".
t " .' ~ . I', : . I ..
I . t· •.
l,.
t ".,'
~ ~~ ... . : j.
, .

: .. _-.; ... ~~ .!-..::"!; ........... ",', , ...:.
.. ". -, ~ .:" .... 1J, •. ..::.. .... ~~:...."- -4-.'""~~"'~' -L __ ",-1<.; "'*_~, ... . i~.t~~~·_.~ ,-;.",--~-..:...-- - -:t;~':~_
Movable Mirror
Reference I nterferogram
Beam Splitter
Detector
' . . ' . . .. ~.. .
Compensator Plate
Detector
Fixed Mirror
Correlator
FIGURE 4. - SCHEMATIC DIAGRAM OF CORRELATION INTERFEROHETEP.
267

c " , .
, ,
. '. . ~ ...... ,(
.
. ~~
.' '.-
" .,' ,:1
.: :·~.:~1 .. ",
.' ,l.: , ,
,', ,
. ,.j'
, ,<
.....
the correlation gas filter concept. However, since the weak points of the gas filters are the same as those inherent with the non-dispersive infrared system, namely background rejection, we would ha.ve to circun'lvent this problem by some means. Since the requirement of background rejection is of utmost importance, the instrument must be based on the use of spectral fine structure whose L'orentz line half widths are on the orde r of 0" 1 cm-1
or greater. Also in order for the high resolution instrument to be capable of separating disti~guishing features, the gases selected must have vibrational mode with low moments of inertia.
Fortunately, some information can be gleaned on the pyrolysis products of materials selected for Shuttle interior. From this information, we were able to select eight potential candidates to use as incipient fire precursors (Figure 5). Of the eight potential candidates as based upon high resolution spectra and a tentative evaluation of possible interfering gas spectra, it appears that the leading candidates tobe used are COFZ and SiF4 • However, monitoring these two gases only, will not suffice due to Some minor interferences. In order to rely on the data we will ba ve to monitor the background for C02 and H20 in the case of COF2 and CO in the case of SiF4 • COF2 (at 0.6 torr partial pressure) shows resolvable rotational fine structure between 1894 and 1973 cm-l and between 2325 and 2650 cm-l • The average line spacings and half widths are 0.34 cm- I and 0.18 cm- l under an air atmosphere. The line half widths for the pure gas was found to be 0.03 cm-l • SiF4 has line spacings and Lorentz half widths of 0.50 cm-1
and 0.18 cm-l , respectively, under a nitrogen atmosphere in the region between 1917 and 2099 cm-l •
By utilizing a detection system capable of analyzing for the most likely fire precursor or precur sors plus those causing background interference, it is believed that a highly reliable incipient fire and toxic gas caution and warning system can be developed for the Shuttle •
Based upon this rationale, we have established some very preliminary parameter goals for our caution and warning system (Figure 6). In addition, the simplest systems would have to provide spectral information without being transformed either to space directly (dispersion) or to space by way of time (i.nterferometry). This can be accomplished by one of three' methods; either as a specific spectral filter mask or by negative or positive adsorption filtering. Th~ best approach is the use of the spectral filter mask; however, this not only increases the system complexity, but also degrades its long term reliability.
A shnple gas filled optical cell used as an absorption filter for the spectral lines produces what can be called a "negative filter" in the sense
268
J
- 'l. ,

.".' . '.'
~~~:~~~.":,:' - .':~ .. ':'~+.:':.:'" :/·"::i.':"··
Gas
HF
HC1 .....
N HCN 0'
~ CH4
CO , N02
COF2
IMltI ..
. ,';. ;~::7~;cJ:~ .~ ~.t;;~~L~:'~;>t :·;:~:,::}:;·~~~ .. ;::X:i:~ ," <. : f h· ~ ~ ,~, ';;: c~ " •. ;~<,
Suggested Spec~:'31 RC;gion
(cm- I )
3600-4200 (upper portion of band relatively free of atmo$pheric interference)
2500-3100
3200-3400
2800-3200
1900-2300
2800-3000
700-800 (upper portion free of atm i nterferen ce)
(E"I .;ii'.·')., ", ., .~
Band Strength
(cm-2atm-1 corr. to 25°C)
412
160
221
328
237
61.5
422
Line Spacings
(cm- l )
40-50
2-25 (smaller spacings of -bimodal distribution due to i sotop i c spl ittings)
,- 2
-10
,....,4
,-- 1 and down
"..., . 7
A number of high frequency bands could be used for this molecule if the fine structure can be resolved. Present data indicate this will require resolution of .1 em-lor better. A typical band that could be used if resolved is
2400-2500 15.2
Figure 5. Spectra! Characteristics of Gases of Interest
..... ::::,,,,~; .:" 4.'~ ~ .,.;. ..:~:' ... ~ r. "~.:"
~. ~" :'j
'~
i:·· t.--...• : ..
- ". Lo '"'- "'a.h me v:; luI. ~
(c~-latm-l)
.05-.1
.03-.09
.03-.08
>:
~.
L , . i
'I"
.' r
• P
,.'
t" , · '
i~' , .' . ~ .~ .
'.' ,
i,"
.. ~. l
" .: ,.
· .

~ ,. -. t .. ~ ~: ..... ::. ~.:. ..~
" .1
· .: -'. ", "~"
.. :' .. ~
: .J .', I.
· . <
· ;':~~ · .:. '", ... ,;
· ., ..... r.' \
:';':'(·:1 - ~ :\:'j
.: ;:.:~.-; .~ . ~~ ... · ... ,id "'. :.:~~.~i"!
·/~;~:·ll · .~:::. ~.~ .. ~··t ,.
,. ':~'. , .'~ .... "
.~- -:; .. ~
':.', , :" .f· ,'" ,,~~,.~~~ .~~-"''''",_ ... ~~~j.:.,~'. __ ~~::'' __ ',0_: ,,~ .. . '. ..-~....
Optical Path Length
}Olinimum Detectable" Partial Pressure (Typ)
Spectral Region
Response Time
Number of Gases to be }1ortitored
Size, Volume, Height
Lifetime
Figure 6. Required System Parameters
270
1 meter
-6 <10 atm
As required (probably 2}J-5lJ)
<30 seconds
6 or more
}Olinimum
2 years
1

... ,
" 'j
.. .. "
;'1
· ' .... ,. :;';' .~ __ ,. __ ~';< v-. -'11( ~,..J _
that it removes the spectral signature of interest while passing all of the background information between the absorption lines. In gf!neral, using only negative filtering leads to a system in which the detector I electronic subsystem must discriminate and detect on the basis of very small changes in a large signal (typically changes on the order of 1 part in 10+5 to 10+7
for the problem at hand).
Commercial instruments have been built utilizing such negative filter, but positive filtering concepts have a distinctive advantage. The common implementation of these involves the use of a pneumatic detector that contains the gas of interest. Infrared absorption takes place only at the lines or bands of interest; thus significantly reducing the radiation load on the detector to just the wavelengths of interest.
An alternative approach has been suggested in which "positive filtering" is achieved. In this configuration, the gas sample and the associated optical system pass radiation only in the spectral intervals corresponding to the absorption lines of interest. The system consists of a interferometer which is adjusted so 1hat there is zero path difference in the two arms, and there is destructive interference at the output for all wavelengths, i. e., the interferometer is effectively opaque. Then a sar.aple of the gas of interest is placed in one arm and the anomalous refraction in and near the absorption lines changes one path by m.any wavelengths. The condition of destructive interference is upset at those wavelengths and radiation passes through the system only at those specific wavelengths. A positive filtering system generally leads to smaller signals, but much larger percentage modulation for detection and discrimination.
If either one of these approaches is used in a simple~ level detection device, it would be vulnerable to changes in the background level and the presence of spurious absorption bands. Sensitivity to background (or source) level can be completely eliminated and susceptibility to false alarms greatly reduced by cornbining the two techniques to determine the relative change in absorption of the lines of interest and the spectral region'between the lines.
An effective and compact configuration for accomplishing this is shown in Figure 7. The basic positive filter interferometer is set up and the radiation at the wavelengths of the absorption lines appears in the lower output beam. One of the interferometer mirrors is made partially transmitting allowing the "negative filtered" radiation to escape the interferometer. A second gas cell may be necessary to obtain a sufficient amount of negative filtering. ' In any event, this radiation (upper beam) is pas sed through an optical attenuator so that its total power exactly equals the positively filtered beam when none of the gas of interest is in the sample path •
271
\

N -...J N
band selection fi ter
~
t:. . .:.' " ...... ;. . . ,~.; ~ ". i'.!." •. - ". J '.' '.' '. :./ •. ': ...... ;.' .:' •• ~~~~.~ ••. -.:.'., ",' " >, ••••• : ••• ', ' •• ': ... 'of.~· ".
.: -;. -·:::: .. ';::J-~ .. 2~i:.:~:i;:~;i!;~i?~;:;:':.:_~:~},:;,;;~,: :\;i~:~;i2;:·J:.~~)i;i.·.! .·:i· k::.L~:.
beam plitter
, par- ially transmit ting reference gas cell
mirror
fixed attenuator
/
ariable a~tenuator
, ide~Sing. lens
. ~5' ~
I Ut nl
"
entrance
f )
, aperture
interference plane
condensing lens
chopper assembly
Figure 7. Schematic .Layout of Gas Filter Correlating Sensor
detector
beam
positive filtered beam
t:' •. -
I
I.
.;
.. ~
; . : ., ..
, .. ). "
~.
~ t: ~.~~. :,
-'.
. . . .
• I . t. •...
.••• J.

-';{
,J
:~ ',.;' t. 1 •
" , i~
... :. ,,' . "
. ..... . u.... 0",,-_'-. ' .z .... _,.":r."X __ .~' .. _t "".~,c.~.~·~;,.~t.;·~·- ,:.,..: rX. ".::
'.,.- .. ~ ~,-".:~. '. ' .. "~
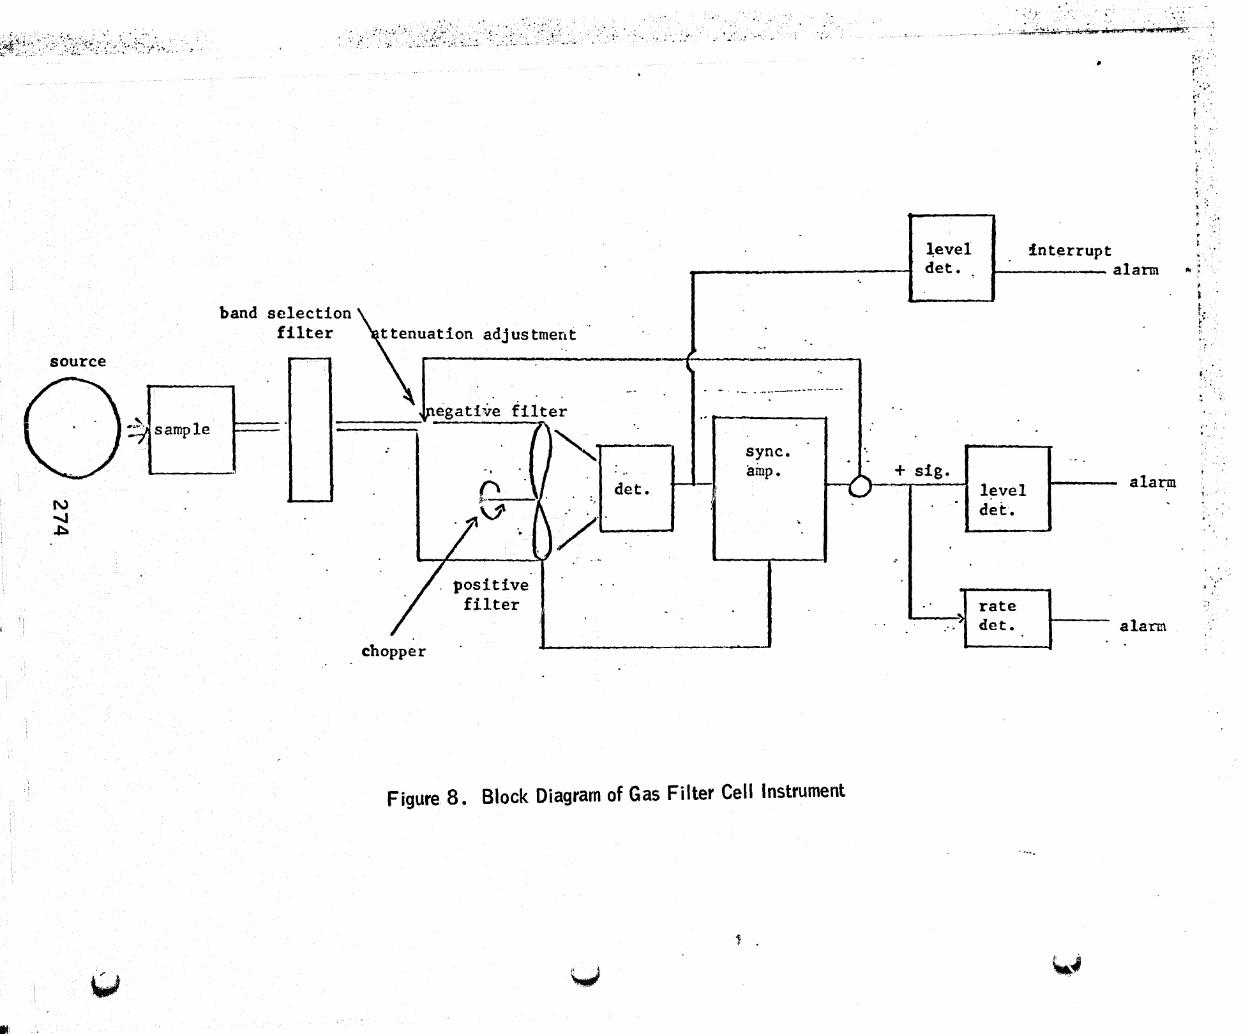
The strength of the tlo,!O beams is compared by alternately directing them to a single detector. A signal processing block diagram is shown in Figure 8. The difference between the two beams is determined by the a.c. portion of the detector signal and the d.c. level is neglected. Synchronous detection of the signal is used with the rotation or a change in broad absorption band which covers both the positively filtered lines and the negatively filtered region, the ra.diation levels in the two beams change by the same percentage and there is no signal difference introduced. Positive signals (in phase) indicate the radiation in the absorption bands has fallen off and the gas of interest is present. Negative signals indicate that something in the background between the absorption lines of interest is beginning to absorb. This negative signal would be nulled out either optically (by varying the attenuator), or electrically to preserve the threshold setting of the alarm. Interruption of the beams or a gross loss in transmission from the source would be used to sound an "inoperative" alarm.
If there were interferring gases in the background, i.e., gases with absorption lines ove~lapping those of the gas of interest. the blocking filter at the sensor input could include negative filtering by a cell filled with the offending gas.
In the present stage of development, we now have an engineering breadboard in operation (Figure 9) and testing is now underway to determine its sensitivity (signal to noise ratio), stability, specificity and susceptibility to interference, nature of the stored reference, capability of being used in multigas analysis, and equipment complexity. Gas sampling techniques and capabilities are also being evaluated as well. One technique is obviously by use of a finite dimensional gas cell where samples from a given "black box" or locale can be a.ssayed. The second concept is to evalua.te the ability of the unit to be used for area monitoring. If the second concept is found to be feasible two correlation gas filters can be used for the purpose of triangulating in on a potential fire source.
The contemplated flight unit based upon present estimates will be modular in nature. Each. module will be approximately 5 cm2 by 'IS cm long. Six modules are expected to ma.ke up the total package.
273
J
-_ .. " ....... ", '" ii"'ii.fr'Li.;, ,. ' : ~ . . r:::" .. ~;:"".::" '.: 1,,"
.:. OJ .~~ .: ..... -rIO ·'~1 -= ~ ... , ,' ..
source
...
1'"
...
N ...... b
" :;1 sample
~
band se f
.. : .. . ~ i, . , . "
.' ". "." . . t' . 'J: ':. /~~~., ~. " . , ' ·;: •. ",·i"'~:!·~ ::u..oar5& .... "';}! t,;i_4 •. i ... j ... ·-~ ..... :: .... .: .. : ~:...: . ,;. ...".;, •• • '.'.- 4-
- ,
•
,
~evel interrupt det. ,
'.
lection lIter t tenuation adj us tmen t " r ' . , "
~egativ~ fiite~ -' ,~ -. '- , .... --_.. , ,
:::. ===:::::;- ( "-: ) " sync.. .~ '. ,
'. '. J ' . " amp. -0 + sig. o ~1. det. : level ~, •• :.. 1 • ~
. V'. ~ /. '. . det •
. / .). .'
'/ positive' , , 1 I . filter . . . . . . rate t----
." _ det. _ .... "'---,..-
Figure 8. Block Diagram of Gas Filter Cell Instrument
1 .
~ ~-J
alarm
alarm
:.~
r: , ,.
,- ..... (' ' , t '
j.
" , :' :1' ,
. III ,
, ~
t. ( "
," '-, .
," .
,"
"
. \' "
alarm
", . . '

~--.....,... -- -
N ~ U1
NOT REPRODUCIBLE F igure 9 . Engineer ing Breadboard Model of a
Gas F ilter Ce l l Instrument
" •

;.: ... ".. & .~ ••
· ;-"
· "
. ;:
.' . · t:·.
". ~".
l , ~"':.~:' .
. '. f; t .. ,.:
. , ...
Conclusions
',> . ... "~ ;
.... .: ....
Based upon present evidence, the gas filter cell offers the ultimate in background rejection. Not only does the gas filter cell offer sensitivity as good as the other systems, but its inherent throughput advantage offers more ultimate sensitivity at the expense of some source power. The !nost difficult problem in implementing the gas filter cell is making stable reference sam:ples for the two-year lifetime. It is believed that the individual gas cell sensor can be made into a small, compact, and reliable instrument. However, multiple gas monitoring wi.!l probably require parallel optical systems •
Based upon present data, the amount of toxic gas required to implement the system ~ill be insufficient to be a significant hazard in the spacecraft. Also, this approach is believed to offer the most convenient changes in gas of interest - simply add a sensor for the new species without changing any of the existing system.
276
I \.