Embed Size (px)
Citation preview

Natural Resource Partners L.P.
2014 Annual Report
NATURALRESOURCE
COMPANY
A DIVERSIFIED

INTERESTS IN GREATER THAN
1,500 OIL AND
GAS WELLS2.3 BILLION
TONS OF COAL
RESERVES
WHAT WE O

In recent years, Natural Resource Partners has focused on a business plan designed to diversify our asset base and revenue streams. With prudent, accretive acquisitions beyond the coal space, we have successfully transitioned into a diverse, more balanced natural resource company with strong positions in sectors that supply America with energy, electricity, construction materials, and essential products.
1
49% EQUITY INTEREST IN TRONA MINING AND SODA ASH PROCESSING COMPANY
792 MILLION TONS OF AGGREGATES IN 16 STATES
WN

WHY IT’S IM
COAL
COAL IS ONE OF THIS NATION’S MOST ABUNDANT FUEL SOURCES AND IS USED PRIMARILY FOR GENERATION OF ELECTRICITY, AND IS ALSO USED IN PRODUCING STEEL USED IN BUILDING THE NATION’S INFRASTRUCTURE.
AGGREGATES
AGGREGATES – CRUSHED STONE, SAND AND GRAVEL – ARE USED IN THE MAJORITY OF THE COUNTRY’S INFRASTRUCTURE.
2
In 2014, coal provided 39 percent of total U.S. electricity generation.
Each person in the United States uses three tons of coal every year.
Nearly 917 million tons of coal used annually in the United States.
39%
1:3
917MM TONS
It takes 400 tons of aggregates to build the typical modern home.
Aggregates make up 94 percent of asphalt pavement and 80 percent of concrete.
It takes 152,000 tons of aggregates to build one mile of a four-lane interstate highway.
400TONS
AND94%
80%
TONS
152,000

PORTANT
SODA ASH OIL AND GAS
WHILE OIL IS PRIMARILY USED FOR FUELING THE NATION’S AUTOMOBILES, TRUCKS AND TRANS-PORTS, GAS IS USED PRIMARILY IN GENERATING ELECTRICITY AND HEATING OUR HOMES.
SODA ASH CONSUMPTION TENDS TO INCREASE IN PROPORTION TO POPULATION AND GROSS DOMESTIC PRODUCT GROWTH RATES.
3
47 percent of U.S. soda ash used in making glass.
30 percent of U.S. soda ash used in chemicals.
7 percent of U.S. soda ash used in soaps and detergents.
47%
30%
7%
In 2014, the United States consumed an average of 19.05 million barrels of petroleum products per day.
Oil accounts for 92 percent of the energy used for transportation in the United States.
The average U.S. home uses 200 cubic feet of natural gas every day.
92%
200
19.05MILLION

4
Even In A Challenging Market, Continued Diversification
In 2014, Natural Resource Partners continued to manage the tremendous challenges that accompany a turbulent commodity price environment. Our ability to move forward even in difficult times has helped to further establish us as a diversified natural resources company that is built for the long term. As evidence of our continued diversification:
• Total revenues and other income rose 12 percent, to $399.8 million, because of significant increases in revenue from aggregates and oil and gas assets, and from equity income from our soda ash business
• Approximately $173 million, or 43 percent, of our revenues and other income were attributable to non-coal-related assets
These increases have helped cushion us from an uncertain coal market and enabled us to offset continued declines in coal-related income.
Last year, we undertook two major transactions that both complemented our existing assets and are expected to deliver positive long-term value for our unitholders: the purchase of VantaCore Partners LLC, which specializes in the construction materials industry; and the acquisition of non-operated working interests in oil and gas properties in the Bakken/Three Forks play of the Williston Basin from an affiliate of Kaiser-Francis Oil Co.
VantaCore
VantaCore is one of the top 25 aggregates producers in the United States, controlling approximately 292 million tons of estimated reserves across five states. It operates three hard rock quarries, six sand and gravel plants, two asphalt plants, and a marine terminal. It was originally formed to acquire stable, well-managed companies and since 2006 has successfully integrated seven such companies. With an experienced management team in place, we believe that VantaCore will facilitate future growth in the construction aggregates business. In the fourth quarter of 2014 we recorded total revenues of $137.3 million compared with $94.7 million during the same period in 2013, an increase due largely to VantaCore’s contributions.
To Our UnitholdersAlthough 2014 was a challenging year by virtually any standard, Natural Resource Partners remained focused on executing a business plan designed to diversify our asset base, revenue streams, and cash flow. Even in an uncertain energy environ-ment, we reinforced our commitment to that strategy with two transformative acquisitions beyond the coal space – one in aggregates, the other in oil and gas – that are expected to deliver long-term value to our unitholders.
Learn more about our recent
acquisitions and how they
add value to the company.
VantaCore Acquisition
VantaCore is one of the top 25 aggregates producers in the country. It controls almost 300 million tons of estimated reserves in five states, and will facilitate our growth in the construction aggregates business.
Williston Basin
We acquired oil and gas assets in the Sanish Field, one of the nation’s premier producing regions. They include 6,086 net acres and 196 producing wells at December 31, 2014.

5
“ Our confidence is built in part on the belief that, in many ways, Natural Resource Partners is helping to supply America with what Americans have always needed...”Corbin J. Robertson, Jr.
Chairman and Chief Executive Officer

FOR THE YEAR ENDED DECEMBER 31
(in millions, except per unit) 2014 2013 2012 2011 2010 2009 2008 2007
Total Revenues $ 400 $ 358 $ 379 $ 378 $ 301 $ 256 $ 292 $ 215
Income from operations 189 236 267 104 196 154 197 128
Net income 109 172 213 54 154 114 170 102
Net income before
considering impairments 135 173 216 215 154 114 170 102
Net income per unit $ .94 $ 1.54 $ 1.97 $ .50 $ 1.54 $ 1.17 $ 1.95 $ 1.11
Net income per unit before
considering impairments $ 1.17 $ 1.55 $ 2.00 $ 1.99 $ 1.54 $ 1.17 $ 1.95 $ 1.11
Distributions per unit $ 1.40 $ 2.00 $ 2.20 $ 2.18 $ 2.16 $ 2.16 $ 2.07 $ 1.88
Weighted average number
of units outstanding 113 110 106 106 82 68 65 65
Cash from operations $ 211 $ 247 $ 271 $ 306 $ 259 $ 211 $ 230 $ 168
BALANCE SHEET DATA
(at December 31)
Cash and cash equivalents $ 50 $ 93 $ 149 $ 215 $ 96 $ 83 $ 90 $ 58
Total assets 2,445 1,992 1,765 1,666 1,664 1,524 1,301 1,320
Long-term debt 1,394 1,084 897 836 661 627 479 496
Partner’s capital 720 617 617 645 825 765 743 745
Financial Highlights
6
07 $215
$292
$256
$301
$378
$379
$358
$400
08
09
10
11
12
13
14
Total Revenue
Coal
Aggregates
Oil & Gas
Industrial Minerals
Other
$ in millions

7
2014 Highlights
• Revenues and other income increased 12 percent
• 43 percent of revenues and other income attributable to non-coal-related assets
• Transformative acquisitions that strengthened our position in the oil and gas and aggregates sectors
• Successful transition into a diversified natural resource company with a diverse range of assets
Williston Basin
Our acquisition in the Williston Basin is located in the Sanish Field in North Dakota, one of the premier, most prolific oil producing regions in the country. It includes over 6,000 net acres and 196 producing wells at year-end. This acquisition added to our existing non-operated working interest assets in the Williston Basin and will be easily integrated into our current operations.
Looking Forward: Prepared For The Challenges
While we have acquired some high-quality long-term assets for our unitholders, our debt level following those acquisitions is higher than we would like. As a result, we have implemented a long-term strategic plan that will help to strengthen our balance sheet and put us in a position to capitalize on future opportunities to expand our existing asset platforms. After several years of accelerated growth and diversifica-tion of assets through acquisitions, we will concentrate in 2015 on implementing our long-term plan to strengthen our balance sheet, reduce debt, and enhance liquidity. As part of our plan, we will increase our focus on capital efficiency and maintain our ongoing diversification strategy through organic growth of our aggregates, industrial minerals, and oil and natural gas assets. As we look ahead to the future, we do so with confidence but recognize the challenges that lie ahead.
Our confidence is built in part on the belief that, in many ways, Natural Resource Partners is helping to supply America with what Americans have always needed: coal for electricity; oil and gas for energy; raw materials for essential products like glass, chemicals, soap, and paper; and the aggregates necessary to build and rebuild the nation’s infrastructure, and to develop new residential and commercial structures. As America continues to grow, so too will the demand for our products.
Thanks to a forward-looking long-term strategy and a management team committed to executing effectively, we have transformed into a diverse natural resource company. As such, we are fully prepared to overcome any challenge and maximize any opportunity that the future may hold.
Corbin J. Robertson, Jr.
Chairman and Chief Executive Officer
Learn more about our
enduring value.

8
BOARD OF DIRECTORS
Corbin J. Robertson, Jr.
Chairman and Chief Executive Officer
Robert T. Blakely (1) (2) (3) (4)
Ally FinancialChairman of the Audit Committee Greenhill & Co.Westlake Chemical CorporationBoard Member
Russell D. Gordy (2) (4)
SG Interests, RGGS and Rock Creek Ranch Managing PartnerGordy Oil Company and Gordy Gas CorporationPresident
Donald R. Holcomb
Dickinson Fuel Company, Inc. Chief Executive Officer Dickinson Properties Limited PartnershipManaging General PartnerIkes Fork, LLC Owner and Manager
Robert B. Karn III (1) (2) (3) (4)
Peabody Energy CorporationKennedy Capital Management, Inc. Board Member Guggenheim family of funds – numerous publicly listed closed-end and exchange traded funds Board of Trustees Member
S. Reed Morian
DX Holding CompanyChairman, Chief Executive Officer and President
Richard A. Navarre (1) (4)
Civeo CorporationChairman of the Audit Committee Secure Energy, LLC Advisory Board Member
Corbin J. Robertson III
LKCM Headwater Investments GP, LLCCo-Managing PartnerGeneral partner of Genesis Energy L.P.Corsa Coal CorpBuckhorn Energy ServicesLL&B MineralsBoard Member
Stephen P. Smith (1) (3) (4) NiSource, Inc. Executive Vice President and Chief Financial Officer General partner of Columbia Pipeline Partners LP Chief Financial Officer, Chief Accounting Officer and Board Member
Leo A. Vecellio, Jr. (2) (4)
Vecellio Group, Inc. Chairman and Chief Executive Officer
OFFICERS
Corbin J. Robertson, Jr.
Chairman and Chief Executive Officer
Wyatt L. Hogan
President and Chief Operating Officer
Craig W. Nunez
Chief Financial Officer and Treasurer
Kevin J. Craig
Executive Vice President – Coal
Dennis F. Coker
Vice President – Aggregates
David Hartz
Vice President – Oil and Gas
Kathy H. Roberts
Vice President – Investor Relations
Kathryn S. Wilson
Vice President, General Counsel and Secretary
Gregory F. Wooten
Vice President – Chief Engineer
Christopher J. Zolas
Chief Accounting Officer
Directors & Officers
(1) Audit Committee(2) Nominating and Compensation Committee(3) Conflicts Committee(4) Independent Directors

UNITED STATES SECURITIES AND EXCHANGE COMMISSIONWashington, D.C. 20549
FORM 10-KÈ ANNUAL REPORT PURSUANT TO SECTION 13 OR 15(d)
OF THE SECURITIES EXCHANGE ACT OF 1934For the fiscal year ended December 31, 2014 or
‘ TRANSITION REPORT PURSUANT TO SECTION 13 OR 15(d)OF THE SECURITIES EXCHANGE ACT OF 1934For the transition period from to
Commission file number: 1-31465
NATURAL RESOURCE PARTNERS L.P.(Exact name of registrant as specified in its charter)
Delaware 35-2164875(State or other jurisdiction of
incorporation or organization)(I.R.S. Employer
Identification Number)
601 Jefferson, Suite 3600Houston, Texas
(Address of principal executive offices)
77002(Zip Code)
(713) 751-7507
(Registrant’s telephone number, including area code)Securities registered pursuant to Section 12(b) of the Act:
Title of each class Name of each exchange on which registered
Common Units representing limited partnership interests New York Stock Exchange
Securities registered pursuant to Section 12(g) of the Act:None.
Indicate by check mark if the registrant is a well-known seasoned issuer, as defined in Rule 405 of the SecuritiesAct. Yes È No ‘
Indicate by check mark if the registrant is not required to file reports pursuant to Section 13 or Section 15(d) of theAct. Yes ‘ No È
Indicate by check mark whether the registrant: (1) has filed all reports required to be filed by Section 13 or 15(d) of theSecurities Exchange Act of 1934 during the preceding 12 months (or for such shorter period that the registrant was requiredto file such reports), and (2) has been subject to such filing requirements for the past 90 days. Yes È No ‘
Indicate by check mark whether the registrant has submitted electronically and posted on its corporate Web site, if any,every Interactive Data File required to be submitted and posted pursuant to Rule 405 of Regulation S-T (§232.405 of thischapter) during the preceding 12 months (or for such shorter period that the registrant was required to submit and post suchfiles). Yes È No ‘
Indicate by check mark if disclosure of delinquent filers pursuant to Item 405 of Regulation S-K (§229.405 of thischapter) is not contained herein, and will not be contained, to the best of registrant’s knowledge, in definitive proxy orinformation statements incorporated by reference in Part III of this Form 10-K or any amendment to this Form 10-K. ‘
Indicate by check mark whether the registrant is a large accelerated filer, an accelerated filer, a non-accelerated filer or asmaller reporting company. See the definitions of “large accelerated filer,” “accelerated filer” and “smaller reportingcompany” in Rule 12b-2 of the Exchange Act.
È Large Accelerated Filer ‘ Accelerated Filer ‘ Non-accelerated Filer ‘ Smaller Reporting Company
Indicate by check mark whether the registrant is a shell company (as defined in Exchange Act Rule12b-2) Yes ‘ No È
The aggregate market value of the Common Units held by non-affiliates of the registrant (treating all executive officersand directors of the registrant and holders of 10% or more of the Common Units outstanding, for this purpose, as if they wereaffiliates of the registrant) was approximately $1.3 billion on June 30, 2014 based on a price of $16.57 per unit, which wasthe closing price of the Common Units as reported on the daily composite list for transactions on the New York StockExchange on that date.
As of February 27, 2015, there were 122,299,825 Common Units outstanding.
DOCUMENTS INCORPORATED BY REFERENCE.None.
Table of Contents
Item Page
PART I1. Business . . . . . . . . . . . . . . . . . . . . . . . . . . . . . . . . . . . . . . . . . . . . . . . . . . . . . . . . . . . . . . . . . . . . . . . . 2
1A. Risk Factors . . . . . . . . . . . . . . . . . . . . . . . . . . . . . . . . . . . . . . . . . . . . . . . . . . . . . . . . . . . . . . . . . . . . . 29
1B. Unresolved Staff Comments . . . . . . . . . . . . . . . . . . . . . . . . . . . . . . . . . . . . . . . . . . . . . . . . . . . . . . . . 45
2. Properties . . . . . . . . . . . . . . . . . . . . . . . . . . . . . . . . . . . . . . . . . . . . . . . . . . . . . . . . . . . . . . . . . . . . . . . 46
3. Legal Proceedings . . . . . . . . . . . . . . . . . . . . . . . . . . . . . . . . . . . . . . . . . . . . . . . . . . . . . . . . . . . . . . . . 46
4. Mine Safety Disclosures . . . . . . . . . . . . . . . . . . . . . . . . . . . . . . . . . . . . . . . . . . . . . . . . . . . . . . . . . . . 46
PART II5. Market for Registrant’s Common Equity, Related Unitholder Matters and Issuer Purchases of
Equity Securities . . . . . . . . . . . . . . . . . . . . . . . . . . . . . . . . . . . . . . . . . . . . . . . . . . . . . . . . . . . . . . . 47
6. Selected Financial Data . . . . . . . . . . . . . . . . . . . . . . . . . . . . . . . . . . . . . . . . . . . . . . . . . . . . . . . . . . . . 48
7. Management’s Discussion and Analysis of Financial Condition and Results of Operations . . . . . . . 50
7A. Quantitative and Qualitative Disclosures About Market Risk . . . . . . . . . . . . . . . . . . . . . . . . . . . . . . 73
8. Financial Statements and Supplementary Data . . . . . . . . . . . . . . . . . . . . . . . . . . . . . . . . . . . . . . . . . . 75
9. Changes In and Disagreements with Accountants on Accounting and Financial Disclosure . . . . . . . 109
9A. Controls and Procedures . . . . . . . . . . . . . . . . . . . . . . . . . . . . . . . . . . . . . . . . . . . . . . . . . . . . . . . . . . . 109
9B. Other Information . . . . . . . . . . . . . . . . . . . . . . . . . . . . . . . . . . . . . . . . . . . . . . . . . . . . . . . . . . . . . . . . 110
PART III10. Directors and Executive Officers of the Managing General Partner and Corporate Governance . . . . 111
11. Executive Compensation . . . . . . . . . . . . . . . . . . . . . . . . . . . . . . . . . . . . . . . . . . . . . . . . . . . . . . . . . . . 118
12. Security Ownership of Certain Beneficial Owners and Management . . . . . . . . . . . . . . . . . . . . . . . . . 128
13. Certain Relationships and Related Transactions, and Director Independence . . . . . . . . . . . . . . . . . . 129
14. Principal Accountant Fees and Services . . . . . . . . . . . . . . . . . . . . . . . . . . . . . . . . . . . . . . . . . . . . . . . 136
PART IV15. Exhibits, Financial Statement Schedules . . . . . . . . . . . . . . . . . . . . . . . . . . . . . . . . . . . . . . . . . . . . . . . 139

Forward-Looking Statements
Statements included in this Annual Report on Form 10-K may constitute forward-looking statements. Inaddition, we and our representatives may from time to time make other oral or written statements which are alsoforward-looking statements.
Such forward-looking statements include, among other things, statements regarding:
• our business strategy;
• our financial strategy;
• prices of and demand for coal, oil, natural gas, aggregates and industrial minerals;
• estimated revenues, expenses and results of operations;
• the amount, nature and timing of capital expenditures;
• our ability to make acquisitions and integrate the acquisitions we do make;
• our liquidity and access to capital and financing sources;
• projected production levels by our lessees, VantaCore Partners LLC, and the operators of our oil and gasworking interests;
• OCI Wyoming LLC’s trona mining and soda ash refinery operations;
• the impact of governmental policies, laws and regulations, as well as regulatory and legal proceedingsinvolving us, and of scheduled or potential regulatory or legal changes; and
• global and U.S. economic conditions.
These forward-looking statements speak only as of the date hereof and are made based upon management’scurrent plans, expectations, estimates, assumptions and beliefs concerning future events impacting us andtherefore involve a number of risks and uncertainties. We caution that forward-looking statements are notguarantees and that actual results could differ materially from those expressed or implied in the forward-lookingstatements.
You should not put undue reliance on any forward-looking statements. See “Item 1A. Risk Factors” in thisAnnual Report on Form 10-K for important factors that could cause our actual results of operations or our actualfinancial condition to differ.
1

PART I
As used in this Part I, unless the context otherwise requires: “we,” “our” and “us” refer to NaturalResource Partners L.P. and, where the context requires, our subsidiaries. References to “NRP” and “NaturalResource Partners” refer to Natural Resource Partners L.P. only, and not to NRP (Operating) LLC or any ofNatural Resource Partners L.P.’s subsidiaries. References to “Opco” refer to NRP (Operating) LLC and itssubsidiaries. References to NRP Oil and Gas refer to NRP Oil and Gas LLC, a wholly owned subsidiary of NRP.NRP Finance Corporation (“NRP Finance”) is a wholly owned subsidiary of NRP and a co-issuer with NRP onthe 9.125% senior notes.
Item 1. Business
We are a limited partnership formed in April 2002, and we completed our initial public offering in October2002. We engage principally in the business of owning, managing and leasing a diversified portfolio of mineralproperties in the United States, including interests in coal, trona and soda ash, crude oil and natural gas,construction aggregates, frac sand and other natural resources. Executing on our plans to diversify our business,we have completed over $900 million in acquisitions since January 2013. For the year ended December 31, 2014,we recorded revenues and other income of $399.8 million and Adjusted EBITDA of $300.3 million.Approximately $226.7 million (57%) of our 2014 revenues and other income were attributable to coal-relatedsources, and $173.0 million (43%) of our revenues and other income were attributed to non-coal-related sources.Adjusted EBITDA is a non-GAAP financial measure. For a reconciliation of Adjusted EBITDA to net income,see “Item 6. Selected Financial Data—Non-GAAP Financial Measures—Adjusted EBITDA.”
Our coal reserves are located in the three major U.S. coal-producing regions: Appalachia, the Illinois Basinand the Western United States, as well as lignite reserves in the Gulf Coast region. We do not operate any coalmines, but lease our reserves to experienced mine operators under long-term leases that grant the operators theright to mine and sell our reserves in exchange for royalty payments. We also own and manage infrastructureassets that generate additional revenues, primarily in the Illinois Basin.
We own or lease aggregates and industrial mineral reserves located in a number of states across the country.We derive a small percentage of our aggregates and industrial mineral revenues by leasing our owned reserves tothird party operators who mine and sell the reserves in exchange for royalty payments. However, the majority ofour aggregates and industrial mineral revenues come from VantaCore Partners LLC, which we acquired inOctober 2014. VantaCore specializes in the construction materials industry and operates three hard rock quarries,five sand and gravel plants, two asphalt plants and a marine terminal. VantaCore’s current operations are locatedin Pennsylvania, West Virginia, Tennessee, Kentucky and Louisiana.
We own a 49% non-controlling equity interest in a trona ore mining operation and soda ash refinery in theGreen River Basin, Wyoming. OCI Resources LP, our operating partner, mines the trona, processes it into sodaash, and distributes the soda ash both domestically and internationally into the glass and chemicals industries. Wereceive regular quarterly distributions from this business.
We own various interests in oil and gas properties that are located in the Williston Basin, the AppalachianBasin, Louisiana and Oklahoma. Our interests in the Appalachian Basin, Louisiana and Oklahoma are mineralsand royalty interests, while in the Williston Basin we own non-operated working interests. Our Williston Basinnon-operated working interest properties include the properties acquired in the Sanish Field from an affiliate ofKaiser-Francis Oil Company in November 2014.
Partnership Structure and Management
Our operations are conducted through, and our operating assets are owned by, our subsidiaries. We conductour business through two wholly owned operating companies: NRP (Operating) LLC and NRP Oil and Gas LLC.NRP (GP) LP, our general partner, has sole responsibility for conducting our business and for managing ouroperations. Because our general partner is a limited partnership, its general partner, GP Natural ResourcePartners LLC, conducts its business and operations, and the Board of Directors and officers of GP Natural
2

Resource Partners LLC make decisions on our behalf. Robertson Coal Management LLC, a limited liabilitycompany wholly owned by Corbin J. Robertson, Jr., owns all of the membership interest in GP Natural ResourcePartners LLC. Subject to the Investor Rights Agreement with Adena Minerals, LLC, Mr. Robertson is entitled tonominate ten directors, five of whom must be independent directors, to the Board of Directors of GP NaturalResource Partners LLC. Mr. Robertson has delegated the right to nominate two of the directors, one of whommust be independent, to Adena Minerals.
The senior executives and other officers who manage NRP are employees of Western Pocahontas PropertiesLimited Partnership and Quintana Minerals Corporation, companies controlled by Mr. Robertson, and theyallocate varying percentages of their time to managing our operations. Neither our general partner, GP NaturalResource Partners LLC, nor any of their affiliates receive any management fee or other compensation inconnection with the management of our business, but they are entitled to be reimbursed for all direct and indirectexpenses incurred on our behalf.
We have several regional offices through which we conduct our operations, the largest of which is located at5260 Irwin Road, Huntington, West Virginia 25705 and the telephone number is (304) 522-5757. Our principalexecutive office is located at 601 Jefferson Street, Suite 3600, Houston, Texas 77002 and our phone number is(713) 751-7507.
Coal and Coal-Related Properties
Coal Royalty Business
Royalty businesses principally own and manage mineral reserves. As an owner of coal reserves, wetypically are not responsible for operations on our coal properties, but instead enter into leases with operatorsgranting them the right to mine and sell reserves from our property in exchange for a royalty payment. A typicallease has a five- to ten-year base term, with the lessee having an option to extend the lease for additional terms.Leases may include the right to renegotiate rents and royalties for the extended term.
Under our standard lease, lessees calculate royalty payments due to us and are required to report tons of coalremoved as well as the sales prices of the extracted coal. Therefore, to a great extent, amounts reported as royaltyrevenue are based upon the reports of our lessees. We periodically audit this information by examining certainrecords and internal reports of our lessees, and we perform periodic mine inspections to verify that theinformation that our lessees have submitted to us is accurate. Our audit and inspection processes are designed toidentify material variances from lease terms as well as differences between the information reported to us and theactual results from each property.
In addition to their royalty obligations, our lessees are often subject to pre-established minimum monthly,quarterly or annual payments. These minimum rentals reflect amounts we are entitled to receive even if nomining activity occurred during the period. Minimum rentals are usually credited against future royalties that areearned as minerals are produced. Our current coal royalty leases provide for the payment of approximately $103million in minimums to us during 2015.
Because we do not operate any coal mines, our coal royalty business does not bear ordinary operating costsand has limited direct exposure to environmental, permitting and labor risks. As operators, our lessees are subjectto environmental laws, permitting requirements and other regulations adopted by various governmentalauthorities. In addition, the lessees generally bear all labor-related risks, including retiree health care legacycosts, black lung benefits and workers’ compensation costs associated with operating the mines on our coal andaggregates properties. We typically pay property taxes on our properties, which are then reimbursed by the lesseepursuant to the terms of the lease.
3

Coal Royalty Revenues, Reserves and Production
The following summary table sets forth coal royalty revenues and average coal royalty per ton from theproperties that we owned or controlled for the years ending December 31, 2014, 2013 and 2012. Coal royaltyrevenues were generated from the properties in each of the areas as follows:
Coal Royalty Revenues Average Coal Royalty Per Ton
Year Ended December 31, Year Ended December 31,
2014 2013 2012 2014 2013 2012
(In thousands) ($ per ton)
AreaAppalachia:
Northern . . . . . . . . . . . . . . . . . . . . . . . $ 8,621 $ 14,643 $ 15,768 $0.92 $1.27 $1.50
Central . . . . . . . . . . . . . . . . . . . . . . . . 89,627 105,004 156,390 $4.46 $5.05 $5.99
Southern . . . . . . . . . . . . . . . . . . . . . . . 20,292 26,156 29,325 $5.18 $6.30 $7.89
Total Appalachia . . . . . . . . . . . . . . . . . . 118,540 145,803 201,483 $3.55 $4.00 $5.00
Illinois Basin . . . . . . . . . . . . . . . . . . . . . 54,049 56,001 49,538 $4.10 $4.28 $4.38
Northern Powder River Basin . . . . . . . . 7,804 7,569 8,501 $2.74 $2.72 $3.58
Gulf Coast . . . . . . . . . . . . . . . . . . . . . . . 3,793 3,290 1,212 $3.47 $3.39 $2.60
Total . . . . . . . . . . . . . . . . . . . . . . . . . . . . $184,186 $212,663 $260,734 $3.65 $3.99 $4.79
The following summary table sets forth coal production data and reserve information for the properties thatwe owned or controlled for the years ending December 31, 2014, 2013 and 2012. All of the reserves reportedbelow are recoverable reserves as determined by the SEC’s Industry Guide 7. In excess of 90% of the reserveslisted below are currently leased to third parties. Coal production data and reserve information for the propertiesin each of the areas are as follows:
Coal Production and Reserves
Production for Year EndedDecember 31,
Proven and Probable Reserves atDecember 31, 2014
2014 2013 2012 Underground Surface Total
(Tons in thousands)
AreaAppalachia:
Northern . . . . . . . . . . . . . . . . . . . . . . . . . . . . . 9,339 11,505 10,486 469,206 27,864 497,070
Central . . . . . . . . . . . . . . . . . . . . . . . . . . . . . . 20,092 20,801 26,098 1,017,993 260,598 1,278,591
Southern . . . . . . . . . . . . . . . . . . . . . . . . . . . . . 3,914 4,151 3,718 83,846 24,730 108,576
Total Appalachia . . . . . . . . . . . . . . . . . . . . . . . . . 33,345 36,457 40,302 1,571,045 313,192 1,884,237
Illinois Basin . . . . . . . . . . . . . . . . . . . . . . . . . . . . 13,177 13,087 11,299 330,137 15,025 345,162
Northern Powder River Basin . . . . . . . . . . . . . . . 2,844 2,778 2,377 — 94,157 94,157
Gulf Coast . . . . . . . . . . . . . . . . . . . . . . . . . . . . . . 1,093 970 466 — 2,696 2,696
Total . . . . . . . . . . . . . . . . . . . . . . . . . . . . . . . . 50,459 53,292 54,444 1,901,182 425,070 2,326,252
We classify low sulfur coal as coal with a sulfur content of less than 1.0%, medium sulfur coal as coal witha sulfur content between 1.0% and 1.5% and high sulfur coal as coal with a sulfur content of greater than 1.5%.Compliance coal is coal which meets the standards of Phase II of the Clean Air Act and is that portion of lowsulfur coal that, when burned, emits less than 1.2 pounds of sulfur dioxide per million Btu. As of December 31,2014, approximately 49% of our reserves were low sulfur coal and 32% of our reserves were compliance coal.Unless otherwise indicated, we present the quality of the coal throughout this Annual Report on Form 10-K on anas-received basis, which assumes 6% moisture for Appalachian reserves, 12% moisture for Illinois Basin
4

reserves and 25% moisture for Northern Powder River Basin reserves. We own both steam and metallurgical coalreserves in Northern, Central and Southern Appalachia, as well as the Gulf Coast, and we own steam coalreserves in the Illinois Basin and the Northern Powder River Basin. In 2014, approximately 32% of theproduction and 40% of the coal royalty revenues from our properties were from metallurgical coal.
The following table sets forth our estimate of the sulfur content, the typical quality of our coal reserves andthe type of coal in each area as of December 31, 2014.
Sulfur Content, Typical Quality and Type of Coal
Sulfur Content Typical Quality Type of Coal
ComplianceCoal(1)
Low(<1.0%)
Medium(1.0%
to1.5%)
High(>1.5%) Total
HeatContent(Btu perpound)
Sulfur(%) Steam Met(2)
(Tons in thousands) (Tons in thousands)
Area
Appalachia
Northern . . . . . . . . . . . . . . . . . . 50,097 72,816 24,466 399,788 497,070 12,831 2.58 487,508 9,562
Central . . . . . . . . . . . . . . . . . . . 623,881 885,689 332,186 60,716 1,278,591 13,311 0.90 858,899 419,692
Southern . . . . . . . . . . . . . . . . . . 72,273 78,337 27,499 2,740 108,576 13,509 0.84 78,590 29,986
Total Appalachia . . . . . . . . . . . . . 746,251 1,036,842 384,151 463,244 1,884,237 13,196 1.34 1,424,997 459,240
Illinois Basin . . . . . . . . . . . . . . . . — — 2,183 342,979 345,162 11,497 3.28 345,162 —
Northern Powder River Basin . . . — 94,157 — — 94,157 8,800 0.65 94,157 —
Gulf Coast . . . . . . . . . . . . . . . . . . 96 2,696 — — 2,696 6,922 0.69 2,600 96
Total . . . . . . . . . . . . . . . . . . . . . . . 746,347 1,133,695 386,334 806,223 2,326,252 1,866,916 459,336
(1) Compliance coal meets the sulfur dioxide emission standards imposed by Phase II of the Clean Air Actwithout blending with other coals or using sulfur dioxide reduction technologies. Compliance coal is asubset of low sulfur coal and is, therefore, also reported within the amounts for low sulfur coal.
(2) For purposes of this table, we have defined metallurgical coal reserves as reserves located in those seamsthat historically have been of sufficient quality and characteristics to be able to be used in the steel makingprocess. Some of the reserves in the metallurgical category can also be used as steam coal.
We have engaged outside consultants to conduct reserve studies of our existing properties. These studies arean ongoing process and we will update the reserve studies based on our review of the following factors: the sizeof the properties, the amount of production that has occurred, or the development of new data which may be usedin these studies. In connection with most acquisitions, we have either commissioned new studies or relied onrecent reserve studies completed prior to the acquisition. In addition to these studies, we base our estimates ofreserve information on engineering, economic and geological data assembled and analyzed by our internalgeologists and engineers. There are numerous uncertainties inherent in estimating the quantities and qualities ofrecoverable reserves, including many factors beyond our control. Estimates of economically recoverable coalreserves depend upon a number of variable factors and assumptions, any one of which may, if incorrect, result inan estimate that varies considerably from actual results. See “Item 1A. Risk Factors—Risks Related to OurBusiness—Our reserve estimates depend on many assumptions that may be inaccurate, which could materiallyadversely affect the quantities and value of our reserves.”
5

Major Coal Properties
The following is a summary of our major coal producing properties in each region:
Appalachia
Northern Appalachia
Hibbs Run. The Hibbs Run property is located in Marion County, West Virginia. In 2014, 6.0 million tonswere produced from the property by Consolidation Coal Company. Coal from this property is produced fromlongwall mines. The royalty rate for this property is a low fixed rate per ton and has a significant effect on the perton revenue for the region. Coal is shipped by rail to utility customers such as First Energy and PPL.
Beaver Creek. The Beaver Creek property is located in Grant and Tucker Counties, West Virginia. In2014, 1.4 million tons were produced from this property. We lease this property to Mettiki Coal, LLC, asubsidiary of Alliance Resource Partners L.P. Coal is produced from an underground longwall mine and istransported by truck to a preparation plant operated by the lessee. Coal is shipped primarily by truck to the MountStorm power plant of Dominion Power.
AFG-Ohio. The AFG-Ohio property is located in Belmont County, Ohio. In 2014, 1.4 million tons wereproduced from the property. We lease this property to subsidiaries of Murray Energy Corporation. Coal isproduced from an underground longwall mine and shipped by rail and barge to customers including AEP, DukeEnergy and First Energy.
6

The map below shows the location of our properties in Northern Appalachia.
7

Central Appalachia
VICC/Alpha. The VICC/Alpha property is located in Wise, Dickenson, Russell and Buchanan Counties,Virginia. In 2014, 3.8 million tons were produced from this property. We primarily lease this property to asubsidiary of Alpha Natural Resources, Inc. Production comes from both underground and surface mines and istrucked to one of four preparation plants. Coal is shipped via both the CSX and Norfolk Southern railroads toutility and metallurgical customers. Major customers include American Electric Power, Southern Company,Tennessee Valley Authority, VEPCO and U.S. Steel and to various export metallurgical customers.
Dingess-Rum. The Dingess-Rum property is located in Logan, Clay and Nicholas Counties, West Virginia.This property is leased to subsidiaries of Alpha Natural Resources, Inc. and Patriot Coal Corporation. In 2014,2.9 million tons were produced from the property. Both steam and metallurgical coal are produced fromunderground and surface mines and has been historically transported by belt or truck to preparation plants on theproperty. Coal is shipped via the CSX railroad to steam customers such as American Electric Power, DaytonPower and Light, Detroit Edison and to various export metallurgical customers.
Pinnacle. The Pinnacle property is located in Wyoming and McDowell Counties, West Virginia. In 2014,2.4 million tons of metallurgical coal were produced from our reserves on this property. We also own anoverriding royalty interest on coal produced from the reserves that we do not own at this property, from whichwe derive additional revenues. We lease the property to a subsidiary of Cliffs Natural Resources, Inc. Productioncomes from a longwall mine and is transported by beltline to a preparation plant and is then shipped via railroadand barge to both domestic and export customers.
Lynch. The Lynch property is located in Harlan and Letcher Counties, Kentucky. In 2014, 2.1 million tonswere produced from this property. We primarily lease the property to a subsidiary of Alpha Natural Resources,Inc. Production comes from both underground and surface mines. This property has the ability to ship coal onboth the CSX and Norfolk Southern railroads.
VICC/Kentucky Land. The VICC/Kentucky Land property is located primarily in Perry, Leslie and PikeCounties, Kentucky. In 2014, 1.7 million tons were produced from this property. Coal is produced from a numberof lessees, including subsidiaries of TECO and Blackhawk Mining, from both underground and surface mines.Coal is shipped primarily by truck but also on the CSX and Norfolk Southern railroads to customers such asSouthern Company, Tennessee Valley Authority, and American Electric Power.
Lone Mountain. The Lone Mountain property is located in Harlan County, Kentucky. In 2014, 1.4 milliontons were produced from this property. We lease the property to a subsidiary of Arch Coal, Inc. Productioncomes from underground mines and is transported primarily by beltline to a preparation plant on adjacentproperty and shipped on the Norfolk Southern or CSX railroads to utility and metallurgical customers such asSCANA and US Steel.
Kingston. The Kingston property is located in Fayette and Raleigh Counties, West Virginia. This propertyis leased to a subsidiary of Alpha Natural Resources, Inc. In 2014, 1.1 million tons were produced from theproperty. Both steam and metallurgical coal are produced from underground and surface mines and has beenhistorically transported by belt or truck to a preparation plant on the property or shipped raw. During 2014, thelessee idled the surface mines on the property in response to market conditions. Coal is shipped via both the CSXrailroad and by truck to barges to steam customers and various export metallurgical customers.
D.D. Shepard. The D.D. Shepard property is located in Boone County, West Virginia. This property isprimarily leased to a subsidiary of Patriot Coal Corporation. In 2014, 641,000 tons were produced from theproperty. Both steam and metallurgical coal are produced by the lessees from underground and surface mines.Coal is transported from the mines via belt or truck to preparation plants on the property. Coal is shipped via theCSX railroad to various domestic and export metallurgical customers.
Pardee. The Pardee property is located in Letcher County, Kentucky and Wise County, Virginia. In 2014,512,000 tons were produced from this property. We lease the property to a subsidiary of Arch Coal, Inc. andRevelation Energy. In late 2014, Arch surrendered the surface mineable coal on the lease and we entered into a
8

new lease for those reserves with Revelation Energy. Production comes from underground mines and istransported by truck or beltline to a preparation plant on the property and shipped on the Norfolk Southernrailroad primarily to domestic and export metallurgical customers such as Algoma Steel and Arcelor.
The map below shows the location of our properties in Central Appalachia.
9

Southern Appalachia
Oak Grove. The Oak Grove property is located in Jefferson County, Alabama. In 2014, 2.4 million tonswere produced from this property. We lease the property to a subsidiary of Cliffs Natural Resources, Inc.Production comes from an underground mine and is transported primarily by beltline to a preparation plant. Themetallurgical coal is then shipped via railroad and barge to both domestic and export customers.
BLC Properties. The BLC properties are located in Kentucky and Tennessee. In 2014, 1.5 million tons wereproduced from these properties. We lease these properties to a number of operators including Middlesboro MiningProperties, Inc., Revelation Energy, LLC and Corsa Coal Corp. Production comes from both underground andsurface mines and is trucked to preparation plants and loading facilities operated by our lessees. Coal is transportedby truck and is shipped via both CSX and Norfolk Southern railroads to utility and industrial customers. Majorcustomers include South Carolina Electric & Gas, and numerous medium and small industrial customers.
The map below shows the location of our properties in Southern Appalachia.
10

Illinois Basin
Williamson. The Williamson property is located in Franklin and Williamson Counties, Illinois. Theproperty is under lease to a subsidiary of Foresight Energy LP, and in 2014, 6.0 million tons were mined on theproperty. This production is from a longwall mine and is shipped primarily via the Canadian National railroad tocustomers such as Duke Energy and to various export customers.
Hillsboro. The Hillsboro property is located in Montgomery and Bond Counties, Illinois. The property isunder lease to a subsidiary of Foresight Energy LP, and in 2014, 5.4 million tons were shipped from the property.Production is currently from an underground longwall mine and is shipped via either the Union Pacific, NorfolkSouthern or Canadian National railroads or by barges to domestic utilities or export customers.
Macoupin. The Macoupin property is located in Macoupin County, Illinois. The property is under lease toa subsidiary of Foresight Energy LP, and in 2014, 1.1 million tons were shipped from the property. Production isfrom an underground mine and is shipped via the Norfolk Southern or Union Pacific railroads or by barge tocustomers such as Western KY Energy and other midwest utilities or loaded into barges for shipment to exportcustomers.
Sahara. The Sahara property is located in Saline, Hamilton and Williamson Counties in Illinois. Thisproperty was acquired in June of 2014. The property is under lease to a subsidiary of Peabody EnergyCorporation, and following the acquisition in 2014, 486,000 tons were mined on the property. Production iscurrently from an underground mine and is shipped via barge primarily to Tennessee Valley Authority.
In addition to these properties, we own loadout and other transportation assets at the Williamson andMacoupin mines and at the Sugar Camp mine, which is another mine operated by Foresight Energy LP. See“—Coal Transportation and Processing Assets.”
11

The map below shows the location of our properties in the Illinois Basin.
12

Northern Powder River Basin
Western Energy. The Western Energy property is located in Rosebud and Treasure Counties, Montana. In2014, 2.8 million tons were produced from our property. A subsidiary of Westmoreland Coal Company has twocoal leases on the property. Coal is produced by surface dragline mining, and the coal is transported by eithertruck or beltline to the four-unit 2,200-megawatt Colstrip generation station located at the mine mouth.
The map below shows the location of our properties in the Northern Powder River Basin.
13

Coal Transportation and Processing Assets
We own preparation plants and related material handling facilities that we lease to third parties. Similar toour royalty structure, the throughput fees for the use of these facilities are based on a percentage of the ultimatesales price for the material that is processed.
In addition to our preparation plants, we own handling and transportation infrastructure related to certain ofour coal and aggregates properties. We own loadout and other transportation assets at the Williamson andMacoupin mines in the Illinois Basin. In addition, we own rail loadout and associated infrastructure at the SugarCamp mine, an Illinois Basin mine operated by an affiliate of Foresight Energy. While we own coal reserves atthe Williamson and Macoupin mines, we do not own coal reserves at the Sugar Camp mine. We typically leasethis infrastructure to third parties and collect throughput fees; however, at the loadout facility at the Williamsonmine in Illinois, we operate the coal handling and transportation infrastructure and have subcontracted out thatresponsibility to a third party.
Total revenues from our coal transportation and processing assets were $22.0 million for the year endedDecember 31, 2014.
Aggregates and Industrial Minerals Business
Aggregates are crushed stone, sand and gravel, utilized in the construction of the majority of our country’sinfrastructure. Aggregates are used in nearly every residential, commercial and building construction project andin most public works projects, such as roads, highways, bridges, railroad beds, dams, airports, water and sewagetreatment plants and systems and tunnels. Through our subsidiary, VantaCore Partners LLC, we mine andproduce construction materials. In addition, we own aggregates reserves throughout the United States, a portionof which are leased to third parties in exchange for royalty payments.
Industrial minerals include non-fuel mineral resources such as soda ash, sand, lime, potash and rare earths,among others, that are mined and processed for a wide range of industrial and consumer applications such asglass, abrasives, soaps and detergents. We own a 49% noncontrolling equity interest in OCI Wyoming’s tronamining and soda ash production operation.
14

VantaCore Partners LLC Construction Materials Business
VantaCore is a construction materials company that we acquired on October 1, 2014. VantaCore operatesthree limestone quarries, five sand and gravel plants, two asphalt plants and a marine terminal. VantaCore isheadquartered in Philadelphia, Pennsylvania, and its operations are located in Pennsylvania, West Virginia,Tennessee, Kentucky and Louisiana. As of December 31, 2014, VantaCore controlled approximately 292 milliontons of estimated aggregates reserves. The reserve estimates for each of VantaCore’s properties were preparedinternally and audited by an independent third party advisor. For the three months ended December 31, 2014,VantaCore sold approximately 1.9 million tons of crushed stone and gravel, including brokered stone, 0.4 milliontons of sand and 40,000 tons of asphalt. VantaCore’s three operating businesses are Laurel Aggregates, located inLake Lynn, Pennsylvania, Winn Materials/McIntosh Construction, located near Clarksville, Tennessee, andSouthern Aggregates, located near Baton Rouge, Louisiana. VantaCore’s business is seasonal, with productiontypically lower in the first quarter of each year due to winter weather. The following map shows the locations ofeach of VantaCore’s operations.
Baton Rouge
Nashville
Pittsburgh
Laurel Aggregates
Winn Materials
Southern Aggregates
Laurel Aggregates
Laurel Aggregates is a limestone mining company located in Lake Lynn, Pennsylvania. Its operationsconsist of a surface mine and an underground mine and use conventional drilling, blasting and crushing methods.The surface mine is located on approximately 100 acres of owned property, and the underground reserves arelocated on approximately 670 acres of leased property. Laurel pays royalties for material mined and sold from itsleased property. Laurel also brokers stone for third party quarries located in Ohio and Pennsylvania. Crushedstone is loaded into third party trucks for delivery to customers located in southwestern Pennsylvania,northeastern West Virginia and eastern Ohio. Laurel’s customers consist primarily of oilfield service companiesand natural gas exploration and production companies and also include construction and contracting companies.
Winn Materials/McIntosh Construction
Winn Materials’ operations consist of two crushed stone quarries and a river terminal, while McIntosh is acomplementary asphalt producer and paving company. Together, the two companies function as a verticallyintegrated unit. The operations of Winn/McIntosh are located in and around Clarksville, Tennessee, which islocated approximately 45 miles northwest of Nashville and is Tennessee’s fifth largest city.
15

Winn mines and produces hard rock limestone using conventional drilling, blasting and crushing methods.Winn primarily leases its properties at its two quarries located in Clarksville and in Trenton, Kentucky and paysroyalties for material produced and sold from the leased properties. Winn’s marine terminal business is locatedon the Cumberland River, adjacent to Winn’s Clarksville quarry. Its dock transloads various materials by barge.Through the river terminal, Winn loads out crushed stone and also imports products such as river and granitesand and fertilizer and agricultural products for the local and regional markets. The river terminal is currentlybeing expanded to meet growing demand for additional imported product into these markets. Crushed stoneproduced at Winn’s quarries and products imported from the river terminal are loaded onto third party trucks fordelivery to Winn’s customers.
McIntosh sells asphalt to third parties and also operates its own paving business. Winn supplies most ofMcIntosh’s crushed stone and sand used for both its asphalt production and construction needs. The Winn/McIntosh businesses sell to and provide services for residential, commercial and industrial customers. Thesebusinesses also supply and provide construction services for infrastructure and highway construction projectsprimarily within Montgomery County, Tennessee, including for Fort Campbell, one of the largest Army bases inthe United States.
Southern Aggregates
Southern Aggregates is a sand and gravel mining company based in Denham Springs, Louisianaapproximately 25 miles northeast of Baton Rouge, Louisiana. Southern operates five sand and gravel operations.Suction dredges extract sand and gravel, and the mined material is processed at plants generally located at eachsite. The plants separate gravel and saleable sand from waste sand and clays, and the waste is returned to mined-out sections of pits. The saleable sand and gravel material is loaded onto third party trucks for delivery toSouthern’s customers. Southern leases its mineral reserves and pays royalties based on its sales volumes.Southern’s markets extend approximately 100 miles west and south from its operating locations, including to thecities of Baton Rouge, Lafayette and New Orleans. Southern’s customers consist primarily of ready mix concretecompanies, asphalt producers and contractors.
Trona Mining and Soda Ash Production Business
We own a 49% non-controlling equity interest in OCI Wyoming LLC (“OCI Wyoming”), which is one ofthe largest and lowest cost producers of soda ash in the world, serving a global market from its facility located inthe Green River Basin of Wyoming. The Green River Basin geological formation holds the largest, and one ofthe highest purity, known deposits of trona ore in the world. Trona, a naturally occurring soft mineral, is alsoknown as sodium sesquicarbonate and consists primarily of sodium carbonate, or soda ash, sodium bicarbonateand water. OCI Wyoming processes trona ore into soda ash, which is an essential raw material in flat glass,container glass, detergents, chemicals, paper and other consumer and industrial products. The vast majority of theworld’s trona reserves are located in the Green River Basin. According to historical production statistics,approximately one-quarter of global soda ash is produced by processing trona, with the remainder beingproduced synthetically through chemical processes. The costs associated with procuring the materials needed forsynthetic production are greater than the costs associated with mining trona for trona-based production. Inaddition, trona-based production consumes less energy and produces fewer undesirable by-products thansynthetic production.
OCI Wyoming’s Green River Basin surface operations are situated on approximately 880 acres inWyoming, and its mining operations consist of approximately 23,500 acres of leased and licensed subsurfacemining area. The facility is accessible by both road and rail. OCI Wyoming uses six large continuous miningmachines and ten underground shuttle cars in its mining operations. Its processing assets consist of materialsizing units, conveyors, calciners, dissolver circuits, thickener tanks, drum filters, evaporators and rotary dryers.
16

The following map provides an aerial view of OCI Wyoming’s surface operations.
In trona ore processing, insoluble materials and other impurities are removed by thickening and filtering theliquor, a solution consisting of sodium carbonate dissolved in water. OCI Wyoming then adds activated carbon tofilters to remove organic impurities, which can cause color contamination in the final product. The resulting clearliquid is then crystallized in evaporators, producing sodium carbonate monohydrate. The crystals are then drawnoff and passed through a centrifuge to remove excess water. The resulting material is dried in a product dryer toform anhydrous sodium carbonate, or soda ash. The resulting processed soda ash is then stored in seven on-sitestorage silos to await shipment by bulk rail or truck to distributors and end customers. OCI Wyoming’s storagesilos can hold up to 65,000 short tons of processed soda ash at any given time. The facility is in good workingcondition and has been in service for over 50 years.
The evaporation stage of trona ore processing produces a precipitate and natural by-product called deca.“Deca,” short for sodium carbonate decahydrate, is one part soda ash and ten parts water. Solar evaporationcauses deca to crystallize and precipitate to the bottom of the four main surface ponds at the Green River Basinfacility. OCI Wyoming’s deca rehydration process enables OCI Wyoming to reduce waste storage needs andconvert what is typically a waste product into a usable raw material. As a result of this process, OCI Wyominghas been able to reduce the amount of short tons of trona ore it takes to produce one short ton of soda ash.
The soda ash produced is shipped by rail or truck from the Green River Basin facility. For the year endedDecember 31, 2014, OCI Wyoming shipped approximately 96.0% of its soda ash to customers initially via railunder a contract with Union Pacific that expires on December 31, 2017, and the plant receives rail serviceexclusively from Union Pacific. OCI Wyoming leases a fleet of more than 1,700 hopper cars that serve asdedicated modes of shipment to its domestic customers. For export, OCI Wyoming ships soda ash on unit trainsconsisting of approximately 100 cars to two primary ports: Port Arthur, Texas and Portland, Oregon. From theseports, the soda ash is loaded onto ships for delivery to ports all over the world. American Natural Soda Ash
17

Corporation (“ANSAC”) provides logistics and support services for all of OCI Wyoming’s export sales. Fordomestic sales, OCI Chemical Co. provides similar services.
OCI Wyoming’s largest customer is ANSAC, which buys soda ash (through OCI Wyoming’s sales agent)and other of its member companies for further export to its customers. ANSAC takes soda ash orders directlyfrom its overseas customers and then purchases soda ash for resale from its member companies pro rata based oneach member’s production volumes. ANSAC is the exclusive distributor for its members to the markets it serves.However, OCI Chemical, on OCI Wyoming’s behalf, negotiates directly with, and OCI Wyoming exports to,customers in markets not served by ANSAC.
OCI Wyoming is party to nine mining leases and one license for its subsurface mining rights. Some of theleases are renewable at OCI Wyoming’s option upon expiration. OCI Wyoming pays royalties to the State ofWyoming, the U.S. Bureau of Land Management and Anadarko Petroleum or its affiliates, which are calculatedbased upon a percentage of the quantity or gross value of soda ash and related products at a certain stage in themining process, or a certain sum per ton of such products. These royalty payments are typically subject to aminimum domestic production volume from the Green River Basin facility, although OCI Wyoming is obligatedto pay minimum royalties or annual rentals to its lessors and licensor regardless of actual sales. The royalty ratespaid to OCI Wyoming’s lessors and licensor may change upon renewal of such leases and license.
As a minority interest owner in OCI Wyoming, we do not operate and are not involved at all in the day-to-day operation of the trona ore mine or soda ash production plant. Our partner, OCI Resources LP manages themining and plant operations. We appoint three of the seven members of the Board of Managers of OCI Wyomingand have certain limited negative controls relating to the company.
Aggregates/Industrial Minerals Royalty Business
We own an estimated 500 million tons of aggregates reserves located in a number of states across thecountry. We lease a portion of these reserves to third parties in exchange for royalty payments. The structure ofthese leases is similar to our coal leases, and these leases typically also require minimum rental payments inaddition to royalties. See “—Coal and Coal-Related Properties—Coal Royalty Business” for a description of ourroyalty structure. In 2006, we bought our first aggregates reserves property on the Puget Sound in WashingtonState. Since that time, we have made several other aggregates reserve purchases in multiple U.S. geographies.During 2014, our aggregates lessees produced 3.5 million tons of aggregates from these properties and wereceived $8.7 million in aggregates royalty revenues, including overriding royalty revenues.
Oil and Natural Gas Properties
We generate oil and gas revenues from non-operated working interests, royalty interests and overridingroyalty interests in producing oil and gas wells. During 2014, we generated $59.6 million in revenues from ourinterests in oil and gas properties. Our primary interests in oil and natural gas producing properties are our non-operated working interests located in the Williston Basin, but we also own fee mineral, royalty or overridingroyalty interests in oil and gas properties in several other areas, including the Appalachian Basin and theMississippian Lime formation. NRP owns a 51% interest in BRP LLC, which owns oil and gas mineral rights, innorthern Louisiana. See “—BRP LLC Joint Venture.”
Revenues related to our non-operated working interests in oil and gas assets are recognized on the basis ofour net revenue interests in hydrocarbons produced. We also incur capital expenditures and operating expensesassociated with the non-operated working interests. Oil and gas royalty revenues include production payments aswell as bonus payments and are recognized on the basis of hydrocarbons sold by lessees and the correspondingrevenues from those sales. Generally, the lessees make payments based on a percentage of the selling price.Some leases are subject to minimum annual payments or delay rentals. Our revenues fluctuate based on changesin the market prices for oil and natural gas, the decline in production from producing wells, and other factorsaffecting the third-party oil and natural gas exploration and production companies that operate our wells,including the cost of development and production.
18

Our non-operated working interests are all located in the Williston Basin in North Dakota and Montana. Asof December 31, 2014, we had non-operated working interests in 21,832 net acres in the basin, all of which areheld by production. These assets include 6,086 net acres in the Sanish Field in Mountrail County, North Dakotathat we acquired in November 2014 from an affiliate of Kaiser-Francis Oil Company. The interests acquired inthat acquisition are all operated by Whiting Petroleum Corporation and include an estimated average workinginterest of 14.5% in approximately 196 wells that were producing as of December 31, 2014.
We own royalty interests where we have leased certain portions of our owned mineral interests to thirdparties primarily located in the southern portion of the Appalachian Basin and in the Mississippian Lime inOklahoma. We also own overriding royalty interests primarily located in the Appalachian Basin in West Virginiaand Pennsylvania, including in the Marcellus Shale, and in the Haynesville Shale in Louisiana.
Estimated Proved Reserves
Proved reserves are those quantities of crude oil and natural gas which, by analysis of geoscience andengineering data, can be estimated with reasonable certainty to be economically producible from a given dateforward, from known reservoirs, and under existing economic conditions, operating methods, and governmentregulations prior to the time at which contracts providing the right to operate expire, unless evidence indicatesrenewal is reasonably certain. In connection with the estimation of proved reserves, the term “reasonablecertainty” implies a high degree of confidence that the quantities of crude oil, natural gas liquids and/or naturalgas actually recovered will equal or exceed the estimate. Our estimated proved reserves as of December 31, 2014were prepared by Netherland, Sewell & Associates, Inc., our independent reserve engineer. To achievereasonable certainty, Netherland Sewell employed technologies that have been demonstrated to yield results withconsistency and repeatability. The technologies and economic data used in the estimation of our proved reservesinclude, but are not limited to, well logs, geologic maps including isopach and structure maps, analogy andstatistical analysis, and available downhole and production data and well test data.
The following tables set forth our estimated proved and related standardized measure of discounted cashflows by reserve category as of December 31, 2014. Netherland Sewell prepared its report covering propertiesrepresenting 100% of our estimated proved reserves as of December 31, 2014. Prices were calculated using theunweighted average of the first-day-of-the-month pricing for the twelve months ended December 31, 2014.These prices were then adjusted for transportation and other costs. There can be no assurance that the provedreserves will be produced as estimated or that the prices and costs will remain constant. There are numerousuncertainties inherent in estimating reserves and related information and different reserve engineers often arriveat different estimates for the same properties. A copy of Netherland Sewell’s summary report is included asExhibit 99.2 to this Annual Report on Form 10-K.
Estimated Proved Reserves as of December 31, 2014(1)
Crude Oil(MBbl)
NGLs(MBbl)
Natural Gas(MMcf)
Total ProvedReserves
(MBoe)(2)
StandardizedMeasure of
Discounted CashFlows(3)
(in thousands)
Proved Developed Producing . . . . . . . . . . . . . . . . 8,918 1,093 13,069 12,189 $286,179
Proved Developed Non-Producing . . . . . . . . . . . . 12 5 92 32 655
Proved Undeveloped . . . . . . . . . . . . . . . . . . . . . . . 1,053 131 1,209 1,386 18,363
Total . . . . . . . . . . . . . . . . . . . . . . . . . . . . . . . . . . 9,983 1,229 14,370 13,607(4) $305,197
(1) Includes reserves attributable to our 51% member interest in BRP LLC.
(2) Natural gas is converted on the basis of six Mcf of gas per one Bbl of oil equivalent. This ratio reflects anenergy content equivalency and not a price or revenue equivalency.
(3) Standardized measure of discounted cash flows represents the present value of estimated future net revenueto be generated from the production of proved reserves, determined in accordance with the rules and
19

regulations of the SEC (using prices and costs in effect as of the date of estimation), less futuredevelopment, production and income tax expenses, and discounted at 10% per annum to reflect the timingof future net revenue.
(4) Includes 12,144 MBoe of estimated proved reserves attributable to our non-operated working interests in oiland natural gas properties in the Williston Basin, approximately 10% of which were proved undevelopedreserves.
Proved Undeveloped Reserves
As of December 31, 2014, our estimated proved undeveloped reserves were 1,386 MBoe. During 2014, weparticipated in 33 wells related to the conversion of estimated proved undeveloped reserves with associatedcapital expenditures of $5.2 million. During 2014, we converted 704 MBoe of estimated proved undevelopedreserves to estimated proved developed reserves. As of December 31, 2014, we had no estimated provedundeveloped reserves that have remained undeveloped for more than five years, and we expect all estimatedproved undeveloped reserves reported herein will be developed within the next two years.
For additional information on our estimated proved reserves, see Note 19 to the audited consolidatedfinancial statements included elsewhere in this Annual Report on Form 10-K.
Qualifications of Technical Persons and Internal Controls Over Reserves Estimation Process
Netherland Sewell, our independent reserve engineering firm, estimated, in accordance with generallyaccepted petroleum engineering and evaluation principles and definitions and guidelines established by theSecurities and Exchange Commission, 100% of our proved reserves as of December 31, 2014. The NetherlandSewell technical personnel responsible for preparing the reserve estimates presented herein meet therequirements regarding qualifications, independence, objectivity and confidentiality set forth in the StandardsPertaining to the Estimating and Auditing of Oil and Gas Reserves Information promulgated by the Society ofPetroleum Engineers. See Exhibit 99.2 included as an exhibit to this Annual Report on Form 10-K for furtherdiscussion of the qualifications of Netherland Sewell personnel.
We maintain an internal staff of petroleum engineers and geoscience professionals who work closely withour independent reserve engineers to ensure the integrity, accuracy and timeliness of data furnished to NetherlandSewell in their reserves estimation process. In the fourth quarter, our technical team was in contact regularly withrepresentatives of Netherland Sewell to review properties and discuss methods and assumptions used inNetherland Sewell’s preparation of the year-end reserves estimates. A copy of the Netherland Sewell reservereport was reviewed by our internal technical staff prior to the inclusion of such report in this Annual Report onForm 10-K.
Our Director-Engineering and Reserves is the technical person primarily responsible for overseeing thepreparation of our reserve estimates. He has a Bachelor of Science degree in Petroleum Engineering from theUniversity of Texas at Austin and is a member of the Society of Petroleum Engineers. Prior to joining NRP, hespent nine years at DeGolyer and MacNaughton as a reservoir engineer working on multiple aspects of reserveevaluation and appraisals. The Director-Engineering and Reserves reports directly to our Vice President, Oil andGas.
20

Production and Price History
The following table sets forth summary information concerning our production results, average sales pricesand production costs for the year ended December 31, 2014 in total and for each field containing 15 percent ormore of our total proved reserves as of December 31, 2014. Production and price information for the years endedDecember 31, 2013 and 2012 is not included, as our oil and natural gas producing activities were not material toour results of operations for those years.
Year Ended December 31, 2014
WillistonBasin(1)
Royalty andOverriding
RoyaltyInterests(2) Total
Net Production Volumes:Crude oil (MBbl) . . . . . . . . . . . . . . . . . . . . . . . . . . . . . . . . . . . . . . 578 33 611
NGLs (MBbl) . . . . . . . . . . . . . . . . . . . . . . . . . . . . . . . . . . . . . . . . 53 18 71
Natural gas (MMcf) . . . . . . . . . . . . . . . . . . . . . . . . . . . . . . . . . . . . 408 1,313 1,721
Average sales prices:Crude oil ($/Bbl) . . . . . . . . . . . . . . . . . . . . . . . . . . . . . . . . . . . . . . $77.85 $82.91 $78.12
NGLs ($/Bbl) . . . . . . . . . . . . . . . . . . . . . . . . . . . . . . . . . . . . . . . . . $33.64 $34.56 $33.87
Natural gas ($/Mcf) . . . . . . . . . . . . . . . . . . . . . . . . . . . . . . . . . . . . $ 5.04 $ 4.17 $ 4.37
Average costs ($/Boe):Production expenses . . . . . . . . . . . . . . . . . . . . . . . . . . . . . . . . . . . . . $13.08 — $13.08
Ad valorem and severance taxes . . . . . . . . . . . . . . . . . . . . . . . . . . . . $ 7.91 — $ 7.91
General and administrative expense . . . . . . . . . . . . . . . . . . . . . . . . . $ 4.86 — $ 4.86
DD&A expense . . . . . . . . . . . . . . . . . . . . . . . . . . . . . . . . . . . . . . . . . $25.73 $22.06 $24.70
(1) Represents volume, price and cost information relating to our non-operated Williston Basin working interestproperties.
(2) Represents information relating to our royalty and overriding royalty interests in oil and gas properties.These interests are recorded net of costs.
For additional information on our production, sales prices and costs, see Note 19 to the audited consolidatedfinancial statements included elsewhere in this Annual Report on Form 10-K.
Drilling and Development Activities
We do not operate any wells or conduct any drilling activities. The following table sets forth informationwith respect to the number of net wells drilled and completed on our properties during the year endedDecember 31, 2014. Well information for the years ended December 31, 2013 and 2012 is not included, as ouroil and natural gas producing activities were not material to our results of operations for those years. Productivewells are those that produce commercial quantities of hydrocarbons, whether or not they produce a reasonablerate of return. Net wells represent the total of our fractional working interests or royalty interests, as applicable,owned in gross wells.
Year Ended December 31, 2014
Productive Dry Total
Gross Net Gross Net Gross Net
Development . . . . . . . . . . . . . . . . . . . . . . . . . . . . . . . . . . . . . . . 123 4.4 0 0 123 4.4
Exploratory . . . . . . . . . . . . . . . . . . . . . . . . . . . . . . . . . . . . . . . . 0 0 0 0 0 0
Total . . . . . . . . . . . . . . . . . . . . . . . . . . . . . . . . . . . . . . . . . . . . 123 4.4 0 0 123 4.4
21

Producing Oil and Natural Gas Wells
The following table sets forth the gross and net producing oil and natural gas wells in which we heldworking interests and royalty or overriding royalty interests as of December 31, 2014. Gross wells represent thenumber of wells in which we own an interest. Net wells represent the total of our fractional working interests orroyalty interests, as applicable, owned in gross wells.
As of December 31, 2014
Working Interest Wells(1) Royalty and Overriding Royalty Interest Wells(2)
Oil Natural Gas Oil Natural Gas
Gross Net Gross Net Gross Net Gross Net
Williston Basin . . . . . . . . . . . . . . . 442 47 0 0 25 0.1 0 0
Other . . . . . . . . . . . . . . . . . . . . . . . 0 0 0 0 100 5.2 987 76
Total . . . . . . . . . . . . . . . . . . . . . 442 47 0 0 125 5.3 987 76
(1) As of December 31, 2014, we also owned non-operated working interests in 40 gross oil wells in variousstages of development in the Williston Basin.
(2) 57 gross (1.4 net) natural gas and oil wells are attributable to our overriding royalty interest in the MarcellusShale acquired in 2012. The remaining wells consist primarily of conventional oil and gas wells or coal bedmethane that are located in the southern portion of the Appalachian Basin.
Undeveloped Acreage Summary
The following table contains a summary of the undeveloped gross and net acres in which we had interests asof December 31, 2014:
Undeveloped Acres as of December 31, 2014
Acres Leased to NRP(1) Net ORRI and Fee Mineral Acres
Gross Net ORRI(2) Fee Mineral(3)
Williston Basin . . . . . . . . . . . . . . . . . . . . . . . . . . . . . . . . 610 384 0 0
Other . . . . . . . . . . . . . . . . . . . . . . . . . . . . . . . . . . . . . . . . 0 0 25,162 30,696
Total . . . . . . . . . . . . . . . . . . . . . . . . . . . . . . . . . . . . 610 384 25,162 30,696
(1) Represents mineral acres leased by third parties to NRP.
(2) Represents net acres in which we have an overriding royalty interest in the Marcellus Shale acquired inDecember 2012. Certain of the leases subject to the overriding royalty interest originally acquired haveexpired but may be renewed. To the extent those leases are renewed, our overriding royalty interest in thoseproperties will continue.
(3) Represents net fee mineral acres owned by NRP and BRP LLC and leased to third parties.
Delivery Commitments
As of December 31, 2014, we had no material delivery commitments.
BRP LLC Joint Venture
BRP LLC is a joint venture between NRP and International Paper Company, in which we own a 51%interest. As of December 31, 2014, BRP owned approximately 10 million mineral acres in 31 states. While thevast majority of the 10 million acres remain largely undeveloped, BRP currently holds 71 mineral leases and 17cell tower leases and has an active program to identify additional opportunities to lease its minerals to operatingparties. For the year ended December 31, 2014, BRP generated $8.0 million in revenue.
22

BRP’s assets include approximately 300,000 gross acres of oil and gas mineral rights in Louisiana, of whichover 54,000 acres were leased as of December 31, 2014. In addition to the leased mineral acreage, BRP holds a1% overriding royalty interest on approximately 28,000 mineral acres in Louisiana. As of December 31, 2014,BRP owned nearly 95,000 net mineral acres of coal rights (primarily lignite and some bituminous coal) in theGulf Coast region, of which approximately 5,800 acres are leased in Louisiana, Alabama and Texas. In addition,BRP also owns copper rights in Michigan’s Upper Peninsula that are subject to a development agreement with acopper development company. BRP also holds various other mineral rights including coalbed methane, metals,aggregates, water and geothermal, in several states throughout the United States.
Significant Customers
In 2014, we had total revenues of $81.5 million from Foresight Energy LP and its affiliated companies and$48.8 million from Alpha Natural Resources. Each of these lessees represented more than 10% of our totalrevenues. The loss of one or both of these lessees could have a material adverse effect on us. In addition, theclosure or loss of revenue from Foresight’s Williamson mine, which accounted for 10% of our revenue in 2014,could have a material adverse effect on us, but we do not believe that the loss of any other single mine on ourproperties would have a material adverse effect on our revenues or distributable cash flow.
Competition
We face competition from land companies, coal producers, international steel companies and private equityfirms in purchasing coal reserves and royalty producing properties. Numerous producers in the coal industrymake coal marketing intensely competitive. Our lessees compete among themselves and with coal producers invarious regions of the United States for domestic sales. Lessees compete with both large and small producersnationwide on the basis of coal price at the mine, coal quality, transportation cost from the mine to the customerand the reliability of supply. Continued demand for our coal and the prices that our lessees obtain are alsoaffected by demand for electricity and steel, as well as government regulations, technological developments andthe availability and the cost of generating power from alternative fuel sources, including nuclear, natural gas andhydroelectric power.
Our trona mining and soda ash refinery business in the Green River Basin, Wyoming, faces competitionfrom a number of soda ash producers in the United States, Europe and Asia, some of which have greater marketshare and greater financial, production and other resources than OCI Wyoming does. Some of OCI Wyoming’scompetitors are diversified global corporations that have many lines of business and some have greater capitalresources and may be in a better position to withstand a long-term deterioration in the soda ash market. Othercompetitors, even if smaller in size, may have greater experience and stronger relationships in their localmarkets. Competitive pressures could make it more difficult for OCI Wyoming to retain its existing customersand attract new customers, and could also intensify the negative impact of factors that decrease demand for sodaash in the markets it serves, such as adverse economic conditions, weather, higher fuel costs and taxes or othergovernmental or regulatory actions that directly or indirectly increase the cost or limit the use of soda ash.
The construction aggregates industry that VantaCore operates in is highly competitive and fragmented witha large number of independent local producers in operating in VantaCore’s local markets. Additionally,VantaCore also competes against large private and public companies, some of which are significantly verticallyintegrated. Therefore, there is intense competition in a number of markets in which VantaCore operates. Thissignificant competition could lead to lower prices and lower sales volumes in some markets, negatively affectingour earnings and cash flows.
The oil and natural gas industry is intensely competitive, and we compete with other companies in thatindustry who have greater resources than we do. These companies may be able to pay more for productive oiland natural gas properties and may be able to expend greater resources to evaluate properties and attract andmaintain industry personnel. In addition, these companies may have a greater ability to make acquisitions intimes of low commodity prices. Our larger competitors may be able to absorb the burden of existing, and anychanges to, federal, state and local laws and regulations more easily than we can, which would adversely affect
23

our competitive position. Our ability to acquire additional properties will be dependent upon our ability toevaluate and select suitable properties and to consummate transactions in a highly competitive environment.
Title to Property
We owned approximately 99% of our coal and aggregates reserves in fee as of December 31, 2014. Welease the remainder from unaffiliated third parties, including leasing aggregates reserves for VantaCore’sconstruction materials business. OCI Wyoming also leases or licenses its trona reserves. As of December 31,2014, we owned certain of our oil and gas reserves in fee and leased our non-operated working interests in theWilliston Basin from third parties. We believe that we have satisfactory title to all of our mineral properties, butwe have not had a qualified title company confirm this belief. Although title to these properties is subject toencumbrances in certain cases, such as customary easements, rights-of-way, interests generally retained inconnection with the acquisition of real property, licenses, prior reservations, leases, liens, restrictions and otherencumbrances, we believe that none of these burdens will materially detract from the value of our properties orfrom our interest in them or will materially interfere with their use in the operations of our business.
For most of our properties, the surface, oil and gas and mineral or coal estates are not owned by the sameentities. Some of those entities are our affiliates. State law and regulations in most of the states where we dobusiness require the oil and gas owner to coordinate the location of wells so as to minimize the impact on theintervening coal seams. We do not anticipate that the existence of the severed estates will materially impededevelopment of the minerals on our properties.
Regulation and Environmental Matters
General
Operations on our properties must be conducted in compliance with all applicable federal, state and locallaws and regulations. These laws and regulations include matters involving the discharge of materials into theenvironment, employee health and safety, mine permits and other licensing requirements, reclamation andrestoration of mining properties after mining is completed, management of materials generated by miningoperations, surface subsidence from underground mining, water pollution, legislatively mandated benefits forcurrent and retired coal miners, air quality standards, protection of wetlands, plant and wildlife protection,limitations on land use, storage of petroleum products and substances which are regarded as hazardous underapplicable laws and management of electrical equipment containing PCBs. Because of extensive, comprehensiveand often ambiguous regulatory requirements, violations during natural resource extraction operations are notunusual and, notwithstanding compliance efforts, we do not believe violations can be eliminated entirely.However, to our knowledge none of the violations to date, nor the monetary penalties assessed, have beenmaterial to our lessees or operations.
While it is not possible to quantify the costs of compliance with all applicable federal, state and local lawsand regulations, those costs have been and are expected to continue to be significant. Our lessees in our coal andaggregates royalty businesses post performance bonds pursuant to federal and state mining laws and regulationsfor the estimated costs of reclamation and mine closures, including the cost of treating mine water dischargewhen necessary. We do not accrue for such costs because our lessees are both contractually liable and liableunder the permits they hold for all costs relating to their mining operations, including the costs of reclamationand mine closures. Although the lessees typically accrue adequate amounts for these costs, their future operatingresults would be adversely affected if they later determined these accruals to be insufficient. In recent years,compliance with these laws and regulations has substantially increased the cost of coal mining for all domesticcoal producers.
In addition, the electric utility industry, which is the most significant end-user of steam coal, is subject toextensive regulation regarding the environmental impact of its power generation activities, which has affected and isexpected to continue to affect demand for coal mined from our properties. Current and future proposed legislationand regulations could be adopted that will have a significant additional impact on the mining operations of ourlessees or their customers’ ability to use coal and may require our lessees or their customers to change operationssignificantly or incur additional substantial costs that would negatively impact the coal industry.
24
Many of the statutes discussed below also apply to exploration and development activities associated withour interests in crude oil and natural gas properties and to the aggregates and industrial mineral miningoperations in which we hold interests, including VantaCore’s construction aggregates mining and productionoperations and OCI Wyoming’s trona mining and soda ash production operations, and therefore we do notpresent a separate discussion of statutes related to those activities, except where appropriate.
Air Emissions
The Clean Air Act and corresponding state and local laws and regulations affect all aspects of our business.The Clean Air Act directly impacts our lessees’ coal mining and processing operations by imposing permittingrequirements and, in some cases, requirements to install certain emissions control equipment, on sources thatemit various hazardous and non-hazardous air pollutants. The Clean Air Act also indirectly affects coal miningoperations by extensively regulating the air emissions of coal-fired electric power generating plants. There havebeen a series of federal rulemakings that are focused on emissions from coal-fired electric generating facilities,including the Cross-State Air Pollution Rule (CSAPR), regulating emissions of nitrogen oxide and sulfur dioxide,and the Mercury and Air Toxics Rule (MATS), regulating emissions of hazardous air pollutants. Installation ofadditional emissions control technologies and other measures required under these and other U.S. EnvironmentalProtection Agency (EPA) regulations, including EPA’s proposed rules to regulate greenhouse gas (GHG)emissions from new and existing fossil fuel-fired power plants, will make it more costly to operate coal-firedpower plants and could make coal a less attractive or even effectively prohibited fuel source in the planning andbuilding of power plants in the future. These rules and regulations have resulted in a reduction in coal’s share ofpower generating capacity, which has negatively impacted our lessees’ ability to sell coal and our coal-relatedrevenues. Further reductions in coal’s share of power generating capacity as a result of compliance with existingor proposed rules and regulations would have a material adverse effect on our coal-related revenues.
The emission of air pollutants from the exploration and development of crude oil and natural gas is alsosubject to the Clean Air Act and comparable state laws. In 2012, EPA published final New Source PerformanceStandards for volatile organic compounds and sulfur dioxide and National Emissions Standards for HazardousAir Pollutants associated with oil and gas facilities. In January 2013, EPA granted petitions asking the agency toreconsider and revise parts of this rule. Accordingly, in September 2013, EPA issued updates to the New SourcePerformance Standards for the emission of volatile organic compounds from storage vessels used in crude oil andnatural gas production. Similarly, in December 2014, EPA finalized rules related to emissions from gas andliquids during well completion. These rules could have an adverse effect on revenues from our interests in oil andnatural gas properties.
Carbon Dioxide and Greenhouse Gas Emissions
In December 2009, EPA determined that emissions of carbon dioxide, methane, and other GHGs, present anendangerment to public health and welfare because emissions of such gases are, according to EPA, contributingto warming of the Earth’s atmosphere and other climatic changes. Based on its findings, EPA has begun adoptingand implementing regulations to restrict emissions of GHGs under various provisions of the Clean Air Act.
In January 2014, EPA published proposed new source performance standards for greenhouse gas emissionsfrom new fossil fuel-fired electric generating units. The effect of the proposed rules would be to require partialcarbon capture and sequestration on any new coal-fired power plants, which may amount to their effectiveprohibition. In June 2014, EPA proposed the Clean Power Plan, which outlined a multi-factor plan to cut carbonemissions from existing electric generating units, including coal-fired power plants. Under this proposed rule,existing power plants would be required to cut their carbon dioxide emissions 30% from 2005 levels by the year2030. The effect of the proposed rules would be to require many existing coal-fired power plants to incursubstantial costs in order to comply or alternatively result in the closure of some of these plants. EPA intends tofinalize these rules in the summer of 2015, both of which have been challenged by industry participants and otherparties. The implementation of these rules as proposed would have a material adverse effect on the demand forcoal by electric power generators.
25

President Obama also announced an emission reduction deal with China’s President Xi Jinping inNovember 2014. The United States pledged that by 2025 it would cut climate pollution by 26 to 28% from 2005levels. China pledged it would reach its peak carbon dioxide emissions around 2030 or earlier, and increase itsnon-fossil fuel share of energy to around 20% by 2030. While there is no way to estimate the impact of thispledge, it could ultimately have an adverse effect on the demand for coal, both nationally and internationally.
EPA has also adopted rules requiring the reporting of GHG emissions from specified large GHG emissionsources in the United States, including coal-fired electric power plants, on an annual basis, as well as certain oiland natural gas production facilities, on an annual basis.
On January 14, 2015, EPA announced plans to propose new regulations to reduce emissions of methanefrom crude oil and natural gas production and transportation activities such as wells, pipelines, and valves levelsby up to 45 percent by 2025 (compared to 2012 levels). EPA expects to propose the new regulations in thesummer of 2015 and a final rule is expected in 2016.
Hazardous Materials and Waste
The Federal Comprehensive Environmental Response, Compensation and Liability Act (CERCLA or theSuperfund law) and analogous state laws impose liability, without regard to fault or the legality of the originalconduct, on certain classes of persons that are considered to have contributed to the release of a “hazardoussubstance” into the environment. We could become liable under federal and state Superfund and wastemanagement statutes if our lessees are unable to pay environmental cleanup costs relating to hazardoussubstances. In addition, we may have liability for environmental clean-up costs in connection with our VantaCoreconstruction aggregates and OCI Wyoming soda ash businesses and in connection with our non-operatedworking interests in oil and gas properties, to the extent of our proportionate interest therein.
Water Discharges
Operations conducted on our properties can result in discharges of pollutants into waters. The Clean WaterAct and analogous state laws and regulations create two permitting programs for mining operations. The NationalPollutant Discharge Elimination System (NPDES) program under Section 402 of the statute is administered bythe states or EPA and regulates the concentrations of pollutants in discharges of waste and storm water from amine site. The Section 404 program is administered by the Army Corps of Engineers and regulates the placementof overburden and fill material into channels, streams and wetlands that comprise “waters of the United States.”The scope of waters that may fall within the jurisdictional reach of the Clean Water Act is expansive and mayinclude land features not commonly understood to be a stream or wetlands. The Clean Water Act and itsregulations prohibit the unpermitted discharge of pollutants into such waters, including those from a spill or leak.Similarly, Section 404 also prohibits discharges of fill material and certain other activities in waters unlessauthorized by the issued permit.
In connection with EPA’s review of permits, it has sought to reduce the size of fills and to impose limits onspecific conductance (conductivity) and sulfate at levels that can be unachievable absent treatment at manymines. Such actions by EPA could make it more difficult or expensive to obtain or comply with such permits,which could, in turn, have an adverse effect on our coal-related revenues.
In addition to government action, private citizens’ groups have continued to be active in bringing lawsuitsagainst operators and landowners. Since 2012, several citizen suit group lawsuits have been filed against mineoperators for allegedly violating conditions in their NPDES permits requiring compliance with West Virginia’swater quality standards. Some of the lawsuits allege violations of water quality standards for selenium, whereasothers allege that discharges of conductivity and sulfate are causing violations of West Virginia’s narrative waterquality standards, which generally prohibit adverse effects to aquatic life. The citizen suit groups have soughtpenalties as well as injunctive relief that would limit future discharges of selenium, conductivity or sulfate. Thefederal district court for the Southern District of West Virginia has ruled in favor of the citizen suit groups inmultiple suits alleging violations of the water quality standard for selenium and in two suits alleging violations ofwater quality standards due to discharges of conductivity. Most of these cases were resolved prior to any appeal
26

and it is difficult to predict whether such suits will continue to be successful. However, additional rulingsrequiring operators to reduce their discharges of selenium, conductivity or sulfate could result in large treatmentexpenses for our lessees.
Since 2013, several citizen group lawsuits have been filed against landowners alleging ongoing dischargesof pollutants, including selenium and conductivity, from valley fills located at reclaimed mountaintop removalmining sites in West Virginia. NRP has been named as a defendant in one of these lawsuits. In each case, themine on the subject property has been closed, the property has been reclaimed, and the state reclamation bondhas been released. While it is too early to determine the merits or predict the outcome of any of these lawsuits,any determination that a landowner or lessee has liability for discharges from a previously reclaimed mine sitecould result in substantial compliance costs or fines and would result in uncertainty as to continuing liability forcompleted and reclaimed coal mine operations.
Drilling and development activities associated with our oil and natural gas business generate producedwater. Produced water is often disposed of in underground injection control (“UIC”) wells that receive permitsfrom EPA or from state agencies that have been granted authority to issue UIC issue permits by EPA. Failures ordelays in getting such permits could negatively impact exploration and production activities and, in turn,adversely affect our oil and natural gas business.
Other Regulations Affecting the Mining Industry
Mine Health and Safety Laws
The operations of our lessees, VantaCore and OCI Wyoming are subject to stringent health and safetystandards that have been imposed by federal legislation since the adoption of the Mine Health and Safety Act of1969. The Mine Health and Safety Act of 1969 resulted in increased operating costs and reduced productivity.The Mine Safety and Health Act of 1977, which significantly expanded the enforcement of health and safetystandards of the Mine Health and Safety Act of 1969, imposes comprehensive health and safety standards on allmining operations. In addition, the Black Lung Acts require payments of benefits by all businesses conductingcurrent mining operations to coal miners with black lung or pneumoconiosis and to some beneficiaries of minerswho have died from this disease.
Mining accidents in recent years have received national attention and instigated responses at the state andnational level that have resulted in increased scrutiny of current safety practices and procedures at all miningoperations, particularly underground mining operations. Since 2006, heightened scrutiny has been applied to thesafe operations of both underground and surface mines. This increased level of review has resulted in an increasein the civil penalties that mine operators have been assessed for non-compliance. Operating companies and theirsupervisory employees have also been subject to criminal convictions. The Mine Safety and HealthAdministration (MSHA) has also advised mine operators that it will be more aggressive in placing mines in thePattern of Violations program, if a mine’s rate of injuries or significant and substantial citations exceed a certainthreshold. A mine that is placed in a Pattern of Violations program will receive additional scrutiny from MSHA.
Surface Mining Control and Reclamation Act of 1977
The Surface Mining Control and Reclamation Act of 1977 (SMCRA) and similar statutes enacted andenforced by the states impose on mine operators the responsibility of reclaiming the land and compensating thelandowner for types of damages occurring as a result of mining operations. To ensure compliance with anyreclamation obligations, mine operators are required to post performance bonds. Our coal lessees arecontractually obligated under the terms of our leases to comply with all federal, state and local laws, includingSMCRA. Upon completion of the mining, reclamation generally is completed by seeding with grasses or plantingtrees for use as pasture or timberland, as specified in the reclamation plan approved by the state regulatoryauthority. In addition, higher and better uses of the reclaimed property are encouraged. Regulatory authorities orindividual citizens who bring civil actions under SMCRA may attempt to assign the liabilities of our coal lesseesto us if any of these lessees are not financially capable of fulfilling those obligations.
27

Mining Permits and Approvals
Numerous governmental permits or approvals such as those required by SMCRA and the Clean Water Actare required for mining operations. In connection with obtaining these permits and approvals, our lessees may berequired to prepare and present to federal, state or local authorities data pertaining to the effect or impact that anyproposed production of coal may have upon the environment. The requirements imposed by any of theseauthorities may be costly and time consuming and may delay commencement or continuation of miningoperations.
In order to obtain mining permits and approvals from state regulatory authorities, mine operators, includingour lessees, must submit a reclamation plan for reclaiming the mined property upon the completion of miningoperations. Our lessees have obtained or applied for permits to mine a majority of the reserves that are currentlyplanned to be mined over the next five years. Our lessees are also in the planning phase for obtaining permits forthe additional reserves planned to be mined over the following five years. However, given the imposition of newrequirements in the permits in the form of policies and the increased oversight review that has been exercised byEPA, there are no assurances that they will not experience difficulty and delays in obtaining mining permits inthe future. In addition, EPA has used its authority to create significant delays in the issuance of new permits andthe modification of existing permits, which has led to substantial delays and increased costs for coal operators.
Regulations under SMCRA include a “stream buffer zone” rule that prohibits certain mining activities nearstreams. In 2008, the federal Office of Surface Mining (OSM), which implements SMCRA, revised the streambuffer zone rule, making it more clear that valley fills are not prohibited by the rule. Environmental groupschallenged the revision to the buffer zone rule in federal court. In February 2014, the federal court vacated the2008 rule and in December 2014, OSM reinstated the previous version of the rule, without clarifying whether theprevious version of the rule impacts the ability to construct excess fills. OSM has stated that it is consideringfuture revisions to the buffer zone rule. Any revision or interpretation of the rule limiting or prohibiting valleyfills could restrict our lessees’ ability to develop new mines, or could require our lessees to modify existingoperations, which could have an adverse effect on our coal-related revenues.
In April 2013, in Mingo Logan Coal Company v. EPA, the D.C. Circuit Court ruled that EPA has theauthority under the Clean Water Act to retroactively veto a Section 404 dredge and fill permit issued at a coalmine by the U.S. Army Corps of Engineers. The decision creates uncertainties for all companies operating withClean Water Act fill permits and their business partners. While the specific facts of this case relate to ongoing fillactivities, the broadly written language of the decision could have sweeping implications in other areas and resultin increased regulatory activity by EPA that is adverse to the mining industry.
Other Regulations Affecting the Crude Oil and Natural Gas Industry
Hydraulic Fracturing
The exploration and production companies that operate the crude oil and natural gas properties in which wehave interests use hydraulic fracturing to recover oil and natural gas from tight rock formations. Hydraulicfracturing is a process customary to the oil and gas industry in which water, sand and other additives are pumpedunder high pressure into tight rock formations in a manner that creates or expands fractures in the rock tofacilitate oil and gas recovery. While hydraulic fracturing has been used to recover oil and natural gas fordecades, the practice has recently received increased scrutiny from various federal, state and local agencies, someof which have prohibited the practice or called for further study of its effects. Future requirements that limit ormore strictly regulate the permitting or use of hydraulic fracturing could impact revenues from our oil and naturalgas properties.
Permitting
Additionally, state agencies are generally charged with issuing permits governing the location andconstruction of drilling sites. Delays or failures to obtain such permits due to local land use or environmentalconcerns could negatively impact revenues from our oil and gas operations.
28

Transportation
Our revenues could be negatively impacted if the Federal Energy Regulatory Commission, which approvesinterstate pipelines and certain gathering lines, fails to timely approve pipelines that transport oil or natural gasproduced from the properties in which we own interests. Additionally, our oil and natural gas revenues could benegatively impacted by rules proposed in July 2014 by the United States Department of Transportation governingthe transportation of crude oil by rail. As proposed, the rules would require thousands of railroad tank cars to beupgraded or phased out by 2017. Railroad tank car shortages resulting from the proposed rule could delay orincrease the costs of transportation of crude oil from our Williston Basin non-operated working interests andnegatively impact revenues from those properties.
Employees and Labor Relations
We historically have not had any employees. To carry out our operations, affiliates of our general partneremploy 89 people who directly support our operations. None of these employees are subject to a collectivebargaining agreement. As a result of our acquisition of VantaCore in the fourth quarter of 2014, we now employ269 people who support VantaCore’s construction aggregates mining and production operations. None of theseemployees are subject to a collective bargaining agreement.
Segment Information
We conduct all of our operations in a single segment – the ownership and leasing of natural resources andrelated transportation and processing infrastructure. Substantially all of our owned properties are subject toleases, and revenues are earned based on the volume and price of minerals extracted, processed ortransported. Included in revenues and other income from these natural resource properties are royalties from coal,aggregates, oil and gas, timber, related transportation and processing infrastructure revenues, as well as otherincome from our equity investment in OCI Wyoming’s trona mine and soda ash refinery operations, andrevenues from the VantaCore aggregates mining and production operation purchased during 2014.
Website Access to Company Reports
Our internet address is www.nrplp.com. We make available free of charge on or through our internet websiteour Annual Report on Form 10-K, Quarterly Reports on Form 10-Q, Current Reports on Form 8-K andamendments to those reports filed or furnished pursuant to Section 13(a) or 15(d) of the Securities Exchange Actof 1934 as soon as reasonably practicable after we electronically file such material with, or furnish it to, theSecurities and Exchange Commission. Also included on our website are our Code of Business Conduct andEthics, our Disclosure Controls and Procedures Policy and our Corporate Governance Guidelines adopted by ourBoard of Directors, as well as the charters for our Audit Committee, Conflicts Committee and Compensation,Nominating and Governance Committee. Also, copies of our annual report, our Code of Business Conduct andEthics, our Disclosure Controls and Procedures Policy, our Corporate Governance Guidelines and our committeecharters will be made available upon written request.
Item 1A. Risk Factors
Risks Related to Our Business
Cash distributions are not guaranteed and may fluctuate with our performance and the establishment offinancial reserves.
Because distributions on the common units are dependent on the amount of cash we generate, distributionsmay fluctuate based on our performance. The actual amount of cash that is available to be distributed eachquarter depends on numerous factors, some of which are beyond our control and the control of the generalpartner. The actual amount of cash we have to distribute each quarter is reduced by payments in respect of debtservice and other contractual obligations, fixed charges, maintenance capital expenditures and reserves for futureoperating or capital needs that the board of directors may determine are appropriate. Cash distributions aredependent primarily on cash flow, and not solely on profitability, which is affected by non-cash items. Therefore,
29

cash distributions might be made during periods when we record losses and might not be made during periodswhen we record profits. To the extent our board of directors deems appropriate, it may determine to decrease theamount of the quarterly distribution.
Our leverage and debt service obligations may adversely affect our financial condition, results of operationsand business prospects.
As of December 31, 2014, we and our subsidiaries had approximately $1.5 billion of total indebtedness. Theterms and conditions governing our indebtedness, including NRP’s 9.125% senior notes, Opco’s revolving creditfacility, term loan and senior notes, and NRP Oil and Gas’s revolving credit facility:
• require us to meet certain leverage and interest coverage ratios;
• require us to dedicate a substantial portion of our cash flow from operations to service our existing debt,thereby reducing the cash available to finance our operations and other business activities and could limitour flexibility in planning for or reacting to changes in our business and the industries in which weoperate;
• increase our vulnerability to economic downturns and adverse developments in our business;
• limit our ability to access the bank and capital markets to raise capital on favorable terms or to obtainadditional financing for working capital, capital expenditures or acquisitions or to refinance existingindebtedness;
• place restrictions on our ability to obtain additional financing, make investments, lease equipment, sellassets and engage in business combinations;
• place us at a competitive disadvantage relative to competitors with lower levels of indebtedness in relationto their overall size or less restrictive terms governing their indebtedness;
• make it more difficult for us to satisfy our obligations under our debt agreements and increase the risk thatwe may default on our debt obligations; and
• limit management’s discretion in operating our business.
Our ability to meet our expenses and debt obligations will depend on our future performance, which will beaffected by financial, business, economic, regulatory and other factors. We will not be able to control many ofthese factors, such as economic conditions and governmental regulation. We cannot be certain that our cash flowwill be sufficient to allow us to pay the principal and interest on our debt and meet our other obligations. If we donot have sufficient funds, we may be required to refinance all or part of our existing debt, borrow more money,sell assets or raise equity, and our ability to pursue acquisitions may be limited. We are required to makesubstantial principal repayments each year in connection with Opco’s senior notes, with approximately $81million due thereunder each year through 2018. In addition, Opco’s revolving credit facility and term loan bothmature in 2016. We will be required to repay or refinance the amounts outstanding under these credit facilitiesprior to their maturity. We may not be able to refinance these amounts on terms acceptable to us, if at all, or theborrowing capacity under Opco’s revolving credit facility may be substantially reduced.
The borrowing base under NRP Oil and Gas’s revolving credit facility is based on the value of our provedreserves and is redetermined on a semi-annual basis in May and October of each year. The current oil priceenvironment or future declines in prices or reduced production from or development of our properties couldresult in a determination to lower the borrowing base. In such event, we may not be able to access funding underthe facility necessary to operate our business or we could be required to repay any indebtedness in excess of theredetermined borrowing base.
We may not be able to refinance our debt, sell assets, borrow more money or access the bank and capitalmarkets on terms acceptable to us, if at all. Our ability to access the capital markets may be challenging in thecurrent commodity price environment. Our ability to comply with the financial and other restrictive covenants in
30

our debt agreements will be affected by the levels of cash flow from our operations and future events andcircumstances beyond our control. Failure to comply with these covenants would result in an event of defaultunder our indebtedness, and such an event of default could adversely affect our business, financial condition andresults of operations.
Coal prices continue to be severely depressed, which has negatively affected our coal-related revenues andthe value of our coal reserves. Further declines or a continued low price environment could have anadditional adverse effect on our coal-related revenues and the value of our coal reserves.
Prices for both steam and metallurgical coal have declined substantially in recent years and remain at levelsclose to or below the level of operating costs for a number of our lessees. The prices our lessees receive for theircoal depend upon factors beyond their or our control, including:
• the supply of and demand for domestic and foreign coal;
• domestic and foreign governmental regulations and taxes;
• changes in fuel consumption patterns of electric power generators;
• the price and availability of alternative fuels, especially natural gas;
• global economic conditions, including the strength of the U.S. dollar relative to other currencies and thedemand for steel;
• the proximity to and capacity of transportation facilities;
• weather conditions; and
• the effect of worldwide energy conservation measures.
Natural gas is the primary fuel that competes with steam coal for power generation. Relatively low naturalgas prices have resulted in a number of utilities switching from steam coal to natural gas to the extent that it ispractical to do so. This switching has resulted in a decline in steam coal prices, and to the extent that natural gasprices remain low, steam coal prices will also remain low. The closure of coal-fired power plants as a result ofincreased governmental regulations or the inability to comply with such regulations has also resulted in adecrease in the demand for steam coal.
Prices for metallurgical coal are also at multi-year lows due to global economic conditions. Our lesseesproduce a significant amount of the metallurgical coal that is used in both the U.S. and foreign steel industries.Since the amount of steel that is produced is tied to global economic conditions, a continuation of currentconditions or a further decline in those conditions could result in the decline of steel, coke and metallurgical coalproduction. In addition, rising exports of metallurgical coal from Australia and a strong U.S. dollar continue tohave a negative effect on prices received for metallurgical coal produced in the United States. Since metallurgicalcoal is priced higher than steam coal, some mines on our properties may only operate profitably if all or a portionof their production is sold as metallurgical coal. If these mines are unable to sell metallurgical coal, they may notbe economically viable and may be temporarily idled or closed.
Lower prices have reduced the quantity of coal that may be economically produced from our properties,which has in turn reduced our coal-related revenues and the value of our coal reserves. Further declines or acontinued low price environment could have an additional adverse effect on our coal-related revenues or thevalue of our reserves. A long term asset generally is deemed impaired when the future expected cash flow fromits use and disposition is less than its book value. For the year ended December 31, 2014, we took an impairmentcharge of $17.6 million relating to certain of our coal related properties. With the continued weakness in the coalmarkets, we intend to closely monitor our coal assets impairment risk. Future impairment analyses could result indownward adjustments to the carrying value of our assets.
31

Changes in fuel consumption patterns by electric power generators resulting in a decrease in the use of coalhave resulted in and will continue to result in lower coal production by our lessees and reduced coal-relatedrevenues.
The amount of coal consumed for domestic electric power generation is affected primarily by the overalldemand for electricity, the price and availability of competing fuels for power plants and environmental andother governmental regulations. We expect that substantially all newly constructed power plants in the UnitedStates will be fired by natural gas because of lower construction and compliance costs compared to coal-firedplants and because natural gas is a cleaner burning fuel. The increasingly stringent requirements of rules andregulations promulgated under the federal Clean Air Act have resulted in more electric power generators shiftingfrom coal to natural-gas-fired power plants, or to other alternative energy sources such as solar and wind. Inaddition, the proposed rules promulgated by the EPA on greenhouse gas emissions from new and existing powerplants are expected to further limit the construction of new coal-fired generation plants in favor of alternativesources of energy and negatively affect the viability of coal-fired power generation. These changes have resultedin reduced coal consumption and the production of coal from our properties and are expected to continue to havean adverse effect on our coal-related revenues.
The adoption of climate change legislation or regulations restricting emissions of “greenhouse gases” andother hazardous air pollutants could result in reduced demand for our coal, oil and natural gas.
In December 2009, EPA determined that emissions of carbon dioxide, methane, and other GHGs, present anendangerment to public health and welfare because emissions of such gases are, according to EPA, contributingto warming of the Earth’s atmosphere and other climatic changes. Based on its findings, EPA has begun adoptingand implementing regulations to restrict emissions of GHGs under various provisions of the Clean Air Act.
In January 2014, EPA published proposed new source performance standards for GHG emissions from newfossil fuel-fired electric generating units. The effect of the proposed rules would be to require partial carboncapture and sequestration on any new coal-fired power plants, which may amount to their effective prohibition.In June 2014, EPA proposed the Clean Power Plan, which outlined a multi-factor plan to cut carbon emissionsfrom existing electric generating units, including coal-fired power plants. Under this proposed rule, existingpower plants would be required to cut their carbon dioxide emissions 30% from 2005 levels by the year 2030.The effect of the proposed rules would be to require many existing coal-fired power plants to incur substantialcosts in order to comply or alternatively result in the closure of some of these plants. EPA intends to finalizethese rules in the summer of 2015, both of which have been challenged by industry participants and other parties.The implementation of these rules as proposed would have a material adverse effect on the demand for coal byelectric power generators and as a result on our coal related-revenues.
In addition to EPA’s GHG initiatives, there are several other federal rulemakings that are focused onemissions from coal-fired electric generating facilities, including the Cross-State Air Pollution Rule (CSAPR),regulating emissions of nitrogen oxide and sulfur dioxide, and the Mercury and Air Toxics Rule (MATS),regulating emissions of hazardous air pollutants. Installation of additional emissions control technologies andother measures required under these and other EPA regulations have made it more costly to operate many coal-fired power plants and have resulted in and are expected to continue to result in plant closures. Further reductionsin coal’s share of power generating capacity as a result of compliance with existing or proposed rules andregulations would have a material adverse effect on our coal-related revenues.
The emission of air pollutants from the exploration and development of crude oil and natural gas and relatedfacilities is also subject to the Clean Air Act and comparable state laws. In 2012, EPA published final NewSource Performance Standards for volatile organic compounds and sulfur dioxide and National EmissionsStandards for Hazardous Air Pollutants associated with oil and gas facilities. In January 2013, EPA grantedpetitions asking the agency to reconsider and revise parts of this rule. Accordingly, in September 2013, EPAissued updates to the New Source Performance Standards for the emission of volatile organic compounds fromstorage vessels used in crude oil and natural gas production. Similarly, in December 2014, EPA finalized rulesrelated to emissions from gas and liquids during well completion. These rules could have an adverse effect onrevenues from our interests in oil and natural gas properties.
32
In January 2015, EPA announced plans to propose new regulations to reduce emissions of methane fromcrude oil and natural gas production and transportation activities such as wells, pipelines, and valves levels by upto 45 percent by 2025 (compared to 2012 levels). EPA expects to propose the new regulations in the summer of2015 and a final rule is expected in 2016. Any such rules could have a material adverse effect on our oil andnatural gas revenues.
Mining operations are subject to operating risks that could result in lower revenues to us. In addition, weare subject to operating risks as a result of the VantaCore acquisition that we have not previouslyexperienced.
Our revenues are largely dependent on the level of production of minerals from our properties, and anyinterruptions to the production from our properties would reduce our revenues. The level of production is subjectto operating conditions or events beyond our or our lessees’ control including:
• the inability to acquire necessary permits or mining or surface rights;
• changes or variations in geologic conditions, such as the thickness of the mineral deposits and, in the caseof coal, the amount of rock embedded in or overlying the coal deposit;
• mining and processing equipment failures and unexpected maintenance problems;
• the availability of equipment or parts and increased costs related thereto;
• the availability of transportation facilities and interruptions due to transportation delays;
• adverse weather and natural disasters, such as heavy rains and flooding;
• labor-related interruptions; and
• unexpected mine safety accidents, including fires and explosions.
As a result of recent judicial decisions and the increased involvement of the Obama Administration andEPA in the permitting process, there is substantial uncertainty relating to the ability of our coal lessees to beissued permits necessary to conduct mining operations. The non-issuance of permits has limited the ability of ourcoal lessees to open new operations, expand existing operations, and may preclude new acquisitions in which wemight otherwise be involved. We and our lessees may also incur costs and liabilities resulting from claims fordamages to property or injury to persons arising from our or their operations. If we or our lessees are pursued forthese sanctions, costs and liabilities, mining operations and, as a result, our revenues could be adversely affected.
Prior to the VantaCore acquisition, we did not operate aggregates mining and production assets. VantaCorecurrently operates three hard rock quarries, five sand and gravel plants, two asphalt plants and a marine terminal. Asan operator of these assets, we will be exposed to risks that we have not historically been exposed to in our mineralrights and royalties business. Such risks include, but are not limited to, prices and demand for constructionaggregates, capital and operating expenses necessary to maintain VantaCore’s operations, production levels, generaleconomic conditions, conditions in the local markets that VantaCore serves, inclement or hazardous weatherconditions and typically lower production levels in the winter months, permitting risk, fire, explosions or otheraccidents, and unanticipated geologic conditions. Any of these risks could result in damage to, or destruction of,VantaCore’s mining properties or production facilities, personal injury, environmental damage, delays in mining orprocessing, reduced revenue or losses or possible legal liability. In addition, not all of these risks are reasonablyinsurable, and our insurance coverage contains limits, deductibles, exclusions and endorsements. Our insurancecoverage may not be sufficient to meet our needs in the event of loss. Any prolonged downtime or shutdowns atVantaCore’s mining properties or production facilities or material loss could have an adverse effect on our results ofoperations and prevent us from realizing all of the anticipated benefits of the acquisition.
Prices for crude oil and natural gas are extremely volatile. An extended decline or further declines in crudeoil and natural gas prices could have an adverse effect on our results of operations
Crude oil and natural gas prices are subject to wide fluctuations in response to relatively minor changes insupply and demand and on numerous other factors beyond our control, including:
• domestic and foreign supply of oil and natural gas;
33

• the level of prices and expectations about future prices of oil and natural gas;
• the level of global oil and natural gas exploration and production;
• the cost of exploring for, developing, producing and delivering oil and natural gas;
• the price and quantity of foreign imports;
• political and economic conditions in oil producing countries, including the Middle East, Africa, SouthAmerica and Russia;
• the actions of the Organization of Petroleum Exporting Countries with respect to oil price and productioncontrols;
• speculative trading in crude oil and natural gas derivative contracts;
• the level of consumer product demand;
• weather conditions and other natural disasters;
• risks associated with drilling and completion operations;
• technological advances affecting energy consumption;
• domestic and foreign governmental regulations and taxes;
• the continued threat of terrorism and the impact of military and other action, including U.S. militaryoperations in the Middle East;
• the proximity, cost, availability and capacity of oil and natural gas pipelines and other transportationfacilities and the resulting differentials to market index prices;
• the price and availability of alternative fuels; and
• overall domestic and global economic conditions, including the relative value of the U.S. dollar to othercurrencies.
Due to global oversupply of crude oil in part due to increasing U.S. production and a strong U.S. dollar,crude oil prices have fallen significantly since the first half of 2014 to their lowest levels since 2008. In addition,natural gas prices have also fallen to low levels due to record high levels of production and robust storageinventories. These markets will likely continue to be volatile in the future, and any extended period of low pricescould have a material adverse effect on our results of operations from our oil and gas business.
In addition to climate change and other Clean Air Act legislation, our businesses are subject to numerousother federal, state and local laws and regulations that may limit production from our properties and ourprofitability.
The operations of our lessees, VantaCore and OCI Wyoming are subject to stringent health and safetystandards under increasingly strict federal, state and local environmental, health and safety laws, including minesafety regulations and governmental enforcement policies. The oil and gas industry is also subject to numerouslaws and regulations. Failure to comply with these laws and regulations may result in the assessment ofadministrative, civil and criminal penalties, the imposition of cleanup and site restoration costs and liens, theissuance of injunctions to limit or cease operations, the suspension or revocation of permits and otherenforcement measures that could have the effect of limiting production from our properties.
New environmental legislation, new regulations and new interpretations of existing environmental laws,including regulations governing permitting requirements, could further regulate or tax the mining and oil andgas industries and may also require significant changes to operations, the incurrence of increased costs or therequirement to obtain new or different permits, any of which could decrease our revenues and have a materialadverse effect on our financial condition or results of operations.
34

In addition to governmental regulation, private citizens’ groups have continued to be active in bringinglawsuits against coal mine operators and landowners. Since 2012, several citizen suit group lawsuits have beenfiled against mine operators and landowners for alleged violations of water quality standards resulting fromongoing discharges of pollutants from reclaimed mining operations, including selenium and conductivity. NRPhas been named as a defendant in one of these lawsuits. The citizen suit groups have sought penalties as well asinjunctive relief that would limit future discharges of these pollutants, which would result in significant expensesfor our lessees. While it is too early to determine the merits or measure the impact of these lawsuits, anydetermination that a landowner or lessee has liability for discharges from a previously reclaimed mine site wouldresult in uncertainty as to continuing liability for completed and reclaimed coal mine operations and could resultin substantial compliance costs or fines.
Our reserve estimates depend on many assumptions that may be inaccurate, which could materiallyadversely affect the quantities and value of our reserves.
Coal, aggregates and industrial minerals, and oil and natural gas reserve engineering requires subjectiveestimates of underground accumulations of coal, aggregates and industrial minerals, and oil and natural gas andassumptions and are by nature imprecise. Our reserve estimates may vary substantially from the actual amountsof coal, aggregates and industrial minerals, or oil and natural gas recovered from our reserves. There arenumerous uncertainties inherent in estimating quantities of reserves, including many factors beyond our control.Estimates of reserves necessarily depend upon a number of variables and assumptions, any one of which may, ifincorrect, result in an estimate that varies considerably from actual results. These factors and assumptions relateto:
• future prices, operating costs, capital expenditures, severance and excise taxes, and development andreclamation costs;
• production levels;
• future technology improvements;
• the effects of regulation by governmental agencies; and
• geologic and mining conditions, which may not be fully identified by available exploration data.
Actual production, revenue and expenditures with respect to our reserves will likely vary from estimates,and these variations may be material. As a result, you should not place undue reliance on our reserve data that isincluded in this report.
As a result of consolidation in the coal industry and our partnership with Foresight Energy, we derive alarge percentage of our revenues and other income from a small number of coal lessees.
In 2014, we derived 20% and 12% of our total revenues and other income from Foresight Energy LP andAlpha Natural Resources, respectively. Foresight’s Williamson mine alone was responsible for approximately10% of our total revenues and other income in 2014. As a result, we have significant concentration of revenueswith these lessees. If our lessees merge or otherwise consolidate, or if we acquire additional reserves fromexisting lessees, then our revenues could become more dependent on fewer mining companies. If issues occur atthose companies that impact their ability to pay us royalties, our revenues and ability to make future distributionswould be adversely affected.
Prices for soda ash are volatile. Any substantial or extended decline in soda ash prices could have anadverse effect on our results of operations.
The market price of soda ash directly affects the profitability of OCI Wyoming’s soda ash productionoperations. If the market price for soda ash declines, OCI Wyoming’s sales will decrease. Historically, the globalmarket and, to a lesser extent, the domestic market for soda ash have been volatile, and those markets are likelyto remain volatile in the future. The prices OCI Wyoming receives for its soda ash depend on numerous factorsbeyond OCI Wyoming’s control, including worldwide and regional economic and political conditions impacting
35

supply and demand. Glass manufacturers and other industrial customers drive most of the demand for soda ash,and these customers experience significant fluctuations in demand and production costs. Substantial or extendeddeclines in prices for soda ash could have a material adverse effect on our results of operations. In addition, OCIWyoming relies on natural gas as the main energy source in its soda ash production process. Accordingly, highnatural gas prices increase OCI Wyoming’s cost of production and affect its competitive cost position whencompared to other foreign and domestic soda ash producers.
VantaCore operates in a highly competitive and fragmented industry, which may negatively impact prices,volumes and costs. In addition, both commercial and residential construction are dependent upon theoverall U.S. economy, which is recovering at a slow pace.
The construction aggregates industry is highly fragmented with a large number of independent localproducers in operating in VantaCore’s local markets. Additionally, VantaCore also competes against largeprivate and public companies, some of which are significantly vertically integrated. Therefore, there is intensecompetition in a number of markets in which VantaCore operates. This significant competition could lead tolower prices and lower sales volumes in some markets, negatively affecting our earnings and cash flows.
In addition, commercial and residential construction levels generally move with economic cycles. When theeconomy is strong, construction levels rise and when the economy is weak, construction levels fall. The U.S.economy is recovering from the 2008-2009 recession, but the pace of recovery is slow. Since constructionactivity generally lags the recovery after down cycles, construction projects have not returned to their pre-recession levels.
We may incur unanticipated costs or delays in connection with the integration of VantaCore and futureaggregates operations into our company.
There are risks with respect to the integration of VantaCore into our company that may result inunanticipated costs or delays to us. Such risks include:
• integrating additional personnel into our company, including the 269 people employed by VantaCore;
• establishing the internal controls and procedures for the acquired businesses that we are required tomaintain under the Sarbanes-Oxley Act of 2002;
• consolidating other corporate and administrative functions;
• diversion of management’s attention away from our other business concerns;
• loss of key employees; and
• the assumption of any undisclosed or other potential liabilities of the acquired company.
Similar risks may apply to the integration of future aggregates operations that we may acquire through theVantaCore platform. Any significant costs and delays resulting from the risks described above could cause us notto realize the anticipated benefits of these acquisitions.
We may be subject to risks in connection with oil and gas asset acquisitions.
The acquisition of oil and gas properties requires an assessment of several factors, including:
• recoverable reserves;
• the pace of development and drilling and completion activities by operators;
• future crude oil and natural gas prices and their differentials;
• the availability of and access to takeaway and transportation;
• future development costs, operating costs and property taxes;
• governmental regulations; and
• potential environmental and other liabilities.
36

The accuracy of these assessments is inherently uncertain. In connection with these assessments, weperform a review of the subject properties we believe to be generally consistent with industry practices. Ourreview will not reveal all existing or potential problems nor will it permit us to become sufficiently familiar withthe properties to fully assess their deficiencies and capabilities prior to acquisition. Inspections may not alwaysbe performed on every well, and environmental problems are not necessarily observable even when an inspectionis undertaken. Even when problems are identified, the seller of the subject properties may be unwilling or unableto provide effective contractual protection against all or part of the problems. We often are not entitled tocontractual indemnification for environmental and other liabilities and acquire properties on an “as is” basis.
Our business will be adversely affected if we are unable to make acquisitions or access the bank and capitalmarkets to finance our growth.
Because our reserves decline due to production, our future success and growth depend, in part, upon ourability to make acquisitions to replace reserves that are depleted. If we are unable to make acquisitions onacceptable terms, our revenues will decline as our reserves are depleted. Our ability to acquire additional interestsin mineral reserves or make other acquisitions is dependent in part on our ability to access the bank and capitalmarkets. We cannot be certain that funding will be available if needed and to the extent required, on acceptableterms. If funding is not available when needed, or is available only on unfavorable terms, we may be unable tocomplete acquisitions or otherwise take advantage of business opportunities or respond to competitive pressures,any of which could have a material adverse effect on our revenues, results of operations and quarterlydistributions. In addition, if we are unable to successfully integrate the companies, businesses or properties weare able to acquire, our revenues may decline and we could experience a material adverse effect on our business,financial condition or results of operations.
There is a possibility that any acquisition could be dilutive to our earnings and reduce our ability to makedistributions to unitholders. Any debt we incur to finance an acquisition may also reduce our ability to makedistributions to unitholders. Our ability to make acquisitions in the future also could be limited by restrictionsunder our existing or future debt agreements, competition from other mineral companies for attractive propertiesor the lack of suitable acquisition candidates.
If our lessees do not manage their operations well, their production volumes and our royalty revenues coulddecrease.
We depend on our lessees to effectively manage their operations on our properties. Our lessees make theirown business decisions with respect to their operations within the constraints of their leases, including decisionsrelating to:
• the payment of minimum royalties;
• marketing of the minerals mined;
• mine plans, including the amount to be mined and the method of mining;
• processing and blending minerals;
• expansion plans and capital expenditures;
• credit risk of their customers;
• permitting;
• insurance and surety bonding;
• acquisition of surface rights and other mineral estates;
• employee wages;
• transportation arrangements;
• compliance with applicable laws, including environmental laws; and
37

• mine closure and reclamation.
A failure on the part of one of our lessees to make royalty payments, including minimum royalty payments,could give us the right to terminate the lease, repossess the property and enforce payment obligations under thelease. If we repossessed any of our properties, we would seek a replacement lessee. We might not be able to finda replacement lessee and, if we did, we might not be able to enter into a new lease on favorable terms within areasonable period of time. In addition, the existing lessee could be subject to bankruptcy proceedings that couldfurther delay the execution of a new lease or the assignment of the existing lease to another operator. If we enterinto a new lease, the replacement operator might not achieve the same levels of production or sell minerals at thesame price as the lessee it replaced. In addition, it may be difficult for us to secure new or replacement lessees forsmall or isolated mineral reserves.
We have limited control over the activities on our properties that we do not operate and are exposed tooperating risks that we do not experience in the royalty business.
We do not have control over the operations of OCI Wyoming or our non-operated oil and gas workinginterest properties. We have limited approval rights with respect to OCI Wyoming, and our partner controls mostbusiness decisions, including decisions with respect to distributions and capital expenditures. Adversedevelopments in OCI Wyoming’s business would result in decreased distributions to NRP. The oil and gasproperties in which we own working interests are operated by third-party operators and involve third-partyworking interest owners. We have limited ability to influence or control the operation or future development ofsuch properties, including compliance with environmental, safety and other regulations, or the amount of capitalexpenditures required to fund such properties. These limitations and our dependence on the operator and otherworking interest owners for these projects could cause us to incur unexpected future costs and materiallyadversely affect our financial condition and results of operations. In addition, we are ultimately responsible foroperating the transportation infrastructure at Foresight’s Williamson mine, and have assumed the capital andoperating risks associated with that business. As a result of these investments, we could experience increasedcosts as well as increased liability exposure associated with operating these facilities.
Oil and gas development activities require substantial capital. We may be unable to obtain needed capital orfinancing on satisfactory terms or at all, which could lead to a decline in the value of our properties and adecline in our oil and natural gas reserves.
The oil and natural gas industry is capital intensive. We have capital expenditures and operating expensesassociated with the wells in which we own working interests and are required to fund our proportionate share onany wells in which we decide to participate. Our share of capital expenditures relating to our working interestscould exceed our revenues from those interests. Moreover, we are dependent on the other working interestowners of such projects to fund their contractual share of the capital expenditures of such projects.
Our operations and other capital resources may not provide cash in sufficient amounts to maintain plannedor future levels of capital expenditures. Further, our actual capital expenditures could exceed our capitalexpenditure budget. In the event our capital expenditure requirements at any time are greater than the amount ofcapital we have available, we could be required to seek additional sources of capital, which may includeadditional reserve based borrowings, debt financing, joint venture partnerships, production payment financings,sales of assets, offerings of debt or equity securities or other means. We may not be able to obtain debt or equityfinancing on terms favorable to us, or at all. If we are unable to fund our capital requirements, we may berequired to decline to participate in wells, which in turn could lead to a decline in the value of our assets or adecline in our oil and natural gas reserves.
Fluctuations in transportation costs and the availability or reliability of transportation could reduce theproduction of coal, oil and gas, soda ash, and other minerals from our properties.
Transportation costs represent a significant portion of the total delivered cost for the customers of ourlessees. Increases in transportation costs could make coal a less competitive source of energy or could make
38

minerals produced by some or all of our lessees less competitive than coal produced from other sources. On theother hand, significant decreases in transportation costs could result in increased competition for our lessees fromproducers in other parts of the country.
Our lessees depend upon railroads, barges, trucks and beltlines to deliver minerals to their customers.Disruption of those transportation services due to weather-related problems, mechanical difficulties, strikes,lockouts, bottlenecks and other events could temporarily impair the ability of our lessees to supply minerals totheir customers. Our lessees’ transportation providers may face difficulties in the future that may impair theability of our lessees to supply minerals to their customers, resulting in decreased royalty revenues to us.
In addition, OCI Wyoming transports its soda ash by rail or truck and ocean vessel. As a result, its businessand financial results are sensitive to increases in rail freight, trucking and ocean vessel rates. Increases intransportation costs, including increases resulting from emission control requirements, port taxes and fluctuationsin the price of fuel, could make soda ash a less competitive product for glass manufacturers when compared toglass substitutes or recycled glass, or could make OCI Wyoming’s soda ash less competitive than soda ashproduced by competitors that have other means of transportation or are located closer to their customers. OCIWyoming may be unable to pass on its freight and other transportation costs in full because market prices forsoda ash are generally determined by supply and demand forces. In addition, rail operations are subject to variousrisks that may result in a delay or lack of service at OCI Wyoming’s facility, and alternative methods oftransportation are impracticable or cost-prohibitive. Any substantial interruption in or increased costs related tothe transportation of OCI Wyoming’s soda ash could have a material adverse effect on our financial conditionand results of operations.
The marketability of our crude oil and natural gas production depends in part on the availability, proximityand capacity of pipeline and rail systems owned by third parties. The lack or unavailability of capacity on thesesystems and facilities could result in the shut-in of producing wells or the delay, or discontinuance of,development plans for properties in which we own oil and gas interests. In addition, as a result of pipelineconstraints in the Williston Basin, a significant amount of crude oil production from the region is transported byrail. Train derailments in the U.S. and Canada have resulted in increased regulatory scrutiny of the transportationof crude oil by rail. Any resulting regulations could result in increased transportation costs, which wouldnegatively affect our profitability from our Williston Basin assets.
We may incur losses and be subject to liability claims as a result of our ownership of working interests in oiland natural gas operations. Additionally, our insurance may be inadequate to protect us against these risks.
As an owner of working interests in oil and natural gas operations, we are responsible for our proportionateshare of any losses and liabilities arising from uninsured and underinsured events, which could adversely affectour business, financial condition or results of operations. We are subject to all of the risks associated with drillingfor and producing crude oil and natural gas, including the possibility of:
• environmental hazards, such as uncontrollable flows of crude oil, natural gas, brine, well fluids, hydraulicfracturing fluids, and toxic gas or other pollutants into the environment, including groundwater andshoreline contamination;
• abnormally pressured formations;
• mechanical difficulties, such as stuck oilfield drilling and service tools and casing collapse;
• fires, explosions and ruptures of pipelines;
• personal injuries and death;
• natural disasters; and
• spillage or mishandling of crude oil, natural gas, brine, well fluids, hydraulic fracturing fluids, toxic gas orother pollutants by third party service providers.
39

Any of these risks could adversely affect our ability to conduct operations or result in substantial losses to usas a result of:
• injury or loss of life;
• damage to and destruction of property, natural resources and equipment;
• pollution and other environmental damage;
• regulatory investigations and penalties;
• suspension of our operations; and
• repair and remediation costs.
We may elect not to obtain insurance if we believe the cost of available insurance is excessive relative to therisks presented. In addition, pollution and environmental risks generally are not fully insurable. The occurrenceof an event that is not fully covered by insurance could have a material adverse effect on our business, financialcondition and results of operations.
Our lessees could satisfy obligations to their customers with minerals from properties other than ours,depriving us of the ability to receive amounts in excess of minimum royalty payments.
Mineral supply contracts generally do not require operators to satisfy their obligations to their customerswith resources mined from specific reserves. Several factors may influence a lessee’s decision to supply itscustomers with minerals mined from properties we do not own or lease, including the royalty rates under thelessee’s lease with us, mining conditions, mine operating costs, cost and availability of transportation, andcustomer specifications. In addition, lessees move on and off of our properties over the course of any given yearin accordance with their mine plans. If a lessee satisfies its obligations to its customers with minerals fromproperties we do not own or lease, production on our properties will decrease, and we will receive lower royaltyrevenues.
A lessee may incorrectly report royalty revenues, which might not be identified by our lessee audit processor our mine inspection process or, if identified, might be identified in a subsequent period.
We depend on our lessees to correctly report production and royalty revenues on a monthly basis. Ourregular lessee audits and mine inspections may not discover any irregularities in these reports or, if we dodiscover errors, we might not identify them in the reporting period in which they occurred. Any undiscoveredreporting errors could result in a loss of royalty revenues and errors identified in subsequent periods could lead toaccounting disputes as well as disputes with our lessees.
Risks Related to Our Structure
Unitholders may not be able to remove our general partner even if they wish to do so.
Our general partner manages and operates NRP. Unlike the holders of common stock in a corporation,unitholders have only limited voting rights on matters affecting our business. Unitholders have no right to electthe general partner or the directors of the general partner on an annual or any other basis.
Furthermore, if unitholders are dissatisfied with the performance of our general partner, they currently havelittle practical ability to remove our general partner or otherwise change its management. Our general partnermay not be removed except upon the vote of the holders of at least 66 2/3% of our outstanding units (includingunits held by our general partner and its affiliates). Because the owners of our general partner, along withdirectors and executive officers and their affiliates, own a significant percentage of our outstanding commonunits, the removal of our general partner would be difficult without the consent of both our general partner and itsaffiliates.
In addition, the following provisions of our partnership agreement may discourage a person or group fromattempting to remove our general partner or otherwise change our management:
• generally, if a person acquires 20% or more of any class of units then outstanding other than from ourgeneral partner or its affiliates, the units owned by such person cannot be voted on any matter; and
40

• our partnership agreement contains limitations upon the ability of unitholders to call meetings or toacquire information about our operations, as well as other limitations upon the unitholders’ ability toinfluence the manner or direction of management.
As a result of these provisions, the price at which the common units will trade may be lower because of theabsence or reduction of a takeover premium in the trading price.
We may issue additional common units without unitholder approval, which would dilute a unitholder’sexisting ownership interests.
Our general partner may cause us to issue an unlimited number of common units, without unitholderapproval (subject to applicable New York Stock Exchange (NYSE) rules). We may also issue at any time anunlimited number of equity securities ranking junior or senior to the common units without unitholder approval(subject to applicable NYSE rules). The issuance of additional common units or other equity securities of equalor senior rank will have the following effects:
• an existing unitholder’s proportionate ownership interest in NRP will decrease;
• the amount of cash available for distribution on each unit may decrease;
• the relative voting strength of each previously outstanding unit may be diminished; and the market priceof the common units may decline.
Our general partner has a limited call right that may require unitholders to sell their units at an undesirabletime or price.
If at any time our general partner and its affiliates own 80% or more of the common units, the generalpartner will have the right, but not the obligation, which it may assign to any of its affiliates, to acquire all, butnot less than all, of the remaining common units held by unaffiliated persons at a price generally equal to the thencurrent market price of the common units. As a result, unitholders may be required to sell their common units at atime when they may not desire to sell them or at a price that is less than the price they would like to receive.They may also incur a tax liability upon a sale of their common units.
Cost reimbursements due to our general partner may be substantial and will reduce our cash available fordistribution to unitholders.
Prior to making any distribution on the common units, we reimburse our general partner and its affiliates,including officers and directors of the general partner, for all expenses incurred on our behalf. Thereimbursement of expenses and the payment of fees could adversely affect our ability to make distributions. Thegeneral partner has sole discretion to determine the amount of these expenses. In addition, our general partnerand its affiliates may provide us services for which we will be charged reasonable fees as determined by thegeneral partner.
Unitholders may not have limited liability if a court finds that unitholder actions constitute control of ourbusiness.
Our general partner generally has unlimited liability for our obligations, such as our debts andenvironmental liabilities, except for those contractual obligations that are expressly made without recourse to ourgeneral partner. Under Delaware law, however, a unitholder could be held liable for our obligations to the sameextent as a general partner if a court determined that the right of unitholders to remove our general partner or totake other action under our partnership agreement constituted participation in the “control” of our business. Inaddition, Section 17-607 of the Delaware Revised Uniform Limited Partnership Act provides that under somecircumstances, a unitholder may be liable to us for the amount of a distribution for a period of three years fromthe date of the distribution.
Conflicts of interest could arise among our general partner and us or the unitholders.
These conflicts may include the following:
• we do not have any employees and we rely solely on employees of affiliates of the general partner;
41
• under our partnership agreement, we reimburse the general partner for the costs of managing and foroperating the partnership;
• the amount of cash expenditures, borrowings and reserves in any quarter may affect cash available to payquarterly distributions to unitholders;
• the general partner tries to avoid being liable for partnership obligations. The general partner is permittedto protect its assets in this manner by our partnership agreement. Under our partnership agreement thegeneral partner would not breach its fiduciary duty by avoiding liability for partnership obligations even ifwe can obtain more favorable terms without limiting the general partner’s liability;
• under our partnership agreement, the general partner may pay its affiliates for any services rendered onterms fair and reasonable to us. The general partner may also enter into additional contracts with any of itsaffiliates on behalf of us. Agreements or contracts between us and our general partner (and its affiliates)are not necessarily the result of arm’s-length negotiations; and
• the general partner would not breach our partnership agreement by exercising its call rights to purchaselimited partnership interests or by assigning its call rights to one of its affiliates or to us.
The control of our general partner may be transferred to a third party without unitholder consent. A changeof control may result in defaults under certain of our debt instruments and the triggering of paymentobligations under compensation arrangements.
Our general partner may transfer its general partner interest to a third party in a merger or in a sale of all orsubstantially all of its assets without the consent of our unitholders. Furthermore, there is no restriction in ourpartnership agreement on the ability of the general partner of our general partner from transferring its generalpartnership interest in our general partner to a third party. The new owner of our general partner would then be ina position to replace the Board of Directors and officers with its own choices and to control their decisions andactions.
In addition, a change of control would constitute an event of default under our revolving credit agreement.During the continuance of an event of default under our revolving credit agreement, the administrative agent mayterminate any outstanding commitments of the lenders to extend credit to us and/or declare all amounts payableby us immediately due and payable. A change of control also may trigger payment obligations under variouscompensation arrangements with our officers.
Tax Risks to Common Unitholders
Our tax treatment depends on our status as a partnership for U.S. federal income tax purposes as well asour not being subject to a material amount of entity-level taxation by individual states. If the IRS were totreat us as a corporation for federal income tax purposes or we were to become subject to materialadditional amounts of entity-level taxation for state tax purposes, then our cash available for distribution toyou would be substantially reduced.
The anticipated after-tax economic benefit of an investment in our common units depends largely on ourbeing treated as a partnership for U.S. federal income tax purposes. Despite the fact that we are organized as alimited partnership under Delaware law, we would be treated as a corporation for U.S. federal income taxpurposes unless we satisfy a “qualifying income” requirement. Based on our current operations, we believe wesatisfy the qualifying income requirement. However, we have not requested, and do not plan to request, a rulingfrom the IRS on this or any other matter affecting us. Failing to meet the qualifying income requirement or achange in current law could cause us to be treated as a corporation for U.S. federal income tax purposes orotherwise subject us to taxation as an entity.
If we were treated as a corporation for U.S. federal income tax purposes, we would pay federal income taxon our taxable income at the corporate tax rate, which is currently a maximum of 35% and would likely be liablefor state income tax at varying rates. Distributions to you would generally be taxed again as corporatedistributions, and no income, gains, losses, deductions or credits would flow through to you. Because tax would
42

be imposed upon us as a corporation, our cash available for distribution to you would be substantially reduced.Therefore, treatment of us as a corporation would result in a material reduction in the anticipated cash flow andafter-tax return to our common unitholders, likely causing a substantial reduction in the value of our commonunits.
At the state level, several states have been evaluating ways to subject partnerships to entity-level taxationthrough the imposition of state income, franchise and other forms of taxation. Imposition of a similar tax on us ina jurisdiction in which we operate or in other jurisdictions to which we may expand could substantially reducethe cash available for distribution to you.
The tax treatment of publicly traded partnerships or an investment in our common units could be subject topotential legislative, judicial or administrative changes or differing interpretations, possibly applied on aretroactive basis.
The present U.S. federal income tax treatment of publicly traded partnerships, including us, or aninvestment in our common units may be modified by administrative, legislative or judicial changes or differinginterpretations at any time. For example, from time to time, members of Congress propose and considersubstantive changes to the existing federal income tax laws that affect publicly traded partnerships. One suchlegislative proposal would have eliminated the qualifying income exception to the treatment of all publicly tradedpartnerships as corporations upon which we rely for our treatment as a partnership for U.S. federal income taxpurposes. We are unable to predict whether any of these changes or other proposals will be reintroduced or willultimately be enacted. Any such changes could negatively impact the value of an investment in our commonunits. Any modification to U.S. federal income tax laws may be applied retroactively and could make it moredifficult or impossible for us to meet the exception for certain publicly traded partnerships to be treated as apartnership for U.S. federal income tax purposes.
If the IRS contests the federal income tax positions we take, the market for our common units may beadversely impacted and the cost of any IRS contest will reduce our cash available for distribution to you.
We have not requested a ruling from the IRS with respect to our treatment as a partnership for federalincome tax purposes or any other matter affecting us. The IRS may adopt positions that differ from the positionswe take. It may be necessary to resort to administrative or court proceedings to sustain some or all of thepositions we take. A court may not agree with some or all of the positions we take. Any contest by the IRS maymaterially and adversely impact the market for our common units and the price at which they trade. In addition,our costs of any contest by the IRS will be borne indirectly by our unitholders and our general partner becausethe costs will reduce our cash available for distribution.
You are required to pay taxes on your share of our income even if you do not receive any cash distributionsfrom us.
Because our unitholders are treated as partners to whom we allocate taxable income that could be differentin amount than the cash we distribute, you are required to pay any federal income taxes and, in some cases, stateand local income taxes on your share of our taxable income even if you receive no cash distributions from us.You may not receive cash distributions from us equal to your share of our taxable income or even equal to theactual tax due from you with respect to that income.
Tax gain or loss on the disposition of our common units could be more or less than expected.
If you sell your common units, you will recognize a gain or loss equal to the difference between the amountrealized and your tax basis in those common units. Because distributions in excess of your allocable share of ournet taxable income result in a decrease in your tax basis in your common units, the amount, if any, of such priorexcess distributions with respect to the common units you sell will, in effect, become taxable income to you ifyou sell such common units at a price greater than your tax basis in those common units, even if the price youreceive is less than your original cost. Furthermore, a substantial portion of the amount realized, whether or not
43

representing gain, may be taxed as ordinary income due to potential recapture items, including depletion anddepreciation recapture. In addition, because the amount realized includes a unitholder’s share of our nonrecourseliabilities, if you sell your common units, you may incur a tax liability in excess of the amount of cash youreceive from the sale.
Tax-exempt entities and non-U.S. persons face unique tax issues from owning our common units that mayresult in adverse tax consequences to them.
Investments in common units by tax-exempt entities, such as employee benefit plans and individualretirement accounts (known as IRAs), and non-U.S. persons raise issues unique to them. For example, virtuallyall of our income allocated to organizations that are exempt from federal income tax, including IRAs and otherretirement plans, will be unrelated business taxable income and will be taxable to them. Allocations and/ordistributions to non-U.S. persons will be reduced by withholding taxes imposed at the highest applicableeffective tax rate applicable to non-U.S. persons, and non-U.S. persons will be required to file U.S. federalincome tax returns and pay tax on their share of our taxable income. If you are a tax exempt entity or a non-U.S.person, you should consult your tax advisor before investing in our common units.
We will treat each purchaser of our common units as having the same tax benefits without regard to theactual common units purchased. The IRS may challenge this treatment, which could adversely affect thevalue of the common units.
Because we cannot match transferors and transferees of our common units and for other reasons, we haveadopted depreciation and amortization positions that may not conform to all aspects of existing TreasuryRegulations. A successful IRS challenge to those positions could adversely affect the amount of tax benefitsavailable to you. It also could affect the timing of these tax benefits or the amount of gain from your sale ofcommon units and could have a negative impact on the value of our common units or result in audit adjustmentsto your tax returns.
We prorate our items of income, gain, loss and deduction between transferors and transferees of ourcommon units each month based upon the ownership of our common units on the first day of each month,instead of on the basis of the date a particular unit is transferred. The IRS may challenge this treatment,which could change the allocation of items of income, gain, loss and deduction among our unitholders.
We generally prorate our items of income, gain, loss and deduction between transferors and transferees ofour common units each month based upon the ownership of our common units on the first day of each month,instead of on the basis of the date a particular unit is transferred. The use of this proration method may not bepermitted under existing Treasury Regulations. The U.S. Treasury Department’s proposed Treasury Regulationsallowing a similar monthly simplifying convention are not final and do not specifically authorize the use of theproration method we have adopted. If the IRS were to successfully challenge our proration method or newTreasury Regulations were issued, we may be required to change the allocation of items of income, gain, loss anddeduction among our unitholders.
A unitholder whose common units are the subject of a securities loan (e.g., a loan to a “short seller” tocover a short sale of common units) may be considered as having disposed of those common units. If so, hewould no longer be treated for tax purposes as a partner with respect to those common units during theperiod of the loan and may recognize gain or loss from the disposition.
Because there are no specific rules governing the U.S. federal income tax consequences of loaning apartnership interest, a unitholder whose common units are the subject of a securities loan may be considered ashaving disposed of the loaned common units. In that case, the unitholder may no longer be treated for taxpurposes as a partner with respect to those common units during the period of the loan and the unitholder mayrecognize gain or loss from such disposition. Moreover, during the period of the loan, any of our income, gain,loss or deduction with respect to those common units may not be reportable by the unitholder and any cashdistributions received by the unitholder as to those common units could be fully taxable as ordinary income.
44

Unitholders desiring to assure their status as partners and avoid the risk of gain recognition from a loan of theircommon units are urged to modify any applicable brokerage account agreements to prohibit their brokers fromborrowing their common units.
The sale or exchange of 50% or more of our capital and profits interests during any twelve-month periodwill result in the termination of us as a partnership for federal income tax purposes.
We will be considered to have terminated as a partnership for federal income tax purposes if there is a saleor exchange of 50% or more of the total interests in our capital and profits within a twelve-month period. Forpurposes of determining whether the 50% threshold has been met, multiple sales of the same interest will becounted only once. Our termination would, among other things, result in the closing of our taxable year for allunitholders, which would result in our filing two tax returns for one calendar year and could result in a significantdeferral of depreciation deductions allowable in computing our taxable income. In the case of a unitholderreporting on a taxable year other than the calendar year, the closing of our taxable year may also result in morethan twelve months of our taxable income or loss being includable in taxable income for the unitholder’s taxableyear that includes our termination. Our termination currently would not affect our classification as a partnershipfor federal income tax purposes, but it would result in our being treated as a new partnership for U.S. federalincome tax purposes following the termination. If we were treated as a new partnership, we would be required tomake new tax elections and could be subject to penalties if we were unable to determine that a terminationoccurred. The IRS recently announced a relief procedure whereby if a publicly traded partnership that hastechnically terminated requests and the IRS grants special relief, among other things, the partnership may bepermitted to provide only a single Schedule K-1 to unitholders for the two short tax periods included in the yearin which the termination occurs.
Certain federal income tax preferences currently available with respect to coal exploration and developmentmay be eliminated as a result of future legislation.
Changes to U.S. federal income tax laws have been proposed in a prior session of Congress that wouldeliminate certain key U.S. federal income tax preferences relating to coal exploration and development. Thesechanges include, but are not limited to (i) repealing capital gains treatment of coal and lignite royalties,(ii) eliminating current deductions and 60-month amortization for exploration and development costs relating tocoal and other hard mineral fossil fuels, (iii) repealing the percentage depletion allowance with respect to coalproperties, and (iv) excluding from the definition of domestic production gross receipts all gross receipts derivedfrom the sale, exchange, or other disposition of coal, other hard mineral fossil fuels, or primary products thereof.If enacted, these changes would limit or eliminate certain tax deductions that are currently available with respectto coal exploration and development, and any such change could increase the taxable income allocable to ourunitholders and negatively impact the value of an investment in our common units.
As a result of investing in our common units, you are subject to state and local taxes and return filingrequirements in jurisdictions where we operate or own or acquire property.
In addition to federal income taxes, you are likely subject to other taxes, including state and local taxes,unincorporated business taxes and estate, inheritance or intangible taxes that are imposed by the variousjurisdictions in which we conduct business or own property now or in the future, even if you do not live in any ofthose jurisdictions. You are likely required to file state and local income tax returns and pay state and localincome taxes in some or all of these various jurisdictions. Further, you may be subject to penalties for failure tocomply with those requirements. We own property and conduct business in a number of states in the UnitedStates. Most of these states impose an income tax on individuals, corporations and other entities. As we makeacquisitions or expand our business, we may own assets or conduct business in additional states that impose apersonal income tax. It is your responsibility to file all U.S. federal, state and local tax returns.
Item 1B. Unresolved Staff Comments
None.
45

Item 2. Properties.
The information required by this Item is included under “Item 1. Business” in this Annual Report on Form10-K and is incorporated by reference herein.
Item 3. Legal Proceedings
We are involved, from time to time, in various legal proceedings arising in the ordinary course of business.While the ultimate results of these proceedings cannot be predicted with certainty, we believe these claims willnot have a material effect on our financial position, liquidity or operations.
Item 4. Mine Safety Disclosures
The information concerning mine safety violations or other regulatory matters required by SEC regulationsis included in Exhibit 95.1 to this Annual Report on Form 10-K.
46

PART II
Item 5. Market for Registrant’s Common Equity, Related Unitholder Matters and Issuer Purchases ofEquity Securities
NRP Common Units and Cash Distributions
Our common units are listed and traded on the NYSE under the symbol “NRP”. As of February 23, 2015,there were approximately 43,400 beneficial and registered holders of our common units. The computation of theapproximate number of unitholders is based upon a broker survey.
The following table sets forth the high and low sales prices per common unit, as reported on the NYSEComposite Transaction Tape from January 1, 2013 to December 31, 2014, and the quarterly cash distributiondeclared and paid with respect to each quarter per common unit.
Price Range Cash Distribution History
High LowPerUnit
RecordDate
PaymentDate
2013
First Quarter . . . . . . . . . . . . . . . . . . . . . . $23.95 $18.93 $0.5500 05/06/2013 05/14/2013
Second Quarter . . . . . . . . . . . . . . . . . . . $24.37 $20.08 $0.5500 08/05/2013 08/14/2013
Third Quarter . . . . . . . . . . . . . . . . . . . . . $22.39 $18.98 $0.5500 11/05/2013 11/14/2013
Fourth Quarter . . . . . . . . . . . . . . . . . . . . $21.57 $18.99 $0.3500 01/21/2014 01/31/2014
2014
First Quarter . . . . . . . . . . . . . . . . . . . . . . $20.72 $14.80 $0.3500 05/05/2014 05/14/2014
Second Quarter . . . . . . . . . . . . . . . . . . . $16.57 $12.78 $0.3500 08/05/2014 08/14/2014
Third Quarter . . . . . . . . . . . . . . . . . . . . . $16.91 $12.56 $0.3500 11/05/2014 11/14/2014
Fourth Quarter . . . . . . . . . . . . . . . . . . . . $13.83 $ 7.97 $0.3500 02/05/2015 02/13/2015
Cash Distributions to PartnersGeneral
Partner(1)Limited
Partners(2)Total
Distributions
(in thousands)
2013 Distributions . . . . . . . . . . . . . . . . . . . . . . . . . . . . . . . . . . . . . . . . . . . . . . $4,930 $241,588 $246,518
2014 Distributions . . . . . . . . . . . . . . . . . . . . . . . . . . . . . . . . . . . . . . . . . . . . . . $3,241 $158,801 $162,042
(1) Represents distributions on our general partner’s 2% general partner interest in us.
(2) Includes distributions on 1,560,000 common units held by our general partner.
Unregistered Sales of Equity Securities
As previously reported, in connection with the closing of the VantaCore acquisition, on October 1, 2014, weissued 2,426,690 common units to certain of the owners of VantaCore in exchange for their interests inVantaCore and VantaCore GP upon closing of the acquisition. The aggregate offering price of the common unitsas of the date of issuance was approximately $31.6 million. On December 4, 2014, we issued an additional 813units to certain of the former owners of VantaCore in connection with a post-closing adjustment to the purchaseprice for the acquisition. The aggregate offering price of such additional common units as of the date of issuancewas approximately $8,500. Such common units were issued and sold in reliance upon an exemption from theregistration requirements of the Securities Act of 1933, pursuant to Section 4(2) thereof.
47

Item 6. Selected Financial Data
The following table shows selected historical financial data for Natural Resource Partners L.P. for theperiods and as of the dates indicated. We derived the information in the following tables from, and theinformation should be read together with and is qualified in its entirety by reference to, the historical financialstatements and the accompanying notes included in “Item 8. Financial Statements and Supplementary Data” inthis and previously filed Annual Reports on Form 10-K. These tables should be read together with “Item 7.Management’s Discussion and Analysis of Financial Condition and Results of Operations.”
Natural Resource Partners L.P. Selected Financial DataFor the Years Ended December 31,
2014 2013 2012 2011 2010
(in thousands, except per unit data)
Total revenues and other income . . . . . . . . . $ 399,752 $ 358,117 $ 379,147 $ 377,683 $ 301,401
Asset impairments . . . . . . . . . . . . . . . . . . . . . $ 26,209 $ 734 $ 2,568 $ 161,336 $ —
Income from operations . . . . . . . . . . . . . . . . $ 188,919 $ 236,236 $ 267,165 $ 104,135 $ 196,061
Net income . . . . . . . . . . . . . . . . . . . . . . . . . . $ 108,830 $ 172,078 $ 213,355 $ 54,026 $ 154,461
Basic and diluted net income per limitedpartner unit . . . . . . . . . . . . . . . . . . . . . . . . $ 0.94 $ 1.54 $ 1.97 $ 0.50 $ 1.54
Distributions paid ($ per unit) . . . . . . . . . . . . $ 1.40 $ 2.20 $ 2.20 $ 2.17 $ 2.16
Weighted average number of common unitsoutstanding . . . . . . . . . . . . . . . . . . . . . . . . 113,262 109,584 106,028 106,028 81,917
Cash from operations . . . . . . . . . . . . . . . . . . $ 210,755 $ 247,074 $ 271,408 $ 305,574 $ 258,694
Distributable cash flow(1) . . . . . . . . . . . . . . . $ 217,710 $ 309,394 $ 298,899 $ 311,174 $ 260,274
Adjusted EBITDA(1) . . . . . . . . . . . . . . . . . . $ 300,322 $ 340,345 $ 328,116 $ 329,660 $ 253,074
Balance sheet data:
Cash and cash equivalents . . . . . . . . . . . . . . . $ 50,076 $ 92,513 $ 149,424 $ 214,922 $ 95,506
Total assets . . . . . . . . . . . . . . . . . . . . . . . . . . $2,444,724 $1,991,856 $1,764,672 $1,665,649 $1,664,036
Long-term debt . . . . . . . . . . . . . . . . . . . . . . . $1,394,240 $1,084,226 $ 897,039 $ 836,268 $ 661,070
Partners’ capital . . . . . . . . . . . . . . . . . . . . . . . $ 720,155 $ 616,789 $ 617,447 $ 644,915 $ 825,180
(1) See “—Non-GAAP Financial Measures” below.
Non-GAAP Financial Measures
Distributable Cash Flow
Under our partnership agreement, we are required to distribute all of our available cash each quarter.Because distributable cash flow is a significant liquidity metric that is an indicator of our ability to generate cashflows in order to make quarterly cash distributions to our partners, we view it as the most important measure ofour success as a company. Distributable cash flow is also the quantitative standard used in the investmentcommunity with respect to publicly traded partnerships.
Our distributable cash flow represents cash flow from operations, plus returns on unconsolidated equityinvestments, proceeds from sales of assets, and returns on direct financing lease and contractual overrides.Although distributable cash flow is a “non-GAAP” financial measure, we believe it is a useful adjunct to net cashprovided by operating activities under GAAP. Distributable cash flow is not a measure of financial performanceunder GAAP and should not be considered as an alternative to cash flows from operating, investing or financingactivities. Distributable cash flow may not be calculated the same for us as for other companies.
48

Reconciliation of “Net cash provided by operating activities” to “Distributable cash flow”
Year Ended December 31,
2014 2013 2012 2011 2010
(in thousands)
Net cash provided by operating activities . . . . . . . . . . $210,755 $247,074 $271,408 $305,574 $258,694Returns on unconsolidated equity investments . . . . . . 3,633 48,833 — — —Returns on direct financing lease and contractual
overrides . . . . . . . . . . . . . . . . . . . . . . . . . . . . . . . . . . 1,904 2,558 2,669 — —Proceeds from sales of assets . . . . . . . . . . . . . . . . . . . . 1,418 10,929 24,822 5,600 1,580
Distributable cash flow . . . . . . . . . . . . . . . . . . . . . . . . . $217,710 $309,394 $298,899 $311,174 $260,274
Adjusted EBITDA
Adjusted EBITDA is a non-GAAP financial measure that we define as net income less equity and otherunconsolidated investment income; plus distributions from unconsolidated affiliates, interest expense, gross,depreciation, depletion and amortization, and asset impairments. Adjusted EBITDA, as used and defined by us,may not be comparable to similarly titled measures employed by other companies and is not a measure ofperformance calculated in accordance with GAAP. Adjusted EBITDA should not be considered in insolation oras a substitute for operating income, net income or loss, cash flows provided by operating, investing and financialactivities, or other income or cash flow statement data prepared in accordance with GAAP. Adjusted EBITDAprovides no information regarding a company’s capital structure, borrowings, interest costs, capital expenditures,and working capital movement or tax positions. Adjusted EBITDA does not represent funds available fordiscretionary use because those funds may be required for debt service, capital expenditures, working capital andother commitments and obligations. Our management team believes Adjusted EBITDA is useful in evaluatingour financial performance because this measure is widely used by financial analysts, investors and ratingagencies for comparative purposes. NRP entered the high-yield bond market in 2013, and Adjusted EBITDA is afinancial measure widely used by investors in that market. There are significant limitations to using AdjustedEBITDA as a measure of performance, including the inability to analyze the effect of certain recurring items thatmaterially affect our net income or loss, the lack of comparability of results of operations of different companiesand the different methods of calculating Adjusted EBITDA reported by different companies.
Reconciliation of “Net income” to “Adjusted EBITDA”
Year Ended December 31,
2014 2013 2012 2011 2010
(in thousands)
Net income . . . . . . . . . . . . . . . . . . . . . . . . . . . . . . . . . . $108,830 $172,078 $213,355 $ 54,026 $154,461Less equity and other unconsolidated investment
income . . . . . . . . . . . . . . . . . . . . . . . . . . . . . . . . . . . (41,416) (34,186) — — —Add distributions from unconsolidated affiliates . . . . . 46,638 72,946 — — —Add depreciation, depletion and amortization . . . . . . . 79,876 64,377 58,221 65,118 56,978Add asset impairments . . . . . . . . . . . . . . . . . . . . . . . . . 26,209 734 2,568 161,336 —Add interest expense, gross . . . . . . . . . . . . . . . . . . . . . 80,185 64,396 53,972 49,180 41,635
Adjusted EBITDA . . . . . . . . . . . . . . . . . . . . . . . . . . . . $300,322 $340,345 $328,116 $329,660 $253,074
Adjusted EBITDA presented in the table above differs from the EBITDDA definitions contained in Opco’sdebt agreement covenants. In calculating EBITDDA for purposes of Opco’s debt covenant compliance, proforma effect may be given to acquisitions and dispositions made during the relevant period. See “Item 7.Management’s Discussion and Analysis of Financial Condition and Results of Operations—Liquidity and CapitalResources—Contractual Obligations and Commercial Commitments—Opco Debt” for a description of Opco’sdebt agreements.
49

Item 7. Management’s Discussion and Analysis of Financial Condition and Results of Operations
The following discussion of the financial condition and results of operations should be read in conjunctionwith the historical financial statements and notes thereto included elsewhere in this filing and the financialstatements and footnotes included elsewhere in this Annual Report on Form 10-K for the year endedDecember 31, 2014.
As used in this Item 7, unless the context otherwise requires: “we,” “our” and “us” refer to NaturalResource Partners L.P. and, where the context requires, our subsidiaries. References to “NRP” and “NaturalResource Partners” refer to Natural Resource Partners L.P. only, and not to NRP (Operating) LLC or any ofNatural Resource Partners L.P.’s subsidiaries. References to “Opco” refer to NRP (Operating) LLC and itssubsidiaries. References to NRP Oil and Gas refer to NRP Oil and Gas LLC, a wholly owned subsidiary of NRP.NRP Finance Corporation (“NRP Finance”) is a wholly owned subsidiary of NRP and a co-issuer with NRP onthe 9.125% senior notes.
Executive Overview
We engage principally in the business of owning, managing and leasing a diversified portfolio of mineralproperties in the United States, including interests in coal, trona and soda ash, crude oil and natural gas,construction aggregates, frac sand and other natural resources. Executing on our plans to diversify our business,we have completed over $900 million in acquisitions since January 2013. For the year ended December 31, 2014,we recorded revenues and other income of $399.8 million and Adjusted EBITDA of $300.3 million.Approximately $226.7 million (57%) of our 2014 revenues and other income were attributable to coal-relatedsources, and $173.0 million (43%) of our revenues and other income were attributed to non-coal-related sources.Adjusted EBITDA is a non-GAAP financial measure. For a reconciliation of Adjusted EBITDA to net income,see “Item 6. Selected Financial Data—Non-GAAP Financial Measures—Adjusted EBITDA.”
Our coal reserves are located in the three major U.S. coal-producing regions: Appalachia, the Illinois Basinand the Western United States, as well as lignite reserves in the Gulf Coast region. We do not operate any coalmines, but lease our coal reserves to experienced mine operators under long-term leases that grant the operatorsthe right to mine and sell our reserves in exchange for royalty payments. We also own and manage infrastructureassets that generate additional revenues, primarily in the Illinois Basin.
We own or lease aggregates and industrial minerals located in a number of states across the country. Wederive a small percentage of our aggregates and industrial minerals revenues by leasing our owned reserves tothird party operators who mine and sell the reserves in exchange for royalty payments. However, the majority ofour aggregates and industrial minerals revenues come through our ownership of VantaCore Partners LLC, whichwe acquired in October 2014. VantaCore specializes in the construction materials industry and operates threehard rock quarries, five sand and gravel plants, two asphalt plants and a marine terminal. VantaCore’s currentoperations are located in Pennsylvania, West Virginia, Tennessee, Kentucky and Louisiana.
We own a 49% non-controlling equity interest in a trona ore mining operation and soda ash refinery in theGreen River Basin, Wyoming. OCI Resources LP, our operating partner, mines the trona, processes it into sodaash, and distributes the soda ash both domestically and internationally into the glass and chemicals industries. Wereceive regular quarterly distributions from this business.
We own various interests in oil and gas properties that are located in the Williston Basin, the AppalachianBasin, Louisiana and Oklahoma. Our interests in the Appalachian Basin, Louisiana and Oklahoma are mineralsand royalty interests, while in the Williston Basin we own non-operated working interests. Our Williston Basinnon-operated working interest properties include the properties acquired in the Sanish Field from an affiliate ofKaiser-Francis Oil Company in November 2014.
Current Liquidity Position
As of December 31, 2014, we had $100 million in available borrowing capacity under Opco’s revolvingcredit facility, $27 million available under the NRP Oil and Gas revolving credit facility and $50.1 million incash.
50

We have $80.9 million in principal payments due on NRP Operating’s senior notes each year through 2018,and NRP Operating’s revolving credit facility and term loan facility both mature in 2016. While we believe wehave sufficient liquidity to meet our current financial needs, we will be required to repay or refinance theamounts outstanding under Opco’s credit facilities prior to their maturity. While we believe we will be able torefinance these amounts, we may not be able to do so on terms acceptable to us, if at all, or the borrowingcapacity under Opco’s revolving credit facility may be substantially reduced. Our ability to refinance theseamounts may depend in part on our ability to access the debt or equity capital markets, which will be challengingin the current commodity price environment. See “—Liquidity and Capital Resources” for a further descriptionof our indebtedness, cash flows and capital expenditures.
Current Results/Market Outlook
Our revenues and other income from sources other than coal represented 43% of our total revenues andother income in 2014, as compared to 23% of total revenues and other income in 2013. Although our totalrevenues and other income for 2014 increased over 2013, our coal-related revenues were down 17% compared tothe same period. The majority of the decrease in coal-related revenues was due to lower Appalachian coal royaltyrevenues, which were down approximately 19% from 2013. During 2014, our investment in OCI Wyoming’strona mining and soda ash production operations contributed $41.4 million in other income, up $7.2 million from2013, and our oil and gas revenues increased to $59.6 million, triple our oil and gas revenues in 2013.
The coal markets remained challenged during the year and do not currently show signs of recovery.Although thermal coal prices continue to be depressed, we believe that thermal coal production from ourproperties in the low-cost Illinois Basin will continue to remain strong in spite of the weak thermal markets. Weexpect the markets for thermal coal from our other regions to remain weak during 2015. We continue to havesubstantial exposure to metallurgical coal, from which we derived approximately 40% of our coal royaltyrevenues and 32% of the related production during 2014. The first quarter 2015 benchmark price formetallurgical coal remains at a multi-year low, and the global metallurgical coal market continues to suffer fromoversupply in addition to reduced demand from China and a relatively strong U.S. dollar. We do not anticipatethat metallurgical coal prices will recover in 2015. While we have not been significantly impacted so far by thevarious metallurgical coal mine idlings announced during the second half of 2014, additional mine idlingsresulting in reductions of production of metallurgical coal from our properties may occur in 2015 if prices remainat current levels. In addition, if coal prices continue to remain depressed for an extended period of time, thelessees on some of our coal properties may close some of their mines causing some of our coal properties to beimpaired.
Our trona mining and soda ash refinery investment performed in line with our expectations during 2014.The international market for soda ash continues to grow, as global production capacity for high-cost syntheticsoda ash continues to be reduced, and OCI Wyoming’s sales through ANSAC were better than expected.Domestic sales volumes, which are typically sold at higher prices than soda ash sold internationally, haveremained relatively stable. The cash we receive from OCI Wyoming is in part determined by the quarterlydistribution declared by OCI Resources LP. In February 2015, OCI Resources LP paid a quarterly distribution of$0.5315 per common unit with respect to the fourth quarter of 2014, representing a slight increase over thedistribution paid with respect to the third quarter of 2014. OCI Resources LP also announced its intention toincrease its distributions with respect to 2015 by 3% to 6%.
VantaCore’s construction aggregates mining and production business is largely dependent on the strength ofthe local markets that it serves. Its operations based in Clarksville, Tennessee and Baton Rouge, Louisiana willdepend on the pace of commercial and residential construction in those areas, each of which has been slowlyrecovering from the 2008-2009 recession. VantaCore’s Laurel Aggregates operation in southwesternPennsylvania serves many of the producers and oilfield service companies operating in the Marcellus and UticaShales. To the extent that the pace of exploration and development of natural gas in those areas slows due to lownatural gas prices, we expect that VantaCore’s business will be affected. In addition, VantaCore’s business isseasonal, with lower production and sales expected during the first quarter of each year due to winter weather.
51

Global oil prices have declined significantly since the second quarter of 2014 due to increased oil supplydriven by robust onshore U.S. development activity, coupled with reduced global demand and a strong U.S.dollar. Natural gas prices are also low due to record levels of production and high storage inventories. As of thedate of this filing, we have not hedged any of our future oil or natural gas production and, as a result, our oil andgas revenues will continue to be impacted by the current price environment. However, we are able to manage thecapital expenditures associated with our Williston Basin non-operated working interest properties by evaluatingwell proposals on a well-by-well basis. We will continue to monitor the development programs of the operatorsof these properties and manage the capital expenditures associated with those properties by only participating inwells that are expected to provide acceptable economic returns.
Political, Legal and Regulatory Environment Affecting Our Coal Business
The political, legal and regulatory environment continues to be difficult for the coal industry. TheEnvironmental Protection Agency (“EPA”) has used its authority to create significant delays in the issuance ofnew permits and the modification of existing permits, which has led to substantial delays and increased costs forcoal operators. In addition, the electric utility industry, which is the most significant end-user of domestic coal, issubject to extensive regulation regarding the environmental impact of its power generation activities. In January2014, EPA published proposed new source performance standards for GHG emissions from new fossil fuel-firedelectric generating units. The effect of the proposed rules would be to require partial carbon capture andsequestration on any new coal-fired power plants, which may amount to their effective prohibition. In June 2014,EPA proposed the Clean Power Plan, which outlined a multi-factor plan to cut carbon emissions from existingelectric generating units, including coal-fired power plants. Under this proposed rule, existing power plantswould be required to cut their carbon dioxide emissions 30% from 2005 levels by the year 2030. The effect of theproposed rules would be to require many existing coal-fired power plants to incur substantial costs in order tocomply or alternatively result in the closure of some of these plants. EPA intends to finalize these rules in thesummer of 2015, both of which have been challenged by industry participants and other parties. Theimplementation of these rules as proposed would have a material adverse effect on the demand for coal byelectric power generators and as a result on our coal related-revenues.
In addition to EPA’s GHG initiatives, there are several other federal rulemakings that are focused onemissions from coal-fired electric generating facilities, including the Cross-State Air Pollution Rule (CSAPR),which regulates emissions of nitrogen oxide and sulfur dioxide, and the Mercury and Air Toxics Rule (MATS),which regulates emissions of hazardous air pollutants. Installation of additional emissions control technologiesand other measures required under these and other EPA regulations have made it more costly to operate manycoal-fired power plants and have resulted in and are expected to continue to result in plant closures. Furtherreductions in coal’s share of power generating capacity as a result of compliance with existing or proposed rulesand regulations would have a material adverse effect on our coal-related revenues.
Significant Acquisitions
Sanish Field. On November 12, 2014, we completed the purchase of a 40% member interest in Kaiser-Whiting, LLC (“Kaiser LLC”) for $339 million, subject to customary post-closing purchase price adjustments.Effective November 13, 2014, NRP Oil and Gas withdrew as a member of Kaiser LLC and an undivided 40%interest in Kaiser LLC’s assets was distributed out of Kaiser LLC and assigned directly to NRP Oil and Gas. Theassets distributed to us included non-operated working interests in approximately 6,086 net acres with an averageworking interest of approximately 14.5%. The assets, located in the Sanish Field in Mountrail County, NorthDakota, are all held by production and include 196 producing oil and gas wells as of December 31, 2014. See“Note 3. Significant Acquisitions” to the audited consolidated financial statements included elsewhere in thisAnnual Report on Form 10-K.
VantaCore Partners. On October 1, 2014, we completed the acquisition of VantaCore, a privately heldcompany specializing in the construction materials industry, for $201 million in cash and common units, subjectto customary post-closing purchase price adjustments. Headquartered in Philadelphia, Pennsylvania, VantaCoreoperates three hard rock quarries, five sand and gravel plants, two asphalt plants and a marine terminal.
52

VantaCore’s current operations are located in Pennsylvania, West Virginia, Tennessee, Kentucky and Louisiana.See “Note 3. Significant Acquisitions” to the audited consolidated financial statements included elsewhere in thisAnnual Report on Form 10-K.
Sundance. In December 2013, we acquired non-operated working interests in oil and gas properties in theWilliston Basin of North Dakota, including properties producing from the Bakken/Three Forks play, fromSundance Energy, Inc. for $29.4 million, following post-closing purchase price adjustments. The properties,which are all held by production are located in McKenzie, Mountrail and Dunn counties and are actively beingdeveloped.
Abraxas. In August 2013, we acquired non-operated working interests in producing oil and gas propertiesin the Williston Basin of North Dakota and Montana, including properties producing from the Bakken/ThreeForks play, from Abraxas Petroleum Corporation for $38.0 million, following post-closing purchase priceadjustments.
OCI Wyoming. In January 2013, we acquired a non-controlling equity interest in OCI Wyoming, anoperator of a trona ore mining operation and a soda ash refinery in the Green River Basin, Wyoming, fromAnadarko Holding Company and its subsidiary, Big Island Trona Company for $292.5 million. The acquisitionagreement provides for up to the net present value of $50 million in additional contingent consideration payableby us should certain performance criteria be met as defined in the purchase and sales agreement in any of 2013,2014 or 2015. As of December 31, 2014 we had accrued $14.5 million for contingent consideration payments, ofwhich we expect to pay $3.8 million to Anadarko with respect to 2014.
Critical Accounting Policies
Preparation of the accompanying financial statements in conformity with accounting principles generallyaccepted in the United States requires management to make estimates and assumptions that affect the reportedamounts of assets and liabilities in the accompanying Consolidated Balance Sheets and the reported amounts ofrevenues and expenses in the accompanying Consolidated Statements of Comprehensive Income during thereporting period. See “Note 2. Summary of Significant Accounting Policies” to the audited consolidated financialstatements included elsewhere in this Annual Report on Form 10-K. The following critical accounting policiesare affected by estimates and assumptions used in the preparation of Consolidated Financial Statements.
Equity Investments
We account for non-marketable investments using the equity method of accounting if the investment givesus the ability to exercise significant influence over, but not control of, an investee. Significant influence generallyexists if we have an ownership interest representing between 20% and 50% of the voting stock of the investee.We account for our investment in OCI Wyoming using this method.
Under the equity method of accounting, investments are stated at initial cost and are adjusted for subsequentadditional investments and the proportionate share of earnings or losses and distributions. The basis differencebetween the investment and the proportional share of the fair value of the underlying net assets of equity methodinvestees is hypothetically allocated first to identified tangible assets and liabilities, then to finite-livedintangibles or indefinite-lived intangibles and the balance is attributed to goodwill. The portion of the basisdifference attributed to net tangible assets and finite-lived intangibles is amortized over its estimated useful lifewhile indefinite-lived intangibles, if any, and goodwill are not amortized. The amortization of the basisdifference is recorded as a reduction of earnings from the equity investment in the Consolidated Statements ofComprehensive Income.
Our carrying value in an equity method investee company is reflected in the caption “Equity and otherunconsolidated investments” in our Consolidated Balance Sheets. Our adjusted share of the earnings or losses ofthe investee company is reflected in the Consolidated Statements of Comprehensive Income as revenues andother income under the caption ‘‘Equity and other unconsolidated investment income.” These earnings aregenerated from natural resources, which are considered part of our core business activities consistent with its
53

directly owned revenue generating activities. Investee earnings are adjusted to reflect the amortization of anydifference between the cost basis of the equity investment and the proportionate share of the investee’s bookvalue, which has been allocated to the fair value of net identified tangible and finite-lived intangible assets andamortized over the estimated lives of those assets.
Revenues
Coal Related Revenues. Coal related revenues consist primarily of royalties as well as transportation andprocessing fees. Royalty revenues are recognized on the basis of tons of mineral sold by our lessees and thecorresponding revenue from those sales. Generally, the lessees make payments to us based on the greater of apercentage of the gross sales price or a fixed price per ton of mineral they sell. Processing fees are recognized onthe basis of tons of material processed through the facilities by our lessees and the corresponding revenue fromthose sales. Generally, the lessees of the processing facilities make payments to us based on the greater of apercentage of the gross sales price or a fixed price per ton of material that is processed and sold from thefacilities. The processing leases are structured in a manner so that the lessees are responsible for operating andmaintenance expenses associated with the facilities. Transportation fees are recognized on the basis of tons ofmaterial transported over the beltlines. Under the terms of the transportation contracts, we receive a fixed priceper ton for all material transported on the beltlines.
Oil and Gas Revenues. Oil and gas related revenues consist of revenues from our non-operated workinginterests, royalties and overriding royalties. Revenues related to our non-operated working interests in oil and gasassets are recognized on the basis of our net revenue interests in hydrocarbons produced. We also have capitalexpenditure and operating expenditure obligations associated with the non-operated working interests. Ourrevenues fluctuate based on changes in the market prices for oil and natural gas, the decline in production fromproducing wells, and other factors affecting the third-party oil and natural gas exploration and productioncompanies that operate our wells, including the cost of development and production. Oil and gas royalty revenuesare recognized on the basis of volume of hydrocarbons sold by lessees and the corresponding revenue from thosesales. Also, included within oil and gas royalties are lease bonus payments, which are generally paid upon theexecution of a lease.
Aggregates and Industrial Minerals Related Revenues. Aggregates and industrial minerals relatedrevenues consist primarily of revenues generated in VantaCore’s construction aggregates business, royalties andoverriding royalties. Revenues from the sale of aggregates, gravel, sand and asphalt are recorded based upon thetransfer of product at delivery to customers, which generally occurs at the quarries or asphalt plants. Aggregatesand industrial minerals royalty and overriding royalty revenues are recognized on the basis of tons of mineralsold by our lessees and the corresponding revenue from those sales. Generally, the lessees make payments to usbased on the greater of a percentage of the gross sales price or a fixed price per ton of mineral they sell.Revenues from long-term construction contracts are recognized on the percentage-of-completion method,measured by the percentage of total costs incurred to date to the estimated total costs for each contract. Thatmethod is used since we consider total cost to be the best available measure of progress on the contracts.Provisions for estimated losses on uncompleted contracts are made in the period in which such losses aredetermined. Changes in job performance, job conditions and estimated profitability, including those arising fromfinal contract settlements, which result in revisions to job costs and profits are recognized in the period in whichthe revisions are determined. Contract costs include all direct job costs and those indirect costs related to contractperformance, such as indirect labor, supplies, insurance, equipment maintenance and depreciation. General andadministrative costs are charged to expense as incurred.
Deferred Revenue
Most of our coal and aggregates lessees must make minimum annual or quarterly payments which aregenerally recoupable over certain time periods. These minimum payments are recorded as deferred revenue whenreceived. The deferred revenue attributable to the minimum payment is recognized as revenue when the lesseerecoups the minimum payment through production or in the period immediately following the expiration of thelessee’s ability to recoup the payments.
54

Lessee Audits and Inspections
We periodically audit lessee information by examining certain records and internal reports of our lessees.Our regional managers also perform periodic mine inspections to verify that the information that has beenreported to us is accurate. The audit and inspection processes are designed to identify material variances fromlease terms as well as differences between the information reported to us and the actual results from eachproperty. Audits and inspections, however, are in periods subsequent to when the revenue is reported and anyadjustment identified by these processes might be in a reporting period different from when the revenue wasinitially recorded. Typically there are no material adjustments from this process.
Share-Based Payment
We account for awards relating to our Long-Term Incentive Plan using the fair value method, whichrequires us to estimate the fair value of the grant, and charge or credit the estimated fair value to expense over theservice or vesting period of the grant based on fluctuations in our common unit price. In addition, estimatedforfeitures are included in the periodic computation of the fair value of the liability and the fair value isrecalculated at each reporting date over the service or vesting period of the grant.
Asset Impairment
We have developed procedures to periodically evaluate our long-lived assets for possible impairment. Theseprocedures are performed throughout the year and are based on historic, current and future performance and aredesigned to be early warning tests. If an asset fails one of the early warning tests, additional evaluation isperformed for that asset that considers both quantitative and qualitative information. A long-lived asset is deemedimpaired when the future expected undiscounted cash flows from its use and disposition is less than the assets’carrying value. Impairment is measured based on the estimated fair value, which is usually determined basedupon the present value of the projected future cash flow compared to the assets’ carrying value. In addition to theevaluations discussed above, specific events such as a reduction in economically recoverable reserves orproduction ceasing on a property for an extended period may require a separate impairment evaluation becompleted on a significant property. As a result of the continued weakness in the coal markets and the potentialfor further declines in oil and natural gas prices, we intend to closely monitor our coal and oil and gas assets, andthe impairment evaluation process may be completed more frequently if deemed necessary. Future impairmentanalyses could result in downward adjustments to the carrying value of our assets. During 2014, we recordedimpairment expense of $26.9 million on certain of our coal reserves, a preparation plant, intangible assets andaggregates properties. For further discussion relating to our 2014 impairments see “Note 7. Plant andEquipment,” “Note 8. Minerals Rights” and “Note 9. Intangible Assets” to the audited consolidated financialstatements included elsewhere in this Annual Report on Form 10-K
We evaluate our equity investments for impairment when events or changes in circumstances indicate, inmanagement’s judgment, that the carrying value of such investment may have experienced an other-than-temporary decline in value. When evidence of loss in value has occurred, management compares the estimatedfair value of the investment to the carrying value of the investment to determine whether impairment hasoccurred. If the estimated fair value is less than the carrying value and management considers the decline invalue to be other than temporary, the excess of the carrying value over the estimated fair value is recognized inthe financial statements as an impairment loss. The fair value of the impaired investment is based on quotedmarket prices, or upon the present value of expected cash flows using discount rates believed to be consistentwith those used by principal market participants, plus market analysis of comparable assets owned by theinvestee, if appropriate.
In accordance with FASB accounting and disclosure guidance for goodwill, we test our recorded goodwillfor impairment annually or more often if indicators of potential impairment exist, by determining if the carryingvalue of a reporting unit exceeds its estimated fair value. Factors that could trigger an interim impairment testinclude, but are not limited to, underperformance relative to historical or projected future operating results orsignificant changes in our overall business, industry, or economic trends.
55
Business Combinations
For purchase acquisitions accounted for as a business combination, we are required to record the assetsacquired, including identified intangible assets and liabilities assumed at their fair value, which in many instancesinvolves estimates based on third party valuations, such as appraisals, or internal valuations based on discountedcash flow analyses or other valuation techniques.
Recent Accounting Pronouncements
In May 2014, the FASB amended revenue recognition topics and created a new topic relating to revenuerecognition that will supersede existing guidance under U.S. GAAP. The core principle of the new guidance is torecognize revenue when promised goods or services are transferred to the customer and in an amount that reflectsthe consideration expected in exchange for those goods or services. To achieve this core principle, an entityshould (1) identify the contract(s) with the customer, (2) identify the performance obligations in the contract,(3) determine the transaction price, (4) allocate the transaction price to the performance obligations in thecontract and (5) recognize revenue when each performance obligation is satisfied. The guidance also specifies theaccounting for some costs to obtain or fulfill a contract with a customer. Disclosure requirements includesufficient qualitative and quantitative information to enable financial statement users to understand the nature,amount, timing and uncertainty of revenues and cash flows arising from contracts with customers. The new topicis effective for annual reporting periods beginning after December 15, 2016, including interim periods within thatreporting period. The guidance allows for either full adoption or a modified retrospective adoption. We arecurrently evaluating the requirements to determine the impact, if any, of this new topic on its financial position,results of operations and cash flows.
Other accounting standards that have been issued by the FASB or other standards-setting bodies are notexpected to have a material impact on the Partnership’s financial position, results of operations or cash flows.
Results of Operations
Year Ended December 31, 2014 Compared to Year Ended December 31, 2013
Adjusted EBITDA
Adjusted EBITDA declined 12% in 2014 to $300.3 million from $340.3 million generated in 2013. Thedecrease is mainly related to the special distribution of $44.8 million received in 2013 from OCI Wyoming aswell as lower coal related revenues offset by higher earnings from our investments in aggregates and oil and gas.Adjusted EBITDA is a non-GAAP financial measure. See “Item 6. Selected Financial Data—Non-GAAPFinancial Measures—Adjusted EBITDA” for an explanation of adjusted EBITDA and a reconciliation of thismeasure to net income.
Distributable Cash Flow
Distributable cash flow for 2014 decreased by $91.7 million, or 30%, from 2013 to $217.7 million. Thischange was due primarily to a $44.8 million special distribution received from OCI Wyoming in 2013, declinesin the coal business, and an additional $21.0 million of interest paid in 2014 that resulted in a $36.3 milliondecrease in net cash provided by operations relative to 2013 and also a $9.5 million difference in proceeds fromthe sale of assets. Distributable cash flow is a non-GAAP financial measure. See “Item 6. Selected FinancialData—Non-GAAP Financial Measures—Distributable Cash Flow” for an explanation of distributable cash flowand a reconciliation of this measure to net cash provided by operating activities.
56

Coal Related Revenues and Production
For the Years EndedDecember 31, Increase
(Decrease)Percentage
Change2014 2013
(In thousands, except percent and per ton data)(Unaudited)
Regional StatisticsCoal royalty production (tons)
Appalachia:Northern . . . . . . . . . . . . . . . . . . . . . . . . . . . . . . . . . . . . . . . . . . . . . 9,339 11,505 (2,166) (19)%Central . . . . . . . . . . . . . . . . . . . . . . . . . . . . . . . . . . . . . . . . . . . . . . . 20,092 20,801 (709) (3)%Southern . . . . . . . . . . . . . . . . . . . . . . . . . . . . . . . . . . . . . . . . . . . . . 3,914 4,151 (237) (6)%
Total Appalachia . . . . . . . . . . . . . . . . . . . . . . . . . . . . . . . . . . . . . . . . . 33,345 36,457 (3,112) (9)%Illinois Basin . . . . . . . . . . . . . . . . . . . . . . . . . . . . . . . . . . . . . . . . . . . . 13,177 13,087 90 1%Northern Powder River Basin . . . . . . . . . . . . . . . . . . . . . . . . . . . . . . . 2,844 2,778 66 2%Gulf Coast . . . . . . . . . . . . . . . . . . . . . . . . . . . . . . . . . . . . . . . . . . . . . . 1,093 970 123 13%
Total . . . . . . . . . . . . . . . . . . . . . . . . . . . . . . . . . . . . . . . . . . . . . . . . 50,459 53,292 (2,833) (5)%
Average coal royalty revenue per tonAppalachia:
Northern . . . . . . . . . . . . . . . . . . . . . . . . . . . . . . . . . . . . . . . . . . . . . $ 0.92 $ 1.27 $ (0.35) (27)%Central . . . . . . . . . . . . . . . . . . . . . . . . . . . . . . . . . . . . . . . . . . . . . . . 4.46 5.05 (0.59) (12)%Southern . . . . . . . . . . . . . . . . . . . . . . . . . . . . . . . . . . . . . . . . . . . . . 5.18 6.30 (1.12) (18)%
Total Appalachia . . . . . . . . . . . . . . . . . . . . . . . . . . . . . . . . . . . . . . . . . 3.55 4.00 (0.44) (11)%Illinois Basin . . . . . . . . . . . . . . . . . . . . . . . . . . . . . . . . . . . . . . . . . . . . 4.10 4.28 (0.18) (4)%Northern Powder River Basin . . . . . . . . . . . . . . . . . . . . . . . . . . . . . . . 2.74 2.72 0.02 1%Gulf Coast . . . . . . . . . . . . . . . . . . . . . . . . . . . . . . . . . . . . . . . . . . . . . . 3.47 3.39 0.08 2%Combined average gross royalty per ton . . . . . . . . . . . . . . . . . . . . . . . $ 3.65 $ 3.99 $ (0.34) (9)%
Coal royalty revenuesAppalachia:
Northern . . . . . . . . . . . . . . . . . . . . . . . . . . . . . . . . . . . . . . . . . . . . . $ 8,621 $ 14,643 $ (6,022) (41)%Central . . . . . . . . . . . . . . . . . . . . . . . . . . . . . . . . . . . . . . . . . . . . . . . 89,627 105,004 (15,377) (15)%Southern . . . . . . . . . . . . . . . . . . . . . . . . . . . . . . . . . . . . . . . . . . . . . 20,292 26,156 (5,864) (22)%
Total Appalachia . . . . . . . . . . . . . . . . . . . . . . . . . . . . . . . . . . . . . . . . . 118,540 145,803 (27,263) (19)%Illinois Basin . . . . . . . . . . . . . . . . . . . . . . . . . . . . . . . . . . . . . . . . . . . . 54,049 56,001 (1,952) (3)%Northern Powder River Basin . . . . . . . . . . . . . . . . . . . . . . . . . . . . . . . 7,804 7,569 235 3%Gulf Coast . . . . . . . . . . . . . . . . . . . . . . . . . . . . . . . . . . . . . . . . . . . . . . 3,793 3,290 503 15%
Total . . . . . . . . . . . . . . . . . . . . . . . . . . . . . . . . . . . . . . . . . . . . . . . . $184,186 $212,663 $(28,477) (13)%
Other coal related revenuesOverride revenue . . . . . . . . . . . . . . . . . . . . . . . . . . . . . . . . . . . . . . . . . $ 4,601 $ 10,372 $ (5,771) (56)%Transportation and processing fees . . . . . . . . . . . . . . . . . . . . . . . . . . . 22,048 22,519 (471) (2)%Minimums recognized as revenue . . . . . . . . . . . . . . . . . . . . . . . . . . . . 6,659 6,528 131 2%Condemnation payment . . . . . . . . . . . . . . . . . . . . . . . . . . . . . . . . . . . — 10,370 (10,370) 100%Coal bonus payment . . . . . . . . . . . . . . . . . . . . . . . . . . . . . . . . . . . . . . 98 — 98 100%Reserve swap . . . . . . . . . . . . . . . . . . . . . . . . . . . . . . . . . . . . . . . . . . . . 5,690 8,149 (2,459) (30)%Wheelage . . . . . . . . . . . . . . . . . . . . . . . . . . . . . . . . . . . . . . . . . . . . . . . 3,442 3,593 (151) (4)%
Total . . . . . . . . . . . . . . . . . . . . . . . . . . . . . . . . . . . . . . . . . . . . . . . . $ 42,538 $ 61,531 $(18,993) (31)%
Total coal related revenues . . . . . . . . . . . . . . . . . . . . . . . . . . . . . . . . . $226,724 $274,194 $(47,470) (17)%
57

Total coal related revenues. Total coal related revenues comprised approximately 57% and 77% of ourtotal revenues and other income for the years ended December 31, 2014 and 2013, respectively. The following isa discussion of the major categories of coal related revenue:
Coal royalty revenues and production. Coal royalty revenues comprised approximately 46% and 59% ofour total revenues and other income for the years ended December 2014 and 2013, respectively. The following isa discussion of the coal royalty revenues and production derived from our major coal producing regions:
Appalachia. Coal royalty revenues decreased $27.3 million or 19% for the year ended December 31, 2014compared to the same period of 2013, while production decreased 3.1 million tons or 9%.
Production from our properties in the Central Appalachian region decreased by 3%. This decrease wasprimarily due to a greater proportion of mining on adjacent property and some lessees temporarily idlingproduction on our property. In addition, pricing realized by our lessees for both thermal and metallurgical coal inCentral Appalachia is generally below the levels received in the same period in 2013, causing a larger percentagedecrease in coal royalty revenues compared to the decrease in production.
The Southern Appalachian region also had decreased production and coal royalty revenues. This was due toa new lessee being slower in building its production after succeeding a former lessee and one lessee temporarilyidling a mining unit on our property. In general our lessees received lower sales prices for both thermal andmetallurgical coal causing a larger percentage decrease in coal royalty revenue compared to the decrease inproduction.
With respect to Northern Appalachia, for the year ended December 31, 2014 there was a decrease in coalroyalty revenues and production. These decreases were primarily due to the net effect of two longwall mines havinga greater proportion of their production on adjacent property in 2014 in the normal course of its mining plan.
Illinois Basin. Coal royalty revenues for the year ended December 31, 2014 decreased 3% whencompared to the same period in 2013, while production was nearly constant. The Williamson mine in Illinois hadlower production as did one of our properties in Indiana. These decreases were offset by higher production at theHillsboro mine and the Macoupin mine where an additional mining unit was added. We also received increasedrevenue from a coal reserve acquisition completed in June 2014.
Northern Powder River Basin. Coal royalty revenues and production on our Western Energy propertywere about the same for the year ended December 31, 2014 when compared to 2013.
Gulf Coast. Coal royalty revenues and production slightly increased for the year ended December 31, 2014compared to the same period in 2013, due to one lessee having a greater proportion of mining on our property.
Other coal related revenues. Other coal related revenues for the year ended December 31, 2014 decreased31% compared to the same period in 2013. The following is a discussion of the revenues derived from each ofthe major sources of other coal-related revenue:
Override revenues for the year ended December 31, 2014 decreased by 56% compared to the same period in2013 primarily due to one lessee moving its mining operations from an area on which we receive an overridingroyalty onto property on which we receive coal royalty revenues, another lessee exhausting the reserves subjectto the override and other lessees mining less on the area subject to our overriding royalty.
Transportation and processing fees decreased by $0.5 million or 2%, for the year ended December 31, 2014,when compared to the same period in 2013. The decrease is primarily due to the temporary idling of twoprocessing facilities in response to market conditions which was partially offset by increased tonnage put throughour Macoupin facilities.
Minimums recognized as revenue were about the same for both years.
During the year ended December 31, 2014 we also recognized revenue of $5.7 million related to a reserveswap completed in the third quarter. During 2013 we recognized $8.1 million on a similar swap. In addition,2013 included a condemnation payment of $10.4 million.
58

Wheelage revenue decreased by 4% for the year ended December 31, 2014 compared to the same period in2013. This increase was due to the normal fluctuations of tonnage that are subject to wheelage charges.
Aggregates and Industrial Minerals Revenues, and Other Related Income
For the Years EndedDecember 31, Increase
(Decrease)Percentage
Change2014 2013
(In thousands, except percent and per ton data)(Unaudited)
VantaCore:Tonnage sold . . . . . . . . . . . . . . . . . . . . . . . . . . . . . . . . . . . . . . . . . . 2,295 N/A N/A N/A
Revenues . . . . . . . . . . . . . . . . . . . . . . . . . . . . . . . . . . . . . . . . . . . . . $42,051 N/A N/A N/A
Operating expenses . . . . . . . . . . . . . . . . . . . . . . . . . . . . . . . . . . . . . $32,309 N/A N/A N/A
Royalty revenues . . . . . . . . . . . . . . . . . . . . . . . . . . . . . . . . . . . . . . . . $12,073 $13,479 $ (1,406) (10)%
Total aggregates and industrial minerals related revenues . . . . . . $54,124 $13,479 $ 40,645 302%
Soda ash revenues and distributions:Equity and other unconsolidated investment earnings . . . . . . . . . . . . $41,416 $34,186 $ 7,230 21%
Cash distributions received from OCI Wyoming . . . . . . . . . . . . . . . . $46,638 $72,946 $(26,308) (36)%
Total aggregates and industrial minerals revenues, and other related income. Total aggregates relatedrevenues, and other related income represented approximately 24% and 13% of our total revenues and otherincome for both periods ended December 31, 2014 and 2013, respectively. The following is a discussion of themajor categories of these revenues:
VantaCore operating revenues contributed $42.1 million. We acquired VantaCore on October 1, 2014.
Aggregates and industrial minerals related revenues decreased 10% for 2014. This decrease is primarily dueto one of our lessees moving from property on which we receive royalty revenue to property on which we receiveoverriding royalty revenue and another lessee temporarily idling its operation in early 2014. This decrease wasoffset by an increase in override revenues of approximately $2.0 million in our overriding royalty revenues fromfrac sand properties, the remaining increase is due to override revenues increasing on our Washington aggregatesproperty due to a lessee moving from our owned property to an area subject to an override.
Equity and other unconsolidated investment earnings. Income from our investment in the OCI Wyomingtrona mining and soda ash production business was $41.4 million for the year ended December 31, 2014, and wereceived $46.6 million in cash distributions during the year. For the same period in 2013, we recorded equityincome of $34.2 million and received $72.9 million in cash, which included a one-time special distribution of$44.8 million. The increase in equity income of 21% over 2013 is due to improved earnings from OCI Wyomingin 2014 over 2013.
59

Oil and Gas Revenues
For the Years EndedDecember 31, Increase
(Decrease)Percentage
Change2014 2013
(Dollars in thousands, except per unit data)(Unaudited)
Williston Basin non-operated working interests:
Production volumes:
Oil (MBbl) . . . . . . . . . . . . . . . . . . . . . . . . . . . . . . . . . . . . . . . . . . . . 578 N/A N/A N/A
Natural gas (Mcf) . . . . . . . . . . . . . . . . . . . . . . . . . . . . . . . . . . . . . . . 408 N/A N/A N/A
NGL (MBoe) . . . . . . . . . . . . . . . . . . . . . . . . . . . . . . . . . . . . . . . . . . 53 N/A N/A N/A
Average sales price per unit:
Oil (Bbl) . . . . . . . . . . . . . . . . . . . . . . . . . . . . . . . . . . . . . . . . . . . . . . $ 77.85 N/A N/A N/A
Natural gas (Mcf) . . . . . . . . . . . . . . . . . . . . . . . . . . . . . . . . . . . . . . . $ 5.04 N/A N/A N/A
NGL (Boe) . . . . . . . . . . . . . . . . . . . . . . . . . . . . . . . . . . . . . . . . . . . . $ 33.64 N/A N/A N/A
Revenues:
Oil . . . . . . . . . . . . . . . . . . . . . . . . . . . . . . . . . . . . . . . . . . . . . . . . . . $44,995 N/A N/A N/A
Natural gas . . . . . . . . . . . . . . . . . . . . . . . . . . . . . . . . . . . . . . . . . . . . 2,056 N/A N/A N/A
NGL . . . . . . . . . . . . . . . . . . . . . . . . . . . . . . . . . . . . . . . . . . . . . . . . . 1,783 N/A N/A N/A
Total . . . . . . . . . . . . . . . . . . . . . . . . . . . . . . . . . . . . . . . . . . . . . . . $48,834 N/A N/A N/A
Other oil and gas revenues:
Royalty and overriding royalty revenues . . . . . . . . . . . . . . . . . . . . . 10,732 N/A N/A N/A
Total oil and gas revenues . . . . . . . . . . . . . . . . . . . . . . . . . . . . . . . . $59,566 $17,080 $42,486 249%
Oil and gas revenues increased $42 million for the year ended December 31, 2014 when compared to theyear ended December 31, 2013. The increase in revenues is due to a full year of revenues from our non-operatedworking interests in the Williston Basin that were acquired the second half of 2013. In addition, our 2014 resultsinclude revenues attributable to our Sanish Field properties acquired on November 12, 2014.
Our average oil price received from our Williston Basin properties for the year ended December 31, 2014was $77.85.
Due to the decline in oil prices in the fourth quarter of 2014, our average price for the fourth quarterdecreased to $63.17 which represents an 18.9% reduction as compared to full year.
Year Ended December 31, 2013 Compared to Year Ended December 31, 2012
Adjusted EBITDA
Adjusted EBITDA increased 4% to $340.3 million mainly due to our investment in OCI Wyoming thatgenerated $72.9 million that more than offset the significant declines of $69.2 million that we saw from our coalrelated revenues. Adjusted EBITDA is a non-GAAP financial measure. See “Item 6. Selected Financial Data—Non-GAAP Financial Measures—Adjusted EBITDA” for an explanation of adjusted EBITDA and areconciliation of this measure to net income.
Distributable Cash Flow
Distributable cash flow increased by $10.5 million, or 4%, to $309.4 million mainly due to distributions of $72.9million from OCI Wyoming in 2013, offset by lower cash flows from coal related assets and proceeds from the sale ofa preparation plant in 2012 of $4.7 million. Distributable cash flow is a non-GAAP financial measure. See “Item 6.Selected Financial Data—Non-GAAP Financial Measures—Distributable Cash Flow” for an explanation ofdistributable cash flow and a reconciliation of this measure to net cash provided by operating activities.
60

Coal Related Revenues and Production
For the Years EndedDecember 31, Increase
(Decrease)Percentage
Change2013 2012
(In thousands, except percent and per ton data)(Unaudited)
Regional StatisticsCoal royalty production (tons)
AppalachiaNorthern . . . . . . . . . . . . . . . . . . . . . . . . . . . . . . . . . . . . . . . . . . . . . 11,505 10,486 1,019 10%Central . . . . . . . . . . . . . . . . . . . . . . . . . . . . . . . . . . . . . . . . . . . . . . . 20,801 26,098 (5,297) (20)%Southern . . . . . . . . . . . . . . . . . . . . . . . . . . . . . . . . . . . . . . . . . . . . . 4,151 3,718 433 12%
Total Appalachia . . . . . . . . . . . . . . . . . . . . . . . . . . . . . . . . . . . . . . . . . 36,457 40,302 (3,845) (10)%Illinois Basin . . . . . . . . . . . . . . . . . . . . . . . . . . . . . . . . . . . . . . . . . . . . 13,087 11,299 1,788 16%Northern Powder River Basin . . . . . . . . . . . . . . . . . . . . . . . . . . . . . . . 2,778 2,377 401 17%Gulf Coast . . . . . . . . . . . . . . . . . . . . . . . . . . . . . . . . . . . . . . . . . . . . . . 970 466 504 108%
Total . . . . . . . . . . . . . . . . . . . . . . . . . . . . . . . . . . . . . . . . . . . . . . . . 53,292 54,444 (1,152) (2)%
Average coal royalty revenue per tonAppalachia
Northern . . . . . . . . . . . . . . . . . . . . . . . . . . . . . . . . . . . . . . . . . . . . . $ 1.27 $ 1.50 $ (.23) (15%)Central . . . . . . . . . . . . . . . . . . . . . . . . . . . . . . . . . . . . . . . . . . . . . . . 5.05 5.99 (.94) (16%)Southern . . . . . . . . . . . . . . . . . . . . . . . . . . . . . . . . . . . . . . . . . . . . . 6.30 7.89 (1.59) (20%)
Total Appalachia . . . . . . . . . . . . . . . . . . . . . . . . . . . . . . . . . . . . . . . . . 4.00 5.00 (1.00) (20)%Illinois Basin . . . . . . . . . . . . . . . . . . . . . . . . . . . . . . . . . . . . . . . . . . . . 4.28 4.38 (.10) (2)%Northern Powder River Basin . . . . . . . . . . . . . . . . . . . . . . . . . . . . . . . 2.72 3.58 (.86) (24)%Gulf Coast . . . . . . . . . . . . . . . . . . . . . . . . . . . . . . . . . . . . . . . . . . . . . . 3.39 2.60 .79 30%Combined average gross royalty per ton . . . . . . . . . . . . . . . . . . . . . . . $ 3.99 $ 4.79 (.80) (17)%
Coal royalty revenuesAppalachia
Northern . . . . . . . . . . . . . . . . . . . . . . . . . . . . . . . . . . . . . . . . . . . . . $ 14,643 $ 15,768 $ (1,125) (7)%Central . . . . . . . . . . . . . . . . . . . . . . . . . . . . . . . . . . . . . . . . . . . . . . . 105,004 156,390 (51,386) (33)%Southern . . . . . . . . . . . . . . . . . . . . . . . . . . . . . . . . . . . . . . . . . . . . . 26,156 29,325 (3,169) (11)%
Total Appalachia . . . . . . . . . . . . . . . . . . . . . . . . . . . . . . . . . . . . . . . . . 145,803 201,483 (55,680) (28)%Illinois Basin . . . . . . . . . . . . . . . . . . . . . . . . . . . . . . . . . . . . . . . . . . . . 56,001 49,538 6,463 13%Northern Powder River Basin . . . . . . . . . . . . . . . . . . . . . . . . . . . . . . . 7,569 8,501 (932) (11)%Gulf Coast . . . . . . . . . . . . . . . . . . . . . . . . . . . . . . . . . . . . . . . . . . . . . . 3,290 1,212 2,078 171%
Total . . . . . . . . . . . . . . . . . . . . . . . . . . . . . . . . . . . . . . . . . . . . . . . . $212,663 $260,734 $(48,071) (18)%
Other coal related revenuesOverride revenue . . . . . . . . . . . . . . . . . . . . . . . . . . . . . . . . . . . . . . . . . $ 10,372 $ 13,979 $ (3,607) (26)%Transportation and processing fees . . . . . . . . . . . . . . . . . . . . . . . . . . . 22,519 27,354 (4,835) (18)%Minimums recognized as revenue . . . . . . . . . . . . . . . . . . . . . . . . . . . . 6,528 23,029 (16,501) (72)%Condemnation payments . . . . . . . . . . . . . . . . . . . . . . . . . . . . . . . . . . . 10,370 8,463 1,907 23%Gain on Sale of Assets . . . . . . . . . . . . . . . . . . . . . . . . . . . . . . . . . . . . — 4,715 (4,715) (100)%Reserve swap . . . . . . . . . . . . . . . . . . . . . . . . . . . . . . . . . . . . . . . . . . . . 8,149 — 8,149 100%Wheelage . . . . . . . . . . . . . . . . . . . . . . . . . . . . . . . . . . . . . . . . . . . . . . . 3,593 5,078 (1,485) (29)%
Total . . . . . . . . . . . . . . . . . . . . . . . . . . . . . . . . . . . . . . . . . . . . . . . . $ 61,531 $ 82,618 $(21,087) (26)%
Total coal related revenues . . . . . . . . . . . . . . . . . . . . . . . . . . . . . . . . . $274,194 $343,352 $(69,158) (20)%
61

Total coal related revenues. Total coal related revenues comprised approximately 77% and 91% of ourtotal revenues and other income for the years ended December 31, 2013 and 2012, respectively. The following isa discussion of the major categories of coal related revenue:
Coal royalty revenues and production. Coal royalty revenues comprised approximately 59% and 69% ofour total revenues and other income for the year ended December 31, 2013 and 2012, respectively. The followingis a discussion of the coal royalty revenues and production derived from our major coal producing regions:
Appalachia. Coal royalty revenues decreased $55.7 million or 28% for the year ended December 31, 2013compared to the same period of 2012, while production decreased 3.8 million tons or 10%.
Production from our properties in the Central Appalachian region declined by 20% due to a combination ofthe idling of mining units or mines, lower sales volumes from mines on our property and some mining unitsmoving off of our property to adjacent properties in the normal course of their mine plans. In addition, pricingrealized by our lessees for both thermal and metallurgical coal in Central Appalachia is generally below thelevels of the same period in 2012, causing a higher percentage decrease in coal royalty revenues compared to thedecrease in production.
The Southern Appalachian region also had increased production but decreased coal royalty revenues. Theincreased production was due to one of our lessees having more normal production for 2013 after a slower startin 2012 after making repairs to its preparation plant that was damaged by a tornado in 2011. In addition pricesfrom the metallurgical sales from our properties were lower than the same period in 2012, which contributed tothe decrease in coal royalty revenue.
With respect to Northern Appalachia, during the year ended December 31, 2013 there was also a decrease incoal royalty revenue while we had an increase in production of 1.0 million tons or 10%. The increase in tonnagewas due to some lessees having a higher proportion of production on our properties. Those increases weregenerally from leases with lower revenue per ton which caused the decrease in coal royalty revenue.
Illinois Basin. Coal royalty revenues for the year ended December 31, 2013 increased $6.5 million or13% when compared to the same period in 2012, and production increased by 1.8 million tons, or 16%. Theincreased production was primarily due to production from the Hillsboro mine which operated its longwall forthe entire year of 2013 after starting operation in 2012. This increase in production was partially offset by lowerproduction from the Williamson mine and lower production from the Macoupin mine which idled one of itsproducing units in early 2013.
Northern Powder River Basin. Coal royalty revenues decreased on our Western Energy property despitehaving higher production in 2013. The higher production was due to the normal variations in production thatoccur on our checkerboard ownership. The lower coal royalty revenue was due to the timing of revenuerecognition by the lessee in the third quarter of 2012 that did not occur in 2013.
Gulf Coast. Coal royalty revenue and production for the year ended December 31, 2013 increasedcompared to the same period in 2012 due to a mine having a greater proportion of production on our property in2013.
Other coal related revenues. Other coal related revenues for the year ended December 31, 2013 decreased26% compared to the same period in 2012. The following is a discussion of the revenues derived from each ofthe major sources of other coal-related revenue:
Override revenue for the year ended December 31, 2013 decreased by 26% compared to the same period in2012 due to one lessee moving its mining operations from an area on which we receive an overriding royaltyonto property on which we receive coal royalty revenue, one lessee exhausting the reserves subject to theoverride and other lessees mining fewer tons on properties on which we receive an overriding royalty.
Transportation and processing fees decreased 18% for the year ended December 31, 2013, when comparedto the same period in 2012. The decrease in revenue was due to lower tonnage put through our all our facilitiesexcept Sugar Camp and the sale of one of our processing facilities.
62

Minimums recognized as revenue decreased $16.5 million or 72% for the year ended December 31, 2013when compared to the same period in 2012, primarily due to two lessees having significant previously paidminimums losing the ability to recoup them during 2012 that did not occur in 2013.
We recorded a reserve swap for the year ended December 31, 2013 of $8.1 million on our Illinois property.No swap occurred during 2012.
Wheelage revenue decreased by 29% for the year ended December 31, 2013 compared to the same period in2012. This decrease was due to the normal fluctuations of tonnage that are subject to wheelage charges.
Aggregates and Industrial Minerals Revenues, and Other Related Income
For the Years EndedDecember 31, Increase
(Decrease)Percentage
Change2013 2012
(In thousands, except percent and per ton data)(Unaudited)
Aggregates and industrial minerals related revenues . . . . . . . . . . . $13,479 $9,524 $3,955 42%
Soda ash revenues and distributions:Equity and other unconsolidated investment earnings . . . . . . . . . . . $34,186 N/A N/A N/A
Cash distributions received from OCI Wyoming . . . . . . . . . . . . . . . $72,946 N/A N/A N/A
Total aggregates and industrial minerals revenues, and other related income. Total aggregates andindustrial minerals revenues, and other related income represented approximately 4% and 3% of our totalrevenues and other income for the year ended December 31, 2013 and 2012, respectively. The following is adiscussion of the major categories of these revenues:
Aggregates and industrial minerals related revenues were up $4.0 million or 42% compared to 2012 due toan increase of $1.2 million in minimums recognized as revenue during 2013. Override revenues also increased onour frac sand properties by $1.6 million during the year ended December 31, 2013. This override was acquiredduring the fourth quarter of 2012 and did not contribute until 2013.
Equity and other unconsolidated investment earnings. Income from our investment in the OCI Wyomingtrona mining and soda ash production business was $34.2 million for the year ended December 31, 2013 and wereceived $72.9 million in cash distributions which included a special distribution of $44.8 million during the yearended December 31, 2013. We did not own this interest until January 2013.
Oil and Gas Revenues
Oil and gas revenues increased $7.5 million for the year ended December 31, 2013 when compared to thesame period in 2012. The increase is primarily due to revenues from our Williston Basin non-operated workinginterest properties which were acquired during the second half of 2013.
Other Operating Results
Other Revenues. In addition to coal related revenues, aggregates and industrial minerals revenues and oiland gas revenues, we generated approximately 1% of our total revenues and other income from other sources forthe years ended December 31, 2014 and 2013 and less than 1% for 2012. Other sources of revenues primarilyinclude: rentals, metal revenue and timber royalties.
Operating expenses. Included in total expenses are:
• Depreciation, depletion and amortization of $79.9 million, $64.4 million and $58.2 million for the yearsended December 31, 2014, 2013 and 2012, respectively. The increase in 2014 over 2013 is due to a fullyear depletion on oil and gas acquisitions acquired in the fourth quarter of 2013 as well as depletion on theKaiser Francis oil and gas acquisition acquired during the second half of 2014. Also contributing to theincrease in depreciation, depletion and amortization is the added expense associated with the acquisition
63

of VantaCore in the fourth quarter of 2014. The increase in 2013 over 2012 is primarily due to increasedoil and gas depletion and higher coal depletion due to the reserve swap that occurred in 2013 being at ahigher per ton rate.
• General and administrative expenses of $36.4 million, $36.8 million and $29.7 million for the years endedDecember 31, 2014, 2013 and 2012, respectively. General and administrative expenses are primarilyimpacted by accruals under our long-term incentive plan attributable to fluctuations in our unit price andadditional personnel required to manage our properties. In 2014, we recorded additional expenses incurredfor the VantaCore and Kaiser Francis acquisitions, these costs were partially offset by lower accruals forour long term incentive plan due to a drop in the unit price. In 2013, we recorded increases in both longterm incentive plan accruals and additional personnel over the two previous years.
• Property, franchise and other taxes of $21.3 million, $16.5 million and $17.7 million for the years endedDecember 31, 2014, 2013 and 2012, respectively. The increase in property, franchise and other taxesreflects the inclusion of severance tax from our oil and gas properties acquired in late 2013 and 2014. Asubstantial portion of our property taxes in our coal and aggregates royalty business is reimbursed to us byour lessees and is reflected as property tax revenue on our consolidated statements of comprehensiveincome.
Interest Expense. Interest expense was $80.2 million, $64.4 million and $54.0 million for the years endedDecember 31, 2014, 2013 and 2012, respectively. Interest increased due to additional debt incurred in 2014 and2013 to fund acquisitions as well as a refinancing of our credit facility and payment on our term loan with9.125% high yield notes.
Liquidity and Capital Resources
Liquidity and Financing Activities
As of December 31, 2014, we had $100 million in available borrowing capacity under Opco’s revolvingcredit facility and $27 million of available borrowing capacity under the NRP Oil and Gas revolving creditfacility. In addition to the amounts available under our revolving credit facilities, we had $50.1 million in cash atDecember 31, 2014. Generally, we satisfy our working capital requirements with cash generated from operations.We finance our acquisitions with available cash, borrowings under our revolving credit facilities, and theissuance of debt securities and common units. We typically access the capital markets to refinance amountsoutstanding under our revolving credit facilities as we approach the limits under those facilities. Our currentliabilities exceeded our current assets by approximately $11.8 million as of December 31, 2014, because we usedcash to repay the principal on Opco’s notes rather than refinancing the amounts due.
As of December 31, 2014, we were in compliance with all of our debt covenant ratios. Opco’s revolvingcredit facility and term loan facility both mature during 2016. In addition, we are required to make approximately$81 million of principal payments in connection with Opco’s senior notes each year through 2018. We also have$425 million principal amount of 9.125% senior notes issued by NRP and NRP Finance, as co-issurers, thatmature in 2018. In addition, we will be required to repay or refinance the amounts outstanding under Opco’scredit facilities prior to their maturity. While we believe we will be able to refinance these amounts, we may notbe able to do so on terms acceptable to us, if at all, or the borrowing capacity under Opco’s revolving creditfacility may be substantially reduced. Our ability to comply with the financial and other restrictive covenants inour debt agreements will be affected by the levels of cash flow from our operations and future events andcircumstances beyond our control. In addition, our ability to refinance our debt may depend in part or our abilityto access the debt or equity capital markets, which will be challenging in the current market environment. For amore complete discussion of factors that will affect our liquidity, see “Item 1A. Risk Factors—Risks Related toOur Business.”
During 2014, we engaged in several financing transactions in connection with our two major acquisitions.We funded the purchase price of VantaCore through the borrowing of $169.0 million under Opco’s revolvingcredit facility and the issuance of 2,427,503 common units to certain of the sellers. We funded the $339 millionpurchase price of the Sanish Field acquisition using a combination of the net proceeds of $100.4 million
64

(including our general partner’s proportionate capital contribution to maintain its 2% general partner interest inus) from a public offering of 8,500,000 common units at a public offering price of $12.02 per common unit, thenet proceeds of $122.6 million from a private offering of an additional $125 million principal amount of our9.125% Senior Notes due 2018 at an offering price of 99.5%, and borrowings of $117.0 million under theamended NRP Oil and Gas revolving credit facility. Also during 2014, we sold 1,559,914 common units inconnection with our “at-the-market” offering program at an average price of $16.05 per common unit forapproximately $25.2 million in net proceeds, including our general partner’s proportionate capital contribution inorder to maintain its 2% general partner interest in us. We used the net proceeds from these sales for generalpartnership purposes, including the repayment of principal due on Opco’s senior notes.
Capital Expenditures
Our capital expenditures, other than for acquisitions, have historically been minimal. However, as a result ofour Sanish Field oil and gas and VantaCore aggregates acquisitions in the fourth quarter of 2014, we anticipatehigher operating capital expenditures in 2015. A portion of the capital expenditures associated with both our oiland gas working interest business and VantaCore are maintenance capital expenditures, which are capitalexpenditures made to maintain the long-term production capacity of those businesses. These maintenance capitalexpenditures reduce our cash available for distribution to our unitholders. We finance the capital expendituresassociated with our Williston Basin non-operated working interest oil and gas assets through a combination ofcash flow from operations and borrowings under the NRP Oil and Gas revolving credit facility and are able tocontrol the level of these capital expenditures by evaluating well proposals on a well-by-well basis. We willcontinue to monitor the development programs of the operators of these properties and manage the capitalexpenditures associated with those properties by only participating in wells that are expected to provideacceptable economic returns. The capital expenditures in connection with VantaCore’s construction aggregatesmining and production operations are generally funded through cash flow from operations.
Cash Flows
Net cash provided by operating activities for the years ended December 31, 2014, 2013 and 2012 was$210.8 million, $247.1 million and $271.4 million, respectively. The majority of our cash provided by operationsis generated from coal royalty revenues, our equity interest in OCI Wyoming and beginning in 2014, oil and gasrevenues.
Net cash used in investing activities for the years ended December 31, 2014, 2013 and 2012 was $520.5million, $302.8 million and $212.7 million, respectively. Our 2014 investing activities consisted of our SanishField oil and gas and VantaCore acquisitions, the $5.0 million Illinois Basin coal acquisition completed in June2014, as well as additional capital expenditures related to the participation in new wells in connection with ourWilliston Basin non-operated oil and gas working interest properties. Our 2013 investing activities consisted ofthe acquisitions of the interest in OCI Wyoming and two acquisitions of non-operated working interests in oiland gas properties located in the Williston Basin of North Dakota and Montana. During 2012, the majority of ourinvesting activities consisted of acquiring reserves, plant and equipment and related intangibles as well as assetsrelating to Sugar Camp. These uses in 2012 were slightly offset by $24.8 million in proceeds from asset sales.
Net cash flows provided by financing activities for the year ended December 31, 2014 were $267.3 million.Net cash flows used in financing activities for the years ended December 31, 2013 and 2012 were $1.2 millionand $124.2 million, respectively. During 2014, 2013 and 2012 we had proceeds from loans of $637.4 million,$567.0 million and $148.0 million, respectively. During 2014, 2013 and 2012, these proceeds were offset byrepayment of debt of $328.0 million, $386.2 million and $30.8 million, respectively. Also during 2014, 2013 and2012 we paid cash distributions to our unitholders of $162.0 million, $246.5 million and $238.0 million,respectively. During 2014, we had net proceeds from an issuance of common units of $122.8 million, togetherwith a capital contribution from our general partner of $3.2 million. During 2013, we had net proceeds from anissuance of common units of $74.7 million, together with a capital contribution from our general partner of $1.5million.
65

Contractual Obligations and Commercial Commitments
NRP Debt
Senior Notes. In September 2013, NRP and NRP Finance, as co-issuers, completed a private offering of$300 million principal amount of 9.125% Senior Notes due 2018 at an offering price of 99.007% of par. Thenotes were offered and sold to qualified institutional buyers pursuant to Rule 144A under the Securities Act of1933, as amended, and to persons outside the United States pursuant to Regulation S under the Securities Act.The notes were issued pursuant to an indenture, dated September 18, 2013, among NRP, NRP FinanceCorporation and Wells Fargo Bank, National Association, as trustee. The notes bear interest at a rate of9.125% per year, payable semiannually in arrears on April 1 and October 1 of each year, beginning on April 1,2014. The notes will mature on October 1, 2018.
In October 2014, NRP and NRP Finance issued an additional $125 million in aggregate principal amount ofthe 9.125% Senior Notes due 2018 at an offering price of 99.5% of par. The notes were issued pursuant to theexisting indenture and constitute the same series of securities as the existing 9.125% Senior Notes due 2018issued in September 2013. In the offering, $105 million in aggregate principal amount of the notes were sold in aprivate offering to the initial purchasers thereof to be offered and sold to qualified institutional buyers pursuant toRule 144A under the Securities Act, and to persons outside the United States pursuant to Regulation S under theSecurities Act. The remaining $20 million in aggregate principal amount of the notes were sold in a separateprivate offering to Cline Trust Company, LLC.
The notes are the senior unsecured obligations of NRP and NRP Finance. The notes rank equal in right ofpayment to all existing and future senior unsecured debt of NRP and NRP Finance and senior in right of paymentto any subordinated debt of NRP and NRP Finance. The notes are effectively subordinated in right of payment toall future secured debt of NRP and NRP Finance to the extent of the value of the collateral securing suchindebtedness and will be structurally subordinated in right of payment to all existing and future debt and otherliabilities of NRP’s subsidiaries, including Opco’s revolving credit facility and term loan facility, each series ofOpco’s existing senior notes, and NRP Oil and Gas’s revolving credit facility. None of NRP’s subsidiariesguarantee the notes.
NRP and NRP Finance have the option to redeem the notes, in whole or in part, at any time on or afterApril 1, 2016, at the redemption prices (expressed as percentages of principal amount) of 106.844% for the six-month period beginning on April 1, 2016, 104.563% for the twelve-month period beginning on October 1, 2016and 100.000% beginning on October 1, 2017 and at any time thereafter, together with any accrued and unpaidinterest to the date of redemption. In addition, before April 1, 2016, NRP and NRP Finance may redeem all orany part of the notes at a redemption price equal to the sum of the principal amount thereof, plus a make wholepremium at the redemption date, plus accrued and unpaid interest, if any, to the redemption date. Furthermore,before April 1, 2016, NRP and NRP Finance may on any one or more occasions redeem up to 35% of theaggregate principal amount of the notes with the net proceeds of certain public or private equity offerings at aredemption price of 109.125% of the principal amount of notes, plus any accrued and unpaid interest, if any, tothe date of redemption, if at least 65% of the aggregate principal amount of the notes issued under the indentureremains outstanding immediately after such redemption and the redemption occurs within 180 days of the closingdate of such equity offering. In the event of a change of control, as defined in the indenture, the holders of thenotes may require NRP and NRP Finance to purchase their notes at a purchase price equal to 101% of theprincipal amount of the notes, plus accrued and unpaid interest, if any.
The indenture for the senior notes contains covenants that limit the ability of NRP and certain of itssubsidiaries to incur or guarantee additional indebtedness. Under the indenture, NRP and certain of itssubsidiaries generally are not permitted to incur additional indebtedness unless, on a consolidated basis, the fixedcharge coverage ratio (as defined in the indenture) is at least 2.0 to 1.0 for the four preceding full fiscal quarters.The ability of NRP and certain of its subsidiaries to incur additional indebtedness is further limited in the eventthe amount of indebtedness of NRP and its subsidiaries that is senior to NRP’s unsecured indebtedness exceedscertain thresholds. The indenture contains additional covenants that, among other things, limit NRP’s ability andthe ability of certain of its subsidiaries to declare or pay any dividend or distribution on, purchase or redeem units
66

or purchase or redeem subordinated debt; make investments; create certain liens; enter into agreements thatrestrict distributions or other payments from NRP’s restricted subsidiaries as defined in the indenture to NRP;sell assets; consolidate, merge or transfer all or substantially all of the assets of NRP and its restrictedsubsidiaries; engage in transactions with affiliates; create unrestricted subsidiaries; and enter into certain sale andleaseback transactions.
Opco Debt
As of the date of this filing, Opco’s debt consisted of:
• $200.0 million under the floating rate revolving credit facility, due August 2016;
• $75.0 million under the floating rate term loan, due January 2016;
• $18.5 million of 4.91% senior notes due 2018;
• $107.1 million of 8.38% senior notes due 2019;
• $46.2 million of 5.05% senior notes due 2020;
• $1.3 million of 5.31% utility local improvement obligation due 2021;
• $24.3 million of 5.55% senior notes due 2023;
• $67.5 million of 4.73% senior notes due 2023;
• $150.0 million of 5.82% senior notes due 2024;
• $45.5 million of 8.92% senior notes due 2024;
• $161.5 million of 5.03% senior notes due 2026; and
• $46.2 million of 5.18% senior notes due 2026.
Senior Notes. Opco issued the senior notes listed above under a note purchase agreement as supplementedfrom time to time. The senior notes are unsecured but are guaranteed by Opco’s subsidiaries. Opco may prepaythe senior notes at any time together with a make-whole amount (as defined in the note purchase agreement). Ifany event of default exists under the note purchase agreement, the noteholders will be able to accelerate thematurity of the senior notes and exercise other rights and remedies.
The senior note purchase agreement contains covenants requiring Opco to:
• Maintain a ratio of consolidated indebtedness to consolidated EBITDDA (as defined in the note purchaseagreement) of no more than 4.0 to 1.0 for the four most recent quarters;
• not permit debt secured by certain liens and debt of subsidiaries to exceed 10% of consolidated nettangible assets (as defined in the note purchase agreement); and
• maintain the ratio of consolidated EBITDDA to consolidated fixed charges (consisting of consolidatedinterest expense and consolidated operating lease expense) at not less than 3.5 to 1.0.
All of Opco’s senior notes require annual principal payments in addition to semi-annual interest payments.Opco also makes annual principal and interest payments on the utility local improvement obligation.
Revolving Credit Facility. As of the date of this report, Opco had $100 million in available borrowingcapacity under its $300 million revolving credit facility, which matures on August 9, 2016.
67

During 2014, Opco’s borrowings and repayments under its revolving credit facility were as follows:
Quarter Ending
March 31 June 30 September 30 December 31
(In thousands)
Outstanding balance, beginning of period . . . . . . $20,000 $20,000 $15,000 $ 7,000
Borrowings under credit facility . . . . . . . . . . . . . . — — — 394,000
Less: Repayments under credit facility . . . . . . . . — (5,000) (8,000) (201,000)
Outstanding balance, ending period . . . . . . . . . . . $20,000 $15,000 $ 7,000 $ 200,000
Opco’s obligations under its revolving credit facility are unsecured but are guaranteed by its subsidiaries.Opco may prepay all amounts outstanding under the credit facility at any time without penalty. Indebtednessunder Opco’s revolving credit facility bears interest, at our option, at either:
• the Alternate Base Rate (as defined in the credit agreement) plus an applicable margin ranging from 0% to1%; or
• the Adjusted LIBO Rate (as defined in the credit agreement) plus an applicable margin ranging from1.00% to 2.25%.
Opco incurs a commitment fee on the unused portion of the revolving credit facility at a rate ranging from0.18% to 0.40% per annum.
The Opco revolving credit facility contains covenants requiring Opco to maintain:
• a ratio of consolidated indebtedness to consolidated EBITDDA (as defined in the credit agreement) not toexceed 4.0 to 1.0; and
• a ratio of consolidated EBITDDA to consolidated fixed charges (consisting of consolidated interestexpense and consolidated lease operating expense) not less than 3.5 to 1.0.
Under an accordion feature in the credit facility, Opco may request its lenders to increase their aggregatecommitment to a maximum of $500 million on the same terms. However, Opco cannot be certain that its lenderswill elect to participate in the accordion feature. To the extent the lenders decline to participate, Opco may electto bring new lenders into the facility, but cannot make any assurance that the additional credit capacity will beavailable on existing or comparable terms.
Term Loan. In connection with the OCI Wyoming soda ash business acquisition in January 2013, Opcoentered into a 3-year, $200 million term loan facility. The term loan facility is guaranteed by Opco’s operatingsubsidiaries and bore interest at a weighted average rate of 2.22% in 2014. We repaid $101 million of the termloan during 2013 and an additional $24 million in the fourth quarter of 2014. The remaining balance of $75.0million is due on January 23, 2016. The term loan facility contains financial covenants and other terms that areidentical to those of Opco’s revolving credit facility.
NRP Oil and Gas Debt
Revolving Credit Facility. In August 2013, NRP Oil and Gas entered into a senior secured, reserve-basedrevolving credit facility in order to fund capital expenditure requirements related to the development of the oiland gas assets in which it owns non-operated working interests. In connection with the closing of the SanishField acquisition in November 2014, the credit facility was amended to be a $500 million facility with an initialborrowing base of $137 million and will mature on November 12, 2019. The credit facility is secured by a firstpriority lien and security interest in substantially all of the assets of NRP Oil and Gas. NRP Oil and Gas is thesole obligor under its revolving credit facility, and neither NRP nor any of its other subsidiaries is a guarantor ofsuch facility. As of December 31, 2014, NRP Oil and Gas had $110.0 million outstanding under the facility.
68

Indebtedness under the NRP Oil and Gas credit facility bears interest, at the option of NRP Oil and Gas, ateither:
• the higher of (i) the prime rate as announced by the agent bank; (ii) the federal funds rate plus 0.50%; or(iii) LIBOR plus 1%, in each case plus an applicable margin ranging from 0.50% to 1.50%; or
• a rate equal to LIBOR, plus an applicable margin ranging from 1.50% to 2.50%.
NRP Oil and Gas incurs a commitment fee on the unused portion of the borrowing base under the creditfacility at a rate ranging from 0.375% to 0.50% per annum.
The NRP Oil and Gas credit facility contains certain covenants, which, among other things, require themaintenance of (i) a total leverage ratio (defined as the ratio of the total debt of NRP Oil and Gas to itsEBITDAX) of not more than 3.5 to 1.0 and (ii) a current ratio of at least 1.0 to 1.0. The credit facility alsocontains other customary covenants, subject to certain agreed exceptions, including covenants restricting theability of NRP Oil and Gas to, among other items, incur indebtedness; create, assume or permit to exist liens; bea party to or be liable on any hedging contract; engage in mergers or consolidations; transfer, lease, exchange,alienate or dispose of material assets or properties; pay distributions; make any acquisitions of, capitalcontributions to or other investments in any entity or property; extend credit or make advances or loans; orengage in transactions with affiliates. Events of default under the credit facility include payment defaults,misrepresentations and breaches of covenants by NRP Oil and Gas. The credit facility also contains a cross-default provision with respect to any indebtedness of NRP’s.
The maximum amount available under the credit facility is subject to semi-annual redeterminations of theborrowing base in May and November of each year, based on the value of the proved oil and natural gas reservesof NRP Oil and Gas, in accordance with the lenders’ customary procedures and practices. NRP Oil and Gas andthe lenders each have a right to one additional redetermination each year.
Long-Term Contractual Obligations
The following table reflects our long-term non-cancelable contractual obligations as of December 31, 2014:
Payments Due by Period
Contractual Obligations Total 2015 2016 2017 2018 2019 Thereafter
(In millions)
NRP:
Long-term debt principal payments(including current maturities)(1) . . . . . $ 425.0 $ — $ — $ — $425.0 $ — $ —
Long-term debt interest payments(2) . . . 155.2 38.8 38.8 38.8 38.8 — —
NRP Oil and Gas:
Long-term debt principal payments . . . . . 110.0 — — — — 110.0 —
Opco:
Long-term debt principal payments(including current maturities)(3) . . . . . 943.1 81.0 356.0 81.0 81.0 76.4 267.7
Long-term debt interest payments(4) . . . 187.0 38.4 33.3 28.2 23.2 18.2 45.7
Rental leases(5) . . . . . . . . . . . . . . . . . . . . 2.7 0.7 0.7 0.7 0.6 — —
Total . . . . . . . . . . . . . . . . . . . . . . . . . . . . . . . $1,823.0 $158.9 $428.8 $148.7 $568.6 $204.6 $313.4
(1) On September 18, 2013, NRP and NRP Finance issued $300 million of 9.125% senior notes at an offeringprice of 99.007% of par value due October 1, 2018. On October 17, 2014 NRP and NRP Finance issued anadditional $125 million of 9.125% senior notes at an offering price of 99.5% of par value.
(2) The amounts indicated in the table include interest due on NRP’s 9.125% senior notes.
69

(3) The amounts indicated in the table include principal due on Opco’s senior notes, credit facility, term loanand utility local improvement obligation.
(4) The amounts indicated in the table include interest due on Opco’s senior notes and utility local improvementobligation.
(5) On January 1, 2009, Opco entered into a ten-year lease agreement for the rental of office space fromWestern Pocahontas Properties Limited Partnership for $0.6 million per year. In addition, BRP leases officespace for approximately $100,000 per year through 2017. These rental obligations are included in the tableabove.
Shelf Registration Statements and “At-the-Market” Program
In April 2012 we filed an automatically effective shelf registration statement on Form S-3 with the SEC thatis available for registered offerings of common units and debt securities. In October 2014, we issued 8,500,000common units in an underwritten public offering pursuant to this registration statement at a public offering priceof $12.02 per common unit. We used the net proceeds of approximately $100.4 million from this offering,including our general partner’s proportionate capital contribution to maintain its 2% general partner interest in us,to fund a portion of the purchase price of the Sanish Field acquisition.
In August 2012, we filed a shelf registration statement on Form S-3 that registered all of the common unitsheld by Adena Minerals. This shelf registration statement was declared effective by the SEC in September 2012.Following the effectiveness of this registration statement, Adena distributed 15,181,716 common units to itsshareholders, and we subsequently filed prospectus supplements to register the resale of these common units bythose shareholders. The shelf registration statement filed in August 2012 also registered up to $500 million inequity securities to be sold by NRP. In November 2013, we filed a prospectus supplement and entered into anEquity Distribution Agreement relating to the offer and sale from time to time of common units having anaggregate offering price of $75 million through one or more managers acting as sales agents at prices to beagreed upon at the time of sale. Under the terms of the Equity Distribution Agreement, we may also sell commonunits from time to time to any manager as principal for its own account at a price to be agreed upon at the time ofsale. Any sale of common units to any manager as principal would be pursuant to the terms of a separate termsagreement between NRP and such manager. Sales of common units in this “at-the-market” (“ATM”) program aremade pursuant to the shelf registration statement declared effective in September 2012. For the year endedDecember 31, 2014, we sold 1,559,914 common units for an average price of $16.05 for gross proceeds of $25.0million.
In April 2013, we filed a resale shelf registration statement on Form S-3 to register the 3,784,572 commonunits issued in the January 2013 private placement in connection with the OCI Wyoming acquisition. This shelfregistration statement was declared effective by the SEC in May 2013. A portion of the common units issued inthe private placement were issued, directly and indirectly, to certain of our affiliates, including Corbin J.Robertson, Jr. and Christopher Cline.
We cannot control the resale of the common units by any of the selling unitholders under the shelfregistration statements described above, and the amounts, prices and timing of the issuance and sale of any equityor debt securities by NRP will depend on market conditions, our capital requirements and compliance with ourcredit facilities, term loan and senior notes.
Off-Balance Sheet Transactions
We do not have any off-balance sheet arrangements with unconsolidated entities or related parties andaccordingly, there are no off-balance sheet risks to our liquidity and capital resources from unconsolidatedentities.
Inflation
Inflation in the United States has been relatively low in recent years and did not have a material impact onoperations for the years ended December 31, 2014, 2013 and 2012.
70

Environmental
The operations our lessees conduct on our properties, as well as the aggregates/industrial minerals and oiland gas operations in which we have interests, are subject to federal and state environmental laws andregulations. See “Item 1. Business—Regulation and Environmental Matters.” As an owner of surface interests insome properties, we may be liable for certain environmental conditions occurring on the surface properties. Theterms of substantially all of our coal leases require the lessee to comply with all applicable laws and regulations,including environmental laws and regulations. Lessees post reclamation bonds assuring that reclamation will becompleted as required by the relevant permit, and substantially all of the leases require the lessee to indemnify usagainst, among other things, environmental liabilities. Some of these indemnifications survive the termination ofthe lease. We make regular visits to the mines to ensure compliance with lease terms, but the duty to comply withall regulations rests with the lessees. We believe that our lessees will be able to comply with existing regulationsand do not expect any lessee’s failure to comply with environmental laws and regulations to have a materialimpact on our financial condition or results of operations. We have neither incurred, nor are aware of, anymaterial environmental charges imposed on us related to our properties for the period ended December 31, 2014.We are not associated with any environmental contamination that may require remediation costs. However, ourlessees do conduct reclamation work on the properties under lease to them. Because we are not the permittee ofthe mines being reclaimed, we are not responsible for the costs associated with these reclamation operations. Inaddition, West Virginia has established a fund to satisfy any shortfall in reclamation obligations. As an owner ofworking interests in oil and natural gas operations, we are responsible for our proportionate share of any lossesand liabilities, including environmental liabilities, arising from uninsured and underinsured events. We are alsoresponsible for losses and liabilities, including environmental liabilities that may arise from uninsured andunderinsured events.
For additional information on environmental regulation that may have a material impact on our business, see“—Executive Overview—Political, Legal and Regulatory Environment Affecting Our Coal Business” and“Item 1. Business—Regulation and Environmental Matters.”
Related Party Transactions
Partnership Agreement
Our general partner does not receive any management fee or other compensation for its management ofNatural Resource Partners L.P. However, in accordance with the partnership agreement, we reimburse ourgeneral partner and its affiliates for expenses incurred on our behalf. All direct general and administrativeexpenses are charged to us as incurred. We also reimburse indirect general and administrative costs, includingcertain legal, accounting, treasury, information technology, insurance, administration of employee benefits andother corporate services incurred by our general partner and its affiliates.
The reimbursements to our general partner for services performed by Western Pocahontas Properties andQuintana Minerals Corporation are as follows:
For the Years EndedDecember 31,
2014 2013 2012
(In thousands)
Reimbursement for services . . . . . . . . . . . . . . . . . . . . . . . . . . . . . . . . . $11,798 $11,480 $9,791
For additional information, see “Item 13. Certain Relationships and Related Transactions, and DirectorIndependence—Omnibus Agreement.”
Transactions with Cline Affiliates
Various companies controlled by Chris Cline, including Foresight Energy LP, lease coal reserves from NRP,and we provide coal transportation services to them for a fee. Mr. Cline, both individually and through affiliatedcompanies, owns a 31% interest in our general partner, as well as 4,917,548 common units, at the time of this
71

filing. At December 31, 2014, we had accounts receivable totaling $9.2 million from Cline affiliates. In addition,the overriding royalty and the lease of the loadout facility at the Sugar Camp mine are classified as contractsreceivable of $50.0 million on our Consolidated Balance Sheets. Revenues from the Cline affiliates are asfollows:
For The Years EndedDecember 31,
2014 2013 2012
(In thousands)
Coal royalty revenues . . . . . . . . . . . . . . . . . . . . . . . . . . . . . . . . . . . . . $52,415 $54,322 $48,567
Processing and transportation fees . . . . . . . . . . . . . . . . . . . . . . . . . . . 20,594 19,258 21,923
Minimums recognized as revenue . . . . . . . . . . . . . . . . . . . . . . . . . . . — 3,477 17,785
Override revenue . . . . . . . . . . . . . . . . . . . . . . . . . . . . . . . . . . . . . . . . 2,847 3,226 4,066
Other revenue . . . . . . . . . . . . . . . . . . . . . . . . . . . . . . . . . . . . . . . . . . . 5,690 8,149 —
$81,546 $88,432 $92,341
As of December 31, 2014, we had received $86.8 million in minimum royalty payments that have not beenrecouped by Cline affiliates, of which $16.0 million was received in 2014.
During the fourth quarter of 2012, we recognized an impairment of $2.6 million related to the assets at theGatling West Virginia location, a location leased to and affiliate of Chris Cline.
During 2014 and 2013, we recognized non-cash gains of $5.7 million and $8.1 million on reserve exchangesin Illinois with Williamson Energy, a subsidiary of Foresight Energy LP. The tons received during 2014 and2013 were fully mined during each of those years, while the tons exchanged are not included in current mineplans. The gains are included in Coal related revenues on the Consolidated Statement of Comprehensive Income.
We entered into a lease agreement related to the rail loadout and associated facilities at Sugar Camp that hasbeen accounted for as a direct financing lease. Total projected remaining payments under the lease atDecember 31, 2014 are $86.3 million with unearned income of $39.0 million. The net amount receivable underthe lease as of December 31, 2014 was $47.3 million, of which $1.8 million is included in Accounts receivable—affiliates while the remaining is included in Long-term contracts receivable—affiliate on the accompanyingConsolidated Balance Sheets.
In a separate transaction, we acquired a contractual overriding royalty interest from a Cline affiliate thatprovides for payments based upon production from specific tons at the Sugar Camp operations. This overridingroyalty was accounted for as a financing arrangement and is reflected as an affiliate receivable. The net amountreceivable under the agreement as of December 31, 2014 was $5.6 million, of which $1.1 million is included inAccounts receivable—affiliates while the remaining is included in Long-term contracts receivable—affiliate onthe accompanying Consolidated Balance Sheets.
Note to Cline Trust Company, LLC
Donald R. Holcomb, one of our directors, is a manager of Cline Trust Company, LLC, which ownsapproximately 5.35 million of our common units and $20 million in principal amount of our 9.125% SeniorNotes due 2018. The members of the Cline Trust Company are four trusts for the benefit of the children ofChristopher Cline, each of which owns an approximately equal membership interest in the Cline Trust Company.Mr. Holcomb also serves as trustee of each of the four trusts. Cline Trust Company, LLC purchased the $20million of our 9.125% Senior Notes due 2018 in our offering of $125 million additional principal amount of suchnotes in October 2014 at the same price as the other purchasers in that offering. The balance on this portion ofour 9.125% Senior Notes due 2018 was $19.9 million as of December 31, 2014 and is included with our longterm debt.
72

Quintana Capital Group GP, Ltd.
Corbin J. Robertson, Jr. is a principal in Quintana Capital Group GP, Ltd., which controls several privateequity funds focused on investments in the energy business. In connection with the formation of QuintanaCapital, the Partnership adopted a formal conflicts policy that establishes the opportunities that will be pursuedby NRP and those that will be pursued by Quintana Capital. The governance documents of Quintana Capital’saffiliated investment funds reflect the guidelines set forth in NRP’s conflicts policy. See “Item 13. CertainRelationships and Related Transactions, and Director Independence—Quintana Capital Group GP, Ltd.”
A fund controlled by Quintana Capital owned a significant membership interest in Taggart Global USA,LLC, including the right to nominate two members of Taggart’s 5-person board of directors. In 2013, Taggartwas sold to Forge Group, and Quintana no longer retains an interest in Taggart or Forge. We own and leasepreparation plants to Forge, which operates the plants. The lease payments were based on the sales price for thecoal that was processed through the facilities.
For the years ended December 31, 2014, 2013 and 2012, the revenues from Taggart prior to the sale toForge were as follows:
For the Years EndedDecember 31,
2014 2013 2012
(In thousands)
Processing revenue . . . . . . . . . . . . . . . . . . . . . . . . . . . . . . . . . . . . . . . . . . $— $1,761 $5,580
During the third quarter of 2012, we sold a preparation plant back to Taggart Global for $12.3 million. Wereceived $10.5 million in cash and a note receivable from Taggart, payable over three years for the balance. Werecorded a gain of $4.7 million included in Other income or the Consolidated Statements of Income for 2012.The net book value of the asset sold was $7.6 million. During 2013, the note receivable that we held was paid infull.
At December 31, 2013, a fund controlled by Quintana Capital owned a majority interest in Corsa CoalCorp., a coal mining company traded on the TSX Venture Exchange that is one of our lessees in Tennessee.Corbin J. Robertson III, one of our directors, is Chairman of the Board of Corsa. Revenues from Corsa are asfollows:
For the Years EndedDecember 31,
2014 2013 2012
(In thousands)
Coal royalty revenues . . . . . . . . . . . . . . . . . . . . . . . . . . . . . . . . . . . . . . . . $3,013 $4,594 $3,486
NRP also had accounts receivable totaling $0.3 million from Corsa at each of December 31, 2013 andDecember 31, 2014.
Office Building in Huntington, West Virginia
We lease an office building in Huntington, West Virginia from Western Pocahontas at market rates. Theterms of the lease were approved by our Conflicts Committee. We pay $0.6 million each year in lease payments.
Item 7A. Quantitative and Qualitative Disclosures about Market Risk
We are exposed to market risk, which includes adverse changes in commodity prices and interest rates.
Commodity Price Risk
We are dependent upon the effective marketing of the coal mined by our lessees. Our lessees sell the coalunder various long-term and short-term contracts as well as on the spot market. We estimate that over 65% of ourcoal is currently sold by our lessees under coal supply contracts that have terms of one year or more. Current
73

conditions in the coal industry may make it difficult for our lessees to extend existing contracts or enter intosupply contracts with terms of one year or more. Our lessees’ failure to negotiate long-term contracts couldadversely affect the stability and profitability of our lessees’ operations and adversely affect our coal royaltyrevenues. If more coal is sold on the spot market, coal royalty revenues may become more volatile due tofluctuations in spot coal prices.
The market price of soda ash directly affects the profitability of OCI Wyoming’s operations. If the marketprice for soda ash declines, OCI Wyoming’s sales will decrease. Historically, the global market and, to a lesserextent, the domestic market for soda ash have been volatile, and those markets are likely to remain volatile in thefuture. In addition, crude oil and natural gas prices are subject to wide fluctuations in response to relatively minorchanges in supply and demand. These markets will likely continue to be volatile in the future.
Interest Rate Risk
Our exposure to changes in interest rates results from borrowings under the Opco revolving credit facility,the Opco term loan and the NRP Oil and Gas revolving credit facility, which are subject to variable interest ratesbased upon LIBOR or the federal funds rate plus an applicable margin. Management monitors interest rates andmay enter into interest rate instruments to protect against increased borrowing costs. At December 31, 2014, wehad $385 million outstanding in variable interest debt. If interest rates were to increase by 1%, annual interestexpense would increase approximately $3.9 million, assuming the same principal amount remained outstandingduring the year.
74

Item 8. Financial Statements and Supplementary Data
INDEX TO CONSOLIDATED FINANCIAL STATEMENTS
Page
Report of Ernst & Young LLP, independent registered public accounting firm . . . . . . . . . . . . . . . . . . . . . . . 76
Report of Deloitte & Touche, LLP, independent registered public accounting firm . . . . . . . . . . . . . . . . . . . . 77
Consolidated balance sheets as of December 31, 2014 and 2013 . . . . . . . . . . . . . . . . . . . . . . . . . . . . . . . . . . 78
Consolidated statements of comprehensive income for the years ended December 31, 2014, 2013 and2012 . . . . . . . . . . . . . . . . . . . . . . . . . . . . . . . . . . . . . . . . . . . . . . . . . . . . . . . . . . . . . . . . . . . . . . . . . . . . . . . 79
Consolidated statements of partners’ capital for the years ended December 31, 2014, 2013 and 2012 . . . . . 80
Consolidated statements of cash flows for the years ended December 31, 2014, 2013 and 2012 . . . . . . . . . . 81
Notes to consolidated financial statements . . . . . . . . . . . . . . . . . . . . . . . . . . . . . . . . . . . . . . . . . . . . . . . . . . . . 82
75

Report of Independent Registered Public Accounting Firm
The Partners of Natural Resource Partners L.P.
We have audited the accompanying consolidated balance sheets of Natural Resource Partners L.P. as ofDecember 31, 2014 and 2013, and the related consolidated statements of comprehensive income, partners’ capitaland cash flows for each of the three years in the period ended December 31, 2014. These financial statements arethe responsibility of the Partnership’s management. Our responsibility is to express an opinion on these financialstatements based on our audits. We did not audit the financial statements of OCI Wyoming LLC (OCI Wyoming)(a Limited Liability Company in which Natural Resource Partners L.P. owns a 49% interest). Natural ResourcePartners L.P.’s investment in OCI Wyoming constituted approximately $264 million and $269 million of NaturalResource Partners L.P.’s assets as of December 31, 2014 and 2013, and total revenues of $41 million and $34million for the two years in the period ended December 31, 2014. Those statements were audited by otherauditors whose report has been furnished to us. Our opinion, insofar as it relates to the amounts included forNatural Resource Partners L.P., is based solely on the report of the other auditors.
We conducted our audits in accordance with the standards of the Public Company Accounting OversightBoard (United States). Those standards require that we plan and perform the audit to obtain reasonable assuranceabout whether the financial statements are free of material misstatement. An audit includes examining, on a testbasis, evidence supporting the amounts and disclosures in the financial statements. An audit also includesassessing the accounting principles used and significant estimates made by management, as well as evaluatingthe overall financial statement presentation. We believe that our audits and the report of other auditors provides areasonable basis for our opinion.
In our opinion, based on our audits and the report of other auditors, the financial statements referred toabove present fairly, in all material respects, the consolidated financial position of Natural Resource Partners L.P.and subsidiaries at December 31, 2014 and 2013, and the consolidated results of their operations and their cashflows for each of the three years in the period ended December 31, 2014, in conformity with U.S. generallyaccepted accounting principles.
We also have audited, in accordance with the standards of the Public Company Accounting Oversight Board(United States), Natural Resource Partners L.P.’s internal control over financial reporting as of December 31,2014, based on criteria established in Internal Control-Integrated Framework issued by the Committee ofSponsoring Organizations of the Treadway Commission (2013 framework), and our report dated February 27,2015 expressed an unqualified opinion thereon.
/s/ Ernst & Young LLP
Houston, TexasFebruary 27, 2015
76

REPORT OF INDEPENDENT REGISTERED PUBLIC ACCOUNTING FIRM
The Board of Managers and Members ofOCI Wyoming LLCAtlanta, Georgia
We have audited the accompanying balance sheets of OCI Wyoming LLC (the “Company”) as ofDecember 31, 2014 and 2013, and the related statements of operations and comprehensive income, members’equity, and cash flows for the years then ended, and the related notes to the financial statements. These financialstatements are the responsibility of the Company’s management. Our responsibility is to express an opinion onthese financial statements based on our audits.
We conducted our audits in accordance with the standards of the Public Company Accounting OversightBoard (United States). Those standards require that we plan and perform the audit to obtain reasonable assuranceabout whether the financial statements are free of material misstatement. The Company is not required to have,nor were we engaged to perform, an audit of its internal control over financial reporting. Our audits includedconsideration of internal control over financial reporting as a basis for designing audit procedures that areappropriate in the circumstances, but not for the purpose of expressing an opinion on the effectiveness of theCompany’s internal control over financial reporting. Accordingly, we express no such opinion. An audit alsoincludes examining, on a test basis, evidence supporting the amounts and disclosures in the financial statements,assessing the accounting principles used and significant estimates made by management, as well as evaluatingthe overall financial statement presentation. We believe that our audits provide a reasonable basis for ouropinion.
In our opinion, such financial statements present fairly, in all material respects, the financial position of theCompany as of December 31, 2014 and 2013, and the results of its operations and its cash flows for the yearsthen ended, in conformity with accounting principles generally accepted in the United States of America.
/s/ DELOITTE & TOUCHE LLP
Atlanta, GeorgiaFebruary 26, 2015
77

NATURAL RESOURCE PARTNERS L.P.
CONSOLIDATED BALANCE SHEETS(In thousands, except for unit information)
December 31,2014
December 31,2013
ASSETSCurrent assets:
Cash and cash equivalents . . . . . . . . . . . . . . . . . . . . . . . . . . . . . . . . . . . . . . . . . . . . . $ 50,076 $ 92,513Accounts receivable, net of allowance for doubtful accounts . . . . . . . . . . . . . . . . . . 66,455 33,737Accounts receivable — affiliates . . . . . . . . . . . . . . . . . . . . . . . . . . . . . . . . . . . . . . . . 9,494 7,666Inventory . . . . . . . . . . . . . . . . . . . . . . . . . . . . . . . . . . . . . . . . . . . . . . . . . . . . . . . . . . 5,814 —Other . . . . . . . . . . . . . . . . . . . . . . . . . . . . . . . . . . . . . . . . . . . . . . . . . . . . . . . . . . . . . 4,279 1,691
Total current assets . . . . . . . . . . . . . . . . . . . . . . . . . . . . . . . . . . . . . . . . . . . . . . . . 136,118 135,607Land . . . . . . . . . . . . . . . . . . . . . . . . . . . . . . . . . . . . . . . . . . . . . . . . . . . . . . . . . . . . . . . . 25,243 24,340Plant and equipment, net . . . . . . . . . . . . . . . . . . . . . . . . . . . . . . . . . . . . . . . . . . . . . . . . 60,093 26,435Mineral rights, net . . . . . . . . . . . . . . . . . . . . . . . . . . . . . . . . . . . . . . . . . . . . . . . . . . . . . 1,781,852 1,405,455Intangible assets, net . . . . . . . . . . . . . . . . . . . . . . . . . . . . . . . . . . . . . . . . . . . . . . . . . . . 60,733 66,950Equity and other unconsolidated investments . . . . . . . . . . . . . . . . . . . . . . . . . . . . . . . . 264,020 269,338Loan financing costs, net . . . . . . . . . . . . . . . . . . . . . . . . . . . . . . . . . . . . . . . . . . . . . . . . 13,905 11,502Long-term contracts receivable — affiliates . . . . . . . . . . . . . . . . . . . . . . . . . . . . . . . . . 50,008 51,732Goodwill . . . . . . . . . . . . . . . . . . . . . . . . . . . . . . . . . . . . . . . . . . . . . . . . . . . . . . . . . . . . 52,012 —Other assets . . . . . . . . . . . . . . . . . . . . . . . . . . . . . . . . . . . . . . . . . . . . . . . . . . . . . . . . . . 740 497
Total assets . . . . . . . . . . . . . . . . . . . . . . . . . . . . . . . . . . . . . . . . . . . . . . . . . . . . . . . $2,444,724 $1,991,856
LIABILITIES AND PARTNERS’ CAPITALCurrent liabilities:
Accounts payable and accrued liabilities . . . . . . . . . . . . . . . . . . . . . . . . . . . . . . . . . . $ 32,416 $ 8,659Accounts payable — affiliates . . . . . . . . . . . . . . . . . . . . . . . . . . . . . . . . . . . . . . . . . . 950 391Current portion of long-term debt . . . . . . . . . . . . . . . . . . . . . . . . . . . . . . . . . . . . . . . 80,983 80,983Accrued incentive plan expenses — current portion . . . . . . . . . . . . . . . . . . . . . . . . . 7,048 8,341Property, franchise and other taxes payable . . . . . . . . . . . . . . . . . . . . . . . . . . . . . . . 8,318 7,830Accrued interest . . . . . . . . . . . . . . . . . . . . . . . . . . . . . . . . . . . . . . . . . . . . . . . . . . . . . 18,216 17,184
Total current liabilities . . . . . . . . . . . . . . . . . . . . . . . . . . . . . . . . . . . . . . . . . . . . . . 147,931 123,388Deferred revenue . . . . . . . . . . . . . . . . . . . . . . . . . . . . . . . . . . . . . . . . . . . . . . . . . . . . . . 160,260 142,586Accrued incentive plan expenses . . . . . . . . . . . . . . . . . . . . . . . . . . . . . . . . . . . . . . . . . . 6,554 10,526Asset retirement obligation . . . . . . . . . . . . . . . . . . . . . . . . . . . . . . . . . . . . . . . . . . . . . . 4,905 —Other non-current liabilities . . . . . . . . . . . . . . . . . . . . . . . . . . . . . . . . . . . . . . . . . . . . . . 10,679 14,341Long-term debt . . . . . . . . . . . . . . . . . . . . . . . . . . . . . . . . . . . . . . . . . . . . . . . . . . . . . . . . 1,394,240 1,084,226Partners’ capital:
Common units outstanding: (122,299,825 and 109,812,408) . . . . . . . . . . . . . . . . . . 709,019 606,774General partner’s interest . . . . . . . . . . . . . . . . . . . . . . . . . . . . . . . . . . . . . . . . . . . . . . 12,245 10,069Non-controlling interest . . . . . . . . . . . . . . . . . . . . . . . . . . . . . . . . . . . . . . . . . . . . . . . (650) 324Accumulated other comprehensive loss . . . . . . . . . . . . . . . . . . . . . . . . . . . . . . . . . . (459) (378)
Total partners’ capital . . . . . . . . . . . . . . . . . . . . . . . . . . . . . . . . . . . . . . . . . . . . . . 720,155 616,789
Total liabilities and partners’ capital . . . . . . . . . . . . . . . . . . . . . . . . . . . . . . . . . . . $2,444,724 $1,991,856
The accompanying notes are an integral part of these financial statements.
78

NATURAL RESOURCE PARTNERS L.P.
CONSOLIDATED STATEMENTS OF COMPREHENSIVE INCOME(In thousands, except per unit data)
For the Years Ended December 31,
2014 2013 2012
Revenues and other income:
Coal related revenues . . . . . . . . . . . . . . . . . . . . . . . . . . . . . . . . . . . . . . . . . . . $226,724 $274,194 $343,352
Aggregates related revenues . . . . . . . . . . . . . . . . . . . . . . . . . . . . . . . . . . . . . . 54,124 13,479 9,524
Oil and gas related revenues . . . . . . . . . . . . . . . . . . . . . . . . . . . . . . . . . . . . . . 59,566 17,080 9,561
Equity and other unconsolidated investment income . . . . . . . . . . . . . . . . . . . 41,416 34,186 —
Property taxes . . . . . . . . . . . . . . . . . . . . . . . . . . . . . . . . . . . . . . . . . . . . . . . . . 13,609 15,416 15,273
Other . . . . . . . . . . . . . . . . . . . . . . . . . . . . . . . . . . . . . . . . . . . . . . . . . . . . . . . . 4,313 3,762 1,437
Total revenues and other income . . . . . . . . . . . . . . . . . . . . . . . . . . . . . . . . 399,752 358,117 379,147
Operating expenses:
Depreciation, depletion and amortization . . . . . . . . . . . . . . . . . . . . . . . . . . . 79,876 64,377 58,221
Asset impairments . . . . . . . . . . . . . . . . . . . . . . . . . . . . . . . . . . . . . . . . . . . . . 26,209 734 2,568
General and administrative . . . . . . . . . . . . . . . . . . . . . . . . . . . . . . . . . . . . . . 36,437 36,821 29,714
Property, franchise and other taxes . . . . . . . . . . . . . . . . . . . . . . . . . . . . . . . . 21,279 16,463 17,678
Oil and gas lease operating expenses . . . . . . . . . . . . . . . . . . . . . . . . . . . . . . . 9,144 739 —
Aggregates operating expenses . . . . . . . . . . . . . . . . . . . . . . . . . . . . . . . . . . . 32,309 — —
Transportation costs . . . . . . . . . . . . . . . . . . . . . . . . . . . . . . . . . . . . . . . . . . . . 1,604 1,644 1,944
Coal royalty and override payments . . . . . . . . . . . . . . . . . . . . . . . . . . . . . . . 3,975 1,103 1,857
Total operating expenses . . . . . . . . . . . . . . . . . . . . . . . . . . . . . . . . . . . . . . 210,833 121,881 111,982
Income from operations . . . . . . . . . . . . . . . . . . . . . . . . . . . . . . . . . . . . . . . . . . . 188,919 236,236 267,165
Other income (expense)
Interest expense . . . . . . . . . . . . . . . . . . . . . . . . . . . . . . . . . . . . . . . . . . . . . . . (80,185) (64,396) (53,972)
Interest income . . . . . . . . . . . . . . . . . . . . . . . . . . . . . . . . . . . . . . . . . . . . . . . . 96 238 162
Income before non-controlling interest . . . . . . . . . . . . . . . . . . . . . . . . . . . . . . . 108,830 172,078 213,355
Non-controlling interest . . . . . . . . . . . . . . . . . . . . . . . . . . . . . . . . . . . . . . . . . — — —
Net income . . . . . . . . . . . . . . . . . . . . . . . . . . . . . . . . . . . . . . . . . . . . . . . . . . . . . $108,830 $172,078 $213,355
Net income attributable to:
General partner . . . . . . . . . . . . . . . . . . . . . . . . . . . . . . . . . . . . . . . . . . . . . . . . $ 2,177 $ 3,442 $ 4,267
Limited partners . . . . . . . . . . . . . . . . . . . . . . . . . . . . . . . . . . . . . . . . . . . . . . . $106,653 $168,636 $209,088
Basic and diluted net income per limited partner unit . . . . . . . . . . . . . . . . . . . . $ 0.94 $ 1.54 $ 1.97
Weighted average number of common units outstanding . . . . . . . . . . . . . . . . . 113,262 109,584 106,028
Comprehensive income . . . . . . . . . . . . . . . . . . . . . . . . . . . . . . . . . . . . . . . . . . . $108,749 $172,143 $213,405
The accompanying notes are an integral part of these financial statements.
79

NATURAL RESOURCE PARTNERS L.P.
CONSOLIDATED STATEMENTS OF PARTNERS’ CAPITAL(In thousands, except unit data)
Common Units GeneralPartner
Amounts
Non-Controlling
InterestAmounts
AccumulatedOther
ComprehensiveIncome (Loss) TotalUnits Amounts
Balance at December 31, 2011 . . . . . . . . . 106,027,836 $ 629,253 $10,517 $ 5,638 $(493) $ 644,915Distributions to unitholders . . . . . . . . . . . . — (233,263) (4,758) — — (238,021)Distributions to non-controlling
interests . . . . . . . . . . . . . . . . . . . . . . . . . — — — (2,793) — (2,793)Costs associated with equity
transactions . . . . . . . . . . . . . . . . . . . . . . — (59) — — — (59)Net income for the year ended
December 31, 2012 . . . . . . . . . . . . . . . . — 209,088 4,267 — — 213,355Loss on interest hedge . . . . . . . . . . . . . . . . — — — — 50 50
Comprehensive income . . . . . . . . . . . . . . . — — — — 50 213,405
Balance at December 31, 2012 . . . . . . . . . 106,027,836 $ 605,019 $10,026 $ 2,845 $(443) $ 617,447
Issuance of common units . . . . . . . . . . . . . 3,784,572 75,000 — — — 75,000Capital contribution . . . . . . . . . . . . . . . . . . — — 1,531 — — 1,531Cost associated with equity
transactions . . . . . . . . . . . . . . . . . . . . . . — (293) — — — (293)Distributions to unitholders . . . . . . . . . . . . — (241,588) (4,930) — — (246,518)Distributions to non-controlling
interests . . . . . . . . . . . . . . . . . . . . . . . . . — — — (2,521) — (2,521)Net income for the year ended
December 31, 2013 . . . . . . . . . . . . . . . . — 168,636 3,442 — — 172,078Interest rate swap from unconsolidated
investments . . . . . . . . . . . . . . . . . . . . . . — — — — 13 13Loss on interest hedge . . . . . . . . . . . . . . . . — — — — 52 52
Comprehensive income . . . . . . . . . . . . . . . — — — — 65 172,143
Balance at December 31, 2013 . . . . . . . . . 109,812,408 $ 606,774 $10,069 $ 324 $(378) $ 616,789
Issuance of common units . . . . . . . . . . . . . 10,059,914 127,202 — — — 127,202Issuance of common units for
acquisitions . . . . . . . . . . . . . . . . . . . . . . 2,427,503 31,604 — — — 31,604Capital contribution . . . . . . . . . . . . . . . . . . — — 3,240 — — 3,240Cost associated with equity
transactions . . . . . . . . . . . . . . . . . . . . . . — (4,413) — — — (4,413)Distributions to unitholders . . . . . . . . . . . . — (158,801) (3,241) — — (162,042)Distributions to non-controlling
interests . . . . . . . . . . . . . . . . . . . . . . . . . — — — (974) — (974)Net income for the year ended
December 31, 2014 . . . . . . . . . . . . . . . . — 106,653 2,177 — — 108,830Interest rate swap from unconsolidated
investments . . . . . . . . . . . . . . . . . . . . . . — — — — (96) (96)Unrealized loss on investments . . . . . . . . . — — — — (25) (25)Loss on interest hedge . . . . . . . . . . . . . . . . — — — — 40 40
Comprehensive income . . . . . . . . . . . . . . . — — — — (81) 108,749
Balance at December 31, 2014 . . . . . . . . . 122,299,825 $ 709,019 $12,245 $ (650) $(459) $ 720,155
The accompanying notes are an integral part of these financial statements.
80

NATURAL RESOURCE PARTNERS L.P.
CONSOLIDATED STATEMENTS OF CASH FLOWS(In thousands)
For the Years Ended December 31,
2014 2013 2012
Cash flows from operating activities:Net income . . . . . . . . . . . . . . . . . . . . . . . . . . . . . . . . . . . . . . . . . . . . . . . . . . . . . . . . . . . . . . . . . . . . . . . . . . . . . . . . . . . . . $ 108,830 $ 172,078 $ 213,355Adjustments to reconcile net income to net cash provided by operating activities:
Depreciation, depletion and amortization . . . . . . . . . . . . . . . . . . . . . . . . . . . . . . . . . . . . . . . . . . . . . . . . . . . . . . . . . . . . 79,876 64,377 58,221Non-cash interest charge . . . . . . . . . . . . . . . . . . . . . . . . . . . . . . . . . . . . . . . . . . . . . . . . . . . . . . . . . . . . . . . . . . . . . . . . . 3,328 2,200 605Non-cash gain on reserve swap . . . . . . . . . . . . . . . . . . . . . . . . . . . . . . . . . . . . . . . . . . . . . . . . . . . . . . . . . . . . . . . . . . . . (5,690) (8,149) —Equity and other unconsolidated investment income . . . . . . . . . . . . . . . . . . . . . . . . . . . . . . . . . . . . . . . . . . . . . . . . . . . (41,416) (34,186) —Distributions of earnings from unconsolidated investments . . . . . . . . . . . . . . . . . . . . . . . . . . . . . . . . . . . . . . . . . . . . . . 43,005 24,113 —Gain on sale of assets . . . . . . . . . . . . . . . . . . . . . . . . . . . . . . . . . . . . . . . . . . . . . . . . . . . . . . . . . . . . . . . . . . . . . . . . . . . (1,386) (10,921) (13,575)Asset impairment . . . . . . . . . . . . . . . . . . . . . . . . . . . . . . . . . . . . . . . . . . . . . . . . . . . . . . . . . . . . . . . . . . . . . . . . . . . . . . . 26,209 734 2,568
Change in operating assets and liabilities (net of effects of acquisitions):Inventory . . . . . . . . . . . . . . . . . . . . . . . . . . . . . . . . . . . . . . . . . . . . . . . . . . . . . . . . . . . . . . . . . . . . . . . . . . . . . . . . . . . . . 748 — —Accounts receivable . . . . . . . . . . . . . . . . . . . . . . . . . . . . . . . . . . . . . . . . . . . . . . . . . . . . . . . . . . . . . . . . . . . . . . . . . . . . (10,693) 6,826 (802)Other assets . . . . . . . . . . . . . . . . . . . . . . . . . . . . . . . . . . . . . . . . . . . . . . . . . . . . . . . . . . . . . . . . . . . . . . . . . . . . . . . . . . . (795) (516) (236)Accounts payable and accrued liabilities . . . . . . . . . . . . . . . . . . . . . . . . . . . . . . . . . . . . . . . . . . . . . . . . . . . . . . . . . . . . (4,411) 2,197 1,909Accrued interest . . . . . . . . . . . . . . . . . . . . . . . . . . . . . . . . . . . . . . . . . . . . . . . . . . . . . . . . . . . . . . . . . . . . . . . . . . . . . . . . 1,032 6,919 (496)Deferred revenue . . . . . . . . . . . . . . . . . . . . . . . . . . . . . . . . . . . . . . . . . . . . . . . . . . . . . . . . . . . . . . . . . . . . . . . . . . . . . . . 17,674 19,240 11,684Accrued incentive plan expenses . . . . . . . . . . . . . . . . . . . . . . . . . . . . . . . . . . . . . . . . . . . . . . . . . . . . . . . . . . . . . . . . . . (5,265) 2,284 (3,461)Property, franchise and other taxes payable . . . . . . . . . . . . . . . . . . . . . . . . . . . . . . . . . . . . . . . . . . . . . . . . . . . . . . . . . . (291) (122) 1,636
Net cash provided by operating activities . . . . . . . . . . . . . . . . . . . . . . . . . . . . . . . . . . . . . . . . . . . . . . . . . . . . . . . . . . 210,755 247,074 271,408
Cash flows from investing activities:Acquisition of land, coal, other mineral rights and related intangibles . . . . . . . . . . . . . . . . . . . . . . . . . . . . . . . . . . . . . . . . (339,768) (72,000) (180,534)Acquisition of equity interests . . . . . . . . . . . . . . . . . . . . . . . . . . . . . . . . . . . . . . . . . . . . . . . . . . . . . . . . . . . . . . . . . . . . . . . — (293,085) —Acquisition of aggregates business . . . . . . . . . . . . . . . . . . . . . . . . . . . . . . . . . . . . . . . . . . . . . . . . . . . . . . . . . . . . . . . . . . . (168,978) — —Oil and gas capital expenditures . . . . . . . . . . . . . . . . . . . . . . . . . . . . . . . . . . . . . . . . . . . . . . . . . . . . . . . . . . . . . . . . . . . . . (16,258) — —Distributions from unconsolidated investments . . . . . . . . . . . . . . . . . . . . . . . . . . . . . . . . . . . . . . . . . . . . . . . . . . . . . . . . . 3,633 48,833 —Acquisition of plant and equipment . . . . . . . . . . . . . . . . . . . . . . . . . . . . . . . . . . . . . . . . . . . . . . . . . . . . . . . . . . . . . . . . . . (2,454) — (681)Proceeds from sale of assets . . . . . . . . . . . . . . . . . . . . . . . . . . . . . . . . . . . . . . . . . . . . . . . . . . . . . . . . . . . . . . . . . . . . . . . . 1,418 10,929 24,822Return on direct financing lease and contractual override . . . . . . . . . . . . . . . . . . . . . . . . . . . . . . . . . . . . . . . . . . . . . . . . . 1,904 2,558 2,669Investment in direct financing lease . . . . . . . . . . . . . . . . . . . . . . . . . . . . . . . . . . . . . . . . . . . . . . . . . . . . . . . . . . . . . . . . . . — — (59,009)
Net cash used in investing activities . . . . . . . . . . . . . . . . . . . . . . . . . . . . . . . . . . . . . . . . . . . . . . . . . . . . . . . . . . . . . . (520,503) (302,765) (212,733)
Cash flows from financing activities:Proceeds from loans . . . . . . . . . . . . . . . . . . . . . . . . . . . . . . . . . . . . . . . . . . . . . . . . . . . . . . . . . . . . . . . . . . . . . . . . . . . . . . 637,375 567,020 148,000Proceeds from issuance of common units . . . . . . . . . . . . . . . . . . . . . . . . . . . . . . . . . . . . . . . . . . . . . . . . . . . . . . . . . . . . . . 127,202 75,000 —Deferred financing costs . . . . . . . . . . . . . . . . . . . . . . . . . . . . . . . . . . . . . . . . . . . . . . . . . . . . . . . . . . . . . . . . . . . . . . . . . . . (5,094) (9,209) —Repayments of loans . . . . . . . . . . . . . . . . . . . . . . . . . . . . . . . . . . . . . . . . . . . . . . . . . . . . . . . . . . . . . . . . . . . . . . . . . . . . . . (327,983) (386,230) (30,800)Payment of obligation related to acquisitions . . . . . . . . . . . . . . . . . . . . . . . . . . . . . . . . . . . . . . . . . . . . . . . . . . . . . . . . . . . — — (500)Costs associated with equity transactions . . . . . . . . . . . . . . . . . . . . . . . . . . . . . . . . . . . . . . . . . . . . . . . . . . . . . . . . . . . . . . (4,413) (293) (59)Distributions to unitholders . . . . . . . . . . . . . . . . . . . . . . . . . . . . . . . . . . . . . . . . . . . . . . . . . . . . . . . . . . . . . . . . . . . . . . . . . (162,042) (246,518) (238,021)Distributions to non-controlling interests . . . . . . . . . . . . . . . . . . . . . . . . . . . . . . . . . . . . . . . . . . . . . . . . . . . . . . . . . . . . . . (974) (2,521) (2,793)Capital contribution by general partner . . . . . . . . . . . . . . . . . . . . . . . . . . . . . . . . . . . . . . . . . . . . . . . . . . . . . . . . . . . . . . . . 3,240 1,531 —
Net cash provided by (used in) financing activities . . . . . . . . . . . . . . . . . . . . . . . . . . . . . . . . . . . . . . . . . . . . . . . . . . 267,311 (1,220) (124,173)
Net (decrease) in cash and cash equivalents . . . . . . . . . . . . . . . . . . . . . . . . . . . . . . . . . . . . . . . . . . . . . . . . . . . . . . . . . . . . . . (42,437) (56,911) (65,498)Cash and cash equivalents at beginning of period . . . . . . . . . . . . . . . . . . . . . . . . . . . . . . . . . . . . . . . . . . . . . . . . . . . . . . . . . 92,513 149,424 214,922
Cash and cash equivalents at end of period . . . . . . . . . . . . . . . . . . . . . . . . . . . . . . . . . . . . . . . . . . . . . . . . . . . . . . . . . . . . . . . $ 50,076 $ 92,513 $ 149,424
Supplemental cash flow information:Cash paid during the period for interest . . . . . . . . . . . . . . . . . . . . . . . . . . . . . . . . . . . . . . . . . . . . . . . . . . . . . . . . . . . . . . . $ 76,155 $ 55,191 $ 53,842
Non-cash investing activities:Units issued for acquisition of aggregate operations . . . . . . . . . . . . . . . . . . . . . . . . . . . . . . . . . . . . . . . . . . . . . . . . . . . . . . $ 31,604 — —Note receivable related to sale of assets . . . . . . . . . . . . . . . . . . . . . . . . . . . . . . . . . . . . . . . . . . . . . . . . . . . . . . . . . . . . . . . — — $ 1,808Non-cash contingent consideration on equity investments . . . . . . . . . . . . . . . . . . . . . . . . . . . . . . . . . . . . . . . . . . . . . . . . . — $ 15,000 —
The accompanying notes are an integral part of these financial statements.
81

NATURAL RESOURCE PARTNERS L.P.
NOTES TO CONSOLIDATED FINANCIAL STATEMENTS
1. Basis of Presentation and Organization
Natural Resource Partners L.P. (the “Partnership”), a Delaware limited partnership, was formed in April2002. The general partner of the Partnership is NRP (GP) LP (“NRP GP”), a Delaware limited partnership,whose general partner is GP Natural Resource Partners LLC, a Delaware limited liability company. ThePartnership engages principally in the business of owning, managing and leasing a diversified portfolio ofmineral properties in the United States, including interests in coal, trona and soda ash, oil and gas, constructionaggregates, frac sand and other natural resources.
The Partnership’s coal reserves are located in the three major U.S. coal-producing regions: Appalachia, theIllinois Basin and the Western United States, as well as lignite reserves in the Gulf Coast region. The Partnershipdoes not operate any coal mines, but leases its coal reserves to experienced mine operators under long-termleases that grant the operators the right to mine and sell its reserves in exchange for royalty payments. ThePartnership also owns and manages infrastructure assets that generate additional revenues, primarily in theIllinois Basin.
The Partnership owns or leases aggregates and industrial minerals located in a number of states across thecountry. The Partnership derives a small percentage of its aggregates and industrial mineral revenues by leasingits owned reserves to third party operators who mine and sell the reserves in exchange for royalty payments.However, the majority of the Partnership’s aggregates revenues come through its ownership of VantaCorePartners LLC, which was acquired in October 2014. VantaCore specializes in the construction materials industryand operates three hard rock quarries, five sand and gravel plants, two asphalt plants and a marine terminal.VantaCore’s current operations are located in Pennsylvania, West Virginia, Tennessee, Kentucky and Louisiana.
The Partnership also owns a 49% non-controlling equity interest in a trona ore mining operation and sodaash refinery in the Green River Basin, Wyoming. OCI Resources LP, the Partnership’s operating partner, minesthe trona, processes it into soda ash, and distributes the soda ash both domestically and internationally into theglass and chemicals industries. The Partnership receives regular quarterly distributions from this business, andrecords the income in accordance with the equity method of accounting.
The Partnership also owns various interests in oil and gas properties that are located in the Williston Basin,the Appalachian Basin, Louisiana and Oklahoma. The Partnership’s interests in the Appalachian Basin,Louisiana and Oklahoma are minerals and royalty interests, while in the Williston Basin the Partnership ownsnon-operated working interests.
The Partnership’s operations are conducted through, and its operating assets are owned by, its subsidiaries.The Partnership owns its subsidiaries through two wholly owned operating companies: NRP (Operating) LLCand NRP Oil and Gas LLC. NRP GP has sole responsibility for conducting its business and for managing itsoperations. Because NRP GP is a limited partnership, its general partner, GP Natural Resource Partners LLC,conducts its business and operations, and the board of directors and officers of GP Natural Resource PartnersLLC makes decisions on its behalf. Robertson Coal Management LLC, a limited liability company wholly ownedby Corbin J. Robertson, Jr., owns all of the membership interest in GP Natural Resource Partners LLC.Mr. Robertson is entitled to nominate all ten of the directors, five of whom must be independent directors, to theboard of directors of GP Natural Resource Partners LLC. Mr. Robertson has delegated the right to nominate twoof the directors, one of whom must be independent, to Adena Minerals, LLC, an affiliate of Christopher Cline.
2. Summary of Significant Accounting Policies
Reclassification
Certain reclassifications have been made to the Consolidated Statements of Comprehensive Income.Amounts relating to prior year’s coal royalties, processing fees, transportation fees, minimums recognized asrevenue, override royalties and other have been reclassified into a single line item “Coal related revenues” on this
82

year’s Consolidated Statements of Comprehensive Income. Amounts relating to prior year’s aggregates royalties,processing fees, minimums recognized as revenue, override royalties and other have been reclassified into asingle line item “Aggregates related revenues” on this year’s Consolidated Statements of ComprehensiveIncome. Amounts relating to prior year’s oil and gas revenues and minimums recognized as revenue have beenreclassified into a single line item “Oil and gas related revenues” on this year’s Consolidated Statements ofComprehensive Income. The following is reclassification reconciliation:
For The Year EndedDecember 31, 2013
For The Year EndedDecember 31, 2012
AsReported
AsReclassified
AsReported
AsReclassified
Total
CoalRelated
Revenues
AggregatesRelated
Revenues Total
CoalRelated
Revenues
AggregatesRelated
Revenues
Oil & GasRelated
Revenues
Revenues:
Coal royalties . . . . . . . . . . . $212,663 $212,663 $ — $260,734 $260,734 $ — $ —
Equity and otherunconsolidatedinvestment income . . . . . 34,186 — — — — — —
Aggregate royalties . . . . . . . 7,643 — 7,643 6,598 — 6,598 —
Processing fees . . . . . . . . . . 5,049 4,542 507 8,299 7,841 458 —
Transportation fees . . . . . . . 17,977 17,977 — 19,513 19,513 — —
Oil and gas royalties . . . . . . 17,080 — — 9,160 — — 9,160
Property taxes . . . . . . . . . . . 15,416 — — 15,273 — — —
Minimums recognized asrevenue . . . . . . . . . . . . . . 8,285 6,528 1,757 23,956 23,029 526 401
Override royalties . . . . . . . . 13,499 10,372 3,127 15,527 13,979 1,548 —
Other . . . . . . . . . . . . . . . . . . 26,319 22,112 445 20,087 18,256 394 —
Total revenues . . . . . . . . . . . $358,117 $274,194 $13,479 $379,147 $343,352 $9,524 $9,561
Principles of Consolidation
The financial statements include the accounts of Natural Resource Partners L.P. and its wholly ownedsubsidiaries, as well as BRP LLC, a joint venture with International Paper Company controlled by thePartnership. Intercompany transactions and balances have been eliminated.
Business Combinations
For purchase acquisitions accounted for as business combinations, the Partnership is required to record theassets acquired, including identified intangible assets and liabilities assumed at their fair value, which in manyinstances involves estimates based on third party valuations, such as appraisals, or internal valuations based ondiscounted cash flow analyses or other valuation techniques.
Use of Estimates
Preparation of the accompanying financial statements in conformity with accounting principles generallyaccepted in the United States requires management to make estimates and assumptions that affect the reportedamounts of assets and liabilities in the accompanying Consolidated Balance Sheets and the reported amounts ofrevenues and expenses in the accompanying Consolidated Statements of Comprehensive Income during thereporting period. Actual results could differ from those estimates.
83

Fair Value
The Partnership discloses certain assets and liabilities using fair value as defined by authoritative guidance.Fair value is defined as the price that would be received to sell an asset or paid to transfer a liability in an orderlytransaction between market participants at the measurement date. See “Note 11. Fair Value Measurements.”
There are three levels of inputs that may be used to measure fair value:
• Level 1—Quoted prices in active markets for identical assets or liabilities.
• Level 2—Observable inputs other than Level 1 prices, such as quoted prices for similar assets orliabilities; quoted prices in markets that are not active; or other inputs that are observable or can becorroborated by observable market data for substantially the full term of the assets or liabilities.
• Level 3—Unobservable inputs that are supported by little or no market activity and that are significant tothe fair value of the assets or liabilities. Level 3 assets and liabilities include financial instruments whosevalue is determined using pricing models, discounted cash flow methodologies, or similar techniques, aswell as instruments for which the determination of fair value requires significant management judgment orestimation.
Cash and Cash Equivalents
The Partnership considers all highly liquid short-term investments with an original maturity of three monthsor less to be cash equivalents.
Accounts Receivable
Accounts receivable from the Partnership’s lessees and customers do not bear interest. Receivables arerecorded net of the allowance for doubtful accounts in the accompanying Consolidated Balance Sheets. ThePartnership evaluates the collectability of its accounts receivable based on a combination of factors. ThePartnership regularly analyzes its accounts receivable and when it becomes aware of a specific lessee’s orcustomer’s inability to meet its financial obligations to the Partnership, such as in the case of bankruptcy filingsor deterioration in the lessee’s or customer’s operating results or financial position, the Partnership records aspecific reserve for bad debt to reduce the related receivable to the amount it reasonably believes is collectible.Accounts are charged off when collection efforts are complete and future recovery is doubtful.
Inventory
Inventories are stated at the lower of cost or market. The cost of aggregates and asphalt components such asstone, sand, and recycled and liquid asphalt is determined by the first-in, first-out (FIFO) method. Cost includesall direct materials, direct labor and related production overheads based on normal operating capacity. The costof supplies inventory is determined by the average cost method and includes operating and maintenance suppliesto be used in the Partnership’s aggregates operations.
Plant and Equipment
Plant and equipment consists of coal preparation plants, related coal handling facilities, and other coal andaggregate processing and transportation infrastructure. Expenditures for new facilities and expenditures thatsubstantially increase the useful life of property, including interest during construction, are capitalized andreported in the Consolidated Statements of Cash Flows. These assets are recorded at cost and are depreciated on astraight-line basis over their useful lives generally as follows:
Years
Buildings and improvements . . . . . . . . . . . . . . . . . . . . . . . . . . . . . . . . . . . . . . . . . . . . . . 20 to 40
Machinery and equipment . . . . . . . . . . . . . . . . . . . . . . . . . . . . . . . . . . . . . . . . . . . . . . . . 5 to 12
Leasehold improvements . . . . . . . . . . . . . . . . . . . . . . . . . . . . . . . . . . . . . . . . . . . . . . . . . Life of Lease
84

The Partnership begins capitalizing mine development costs at its aggregates operations at a point whenreserves are determined to be proven or probable, economically mineable and when demand supports investmentin the market. Capitalization of these costs ceases when production commences. Mine development costs areamortized based on production over the estimated life of mineral reserves and amortization is included as acomponent of depreciation expense.
Mineral Rights
Mineral rights owned and leased are initially recorded using the FASB’s business combination and assetpurchase authoritative guidance depending on circumstances. Coal and aggregate mineral rights are depleted on aunit-of-production basis by lease, based upon minerals mined in relation to the net cost of the mineral propertiesand estimated proven and probable tonnage therein. The Partnership owns royalty and non-operated workinginterests in oil and natural gas minerals, all of which are located in the U.S. The Partnership does not determinewhether or when to develop reserves. The Partnership uses the successful efforts method to account for itsworking interest in oil and gas properties. Oil and gas non-operated working interests are depleted on a unit-of-production basis. The depletion rate is adjusted annually based upon the amount of remaining reserves asdetermined by independent third party petroleum engineers. Oil and gas royalty interests are depleted on astraight-line basis over 30 years or the life of the asset, whichever is shorter.
Intangible Assets
The Partnership’s intangible assets consist primarily of contracts that at acquisition were more favorable forthe Partnership than prevailing market rates, known as above-market contracts. The estimated fair values of theabove-market rate contracts are determined based on the present value of future cash flow projections related tothe underlying assets acquired. Intangible assets are amortized on a unit-of-production basis except that aminimum amortization is calculated on a straight-line basis for temporarily idled assets.
Equity Investments
The Partnership accounts for non-marketable investments using the equity method of accounting if theinvestment gives it the ability to exercise significant influence over, but not control of, an investee. Significantinfluence generally exists if the Partnership has an ownership interest representing between 20% and 50% of thevoting stock of the investee.
Under the equity method of accounting, investments are stated at initial cost and are adjusted for subsequentadditional investments and the proportionate share of earnings or losses and distributions. The basis differencebetween the investment and the proportional share of the fair value of the underlying net assets of equity methodinvestees is hypothetically allocated first to identified tangible assets and liabilities, then to finite-livedintangibles or indefinite-lived intangibles and the balance is attributed to goodwill. The portion of the basisdifference attributed to net tangible assets and finite-lived intangibles is amortized over its estimated useful lifewhile indefinite-lived intangibles, if any, and goodwill are not amortized. The amortization of the basisdifference is recorded as a reduction of earnings from the equity investment in the Consolidated Statements ofComprehensive Income.
The Partnership’s carrying value in an equity method investee company is reflected in the caption “Equityand other unconsolidated investments” in the Partnership’s Consolidated Balance Sheets. The Partnership’sadjusted share of the earnings or losses of the investee company is reflected in the Consolidated Statements ofComprehensive Income as revenues and other income under the caption ‘‘Equity and other unconsolidatedinvestment income.” These earnings are generated from natural resources, which are considered part of thePartnership’s core business activities consistent with its directly owned revenue generating activities. Investeeearnings are adjusted to reflect the amortization of any difference between the cost basis of the equity investmentand the proportionate share of the investee’s book value, which has been allocated to the fair value of netidentified tangible and finite-lived intangible assets and amortized over the estimated lives of those assets.
85

Deferred Financing Costs
Deferred financing costs consist of legal and other costs related to the issuance of the Partnership’s long-term debt. These costs are amortized over the term of the debt.
Asset Impairment
The Partnership has developed procedures to periodically evaluate its long-lived assets for possibleimpairment. These procedures are performed throughout the year and are based on historic, current and futureperformance and are designed to be early warning tests. If an asset fails one of the early warning tests, additionalevaluation is performed for that asset that considers both quantitative and qualitative information. A long-livedasset is deemed impaired when the future expected undiscounted cash flows from its use and disposition is lessthan the assets’ carrying value. Impairment is measured based on the estimated fair value, which is usuallydetermined based upon the present value of the projected future cash flow compared to the assets’ carrying value.In addition to the evaluations discussed above, specific events such as a reduction in economically recoverablereserves or production ceasing on a property for an extended period may require a separate impairmentevaluation be completed on a significant property. As a result of the continued weakness in the coal markets andthe potential for further declines in oil and natural gas prices, the Partnership intends to closely monitor its coaland oil and gas assets and the impairment evaluation process may be completed more frequently if deemednecessary by the Partnership. Future impairment analyses could result in downward adjustments to the carryingvalue of the Partnership’s assets.
The Partnership evaluates its equity investments for impairment when events or changes in circumstancesindicate, in management’s judgment, that the carrying value of such investment may have experienced an otherthan temporary decline in value. When evidence of loss in value has occurred, management compares theestimated fair value of the investment to the carrying value of the investment to determine whether impairmenthas occurred. If the estimated fair value is less than the carrying value and management considers the decline invalue to be other than temporary, the excess of the carrying value over the estimated fair value is recognized inthe financial statements as an impairment loss. The fair value of the impaired investment is based on quotedmarket prices, or upon the present value of expected cash flows using discount rates believed to be consistentwith those used by principal market participants, plus market analysis of comparable assets owned by theinvestee, if appropriate. No impairment losses have been recognized for equity investments as of December 31,2014.
In accordance with accounting and disclosure guidance for goodwill, the Partnership tests its recordedgoodwill for impairment annually or more often if indicators of potential impairment exist, by determining if thecarrying value of a reporting unit exceeds its estimated fair value. Factors that could trigger an interimimpairment test include, but are not limited to, underperformance relative to historical or projected futureoperating results or significant changes in the reporting units, business, industry, or economic trends.
Share-Based Payment
The Partnership accounts for awards relating to its Long-Term Incentive Plan using the fair value method,which requires the Partnership to estimate the fair value of the grant, and charge or credit the estimated fair valueto expense over the service or vesting period of the grant based on fluctuations in the Partnership’s common unitprice. In addition, estimated forfeitures are included in the periodic computation of the fair value of the liabilityand the fair value is recalculated at each reporting date over the service or vesting period of the grant. See“Note 16. Incentive Plans.”
Deferred Revenue
Most of the Partnership’s coal and aggregates lessees must make minimum annual or quarterly paymentswhich are generally recoupable over certain time periods. These minimum payments are recorded as deferredrevenue when received. The deferred revenue attributable to the minimum payment is recognized as revenuebased upon the underlying mineral lease when the lessee recoups the minimum payment through production or inthe period immediately following the expiration of the lessee’s ability to recoup the payments.
86

Asset Retirement Costs and Obligations
The Partnership accrues for mine closure, reclamation as well as plugging and abandonment of its oil andgas non-operated working interests in accordance with authoritative guidance related to accounting for assetretirement and environmental obligations. This guidance requires the fair value of an obligation be recognized inthe period it is incurred, if the fair value can be reasonably estimated. The Partnership recognizes an asset andliability related to the present value of future estimated costs. Depreciation or depletion of the capitalized assetretirement cost is determined based upon the underlying asset being retired in the future. Accretion of the assetretirement obligation is recognized over time and will increase as the obligation becomes more near term. It isreasonably possible that the estimates related to asset retirement and environmental obligations may change inthe future. See “Note 13. Asset Retirement Obligations.”
Revenues
Coal related revenues. Coal related revenue consist primarily of royalties as well as transportation andprocessing fees. Royalty revenues are recognized on the basis of tons of mineral sold by the Partnership’s lesseesand the corresponding revenue from those sales. Generally, the lessees make payments to the Partnership basedon the greater of a percentage of the gross sales price or a fixed price per ton of mineral they sell. Processing feesare recognized on the basis of tons of material processed through the facilities by the Partnership’s lessees andthe corresponding revenue from those sales. Generally, the lessees of the processing facilities make payments tothe Partnership based on the greater of a percentage of the gross sales price or a fixed price per ton of materialthat is processed and sold from the facilities. The processing leases are structured in a manner so that the lesseesare responsible for operating and maintenance expenses associated with the facilities. Transportation fees arerecognized on the basis of tons of material transported over the beltlines. Under the terms of the transportationcontracts, the Partnership receives a fixed price per ton for all material transported on the beltlines.
Oil and Gas Revenues. Oil and gas related revenues consist of non-operated working interests, royaltiesand overriding royalties. Revenues related to the Partnership’s non-operated working interests in oil and gasassets are recognized based on the amount actually sold. The Partnership also has capital expenditure andoperating expenditure obligations associated with the non-operated working interests. The Partnership’s revenuesfluctuate based on changes in the market prices for oil and natural gas, the decline in production from producingwells, and other factors affecting the third-party oil and natural gas exploration and production companies thatoperate the wells, including the cost of development and production. Oil and gas royalty revenues are recognizedon the basis of volume of hydrocarbons sold by lessees and the corresponding revenue from those sales. Also,included within oil and gas royalties are lease bonus payments, which are generally paid upon the execution of alease. Some leases are subject to minimum annual payments or delay rentals.
Aggregates and Industrial Minerals Related Revenues. Aggregates and industrial minerals relatedrevenues consist primarily of revenues generated by VantaCore’s construction aggregates business, royalties andoverriding royalties. Revenues from the sale of aggregates, gravel, sand and asphalt are recorded based upon thetransfer of product at delivery to customers, which generally occurs at the quarries or asphalt plants at eithermarket or contractual prices. Aggregates royalty and overriding royalty revenues are recognized on the basis oftons of mineral sold by the Partnership’s lessees and the corresponding revenue from those sales. Generally, thelessees make payments to the Partnership based on the greater of a percentage of the gross sales price or a fixedprice per ton of mineral they sell. Revenues from long-term construction contracts are recognized on thepercentage-of-completion method, measured by the percentage of total costs incurred to date to the estimatedtotal costs for each contract. That method is used since the Partnership considers total cost to be the best availablemeasure of progress on the contracts. Provisions for estimated losses on uncompleted contracts are made in theperiod in which such losses are determined. Changes in job performance, job conditions and estimatedprofitability, including those arising from final contract settlements, which result in revisions to job costs andprofits are recognized in the period in which the revisions are determined. Contract costs include all direct jobcosts and those indirect costs related to contract performance, such as indirect labor, supplies, insurance,equipment maintenance and depreciation. General and administrative costs are charged to expense as incurred.
87

Property Taxes
The Partnership is responsible for paying property taxes on the properties it owns. Typically, the lessees arecontractually responsible for reimbursing the Partnership for property taxes on the leased properties. Thepayment of and reimbursement of property taxes is included in Property taxes revenue and in Property, franchiseand other taxes expense, respectively, in the Consolidated Statements of Comprehensive Income.
Transportation Revenue and Expense
Shipping and handling costs invoiced to aggregate customers and paid to third-party carriers are recorded asAggregate related revenues and Aggregates operating expenses in the Consolidated Statements ofComprehensive Income.
Income Taxes
No provision for income taxes related to the operations of the Partnership has been included in theaccompanying financial statements because, as a partnership, it is not subject to federal or material state incometaxes and the tax effect of its activities accrues to the unitholders. Net income for financial statement purposesmay differ significantly from taxable income reportable to unitholders as a result of differences between the taxbases and financial reporting bases of assets and liabilities. In the event of an examination of the Partnership’stax return, the tax liability of the partners could be changed if an adjustment in the Partnership’s income isultimately sustained by the taxing authorities.
Lessee Audits and Inspections
The Partnership periodically audits lessee information by examining certain records and internal reports ofits lessees. The Partnership’s regional managers also perform periodic mine inspections to verify that theinformation that has been reported to the Partnership is accurate. The audit and inspection processes are designedto identify material variances from lease terms as well as differences between the information reported to thePartnership and the actual results from each property. Audits and inspections, however, are in periods subsequentto when the revenue is reported and any adjustment identified by these processes might be in a reporting perioddifferent from when the revenue was initially recorded. Typically there are no material adjustments from thisprocess.
New Accounting Standards
In May 2014, the FASB amended revenue recognition topics and created a new topic relating to revenuerecognition that will supersede existing guidance under U.S. GAAP. The core principle of the new guidance is torecognize revenue when promised goods or services are transferred to the customer and in an amount that reflectsthe consideration expected in exchange for those goods or services. To achieve this core principle, an entityshould (1) identify the contract(s) with the customer, (2) identify the performance obligations in the contract,(3) determine the transaction price, (4) allocate the transaction price to the performance obligations in thecontract and (5) recognize revenue when each performance obligation is satisfied. The guidance also specifies theaccounting for some costs to obtain or fulfill a contract with a customer. Disclosure requirements includesufficient qualitative and quantitative information to enable financial statement users to understand the nature,amount, timing and uncertainty of revenues and cash flows arising from contracts with customers. The new topicis effective for annual reporting periods beginning after December 15, 2016, including interim periods within thatreporting period. The guidance allows for either full adoption or a modified retrospective adoption. ThePartnership is currently evaluating the requirements to determine the impact, if any, of this new topic on itsfinancial position, results of operations and cash flows.
Other accounting standards that have been issued by the FASB or other standards-setting bodies are notexpected to have a material impact on the Partnership’s financial position, results of operations or cash flows.
88

3. Significant Acquisitions
VantaCore. Consistent with the Partnership’s diversification plan, on October 1, 2014, the Partnershipcompleted its acquisition of VantaCore Partners LLC (“VantaCore”), a privately held company specializing inthe construction materials industry, for $201 million in cash and common units. Headquartered in Philadelphia,Pennsylvania, VantaCore operates three hard rock quarries, five sand and gravel plants, two asphalt plants and amarine terminal. VantaCore’s current operations are located in Pennsylvania, West Virginia, Tennessee,Kentucky and Louisiana.
Transaction costs through December 31, 2014 associated with this acquisition were $2.9 million and wereexpensed as incurred. These expenses are reflected in General and administrative expense on the ConsolidatedStatements of Comprehensive Income. Included in the consolidated statements of comprehensive income for theyear ended December 31, 2014 were revenue of $42.1 million and operating expenses of $32.3 million, includingdepreciation and depletion of $3.2 million.
The Partnership accounted for the transaction in accordance with the authoritative guidance for businesscombinations, which requires the acquired assets and liabilities to be recorded at fair values as of the acquisitiondate of October 1, 2014. The following table summarizes the purchase price and the preliminary estimated valuesof assets acquired and liabilities assumed and are subject to revision as the Partnership continues to completeappraisals of the fair value of the assets acquired and liabilities assumed. The preliminary allocation was basedon the book values of the assets and liabilities assumed with the excess of purchase price over net book valueallocated to goodwill. Adjustments to the estimated fair values may be recorded during the allocation period, notto exceed one year from the date of acquisition.
Preliminary Purchase Price Allocation—VantaCore Partners LLC AcquisitionOctober 1, 2014
(In thousands)
ConsiderationCash . . . . . . . . . . . . . . . . . . . . . . . . . . . . . . . . . . . . . . . . . . . . . . . . . . . . . . . . . . . . . . . $168,978NRP common units(1) . . . . . . . . . . . . . . . . . . . . . . . . . . . . . . . . . . . . . . . . . . . . . . . . . 31,604
Total consideration given . . . . . . . . . . . . . . . . . . . . . . . . . . . . . . . . . . . . . . . . . . . . $200,582
Preliminary Allocation of Purchase PriceCurrent assets . . . . . . . . . . . . . . . . . . . . . . . . . . . . . . . . . . . . . . . . . . . . . . . . . . . . . . . . $ 37,222Land, property and equipment . . . . . . . . . . . . . . . . . . . . . . . . . . . . . . . . . . . . . . . . . . . 40,411Mineral rights . . . . . . . . . . . . . . . . . . . . . . . . . . . . . . . . . . . . . . . . . . . . . . . . . . . . . . . 87,907Other assets . . . . . . . . . . . . . . . . . . . . . . . . . . . . . . . . . . . . . . . . . . . . . . . . . . . . . . . . . 3,268Current liabilities . . . . . . . . . . . . . . . . . . . . . . . . . . . . . . . . . . . . . . . . . . . . . . . . . . . . . (16,953)Asset retirement obligation . . . . . . . . . . . . . . . . . . . . . . . . . . . . . . . . . . . . . . . . . . . . . (3,285)Goodwill . . . . . . . . . . . . . . . . . . . . . . . . . . . . . . . . . . . . . . . . . . . . . . . . . . . . . . . . . . . 52,012
Fair value of net assets acquired . . . . . . . . . . . . . . . . . . . . . . . . . . . . . . . . . . . . . . . . . $200,582
(1) Includes 2,426,690 units issued on October 1, 2014 at $13.02, closing price on that day and 813 units issuedfor a post-closing adjustment on December 4, 2014 at $10.48.
Sanish Field. Consistent with the Partnership’s diversification plans, in November 2014, the Partnershipcompleted the purchase of a 40% member interest in Kaiser-Whiting, LLC (“Kaiser LLC”) for $339 million,subject to customary post-closing purchase price adjustments. Effective November 13, 2014, NRP Oil and Gaswithdrew as a member of Kaiser LLC and an undivided 40% interest in Kaiser LLC’s assets was distributed outof Kaiser LLC, and assigned directly to the Partnership. The assets distributed to the Partnership included non-operated working interests in approximately 6,086 net acres with an average working interest of approximately14.5%. The assets, located in the Sanish Field in Mountrail County, North Dakota, are all held by production andinclude 192 producing wells.
89

The transaction costs incurred in connection with this acquisition were $1.8 million through December 31,2014, and were expensed as incurred. These expenses are reflected in General and administrative expense on theConsolidated Statements of Comprehensive Income. Included in the consolidated statements of comprehensiveincome for the year ended December 31, 2014, was revenue of $12.8 million and operating costs of $9.1 millionincluding depletion expense of $6.7 million related to the Sanish Field acquisition.
The Partnership accounted for the transaction in accordance with the authoritative guidance for businesscombinations, which requires the acquired assets and liabilities to be recorded at fair values as of the acquisitiondate of November 12, 2014. The following table summarizes the preliminary purchase price and the preliminaryestimated values of assets acquired and liabilities assumed and are subject to revision as the Partnershipcontinues to complete appraisals of the fair value of the assets and liabilities assumed. Adjustments to theestimated fair values may be recorded during the allocation period, not to exceed one year from the date ofacquisition.
Preliminary Purchase Price Allocation—Sanish Field Acquisition
November 12, 2014
(In thousands)
Mineral rightsProven oil and gas properties . . . . . . . . . . . . . . . . . . . . . . . . . . . . . . . . . . . . . . . $298,627
Probable and possible resources . . . . . . . . . . . . . . . . . . . . . . . . . . . . . . . . . . . . . 40,800
Total fair value of oil and gas properties acquired . . . . . . . . . . . . . . . . . . . . . . . . . . . 339,427
Asset retirement obligation . . . . . . . . . . . . . . . . . . . . . . . . . . . . . . . . . . . . . . . . . (427)
Fair value of net assets acquired . . . . . . . . . . . . . . . . . . . . . . . . . . . . . . . . . . . . . . . . . $339,000
Pending the final purchase price adjustments and allocation, the net assets acquired of approximately $339.4million are included in Mineral Rights in the accompanying Consolidated Balance Sheet. The acquisitionqualifies as a business combination, and as such, the Partnership estimated the fair value of each asset acquiredand liability assumed as of the acquisition date. Fair value measurements utilize assumptions of marketparticipants. To determine the fair value of the oil and gas assets, the Partnership used an income approach basedon a discounted cash flow model and made market assumptions as to future commodity prices, projections ofestimated quantities of oil and natural gas reserves, expectations for timing and amount of future developmentand operating costs, projections of future rates of production, expected recovery rates and risk-adjusted discountrates. The Partnership determined the appropriate discount rates used for the discounted cash flow analyses byusing a weighted average cost of capital from a market participant perspective plus reserve-specific riskpremiums for the assets acquired. The Partnership estimated reserve-specific risk premiums taking intoconsideration that the related reserves are primarily oil, among other hydrocarbons. Given the unobservablenature of some of the significant inputs, they are deemed to be Level 3 in the fair value hierarchy. The initialestimate of asset retirement obligation liability was based upon historical information from Kaiser LLC.
Pro Forma Financial Information
As stated above, the Partnership completed the Sanish Field acquisition on November 13, 2014 and theVantaCore acquisition on October 1, 2014. Below are the combined results of operations for the twelve monthsended December 31, 2014 and 2013 as if the acquisitions had occurred on January 1, 2013.
The unaudited pro forma results reflect significant pro forma adjustments related to funding the acquisitionthrough the issuance of Partnership units and debt and additional depletion expense as a result of the Kaiser andVantaCore acquisitions. The pro forma results do not include any cost savings or other synergies that may result fromthe acquisition or any estimated costs that have been or will be incurred by the Partnership to integrate the propertiesacquired. The pro forma results are not necessarily indicative of what actually would have occurred if the acquisitionhad been completed as of the beginning of the period, nor are they necessarily indicative of future results.
90

For the Years endedDecember 31,
2014 2013
(In thousands)
Revenue and other income except aggregate and oil and gas relatedrevenues . . . . . . . . . . . . . . . . . . . . . . . . . . . . . . . . . . . . . . . . . . . . . . . . . . . . . $286,062 $327,558
Aggregates related revenues . . . . . . . . . . . . . . . . . . . . . . . . . . . . . . . . . . . . . . . 137,220 152,032
Oil and gas related revenues . . . . . . . . . . . . . . . . . . . . . . . . . . . . . . . . . . . . . . . 110,235 100,343
Total revenue . . . . . . . . . . . . . . . . . . . . . . . . . . . . . . . . . . . . . . . . . . . . . . . . . $533,517 $579,933
Net income . . . . . . . . . . . . . . . . . . . . . . . . . . . . . . . . . . . . . . . . . . . . . . . . . . . . $122,319 $197,164
Basic and diluted net income per limited partner unit . . . . . . . . . . . . . . . . . . . $ 0.99 $ 1.60
Sundance. On December 19, 2013, the Partnership completed the acquisition of non-operated workinginterests in oil and gas properties in the Williston Basin of North Dakota from Sundance Energy, Inc. for $29.4million, following post-closing purchase price adjustments. The Partnership accounted for the transaction inaccordance with the authoritative guidance for business combinations. During the third quarter of 2014, thePartnership finalized the determination of the fair value of the assets acquired and liabilities assumed in theacquisition, with no material adjustments. The assets acquired are included in Mineral rights in theaccompanying Consolidated Balance Sheets.
Abraxas. On August 9, 2013, the Partnership completed the acquisition of non-operated working interestsin oil and gas properties in the Williston Basin of North Dakota and Montana from Abraxas Petroleum for $38.0million, following post-closing purchase price adjustments. The Partnership accounted for the transaction inaccordance with the authoritative guidance for business combinations. During the second quarter of 2014, thePartnership finalized the determination of the fair values of the assets acquired and liabilities assumed in theacquisition, with no material adjustments. The assets acquired are included in Mineral rights on theaccompanying Consolidated Balance Sheets.
With respect to the Abraxas and Sundance acquisitions, revenues of $36.1 million, capital expenditures of$22.9 and operating expenses of $12.3 million were included in the Consolidated Statements of ComprehensiveIncome and Consolidated Balance Sheet for the year ended December 31, 2014. For the year endedDecember 31, 2013, revenues and total operating expenses from the Abraxas and Sundance acquisitions were$5.4 million and $2.9 million, respectively.
4. Equity and Other Investments
The Partnership owns a 49% non-controlling equity interest in OCI Wyoming LLC (OCI Wyoming). Theinvestment was acquired from Anadarko Holding Company (Anadarko) and its subsidiary, Big Island TronaCompany for $292.5 million during 2013. OCI Wyoming’s operations consist of the mining of trona ore, which,when refined, become soda ash. All soda ash is sold through an affiliated sales agent to various domestic andEuropean customers and to American Natural Soda Ash Corporation for export primarily to Asia and LatinAmerica. Included in fair value adjustments, is an increase in the Partnership’s proportionate fair value ofproperty, plant and equipment of $65.4 million, which will be depreciated using the straight-line method over aweighted average life of 28 years. Also, $132.7 million has been assigned to a right to mine asset which will beamortized using the units of production method. Under the equity method of accounting, these amounts are notreflected individually in the accompanying consolidated financial statements but are used to determine periodiccharges to amounts reflected as income earned from the equity investment.
The acquisition agreement provides for a net present value of up to $50 million in cumulative additionalcontingent consideration payable by the Partnership should certain performance criteria as defined in thepurchase and sale agreement be met by OCI Wyoming in any of the years 2013, 2014 or 2015. At December 31,2014, the Partnership had accrued $14.5 million of contingent consideration that is included in Equity and other
91

unconsolidated investments. The current portion of $3.8 million is included in Accounts payable and accruedliabilities and the long term portion of $10.7 million is included in Other non-current liabilities. During 2014 thePartnership paid a $0.5 million payment for contingent consideration.
The table below summarizes the differences between the carrying amount of the Partnership’s investmentand the amount of the Partnership’s underlying equity in the net assets of OCI Wyoming. For both the twelvemonth periods ended December 31, 2014 and 2013, the Partnership derived approximately 10% of its revenuesand other income from its equity investment in OCI Wyoming.
For the Year EndedDecember 31,
2014 2013
(In thousands)
Net book value of NRP’s equity interests . . . . . . . . . . . . . . . . . . . . . . . . . . . . . $101,311 $ 96,692
Equity and other unconsolidated investments . . . . . . . . . . . . . . . . . . . . . . . . . . $264,020 $269,338
Excess of NRP’s investment over net book value of NRP’s equity interest . . . $162,709 $172,646
Income allocation to NRP’s equity interests . . . . . . . . . . . . . . . . . . . . . . . . . . . $ 47,354 $ 37,036
Amortization of basis difference . . . . . . . . . . . . . . . . . . . . . . . . . . . . . . . . . . . . $ (5,938) $ (2850)
Equity and other unconsolidated investment income . . . . . . . . . . . . . . . . . . . . $ 41,416 $ 34,186
The following summarized financial information was taken from the OCI Wyoming-prepared financialstatements.
For the Year EndedDecember 31,
2014 2013
(In thousands)
Sales . . . . . . . . . . . . . . . . . . . . . . . . . . . . . . . . . . . . . . . . . . . . . . . . . . . . . . . . . $465,032 $442,132
Gross profit . . . . . . . . . . . . . . . . . . . . . . . . . . . . . . . . . . . . . . . . . . . . . . . . . . . . $118,439 $ 94,299
Net Income . . . . . . . . . . . . . . . . . . . . . . . . . . . . . . . . . . . . . . . . . . . . . . . . . . . . $ 96,640 $ 79,655
Current assets . . . . . . . . . . . . . . . . . . . . . . . . . . . . . . . . . . . . . . . . . . . . . . . . . . $200,622 $201,265
Noncurrent assets . . . . . . . . . . . . . . . . . . . . . . . . . . . . . . . . . . . . . . . . . . . . . . . $202,282 $194,508
Current liabilities . . . . . . . . . . . . . . . . . . . . . . . . . . . . . . . . . . . . . . . . . . . . . . . . $ 47,704 $ 39,663
Noncurrent liabilities . . . . . . . . . . . . . . . . . . . . . . . . . . . . . . . . . . . . . . . . . . . . . $149,192 $158,779
5. Allowance for Doubtful Accounts
Activity in the allowance for doubtful accounts for the years ended December 31, 2014, 2013 and 2012 wasas follows:
2014 2013 2012
(In thousands)
Balance, January 1 . . . . . . . . . . . . . . . . . . . . . . . . . . . . . . . . . . . . . . . . . . . . . $ 275 $ 711 $393
Provision charged to operations:
Additions to the reserve . . . . . . . . . . . . . . . . . . . . . . . . . . . . . . . . . . . . . . . 774 278 318
Collections of previously reserved accounts . . . . . . . . . . . . . . . . . . . . . . . (373) — —
Total charged (credited) to operations . . . . . . . . . . . . . . . . . . . . . . . . . . . . 401 278 318
Non-recoverable balances written off . . . . . . . . . . . . . . . . . . . . . . . . . . . . . . — (714) —
Balance, December 31 . . . . . . . . . . . . . . . . . . . . . . . . . . . . . . . . . . . . . . . . . . $ 676 $ 275 $711
92

The Partnership acquired $0.5 million of allowances for doubtful accounts with its acquisition ofVantaCore.
6. Inventory
The components of inventories at December 31, 2014 are as follows:
2014
(In thousands)
Aggregates . . . . . . . . . . . . . . . . . . . . . . . . . . . . . . . . . . . . . . . . . . . . . . . . . . . . . . . . . . . . . $4,596
Supplies and parts . . . . . . . . . . . . . . . . . . . . . . . . . . . . . . . . . . . . . . . . . . . . . . . . . . . . . . . 1,218
$5,814
All of the Partnership’s inventory for 2014 was acquired with its acquisition of VantaCore. For the yearended December 31, 2013, the Partnership did not have inventory.
7. Plant and Equipment
The Partnership’s plant and equipment consist of the following:
December 31,2014
December 31,2013
(In thousands)
Construction in process . . . . . . . . . . . . . . . . . . . . . . . . . . . . . . . . . . . . . . . $ 457 $ —
Plant and equipment at cost . . . . . . . . . . . . . . . . . . . . . . . . . . . . . . . . . . . . 89,759 55,271
Less accumulated depreciation . . . . . . . . . . . . . . . . . . . . . . . . . . . . . . . . . (30,123) (28,836)
Net book value . . . . . . . . . . . . . . . . . . . . . . . . . . . . . . . . . . . . . . . . . . . . . . $ 60,093 $ 26,435
For the Years endedDecember 31,
2014 2013 2012
(In thousands)
Total depreciation expense on plant and equipment . . . . . . . . . . . . . . . . $7,631 $5,966 $6,825
During the fourth quarter of 2014, the Partnership impaired a preparation plant. The impairment charge was$0.8 million and is included in Asset impairments in the Consolidated Statements of Comprehensive Income forthe year ending December 31, 2014.
8. Mineral Rights
The Partnership’s mineral rights consist of the following:
December 31,2014
December 31,2013
(In thousands)
Coal . . . . . . . . . . . . . . . . . . . . . . . . . . . . . . . . . . . . . . . . . . . . . . . . . . . . . . $1,541,572 $1,574,914
Oil and gas . . . . . . . . . . . . . . . . . . . . . . . . . . . . . . . . . . . . . . . . . . . . . . . . . 560,395 204,906
Aggregates . . . . . . . . . . . . . . . . . . . . . . . . . . . . . . . . . . . . . . . . . . . . . . . . . 211,490 100,080
Other . . . . . . . . . . . . . . . . . . . . . . . . . . . . . . . . . . . . . . . . . . . . . . . . . . . . . 15,014 15,020
Less accumulated depletion and amortization . . . . . . . . . . . . . . . . . . . . . . (546,619) (489,465)
Net book value . . . . . . . . . . . . . . . . . . . . . . . . . . . . . . . . . . . . . . . . . . . . . . $1,781,852 $1,405,455
93

For the years endedDecember 31,
2014 2013 2012
(In thousands)
Total depletion and amortization expense on mineral interests . . . . . $68,603 $54,595 $47,042
During its annual impairment analysis, the Partnership concluded certain unleased properties were impaireddue primarily to the ongoing regulatory environment and continued depressed coal markets with little indicationsof improvement in the near term. While these conditions affect the Partnership’s ability to lease properties, otherevents such as a lessee’s bankruptcy, a lease cancellation, lease modifications, a permanent idling of a propertycould result in triggering events warranting further analysis. The fair values for those unleased properties weredetermined for the associated reserves using Level 2 market approaches based upon recent comparable sales andLevel 3 expected cash flows. The resulting impairment expense of $19.8 million relating to coal and aggregatesmineral properties is included in Asset impairments on the Consolidated Statements of Comprehensive Income.
9. Intangible Assets
Amounts recorded as intangible assets along with the balances and accumulated amortization atDecember 31, 2014 and 2013 are reflected in the table below:
December 31,2014
December 31,2013
(In thousands)
Contract intangibles . . . . . . . . . . . . . . . . . . . . . . . . . . . . . . . . . . . . . . . . . . $ 82,972 $ 89,421
Other intangibles . . . . . . . . . . . . . . . . . . . . . . . . . . . . . . . . . . . . . . . . . . . . 3,004 —
Less accumulated amortization . . . . . . . . . . . . . . . . . . . . . . . . . . . . . . . . . (25,243) (22,471)
Net book value . . . . . . . . . . . . . . . . . . . . . . . . . . . . . . . . . . . . . . . . . . . . . . $ 60,733 $ 66,950
For the Years EndedDecember 31,
2014 2013 2012
(In thousands)
Total amortization expense on intangible assets . . . . . . . . . . . . . . . . . . . $3,642 $3,816 $4,354
Included in intangible assets are certain contract intangibles with a net book value of $1.3 million atDecember 31, 2014 that were deemed held for sale. During the fourth quarter $52.0 million of goodwill wasadded relating to the VantaCore acquisition. This amount represents the preliminary residual value and will beadjusted as the Partnership continues complete appraisals of fair value relating to the acquisition.
During the second quarter of 2014, the Partnership and a lessee amended an aggregates lease, which led thePartnership to conclude an impairment triggering event had occurred. Fair value of the lease agreement wasdetermined using Level 3 expected cash flows. The resulting impairment expense of $5.6 million is included inAsset impairments on the Consolidated Statements of Comprehensive Income.
The estimates of amortization expense for the periods as indicated below are based on current mining plansand are subject to revision as those plans change in future periods.
Estimated amortization expense (In thousands)
For year ended December 31, 2015 . . . . . . . . . . . . . . . . . . . . . . . . . . . . . . . . . . . . . . . . . . . . $3,486
For year ended December 31, 2016 . . . . . . . . . . . . . . . . . . . . . . . . . . . . . . . . . . . . . . . . . . . . 3,743
For year ended December 31, 2017 . . . . . . . . . . . . . . . . . . . . . . . . . . . . . . . . . . . . . . . . . . . . 3,326
For year ended December 31, 2018 . . . . . . . . . . . . . . . . . . . . . . . . . . . . . . . . . . . . . . . . . . . . 3,126
For year ended December 31, 2019 . . . . . . . . . . . . . . . . . . . . . . . . . . . . . . . . . . . . . . . . . . . . 3,053
94

10. Long-Term Debt
As used in this Note 10, references to “NRP LP” refer to Natural Resource Partners L.P. only, and not to NRP(Operating) LLC or any of Natural Resource Partners L.P.’s subsidiaries. References to “Opco” refer to NRP(Operating) LLC and its subsidiaries. References to NRP Oil and Gas refer to NRP Oil and Gas LLC, a wholly ownedsubsidiary of NRP LP. NRP Finance Corporation (NRP Finance) is a wholly owned subsidiary of NRP LP and a co-issuer with NRP LP on the 9.125% senior notes.
Long-term debt consists of the following:
December 31,2014
December 31,2013
(In thousands)
NRP LP Debt:$425 million 9.125% senior notes, with semi-annual interest payments in
April and October, maturing October 2018, $300 million issued at99.007% and $125 million issued at 99.5% . . . . . . . . . . . . . . . . . . . . . . . . $ 422,167 $ 297,170
Opco Debt:$300 million floating rate revolving credit facility, due August 2016 . . . . . . 200,000 20,000$200 million floating rate term loan, due January 2016 . . . . . . . . . . . . . . . . . 75,000 99,0004.91% senior notes, with semi-annual interest payments in June and
December, with annual principal payments in June, maturing in June2018 . . . . . . . . . . . . . . . . . . . . . . . . . . . . . . . . . . . . . . . . . . . . . . . . . . . . . . . 18,467 23,084
8.38% senior notes, with semi-annual interest payments in March andSeptember, with annual principal payments in March, maturing in March2019 . . . . . . . . . . . . . . . . . . . . . . . . . . . . . . . . . . . . . . . . . . . . . . . . . . . . . . . 107,143 128,571
5.05% senior notes, with semi-annual interest payments in January and July,with annual principal payments in July, maturing in July 2020 . . . . . . . . . 46,154 53,846
5.31% utility local improvement obligation, with annual principal andinterest payments, maturing in March 2021 . . . . . . . . . . . . . . . . . . . . . . . . 1,345 1,538
5.55% senior notes, with semi-annual interest payments in June andDecember, with annual principal payments in June, maturing in June2023 . . . . . . . . . . . . . . . . . . . . . . . . . . . . . . . . . . . . . . . . . . . . . . . . . . . . . . . 24,300 27,000
4.73% senior notes, with semi-annual interest payments in June andDecember, with scheduled principal payments beginning December2014, maturing in December 2023 . . . . . . . . . . . . . . . . . . . . . . . . . . . . . . . 67,500 75,000
5.82% senior notes, with semi-annual interest payments in March andSeptember, with annual principal payments in March, maturing in March2024 . . . . . . . . . . . . . . . . . . . . . . . . . . . . . . . . . . . . . . . . . . . . . . . . . . . . . . . 150,000 165,000
8.92% senior notes, with semi-annual interest payments in March andSeptember, with scheduled principal payments beginning March 2014,maturing in March 2024 . . . . . . . . . . . . . . . . . . . . . . . . . . . . . . . . . . . . . . . 45,455 50,000
5.03% senior notes, with semi-annual interest payments in June andDecember, with scheduled principal payments beginning December2014, maturing in December 2026 . . . . . . . . . . . . . . . . . . . . . . . . . . . . . . . 161,538 175,000
5.18% senior notes, with semi-annual interest payments in June andDecember, with scheduled principal payments beginning December2014, maturing in December 2026 . . . . . . . . . . . . . . . . . . . . . . . . . . . . . . . 46,154 50,000
NRP Oil and Gas Debt:Reserve-based revolving credit facility due 2019 . . . . . . . . . . . . . . . . . . . . . . 110,000 —
Total debt . . . . . . . . . . . . . . . . . . . . . . . . . . . . . . . . . . . . . . . . . . . . . . . . . . . . . . . 1,475,223 1,165,209Less—current portion of long term debt . . . . . . . . . . . . . . . . . . . . . . . . . . . . . . . (80,983) (80,983)
Long-term debt . . . . . . . . . . . . . . . . . . . . . . . . . . . . . . . . . . . . . . . . . . . . . . . . . . $1,394,240 $1,084,226
95
NRP LP Debt
Senior Notes. In September 2013, NRP LP, together with NRP Finance as co-issuer, issued $300 millionof 9.125% Senior Notes due 2018 at an offering price of 99.007% of par. Net proceeds after expenses from theissuance of the senior notes of approximately $289.0 million were used to repay all of the outstandingborrowings under Opco’s revolving credit facility and $91.0 million of Opco’s term loan. The senior notes callfor semi-annual interest payments on April 1 and October 1 of each year, beginning on April 1, 2014. The noteswill mature on October 1, 2018.
In October 2014, NRP LP, together with NRP Finance as co-issuer, issued an additional $125 million of its9.125% Senior Notes due 2018 at an offering price of 99.5% of par. The notes constitute the same series ofsecurities as the existing $300.0 million 9.125% senior notes due 2018 issued in September 2013. Net proceedsafter expenses from the issuance of the Senior Notes of approximately $122.6 million were used to fund a portionof the purchase price of NRP’s acquisition of non-operated working interests in oil and gas assets located in theWilliston Basin in North Dakota. The notes call for semi-annual interest payments as April 1 and October 1 ofeach year, beginning on April 1, 2015. The notes will mature on October 1, 2018.
The indenture for the senior notes contains covenants that, among other things, limit the ability of the NRPLP and certain of its subsidiaries to incur or guarantee additional indebtedness. Under the indenture, NRP LP andcertain of its subsidiaries generally are not permitted to incur additional indebtedness unless, on a consolidatedbasis, the fixed charge coverage ratio (as defined in the indenture) is at least 2.0 to 1.0 for the four preceding fullfiscal quarters. The ability of NRP LP and certain of its subsidiaries to incur additional indebtedness is furtherlimited in the event the amount of indebtedness of NRP LP and certain of its subsidiaries that is senior to NRPLP’s unsecured indebtedness exceeds certain thresholds.
Opco Debt
Senior Notes. Opco made principal payments of $80.8 million on its senior notes during the year endedDecember 31, 2014. The Opco senior note purchase agreement contains covenants requiring Opco to:
• Maintain a ratio of consolidated indebtedness to consolidated EBITDDA (as defined in the note purchaseagreement) of no more than 4.0 to 1.0 for the four most recent quarters;
• not permit debt secured by certain liens and debt of subsidiaries to exceed 10% of consolidated nettangible assets (as defined in the note purchase agreement); and
• maintain the ratio of consolidated EBITDDA to consolidated fixed charges (consisting of consolidatedinterest expense and consolidated operating lease expense) at not less than 3.5 to 1.0.
The 8.38% and 8.92% senior notes also provide that in the event that Opco’s leverage ratio exceeds 3.75 to1.00 at the end of any fiscal quarter, then in addition to all other interest accruing on these notes, additionalinterest in the amount of 2.00% per annum shall accrue on the notes for the two succeeding quarters and for aslong thereafter as the leverage ratio remains above 3.75 to 1.00.
Revolving Credit Facility. The weighted average interest rates for the debt outstanding under Opco’srevolving credit facility for the twelve months ended December 31, 2014 and year ended December 31, 2013were 1.98% and 2.23%, respectively. Opco incurs a commitment fee on the undrawn portion of the revolvingcredit facility at rates ranging from 0.18% to 0.40% per annum. The facility includes an accordion featurewhereby Opco may request its lenders to increase their aggregate commitment to a maximum of $500 million onthe same terms.
Opco’s revolving credit facility contains covenants requiring Opco to maintain:
• a ratio of consolidated indebtedness to consolidated EBITDDA (as defined in the credit agreement) not toexceed 4.0 to 1.0 and,
• a ratio of consolidated EBITDDA to consolidated fixed charges (consisting of consolidated interestexpense and consolidated lease operating expense) of not less than 3.5 to 1.0 for the four most recentquarters.
96

Term Loan Facility. During 2013, Opco issued $200 million in term debt. The weighted average interestrates for the debt outstanding under the term loan for the twelve months ended December 31, 2014 and 2013were 2.22% and 2.43% respectively. Opco repaid $101 million in principal under the term loan during the thirdquarter of 2013 and an additional $24 million during the fourth quarter of 2014. Repayment terms call for theremaining outstanding balance of $75 million to be paid on January 23, 2016. The debt is unsecured butguaranteed by the subsidiaries of Opco.
Opco’s term loan contains covenants requiring Opco to maintain:
• a ratio of consolidated indebtedness to consolidated EBITDDA (as defined in the credit agreement) not toexceed 4.0 to 1.0 and,
• a ratio of consolidated EBITDDA to consolidated fixed charges (consisting of consolidated interestexpense and consolidated lease operating expense) of not less than 3.5 to 1.0 for the four most recentquarters.
NRP Oil and Gas Debt
Revolving Credit Facility. In August 2013, NRP Oil and Gas entered into a 5-year, $100 million seniorsecured, reserve-based revolving credit facility in order to fund capital expenditure requirements related to thedevelopment of the oil and gas assets in which it owns non-operated working interests. In connection with theclosing of the Sanish Field acquisition in November 2014, the credit facility was amended to be a $500 millionfacility with an initial borrowing base of $137 million and will mature on November 12, 2019. The credit facilityis secured by a first priority lien and security interest in substantially all of the assets of NRP Oil and Gas. NRPOil and Gas is the sole obligor under its revolving credit facility, and neither the Partnership nor any of its othersubsidiaries is a guarantor of such facility. At December 31, 2014, there was $110.0 million outstanding underthe credit facility. The weighted average interest rate for the debt outstanding under the credit facility for thetwelve months ended December 31, 2014 was 2.37%.
Indebtedness under the NRP Oil and Gas credit facility bears interest, at the option of NRP Oil and Gas, ateither:
• the higher of (i) the prime rate as announced by the agent bank; (ii) the federal funds rate plus 0.50%; or(iii) LIBOR plus 1%, in each case plus an applicable margin ranging from 0.50% to 1.50%; or
• a rate equal to LIBOR, plus an applicable margin ranging from 1.50% to 2.50%.
NRP Oil and Gas incurs a commitment fee on the unused portion of the borrowing base under the creditfacility at a rate ranging from 0.375% to 0.50% per annum.
The NRP Oil and Gas credit facility contains certain covenants, which, among other things, require themaintenance of:
• a total leverage ratio (defined as the ratio of the total debt of NRP Oil and Gas to its EBITDAX) of notmore than 3.5 to 1.0; and
• a minimum current ratio of 1.0 to 1.0.
The maximum amount available under the credit facility is subject to semi-annual redeterminations of theborrowing base in May and November of each year, based on the value of the proved oil and natural gas reservesof NRP Oil and Gas, in accordance with the lenders’ customary procedures and practices. NRP Oil and Gas andthe lenders each have a right to one additional redetermination each year.
97

Consolidated Principal Payments
The consolidated principal payments due are set forth below:
NRP LP OpcoNRP
Oil and Gas
Senior Notes Senior Notes Credit Facility Term Loan Credit Facility Total
(In thousands)
2015 . . . . . . . . . . . . . . . . . . . . . $ — $ 80,983 $ — $ — $ — $ 80,983
2016 . . . . . . . . . . . . . . . . . . . . . — 80,983 200,000 75,000 — 355,983
2017 . . . . . . . . . . . . . . . . . . . . . — 80,983 — — — 80,983
2018 . . . . . . . . . . . . . . . . . . . . . 425,000(1) 80,983 — — — 505,983
2019 . . . . . . . . . . . . . . . . . . . . . — 76,366 — — 110,000 186,366
Thereafter . . . . . . . . . . . . . . . . — 267,758 — — — 267,758
$425,000 $668,056 $200,000 $75,000 $110,000 $1,478,056
(1) The 9.125% senior notes due 2018 were issued at a discount and as of December 31, 2014 were carried at$422.2 million.
NRP LP, Opco and NRP Oil and Gas were in compliance with all terms under their long-term debt as ofDecember 31, 2014. Opco’s revolving credit facility and term loan facility both mature in 2016. While thePartnership believes it has sufficient liquidity to meet its current financial needs, the Partnership will be requiredto repay or refinance the amounts outstanding under Opco’s credit facilities prior to their maturity. While thePartnership believes it will be able to refinance these amounts, it may not be able to do so on terms acceptable tothem, if at all, or the borrowing capacity under Opco’s revolving credit facility may be substantially reduced. ThePartnership’s ability to refinance these amounts may depend in part on its ability to access the debt or equitycapital markets, which will be challenging in the current commodity price environment.
11. Fair Value Measurements
The Partnership’s financial instruments consist of cash and cash equivalents, accounts receivable, accountspayable and long-term debt. The carrying amount of the Partnership’s financial instruments included in accountsreceivable and accounts payable approximates their fair value due to their short-term nature except for theaccounts receivable—affiliate relating to the Sugar Camp override that includes both current and long-termportions. The Partnership’s cash and cash equivalents include money market accounts and are considered aLevel 1 measurement. The fair market value and carrying value of the contractual override and long-term seniornotes are as follows:
Fair Value As Of Carrying Value As Of
December 31,2014
December 31,2013
December 31,2014
December 31,2013
(In thousands)
Assets
Sugar Camp override, current andlong-term . . . . . . . . . . . . . . . . . . . . . $ 5,162 $ 6,852 $ 4,870 $ 6,063
Liabilities
Long-term debt, current andlong-term . . . . . . . . . . . . . . . . . . . . . $1,096,520 $1,071,880 $1,090,223 $1,046,209
The fair value of the Sugar Camp override and long-term debt is estimated by discounting expected futurecash flows at a comparable term risk-free treasury interest rate plus a market rate component comparable to theyield premium observed on debt securities of similar risk and maturity, which is a Level 3 measurement. Sincethe Partnership’s credit facilities and term loan are variable rate debt, their fair values approximate their carryingamounts.
98

12. Related Party Transactions
Reimbursements to Affiliates of the Partnership’s General Partner
The Partnership’s general partner does not receive any management fee or other compensation for itsmanagement of Natural Resource Partners L.P. However, in accordance with the partnership agreement, thegeneral partner and its affiliates are reimbursed for expenses incurred on the Partnership’s behalf. All directgeneral and administrative expenses are charged to the Partnership as incurred. The Partnership also reimbursesindirect general and administrative costs, including certain legal, accounting, treasury, information technology,insurance, administration of employee benefits and other corporate services incurred by the Partnership’s generalpartner and its affiliates. The Partnership had accounts payable of $0.4 million with Western PocahontasProperties and $0.6 million with Quintana Minerals Corporation.
The reimbursements to affiliates of the Partnership’s general partner for services performed by WesternPocahontas Properties and Quintana Minerals Corporation are as follows:
For the Years EndedDecember 31,
2014 2013 2012
(In thousands)
Reimbursement for services . . . . . . . . . . . . . . . . . . . . . . . . . . . . . . . . . $11,798 $11,480 $9,791
The Partnership leases an office building in Huntington, West Virginia from Western Pocahontas Propertiesand pays $0.6 million in lease payments each year through December 31, 2018.
Transactions with Cline Affiliates
Various companies controlled by Chris Cline, including Foresight Energy LP, lease coal reserves from thePartnership, and the Partnership provides coal transportation services to them for a fee. Mr. Cline, bothindividually and through another affiliate, Adena Minerals, LLC, owns a 31% interest (unaudited) in thePartnership’s general partner, as well as 4,917,548 common units (unaudited) at December 31, 2014. AtDecember 31, 2014, the Partnership had accounts receivable totaling $9.2 million from Cline affiliates. Inaddition, the overriding royalty and the lease of the loadout facility at the Sugar Camp mine are classified ascontracts receivable of $50.0 million on the Partnership’s Consolidated Balance Sheets. Revenues from the Clineaffiliates are as follows:
For The Years EndedDecember 31,
2014 2013 2012
(In thousands)
Coal royalty revenues . . . . . . . . . . . . . . . . . . . . . . . . . . . . . . . . . . . . . $52,415 $54,322 $48,567Processing and transportation fees . . . . . . . . . . . . . . . . . . . . . . . . . . . 20,594 19,258 21,923Minimums recognized as revenue . . . . . . . . . . . . . . . . . . . . . . . . . . . — 3,477 17,785Override revenue . . . . . . . . . . . . . . . . . . . . . . . . . . . . . . . . . . . . . . . . 2,847 3,226 4,066Other revenue . . . . . . . . . . . . . . . . . . . . . . . . . . . . . . . . . . . . . . . . . . . 5,690 8,149 —
$81,546 $88,432 $92,341
As of December 31, 2014, the Partnership had received $86.8 million in minimum royalty payments thathave not been recouped by Cline affiliates, of which $16.0 million was received during 2014.
During the fourth quarter of 2012, the Partnership recognized an asset impairment of $2.6 million related tothe assets at the Gatling, WV location, a location leased to an affiliate of Chris Cline, due to receiving atermination notice in December 2012 that the lease was cancelled as of June 2013.
99

During 2014 and 2013, the Partnership recognized gains of $5.7 million and $8.1 million on reserve swapsin Illinois with Williamson Energy, a subsidiary of Foresight Energy LP. The gains are reflected in the tableabove in the “Other revenue” line. The fair value of the reserves was estimated using Level 3 cash flow approach.The expected cash flows were developed using estimated annual sales tons, forecasted sales prices andanticipated market royalty rates. The tons received during 2014 and 2013 were fully mined during each of thoseyears, while the tons exchanged are not included in the current mine plans. The gains are located in Coal relatedrevenues on the Consolidated Statements of Comprehensive Income.
The Partnership entered into a lease agreement related to the rail loadout and associated facilities at SugarCamp that has been accounted for as a direct financing lease. Total projected remaining payments under the leaseat December 31, 2014 are $86.3 million with unearned income of $39.0 million. The net amount receivable underthe lease as of December 31, 2014 was $47.3 million, of which $1.8 million is included in Accounts receivable—affiliates while the remaining is included in Long-term contracts receivable—affiliate on the accompanyingConsolidated Balance Sheets.
In a separate transaction, the Partnership acquired a contractual overriding royalty interest from a Clineaffiliate that provides for payments based upon production from specific tons at the Sugar Camp operations. Thisoverriding royalty was accounted for as a financing arrangement and is reflected as an affiliate receivable. Thenet amount receivable under the agreement as of December 31, 2014 was $5.6 million, of which $1.1 million isincluded in Accounts receivable—affiliates while the remaining is included in Long-term contracts receivable—affiliate on the accompanying Consolidated Balance Sheets.
Note to Cline Trust Company, LLC
Donald R. Holcomb, one of the Partnership’s directors, is a manager of Cline Trust Company, LLC, whichowns approximately 5.35 million of the Partnership’s common units and $20 million in principal amount of thePartnership’s 9.125% Senior Notes due 2018. The members of the Cline Trust Company are four trusts for thebenefit of the children of Christopher Cline, each of which owns an approximately equal membership interest inthe Cline Trust Company. Mr. Holcomb also serves as trustee of each of the four trusts. Cline Trust Company,LLC purchased the $20 million of the Partnership’s 9.125% Senior Notes due 2018 in the Partnership’s offeringof $125 million additional principal amount of such notes in October 2014 at the same price as the otherpurchasers in that offering. The balance on this portion of the Partnership’s 9.125% Senior Notes due 2018 was$19.9 million as of December 31, 2014 and is included with the Partnership’s long term debt.
Quintana Capital Group GP, Ltd.
Corbin J. Robertson, Jr. is a principal in Quintana Capital Group GP, Ltd., which controls several privateequity funds focused on investments in the energy business. In connection with the formation of QuintanaCapital, the Partnership adopted a formal conflicts policy that establishes the opportunities that will be pursuedby the Partnership and those that will be pursued by Quintana Capital. The governance documents of QuintanaCapital’s affiliated investment funds reflect the guidelines set forth in NRP’s conflicts policy.
A fund controlled by Quintana Capital owned a significant membership interest in Taggart Global USA,LLC, including the right to nominate two members of Taggart’s 5-person board of directors. In 2013, Taggartwas sold to Forge Group, and Quintana no longer retains an interest in Taggart or Forge. The Partnership ownsand leases preparation plants to Forge, which operates the plants. The lease payments were based on the salesprice for the coal that was processed through the facilities.
For the years ended December 31, 2014, 2013 and 2012, the revenues from Taggart prior to the sale toForge were as follows:
For the Years EndedDecember 31,
2014 2013 2012
(In thousands)
Processing revenue . . . . . . . . . . . . . . . . . . . . . . . . . . . . . . . . . . . . . . . . . . . . $— $1,761 $5,580
100

During the third quarter of 2012, the Partnership sold a preparation plant back to Taggart Global for $12.3million. The Partnership received $10.5 million in cash and a note receivable from Taggart, payable over threeyears for the balance. The Partnership recorded a gain of $4.7 million included in Coal related revenues on theConsolidated Statements of Income during 2012. The net book value of the asset sold was $7.6 million. During2013, the note receivable that the Partnership held was paid in full.
At December 31, 2014, a fund controlled by Quintana Capital owned a majority interest in Corsa CoalCorp., a coal mining company traded on the TSX Venture Exchange that is one of the Partnership’s lessees inTennessee. Corbin J. Robertson III, one of the Partnership’s directors, is Chairman of the Board of Corsa.Revenues from Corsa are as follows:
For the Years EndedDecember 31,
2014 2013 2012
(In thousands)
Coal royalty revenues . . . . . . . . . . . . . . . . . . . . . . . . . . . . . . . . . . . . . . . . $3,013 $4,594 $3,486
At each of December 31, 2013 and 2014, the Partnership also had accounts receivable totaling $ 0.3 millionfrom Corsa.
13. Asset Retirement Obligations
The Partnership accrues a liability for legal asset retirement obligations based on an estimate of the timingand amount of settlement. The Partnership accrues for costs involving the ultimate closure of certain of itsaggregate mining operations in accordance with its operating permits. These charges include costs of landreclamation, water drainage, and incremental direct administration cost of closing the operations. The Partnershipalso accrues for estimated costs relating to plugging wells in which it has a non-operation working interest. Uponinitial recognition of an asset retirement obligation the Partnership increases the carrying amount of the long-lived asset by the same amount as the liability. Over time, the liabilities are accreted for the change in theirpresent value, through charges to depreciation, depletion, and amortization and the initial costs are depleted overthe useful lives of the related assets.
The following table presents a reconciliation of the beginning and ending carrying amounts of thePartnership’s asset retirement obligations. The table does not include the short-term balance of $68,000, which isincluded in Accounts payable and accrued liabilities in the Consolidated Balance Sheets. The Partnership doesnot have any assets that are legally restricted for purposes of settling these obligations.
For the Years EndedDecember 31,
2014 2013
(In thousands)
Balance, January 1 . . . . . . . . . . . . . . . . . . . . . . . . . . . . . . . . . . . . . . . . . . . . . . . . . $ 39 $39Liabilities incurred in current period . . . . . . . . . . . . . . . . . . . . . . . . . . . . . . . . . . . 4,697 —Accretion expense . . . . . . . . . . . . . . . . . . . . . . . . . . . . . . . . . . . . . . . . . . . . . . . . . 237 —
Balance, December 31 . . . . . . . . . . . . . . . . . . . . . . . . . . . . . . . . . . . . . . . . . . . . . . $4,973 $39
14. Commitments and Contingencies
Legal
The Partnership is involved, from time to time, in various legal proceedings arising in the ordinary course ofbusiness. While the ultimate results of these proceedings cannot be predicted with certainty, Partnershipmanagement believes these claims will not have a material effect on the Partnership’s financial position, liquidityor operations.
101

Environmental Compliance
The operations the Partnership’s lessees’ conduct on its properties, as well as the aggregates/industrialminerals and oil and gas operations in which the Partnership has interests, are subject to federal and stateenvironmental laws and regulations. See “Item 1. Business—Regulation and Environmental Matters.” As anowner of surface interests in some properties, the Partnership may be liable for certain environmental conditionsoccurring on the surface properties. The terms of substantially all of the Partnership’s coal leases require thelessee to comply with all applicable laws and regulations, including environmental laws and regulations. Lesseespost reclamation bonds assuring that reclamation will be completed as required by the relevant permit, andsubstantially all of the leases require the lessee to indemnify the Partnership against, among other things,environmental liabilities. Some of these indemnifications survive the termination of the lease. The Partnershipmakes regular visits to the mines to ensure compliance with lease terms, but the duty to comply with allregulations rests with the lessees. The Partnership believes that its lessees will be able to comply with existingregulations and does not expect that any lessee’s failure to comply with environmental laws and regulations tohave a material impact on the Partnership’s financial condition or results of operations. The Partnership hasneither incurred, nor is aware of, any material environmental charges imposed on the Partnership related to itsproperties for the period ended December 31, 2014. The Partnership is not associated with any environmentalcontamination that may require remediation costs. However, the Partnership’s lessees do conduct reclamationwork on the properties under lease to them. Because the Partnership is not the permittee of the mines beingreclaimed, the Partnership is not responsible for the costs associated with these reclamation operations. Inaddition, West Virginia has established a fund to satisfy any shortfall in reclamation obligations. As an owner ofworking interests in oil and natural gas operations, the Partnership is responsible for its proportionate share ofany losses and liabilities, including environmental liabilities, arising from uninsured and underinsured events.The Partnership is also responsible for losses and liabilities, including environmental liabilities that may arisefrom uninsured and underinsured events.
15. Major Lessees
The Partnership has the following lessees that generated in excess of ten percent of total revenues in any oneof the years ended December 31, 2014, 2013, and 2012. Revenues from these lessees are as follows:
For the Years Ended December 31,
2014 2013 2012
Revenues Percent Revenues Percent Revenues Percent
(Dollars in thousands)
Foresight Energy and affiliates . . . . . $81,546 20.4% $88,432 24.7% $92,341 24.4%Alpha Natural Resources . . . . . . . . . $48,783 12.2% $55,147 15.4% $81,077 21.4%
In 2014, the Partnership derived 32.6% of its revenue from the two companies listed above. As a result, thePartnership has a significant concentration of revenues with those lessees, although in most cases, with theexception of the Williamson mine operated by Foresight Energy, the exposure is spread over a number ofdifferent mining operations and leases. Foresight’s Williamson mine alone was responsible for approximately10.2%, 13.0% and 12.4% of the Partnership’s total revenues for 2014, 2013 and 2012, respectively.
Approximately 50% of the Partnership’s accounts receivable result from amounts due from third-partycompanies in the coal industry, with approximately 30% of the Partnership’s total revenues being attributable tocoal royalty revenues from Appalachia. This concentration of customers may impact the Partnership’s overallcredit risk, either positively or negatively, in that these entities may be collectively affected by the same changesin economic or other conditions. Receivables are generally not collateralized.
16. Incentive Plans
GP Natural Resource Partners LLC adopted the Natural Resource Partners Long-Term Incentive Plan (the“Long-Term Incentive Plan”) for directors of GP Natural Resource Partners LLC and employees of its affiliateswho perform services for the Partnership. The compensation committee of GP Natural Resource Partners LLC’s
102

board of directors administers the Long-Term Incentive Plan. Subject to the rules of the exchange upon which thecommon units are listed at the time, the board of directors and the compensation committee of the board ofdirectors have the right to alter or amend the Long-Term Incentive Plan or any part of the Long-Term IncentivePlan from time to time. Except upon the occurrence of unusual or nonrecurring events, no change in anyoutstanding grant may be made that would materially reduce the benefit intended to be made available to aparticipant without the consent of the participant.
Under the plan a grantee will receive the market value of a common unit in cash upon vesting. Market valueis defined as the average closing price over the 20 trading days prior to the vesting date. The compensationcommittee may make grants under the Long-Term Incentive Plan to employees and directors containing suchterms as it determines, including the vesting period. Outstanding grants vest upon a change in control of thePartnership, the general partner, or GP Natural Resource Partners LLC. If a grantee’s employment ormembership on the board of directors terminates for any reason, outstanding grants will be automaticallyforfeited unless and to the extent the compensation committee provides otherwise.
A summary of activity in the outstanding grants for the year ended December 31, 2014 are as follows:
Outstanding grants at the beginning of the period . . . . . . . . . . . . . . . . . . . . . . . . . . . . . . . . 1,012,984Grants during the period . . . . . . . . . . . . . . . . . . . . . . . . . . . . . . . . . . . . . . . . . . . . . . . . . . 454,884Grants vested and paid during the period . . . . . . . . . . . . . . . . . . . . . . . . . . . . . . . . . . . . . (285,500)Forfeitures during the period . . . . . . . . . . . . . . . . . . . . . . . . . . . . . . . . . . . . . . . . . . . . . . . (28,975)
Outstanding grants at the end of the period . . . . . . . . . . . . . . . . . . . . . . . . . . . . . . . . . . . . . 1,153,393
Grants typically vest at the end of a four-year period and are paid in cash upon vesting. The liabilityfluctuates with the market value of the Partnership common units and because of changes in estimated fair valuedetermined each quarter using the Black-Scholes option valuation model. Risk free interest rates and historicalvolatility are reset at each calculation based on current rates corresponding to the remaining vesting term for eachoutstanding grant and ranged from 0.26% to 1.06% and 33.40% to 43.43%, respectively at December 31, 2014.The Partnership’s cumulative average dividend rate of 7.46% was used in the calculation at December 31, 2014.The Partnership accrued expenses related to its plans to be reimbursed to its general partner of $1.0 million, $9.6million and $2.9 million for the years ended December 31, 2014, 2013 and 2012, respectively. In connection withthe Long-Term Incentive Plans, cash payments of $6.5 million, $7.0 million and $6.6 million were paid duringeach of the years ended December 31, 2014, 2013, and 2012, respectively. The grant date fair value was $17.73,$25.27 and $33.38 per unit for awards in 2014, 2013 and 2012, respectively.
In connection with the phantom unit awards, the CNG committee also granted tandem DistributionEquivalent Rights, or DERs, which entitle the holders to receive distributions equal to the distributions paid onthe Partnership’s common units. The DERs are payable in cash upon vesting but may be subject to forfeiture ifthe grantee ceases employment prior to vesting.
The unaccrued cost, associated with unvested outstanding grants and related DERs at December 31, 2014,was $5.2 million.
17. Subsequent Events (Unaudited)
The following represents material events that have occurred subsequent to December 31, 2014 through thetime of the Partnership’s filing of its Annual Report on Form 10-K with the SEC:
Distributions
On January 20, 2015, the Partnership declared a distribution of $0.35 per unit that was paid on February 13,2015 to unitholders of record on February 5, 2015.
Dividends and Distributions Received From Unconsolidated Equity and Other Investments
Subsequent to December 31, 2014, the Partnership received $10.9 million in cash distributions from OCIWyoming.
103

18. Supplemental Financial Data (Unaudited)
Shown below are selected unaudited quarterly data.
Selected Quarterly Financial Information(In thousands, except per unit data)
2014First
QuarterSecondQuarter
ThirdQuarter
FourthQuarter
Total revenues and other income . . . . . . . . . . . . . . . . . $ 80,309 $ 90,561 $ 91,609 $137,273Depreciation, depletion and amortization . . . . . . . . . . $ 14,647 $ 16,350 $ 18,621 $ 30,258Asset impairment . . . . . . . . . . . . . . . . . . . . . . . . . . . . . $ — $ 5,624 $ — $ 20,585Income from operations . . . . . . . . . . . . . . . . . . . . . . . . $ 52,439 $ 50,403 $ 55,027 $ 31,050Net income . . . . . . . . . . . . . . . . . . . . . . . . . . . . . . . . . . $ 32,605 $ 31,407 $ 36,173 $ 8,645Net income per limited partner unit . . . . . . . . . . . . . . . $ 0.29 $ 0.28 $ 0.32 $ 0.07Weighted average number of common units
outstanding . . . . . . . . . . . . . . . . . . . . . . . . . . . . . . . . 109,848 110,403 111,244 121,449
2013First
QuarterSecondQuarter
ThirdQuarter
FourthQuarter
Total revenues and other income . . . . . . . . . . . . . . . . . $ 94,332 $ 86,804 $ 82,237 $ 94,744Depreciation, depletion and amortization . . . . . . . . . . $ 14,762 $ 17,411 $ 17,852 $ 14,352Income from operations . . . . . . . . . . . . . . . . . . . . . . . . $ 62,528 $ 55,332 $ 51,624 $ 66,752Asset impairment . . . . . . . . . . . . . . . . . . . . . . . . . . . . . $ 291 $ 443 $ — $ —Gain on Department of Highway condemnation . . . . . $ — $ — $ — $ 10,370Net income . . . . . . . . . . . . . . . . . . . . . . . . . . . . . . . . . . $ 47,906 $ 41,065 $ 36,126 $ 46,981Net income per limited partner unit . . . . . . . . . . . . . . . $ 0.43 $ 0.37 $ 0.32 $ 0.42Weighted average number of common units
outstanding . . . . . . . . . . . . . . . . . . . . . . . . . . . . . . . . 108,887 109,812 109,812 109,812
104
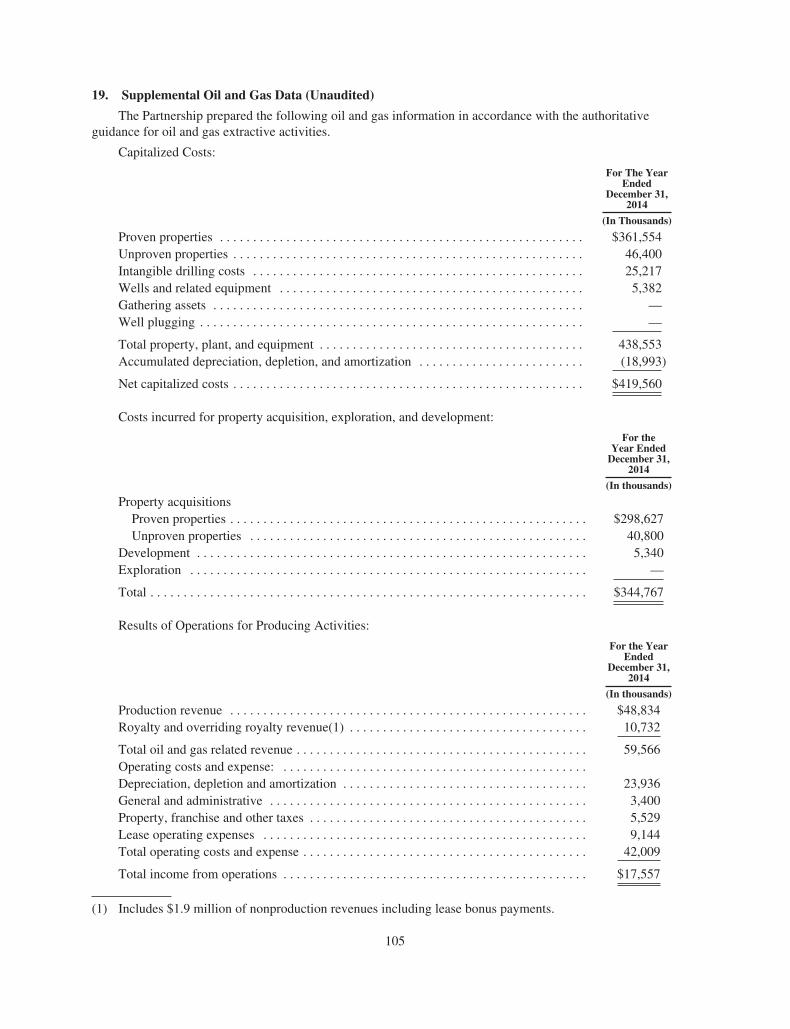
19. Supplemental Oil and Gas Data (Unaudited)
The Partnership prepared the following oil and gas information in accordance with the authoritativeguidance for oil and gas extractive activities.
Capitalized Costs:
For The YearEnded
December 31,2014
(In Thousands)
Proven properties . . . . . . . . . . . . . . . . . . . . . . . . . . . . . . . . . . . . . . . . . . . . . . . . . . . . . . . $361,554Unproven properties . . . . . . . . . . . . . . . . . . . . . . . . . . . . . . . . . . . . . . . . . . . . . . . . . . . . . 46,400Intangible drilling costs . . . . . . . . . . . . . . . . . . . . . . . . . . . . . . . . . . . . . . . . . . . . . . . . . . 25,217Wells and related equipment . . . . . . . . . . . . . . . . . . . . . . . . . . . . . . . . . . . . . . . . . . . . . . 5,382Gathering assets . . . . . . . . . . . . . . . . . . . . . . . . . . . . . . . . . . . . . . . . . . . . . . . . . . . . . . . . —Well plugging . . . . . . . . . . . . . . . . . . . . . . . . . . . . . . . . . . . . . . . . . . . . . . . . . . . . . . . . . . —
Total property, plant, and equipment . . . . . . . . . . . . . . . . . . . . . . . . . . . . . . . . . . . . . . . . 438,553Accumulated depreciation, depletion, and amortization . . . . . . . . . . . . . . . . . . . . . . . . . (18,993)
Net capitalized costs . . . . . . . . . . . . . . . . . . . . . . . . . . . . . . . . . . . . . . . . . . . . . . . . . . . . . $419,560
Costs incurred for property acquisition, exploration, and development:
For theYear Ended
December 31,2014
(In thousands)
Property acquisitionsProven properties . . . . . . . . . . . . . . . . . . . . . . . . . . . . . . . . . . . . . . . . . . . . . . . . . . . . . . $298,627Unproven properties . . . . . . . . . . . . . . . . . . . . . . . . . . . . . . . . . . . . . . . . . . . . . . . . . . . 40,800
Development . . . . . . . . . . . . . . . . . . . . . . . . . . . . . . . . . . . . . . . . . . . . . . . . . . . . . . . . . . . 5,340Exploration . . . . . . . . . . . . . . . . . . . . . . . . . . . . . . . . . . . . . . . . . . . . . . . . . . . . . . . . . . . . —
Total . . . . . . . . . . . . . . . . . . . . . . . . . . . . . . . . . . . . . . . . . . . . . . . . . . . . . . . . . . . . . . . . . . $344,767
Results of Operations for Producing Activities:
For the YearEnded
December 31,2014
(In thousands)
Production revenue . . . . . . . . . . . . . . . . . . . . . . . . . . . . . . . . . . . . . . . . . . . . . . . . . . . . . . $48,834Royalty and overriding royalty revenue(1) . . . . . . . . . . . . . . . . . . . . . . . . . . . . . . . . . . . . 10,732
Total oil and gas related revenue . . . . . . . . . . . . . . . . . . . . . . . . . . . . . . . . . . . . . . . . . . . . 59,566Operating costs and expense: . . . . . . . . . . . . . . . . . . . . . . . . . . . . . . . . . . . . . . . . . . . . . .Depreciation, depletion and amortization . . . . . . . . . . . . . . . . . . . . . . . . . . . . . . . . . . . . . 23,936General and administrative . . . . . . . . . . . . . . . . . . . . . . . . . . . . . . . . . . . . . . . . . . . . . . . . 3,400Property, franchise and other taxes . . . . . . . . . . . . . . . . . . . . . . . . . . . . . . . . . . . . . . . . . . 5,529Lease operating expenses . . . . . . . . . . . . . . . . . . . . . . . . . . . . . . . . . . . . . . . . . . . . . . . . . 9,144Total operating costs and expense . . . . . . . . . . . . . . . . . . . . . . . . . . . . . . . . . . . . . . . . . . . 42,009
Total income from operations . . . . . . . . . . . . . . . . . . . . . . . . . . . . . . . . . . . . . . . . . . . . . . $17,557
(1) Includes $1.9 million of nonproduction revenues including lease bonus payments.
105

Production and Price History
The following table sets forth summary information concerning the Partnership’s production results,average sales prices and production costs for the year ended December 31, 2014 for the Partnership’s WillistonBasin properties. Production and price information for the years ended December 31, 2013 and 2012 is notincluded, as the Partnership’s oil and natural gas producing activities were not material to the Partnership’sresults of operations for those years.
For The Year Ended December 31,2014
WillistonBasin(1)
Royalty andOverriding
RoyaltyInterests(2) Total
Net Production Volumes:Crude oil (MBbl) . . . . . . . . . . . . . . . . . . . . . . . . . . . . . . . . . . . . . . 578 33 611NGLs (MBbl) . . . . . . . . . . . . . . . . . . . . . . . . . . . . . . . . . . . . . . . . 53 18 71Natural gas (MMcf) . . . . . . . . . . . . . . . . . . . . . . . . . . . . . . . . . . . . 408 1,313 1,721
Average sales prices:Crude oil ($/Bbl) . . . . . . . . . . . . . . . . . . . . . . . . . . . . . . . . . . . . . . $77.85 $82.91 $78.12NGLs ($/Bbl) . . . . . . . . . . . . . . . . . . . . . . . . . . . . . . . . . . . . . . . . . $33.64 $34.56 $33.87Natural gas ($/Mcf) . . . . . . . . . . . . . . . . . . . . . . . . . . . . . . . . . . . . $ 5.04 $ 4.17 $ 4.37
Average costs ($/Boe):Production expenses . . . . . . . . . . . . . . . . . . . . . . . . . . . . . . . . . . . . . $13.08 — $13.08Ad valorem and severance taxes . . . . . . . . . . . . . . . . . . . . . . . . . . . . $ 7.91 — $ 7.91General and administrative expense . . . . . . . . . . . . . . . . . . . . . . . . . $ 4.86 — $ 4.86DD&A expense . . . . . . . . . . . . . . . . . . . . . . . . . . . . . . . . . . . . . . . . . $25.73 $22.06 $24.70
(1) Represents volume, price and cost information relating to the Partnership’s non-operated Williston Basinworking interest properties.
(2) Represents information relating to the Partnership’s royalty and overriding royalty interests in oil and gasproperties. These interests are recorded net of costs.
Estimated Proved Reserves
Proved reserves are those quantities of crude oil and natural gas, which, by analysis of geoscience andengineering data, can be estimated with reasonable certainty to be economically producible from a given dateforward, from known reservoirs, and under existing economic conditions, operating methods, and governmentregulations prior to the time at which contracts providing the right to operate expire, unless evidence indicatesrenewal is reasonably certain. In connection with the estimation of proved reserves, the term “reasonablecertainty” implies a high degree of confidence that the quantities of crude oil, natural gas liquids and/or naturalgas actually recovered will equal or exceed the estimate. The Partnership estimated proved reserves as ofDecember 31, 2014 were prepared by Netherland, Sewell & Associates, Inc., the Partnership’s independentreserve engineer. To achieve reasonable certainty, Netherland Sewell employed technologies that have beendemonstrated to yield results with consistency and repeatability. The technologies and economic data used in theestimation of the Partnership’s proved reserves include, but are not limited to, well logs, geologic maps includingisopach and structure maps, analogy and statistical analysis, and available downhole and production data andwell test data.
The following tables set forth the Partnership’s estimated proved and related standardized measure ofdiscounted cash flows by reserve category as of December 31, 2014. Netherland Sewell prepared its reportcovering properties representing 100% of the Partnership’s estimated proved reserves as of December 31, 2014.Prices were calculated using the unweighted average of the first-day-of-the-month pricing for the twelve monthsended December 31, 2014. These prices were then adjusted for transportation and other costs. There can be no
106

assurance that the proved reserves will be produced as estimated or that the prices and costs will remain constant.There are numerous uncertainties inherent in estimating reserves and related information and different reserveengineers often arrive at different estimates for the same properties. A copy of Netherland Sewell’s summaryreport is included as Exhibit 99.2 to this Annual Report on Form 10-K.
Estimated Proved Reserves as of December 31, 2014(1)
CrudeOil
(MBbl)NGLs
(MBbl)
NaturalGas
(MMcf)
TotalProved
Reserves(MBoe)(2)
StandardizedMeasure ofDiscounted
Cash Flows(3)
(in thousands)
Proved Developed Producing . . . . . . . . . . . . 8,918 1,093 13,069 12,189 $286,179Proved Developed Non-Producing . . . . . . . . 12 5 92 32 655Proved Undeveloped . . . . . . . . . . . . . . . . . . . 1,053 131 1,209 1,386 18,363
Total . . . . . . . . . . . . . . . . . . . . . . . . . . . . . 9,983 1,229 14,370 13,607(4) $305,197
(1) Includes reserves attributable to the Partnership’s 51% member interest in BRP LLC.
(2) Natural gas is converted on the basis of six Mcf of gas per one Bbl of oil equivalent. This ratio reflects anenergy content equivalency and not a price or revenue equivalency.
(3) Standardized measure of discounted cash flows represents the present value of estimated future net revenueto be generated from the production of proved reserves, determined in accordance with the rules andregulations of the SEC (using prices and costs in effect as of the date of estimation), less futuredevelopment, production and income tax expenses, and discounted at 10% per annum to reflect the timingof future net revenue.
(4) Includes 12,144 MBoe of estimated proved reserves attributable to the Partnership’s non-operated workinginterests in oil and natural gas properties in the Williston Basin, approximately 10% of which were provedundeveloped reserves.
The following table represents the capitalized development well cost activity as indicated:
For the YearEnded
December 31,2014
(In Thousands)
Costs pending the determination of proved reserves at December 31, 2014For a period one year or less . . . . . . . . . . . . . . . . . . . . . . . . . . . . . . . . . . . . . . . . . . . . . . $5,340For a period greater than one year but less than five years . . . . . . . . . . . . . . . . . . . . . . . —For a period greater than five years . . . . . . . . . . . . . . . . . . . . . . . . . . . . . . . . . . . . . . . . . —
Total . . . . . . . . . . . . . . . . . . . . . . . . . . . . . . . . . . . . . . . . . . . . . . . . . . . . . . . . . . . . . . . . . $5,340
For the YearEnded
December 31,2014
(In Thousands)
Costs reclassified to wells, equipment and facilities based on the determination ofproved reserves . . . . . . . . . . . . . . . . . . . . . . . . . . . . . . . . . . . . . . . . . . . . . . . . . . . . . . . $5,177
Costs expensed due to determination of dry hole or abandonment of project . . . . . . . . . —
107

Standardized Measure of Discounted Future Net Cash Flows:
For the YearEnded
December 31,2014
(In Thousands)
Future Cash Flows:Revenues . . . . . . . . . . . . . . . . . . . . . . . . . . . . . . . . . . . . . . . . . . . . . . . . . . . . . . . . . . . $920,454Production costs . . . . . . . . . . . . . . . . . . . . . . . . . . . . . . . . . . . . . . . . . . . . . . . . . . . . . . 312,666Development costs . . . . . . . . . . . . . . . . . . . . . . . . . . . . . . . . . . . . . . . . . . . . . . . . . . . . 20,072
Future Net Cash Flows . . . . . . . . . . . . . . . . . . . . . . . . . . . . . . . . . . . . . . . . . . . . . . . . . . . 587,716Discount to present value at a 10% annual rate . . . . . . . . . . . . . . . . . . . . . . . . . . . . . . . . 282,519
Total standardized measure of discounted net cash flows . . . . . . . . . . . . . . . . . . . . . . . . $305,197
108

Item 9. Changes In and Disagreements with Accountants on Accounting and Financial Disclosure
None.
Item 9A. Controls and Procedures
Evaluation of Disclosure Controls and Procedures
We carried out an evaluation of the effectiveness of the design and operation of our disclosure controls andprocedures (as defined in Rule 13a-15(e) of the Exchange Act) as of December 31, 2014. This evaluation wasperformed under the supervision and with the participation of our management, including the Chief ExecutiveOfficer and Chief Financial Officer of GP Natural Resource Partners LLC, our managing general partner. Basedupon that evaluation, the Chief Executive Officer and Chief Financial Officer concluded that these disclosurecontrols and procedures are effective in producing the timely recording, processing, summary and reporting ofinformation and in accumulation and communication of information to management to allow for timely decisionswith regard to required disclosures.
Management’s Report on Internal Control Over Financial Reporting
Our management is responsible for establishing and maintaining adequate internal control over financialreporting, as such term is defined in Exchange Act Rules 13a-15(f) and 15d-15(f). Under the supervision andwith the participation of our management, including the Chief Executive Officer and Chief Financial Officer ofGP Natural Resource Partners LLC, our managing general partner, we conducted an evaluation of theeffectiveness of our internal control over financial reporting as of December 31, 2014 based on the framework inInternal Control-Integrated Framework issued by the Committee of Sponsoring Organizations of the TreadwayCommission “2013 Framework” (COSO). Based on that evaluation, our management concluded that our internalcontrol over financial reporting was effective as of December 31, 2014. No changes were made to our internalcontrol over financial reporting during the last fiscal quarter that materially affected, or are reasonably likely tomaterially affect, our internal control over financial reporting.
Our management’s evaluation of the effectiveness of our internal control over financial reporting does notinclude the internal controls of VantaCore Partners LLC, which is included in the 2014 consolidated financialstatements of Natural Resource Partners L.P. and constituted $219.7 million and $204.5 of total and net assets,respectively, as of December 31, 2014 and $42.1 million and $3.5 million of revenues and net income,respectively, for the year then ended.
Ernst & Young, LLP, the independent registered public accounting firm who audited the Partnership’sconsolidated financial statements included in this Annual Report on Form 10-K, has issued a report on thePartnership’s internal control over financial reporting, which is included herein.
Report of Independent Registered Public Accounting Firm
The Partners of Natural Resource Partners L.P.
We have audited Natural Resource Partners L.P.’s internal control over financial reporting as ofDecember 31, 2014, based on criteria established in Internal Control—Integrated Framework issued by theCommittee of Sponsoring Organizations of the Treadway Commission (2013 framework) (the COSO criteria).Natural Resource Partners L.P.’s management is responsible for maintaining effective internal control overfinancial reporting, and for its assessment of the effectiveness of internal control over financial reportingincluded in the accompanying Management’s Report on Internal Control over Financial Reporting. Ourresponsibility is to express an opinion on the company’s internal control over financial reporting based on ouraudit.
We conducted our audit in accordance with the standards of the Public Company Accounting OversightBoard (United States). Those standards require that we plan and perform the audit to obtain reasonable assuranceabout whether effective internal control over financial reporting was maintained in all material respects. Our
109

audit included obtaining an understanding of internal control over financial reporting, assessing the risk that amaterial weakness exists, testing and evaluating the design and operating effectiveness of internal control basedon the assessed risk, and performing such other procedures as we considered necessary in the circumstances. Webelieve that our audit provides a reasonable basis for our opinion.
A company’s internal control over financial reporting is a process designed to provide reasonable assuranceregarding the reliability of financial reporting and the preparation of financial statements for external purposes inaccordance with generally accepted accounting principles. A company’s internal control over financial reportingincludes those policies and procedures that (1) pertain to the maintenance of records that, in reasonable detail,accurately and fairly reflect the transactions and dispositions of the assets of the company; (2) provide reasonableassurance that transactions are recorded as necessary to permit preparation of financial statements in accordancewith generally accepted accounting principles, and that receipts and expenditures of the company are being madeonly in accordance with authorizations of management and directors of the company; and (3) provide reasonableassurance regarding prevention or timely detection of unauthorized acquisition, use, or disposition of thecompany’s assets that could have a material effect on the financial statements.
Because of its inherent limitations, internal control over financial reporting may not prevent or detectmisstatements. Also, projections of any evaluation of effectiveness to future periods are subject to the risk thatcontrols may become inadequate because of changes in conditions, or that the degree of compliance with thepolicies or procedures may deteriorate.
As indicated in the accompanying Management’s Report on Internal Control over Financial Reporting,management’s assessment of and conclusion on the effectiveness of internal control over financial reporting didnot include the internal controls of VantaCore Partners LLC, which is included in the 2014 consolidated financialstatements of Natural Resource Partners L.P. and constituted $219.7 million and $204.5 of total and net assets,respectively, as of December 31, 2014 and $42.1 million and $3.5 million of revenues and net income,respectively, for the year then ended. Our audit of internal control over financial reporting of Natural ResourcePartners L.P. also did not include an evaluation of the internal control over financial reporting of VantaCore.
In our opinion, Natural Resource Partners L.P. maintained, in all material respects, effective internal controlover financial reporting as of December 31, 2014, based on the COSO criteria.
We also have audited, in accordance with the standards of the Public Company Accounting Oversight Board(United States), the consolidated balance sheet of Natural Resource Partners L.P. as of December 31, 2014 and2013, and the related consolidated statements of comprehensive operations, partners’ equity and cash flows foreach of the three years in the period ended December 31, 2014 and our report dated February 27, 2015 expressedan unqualified opinion there thereon.
/s/ Ernst & Young LLP
Houston, TexasFebruary 27, 2015
Item 9B. Other Information
None.
110

PART III
Item 10. Directors and Executive Officers of the Managing General Partner and Corporate Governance
As a master limited partnership we do not employ any of the people responsible for the management of ourproperties. Instead, we reimburse affiliates of our managing general partner, GP Natural Resource Partners LLC,for their services. The following table sets forth information concerning the directors and officers of GP NaturalResource Partners LLC as of February 27, 2015. Each officer and director is elected for their respective office ordirectorship on an annual basis. Unless otherwise noted below, the individuals served as officers or directors ofthe partnership since the initial public offering. Subject to the Investor Rights Agreement with Adena Minerals,LLC, Mr. Robertson is entitled to nominate ten directors, five of whom must be independent directors, to theBoard of Directors of GP Natural Resource Partners LLC. Mr. Robertson has delegated the right to nominate twoof the directors, one of whom must be independent, to Adena Minerals.
Name AgePosition with the General
Partner
Corbin J. Robertson, Jr. . . . . . . . . . . . 67 Chairman of the Board and Chief Executive OfficerWyatt L. Hogan(1) . . . . . . . . . . . . . . . 43 PresidentCraig W. Nunez . . . . . . . . . . . . . . . . . 53 Chief Financial Officer and TreasurerKevin F. Wall(2) . . . . . . . . . . . . . . . . 58 Chief Operating OfficerKevin J. Craig . . . . . . . . . . . . . . . . . . 46 Executive Vice President, CoalDennis F. Coker . . . . . . . . . . . . . . . . . 47 Vice President, AggregatesDavid M. Hartz . . . . . . . . . . . . . . . . . 41 Vice President, Oil and GasKathy H. Roberts . . . . . . . . . . . . . . . . 63 Vice President, Investor RelationsKathryn S. Wilson . . . . . . . . . . . . . . . 40 Vice President, General Counsel and SecretaryGregory F. Wooten . . . . . . . . . . . . . . 58 Vice President, Chief EngineerKenneth Hudson . . . . . . . . . . . . . . . . . 60 ControllerRobert T. Blakely . . . . . . . . . . . . . . . . 73 DirectorRussell D. Gordy . . . . . . . . . . . . . . . . 64 DirectorDonald R. Holcomb . . . . . . . . . . . . . . 58 DirectorRobert B. Karn III . . . . . . . . . . . . . . . 73 DirectorS. Reed Morian . . . . . . . . . . . . . . . . . 69 DirectorRichard A. Navarre . . . . . . . . . . . . . . 54 DirectorCorbin J. Robertson, III . . . . . . . . . . . 44 DirectorStephen P. Smith . . . . . . . . . . . . . . . . 53 DirectorLeo A. Vecellio, Jr. . . . . . . . . . . . . . . 68 Director
(1) Mr. Hogan will become President and Chief Operating Officer effective March 1, 2015.
(2) Mr. Wall will retire as Chief Operating Officer effective March 1, 2015.
Corbin J. Robertson, Jr. has served as Chief Executive Officer and Chairman of the Board of Directors ofGP Natural Resource Partners LLC since 2002. Mr. Robertson has vast business experience having founded andserved as a director and as an officer of multiple companies, both private and public, and has served on theboards of numerous non-profit organizations. He has served as the Chief Executive Officer and Chairman of theBoard of the general partners of Western Pocahontas Properties Limited Partnership since 1986, Great NorthernProperties Limited Partnership since 1992, Quintana Minerals Corporation since 1978, and as Chairman of theBoard of Directors of New Gauley Coal Corporation since 1986. He also serves as a Principal with QuintanaCapital Group, Chairman of the Board of the Cullen Trust for Higher Education and on the boards of theAmerican Petroleum Institute, the National Petroleum Council, the Baylor College of Medicine and the WorldHealth and Golf Association. In 2006, Mr. Robertson was inducted into the Texas Business Hall of Fame.
Wyatt L. Hogan has served as President of GP Natural Resource Partners LLC since September 2014, andeffective March 1, 2015, Mr. Hogan will become President and Chief Operating Officer of GP Natural Resource
111

Partners LLC. Mr. Hogan was Executive Vice President of GP Natural Resource Partners from December 2013through August 2014 and Vice President, General Counsel and Secretary of GP Natural Resource Partners fromMay 2003 to December 2013. Mr. Hogan joined NRP in 2003 from Vinson & Elkins L.L.P., where he practicedcorporate and securities law from August 2000 through April 2003. Mr. Hogan also serves as Executive VicePresident of Quintana Minerals Corporation, New Gauley Coal Corporation, the general partner of WesternPocahontas Properties Limited Partnership and the general partner of Great Northern Properties LimitedPartnership, and from 2003 to October 2013, Mr. Hogan served as General Counsel and Secretary of thoseentities. He is also a member of the Board of Directors of Quintana Minerals Corporation and represents NRP asone of its appointees to the Board of Managers of OCI Wyoming LLC. Mr. Hogan also serves as a member of theBoards of the National Mining Association and the American Coalition for Clean Coal Electricity.
Craig W. Nunez has served as Chief Financial Officer and Treasurer of GP Natural Resource Partners LLCsince January 1, 2015. Prior to joining NRP, Mr. Nunez was an owner and Chief Executive Officer of BocageGroup, a private investment company specializing in energy, natural resources and master limited partnershipssince March 2012. In addition, he has been a FINRA-registered Investment Advisor Representative withSearle & Co since July 2012 and has served as an Executive Advisor to Capital One Asset Management sinceJanuary 2014. From September 2011 through March 2012, Mr. Nunez served as the Executive Vice Presidentand Chief Financial Officer of Quicksilver Resources Canada, Inc. Mr. Nunez was Senior Vice President andTreasurer of Halliburton Company from January 2007 until September 2011, and Vice President and Treasurer ofHalliburton Company from February 2006 to January 2007. Prior to that, he was Treasurer of Colonial PipelineCompany from November 1999 to February 2006.
Kevin F. Wall has served as Chief Operating Officer of GP Natural Resource Partners LLC since September2014 and will retire from such position effective March 1, 2015. Mr. Wall served as Executive Vice President,Operations of GP Natural Resource Partners LLC from December 2008 through August 2014 and as VicePresident—Engineering for GP Natural Resource Partners LLC from 2002 to 2008. Mr. Wall has also served asVice President—Engineering of the general partner of Western Pocahontas Properties Limited Partnership since1998, of the general partner of Great Northern Properties Limited Partnership since 1992, and of New GauleyCoal Corporation since 1998. Mr. Wall also represents NRP as one of its appointees to the Board of Managers ofOCI Wyoming LLC. He has performed duties in the land management, planning, project evaluation, acquisitionand engineering areas since 1981. He is a Registered Professional Engineer in West Virginia and is a member ofthe American Institute of Mining, Metallurgical, and Petroleum Engineers and of the National Society ofProfessional Engineers. Mr. Wall also serves on the Executive Committee for the National Council of CoalLessors, the Board of Directors of Leadership Tri-State and the Board of the Virginia Center for Coal and EnergyResearch and is a past president of the West Virginia Society of Professional Engineers.
Kevin J. Craig has served as Executive Vice President, Coal of GP Natural Resource Partners sinceSeptember 2014. Mr. Craig was the Vice President of Business Development for GP Natural Resource PartnersLLC since 2005. Mr. Craig joined NRP in 2005 from CSX Transportation, where he served as Terminal Managerfor the West Virginia Coalfields. Mr. Craig has extensive experience in business development, operations,finance and marketing within the coal industry. Mr. Craig also served as a Delegate to the West Virginia Houseof Delegates having been elected in 2000 and re-elected in 2002, 2004, 2006, 2008, 2010 and 2012. Mr. Craigmost recently served as Chairman of the Committee on Energy. Mr. Craig did not seek re-election in 2014 andhis term ended January 2015. Prior to joining CSX, he served as a Captain in the United States Army. Mr. Craigis currently serving as the Chairman of the Huntington Regional Chamber of Commerce Board of Directors andas a Director for the West Virginia Chamber of Commerce and is involved in numerous state coal associations.
Dennis F. Coker is Vice President, Aggregates of GP Natural Resource Partners LLC. Mr. Coker joinedNRP in March 2008 from Hanson Building Materials America, where he had been employed since 2002, andmost recently served as Director, Corporate Development. Mr. Coker has 19 years of experience in the miningand materials industry, with the last 15 years focused on corporate development activity. Mr. Coker alsorepresents NRP as one of its appointees to the Board of Managers of OCI Wyoming LLC. Mr. Coker also servesas Treasurer on the Executive Board of the National Stone Sand and Gravel Association.
112
David M. Hartz has served as Vice President, Oil and Gas of GP Natural Resource Partners LLC sinceDecember 2013. He served as Director, Oil and Gas from 2011 to December 2013. Prior to joining NRP,Mr. Hartz served as Director of Scotia Waterous, the oil and gas investment banking group within Scotia Capitalfrom 2007 until 2011 where he was involved in oil and gas acquisition and divestiture transactions throughout theUnited States. Prior to investment banking, Mr. Hartz served in a variety of technical positions as a petroleumgeologist for Texaco and Hess within several U.S. and international petroleum basins. He is a member of IPAA,Houston Producers Forum, as well as numerous state oil and gas associations.
Kathy H. Roberts is Vice President, Investor Relations of GP Natural Resource Partners LLC. Ms. Robertsjoined NRP in July 2002. She was the Principal of IR Consulting Associates from 2001 to July 2002 and from1980 through 2000 held various financial and investor relations positions with Santa Fe Energy Resources, mostrecently as Vice President—Public Affairs. She is a Certified Public Accountant. Ms. Roberts currently serves onthe Board of Directors of the National Association of Publicly Traded Partnerships and has served on the localboard of directors of the National Investor Relations Institute and maintained professional affiliations withvarious energy industry organizations. She has also served on the Executive Committee and as a National VicePresident of the Institute of Management Accountants.
Kathryn S. Wilson has served as Vice President, General Counsel and Secretary of GP Natural ResourcePartners LLC since December 2013. Ms. Wilson served as Associate General Counsel from March 2013 toDecember 2013. Since October 2013, Ms. Wilson has also served as General Counsel and Secretary of each ofQuintana Minerals Corporation, New Gauley Coal Corporation, the general partner of Western PocahontasProperties Limited Partnership, and the general partner of Great Northern Properties Limited Partnership.Ms. Wilson practiced corporate and securities law with Vinson & Elkins L.L.P. from September 2001 toFebruary 2010 and from November 2011 to February 2013. Ms. Wilson served as General Counsel of AnteroResources Corporation from March 2010 to June 2011.
Gregory F. Wooten has served as Vice President, Chief Engineer of GP Natural Resource Partners LLCsince December 2013. Mr. Wooten joined NRP in 2007, serving as Regional Manager. Prior to joining NRP,Mr. Wooten served as Vice President, COO and Chief Engineer of Dingess Rum Properties, Inc., where hemanaged coal, oil, gas and timber properties from 1982 until 2007. Prior to 1982, Mr. Wooten worked as aplanning and production engineer in the coal industry and is a member of the American Institute of Mining,Metallurgical, and Petroleum Engineers.
Kenneth Hudson has served as the Controller of GP Natural Resource Partners LLC since 2002. He hasserved as Controller of the general partner of Western Pocahontas Properties Limited Partnership and of NewGauley Coal Corporation since 1988 and of the general partner of Great Northern Properties Limited Partnershipsince 1992. He was also Controller of Blackhawk Mining Co., Quintana Coal Co. and other related operationsfrom 1985 to 1988. Prior to that time, Mr. Hudson worked in public accounting.
Robert T. Blakely joined the Board of Directors of GP Natural Resource Partners LLC in January 2003.Mr. Blakely has extensive public company experience having served as Executive Vice President and ChiefFinancial Officer for several companies. From January 2006 until August 2007, he served as Executive VicePresident and Chief Financial Officer of Fannie Mae, and from August 2007 to January 2008 as an ExecutiveVice President at Fannie Mae. From mid-2003 through January 2006, he was Executive Vice President and ChiefFinancial Officer of MCI, Inc. He previously served as Executive Vice President and Chief Financial Officer ofLyondell Chemical from 1999 through 2002, Executive Vice President and Chief Financial Officer of Tenneco,Inc. from 1981 until 1999 as well as a Managing Director at Morgan Stanley. He served until December 31, 2011as a Trustee of the Financial Accounting Foundation and is a trustee emeritus of Cornell University. He hasserved on the Board of Westlake Chemical Corporation since August 2004. In 2009, Mr. Blakely joined theBoards of Directors of Ally Financial (formerly GMAC, Inc.), where he serves as Chairman of the AuditCommittee, and Greenhill & Co.
Russell D. Gordy joined the Board of Directors of GP Natural Resource Partners in October 2013.Mr. Gordy brings extensive oil and gas industry, mineral interest and land ownership and financial experience tothe Board. Mr. Gordy is currently managing partner and majority owner in SG Interests, a producer of oil and
113

coal bed methane gas, RGGS, which controls mineral acres currently producing oil and gas, coal, iron ore,limestone, and copper, and Rock Creek Ranch. He is also President of Gordy Oil Company, an oil and gasexploration company in the Gulf Coast of Texas and Louisiana, and Gordy Gas Corporation, an oil and gasexploration company in the San Juan Basin of Colorado and New Mexico. Prior to forming SG Interests in 1989,Mr. Gordy was a founding partner of Northwind Exploration Company an exploration company created in 1981with former Houston Oil and Minerals employees. Mr. Gordy served on the board of directors of HoustonExploration Company from 1987 until 2001.
Donald R. Holcomb joined the Board of Directors of GP Natural Resource Partners LLC in October 2013.Mr. Holcomb brings financial and coal company experience to the Board of Directors. Mr. Holcomb is currentlythe Chief Executive Officer of Dickinson Fuel Company, Inc., the managing general partner of DickinsonProperties Limited Partnership, a land company in West Virginia. He is also the owner and manager of Ikes Fork,LLC. From 2001 to March 31, 2013, Mr. Holcomb served as Chief Financial Officer for Foresight Reserves LPand its subsidiaries, which companies are affiliated with Christopher Cline. Mr. Holcomb also serves as trustee ofvarious trusts affiliated with the Cline family. Prior to joining Foresight, Mr. Holcomb held a variety of executivemanagement positions, including at Banner Coal & Land Company, Inc., Patriot Automotive Group, AtlanticMine Supply Company, Inc., and Wind River Consulting, LLC. Mr. Holcomb is a Certified Public Accountant.
Robert B. Karn III joined the Board of Directors of GP Natural Resource Partners LLC in 2002. Mr. Karnbrings extensive financial and coal industry experience to the Board of Directors. He currently is a consultant andserves on the Board of Directors of various entities. He was the partner in charge of the coal mining practiceworldwide for Arthur Andersen from 1981 until his retirement in 1998. He retired as Managing Partner of the St.Louis office’s Financial and Economic Consulting Practice. Mr. Karn is a Certified Public Accountant, CertifiedFraud Examiner and has served as president of numerous organizations. He also currently serves on the Board ofDirectors of Peabody Energy Corporation, Kennedy Capital Management, Inc. and the Boards of Trustees ofnumerous publicly listed closed-end funds, exchange traded funds and mutual funds of the Guggenheim familyof funds.
S. Reed Morian joined the Board of Directors of GP Natural Resource Partners LLC in 2002. Mr. Morianhas vast executive business experience having served as Chairman and Chief Executive Officer of severalcompanies since the early 1980s and serving on the board of other companies. Mr. Morian has served as amember of the Board of Directors of the general partner of Western Pocahontas Properties Limited Partnershipsince 1986, New Gauley Coal Corporation since 1992 and the general partner of Great Northern PropertiesLimited Partnership since 1992. Mr. Morian worked for Dixie Chemical Company from 1971 to 2006 and servedas its Chairman and Chief Executive Officer from 1981 to 2006. He has also served as Chairman, ChiefExecutive Officer and President of DX Holding Company since 1989. He formerly served on the Board ofDirectors for the Federal Reserve Bank of Dallas-Houston Branch from April 2003 until December 2008 and as aDirector of Prosperity Bancshares, Inc. from March 2005 until April 2009.
Richard A. Navarre joined the Board of Directors of GP Natural Resource Partners LLC in October 2013.Mr. Navarre brings extensive financial, strategic planning, public company and coal industry experience to theBoard of Directors. From 1993 until his retirement in 2012, Mr. Navarre held several executive positions withPeabody Energy Corporation, including President—Americas from March 2012 to June 2012, President andChief Commercial Officer from January 2008 to March 2012, Executive Vice President of CorporateDevelopment and Chief Financial Officer from July 2006 to January 2008 and Chief Financial Officer fromOctober 1999 to June 2008. Since his retirement from Peabody Energy in 2012, Mr. Navarre has providedadvisory services to the coal industry and private equity firms. Mr. Navarre serves on the Board of Directors ofCiveo Corporation, where he serves as Chairman of the Audit Committee, and is an Advisory Board member forSecure Energy, LLC. He is a member of the Hall of Fame of the College of Business, a member of the Board ofAdvisors of the College of Business and Administration of Southern Illinois University Carbondale. He is amember of the Board of Directors of the Foreign Policy Association and is the former Chairman of theBituminous Coal Operators’ Association and former advisor to the New York Mercantile Exchange. Mr. Navarreis a Certified Public Accountant.
Corbin J. Robertson, III joined the Board of Directors of GP Natural Resource Partners LLC in May 2013.Mr. Robertson has experience with investments in a variety of energy businesses, having served both in
114

management of private equity firms and having served on several boards of directors. Mr. Robertson has servedas a Co-Managing Partner of LKCM Headwater Investments GP, LLC and LKCM Headwater Investments I,L.P., a private equity fund, since June 2011. He has served as the Chief Executive Officer of the general partnerof Western Pocahontas Properties Limited Partnership since May 2008, and has served on the Board of Directorsof Western Pocahontas since October 2012. Mr. Robertson also co-founded Quintana Energy Partners, anenergy-focused private equity firm in 2006, and served as a Managing Director thereof from 2006 untilDecember 2010. Mr. Robertson has served on the Board of Directors for Quintana Minerals Corporation sinceOctober 2007, and previously served as Vice President—Acquisitions for GP Natural Resource Partners LLCfrom 2003 until 2005. Mr. Robertson also serves on the Board of Directors of the general partner of GenesisEnergy L.P., a publicly traded master limited partnership, as well as Corsa Coal Corp, Buckhorn Energy Servicesand LL&B Minerals, each of which is in the energy business. Mr. Robertson is the son of Corbin J. Robertson, Jr.
Stephen P. Smith joined the Board of Directors of GP Natural Resource Partners LLC in 2004. Mr. Smithbrings extensive public company financial experience in the power and energy industries to the Board ofDirectors. Mr. Smith has been the Executive Vice President and Chief Financial Officer for NiSource, Inc. sinceJune 2008. Mr. Smith is also the Chief Financial Officer and Chief Accounting Officer and a Director of thegeneral partner of Columbia Pipeline Partners LP, which completed its initial public offering in February 2015.Prior to joining NiSource, he held several positions with American Electric Power Company, Inc., includingSenior Vice President—Shared Services from January 2008 to June 2008, Senior Vice President and Treasurerfrom January 2004 to December 2007, and Senior Vice President—Finance from April 2003 to December 2003.From November 2000 to January 2003, Mr. Smith served as President and Chief Operating Officer—CorporateServices for NiSource Inc. Prior to joining NiSource, Mr. Smith served as Deputy Chief Financial Officer forColumbia Energy Group from November 1999 to November 2000 and Chief Financial Officer for Columbia GasTransmission Corporation and Columbia Gulf Transmission Company from 1996 to 1999.
Leo A. Vecellio, Jr. joined the Board of Directors of GP Natural Resource Partners LLC in May 2007.Mr. Vecellio brings extensive experience in the aggregates and coal mine development industry to the Board ofDirectors. Mr. Vecellio and his family have been in the aggregates materials and construction business since thelate 1930s. Since November 2002, Mr. Vecellio has served as Chairman and Chief Executive Officer of VecellioGroup, Inc, a major aggregates producer, contractor and oil terminal developer/operator in the Mid-Atlantic andSoutheastern states. For nearly 30 years prior to that time Mr. Vecellio served in various capacities withVecellio & Grogan, Inc., having most recently served as Chairman and Chief Executive Officer from April 1996to November 2002. Mr. Vecellio is the former Chairman of the American Road and Transportation Builders andis a longtime member of the Florida Council of 100.
Corporate Governance
Board Attendance and Executive Sessions
The Board met nine times in 2014. During that period, every director attended all of the Board meetings,with the exception of Mr. Blakely, who missed two meetings, Mr. Morian, who missed one meeting, and CorbinJ. Robertson, III, who missed one meeting. During 2014, our non-management directors met in executive sessionseveral times. The presiding director was Mr. Blakely, the Chairman of our Compensation, Nominating andGovernance Committee, or CNG Committee. In addition, our independent directors met one time in executivesession in December 2014. Mr. Blakely was the presiding director at that meeting. Interested parties maycommunicate with our non-management directors by writing a letter to the Chairman of the CNG Committee,NRP Board of Directors, 601 Jefferson Street, Suite 3600, Houston, Texas 77002.
Independence of Directors
The Board of Directors has affirmatively determined that Messrs. Blakely, Gordy, Karn, Navarre, Smith andVecellio are independent based on all facts and circumstances considered by the Board, including the standardsset forth in Section 303A.02(a) of the NYSE’s listing standards. Although we had a majority of independentdirectors in 2014, because we are a limited partnership as defined in Section 303A of the NYSE’s listing
115

standards, we are not required to do so. The Board has an Audit Committee, a Compensation, Nominating andGovernance Committee, and a Conflicts Committee, each of which is staffed solely by independent directors.
Audit Committee
Our Audit Committee is comprised of Robert B. Karn III, who serves as chairman, Robert T. Blakely,Richard A. Navarre and Stephen P. Smith. Mr. Karn, Mr. Blakely, Mr. Navarre and Mr. Smith are “AuditCommittee Financial Experts” as determined pursuant to Item 407 of Regulation S-K. Mr. Blakely currentlyserves on four audit committees. In accordance with the rules of the NYSE, our Board of Directors has made thedetermination that Mr. Blakely’s service on four audit committees does not impair his ability to serve effectivelyon our audit committee.
Report of the Audit Committee
Our Audit Committee is composed entirely of independent directors. The members of the Audit Committeemeet the independence and experience requirements of the New York Stock Exchange. The Committee hasadopted, and annually reviews, a charter outlining the practices it follows. The charter complies with all currentregulatory requirements. The Audit Committee Charter is available on our website at www.nrplp.com and isavailable in print upon request.
During 2014, at each of its meetings, the Committee met with the senior members of our financialmanagement team, our general counsel and our independent auditors. The Committee had private sessions atcertain of its meetings with our independent auditors and the senior members of our financial management teamat which candid discussions of financial management, accounting and internal control issues took place.
The Committee approved the engagement of Ernst & Young LLP as our independent auditors for the yearended December 31, 2014 and reviewed with our financial managers and the independent auditors overall auditscopes and plans, the results of internal and external audit examinations, evaluations by the auditors of ourinternal controls and the quality of our financial reporting.
Management has reviewed the audited financial statements in the Annual Report with the Audit Committee,including a discussion of the quality, not just the acceptability, of the accounting principles, the reasonableness ofsignificant accounting judgments and estimates, and the clarity of disclosures in the financial statements. Inaddressing the quality of management’s accounting judgments, members of the Audit Committee asked formanagement’s representations and reviewed certifications prepared by the Chief Executive Officer and ChiefFinancial Officer that our unaudited quarterly and audited consolidated financial statements fairly present, in allmaterial respects, our financial condition and results of operations, and have expressed to both management andauditors their general preference for conservative policies when a range of accounting options is available.
The Committee also discussed with the independent auditors other matters required to be discussed by theauditors with the Committee by PCAOB Auditing Standard AU Section 380, Communication With AuditCommittees. The Committee received and discussed with the auditors their annual written report on theirindependence from the partnership and its management, which is made under Rule 3526, Communication WithAudit Committees Concerning Independence, and considered with the auditors whether the provision of non-audit services provided by them to the partnership during 2014 was compatible with the auditors’ independence.
In performing all of these functions, the Audit Committee acts only in an oversight capacity. The Committeereviews our Quarterly Reports on Form 10-Q and Annual Reports on Form 10-K prior to filing with theSecurities and Exchange Commission. In 2014, the Committee also reviewed quarterly earnings announcementswith management and representatives of the independent auditor in advance of their issuance. In its oversightrole, the Committee relies on the work and assurances of our management, which has the primary responsibilityfor financial statements and reports, and of the independent auditors, who, in their report, express an opinion onthe conformity of our annual financial statements with U.S. generally accepted accounting principles.
116

In reliance on these reviews and discussions, and the report of the independent auditors, the AuditCommittee has recommended to the Board of Directors, and the Board has approved, that the audited financialstatements be included in our Annual Report on Form 10-K for the year ended December 31, 2014, for filingwith the Securities and Exchange Commission.
Robert B. Karn III, ChairmanRobert T. BlakelyRichard A. NavarreStephen P. Smith
Compensation, Nominating and Governance Committee
Executive officer compensation is administered by the CNG Committee, which is comprised of fourmembers. Mr. Blakely, the Chairman, has served on this Committee since 2003. Mr. Karn has served on theCommittee since 2002. Mr. Vecellio joined the committee in 2007, and Mr. Gordy joined the Committee inDecember 2013. The CNG Committee has reviewed and approved the compensation arrangements described inthe Compensation Discussion and Analysis section of this Annual Report on Form 10-K. Our Board of Directorsappoints the CNG Committee and delegates to the CNG Committee responsibility for:
• reviewing and approving the compensation for our executive officers in light of the time that eachexecutive officer allocates to our business;
• reviewing and recommending the annual and long-term incentive plans in which our executive officersparticipate; and
• reviewing and approving compensation for the Board of Directors.
Our Board of Directors has determined that each CNG Committee member is independent under the listingstandards of the NYSE and the rules of the SEC.
Pursuant to its charter, the CNG Committee is authorized to obtain at NRP’s expense compensation surveys,reports on the design and implementation of compensation programs for directors and executive officers andother data that the CNG Committee considers as appropriate. In addition, the CNG Committee has the soleauthority to retain and terminate any outside counsel or other experts or consultants engaged to assist it in theevaluation of compensation of our directors and executive officers. The CNG Committee Charter is available onour website at www.nrplp.com and is available in print upon request.
Section 16(a) Beneficial Ownership Reporting Compliance
Section 16(a) of the Exchange Act requires directors, officers and persons who beneficially own more thanten percent of a registered class of our equity securities to file with the SEC and the NYSE initial reports ofownership and reports of changes in ownership of their equity securities. These people are also required tofurnish us with copies of all Section 16(a) forms that they file. Based solely upon a review of the copies of Forms3, 4 and 5 furnished to us, or written representations from certain reporting persons that no Forms 5 wererequired for transactions occurring in 2014 and except as described below, we believe that our officers anddirectors and persons who beneficially own more than ten percent of a registered class of our equity securitiescomplied with all filing requirements with respect to transactions in our equity securities during 2014. OnDecember 22, 2014, S. Reed Morian filed a Form 4 reporting the purchase of 20,000 common units in the openmarket on December 11, 2014 that had not been previously reported on a timely basis.
Partnership Agreement
Investors may view our partnership agreement and the amendments to the partnership agreement on ourwebsite at www.nrplp.com. The partnership agreement and the amendments are also filed with the SEC and areavailable in print to any unitholder that requests them.
117
Corporate Governance Guidelines and Code of Business Conduct and Ethics
We have adopted Corporate Governance Guidelines. We have also adopted a Code of Business Conduct andEthics that applies to our management, and complies with Item 406 of Regulation S-K. Our CorporateGovernance Guidelines and our Code of Business Conduct and Ethics are available on our website atwww.nrplp.com and are available in print upon request.
NYSE Certification
Pursuant to Section 303A of the NYSE Listed Company Manual, in 2014, Corbin J. Robertson, Jr. certifiedto the NYSE that he was not aware of any violation by the Partnership of NYSE corporate governance listingstandards.
Item 11. Executive Compensation
Compensation Discussion and Analysis
Overview
As a publicly traded partnership, we have a unique employment and compensation structure that is differentfrom that of a typical public corporation. We have no employees, and our executive officers based in Houston,Texas are employed by Quintana Minerals Corporation and our executive officers based in Huntington, WestVirginia are employed by Western Pocahontas Properties Limited Partnership, both of which are our affiliates.For a more detailed description of our structure, see “Item 1. Business—Partnership Structure and Management”in this Annual Report on Form 10-K. Although our executives’ salaries and bonuses are paid directly by theprivate companies that employ them, we reimburse those companies based on the time allocated to NRP by eachexecutive officer. Our reimbursement for the compensation of executive officers is governed by our partnershipagreement.
Executive Officer Compensation Strategy and Philosophy
Under our partnership agreement, we are required to distribute all of our available cash each quarter. Ourprimary business objective is to generate cash flows at levels that can sustain long-term quarterly cash distributionsto our investors. Our executive officer compensation strategy has been designed to motivate and retain ourexecutive officers and to align their interests with those of our unitholders. Our objectives in determining thecompensation of our executive officers are to retain qualified people and encourage them to build the partnership ina way that ensures the stability of the cash distributions to our unitholders and growth in our asset base. We do nottie our compensation to achievement of specific financial targets or fixed performance criteria, but rather evaluatethe appropriate compensation on an annual basis in light of our overall business objectives.
In accordance with our objective of sustaining and increasing the quarterly distribution over the long-term,we believe that optimal alignment between our unitholders and our executive officers is best achieved bycompensating our executive officers through sharing a percentage of distributions received by our general partnerand through distribution equivalent rights (“DERs”) tied to long-term equity-based compensation. The DERs arecontingent rights, granted in tandem with specific phantom units, to receive upon vesting of the related phantomunits an amount in cash equal to the cash distributions made by NRP with respect to its units during the periodsuch phantom unit are outstanding. Our compensation for executive officers consists of four primarycomponents:
• base salaries;
• annual cash incentive awards, including bonuses and cash payments made by our general partner basedon a percentage of the cash it receives from common units that the general partner owns;
• long-term equity incentive compensation; and
• perquisites and other benefits.
Mr. Robertson does not receive a salary or an annual bonus in his capacity as Chief Executive Officer.Rather, for the reasons discussed in greater detail below, Mr. Robertson is compensated exclusively through
118

long-term phantom unit grants awarded by the CNG Committee and through sharing a percentage of thedistributions received by the general partner. Mr. Robertson also directly or indirectly owns in excess of 20% ofthe outstanding common units of NRP, and thus his interests are directly aligned with our unitholders.
In December of each year, our CNG Committee reviews the performance of the executive officers and theamount of time expected to be spent by each NRP officer on NRP business, and determines the salaries for eachofficer for the upcoming year. All of our executive officers other than Mr. Robertson spend 93% or more of theirtime on NRP matters, and NRP bears the allocated cost of their time. Mr. Robertson has historically spentapproximately 50% of his time on NRP matters.
In February of each year, the CNG Committee approves the year-end bonuses for the year just ended andlong-term incentive awards for the executive officers. The CNG Committee considers the performance of thepartnership, the performance of the individuals and the outlook for the future in determining the amounts of theawards. Because we are a partnership, tax and accounting conventions make it more costly for us to issueadditional common units or options as incentive compensation. Consequently, we have no outstanding options orrestricted units and currently have no plans to issue options or restricted units in the future. Instead, we haveissued phantom units to our executive officers that are paid in cash based on the average closing price of ourcommon units for the 20-day trading period prior to vesting. The phantom units typically vest four years from thedate of grant. In connection with the phantom unit awards, the CNG Committee has also granted tandem DERs,which entitle the holders to receive upon vesting of the related phantom units an amount in cash equal to thedistributions paid on our common units during the period in which the phantom units were outstanding. TheDERs have a four-year vesting period. Through these awards, each executive officer’s interest is aligned withthose of our unitholders in sustaining and increasing our quarterly cash distributions over the long-term,increasing the value of our common units, and maintaining a steady growth profile for NRP.
Role of Compensation Experts
The CNG Committee did not retain any consultants to evaluate compensation of officers or directors in2014. The CNG Committee periodically has utilized consultants to get a basic sense of the market, but hasconsidered the advice of the consultant as only one of many factors among the other items discussed in thiscompensation discussion and analysis. For a more detailed description of the CNG Committee and itsresponsibilities, see “Item 10. Directors and Executive Officers of the Managing General Partner and CorporateGovernance” in this Annual Report on Form 10-K.
Role of Our Executive Officers in the Compensation Process
Mr. Robertson provided recommendations to the CNG Committee in its evaluation of the 2014compensation programs for our executive officers. Mr. Wall, our Chief Operating Officer, provided Mr. Hogan,our President, with recommendations relating to the executive officers that are based in Huntington. Mr. Hoganthen reviewed these recommendations and provided these recommendations, along with recommendationsrelating to the executive officers based in Houston, to Mr. Robertson. Mr. Robertson considered thoserecommendations and provided the CNG Committee with recommendations for all of the executive officers otherthan himself. Mr. Robertson relied on his personal experience in setting compensation over a number of years indetermining the appropriate amounts for each employee, and considered each of the factors described elsewherein this compensation discussion and analysis. Mr. Robertson and Mr. Hogan attended the CNG Committeemeetings at which the Committee deliberated and approved the compensation, but were excused from themeetings when the CNG Committee discussed their compensation. No other named executive officer assumed anactive role in the evaluation or design of the 2014 executive officer compensation programs.
Evaluation of 2014 Performance; Components of Compensation
2014 Performance
Although we reduced our quarterly distribution in January 2014 primarily due to continued pressure on thecoal industry, we used the additional liquidity to fund a portion of the purchase prices of the acquisition of
119
VantaCore Partners LLC, an operating construction aggregates producer, and the acquisition of additional non-operated working interests in oil and gas assets in the Williston Basin of North Dakota from an affiliate ofKaiser-Francis Oil Company. These efforts are reflective of NRP management’s desire to continue to grow anddiversify the partnership and create value for our unitholders.
During 2014, NRP’s financial performance met or exceeded the guidance issued to the public markets inJanuary 2014 as confirmed in August 2014. We recorded revenues and other income in 2014 of $388.9 million,which were 8.5% higher than our revenues in 2013. In addition, although distributable cash flow was down 31%compared to 2013, our distribution coverage ratio for 2014 was approximately 1.3x.
Base Salaries
With the exception of Mr. Robertson, who, as described above, does not receive a salary for his services asChief Executive Officer, our named executive officers are paid an annual base salary by Quintana MineralsCorporation (“Quintana”) and Western Pocahontas Properties Limited Partnership (“Western Pocahontas”) forservices rendered to us by the executive officers during the fiscal year. We then reimburse Quintana and WesternPocahontas based on the time allocated by each executive officer to our business. The base salaries of our namedexecutive officers are reviewed on an annual basis as well as at the time of a promotion or other material changein responsibilities. The CNG Committee reviews and approves the full salaries paid to each executive officer byQuintana and Western Pocahontas, based on both the actual time allocations to NRP in the prior year and theanticipated time allocations in the coming year. Adjustments in base salary are based on an evaluation ofindividual performance, our partnership’s overall performance during the fiscal year and the individual’scontribution to our overall performance.
In determining salaries for NRP’s executive officers for 2015, at the December 2014 meeting, the CNGCommittee considered the financial performance of NRP for the nine months ended September 30, 2014 as wellas the projected financial performance of NRP for the fourth quarter of 2014 and for the year endingDecember 31, 2015. The CNG Committee also considered the individual performance of each member of theexecutive management team during 2014 and the changes to the management team that became effective duringthe year. Based on its review, the CNG Committee determined generally to increase 2015 salaries for themanagement team, with the exceptions of Mr. Dunlap, who retired as our Chief Financial Officer and Treasurereffective January 1, 2015, and Mr. Wall, who will retire as our Chief Operating Officer effective March 1, 2015.The amount of the increases varied among the management team members based on their expected contributionsto the company during 2015.
Annual Cash Incentive Awards
Each named executive officer, participated in two cash incentive programs in 2014, with the exception ofMr. Robertson who did not participate in the cash bonus program. The first program is a discretionary cash bonusaward approved in February 2015 by the CNG Committee based on similar criteria used to evaluate the annualbase salaries. The bonuses awarded with respect to 2014 under this program are disclosed in the SummaryCompensation Table under the Bonus column. As with the base salaries, there are no formulas or specificperformance targets related to these awards. The bonuses for Mr. Hogan and Ms. Wilson were increased as aresult of NRP’s strong performance during 2014 in a difficult commodity price environment and as a result oftheir contributions to the company during 2014, including with respect to the two significant acquisitionscompleted during the year. The increase in Mr. Hogan’s bonus also reflects his additional responsibilities asPresident. The bonuses for Mr. Dunlap, who retired as our Chief Financial Officer and Treasurer effectiveJanuary 1, 2015, and Mr. Wall, who will retire as our Chief Operating Officer effective March 1, 2015 were keptconstant at 2013 levels.
Under the second cash incentive program, our general partner has set aside 7.5% of the cash distributions itreceives on an annual basis with respect to distributions on common units held by our general partner for awardsto our executive officers, including Mr. Robertson. Although Mr. Robertson has the sole discretion to determinethe amount of the 7.5% that is allocated to each executive officer, including himself, the cash awards that ourofficers receive under this plan are reviewed by the CNG Committee and taken into account when making
120

determinations with respect to salaries, bonuses and long-term incentive awards. Because they are ultimatelyreimbursed by the general partner and not NRP, the incentive payments made with respect to this program do nothave any impact on our financial statements or cash available for distribution to our unitholders. Since the cost ofthese awards is not borne by NRP, we have not disclosed the amounts of these awards in the SummaryCompensation Table, but have included the amounts separately in a footnote to the table. With the exception ofMr. Hogan, whose amount decreased by less than 2% over 2013, and Ms. Wilson, who was not a namedexecutive officer with respect to 2013, the amounts received by the named executive officers, includingMr. Robertson, were significantly lower for 2014 as compared to 2013. The per unit distribution paid by NRPduring the calendar year ended December 31, 2014 was 37% lower than that paid in 2013, resulting in adecreased overall amount allocated to the executive officers. The amount received by Mr. Hogan reflected hissignificantly increased responsibility and contributions as President of NRP but was approximately 28% less thanthe amount received by Mr. Carter, NRP’s former President and Chief Operating Officer, with respect to 2013.The remaining portion of the cash awards under this program was allocated equally among NRP’s otherexecutive officers, including Mr. Robertson. We believe that these awards align the interests of our executiveofficers directly with our unitholders.
Long-Term Incentive Compensation
At the time of our initial public offering, we adopted the Natural Resource Partners Long-Term IncentivePlan for our directors and all the employees who perform services for NRP, including the executive officers. Weconsider long-term equity-based incentive compensation to be the most important element of our compensationprogram for executive officers because we believe that these awards keep our officers focused on the growth ofNRP, particularly the sustainability and long-term growth of quarterly distributions and their impact on our unitprice, over an extended time horizon.
Consistent with this approach, we have included DERs as a possible award to be granted under the plan. TheDERs are contingent rights, granted in tandem with phantom units, to receive upon vesting of the relatedphantom units an amount in cash equal to the cash distributions made by NRP with respect to the common unitsduring the period in which the phantom units are outstanding.
Our CNG Committee has generally approved annual awards of phantom units that vest four years from thedate of grant. The amounts included in the compensation table reflect the grant date fair value of the unit awardsdetermined in accordance with FASB stock compensation authoritative guidance. NRP bears 100% of the costsof the phantom units. We have structured the phantom unit awards so that our executive officers and directorsdirectly benefit along with our unitholders when our unit price increases, and experience reductions in the valueof their incentive awards when our unit price declines. Similarly, because the awards are forfeited by theexecutives upon termination of employment in most instances, the long-term vesting component of these awardsencourages our senior executives and employees to remain with NRP over an extended period of time, therebyensuring continuity in our management team. This strategy has proved effective as NRP’s senior managementteam has experienced no turnover since the initial public offering.
In determining 2015 LTIP awards for NRP’s executive officers, at the February 2015 meeting, the CNGCommittee considered the financial performance of NRP for the year ended December 31, 2014 as well as theprojected financial performance of NRP for the year ending December 31, 2015. When determining the 2015LTIP awards, the CNG Committee’s goal was to incentivize the management team during this difficultcommodity price cycle and foster the retention of such officers. Mr. Robertson’s 2015 award was increasedconsistent with the level of increases in awards to him in prior years. Mr. Dunlap’s 2015 award was lower thanthe previous year due to his retirement from NRP effective January 1, 2015 and the expectation that he willallocate approximately 50% of his time to NRP during 2015. Mr. Hogan’s 2015 award was increased relative to2014 in order to reflect his increased responsibilities as President of NRP. Mr. Wall did not receive a 2015 awarddue to his retirement from NRP effective March 1, 2015. However, the CNG Committee has determined that allof Mr. Wall’s outstanding LTIP awards will be vested upon his retirement from NRP effective March 1, 2015.Ms. Wilson’s 2015 award was increased to a level consistent with that of NRP’s other executive officers.
121

Perquisites and Other Personal Benefits
Both Quintana and Western Pocahontas maintain employee benefit plans that provide our executive officersand other employees with the opportunity to enroll in health, dental and life insurance plans. Each of thesebenefit plans require the employee to pay a portion of the health and dental premiums, with the company payingthe remainder. These benefits are offered on the same basis to all employees of Quintana and WesternPocahontas, and the company costs are reimbursed by us to the extent the employee allocates time to ourbusiness.
Quintana and Western Pocahontas also maintain 401(k) and defined contribution retirement plans. Quintanamatches 100% of the first 4.5% of the employee contributions under the 401(k) plan and Western Pocahontasmatches the employee contributions at a level of 100% of the first 3% of the contribution and 50% of the next3% of the contribution. In addition, each company contributes 1/12 of each employee’s base salary to the definedcontribution retirement plan on an annual basis. As with the other contributions, any amounts contributed byQuintana and Western Pocahontas are reimbursed by us based on the time allocated by the employee to ourbusiness. The payments made to Messrs. Dunlap, Hogan, Wall and Carter under the defined contribution planexceeded $10,000 in each of 2012, 2013 and 2014, but did not exceed $25,000 for any individual in any year.The payment made to Ms. Wilson, who was not a named executive officer in 2012 or 2013, under the definedcontribution plan in 2014 exceeded $10,000 but did not exceed $25,000. None of NRP, Quintana or WesternPocahontas maintains a pension plan or a defined benefit retirement plan. As noted in the SummaryCompensation Table, in 2012, 2013 and 2014 we also reimbursed Quintana and Western Pocahontas for carallowances provided to Messrs. Dunlap, Wall and Carter.
Unit Ownership Requirements
We do not have any policy guidelines that require specified ownership of our common units by our directorsor executive officers or unit retention guidelines applicable to equity-based awards granted to directors orexecutive officers. As of December 31, 2014, our named executive officers held 272,425 phantom units that havebeen granted as compensation. In addition, Mr. Robertson directly or indirectly owns in excess of 20% of theoutstanding units of NRP.
Securities Trading Policy
Our insider trading policy states that executive officers and directors may not purchase or sell puts or callsto sell or buy our common units, engage in short sales with respect to our common units, or buy our securities onmargin.
Tax Implications of Executive Compensation
Because we are a partnership, Section 162(m) of the Internal Revenue Code does not apply to compensationpaid to our named executive officers and accordingly, the CNG Committee did not consider its impact indetermining compensation levels in 2012, 2013 or 2014. The CNG Committee has taken into account the taximplications to the partnership in its decision to limit the long-term incentive compensation to phantom units asopposed to options or restricted units.
Accounting Implications of Executive Compensation
The CNG Committee has considered the partnership accounting implications, particularly the “book-up”cost, of issuing equity as incentive compensation, and has determined that phantom units offer the bestaccounting treatment for the partnership while still motivating and retaining our executive officers.
Report of the Compensation, Nominating and Governance Committee
The CNG Committee has reviewed and discussed the Compensation Discussion and Analysis required byItem 402(b) of Regulation S-K with management. Based on the reviews and discussions referred to in the
122

foregoing sentence, the CNG Committee recommended to the board of directors that the CompensationDiscussion and Analysis be included in this Annual Report on Form 10-K for the year ended December 31, 2014.
Robert T. Blakely, ChairmanRussell D. GordyRobert B. Karn IIILeo A. Vecellio, Jr.
Summary Compensation Table
The following table sets forth the amounts reimbursed to affiliates of our general partner for compensationexpense in 2012, 2013 and 2014 based on time allocated by each individual to Natural Resource Partners. In2014, Messrs. Robertson, Dunlap, Hogan and Wall and Ms. Wilson spent approximately 50%, 96%, 100%, 95%and 93%, respectively, of their time on NRP matters. Mr. Carter retired as President and Chief Operating Officereffective September 1, 2014. Prior to that, Mr. Carter spent approximately 97% of this time on NRP matters.Phantom unit awards in the table below represent all amounts paid to the named executive officers in 2014 withrespect to the vesting of such awards, as NRP bears 100% of the costs of all awards under the LTIP.
Summary Compensation Table
Name and Principal Position YearSalary
($)Bonus
($)
PhantomUnit
Awards(4)($)
All OtherCompensation(5)
($)Total
($)
Corbin J. Robertson, Jr. . . . . . . . . . . . . . . . . . .Chairman and CEO
201420132012
———
———
595,728712,000830,400
———
595,728712,000830,400
Dwight L. Dunlap(1) . . . . . . . . . . . . . . . . . . . .Chief Financial Officer and Treasurer
201420132012
327,343328,193325,189
126,900126,900141,000
186,165222,500259,500
39,05638,53737,577
679,464716,130763,266
Wyatt L. Hogan . . . . . . . . . . . . . . . . . . . . . . . .President
201420132012
377,654344,970328,337
225,000126,900141,000
186,165222,500259,500
33,33631,35830,988
822,155725,728759,825
Kevin F. Wall . . . . . . . . . . . . . . . . . . . . . . . . .Chief Operating Officer
201420132012
215,759205,485205,485
126,900126,900141,000
186,165222,500259,500
35,09933,78133,781
563,923588,666639,766
Kathryn S. Wilson(2) . . . . . . . . . . . . . . . . . . .Vice President, General Counsel andSecretary
2014 291,375 100,000 121,007 30,869 543,251
Nick Carter(3) . . . . . . . . . . . . . . . . . . . . . . . . .Former President and Chief OperatingOfficer
201420132012
252,200378,300378,300
133,000199,260221,400
297,864356,000415,200
99,458(6)40,47339,851
782,522974,033
1,054,751
(1) Mr. Dunlap retired as Chief Financial Officer and Treasurer effective January 1, 2015.
(2) Ms. Wilson was not a named executive officer for purposes of this Summary Compensation Table during2013 or 2012.
(3) Mr. Carter retired as President and Chief Operating Officer effective September 1, 2014. Mr. Carterremained employed by Western Pocahontas Properties Limited Partnership from September 1, 2014 throughDecember 31, 2014 and provided consulting services to Natural Resource Partners L.P. during that time. Hecontinued to receive his 2014 salary and employee benefits through December 31, 2014. One-half of theexpenses related to Mr. Carter’s salary and employee benefits for the last four months of 2014 was borne byNatural Resource Partners L.P.
(4) Amounts represent the grant date fair value of phantom unit awards determined in accordance withAccounting Standards Codification Topic 718. For information regarding the assumptions used incalculating these amounts for 2014, see Note 16 to the audited consolidated financial statements includedelsewhere in this Annual Report on Form 10-K.
123

(5) Includes portions of automobile allowance, 401(k) matching and retirement contributions allocated toNatural Resource Partners by Quintana and Western Pocahontas. The table does not include any cashcompensation paid by the general partner to each named executive officer. The general partner maydistribute up to 7.5% of any cash it receives with respect to the common units that it received in connectionwith the elimination of the incentive distribution rights. We do not reimburse the general partner for any ofthese payments, and the payments are not an expense of NRP. The table below shows the amounts paid bythe general partner that are not reimbursed by NRP:
Compensation Received from General Partnerand Not Reimbursed by NRP
Individual Year $
Corbin J. Robertson, Jr. . . . . . . . . . . . . . . . . . . . . . . . . . . . . . . . . . . . . . . . . . 201420132012
180,000456,000456,000
Dwight L. Dunlap . . . . . . . . . . . . . . . . . . . . . . . . . . . . . . . . . . . . . . . . . . . . . 201420132012
180,000391,000391,000
Wyatt L. Hogan . . . . . . . . . . . . . . . . . . . . . . . . . . . . . . . . . . . . . . . . . . . . . . . 201420132012
384,000391,000391,000
Kevin F. Wall . . . . . . . . . . . . . . . . . . . . . . . . . . . . . . . . . . . . . . . . . . . . . . . . 201420132012
180,000391,000391,000
Kathryn S. Wilson . . . . . . . . . . . . . . . . . . . . . . . . . . . . . . . . . . . . . . . . . . . . . 2014 180,000
Nick Carter . . . . . . . . . . . . . . . . . . . . . . . . . . . . . . . . . . . . . . . . . . . . . . . . . . 201420132012
—536,000536,000
(6) Includes $65,000 salary and $7,061 for 401K match, retirement contribution and car allowance in othercompensation received by Mr. Carter for the months of September through December 2014. These amountsrepresent 50% of the total salary and other compensation received by Mr. Carter during that period.
Grants of Plan-Based Awards in 2014
Named Executive Officer Grant Date
Number ofPhantom Units(1)
(#)
Grant DateFair Value of
Unit Awards(2)($)
Corbin J. Robertson, Jr. . . . . . . . . . . . . . . . . . . . . . . . . 2/12/2014 33,600 595,728
Dwight L. Dunlap . . . . . . . . . . . . . . . . . . . . . . . . . . . . 2/12/2014 10,500 186,165
Wyatt L. Hogan . . . . . . . . . . . . . . . . . . . . . . . . . . . . . . 2/12/2014 10,500 186,165
Kevin F. Wall . . . . . . . . . . . . . . . . . . . . . . . . . . . . . . . 2/12/2014 10,500 186,165
Kathryn S. Wilson . . . . . . . . . . . . . . . . . . . . . . . . . . . . 2/12/2014 6,825 121,007
Nick Carter . . . . . . . . . . . . . . . . . . . . . . . . . . . . . . . . . 2/12/2014 16,800 297,864
(1) The phantom units were granted in February 2014 and will vest in February 2018.
(2) Amounts represent the grant date fair value of phantom unit awards determined in accordance withAccounting Standards Codification Topic 718.
None of our executive officers has an employment agreement, and the salary, bonus and phantom unitawards noted above are approved by the CNG Committee. See our disclosure under “—CompensationDiscussion and Analysis” for a description of the factors that the CNG Committee considers in determining theamount of each component of compensation.
124

Subject to the rules of the exchange upon which the common units are listed at the time, the board ofdirectors and the CNG Committee have the right to alter or amend the Long-Term Incentive Plan or any part ofthe Long-Term Incentive Plan from time to time. Except upon the occurrence of unusual or nonrecurring events,no change in any outstanding grant may be made that would materially reduce any award to a participant withoutthe consent of the participant.
The CNG Committee may make grants under the Long-Term Incentive Plan to employees and directorscontaining such terms as it determines, including the vesting period. Outstanding grants vest upon a change incontrol of NRP, our general partner or GP Natural Resource Partners LLC. If a grantee’s employment ormembership on the board of directors terminates for any reason, outstanding grants will be automaticallyforfeited unless and to the extent the CNG Committee provides otherwise.
As stated above under “—Compensation Discussion and Analysis,” we have no outstanding option grants,and do not intend to grant any options or restricted unit awards in the future. The CNG Committee regularlymakes awards of phantom units on an annual basis in February.
Outstanding Awards at December 31, 2014
The table below shows the total number of outstanding phantom units held by each named executive officerat December 31, 2014. The phantom units shown below have been awarded over the last four years, with aportion of the phantom units vesting in February in each of 2015, 2016, 2017 and 2018.
Named Executive Officer
Number ofPhantom Units That
Have Not Vested(#)
Market Valueof Phantom Units That
Have Not Vested(1)($)
Corbin J. Robertson, Jr. . . . . . . . . . . . . . . . . . . . . . . . . . . . . 130,600(2) 1,754,120
Dwight L. Dunlap . . . . . . . . . . . . . . . . . . . . . . . . . . . . . . . . 39,500(3) 526,270
Wyatt L. Hogan . . . . . . . . . . . . . . . . . . . . . . . . . . . . . . . . . . 39,500(3) 526,270
Kevin F. Wall . . . . . . . . . . . . . . . . . . . . . . . . . . . . . . . . . . . . 39,500(3) 526,270
Kathryn S. Wilson . . . . . . . . . . . . . . . . . . . . . . . . . . . . . . . . 23,325(4) 273,247
Nick Carter . . . . . . . . . . . . . . . . . . . . . . . . . . . . . . . . . . . . . . — —
(1) Based on a unit price of $9.25, the closing price for the common units on December 31, 2014. The valuealso includes the value of the accrued DERs as of December 31, 2014.
(2) Includes 33,000 phantom units vested on February 10, 2015, 32,000 phantom units vesting on February 14,2016, 32,000 phantom units vesting on February 13, 2017 and 33,600 phantom units vesting onFebruary 12, 2018.
(3) Includes 9,000 phantom units vested on February 10, 2015, 10,000 phantom units vesting on February 14,2016, 10,000 phantom units vesting on February 13, 2017 and 10,500 phantom units vesting onFebruary 12, 2018.
(4) Includes 4,500 phantom units vested on February 10, 2015, 5,500 phantom units vesting on February 14,2016, 6,500 phantom units vesting on February 13, 2017 and 6,825 phantom units vesting on February 12,2018. Phantom units vested in 2015 and phantom units vesting in 2016 and 2017 include accrued DERsfrom February 12, 2013, the date of the grant of these units to Ms. Wilson.
125

Phantom Units Vested in 2014
The table below shows the phantom units that vested with respect to each named executive officer in 2014,along with the value realized by each individual.
Named Executive Officer
Number ofPhantom Units That
Vested(#)
Value Realized onVesting
($)
Corbin J. Robertson, Jr. . . . . . . . . . . . . . . . . . . . . . . . . . . . . . . . 33,000 803,880
Dwight L. Dunlap . . . . . . . . . . . . . . . . . . . . . . . . . . . . . . . . . . . . 8,000 194,880
Wyatt L. Hogan . . . . . . . . . . . . . . . . . . . . . . . . . . . . . . . . . . . . . 8,000 194,880
Kevin F. Wall . . . . . . . . . . . . . . . . . . . . . . . . . . . . . . . . . . . . . . . 8,000 194,880
Kathryn S. Wilson . . . . . . . . . . . . . . . . . . . . . . . . . . . . . . . . . . . 3,500 62,335(1)
Nick Carter(2) . . . . . . . . . . . . . . . . . . . . . . . . . . . . . . . . . . . . . . . 77,800 1,592,214
(1) Includes accrued DERs from February 12, 2013, the date of the grant of these units to Ms. Wilson.
(2) Includes the phantom units and amount paid to Mr. Carter upon the vesting of all of his phantom units uponhis retirement effective September 1, 2014 pursuant to the terms of Mr. Carter’s Continued Employmentand Separation Agreement. In accordance with the terms of the phantom units, Mr. Carter received for eachphantom unit an amount in cash equal to the average closing price of NRP’s common units for the 20trading days immediately preceding the vesting date, together with associated DERs. See “—PotentialPayments upon Termination or Change in Control.”
Potential Payments upon Termination or Change in Control
Upon the occurrence of a change in control of NRP, our general partner or GP Natural Resource PartnersLLC, the outstanding phantom unit awards held by each of our executive officers would immediately vest. Thetable below indicates the impact of a change in control on the outstanding equity-based awards at December 31,2014, based on the 20-day average of the common units of $9.78 on December 31, 2014 and includes amountsfor accrued DERs.
Named Executive Officer
Number ofPhantom
UnitsThat HaveNot Vested
(#)
PotentialPost-Employment
PaymentsRequired Upon
Change inControl
($)
PotentialCash PaymentsRequired Upon
Change inControl
($)
Corbin J. Robertson, Jr. . . . . . . . . . . . . . . . . . . . . . . . . 130,600 — 1,823,142
Dwight L. Dunlap . . . . . . . . . . . . . . . . . . . . . . . . . . . . . 39,500 — 547,146
Wyatt L. Hogan . . . . . . . . . . . . . . . . . . . . . . . . . . . . . . 39,500 — 547,146
Kevin F. Wall . . . . . . . . . . . . . . . . . . . . . . . . . . . . . . . . 39,500 — 547,146(1)
Kathryn S. Wilson . . . . . . . . . . . . . . . . . . . . . . . . . . . . 23,325 — 285,575(2)
Nick Carter . . . . . . . . . . . . . . . . . . . . . . . . . . . . . . . . . . — — —
(1) The CNG Committee has determined that all of Mr. Wall’s phantom units will vest upon his retirementeffective March 1, 2015. In accordance with the terms of the phantom units, Mr. Wall will receive for eachphantom unit an amount in cash equal to the average closing price of NRP’s common units for the 20trading days immediately preceding the vesting date, together with associated DERs.
(2) Phantom units vested in 2015 and phantom units vesting in 2016 and 2017 include accrued DERs fromFebruary 12, 2013, the date of the grant of these units to Ms. Wilson.
None of our executive officers have entered into employment agreements with Natural Resource Partners orits affiliates. Consequently, there are no severance benefits payable to any executive officer upon the termination
126
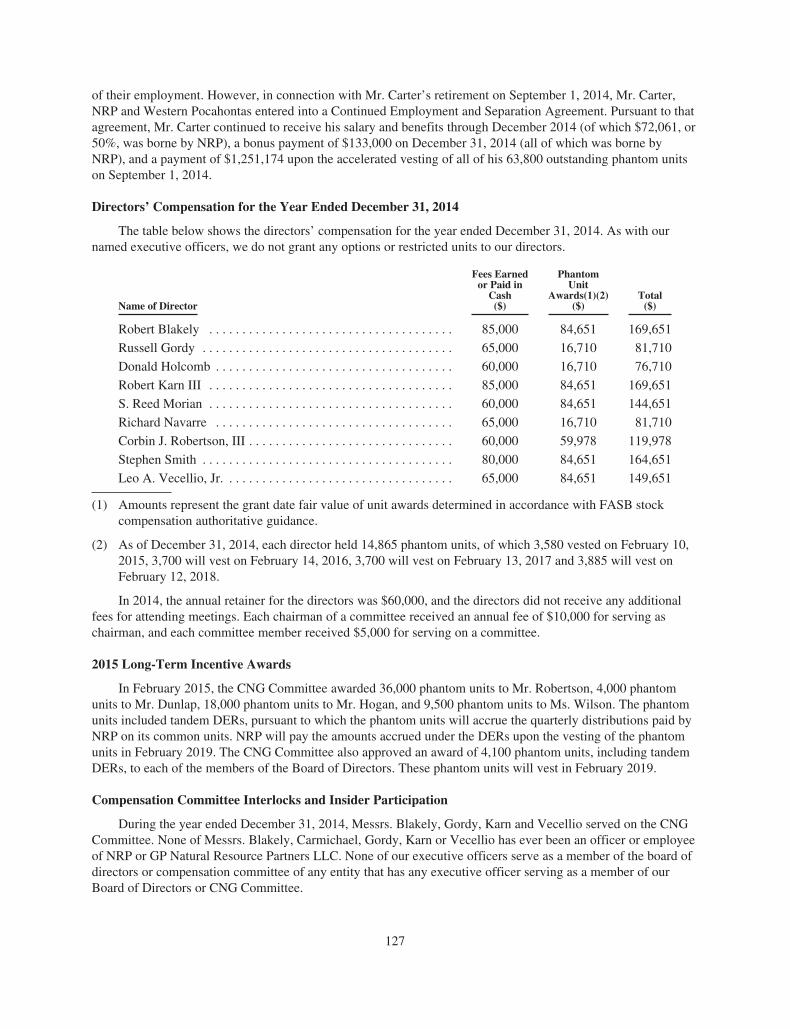
of their employment. However, in connection with Mr. Carter’s retirement on September 1, 2014, Mr. Carter,NRP and Western Pocahontas entered into a Continued Employment and Separation Agreement. Pursuant to thatagreement, Mr. Carter continued to receive his salary and benefits through December 2014 (of which $72,061, or50%, was borne by NRP), a bonus payment of $133,000 on December 31, 2014 (all of which was borne byNRP), and a payment of $1,251,174 upon the accelerated vesting of all of his 63,800 outstanding phantom unitson September 1, 2014.
Directors’ Compensation for the Year Ended December 31, 2014
The table below shows the directors’ compensation for the year ended December 31, 2014. As with ournamed executive officers, we do not grant any options or restricted units to our directors.
Name of Director
Fees Earnedor Paid in
Cash($)
PhantomUnit
Awards(1)(2)($)
Total($)
Robert Blakely . . . . . . . . . . . . . . . . . . . . . . . . . . . . . . . . . . . . . 85,000 84,651 169,651
Russell Gordy . . . . . . . . . . . . . . . . . . . . . . . . . . . . . . . . . . . . . . 65,000 16,710 81,710
Donald Holcomb . . . . . . . . . . . . . . . . . . . . . . . . . . . . . . . . . . . . 60,000 16,710 76,710
Robert Karn III . . . . . . . . . . . . . . . . . . . . . . . . . . . . . . . . . . . . . 85,000 84,651 169,651
S. Reed Morian . . . . . . . . . . . . . . . . . . . . . . . . . . . . . . . . . . . . . 60,000 84,651 144,651
Richard Navarre . . . . . . . . . . . . . . . . . . . . . . . . . . . . . . . . . . . . 65,000 16,710 81,710
Corbin J. Robertson, III . . . . . . . . . . . . . . . . . . . . . . . . . . . . . . . 60,000 59,978 119,978
Stephen Smith . . . . . . . . . . . . . . . . . . . . . . . . . . . . . . . . . . . . . . 80,000 84,651 164,651
Leo A. Vecellio, Jr. . . . . . . . . . . . . . . . . . . . . . . . . . . . . . . . . . . 65,000 84,651 149,651
(1) Amounts represent the grant date fair value of unit awards determined in accordance with FASB stockcompensation authoritative guidance.
(2) As of December 31, 2014, each director held 14,865 phantom units, of which 3,580 vested on February 10,2015, 3,700 will vest on February 14, 2016, 3,700 will vest on February 13, 2017 and 3,885 will vest onFebruary 12, 2018.
In 2014, the annual retainer for the directors was $60,000, and the directors did not receive any additionalfees for attending meetings. Each chairman of a committee received an annual fee of $10,000 for serving aschairman, and each committee member received $5,000 for serving on a committee.
2015 Long-Term Incentive Awards
In February 2015, the CNG Committee awarded 36,000 phantom units to Mr. Robertson, 4,000 phantomunits to Mr. Dunlap, 18,000 phantom units to Mr. Hogan, and 9,500 phantom units to Ms. Wilson. The phantomunits included tandem DERs, pursuant to which the phantom units will accrue the quarterly distributions paid byNRP on its common units. NRP will pay the amounts accrued under the DERs upon the vesting of the phantomunits in February 2019. The CNG Committee also approved an award of 4,100 phantom units, including tandemDERs, to each of the members of the Board of Directors. These phantom units will vest in February 2019.
Compensation Committee Interlocks and Insider Participation
During the year ended December 31, 2014, Messrs. Blakely, Gordy, Karn and Vecellio served on the CNGCommittee. None of Messrs. Blakely, Carmichael, Gordy, Karn or Vecellio has ever been an officer or employeeof NRP or GP Natural Resource Partners LLC. None of our executive officers serve as a member of the board ofdirectors or compensation committee of any entity that has any executive officer serving as a member of ourBoard of Directors or CNG Committee.
127

Item 12. Security Ownership of Certain Beneficial Owners and Management
The following table sets forth, as of February 27, 2015, the amount and percentage of our common unitsbeneficially held by (1) each person known to us to beneficially own 5% or more of any class of our units, (2) byeach of the directors and executive officers and (3) by all directors and executive officers as a group. Unlessotherwise noted, each of the named persons and members of the group has sole voting and investment powerwith respect to the units shown.
Name of Beneficial OwnerCommon
Units
Percentage ofCommonUnits(1)
Corbin J. Robertson, Jr.(2) . . . . . . . . . . . . . . . . . . . . . . . . . . . . . . . . . . . . . 24,346,308 19.9%
Western Pocahontas Properties(3) . . . . . . . . . . . . . . . . . . . . . . . . . . . . . . . 17,279,860 14.1%
Wyatt L. Hogan(4) . . . . . . . . . . . . . . . . . . . . . . . . . . . . . . . . . . . . . . . . . . . 12,500 *
Craig W. Nunez . . . . . . . . . . . . . . . . . . . . . . . . . . . . . . . . . . . . . . . . . . . . . — —
Kevin F. Wall(5) . . . . . . . . . . . . . . . . . . . . . . . . . . . . . . . . . . . . . . . . . . . . . 4,000 *
Kevin J. Craig . . . . . . . . . . . . . . . . . . . . . . . . . . . . . . . . . . . . . . . . . . . . . . . 18,000 *
Dennis F. Coker . . . . . . . . . . . . . . . . . . . . . . . . . . . . . . . . . . . . . . . . . . . . . 4,500 *
David M. Hartz . . . . . . . . . . . . . . . . . . . . . . . . . . . . . . . . . . . . . . . . . . . . . . 1,140 *
Kenneth Hudson . . . . . . . . . . . . . . . . . . . . . . . . . . . . . . . . . . . . . . . . . . . . . 8,000 *
Kathy H. Roberts . . . . . . . . . . . . . . . . . . . . . . . . . . . . . . . . . . . . . . . . . . . . 20,000 *
Kathryn S. Wilson . . . . . . . . . . . . . . . . . . . . . . . . . . . . . . . . . . . . . . . . . . . — —
Gregory F. Wooten . . . . . . . . . . . . . . . . . . . . . . . . . . . . . . . . . . . . . . . . . . . — —
Robert T. Blakely . . . . . . . . . . . . . . . . . . . . . . . . . . . . . . . . . . . . . . . . . . . . 22,500 *
Russell D. Gordy . . . . . . . . . . . . . . . . . . . . . . . . . . . . . . . . . . . . . . . . . . . . 70,000 *
Donald R. Holcomb(6) . . . . . . . . . . . . . . . . . . . . . . . . . . . . . . . . . . . . . . . . 5,469,950 4.5%
Robert B. Karn III(7) . . . . . . . . . . . . . . . . . . . . . . . . . . . . . . . . . . . . . . . . . 5,634 *
Richard A. Navarre . . . . . . . . . . . . . . . . . . . . . . . . . . . . . . . . . . . . . . . . . . . — —
S. Reed Morian(8) . . . . . . . . . . . . . . . . . . . . . . . . . . . . . . . . . . . . . . . . . . . 6,161,588 5.0%
Corbin J. Robertson III(9) . . . . . . . . . . . . . . . . . . . . . . . . . . . . . . . . . . . . . . 1,727,892 1.4%
Stephen P. Smith . . . . . . . . . . . . . . . . . . . . . . . . . . . . . . . . . . . . . . . . . . . . . 3,552 *
Leo A. Vecellio, Jr. . . . . . . . . . . . . . . . . . . . . . . . . . . . . . . . . . . . . . . . . . . . 20,000 *
Directors and Officers as a Group . . . . . . . . . . . . . . . . . . . . . . . . . . . . . . . 37,895,563 31.0%
* Less than one percent.
(1) Percentages based upon 122,299,825 common units issued and outstanding. Unless otherwise noted,beneficial ownership is less than 1%.
(2) Mr. Robertson may be deemed to beneficially own the 17,279,860 common units owned by WesternPocahontas Properties Limited Partnership, 5,627,120 common units held by Western Bridgeport, Inc.,110,206 common units held by Western Pocahontas Corporation and 56 common units held by QMP Inc.Also included are 31,540 common units held by Barbara Robertson, Mr. Robertson’s spouse.Mr. Robertson’s address is 601 Jefferson Street, Suite 3600, Houston, Texas 77002. The 5,627,120 unitsheld by Western Bridgeport are pledged as collateral for a loan.
(3) These common units may be deemed to be beneficially owned by Mr. Robertson. The address of WesternPocahontas Properties Limited Partnership is 601 Jefferson Street, Suite 3600, Houston, Texas 77002.
(4) Of these common units, 500 common units are owned by the Anna Margaret Hogan 2002 Trust, 500common units are owned by the Alice Elizabeth Hogan 2002 Trust, and 500 common units are held by theEllen Catlett Hogan 2005 Trust. Mr. Hogan is a trustee of each of these trusts.
128

(5) Includes 500 common units held by Mr. Wall’s daughter. Mr. Wall disclaims beneficial ownership of thesesecurities.
(6) Includes 5,349,816 common units held by Cline Trust Company LLC. Mr. Holcomb is a manager of ClineTrust Company and may be deemed to have voting or investment power over the common units held ofrecord by Cline Trust Company. The members of Cline Trust Company are for trusts for the benefit ofChristopher Cline, and Mr. Holcomb serves as trustee of each of those trusts. Mr. Holcomb disclaimsbeneficial ownership of the common units held by Cline Trust Company.
(7) Includes 317 common units held by each of two trusts for the benefit of Mr. Karn’s grandchildren. Mr. Karnis the trustee of each of these trusts for his grandchildren, but disclaims beneficial ownership of thesesecurities.
(8) Mr. Morian may be deemed to beneficially own 3,448,624 common units owned by Shadder Investmentsand 600,972 common units held by Mocol Properties. The 3,448,624 units owned by Shadder Investmentsare pledged as collateral for a loan.
(9) Mr. Robertson may be deemed to beneficially own 97,828 common units held CIII Capital Management,LLC, 100,000 common units held by BHJ Investments, 50,461 common units held by The Corbin JamesRobertson III 2009 Family Trust and 387 common units held by his spouse, Brooke Robertson. The addressfor CIII Capital Management, LLC is 601 Jefferson, Suite 3600, Houston, TX 77002, the address for BHJInvestments is 601 Jefferson, Suite 3600, Houston, TX 77002 and the address for The Corbin JamesRobertson III 2009 Family Trust is 601 Jefferson, Suite 3600, Houston, TX 77002. The following commonunits are pledged as collateral for loans: 295,413 common units owned directly by Mr. Robertson and31,000 of the units held by CIII Capital Management, LLC.
Item 13. Certain Relationships and Related Transactions, and Director Independence
Western Pocahontas Properties Limited Partnership, New Gauley Coal Corporation and Great NorthernProperties Limited Partnership are three privately held companies that are primarily engaged in owning andmanaging mineral properties. We refer to these companies collectively as the WPP Group. Corbin J. Robertson,Jr. owns the general partner of Western Pocahontas Properties, 85% of the general partner of Great NorthernProperties and is the Chairman and Chief Executive Officer of New Gauley Coal Corporation.
Omnibus Agreement
Non-competition Provisions
As part of the omnibus agreement entered into concurrently with the closing of our initial public offering,the WPP Group and any entity controlled by Corbin J. Robertson, Jr., which we refer to in this section as the GPaffiliates, each agreed that neither they nor their affiliates will, directly or indirectly, engage or invest in entitiesthat engage in the following activities (each, a “restricted business”) in the specific circumstances describedbelow:
• the entering into or holding of leases with a party other than an affiliate of the GP affiliate for any GPaffiliate-owned fee coal reserves within the United States; and
• the entering into or holding of subleases with a party other than an affiliate of the GP affiliate for coalreserves within the United States controlled by a paid-up lease owned by any GP affiliate or its affiliate.
“Affiliate” means, with respect to any GP affiliate or, any other entity in which such GP affiliate owns,through one or more intermediaries, 50% or more of the then outstanding voting securities or other ownershipinterests of such entity. Except as described below, the WPP Group and their respective controlled affiliates willnot be prohibited from engaging in activities in which they compete directly with us.
A GP affiliate may, directly or indirectly, engage in a restricted business if:
• the GP affiliate was engaged in the restricted business at the closing of the offering; provided that if the fairmarket value of the asset or group of related assets of the restricted business subsequently exceeds $10million, the GP affiliate must offer the restricted business to us under the offer procedures described below.
129

• the asset or group of related assets of the restricted business have a fair market value of $10 million orless; provided that if the fair market value of the assets of the restricted business subsequently exceeds $10million, the GP affiliate must offer the restricted business to us under the offer procedures describedbelow.
• the asset or group of related assets of the restricted business have a fair market value of more than $10million and the general partner (with the approval of the conflicts committee) has elected not to cause usto purchase these assets under the procedures described below.
• its ownership in the restricted business consists solely of a non-controlling equity interest.
For purposes of this paragraph, “fair market value” means the fair market value as determined in good faithby the relevant GP affiliate.
The total fair market value in the good faith opinion of the WPP Group of all restricted businesses engagedin by the WPP Group, other than those engaged in by the WPP Group at closing of our initial public offering,may not exceed $75 million. For purposes of this restriction, the fair market value of any entity engaging in arestricted business purchased by the WPP Group will be determined based on the fair market value of the entityas a whole, without regard for any lesser ownership interest to be acquired.
If the WPP Group desires to acquire a restricted business or an entity that engages in a restricted businesswith a fair market value in excess of $10 million and the restricted business constitutes greater than 50% of thevalue of the business to be acquired, then the WPP Group must first offer us the opportunity to purchase therestricted business. If the WPP Group desires to acquire a restricted business or an entity that engages in arestricted business with a value in excess of $10 million and the restricted business constitutes 50% or less of thevalue of the business to be acquired, then the GP affiliate may purchase the restricted business first and then offerus the opportunity to purchase the restricted business within six months of acquisition. For purposes of thisparagraph, “restricted business” excludes a general partner interest or managing member interest, which isaddressed in a separate restriction summarized below. For purposes of this paragraph only, “fair market value”means the fair market value as determined in good faith by the relevant GP affiliate.
If we want to purchase the restricted business and the GP affiliate and the general partner, with the approvalof the conflicts committee, agree on the fair market value and other terms of the offer within 60 days after thegeneral partner receives the offer from the GP affiliate, we will purchase the restricted business as soon ascommercially practicable. If the GP affiliate and the general partner, with the approval of the conflictscommittee, are unable to agree in good faith on the fair market value and other terms of the offer within 60 daysafter the general partner receives the offer, then the GP affiliate may sell the restricted business to a third partywithin two years for no less than the purchase price and on terms no less favorable to the GP affiliate than lastoffered by us. During this two-year period, the GP affiliate may operate the restricted business in competitionwith us, subject to the restriction on total fair market value of restricted businesses owned in the case of the WPPGroup.
If, at the end of the two year period, the restricted business has not been sold to a third party and therestricted business retains a value, in the good faith opinion of the relevant GP affiliate, in excess of $10 million,then the GP affiliate must reoffer the restricted business to the general partner. If the GP affiliate and the generalpartner, with the approval of the conflicts committee, agree on the fair market value and other terms of the offerwithin 60 days after the general partner receives the second offer from the GP affiliate, we will purchase therestricted business as soon as commercially practicable. If the GP Affiliate and the general partner, with theconcurrence of the conflicts committee, again fail to agree after negotiation in good faith on the fair market valueof the restricted business, then the GP affiliate will be under no further obligation to us with respect to therestricted business, subject to the restriction on total fair market value of restricted businesses owned.
In addition, if during the two-year period described above, a change occurs in the restricted business that, inthe good faith opinion of the GP affiliate, affects the fair market value of the restricted business by more than 10percent and the fair market value of the restricted business remains, in the good faith opinion of the relevant GPaffiliate, in excess of $10 million, the GP affiliate will be obligated to reoffer the restricted business to thegeneral partner at the new fair market value, and the offer procedures described above will recommence.
130

If the restricted business to be acquired is in the form of a general partner interest in a publicly heldpartnership or a managing member interest in a publicly held limited liability company, the WPP Group may notacquire such restricted business even if we decline to purchase the restricted business. If the restricted business tobe acquired is in the form of a general partner interest in a non-publicly held partnership or a managing memberof a non-publicly held limited liability company, the WPP Group may acquire such restricted business subject tothe restriction on total fair market value of restricted businesses owned and the offer procedures described above.
The omnibus agreement may be amended at any time by the general partner, with the concurrence of theconflicts committee. The respective obligations of the WPP Group under the omnibus agreement terminate whenthe WPP Group and its affiliates cease to participate in the control of the general partner.
Restricted Business Contribution Agreement
In connection with our partnership with Christopher Cline and his affiliates, Mr. Cline, Foresight ReservesLP and Adena (collectively, the “Cline Parties”) and NRP have executed a Restricted Business ContributionAgreement. Pursuant to the terms of the Restricted Business Contribution Agreement, the Cline Parties and theiraffiliates are obligated to offer to NRP any business owned, operated or invested in by the Cline Parties, subjectto certain exceptions, that either (a) owns, leases or invests in hard minerals or (b) owns, operates, leases orinvests in transportation infrastructure relating to future mine developments by the Cline Parties in Illinois. Inaddition, we created an area of mutual interest (the “AMI”) around certain of the properties that we haveacquired from Cline affiliates. During the applicable term of the Restricted Business Contribution Agreement, theCline Parties will be obligated to contribute any coal reserves held or acquired by the Cline Parties or theiraffiliates within the AMI to us. In connection with the offer of mineral properties by the Cline Parties to NRP, theparties to the Restricted Business Contribution Agreement will negotiate and agree upon an area of mutualinterest around such minerals, which will supplement and become a part of the AMI.
We have made several acquisitions from Cline affiliates pursuant to the Restricted Business ContributionAgreement. For a summary of recent acquisitions and revenues that we have derived from the Cline relationship,see “Item 7. Management’s Discussion and Analysis of Financial Condition and Results of Operations—Significant Acquisitions” and “—Transactions with Cline Affiliates.”
Mr. Holcomb, who was appointed to the Board in October 2013, previously served as Chief FinancialOfficer for Foresight Reserves LP and its subsidiaries. Mr. Holcomb owned a less than 1% equity interest incertain Cline affiliates until March 2013 when he fully divested from all Cline affiliates. As a result of hisposition as an executive officer and an equity holder of certain Cline affiliates, Mr. Holcomb may be deemed tohave had an indirect material interest in the transactions with the Cline affiliates described in this Annual Reporton Form 10-K.
Mr. Holcomb is a manager of Cline Trust Company, LLC, which owns approximately 5.35 million of ourcommon units and $20 million in principal amount of our 9.125% Senior Notes due 2018. The members of theCline Trust Company are four trusts for the benefit of the children of Christopher Cline, each of which owns anapproximately equal membership interest in the Cline Trust Company. Mr. Holcomb also serves as trustee ofeach of the four trusts.
Investor Rights Agreement
NRP and certain affiliates and Adena executed an Investor Rights Agreement pursuant to which Adena wasgranted certain management rights. Specifically, Adena has the right to name two directors (one of which mustbe independent) to the Board of Directors of our managing general partner so long as Adena beneficially ownseither 5% of our limited partnership interest or 5% of our general partner’s limited partnership interest and solong as certain rights under our managing general partner’s LLC Agreement have not been exercised by Adena orMr. Robertson. Leo A. Vecellio and Donald R. Holcomb currently serve as Adena’s two directors. Mr. Vecellioserves on our CNG Committee. Adena will also have the right, pursuant to the terms of the Investor RightsAgreement, to withhold its consent to the sale or other disposition of any entity or assets contributed by Clineaffiliates to NRP, and any such sale or disposition will be void without Adena’s consent.
131

Quintana Capital Group GP, Ltd.
Corbin J. Robertson, Jr. is a principal in Quintana Capital Group GP, Ltd., which controls several privateequity funds focused on investments in the energy business. NRP’s Board of Directors has adopted a formalconflicts policy that establishes the opportunities that will be pursued by NRP and those that will be pursued byQuintana Capital. The basic tenets of the policy are set forth below.
NRP’s business strategy has historically focused on:
• The ownership of natural resource properties in North America, including, but not limited to coal,aggregates and industrial minerals, and oil and gas. NRP leases these properties to mining or operatingcompanies that mine or produce the resources and pay NRP a royalty.
• The ownership and operation of transportation, storage and related logistics activities related to extractedhard minerals.
The businesses and investments described in this paragraph are referred to as the “NRP Businesses.”
NRP’s acquisition strategy also includes:
• The ownership of non-operating working interests in oil and gas properties.
• The ownership of non-controlling equity interests in companies involved in natural resource developmentand extraction.
• The operation of construction aggregates mining and production businesses.
The businesses and investments described in this paragraph are referred to as the “Shared Businesses.”
NRP’s business strategy does not, and is not expected to, include:
• The ownership of equity interests in companies involved in the mining or extraction of coal.
• Investments that do not generate “qualifying income” for a publicly traded partnership under U.S. taxregulations.
• Investments outside of North America.
• Midstream or refining businesses that do not involve hard extracted minerals, including the gathering,processing, fractionation, refining, storage or transportation of oil, natural gas or natural gas liquids.
In addition, although NRP’s current oil and gas strategy is focused on the acquisition of minerals, royaltiesand non-operated working interests, NRP may also consider the acquisition of operated interests. The businessesand investments described in this paragraph are referred to as the “Non-NRP Businesses.”
It is acknowledged that neither Quintana Capital nor Mr. Robertson will have any obligation to offerinvestments relating to Non-NRP Businesses to NRP, and that NRP will not have any obligation to refrain frompursuing a Non-NRP Business if there is a change in its business strategy.
For so long as Corbin Robertson, Jr. remains both an affiliate of Quintana Capital and an executive officeror director of NRP or an affiliate of its general partner, before making an investment in an NRP Business,Quintana Capital has agreed to adhere to the following procedures:
• Quintana Capital will first offer such opportunity in its entirety to NRP. NRP may elect to pursue suchinvestment wholly for its own account, to pursue the opportunity jointly with Quintana Capital or not topursue such opportunity.
• If NRP elects not to pursue an NRP Business investment opportunity, Quintana Capital may pursue theinvestment for its own account on similar terms.
• NRP will undertake to advise Quintana Capital of its decision regarding a potential investmentopportunity within 10 business days of the identification of such opportunity to the Conflicts Committee.
132

If the opportunity relates to the acquisition of a Shared Business, NRP and Quintana Capital will adhere tothe following procedures:
• If the opportunity is generated by individuals other than Mr. Robertson, the opportunity will belong to theentity for which those individuals are working.
• If the opportunity is generated by Mr. Robertson and both NRP and Quintana Capital are interested inpursuing the opportunity, it is expected that the Conflicts Committee will work together with the relevantLimited Partner Advisory Committees for Quintana Capital to reach an equitable resolution of theconflict, which may involve investments by both parties.
In all cases above in which Mr. Robertson has a conflict of interest, investment decisions will be made onbehalf of NRP by the Conflicts Committee and on behalf of Quintana Capital Group by the relevant InvestmentCommittee, with Mr. Robertson abstaining.
A fund controlled by Quintana Capital owns an interest in Corsa Coal Corp, a coal mining company tradedon the TSX Venture Exchange that is one of our lessees in Tennessee. Corbin J. Robertson, III, one of ourdirectors, is Chairman of the Board of Corsa.
For more information on our relationship with Corsa Coal, see “Item 7. Management’s Discussion andAnalysis of Financial Condition and Results of Operations—Related Party Transactions—Quintana CapitalGroup GP, Ltd.”
Office Building in Huntington, West Virginia
We lease an office building in Huntington, West Virginia from Western Pocahontas Properties LimitedPartnership. The terms of the lease, including $0.6 million per year in lease payments, were approved by ourconflicts committee.
Conflicts of Interest
Conflicts of interest exist and may arise in the future as a result of the relationships between our generalpartner and its affiliates (including the WPP Group, the Cline entities, and their affiliates) on the one hand, andour partnership and our limited partners, on the other hand. The directors and officers of GP Natural ResourcePartners LLC have duties to manage GP Natural Resource Partners LLC and our general partner in a mannerbeneficial to its owners. At the same time, our general partner has a duty to manage our partnership in a mannerbeneficial to us and our unitholders. The Delaware Revised Uniform Limited Partnership Act, which we refer toas the Delaware Act, provides that Delaware limited partnerships may, in their partnership agreements, expand,restrict or eliminate the fiduciary duties otherwise owed by a general partner to limited partners and thepartnership. Pursuant to these provisions, our partnership agreement contains various provisions modifying thefiduciary duties that would otherwise be owed by our general partner with contractual standards governing theduties of the general partner and the methods of resolving conflicts of interest. Our partnership agreement alsospecifically defines the remedies available to limited partners for actions taken that, without these definedliability standards, might constitute breaches of fiduciary duty under applicable Delaware law.
Whenever a conflict arises between our general partner or its affiliates, on the one hand, and our partnershipor any other partner, on the other, our general partner will resolve that conflict. Our general partner may, but isnot required to, seek the approval of the conflicts committee of the Board of Directors of our general partner ofsuch resolution. The partnership agreement contains provisions that allow our general partner to take into accountthe interests of other parties in addition to our interests when resolving conflicts of interest.
Our general partner will not be in breach of its obligations under the partnership agreement or its duties tous or our unitholders if the resolution of the conflict is considered to be fair and reasonable to us. Any resolutionis considered to be fair and reasonable to us if that resolution is:
• approved by the conflicts committee, although our general partner is not obligated to seek such approvaland our general partner may adopt a resolution or course of action that has not received approval;
133

• on terms no less favorable to us than those generally being provided to or available from unrelated thirdparties; or
• fair to us, taking into account the totality of the relationships between the parties involved, including othertransactions that may be particularly favorable or advantageous to us.
In resolving a conflict, our general partner, including its conflicts committee, may, unless the resolution isspecifically provided for in the partnership agreement, consider:
• the relative interests of any party to such conflict and the benefits and burdens relating to such interest;
• any customary or accepted industry practices or historical dealings with a particular person or entity;
• generally accepted accounting practices or principles; and
• such additional factors it determines in its sole discretion to be relevant, reasonable or appropriate underthe circumstances.
Conflicts of interest could arise in the situations described below, among others.
Actions taken by our general partner may affect the amount of cash available for distribution tounitholders.
The amount of cash that is available for distribution to unitholders is affected by decisions of our generalpartner regarding such matters as:
• amount and timing of asset purchases and sales;
• cash expenditures;
• borrowings;
• the issuance of additional common units; and
• the creation, reduction or increase of reserves in any quarter.
In addition, borrowings by us and our affiliates do not constitute a breach of any duty owed by our generalpartner to the unitholders, including borrowings that have the purpose or effect of enabling our general partner toreceive distributions.
For example, in the event we have not generated sufficient cash from our operations to pay the quarterlydistribution on our common units, our partnership agreement permits us to borrow funds which may enable us tomake this distribution on all outstanding common units.
The partnership agreement provides that we and our subsidiaries may borrow funds from our general partnerand its affiliates. Our general partner and its affiliates may not borrow funds from us or our subsidiaries.
We do not have any officers or employees and rely solely on officers and employees of GP Natural ResourcePartners LLC and its affiliates.
We do not have any officers or employees and rely solely on officers and employees of GP NaturalResource Partners LLC and its affiliates. Affiliates of GP Natural Resource Partners LLC conduct businesses andactivities of their own in which we have no economic interest. If these separate activities are significantly greaterthan our activities, there could be material competition for the time and effort of the officers and employees whoprovide services to our general partner. The officers of GP Natural Resource Partners LLC are not required towork full time on our affairs. These officers devote significant time to the affairs of the WPP Group or itsaffiliates and are compensated by these affiliates for the services rendered to them.
134

We reimburse our general partner and its affiliates for expenses.
We reimburse our general partner and its affiliates for costs incurred in managing and operating us,including costs incurred in rendering corporate staff and support services to us. The partnership agreementprovides that our general partner determines the expenses that are allocable to us in any reasonable mannerdetermined by our general partner in its sole discretion.
Our general partner intends to limit its liability regarding our obligations.
Our general partner intends to limit its liability under contractual arrangements so that the other party hasrecourse only to our assets, and not against our general partner or its assets. The partnership agreement providesthat any action taken by our general partner to limit its liability or our liability is not a breach of our generalpartner’s fiduciary duties, even if we could have obtained more favorable terms without the limitation onliability.
Common unitholders have no right to enforce obligations of our general partner and its affiliates underagreements with us.
Any agreements between us on the one hand, and our general partner and its affiliates, on the other, do notgrant to the unitholders, separate and apart from us, the right to enforce the obligations of our general partner andits affiliates in our favor.
Contracts between us, on the one hand, and our general partner and its affiliates, on the other, are not theresult of arm’s-length negotiations.
The partnership agreement allows our general partner to pay itself or its affiliates for any services renderedto us, provided these services are rendered on terms that are fair and reasonable. Our general partner may alsoenter into additional contractual arrangements with any of its affiliates on our behalf. Neither the partnershipagreement nor any of the other agreements, contracts and arrangements between us, on the one hand, and ourgeneral partner and its affiliates, on the other, are the result of arm’s-length negotiations.
All of these transactions entered into after our initial public offerings are on terms that are fair andreasonable to us.
Our general partner and its affiliates have no obligation to permit us to use any facilities or assets of ourgeneral partner and its affiliates, except as may be provided in contracts entered into specifically dealing withthat use. There is no obligation of our general partner or its affiliates to enter into any contracts of this kind.
We may not choose to retain separate counsel for ourselves or for the holders of common units.
The attorneys, independent auditors and others who have performed services for us in the past were retainedby our general partner, its affiliates and us and have continued to be retained by our general partner, its affiliatesand us. Attorneys, independent auditors and others who perform services for us are selected by our generalpartner or the conflicts committee and may also perform services for our general partner and its affiliates. Wemay retain separate counsel for ourselves or the holders of common units in the event of a conflict of interestarising between our general partner and its affiliates, on the one hand, and us or the holders of common units, onthe other, depending on the nature of the conflict. We do not intend to do so in most cases. Delaware case law hasnot definitively established the limits on the ability of a partnership agreement to restrict such fiduciary duties.
Our general partner’s affiliates may compete with us.
The partnership agreement provides that our general partner is restricted from engaging in any businessactivities other than those incidental to its ownership of interests in us. Except as provided in our partnershipagreement, the Omnibus Agreement and the Restricted Business Contribution Agreement, affiliates of ourgeneral partner will not be prohibited from engaging in activities in which they compete directly with us.
The Conflicts Committee Charter is available on our website at www.nrplp.com and is available in printupon request.
135

Director Independence
For a discussion of the independence of the members of the Board of Directors of our managing generalpartner under applicable standards, see “Item 10. Directors and Executive Officers of the Managing GeneralPartner and Corporate Governance—Corporate Governance—Independence of Directors,” which is incorporatedby reference into this Item 13.
Review, Approval or Ratification of Transactions with Related Persons
If a conflict or potential conflict of interest arises between our general partner and its affiliates (includingthe WPP Group, the Cline entities, and their affiliates) on the one hand, and our partnership and our limitedpartners, on the other hand, the resolution of any such conflict or potential conflict is addressed as describedunder “—Conflicts of Interest.”
Pursuant to our Code of Business Conduct and Ethics, conflicts of interest are prohibited as a matter ofpolicy, except under guidelines approved by the Board and as provided in the Omnibus Agreement, theRestricted Business Contribution Agreement, and our partnership agreement. For the year ended December 31,2014, there were no transactions where such guidelines were not followed.
Item 14. Principal Accountant Fees and Services
The Audit Committee of the Board of Directors of GP Natural Resource Partners LLC recommended andwe engaged Ernst & Young LLP to audit our accounts and assist with tax work for fiscal 2014 and 2013. All ofour audit, audit-related fees and tax services have been approved by the Audit Committee of our Board ofDirectors. The following table presents fees for professional services rendered by Ernst &Young LLP:
2014 2013
Audit Fees(1) . . . . . . . . . . . . . . . . . . . . . . . . . . . . . . . . . . . . . . . . . . . . . . . . . $1,056,542 $753,502
Audit-Related Fees . . . . . . . . . . . . . . . . . . . . . . . . . . . . . . . . . . . . . . . . . . . . . — —
Tax Fees(2) . . . . . . . . . . . . . . . . . . . . . . . . . . . . . . . . . . . . . . . . . . . . . . . . . . . 738,626 654,776
All Other Fees(3) . . . . . . . . . . . . . . . . . . . . . . . . . . . . . . . . . . . . . . . . . . . . . . 1,910 1,995
(1) Audit fees include fees associated with the annual integrated audit of our consolidated financial statementsand internal controls over financial reporting, separate audits of subsidiaries and reviews of our quarterlyfinancial statement for inclusion in our Form 10-Q and comfort letters; consents; work related toacquisitions; assistance with and review of documents filed with the SEC.
(2) Tax fees include fees principally incurred for assistance with tax planning, compliance, tax returnpreparation and filing of Schedules K-1.
(3) All other fees include the subscription to EY Online research tool.
Audit and Non-Audit Services Pre-Approval Policy
I. Statement of Principles
Under the Sarbanes-Oxley Act of 2002 (the “Act”), the Audit Committee of the Board of Directors isresponsible for the appointment, compensation and oversight of the work of the independent auditor. As part ofthis responsibility, the Audit Committee is required to pre-approve the audit and non-audit services performed bythe independent auditor in order to assure that they do not impair the auditor’s independence from thePartnership. To implement these provisions of the Act, the SEC has issued rules specifying the types of servicesthat an independent auditor may not provide to its audit client, as well as the audit committee’s administration ofthe engagement of the independent auditor. Accordingly, the Audit Committee has adopted, and the Board ofDirectors has ratified, this Audit and Non-Audit Services Pre-Approval Policy (the “Policy”), which sets forth theprocedures and the conditions pursuant to which services proposed to be performed by the independent auditormay be pre-approved.
136

The SEC’s rules establish two different approaches to pre-approving services, which the SEC considers tobe equally valid. Proposed services may either be pre-approved without consideration of specific case-by-caseservices by the Audit Committee (“general pre-approval”) or require the specific pre-approval of the AuditCommittee (“specific pre-approval”). The Audit Committee believes that the combination of these twoapproaches in this Policy will result in an effective and efficient procedure to pre-approve services performed bythe independent auditor. As set forth in this Policy, unless a type of service has received general pre-approval, itwill require specific pre-approval by the Audit Committee if it is to be provided by the independent auditor. Anyproposed services exceeding pre-approved cost levels or budgeted amounts will also require specific pre-approval by the Audit Committee.
For both types of pre-approval, the Audit Committee will consider whether such services are consistent withthe SEC’s rules on auditor independence. The Audit Committee will also consider whether the independentauditor is best positioned to provide the most effective and efficient service for reasons such as its familiaritywith our business, employees, culture, accounting systems, risk profile and other factors, and whether the servicemight enhance the Partnership’s ability to manage or control risk or improve audit quality. All such factors willbe considered as a whole, and no one factor will necessarily be determinative.
The Audit Committee is also mindful of the relationship between fees for audit and non-audit services indeciding whether to pre-approve any such services and may determine, for each fiscal year, the appropriate ratiobetween the total amount of fees for audit, audit-related and tax services.
The appendices to this Policy describe the audit, audit-related and tax services that have the general pre-approval of the Audit Committee. The term of any general pre-approval is 12 months from the date of pre-approval, unless the Audit Committee considers a different period and states otherwise. The Audit Committeewill annually review and pre-approve the services that may be provided by the independent auditor withoutobtaining specific pre-approval from the Audit Committee. The Audit Committee will add or subtract to the listof general pre-approved services from time to time, based on subsequent determinations.
The purpose of this Policy is to set forth the procedures by which the Audit Committee intends to fulfill itsresponsibilities. It does not delegate the Audit Committee’s responsibilities to pre-approve services performed bythe independent auditor to management.
Ernst & Young LLP, our independent auditor has reviewed this Policy and believes that implementation ofthe policy will not adversely affect its independence.
II. Delegation
As provided in the Act and the SEC’s rules, the Audit Committee has delegated either type of pre-approvalauthority to Robert B. Karn III, the Chairman of the Audit Committee. Mr. Karn must report, for informationalpurposes only, any pre-approval decisions to the Audit Committee at its next scheduled meeting.
III. Audit Services
The annual Audit services engagement terms and fees will be subject to the specific pre-approval of theAudit Committee. Audit services include the annual financial statement audit (including required quarterlyreviews), subsidiary audits and other procedures required to be performed by the independent auditor to be ableto form an opinion on the Partnership’s consolidated financial statements. These other procedures includeinformation systems and procedural reviews and testing performed in order to understand and place reliance onthe systems of internal control, and consultations relating to the audit or quarterly review. Audit services alsoinclude the attestation engagement for the independent auditor’s report on management’s report on internalcontrols for financial reporting. The Audit Committee monitors the audit services engagement as necessary, butnot less than on a quarterly basis, and approves, if necessary, any changes in terms, conditions and fees resultingfrom changes in audit scope, partnership structure or other items.
In addition to the annual audit services engagement approved by the Audit Committee, the Audit Committeemay grant general pre-approval to other audit services, which are those services that only the independent auditor
137

reasonably can provide. Other audit services may include statutory audits or financial audits for our subsidiariesor our affiliates and services associated with SEC registration statements, periodic reports and other documentsfiled with the SEC or other documents issued in connection with securities offerings.
IV. Audit-related Services
Audit-related services are assurance and related services that are reasonably related to the performance ofthe audit or review of the Partnership’s financial statements or that are traditionally performed by theindependent auditor. Because the Audit Committee believes that the provision of audit-related services does notimpair the independence of the auditor and is consistent with the SEC’s rules on auditor independence, the AuditCommittee may grant general pre-approval to audit-related services. Audit-related services include, amongothers, due diligence services pertaining to potential business acquisitions/dispositions; accounting consultationsrelated to accounting, financial reporting or disclosure matters not classified as “Audit Services”; assistance withunderstanding and implementing new accounting and financial reporting guidance from rulemaking authorities;financial audits of employee benefit plans; agreed-upon or expanded audit procedures related to accounting and/or billing records required to respond to or comply with financial, accounting or regulatory reporting matters; andassistance with internal control reporting requirements.
V. Tax Services
The Audit Committee believes that the independent auditor can provide tax services to the Partnership suchas tax compliance, tax planning and tax advice without impairing the auditor’s independence, and the SEC hasstated that the independent auditor may provide such services. Hence, the Audit Committee believes it may grantgeneral pre-approval to those tax services that have historically been provided by the auditor, that the AuditCommittee has reviewed and believes would not impair the independence of the auditor and that are consistentwith the SEC’s rules on auditor independence. The Audit Committee will not permit the retention of theindependent auditor in connection with a transaction initially recommended by the independent auditor, the solebusiness purpose of which may be tax avoidance and the tax treatment of which may not be supported in theInternal Revenue Code and related regulations. The Audit Committee will consult with the Chief FinancialOfficer or outside counsel to determine that the tax planning and reporting positions are consistent with thisPolicy.
VI. Pre-Approval Fee Levels or Budgeted Amounts
Pre-approval fee levels or budgeted amounts for all services to be provided by the independent auditor willbe established annually by the Audit Committee. Any proposed services exceeding these levels or amounts willrequire specific pre-approval by the Audit Committee. The Audit Committee is mindful of the overallrelationship of fees for audit and non-audit services in determining whether to pre-approve any such services. Foreach fiscal year, the Audit Committee may determine the appropriate ratio between the total amount of fees foraudit, audit-related and tax services.
VII. Procedures
All requests or applications for services to be provided by the independent auditor that do not requirespecific approval by the Audit Committee will be submitted to the Chief Financial Officer and must include adetailed description of the services to be rendered. The Chief Financial Officer will determine whether suchservices are included within the list of services that have received the general pre-approval of the AuditCommittee. The Audit Committee will be informed on a timely basis of any such services rendered by theindependent auditor.
Requests or applications to provide services that require specific approval by the Audit Committee will besubmitted to the Audit Committee by both the independent auditor and the Chief Financial Officer, and mustinclude a joint statement as to whether, in their view, the request or application is consistent with the SEC’s ruleson auditor independence.
138

PART IV
Item 15. Exhibits and Financial Statement Schedules
(a)(1) and (2) Financial Statements and Schedules
See “Item 8. Financial Statements and Supplementary Data.”
(a)(3) OCI Wyoming LLC Financial Statements. The financial statements of OCI Wyoming LLCrequired pursuant to Rule 3-09 of Regulation S-X are included in this filing as Exhibit 99.3.
(a)(4) Exhibits
ExhibitNumber Description
2.1 — Purchase Agreement, dated as of January 23, 2013, by and among Anadarko Holding Company, BigIsland Trona Company, NRP Trona LLC and NRP (Operating) LLC (incorporated by reference toExhibit 2.1 to Current Report on Form 8-K filed on January 25, 2013).
2.2 — Agreement and Plan of Merger, dated as of August 18, 2014, by and among VantaCore Partners LP,VantaCore LLC, the Holders named therein, Natural Resource Partners L.P., NRP (Operating) LLCand Rubble Merger Sub, LLC (incorporated by reference to Exhibit 2.1 to Current Report on Form8-K filed on August 20, 2014).
2.3 — Interest Purchase Agreement, by and among NRP Oil and Gas LLC, Kaiser-Whiting, LLC and theOwners of Kaiser-Whiting, LLC dated as of October 5, 2014 (incorporated by reference to CurrentReport on Form 8-K filed on October 6, 2014).
3.1 — Fourth Amended and Restated Agreement of Limited Partnership of Natural Resource Partners L.P.,dated as of September 20, 2010 (incorporated by reference to Exhibit 3.1 to Current Report on Form8-K filed on September 21, 2010).
3.2 — Fifth Amended and Restated Agreement of Limited Partnership of NRP (GP) LP, dated as ofDecember 16, 2011 (incorporated by reference to Exhibit 3.1 to Current Report on Form 8-K filed onDecember 16, 2011).
3.3 — Fifth Amended and Restated Limited Liability Company Agreement of GP Natural ResourcePartners LLC, dated as of October 31, 2013 (incorporated by reference to Exhibit 3.1 to CurrentReport on Form 8-K filed on October 31, 2013).
3.4 — Amended and Restated Limited Liability Company Agreement of NRP (Operating) LLC, dated as ofOctober 17, 2002 (incorporated by reference to Exhibit 3.4 of Annual Report on Form 10-K for theyear ended December 31, 2002).
3.5 — Certificate of Limited Partnership of Natural Resource Partners L.P.(incorporated by reference toExhibit 3.1 to the Registration Statement on Form S-1 filed April 19, 2002, File No. 333-86582).
4.1 — Note Purchase Agreement dated as of June 19, 2003 among NRP (Operating) LLC and thePurchasers signatory thereto (incorporated by reference to Exhibit 4.1 to Current Report on Form 8-Kfiled June 23, 2003).
4.2 — First Amendment, dated as of July 19, 2005, to Note Purchase Agreement dated as of June 19, 2003among NRP (Operating) LLC and the purchasers signatory thereto (incorporated by reference toExhibit 4.2 to Current Report on Form 8-K filed on July 20, 2005).
4.3 — Second Amendment, dated as of March 28, 2007, to Note Purchase Agreement dated as of June 19,2003 among NRP (Operating) LLC and the purchasers signatory thereto (incorporated by referenceto Exhibit 4.2 to Current Report on Form 8-K filed on March 29, 2007).
139

ExhibitNumber Description
4.4 — First Supplement to Note Purchase Agreement, dated as of July 19, 2005 among NRP (Operating)LLC and the purchasers signatory thereto (incorporated by reference to Exhibit 4.1 to Current Reporton Form 8-K filed on July 20, 2005).
4.5 — Second Supplement to Note Purchase Agreement, dated as of March 28, 2007 among NRP(Operating) LLC and the purchasers signatory thereto (incorporated by reference to Exhibit 4.1 toCurrent Report on Form 8-K filed on March 29, 2007).
4.6 — Third Supplement to Note Purchase Agreement, dated as of March 25, 2009 among NRP (Operating)LLC and the purchasers signatory thereto (incorporated by reference to Exhibit 4.1 to Current Reporton Form 8-K filed on March 26, 2009).
4.7 — Fourth Supplement to Note Purchase Agreement, dated as of April 20, 2011 among NRP (Operating)LLC and the purchasers signatory thereto (incorporated by reference to Exhibit 4.1 to Current Reporton Form 8-K filed on April 21, 2011).
4.8 — Subsidiary Guarantee of Senior Notes of NRP (Operating) LLC, dated June 19, 2003 (incorporatedby reference to Exhibit 4.5 to Current Report on Form 8-K filed June 23, 2003).
4.9 — Form of Series A Note (incorporated by reference to Exhibit 4.2 to Current Report on Form 8-K filedJune 23, 2003).
4.10 — Form of Series B Note (incorporated by reference to Exhibit 4.3 to Current Report on Form 8-K filedJune 23, 2003).
4.11 — Form of Series C Note (incorporated by reference to Exhibit 4.4 to Current Report on Form 8-K filedJune 23, 2003).
4.12 — Form of Series D Note (incorporated by reference to Exhibit 4.12 to Annual Report on Form 10-Kfiled February 28, 2007).
4.13 — Form of Series E Note (incorporated by reference to Exhibit 4.3 to Current Report on Form 8-K filedMarch 29, 2007).
4.14 — Form of Series F Note (incorporated by reference to Exhibit 4.2 to Quarterly Report on Form 10-Qfiled May 7, 2009).
4.15 — Form of Series G Note (incorporated by reference to Exhibit 4.3 to Quarterly Report on Form 10-Qfiled May 7, 2009).
4.16 — Form of Series H Note (incorporated by reference to Exhibit 4.2 to Quarterly Report on Form 10-Qfiled May 5, 2011).
4.17 — Form of Series I Note (incorporated by reference to Exhibit 4.3 to Quarterly Report on Form 10-Qfiled May 5, 2011).
4.18 — Form of Series J Note (incorporated by reference to Exhibit 4.1 to Current Report on Form 8-K filedon June 15, 2011).
4.19 — Form of Series K Note (incorporated by reference to Exhibit 4.1 to Current Report on Form 8-K filedon October 3, 2011).
4.20 — Registration Rights Agreement, dated as of January 23, 2013, by and among Natural ResourcePartners L.P. and the Investors named therein (incorporated by reference to Exhibit 4.1 to CurrentReport on Form 8-K filed on January 25, 2013).
4.21 — Amendment No. 1 to Fourth Amended and Restated Agreement of Limited Partnership of NaturalResource Partners L.P., dated March 6, 2012 (incorporated by reference to Exhibit 4.1 to QuarterlyReport on Form 10-Q filed on August 7, 2012).
140

ExhibitNumber Description
4.22 — Indenture, dated September 18, 2013, by and among Natural Resource Partners L.P. and NRPFinance Corporation, as issuers, and Wells Fargo Bank, National Association, as trustee(incorporated by reference to Exhibit 4.1 to Current Report on Form 8-K filed on September 19,2013).
4.23 — Form of 9.125% Senior Notes due 2018 (contained in Exhibit 1 to Exhibit 4.22).
4.24 — 9.125% Senior Note due 2018 in $20,000,000 aggregate principal amount issued by NaturalResource Partners L.P. and NRP Finance Corporation to Cline Trust Company, LLC, datedOctober 17, 2014 (incorporated by reference to Exhibit 4.3 to Current Report on Form 8-K filed onOctober 20, 2014).
4.25 — Registration Rights Agreement, dated October 17, 2014, by and among Natural Resource PartnersL.P., NRP Finance Corporation and Wells Fargo Securities, LLC, as representative of the severalinitial purchasers (incorporated by reference to Exhibit 4.4 to Current Report on Form 8-K filed onOctober 20, 2014).
10.1 — Second Amended and Restated Credit Agreement, dated as of August 10, 2011 (incorporated byreference to Exhibit 10.1 to Current Report on Form 8-K filed on August 11, 2011).
10.2 — First Amendment to the Second Amended and Restated Credit Agreement, dated as of January 23,2013 (incorporated by reference to Exhibit 10.3 to Current Report on Form 8-K filed on January 25,2013).
10.3 — Second Amendment to the Second Amended and Restated Credit Agreement, dated as of June 7,2013 (incorporated by reference to Exhibit 10.1 to Current Report on Form 8-K filed on June 10,2013).
10.4 — Contribution Agreement, dated as of September 20, 2010, by and among Natural Resource PartnersL.P., NRP (GP) LP, Western Pocahontas Properties Limited Partnership, Great Northern PropertiesLimited Partnership, New Gauley Coal Corporation and NRP Investment L.P. (incorporated byreference to Exhibit 10.1 to Current Report on Form 8-K filed on September 21, 2010).
10.5+ — Natural Resource Partners Second Amended and Restated Long-Term Incentive Plan (incorporatedby reference to Exhibit 10.1 to Current Report on Form 8-K filed on January 17, 2008).
10.6+ — Form of Phantom Unit Agreement (incorporated by reference to Exhibit 10.4 to Annual Report onForm 10-K for the year ended December 31, 2007).
10.7+ — Natural Resource Partners Annual Incentive Plan (incorporated by reference to Exhibit 10.4 toAnnual Report on Form 10-K for the year ended December 31, 2002).
10.8 — First Amended and Restated Omnibus Agreement, dated as of April 22, 2009, by and among WesternPocahontas Properties Limited Partnership, Great Northern Properties Limited Partnership, NewGauley Coal Corporation, Robertson Coal Management LLC, GP Natural Resource Partners LLC,NRP (GP) LP, Natural Resource Partners L.P. and NRP (Operating) LLC (incorporated by referenceto Exhibit 10.1 to Quarterly Report on Form 10-Q filed May 7, 2009).
10.9 — Restricted Business Contribution Agreement, dated January 4, 2007, by and among ChristopherCline, Foresight Reserves LP, Adena Minerals, LLC, GP Natural Resource Partners LLC, NRP (GP)LP, Natural Resource Partners L.P. and NRP (Operating) LLC (incorporated by reference to Exhibit10.1 to Current Report on Form 8-K filed on January 4, 2007).
10.10 — Investor Rights Agreement, dated January 4, 2007, by and among NRP (GP) LP, GP NaturalResource Partners LLC, Robertson Coal Management and Adena Minerals, LLC (incorporated byreference to Exhibit 10.2 to Current Report on Form 8-K filed on January 4, 2007).
141

ExhibitNumber Description
10.11 — Waiver Agreement, dated November 12, 2009, by and among Natural Resource Partners L.P., GreatNorthern Properties Limited Partnership, Western Pocahontas Properties Limited Partnership, NewGauley Coal Corporation, Robertson Coal Management LLC, GP Natural Resource Partners LLC,NRP (GP) LP, and NRP (Operating) LLC (incorporated by reference to Exhibit 10.1 to CurrentReport on Form 8-K filed on November 13, 2009).
10.12 — Common Unit Purchase Agreement, dated January 23, 2013, by and among Natural ResourcePartners, L.P. and the purchasers named therein (incorporated by reference to Exhibit 10.1 to CurrentReport on Form 8-K filed on January 25, 2013).
10.13 — Term Loan Agreement, dated as of January 23, 2013, by and among Natural Resource Partners, L.P.,Citibank, N.A., as administrative agent, Citigroup Global Markets, Inc., Wells Fargo Securities, LLCand Compass Bank, as joint lead arrangers and joint bookrunners and Wells Fargo Bank, NationalAssociation and Compass Bank, as co-syndication agents (incorporated by reference to Exhibit 10.2to Current Report on Form 8-K filed on January 25, 2013).
10.14 — First Amendment to Term Loan Agreement, dated as of June 7, 2013 (incorporated by reference toExhibit 10.2 to Current Report on Form 8-K filed on June 10, 2013).
10.15 — Limited Liability Company Agreement of OCI Wyoming LLC, dated June 30, 2014 (incorporated byreference to Exhibit 10.1 to Current Report on Form 8-K filed by OCI Resources LP on July 2,2014).
10.16 — Credit Agreement, dated as of August 12, 2013, among NRP Oil and Gas LLC, Wells Fargo Bank,N.A., as Administrative Agent, and Wells Fargo Securities, LLC as Sole Bookrunner and Sole LeadArranger (incorporated by reference to Exhibit 10.1 to Current Report on Form 8-K filed onAugust 13, 2013).
10.17 — First Amendment to Credit Agreement, dated effective as of December 19, 2013, among NRP Oiland Gas LLC, Wells Fargo Bank, N.A., as Administrative Agent, and Wells Fargo Securities, LLC asSole Bookrunner and Sole Lead Arranger (incorporated by reference to Exhibit 10.1 to CurrentReport on Form 8-K filed on December 20, 2013).
10.18 Second Amendment to Credit Agreement entered into effective as of November 12, 2014 amongNRP Oil and Gas LLC, each of the Lenders that is a signatory thereto, and Wells Fargo Bank, N.A.,as administrative agent for the Lenders (incorporated by reference to Exhibit 10.1 to Current Reporton Form 8-K filed on November 14, 2014).
10.19 — Purchase Agreement dated October 9, 2014 by and among Natural Resource Partners L.P., NRPFinance Corporation and Wells Fargo Securities, LLC (as the representative of the several initialpurchasers) (incorporated by reference to Exhibit 10.1 to Current Report on Form 8-K filed onOctober 10, 2014).
10.20 — Equity Distribution Agreement dated November 12, 2013 by and among the Partnership, NRP (GP)LP, GP Natural Resource Partners LLC, and Citigroup Global Markets Inc. BB&T Capital Markets, adivision of BB&T Securities, LLC, UBS Securities LLC and Wells Fargo Securities, LLC, asManagers (incorporated by reference to Exhibit 1.1 to Current Report on Form 8-K filed onNovember 12, 2013).
10.21+ — Continued Employment and Separation Agreement dated effective as of September 1, 2014, by andamong Natural Resource Partners L.P., Western Pocahontas Properties Limited Partnership and NickCarter (incorporated by reference to Exhibit 10.3 filed on November 7, 2014).
21.1* — List of subsidiaries of Natural Resource Partners L.P.
23.1* — Consent of Ernst & Young LLP.
142

ExhibitNumber Description
23.2* — Consent of Deloitte & Touche LLP.
23.3* — Consent of Netherland, Sewell & Associates, Inc.
31.1* — Certification of Chief Executive Officer pursuant to Section 302 of Sarbanes-Oxley.
31.2* — Certification of Chief Financial Officer pursuant to Section 302 of Sarbanes-Oxley.
32.1* — Certification of Chief Executive Officer pursuant to 18 U.S.C. § 1350.
32.2* — Certification of Chief Financial Officer pursuant to 18 U.S.C. § 1350.
95.1* — Mine Safety Disclosure.
99.1 — Description of certain provisions of the Fourth Amended and Restated Agreement of LimitedPartnership of Natural Resource Partners L.P. (incorporated by reference to Exhibit 99.1 to CurrentReport on Form 8-K filed on September 21, 2010).
99.2* — Report of Netherland, Sewell & Associates, Inc.
99.3* — Financial Statements of OCI Wyoming LLC as of and for the years ended December 31, 2013 and2014.
101* — The following financial information from the Annual Report on Form 10-K of Natural ResourcePartners L.P. for the year ended December 31, 2014, formatted in XBRL (eXtensible BusinessReporting Language): (i) Consolidated Balance Sheets, (ii) Consolidated Statements ofComprehensive Income, (iii) Consolidated Statements of Cash Flows, and (iv) Notes to ConsolidatedFinancial Statements, tagged as blocks of text.
* Submitted herewith
** Management compensatory plan or arrangement
143

SIGNATURES
Pursuant to the requirements of Section 13 or 15(d) of the Securities Exchange Act of 1934, the registranthas duly caused this report to be signed on its behalf by the undersigned, thereunto duly authorized.
NATURAL RESOURCE PARTNERS L.P.By: NRP (GP) LP, its general partnerBy: GP NATURAL RESOURCE
PARTNERS LLC, its general partner
Date: February 27, 2015
By: /s/ CORBIN J. ROBERTSON, JR.
Corbin J. Robertson, Jr.Chairman of the Board and
Chief Executive Officer(Principal Executive Officer)
Date: February 27, 2015
By: /s/ CRAIG W. NUNEZ
Craig W. NunezChief Financial Officer and
Treasurer(Principal Financial Officer)
Date: February 27, 2015
By: /s/ KENNETH HUDSON
Kenneth HudsonController
(Principal Accounting Officer)
144

Pursuant to the requirements of the Securities Exchange Act of 1934, this report has been signed below bythe following persons on behalf of the registrant and in the capacities and on the dates indicated.
Date: February 27, 2015
/s/ ROBERT T. BLAKELY
Robert T. BlakelyDirector
Date: February 27, 2015
/s/ RUSSELL D. GORDY
Russell D. GordyDirector
Date: February 27, 2015
/s/ DONALD R. HOLCOMB
Donald R. HolcombDirector
Date: February 27, 2015
/s/ ROBERT B. KARN III
Robert B. Karn IIIDirector
Date: February 27, 2015
/s/ S. REED MORIAN
S. Reed MorianDirector
Date: February 27, 2015
/s/ RICHARD A. NAVARRE
Richard A. NavarreDirector
145

Date: February 27, 2015
/s/ CORBIN J. ROBERTSON III
Corbin J. Robertson IIIDirector
Date: February 27, 2015
/s/ STEPHEN P. SMITH
Stephen P. SmithDirector
Date: February 27, 2015
/s/ LEO A. VECELLIO, JR.
Leo A. Vecellio, Jr.Director
146

Exhibit 21.1
List of Subsidiaries of Natural Resource Partners L.P.
NRP (Operating) LLC NRP Oil and Gas LLC NRP Finance Corporation WPP LLC ACIN LLC WBRD LLC Hod LLC Shepard Boone Coal Company LLC Gatling Mineral, LLC Independence Land Company, LLC Williamson Transport, LLC Little River Transport, LLC Rivervista Mining, LLC Deepwater Transportation, LLC NRP Trona LLC VantaCore Partners LLC Laurel Aggregates Terminal Services of Delaware, LLC Laurel Aggregates of Delaware, LLC Laurel Aggregates of PA, LLC Utica Resources LLC Winn Materials, LLC Winn Materials of Kentucky, LLC Winn Marine, LLC McIntosh Construction Company, LLC McAsphalt. LLC Southern Aggregates, LLC BRP LLC (51% interest) CoVal Leasing Company, LLC (51% interest)
Exhibit 23.1
Consent of Independent Registered Public Accounting Firm
We consent to the incorporation by reference in the Registration Statements (Form S-3 No. 333-180907, Form S-3 No. 333-183314 and Form S-3 No. 333-187883) of Natural Resource Partners L.P. and in the related Prospectuses of our reports dated February 27, 2015, with respect to the consolidated financial statements of Natural Resource Partners L.P., and the effectiveness of internal control over financial reporting of Natural Resource Partners L.P., included in this Annual Report (Form 10-K) for the year ended December 31, 2014.
/s/ Ernst & Young LLP
Houston, TexasFebruary 27, 2015
Exhibit 23.2
CONSENT OF INDEPENDENT REGISTERED PUBLIC ACCOUNTING FIRM
We consent to the incorporation by reference in Registration Statements on Form S-3 (Nos. 333-180907, 333-183314, and 333-187883) of Natural Resource Partners L.P., of our report dated February 26, 2015, relating to the financial statements of OCI Wyoming LLC for the year ended December 31, 2014, appearing in the Annual Report on Form 10-K of Natural Resource Partners L.P. for the year ended December 31, 2014. /s/ DELOITTE & TOUCHE LLP
Atlanta, GeorgiaFebruary 26, 2015

Exhibit 23.3
CONSENT OF INDEPENDENT PETROLEUM ENGINEERS AND GEOLOGISTS
We hereby consent to the use by Natural Resource Partners L.P. (the “Company”) of our name and to the inclusion of information taken from our report dated January 21, 2015 included in the Company’s Annual Report on Form 10-K for the year ended December 31, 2014, filed with the U.S. Securities and Exchange Commission on or about February 27, 2015, as well as to the incorporation by reference thereof into the Company’s Registration Statements on Form S-3 (Nos. 333-180907, 333-183314 and 333-187883).
NETHERLAND, SEWELL & ASSOCIATES, INC.
By: /s/ Danny D. Simmons Danny D. Simmons, P.E.President and Chief Operating Officer
Houston, TexasFebruary 27, 2015

Exhibit 31.1
CERTIFICATION OF PRINCIPAL EXECUTIVE OFFICER
I, Corbin J. Robertson, Jr., certify that:
Date: February 27, 2015
1) I have reviewed this report on Form 10-K of Natural Resource Partners L.P.
2) Based on my knowledge, this report does not contain any untrue statement of a material fact or omit to state a material fact
necessary to make the statements made, in light of the circumstances under which such statements were made, not misleading with respect to the period covered by this report;
3) Based on my knowledge, the financial statements, and other financial information included in this report, fairly present in
all material respects the financial condition, results of operations and cash flows of the registrant as of, and for, the periods presented in this report;
4) The registrant’s other certifying officer and I are responsible for establishing and maintaining disclosure controls and
procedures (as defined in Exchange Act Rules 13a-15(e) and 15d-15(e)) and internal control over financial reporting (as defined in Exchange Act Rules 13a-15(f) and 15d-15(f)) for the registrant and have:
a. Designed such disclosure controls and procedures, or caused such disclosure controls and procedures to be designed under our supervision, to ensure that material information relating to the registrant, including its consolidated subsidiaries, is made known to us by others within those entities, particularly during the period in which this report is being prepared;
b. Designed such internal control over financial reporting, or caused such internal control over financial reporting to be designed under our supervision, to provide reasonable assurance regarding the reliability of financial reporting and the preparation of financial statements for external purposes in accordance with generally accepted accounting principles;
c. Evaluated the effectiveness of the registrant’s disclosure controls and procedures and presented in this report
our conclusions about the effectiveness of the disclosure controls and procedures, as of the end of the period covered by this report based on such evaluation; and
d. Disclosed in this report any change in the registrant’s internal control over financial reporting that occurred during the registrant’s most recent fiscal quarter (the registrant’s fourth fiscal quarter in the case of an annual report) that has materially affected, or is reasonably likely to materially affect, the registrant’s internal control over financial reporting; and
5) The registrant’s other certifying officer and I have disclosed, based on our most recent evaluation of internal control over
financial reporting, to the registrant’s auditors and the audit committee of the registrant’s board of directors (or persons performing the equivalent functions);
a. All significant deficiencies and material weaknesses in the design or operation of internal control over financial
reporting which are reasonably likely to adversely affect the registrant’s ability to record, process, summarize and report financial information; and
b. Any fraud, whether or not material, that involves management or other employees who have a significant role in the registrant’s internal control over financial reporting.
By:
/s/ Corbin J. Robertson, Jr. Corbin J. Robertson, Jr.Chief Executive Officer

Exhibit 31.2
CERTIFICATION OF PRINCIPAL FINANCIAL OFFICER
I, Craig W. Nunez, certify that:
Date: February 27, 2015
1) I have reviewed this report on Form 10-K of Natural Resource Partners L.P.
2) Based on my knowledge, this report does not contain any untrue statement of a material fact or omit to state a material fact
necessary to make the statements made, in light of the circumstances under which such statements were made, not misleading with respect to the period covered by this report;
3) Based on my knowledge, the financial statements, and other financial information included in this report, fairly present in
all material respects the financial condition, results of operations and cash flows of the registrant as of, and for, the periods presented in this report;
4) The registrant’s other certifying officer and I are responsible for establishing and maintaining disclosure controls and
procedures (as defined in Exchange Act Rules 13a-15(e) and 15d-15(e)) and internal control over financial reporting (as defined in Exchange Act Rules 13a-15(f) and 15d-15(f)) for the registrant and have:
a. Designed such disclosure controls and procedures, or caused such disclosure controls and procedures to be designed under our supervision, to ensure that material information relating to the registrant, including its consolidated subsidiaries, is made known to us by others within those entities, particularly during the period in which this report is being prepared;
b. Designed such internal control over financial reporting, or caused such internal control over financial reporting to be designed under our supervision, to provide reasonable assurance regarding the reliability of financial reporting and the preparation of financial statements for external purposes in accordance with generally accepted accounting principles;
c. Evaluated the effectiveness of the registrant’s disclosure controls and procedures and presented in this report
our conclusions about the effectiveness of the disclosure controls and procedures, as of the end of the period covered by this report based on such evaluation; and
d. Disclosed in this report any change in the registrant’s internal control over financial reporting that occurred during the registrant’s most recent fiscal quarter (the registrant’s fourth fiscal quarter in the case of an annual report) that has materially affected, or is reasonably likely to materially affect, the registrant’s internal control over financial reporting; and
5) The registrant’s other certifying officer and I have disclosed, based on our most recent evaluation of internal control over
financial reporting, to the registrant’s auditors and the audit committee of the registrant’s board of directors (or persons performing the equivalent functions);
a. All significant deficiencies and material weaknesses in the design or operation of internal control over financial
reporting which are reasonably likely to adversely affect the registrant’s ability to record, process, summarize and report financial information; and
b. Any fraud, whether or not material, that involves management or other employees who have a significant role in the registrant’s internal control over financial reporting.
By:
/s/ Craig W. Nunez Craig W. NunezChief Financial Officer and Treasurer

Exhibit 32.1
CERTIFICATION OF CHIEF EXECUTIVE OFFICER
OF GP NATURAL RESOURCE PARTNERS LLC PURSUANT TO 18 U.S.C. § 1350
In connection with the accompanying report on Form 10-K for the year ended December 31, 2014 filed with the Securities and Exchange Commission on the date hereof (the “Report”), I, Corbin J. Robertson, Jr., Chief Executive Officer and Chairman of the Board of GP Natural Resource Partners LLC, the general partner of the general partner of Natural Resource Partners L.P. (the “Company”), hereby certify, to my knowledge, that:
1. The Report fully complies with the requirements of Section 13(a) or 15(d) of the Securities Exchange Act of 1934; and
2. The information contained in the Report fairly presents, in all material respects, the financial condition and results of operations of the Company.
/s/ Corbin J. Robertson, Jr. Name: Corbin J. Robertson, Jr.Date: February 27, 2015

Exhibit 32.2
CERTIFICATION OF CHIEF FINANCIAL OFFICER
OF GP NATURAL RESOURCE PARTNERS LLC PURSUANT TO 18 U.S.C. § 1350
In connection with the accompanying report on Form 10-K for the year ended December 31, 2014 filed with the Securities and Exchange Commission on the date hereof (the “Report”), I, Craig W. Nunez, Chief Financial Officer and Treasurer of GP Natural Resource Partners LLC, the general partner of the general partner of Natural Resource Partners L.P. (the “Company”), hereby certify, to my knowledge, that:
3. The Report fully complies with the requirements of Section 13(a) or 15(d) of the Securities Exchange Act of 1934; and
4. The information contained in the Report fairly presents, in all material respects, the financial condition and results of operations of the Company.
/s/ Craig W. NunezName: Craig W. NunezDate: February 27, 2015

Exhibit 95.1
MINE SAFETY DISCLOSURE
Our mining operations are subject to regulation by the Federal Mine Safety and Health Administration (“MSHA”) under the Federal Mine Safety and Health Act of 1977 (the “Mine Act”). We have disclosed below information regarding certain citations and orders issued by MSHA and related assessments and legal actions with respect to these mining operations. In evaluating the below information regarding mine safety and health, investors should take into account factors such as: (i) the number of citations and orders will vary depending on the size of a mine, (ii) the number of citations issued will vary from inspector to inspector and mine to mine, and (iii) citations and orders can be contested and appealed, and in that process are often reduced in severity and amount, and are sometimes dismissed or vacated. The tables below do not include any orders or citations issued to independent contractors at our mines.
Section 1503 of the Dodd-Frank Wall Street Reform and Consumer Protection Act (the “Dodd-Frank Act”) requires issuers to include in periodic reports filed with the Securities and Exchange Commission (“SEC”) certain information relating to citations and orders for violations of standards under the Mine Act. The following tables disclose information required under the Dodd-Frank Act for the year ended December 31, 2014.
Mine Name / MSHA Identification Number
Section 104 S&S
Citations(1)
Section104(b)
Orders (2)
Section104(d)
Citations andOrders (3)
Section110(b)(2)
Violations (4)
Section 107(a)
Orders (5)
Total DollarValue of MSHA
Assessments Proposed (6)
Winn Materials, LLC/40-03094 2 0 0 0 0 $ 3,407(7)
Laurel Aggregates of Delaware, LLC/36-08891 5 0 0 0 0 $ 1,489(8)
Southern Aggregates, LLC-Plant 11/16-01537 1 0 0 0 0 $ 150
Southern Aggregates, LLC-Plant 1/16-01388 2 0 0 0 0 $ 617
Southern Aggregates, LLC-Plant 7/16-01519 4 0 0 0 0 $ 1,143
Southern Aggregates, LLC-Plant 6/16-00336 1 0 0 0 0 $ 524
Southern Aggregates, LLC-Plant 9/16-01536 1 0 0 0 0 $ 634
Southern Aggregates, LLC-Plant 12/16-01546 0 0 0 0 0 $ 0
(1) Mine Act section 104 S&S citations shown above are for alleged violations of mandatory health or safety standards that could significantly and substantially contribute to a mine health and safety hazard. It should be noted that, for purposes of this table, S&S citations that are included in another column, such as Section 104(d) citations, are not also included as Section 104 S&S citations in this column.
(2) Mine Act section 104(b) orders are for alleged failures to totally abate a citation within the time period specified in the citation. (3) Mine Act section 104(d) citations and orders are for an alleged unwarrantable failure (i.e., aggravated conduct constituting more
than ordinary negligence) to comply with mandatory health or safety standards. (4) Mine Act section 110(b)(2) violations are for an alleged “flagrant” failure (i.e., reckless or repeated) to make reasonable efforts
to eliminate a known violation of a mandatory safety or health standard that substantially and proximately caused, or reasonably could have been expected to cause, death or serious bodily injury.
(5) Mine Act section 107(a) orders are for alleged conditions or practices which could reasonably be expected to cause death or serious physical harm before such condition or practice can be abated and result in orders of immediate withdrawal from the area of the mine affected by the condition.
(6) Amounts shown include assessments proposed by MSHA during the twelve months ended December 31, 2014 on all citations and orders, including those citations and orders that are not required to be included within the above chart.
(7) Excludes penalties for three non-S&S citations issued in 2014 that were not assessed until 2015. (8) Excludes penalties for eight citations (two of which were S&S) issued in 2014 that were not assessed until 2015.

The number of legal actions pending before the Federal Mine Safety and Health Review Commission as of December 31, 2014 that fall into each of the following categories is as follows:
Mine Name / MSHA Identification Number
Total Number of Mining Related
Fatalities
Received Noticeof Pattern of
Violations UnderSection 104(e)
(yes/no) (9)
Legal ActionsPending as ofLast Day of
Period
Legal Actions Initiated During
Period
Legal ActionsResolved During
Period
Winn Materials, LLC/40-03094 0 0 6 6 3
Laurel Aggregates of Delaware, LLC/36-08891 0 0 1 1 0
Southern Aggregates, LLC-Plant 11/16-01537 0 0 1 1 0
Southern Aggregates, LLC-Plant 1/16-01388 0 0 2 2 0
Southern Aggregates, LLC-Plant 7/16-01519 0 0 1 1 0
Southern Aggregates, LLC-Plant 6/16-00336 0 0 0 0 0
Southern Aggregates, LLC-Plant 9/16-01536 0 0 0 0 0
Southern Aggregates, LLC-Plant 12/16-01546 0 0 0 0 0
(9) Mine Act section 104(e) written notices are for an alleged pattern of violations of mandatory health or safety standards that could significantly and substantially contribute to a mine safety or health hazard.
Mine Name / MSHA Identification Number
Contests of
Citations and
Orders
Contestsof
ProposedPenalties
Complaintsfor
Compensation
Complaints ofDischarge/
Discrimination/ Interference
Applications for
Temporary Relief
Appeals ofJudges Rulings
Winn Materials, LLC/40-03094 4 2 0 0 0 0 Laurel Aggregates of Delaware,
LLC/36-08891 1 0 0 0 0 0 Southern Aggregates, LLC-Plant
11/16-01537 0 1 0 0 0 0 Southern Aggregates, LLC-Plant
1/16-01388 0 2 0 0 0 0 Southern Aggregates, LLC-Plant
7/16-01519 0 1 0 0 0 0 Southern Aggregates, LLC-Plant
6/16-00336 0 0 0 0 0 0 Southern Aggregates, LLC-Plant
9/16-01536 0 0 0 0 0 0 Southern Aggregates, LLC-Plant
12/16-01546 0 0 0 0 0 0

Exhibit 99.2
January 21, 2015
Mr. Tim Chung Natural Resource Partners L.P. 601 Jefferson Street, Suite 3600 Houston, Texas 77002
Dear Mr. Chung:
In accordance with your request, we have estimated the proved reserves and future revenue, as of December 31, 2014, to the Natural Resource Partners L.P. (NRP LP) interest in certain oil and gas properties located in the United States. We completed our evaluation on or about the date of this letter. It is our understanding that the proved reserves estimated in this report constitute all of the proved reserves owned by NRP LP. The estimates in this report have been prepared in accordance with the definitions and regulations of the U.S. Securities and Exchange Commission (SEC) and, with the exception of the exclusion of future income taxes, conform to the FASB Accounting Standards Codification Topic 932, Extractive Activities—Oil and Gas. Definitions are presented immediately following this letter. This report has been prepared for NRP LP’s use in filing with the SEC; in our opinion the assumptions, data, methods, and procedures used in the preparation of this report are appropriate for such purpose.
We estimate the net reserves and future net revenue to the NRP LP interest in these properties, as of December 31, 2014, to be:
Totals may not add because of rounding.
The oil volumes shown include crude oil and condensate. Oil and natural gas liquids (NGL) volumes are expressed in thousands of barrels (MBBL); a barrel is equivalent to 42 United States gallons. Gas volumes are expressed in millions of cubic feet (MMCF) at standard temperature and pressure bases.
The estimates shown in this report are for proved reserves. As requested, probable and possible reserves that exist for these properties have not been included. This report does not include any value that could be attributed to interests in undeveloped acreage beyond those tracts for which undeveloped reserves have been estimated. Reserves categorization conveys the relative degree of certainty; reserves subcategorization is based on development and production status. The estimates of reserves and future revenue included herein have not been adjusted for risk.
Gross revenue is NRP LP’s share of the gross (100 percent) revenue from the properties prior to any deductions. Future net revenue is after deductions for NRP LP’s share of production taxes, ad valorem taxes, capital costs, abandonment costs, and operating expenses but before consideration of any income taxes. The future net revenue has been discounted at an annual rate of 10 percent to determine its present worth, which is shown to indicate the effect of time on the value of money. Future net revenue presented in this report, whether discounted or undiscounted, should not be construed as being the fair market value of the properties.
Net Reserves Future Net Revenue (M$) Oil NGL Gas Present WorthCategory (MBBL) (MBBL) (MMCF) Total at 10%
Proved Developed Producing 8,918.3 1,092.9 13,069.1 539,307.4 286,178.7 Proved Developed Non-Producing 12.1 5.2 92.2 1,032.4 654.8 Proved Undeveloped 1,053.3 130.6 1,208.7 47,376.7 18,363.2
Total Proved 9,983.7 1,228.7 14,370.0 587,716.6 305,196.7
2100 ROSS AVENUE, SUITE 2200 DALLAS, TEXAS 75201-2737 PH: 214-969-5401 FAX: 214-969-5411 [email protected] 1301 MCKINNEY STREET, SUITE 3200 HOUSTON, TEXAS 77010-3034 PH: 713-654-4950 FAX: 713-654-4951 netherlandsewell.com

Prices used in this report are based on the 12-month unweighted arithmetic average of the first-day-of-the-month price for each month in the period January through December 2014. For oil and NGL volumes, the average West Texas Intermediate posted price of $91.48 per barrel is adjusted for quality, transportation fees, and market differentials. For gas volumes, the average Henry Hub spot price of $4.350 per MMBTU is adjusted for energy content, transportation fees, and market differentials. All prices are held constant throughout the lives of the properties. The average adjusted product prices weighted by production over the remaining lives of the properties are $82.78 per barrel of oil, $25.00 per barrel of NGL, and $4.406 per MCF of gas.
Operating costs used in this report are based on operating expense records of NRP LP. These costs include the per-well overhead expenses allowed under joint operating agreements along with estimates of costs to be incurred at and below the district and field levels. Operating costs have been divided into per-well costs and per-unit-of-production costs. Since all properties are nonoperated, headquarters general and administrative overhead expenses of NRP LP are not included. Operating costs are not escalated for inflation.
Capital costs used in this report were provided by NRP LP and are based on authorizations for expenditure and actual costs from recent activity. Capital costs are included as required for workovers, new development wells, and production equipment. Based on our understanding of future development plans, a review of the records provided to us, and our knowledge of similar properties, we regard these estimated capital costs to be reasonable. Abandonment costs used in this report are NRP LP’s estimates of the costs to abandon the wells and production facilities, net of any salvage value. Capital costs and abandonment costs are not escalated for inflation.
For the purposes of this report, we did not perform any field inspection of the properties, nor did we examine the mechanical operation or condition of the wells and facilities. We have not investigated possible environmental liability related to the properties; therefore, our estimates do not include any costs due to such possible liability.
We have made no investigation of potential volume and value imbalances resulting from overdelivery or underdelivery to the NRP LP interest. Therefore, our estimates of reserves and future revenue do not include adjustments for the settlement of any such imbalances; our projections are based on NRP LP receiving its net revenue interest share of estimated future gross production.
The reserves shown in this report are estimates only and should not be construed as exact quantities. Proved reserves are those quantities of oil and gas which, by analysis of engineering and geoscience data, can be estimated with reasonable certainty to be economically producible; probable and possible reserves are those additional reserves which are sequentially less certain to be recovered than proved reserves. Estimates of reserves may increase or decrease as a result of market conditions, future operations, changes in regulations, or actual reservoir performance. In addition to the primary economic assumptions discussed herein, our estimates are based on certain assumptions including, but not limited to, that the properties will be developed consistent with current development plans as provided to us by NRP LP, that the properties will be operated in a prudent manner, that no governmental regulations or controls will be put in place that would impact the ability of the interest owner to recover the reserves, and that our projections of future production will prove consistent with actual performance. If the reserves are recovered, the revenues therefrom and the costs related thereto could be more or less than the estimated amounts. Because of governmental policies and uncertainties of supply and demand, the sales rates, prices received for the reserves, and costs incurred in recovering such reserves may vary from assumptions made while preparing this report.
For the purposes of this report, we used technical and economic data including, but not limited to, well test data, production data, historical price and cost information, and property ownership interests. The reserves in this report have been estimated using deterministic methods; these estimates have been prepared in accordance with the Standards Pertaining to the Estimating and Auditing of Oil and Gas Reserves Information promulgated by the Society of Petroleum Engineers (SPE Standards). We used standard engineering and geoscience methods, or a combination of methods, including performance analysis and analogy, that we considered to be appropriate and

necessary to categorize and estimate reserves in accordance with SEC definitions and regulations. As in all aspects of oil and gas evaluation, there are uncertainties inherent in the interpretation of engineering and geoscience data; therefore, our conclusions necessarily represent only informed professional judgment.
The data used in our estimates were obtained from NRP LP, public data sources, and the nonconfidential files of Netherland, Sewell & Associates, Inc. (NSAI) and were accepted as accurate. Supporting work data are on file in our office. We have not examined the titles to the properties or independently confirmed the actual degree or type of interest owned. The technical persons responsible for preparing the estimates presented herein meet the requirements regarding qualifications, independence, objectivity, and confidentiality set forth in the SPE Standards. Steven W. Jansen, a Licensed Professional Engineer in the State of Texas, has been practicing consulting petroleum engineering at NSAI since 2011 and has over 4 years of prior industry experience. We are independent petroleum engineers, geologists, geophysicists, and petrophysicists; we do not own an interest in these properties nor are we employed on a contingent basis.
SWJ:DEC
Sincerely,
NETHERLAND, SEWELL & ASSOCIATES, INC.Texas Registered Engineering Firm F-2699
/s/ C.H. (Scott) Rees IIIBy:
C.H. (Scott) Rees III, P.E.Chairman and Chief Executive Officer
/s/ Steven W. JansenBy:
Steven W. Jansen, P.E. 112973Petroleum Engineer
Date Signed: January 21, 2015
Please be advised that the digital document you are viewing is provided by Netherland, Sewell & Associates, Inc. (NSAI) as a convenience to our clients. The digital document is intended to be substantively the same as the original signed document maintained by NSAI. The digital document is subject to the parameters, limitations, and conditions stated in the original document. In the event of any differences between the digital document and the original document, the original document shall control and supersede the digital document.

DEFINITIONS OF OIL AND GAS RESERVES Adapted from U.S. Securities and Exchange Commission Regulation S-X Section 210.4-10(a)
The following definitions are set forth in U.S. Securities and Exchange Commission (SEC) Regulation S-X Section 210.4-10(a). Also included is supplemental information from (1) the 2007 Petroleum Resources Management System approved by the Society of Petroleum Engineers, (2) the FASB Accounting Standards Codification Topic 932, Extractive Activities—Oil and Gas, and (3) the SEC’s Compliance and Disclosure Interpretations.
(1) Acquisition of properties. Costs incurred to purchase, lease or otherwise acquire a property, including costs of lease bonuses and options to purchase or lease properties, the portion of costs applicable to minerals when land including mineral rights is purchased in fee, brokers’ fees, recording fees, legal costs, and other costs incurred in acquiring properties.
(2) Analogous reservoir. Analogous reservoirs, as used in resources assessments, have similar rock and fluid properties, reservoir conditions (depth, temperature, and pressure) and drive mechanisms, but are typically at a more advanced stage of development than the reservoir of interest and thus may provide concepts to assist in the interpretation of more limited data and estimation of recovery. When used to support proved reserves, an “analogous reservoir” refers to a reservoir that shares the following characteristics with the reservoir of interest:
Instruction to paragraph (a)(2): Reservoir properties must, in the aggregate, be no more favorable in the analog than in the reservoir of interest.
(3) Bitumen. Bitumen, sometimes referred to as natural bitumen, is petroleum in a solid or semi-solid state in natural deposits with a viscosity greater than 10,000 centipoise measured at original temperature in the deposit and atmospheric pressure, on a gas free basis. In its natural state it usually contains sulfur, metals, and other non-hydrocarbons.
(4) Condensate. Condensate is a mixture of hydrocarbons that exists in the gaseous phase at original reservoir temperature and pressure, but that, when produced, is in the liquid phase at surface pressure and temperature.
(5) Deterministic estimate. The method of estimating reserves or resources is called deterministic when a single value for each parameter (from the geoscience, engineering, or economic data) in the reserves calculation is used in the reserves estimation procedure.
(6) Developed oil and gas reserves. Developed oil and gas reserves are reserves of any category that can be expected to be recovered:
Definitions - Page 1 of 7
(i) Same geological formation (but not necessarily in pressure communication with the reservoir of interest);
(ii) Same environment of deposition;
(iii) Similar geological structure; and
(iv) Same drive mechanism.
(i) Through existing wells with existing equipment and operating methods or in which the cost of the required equipment is relatively minor compared to the cost of a new well; and
(ii) Through installed extraction equipment and infrastructure operational at the time of the reserves estimate if the extraction is by
means not involving a well.
Supplemental definitions from the 2007 Petroleum Resources Management System:
Developed Producing Reserves – Developed Producing Reserves are expected to be recovered from completion intervals that are open and producing at the time of the estimate. Improved recovery reserves are considered producing only after the improved recovery project is in operation.
Developed Non-Producing Reserves – Developed Non-Producing Reserves include shut-in and behind-pipe Reserves. Shut-in Reserves are expected to be recovered from (1) completion intervals which are open at the time of the estimate but which have not yet started producing, (2) wells which were shut-in for market conditions or pipeline connections, or (3) wells not capable of production for mechanical reasons. Behind-pipe Reserves are expected to be recovered from zones in existing wells which will require additional completion work or future recompletion prior to start of production. In all cases, production can be initiated or restored with relatively low expenditure compared to the cost of drilling a new well.

DEFINITIONS OF OIL AND GAS RESERVES Adapted from U.S. Securities and Exchange Commission Regulation S-X Section 210.4-10(a)
(7) Development costs. Costs incurred to obtain access to proved reserves and to provide facilities for extracting, treating, gathering and storing the oil and gas. More specifically, development costs, including depreciation and applicable operating costs of support equipment and facilities and other costs of development activities, are costs incurred to:
(8) Development project. A development project is the means by which petroleum resources are brought to the status of economically producible. As examples, the development of a single reservoir or field, an incremental development in a producing field, or the integrated development of a group of several fields and associated facilities with a common ownership may constitute a development project.
(9) Development well. A well drilled within the proved area of an oil or gas reservoir to the depth of a stratigraphic horizon known to be productive.
(10) Economically producible. The term economically producible, as it relates to a resource, means a resource which generates revenue that exceeds, or is reasonably expected to exceed, the costs of the operation. The value of the products that generate revenue shall be determined at the terminal point of oil and gas producing activities as defined in paragraph (a)(16) of this section.
(11) Estimated ultimate recovery (EUR). Estimated ultimate recovery is the sum of reserves remaining as of a given date and cumulative production as of that date.
(12) Exploration costs. Costs incurred in identifying areas that may warrant examination and in examining specific areas that are considered to have prospects of containing oil and gas reserves, including costs of drilling exploratory wells and exploratory-type stratigraphic test wells. Exploration costs may be incurred both before acquiring the related property (sometimes referred to in part as prospecting costs) and after acquiring the property. Principal types of exploration costs, which include depreciation and applicable operating costs of support equipment and facilities and other costs of exploration activities, are:
(13) Exploratory well. An exploratory well is a well drilled to find a new field or to find a new reservoir in a field previously found to be productive of oil or gas in another reservoir. Generally, an exploratory well is any well that is not a development well, an extension well, a service well, or a stratigraphic test well as those items are defined in this section.
(14) Extension well. An extension well is a well drilled to extend the limits of a known reservoir.
Definitions - Page 2 of 7
(i) Gain access to and prepare well locations for drilling, including surveying well locations for the purpose of determining
specific development drilling sites, clearing ground, draining, road building, and relocating public roads, gas lines, and power lines, to the extent necessary in developing the proved reserves.
(ii) Drill and equip development wells, development-type stratigraphic test wells, and service wells, including the costs of platforms and of well equipment such as casing, tubing, pumping equipment, and the wellhead assembly.
(iii) Acquire, construct, and install production facilities such as lease flow lines, separators, treaters, heaters, manifolds,
measuring devices, and production storage tanks, natural gas cycling and processing plants, and central utility and waste disposal systems.
(iv) Provide improved recovery systems.
(i) Costs of topographical, geographical and geophysical studies, rights of access to properties to conduct those studies, and
salaries and other expenses of geologists, geophysical crews, and others conducting those studies. Collectively, these are sometimes referred to as geological and geophysical or “G&G” costs.
(ii) Costs of carrying and retaining undeveloped properties, such as delay rentals, ad valorem taxes on properties, legal costs for title defense, and the maintenance of land and lease records.
(iii) Dry hole contributions and bottom hole contributions.
(iv) Costs of drilling and equipping exploratory wells.
(v) Costs of drilling exploratory-type stratigraphic test wells.
DEFINITIONS OF OIL AND GAS RESERVES Adapted from U.S. Securities and Exchange Commission Regulation S-X Section 210.4-10(a)
(15) Field. An area consisting of a single reservoir or multiple reservoirs all grouped on or related to the same individual geological structural feature and/or stratigraphic condition. There may be two or more reservoirs in a field which are separated vertically by intervening impervious strata, or laterally by local geologic barriers, or by both. Reservoirs that are associated by being in overlapping or adjacent fields may be treated as a single or common operational field. The geological terms “structural feature” and “stratigraphic condition” are intended to identify localized geological features as opposed to the broader terms of basins, trends, provinces, plays, areas-of-interest, etc.
(16) Oil and gas producing activities.
Instruction 1 to paragraph (a)(16)(i): The oil and gas production function shall be regarded as ending at a “terminal point”, which is the outlet valve on the lease or field storage tank. If unusual physical or operational circumstances exist, it may be appropriate to regard the terminal point for the production function as:
Instruction 2 to paragraph (a)(16)(i): For purposes of this paragraph (a)(16), the term saleable hydrocarbons means hydrocarbons that are saleable in the state in which the hydrocarbons are delivered.
(17) Possible reserves. Possible reserves are those additional reserves that are less certain to be recovered than probable reserves.
Definitions - Page 3 of 7
(i) Oil and gas producing activities include:
(A) The search for crude oil, including condensate and natural gas liquids, or natural gas (“oil and gas”) in their natural
states and original locations;
(B) The acquisition of property rights or properties for the purpose of further exploration or for the purpose of removing
the oil or gas from such properties;
(C) The construction, drilling, and production activities necessary to retrieve oil and gas from their natural reservoirs, including the acquisition, construction, installation, and maintenance of field gathering and storage systems, such as:
(1) Lifting the oil and gas to the surface; and
(2) Gathering, treating, and field processing (as in the case of processing gas to extract liquid hydrocarbons); and
(D) Extraction of saleable hydrocarbons, in the solid, liquid, or gaseous state, from oil sands, shale, coalbeds, or other
nonrenewable natural resources which are intended to be upgraded into synthetic oil or gas, and activities undertaken with a view to such extraction.
a. The first point at which oil, gas, or gas liquids, natural or synthetic, are delivered to a main pipeline, a common carrier, a
refinery, or a marine terminal; and
b. In the case of natural resources that are intended to be upgraded into synthetic oil or gas, if those natural resources are
delivered to a purchaser prior to upgrading, the first point at which the natural resources are delivered to a main pipeline, a common carrier, a refinery, a marine terminal, or a facility which upgrades such natural resources into synthetic oil or gas.
(ii) Oil and gas producing activities do not include:
(A) Transporting, refining, or marketing oil and gas;
(B) Processing of produced oil, gas, or natural resources that can be upgraded into synthetic oil or gas by a registrant that
does not have the legal right to produce or a revenue interest in such production;
(C) Activities relating to the production of natural resources other than oil, gas, or natural resources from which synthetic oil and gas can be extracted; or
(D) Production of geothermal steam.
(i) When deterministic methods are used, the total quantities ultimately recovered from a project have a low probability of exceeding proved plus probable plus possible reserves. When probabilistic methods are used, there should be at least a 10% probability that the total quantities ultimately recovered will equal or exceed the proved plus probable plus possible reserves estimates.

DEFINITIONS OF OIL AND GAS RESERVES Adapted from U.S. Securities and Exchange Commission Regulation S-X Section 210.4-10(a)
(18) Probable reserves. Probable reserves are those additional reserves that are less certain to be recovered than proved reserves but which, together with proved reserves, are as likely as not to be recovered.
(19) Probabilistic estimate. The method of estimation of reserves or resources is called probabilistic when the full range of values that could reasonably occur for each unknown parameter (from the geoscience and engineering data) is used to generate a full range of possible outcomes and their associated probabilities of occurrence.
Definitions - Page 4 of 7
(ii) Possible reserves may be assigned to areas of a reservoir adjacent to probable reserves where data control and interpretations of
available data are progressively less certain. Frequently, this will be in areas where geoscience and engineering data are unable to define clearly the area and vertical limits of commercial production from the reservoir by a defined project.
(iii) Possible reserves also include incremental quantities associated with a greater percentage recovery of the hydrocarbons in
place than the recovery quantities assumed for probable reserves.
(iv) The proved plus probable and proved plus probable plus possible reserves estimates must be based on reasonable alternative
technical and commercial interpretations within the reservoir or subject project that are clearly documented, including comparisons to results in successful similar projects.
(v) Possible reserves may be assigned where geoscience and engineering data identify directly adjacent portions of a reservoir within the same accumulation that may be separated from proved areas by faults with displacement less than formation thickness or other geological discontinuities and that have not been penetrated by a wellbore, and the registrant believes that such adjacent portions are in communication with the known (proved) reservoir. Possible reserves may be assigned to areas that are structurally higher or lower than the proved area if these areas are in communication with the proved reservoir.
(vi) Pursuant to paragraph (a)(22)(iii) of this section, where direct observation has defined a highest known oil (HKO) elevation and the potential exists for an associated gas cap, proved oil reserves should be assigned in the structurally higher portions of the reservoir above the HKO only if the higher contact can be established with reasonable certainty through reliable technology. Portions of the reservoir that do not meet this reasonable certainty criterion may be assigned as probable and possible oil or gas based on reservoir fluid properties and pressure gradient interpretations.
(i) When deterministic methods are used, it is as likely as not that actual remaining quantities recovered will exceed the sum of
estimated proved plus probable reserves. When probabilistic methods are used, there should be at least a 50% probability that the actual quantities recovered will equal or exceed the proved plus probable reserves estimates.
(ii) Probable reserves may be assigned to areas of a reservoir adjacent to proved reserves where data control or interpretations of available data are less certain, even if the interpreted reservoir continuity of structure or productivity does not meet the reasonable certainty criterion. Probable reserves may be assigned to areas that are structurally higher than the proved area if these areas are in communication with the proved reservoir.
(iii) Probable reserves estimates also include potential incremental quantities associated with a greater percentage recovery of the hydrocarbons in place than assumed for proved reserves.
(iv) See also guidelines in paragraphs (a)(17)(iv) and (a)(17)(vi) of this section.
(20) Production costs.
(i) Costs incurred to operate and maintain wells and related equipment and facilities, including depreciation and applicable operating costs of support equipment and facilities and other costs of operating and maintaining those wells and related equipment and facilities. They become part of the cost of oil and gas produced. Examples of production costs (sometimes called lifting costs) are:
(A) Costs of labor to operate the wells and related equipment and facilities.
(B) Repairs and maintenance.
(C) Materials, supplies, and fuel consumed and supplies utilized in operating the wells and related equipment and facilities.

DEFINITIONS OF OIL AND GAS RESERVES Adapted from U.S. Securities and Exchange Commission Regulation S-X Section 210.4-10(a)
(22) Proved oil and gas reserves. Proved oil and gas reserves are those quantities of oil and gas, which, by analysis of geoscience and engineering data, can be estimated with reasonable certainty to be economically producible—from a given date forward, from known reservoirs, and under existing economic conditions, operating methods, and government regulations—prior to the time at which contracts providing the right to operate expire, unless evidence indicates that renewal is reasonably certain, regardless of whether deterministic or probabilistic methods are used for the estimation. The project to extract the hydrocarbons must have commenced or the operator must be reasonably certain that it will commence the project within a reasonable time.
(23) Proved properties. Properties with proved reserves.
Definitions - Page 5 of 7
(D) Property taxes and insurance applicable to proved properties and wells and related equipment and facilities.
(E) Severance taxes.
(ii) Some support equipment or facilities may serve two or more oil and gas producing activities and may also serve transportation, refining, and marketing activities. To the extent that the support equipment and facilities are used in oil and gas producing activities, their depreciation and applicable operating costs become exploration, development or production costs, as appropriate. Depreciation, depletion, and amortization of capitalized acquisition, exploration, and development costs are not production costs but also become part of the cost of oil and gas produced along with production (lifting) costs identified above.
(21) Proved area. The part of a property to which proved reserves have been specifically attributed.
(i) The area of the reservoir considered as proved includes:
(A) The area identified by drilling and limited by fluid contacts, if any, and
(B) Adjacent undrilled portions of the reservoir that can, with reasonable certainty, be judged to be continuous with it and to contain economically producible oil or gas on the basis of available geoscience and engineering data.
(ii) In the absence of data on fluid contacts, proved quantities in a reservoir are limited by the lowest known hydrocarbons
(LKH) as seen in a well penetration unless geoscience, engineering, or performance data and reliable technology establishes a lower contact with reasonable certainty.
(iii) Where direct observation from well penetrations has defined a highest known oil (HKO) elevation and the potential exists for an associated gas cap, proved oil reserves may be assigned in the structurally higher portions of the reservoir only if geoscience, engineering, or performance data and reliable technology establish the higher contact with reasonable certainty.
(iv) Reserves which can be produced economically through application of improved recovery techniques (including, but not limited to, fluid injection) are included in the proved classification when:
(A) Successful testing by a pilot project in an area of the reservoir with properties no more favorable than in the reservoir as a whole, the operation of an installed program in the reservoir or an analogous reservoir, or other evidence using reliable technology establishes the reasonable certainty of the engineering analysis on which the project or program was based; and
(B) The project has been approved for development by all necessary parties and entities, including governmental entities.
(v) Existing economic conditions include prices and costs at which economic producibility from a reservoir is to be determined. The price shall be the average price during the 12-month period prior to the ending date of the period covered by the report, determined as an unweighted arithmetic average of the first-day-of-the-month price for each month within such period, unless prices are defined by contractual arrangements, excluding escalations based upon future conditions.

DEFINITIONS OF OIL AND GAS RESERVES Adapted from U.S. Securities and Exchange Commission Regulation S-X Section 210.4-10(a)
(24) Reasonable certainty. If deterministic methods are used, reasonable certainty means a high degree of confidence that the quantities will be recovered. If probabilistic methods are used, there should be at least a 90% probability that the quantities actually recovered will equal or exceed the estimate. A high degree of confidence exists if the quantity is much more likely to be achieved than not, and, as changes due to increased availability of geoscience (geological, geophysical, and geochemical), engineering, and economic data are made to estimated ultimate recovery (EUR) with time, reasonably certain EUR is much more likely to increase or remain constant than to decrease.
(25) Reliable technology. Reliable technology is a grouping of one or more technologies (including computational methods) that has been field tested and has been demonstrated to provide reasonably certain results with consistency and repeatability in the formation being evaluated or in an analogous formation.
(26) Reserves. Reserves are estimated remaining quantities of oil and gas and related substances anticipated to be economically producible, as of a given date, by application of development projects to known accumulations. In addition, there must exist, or there must be a reasonable expectation that there will exist, the legal right to produce or a revenue interest in the production, installed means of delivering oil and gas or related substances to market, and all permits and financing required to implement the project.
Note to paragraph (a)(26): Reserves should not be assigned to adjacent reservoirs isolated by major, potentially sealing, faults until those reservoirs are penetrated and evaluated as economically producible. Reserves should not be assigned to areas that are clearly separated from a known accumulation by a non-productive reservoir (i.e., absence of reservoir, structurally low reservoir, or negative test results). Such areas may contain prospective resources (i.e., potentially recoverable resources from undiscovered accumulations).
Excerpted from the FASB Accounting Standards Codification Topic 932, Extractive Activities—Oil and Gas:
932-235-50-30 A standardized measure of discounted future net cash flows relating to an entity’s interests in both of the following shall be disclosed as of the end of the year:
The standardized measure of discounted future net cash flows relating to those two types of interests in reserves may be combined for reporting purposes.
932-235-50-31 All of the following information shall be disclosed in the aggregate and for each geographic area for which reserve quantities are disclosed in accordance with paragraphs 932-235-50-3 through 50-11B:
a. Proved oil and gas reserves (see paragraphs 932-235-50-3 through 50-11B)
b. Oil and gas subject to purchase under long-term supply, purchase, or similar agreements and contracts in which
the entity participates in the operation of the properties on which the oil or gas is located or otherwise serves as the producer of those reserves (see paragraph 932-235-50-7).
a. Future cash inflows. These shall be computed by applying prices used in estimating the entity’s proved oil and gas
reserves to the year-end quantities of those reserves. Future price changes shall be considered only to the extent provided by contractual arrangements in existence at year-end.
b. Future development and production costs. These costs shall be computed by estimating the expenditures to be incurred in developing and producing the proved oil and gas reserves at the end of the year, based on year-end costs and assuming continuation of existing economic conditions. If estimated development expenditures are significant, they shall be presented separately from estimated production costs.
c. Future income tax expenses. These expenses shall be computed by applying the appropriate year-end statutory tax rates, with consideration of future tax rates already legislated, to the future pretax net cash flows relating to the entity’s proved oil and gas reserves, less the tax basis of the properties involved. The future income tax expenses shall give effect to tax deductions and tax credits and allowances relating to the entity’s proved oil and gas reserves.
d. Future net cash flows. These amounts are the result of subtracting future development and production costs and future income tax expenses from future cash inflows.
e. Discount. This amount shall be derived from using a discount rate of 10 percent a year to reflect the timing of the future net cash flows relating to proved oil and gas reserves.

(27) Reservoir. A porous and permeable underground formation containing a natural accumulation of producible oil and/or gas that is confined by impermeable rock or water barriers and is individual and separate from other reservoirs.
Definitions - Page 6 of 7
f. Standardized measure of discounted future net cash flows. This amount is the future net cash flows less the computed discount.

DEFINITIONS OF OIL AND GAS RESERVES Adapted from U.S. Securities and Exchange Commission Regulation S-X Section 210.4-10(a)
(28) Resources. Resources are quantities of oil and gas estimated to exist in naturally occurring accumulations. A portion of the resources may be estimated to be recoverable, and another portion may be considered to be unrecoverable. Resources include both discovered and undiscovered accumulations.
(29) Service well. A well drilled or completed for the purpose of supporting production in an existing field. Specific purposes of service wells include gas injection, water injection, steam injection, air injection, salt-water disposal, water supply for injection, observation, or injection for in-situ combustion.
(30) Stratigraphic test well. A stratigraphic test well is a drilling effort, geologically directed, to obtain information pertaining to a specific geologic condition. Such wells customarily are drilled without the intent of being completed for hydrocarbon production. The classification also includes tests identified as core tests and all types of expendable holes related to hydrocarbon exploration. Stratigraphic tests are classified as “exploratory type” if not drilled in a known area or “development type” if drilled in a known area.
(31) Undeveloped oil and gas reserves. Undeveloped oil and gas reserves are reserves of any category that are expected to be recovered from new wells on undrilled acreage, or from existing wells where a relatively major expenditure is required for recompletion.
Definitions - Page 7 of 7
(i) Reserves on undrilled acreage shall be limited to those directly offsetting development spacing areas that are reasonably certain of
production when drilled, unless evidence using reliable technology exists that establishes reasonable certainty of economic producibility at greater distances.
(ii) Undrilled locations can be classified as having undeveloped reserves only if a development plan has been adopted indicating that
they are scheduled to be drilled within five years, unless the specific circumstances, justify a longer time.
From the SEC’s Compliance and Disclosure Interpretations (October 26, 2009):
Although several types of projects — such as constructing offshore platforms and development in urban areas, remote locations or environmentally sensitive locations — by their nature customarily take a longer time to develop and therefore often do justify longer time periods, this determination must always take into consideration all of the facts and circumstances. No particular type of project per se justifies a longer time period, and any extension beyond five years should be the exception, and not the rule.
Factors that a company should consider in determining whether or not circumstances justify recognizing reserves even though development may extend past five years include, but are not limited to, the following:
• The company’s level of ongoing significant development activities in the area to be developed (for example, drilling only the
minimum number of wells necessary to maintain the lease generally would not constitute significant development activities);
• The company’s historical record at completing development of comparable long-term projects;
• The amount of time in which the company has maintained the leases, or booked the reserves, without significant
development activities;
• The extent to which the company has followed a previously adopted development plan (for example, if a company has
changed its development plan several times without taking significant steps to implement any of those plans, recognizing proved undeveloped reserves typically would not be appropriate); and
• The extent to which delays in development are caused by external factors related to the physical operating environment (for
example, restrictions on development on Federal lands, but not obtaining government permits), rather than by internal factors (for example, shifting resources to develop properties with higher priority).
(iii) Under no circumstances shall estimates for undeveloped reserves be attributable to any acreage for which an application of fluid injection or other improved recovery technique is contemplated, unless such techniques have been proved effective by actual projects in the same reservoir or an analogous reservoir, as defined in paragraph (a)(2) of this section, or by other evidence using reliable technology establishing reasonable certainty.
(32) Unproved properties. Properties with no proved reserves.

Exhibit 99.3
OCI Wyoming LLC (A Majority-Owned Subsidiary of OCI Resources LP)
Financial Statements as of and for the Years Ended December 31, 2014 and 2013, and Report of Independent Registered Public Accounting Firm
1

OCI WYOMING LLC (A Majority Owned Subsidiary of OCI Resources LP)
TABLE OF CONTENTS
2
Page
Number
REPORT OF INDEPENDENT REGISTERED PUBLIC ACCOUNTING FIRM 3
FINANCIAL STATEMENTS AS OF AND FOR THE YEARS ENDED DECEMBER 31, 2014 AND 2013: Balance Sheets 4 Statements of Operations and Comprehensive Income 5 Statements of Members’ Equity 6 Statements of Cash Flows 7 Notes to Financial Statements 8

REPORT OF INDEPENDENT REGISTERED PUBLIC ACCOUNTING FIRM
The Board of Managers and Members of
OCI Wyoming LLC
Atlanta, Georgia
We have audited the accompanying balance sheets of OCI Wyoming LLC (the “Company”) as of December 31, 2014 and 2013, and the related statements of operations and comprehensive income, members’ equity, and cash flows for the years then ended, and the related notes to the financial statements. These financial statements are the responsibility of the Company’s management. Our responsibility is to express an opinion on these financial statements based on our audits.
We conducted our audits in accordance with the standards of the Public Company Accounting Oversight Board (United States). Those standards require that we plan and perform the audit to obtain reasonable assurance about whether the financial statements are free of material misstatement. The Company is not required to have, nor were we engaged to perform, an audit of its internal control over financial reporting. Our audits included consideration of internal control over financial reporting as a basis for designing audit procedures that are appropriate in the circumstances, but not for the purpose of expressing an opinion on the effectiveness of the Company’s internal control over financial reporting. Accordingly, we express no such opinion. An audit also includes examining, on a test basis, evidence supporting the amounts and disclosures in the financial statements, assessing the accounting principles used and significant estimates made by management, as well as evaluating the overall financial statement presentation. We believe that our audits provide a reasonable basis for our opinion.
In our opinion, such financial statements present fairly, in all material respects, the financial position of the Company as of December 31, 2014 and 2013, and the results of its operations and its cash flows for the years then ended, in conformity with accounting principles generally accepted in the United States of America.
3
/s/ DELOITTE & TOUCHE LLP
Atlanta, Georgia
February 26, 2015

OCI WYOMING LLC (A Majority Owned Subsidiary of OCI Resources LP)
BALANCE SHEETS AS OF DECEMBER 31, 2014 AND 2013 (In thousands of dollars)
See notes to financial statements.
4
2014 2013ASSETS
CURRENT ASSETS: Cash and cash equivalents $ 30,520 $ 45,969 Accounts receivable, net 35,457 34,401 Accounts receivable - ANSAC 70,410 58,051 Due from affiliates, net 19,489 20,394 Inventory 43,237 41,710 Other current assets 1,509 740
Total current assets 200,622 201,265
PROPERTY, PLANT, AND EQUIPMENT, NET 201,402 193,277
OTHER NON-CURRENT ASSETS 880 1,231
TOTAL ASSETS $402,904 $395,773
LIABILITIES AND MEMBERS’ EQUITY
CURRENT LIABILITIES: Accounts payable $ 13,069 $ 13,189 Due to affiliates 5,347 375 Accrued expenses 29,288 26,099
Total current liabilities 47,704 39,663
LONG-TERM DEBT 145,000 155,000
OTHER NON-CURRENT LIABILITIES 4,192 3,779
Total liabilities 196,896 198,442
COMMITMENTS AND CONTINGENCIES
MEMBERS’ EQUITY: Members’ equity — OCI Resources LP 105,445 100,919 Members’ equity — Natural Resource Partners LP 101,311 96,962 Accumulated other comprehensive loss (748) (550)
Total members’ equity 206,008 197,331
TOTAL LIABILITIES AND MEMBERS’ EQUITY $402,904 $395,773

OCI WYOMING LLC (A Majority Owned Subsidiary of OCI Resources LP)
STATEMENTS OF OPERATIONS AND COMPREHENSIVE INCOME FOR THE YEARS ENDED DECEMBER 31, 2014 AND 2013 (In thousands of dollars)
See notes to financial statements.
5
2014 2013
SALES - AFFILIATES $236,685 $211,645 SALES - OTHERS 228,347 230,487
Total net sales 465,032 442,132
COST OF PRODUCTS SOLD 222,848 225,160 FREIGHT COSTS 123,745 122,673
Total cost of products sold 346,593 347,833
GROSS PROFIT 118,439 94,299
SELLING, GENERAL AND ADMINISTRATIVE EXPENSES - AFFILIATES 16,192 12,506
SELLING, GENERAL AND ADMINISTRATIVE EXPENSES - OTHERS 577 36
LOSS ON DISPOSAL OF ASSETS, NET 1,032 —
OPERATING INCOME 100,638 81,757
OTHER INCOME (EXPENSE): Interest income 78 56 Interest expense (5,140) (2,838) Other income, net 1,064 680
Total other income (expense) (3,998) (2,102)
NET INCOME 96,640 79,655
OTHER COMPREHENSIVE INCOME (LOSS)
Income (loss) on derivative financial instruments (198) 30
COMPREHENSIVE INCOME $ 96,442 $ 79,685
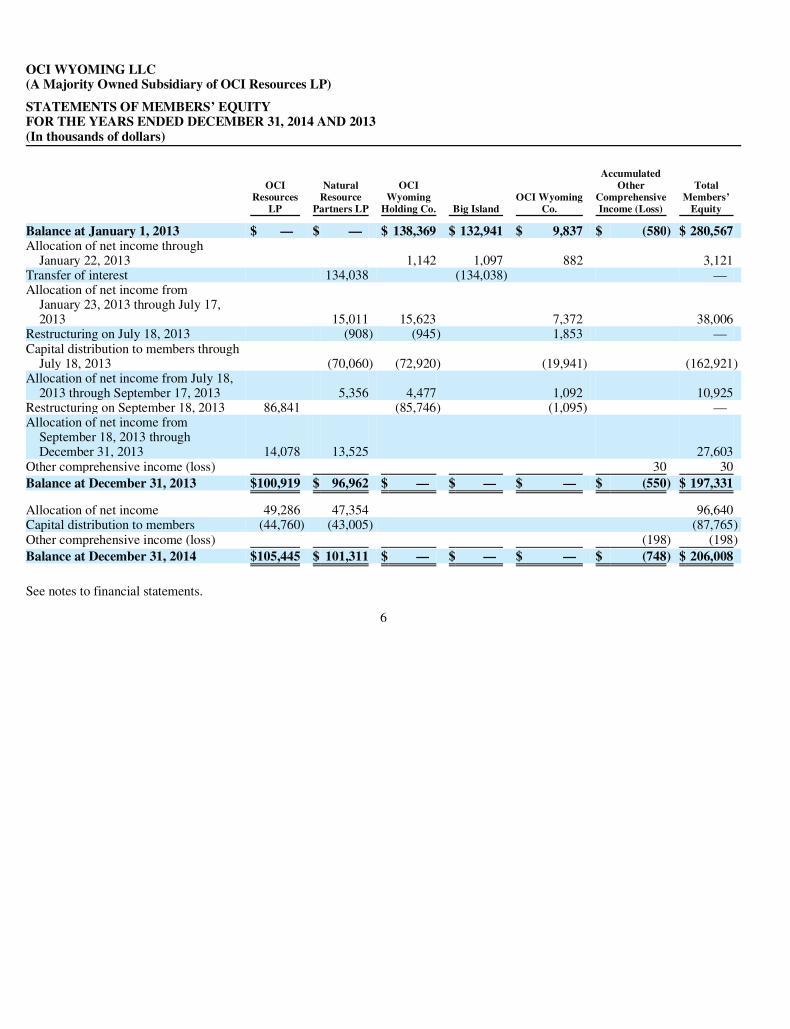
OCI WYOMING LLC (A Majority Owned Subsidiary of OCI Resources LP)
STATEMENTS OF MEMBERS’ EQUITY FOR THE YEARS ENDED DECEMBER 31, 2014 AND 2013 (In thousands of dollars)
See notes to financial statements.
6
OCI Resources
LP
NaturalResource
Partners LP
OCIWyoming
Holding Co. Big IslandOCI Wyoming
Co.
Accumulated Other
ComprehensiveIncome (Loss)
TotalMembers’
Equity
Balance at January 1, 2013 $ — $ — $ 138,369 $ 132,941 $ 9,837 $ (580) $ 280,567 Allocation of net income through
January 22, 2013 1,142 1,097 882 3,121 Transfer of interest 134,038 (134,038) — Allocation of net income from
January 23, 2013 through July 17, 2013 15,011 15,623 7,372 38,006
Restructuring on July 18, 2013 (908) (945) 1,853 — Capital distribution to members through
July 18, 2013 (70,060) (72,920) (19,941) (162,921) Allocation of net income from July 18,
2013 through September 17, 2013 5,356 4,477 1,092 10,925 Restructuring on September 18, 2013 86,841 (85,746) (1,095) — Allocation of net income from
September 18, 2013 through December 31, 2013 14,078 13,525 27,603
Other comprehensive income (loss) 30 30
Balance at December 31, 2013 $100,919 $ 96,962 $ — $ — $ — $ (550) $ 197,331
Allocation of net income 49,286 47,354 96,640 Capital distribution to members (44,760) (43,005) (87,765) Other comprehensive income (loss) (198) (198)
Balance at December 31, 2014 $105,445 $ 101,311 $ — $ — $ — $ (748) $ 206,008

OCI WYOMING LLC (A Majority Owned Subsidiary of OCI Resources LP)
STATEMENTS OF CASH FLOWS FOR THE YEARS ENDED DECEMBER 31, 2014 AND 2013 (In thousands of dollars)
See notes to financial statements
7
2014 2013CASH FLOWS FROM OPERATING ACTIVITIES:
Net income $ 96,640 $ 79,655 Adjustments to reconcile net income to net cash provided by operating activities:
Depreciation, depletion and amortization 21,587 22,723 Loss on disposal of assets, net 1,032 — Other non-cash items (203) — (Increase) decrease in:
Accounts receivable, net (1,055) 809 Accounts receivable - ANSAC (12,359) (4,215) Inventory (1,499) (45) Other current and non-current assets (153) (1,470) Due from affiliates, net 905 5,557
Increase (decrease) in: Accounts payable (3,535) 66 Accrued expenses and other liabilities 3,230 (542) Due to affiliates 4,971 (3,062)
Net cash provided by operating activities 109,561 99,476
CASH FLOWS FROM INVESTING ACTIVITIES: Capital expenditures (27,255) (16,241) Proceeds from sale of fixed assets 10 —
Net cash used in investing activities (27,245) (16,241)
CASH FLOWS FROM FINANCING ACTIVITIES: Repayments of long-term debt (10,000) (32,000) Proceeds from revolving credit facility — 135,000 Cash distribution to members (87,765) (162,921)
Net cash used in financing activities (97,765) (59,921)
NET (DECREASE) INCREASE IN CASH AND CASH EQUIVALENTS (15,449) 23,314
CASH AND CASH EQUIVALENTS:Beginning of year 45,969 22,655
End of year $ 30,520 $ 45,969
SUPPLEMENTAL DISCLOSURE OF CASH FLOW INFORMATION:Interest paid during the year $ 4,274 $ 2,285
SUPPLEMENTAL DISCLOSURES OF NONCASH INVESTING ACTIVITIES :Capital expenditures on account $ 4,579 $ 745

OCI WYOMING LLC (A Majority Owned Subsidiary of OCI Resources LP)
NOTES TO FINANCIAL STATEMENTS AS OF AND FOR THE YEARS ENDED DECEMBER 31, 2014 AND 2013 (Dollars in thousands)
1. Corporate Structure
A 51% membership interest in OCI Wyoming LLC (the “Company,” “we,” “us,” or “our”) is owned by OCI Resources LP (“OCIR” or the “Partnership”). Natural Resource Partners LP (NRP) owns a 49% membership interest in the Company. OCIR is a master limited partnership traded on the New York Stock exchange and is currently owned 74.84% by OCI Wyoming Holding Co. (OCIWHCO) and 25.16% by the general public. OCI Chemical Corporation (OCICC), which is ultimately 100% owned by OCI Enterprises, Inc. (OCIE), owns 100% of OCIWHCO. On June 30, 2014, the Company converted from a Delaware limited partnership to a Delaware limited liability company.
2. Nature of Operations and Summary of Significant Accounting Policies
Nature of Operations - The Company operations consist of the mining of trona ore, which, when processed, becomes soda ash. All soda ash processed is sold through the Company’s sales agent, OCICC, to various domestic and European customers and to American Natural Soda Ash Corporation (ANSAC) for export. All mining and processing activities take place in one facility located in Green River, Wyoming.
A summary of the significant accounting policies is as follows:
Basis of Presentation - The accompanying financial statements have been prepared in accordance with accounting principles generally accepted in the United States of America.
Use of Estimates - The preparation of financial statements, in accordance with accounting principles generally accepted in the United States of America, requires management to make estimates and assumptions that affect the reported amounts of assets and liabilities, and disclosure of contingent assets and liabilities at the dates of the financial statements, and the reported amountsof revenues and expenses during the reporting period. Actual results could differ from those estimates.
Revenue Recognition - We recognize revenue when the earnings process is complete, which is generally upon transfer of title. This transfer typically occurs upon shipment to the customer, which is normally free on board (“FOB”) terms or upon receipt by the customer. In all cases, we apply the following criteria in recognizing revenue: (1) persuasive evidence of an arrangement exists; (2) delivery has occurred; (3) the selling price is fixed, determinable or reasonably estimated sales price has been agreed with the customer; and (4) collectability is reasonably assured. Customer rebates are accounted for as sales deductions. We record amounts billed for shipping and handling fees as revenue. Costs incurred for shipping and handling are recorded as costs of sales and services.
Freight Costs - The Company includes freight costs billed to customers for shipments administered by the Company in gross sales. The related freight costs along with cost of products sold are deducted from gross sales to determine gross profit.
Cash and Cash Equivalents - The Company considers all highly liquid investments purchased with an original maturity of three months or less to be cash equivalents. Cash equivalents consist primarily of money market deposit accounts.
8

Accounts Receivable - Accounts receivable are carried at the original invoice amount less an estimate for doubtful receivables. We generally do not require collateral against outstanding accounts receivable. The allowance for doubtful accounts is based on specifically identified amounts that the Company believes to be uncollectible. An additional allowance is recorded based on certain percentages of aged receivables, which are determined based on management’s assessment of the general financial conditions affecting the Company’s customer base. If actual collection experience changes, revisions to the allowance may be required. Accounts receivable are written off when deemed uncollectible. Recoveries of accounts receivable previously written off are recorded when received. During the years ended 2014 and 2013 there were no significant accounts receivable bad debt expenses, write-offs or recoveries.
Inventory - Inventory and stores inventory is valued at the lower of cost or market on a first-in, first-out basis. Costs include raw materials, direct labor, and manufacturing overhead. Market is based on current replacement cost for raw materials and stores inventory and on net realizable value for finished goods. Stores inventory represents parts materials and supplies currently available for future use.
Property, Plant, and Equipment - Property, plant, and equipment are stated at cost less accumulated depreciation. Depreciation is computed over the estimated useful lives of depreciable assets, using the straight-line method. The estimated useful lives applied to depreciable assets are as follows:
When property, plant, and equipment are sold or otherwise disposed of, the cost and related accumulated depreciation are removed from the accounts and any resulting gain or loss is reflected in operations for the year.
The Company’s policy is to evaluate property, plant, and equipment for impairment whenever events or changes in circumstances indicate that its carrying amount may not be recoverable. An indicator of potential impairment would include situations when the estimated future undiscounted cash flows are less than the carrying value. The amount of any impairment then recognized would be calculated as the difference between estimated fair value and the carrying value of the asset.
Derivative Instruments and Hedging Activities - The Company may enter into derivative contracts from time to time to manage exposure to the risk of exchange rate changes on its foreign currency transactions, the risk of changes in natural gas prices, and the risk of the variability in interest rates on borrowings. Gains and losses on derivative contracts are reported as a component of the underlying transactions. The Company follows hedge accounting for its hedging activities. All derivative instruments are recorded on the balance sheet at their fair values. The accounting for changes in the fair value of a derivative depends on the intended use of the derivative and the resulting designation. The Company designates its derivatives based upon criteria established for hedge accounting under generally accepted accounting principles. For a derivative designated as a fair value hedge, the gain or loss is recognized in earnings in the period of change together with the offsetting gain or loss on the hedged item attributed to the risk being hedged. For a derivative designated as a cash flow hedge, the effective portion of the derivative’s gain or loss is initially reported as a component of accumulated other comprehensive income (loss) and subsequently reclassified into earnings when the hedged exposure affects earnings. Any significant ineffective portion of the gain or loss is reported in earnings immediately. For derivatives not designated as hedges, the gain or loss is reported in earnings in the period of change.
9
Useful LivesLand and land improvements 10 yearsDepletable land 15-60 yearsBuildings and building improvements 10-30 yearsInternal-use computer software 3-5 yearsMachinery and equipment 5-20 yearsFurniture and fixtures 10 years

The Company has interest rate swaps recorded within accrued expenses with an aggregate notional value of $76,000 and a fair value of a liability of $748 at December 31, 2014 and an aggregate notional value of $101,500 and a fair value of a liability of $550 at December 31, 2013. These contracts are for periods consistent with the exposure being hedged and generally will matureon July 18, 2018, the maturity date of the long-term debt under our Wyoming Credit Facility.
The Company enters into foreign exchange forward contracts to hedge certain firm commitments denominated in currencies other than the U.S. dollar. However, the Company does not apply hedge accounting for these contracts. These contracts are for periods consistent with the exposure being hedged and generally have maturities of one year or less. The fair value of forward contracts, which are predominantly used to purchase U.S. dollars and sell Euros, totaled an asset of $617 and a liability of $541 at December 31, 2014 and 2013, respectively. These currency hedges have a notional value of $6,900 and $26,360 at December 31, 2014 and 2013, respectively.
Income Tax - The Company is organized as a pass-through entity for federal income tax purposes. As a result, the members are responsible for federal income taxes based on their respective share of taxable income. Net income for financial statement purposes may differ significantly from taxable income reportable to members as a result of differences between the tax bases and financial reporting bases of assets and liabilities and the taxable income allocation requirements under the membership agreement.
Reclamation Costs - The Company is obligated to return the land beneath its refinery and tailings ponds to its natural condition upon completion of operations and is required to return the land beneath its rail yard to its natural condition upon termination of the various lease agreements.
The Company accounts for its land reclamation liability as an asset retirement obligation, which requires that obligations associated with the retirement of a tangible long-lived asset be recorded as a liability when those obligations are incurred, with the amount of the liability initially measured at fair value. Upon initially recognizing a liability for an asset retirement obligation, an entity must capitalize the cost by recognizing an increase in the carrying amount of the related long-lived asset. Over time, the liability is accreted to its present value each period, and the capitalized cost is depreciated over the estimated useful life of the related asset. Upon settlement of the liability, an entity either settles the obligation for its recorded amount or incurs a gain or loss upon settlement.
The estimated original liability calculated in 1996 for the refinery and tailing ponds was calculated based on the estimated useful life of the mine, which was 80 years, and on external and internal estimates as to the cost to restore the land in the future and state regulatory requirements. As a result of a revised mine reserve study, effective January 1, 2015, the mining reserve will be amortized over a remaining life of 68 years. During 2014 and 2013 the remaining life was 66 years and 67 years, respectively. The liability was discounted using the credit-adjusted risk free rate of 7% and is being accreted throughout the estimated life of the related assets to equal the total estimated costs with a corresponding entry being recorded to interest expense.
During 2011, the Company constructed a rail yard to facilitate loading and switching of rail cars. The Company is required to restore the land on which the rail yard is constructed to its natural conditions. The estimated liability for restoring the rail yard to its natural condition is calculated based on the land lease life of 30 years and on external and internal estimates as to the cost to restore the land in the future. The liability is discounted using a credit-adjusted risk-free rate of 4.25% and is being accreted throughout the estimated life of the related assets to equal the total estimated costs with a corresponding entry being recorded to interest expense.
Fair Value of Financial Instruments - The following methods and assumptions were used to estimate the fair values of each class of financial instruments:
Financial instruments consist primarily of cash and cash equivalents, accounts receivable, accounts payable, accrued expenses and long-term debt. The carrying amounts of cash and cash equivalents, accounts receivable,
10

accounts payable and accrued expenses approximate their fair value because of the nature of such instruments. Our interest rate swaps and foreign exchange contracts are fair valued with Level 2 inputs based on quoted market values for similar but not identical financial instruments.
Long-Term Debt - The fair value of our long-term debt is based on present rates for indebtedness with similar amounts, durations and credit risks.
Financial assets and liabilities are classified in their entirety based on the lowest level of input that is significant to the fair value measurement. Fair value accounting requires that these financial assets and liabilities be classified into one of the following three categories:
Subsequent Events - The Company has evaluated all subsequent events through February 26, 2015, the date the financial statements were available to be issued.
Recently Issued Accounting Standards - In May 2014, the Financial Accounting Standards Board (“FASB”) issued Accounting Standards Update (“ASU”) No. 2014-09, Revenue from Contracts with Customers (Topic 606) that requires companies to recognize revenue when a customer obtains control rather than when companies have transferred substantially all risks and rewards of a good or service. This update is effective for annual reporting periods beginning on or after December 15, 2016 and interim periods therein and requires expanded disclosures. We are currently assessing the impact the adoption of ASU 2014-09 will have on our consolidated financial statements.
3. ACCOUNTS RECEIVABLE, NET
Accounts receivable, net as of December 31, 2014 and 2013 consists of the following:
4. INVENTORY
Inventory as of December 31, 2014 and 2013 consists of the following:
11
• Level 1-inputs to the valuation methodology are quoted prices (unadjusted) for an identical asset or liability in an active market.
• Level 2-inputs to the valuation methodology include quoted prices for a similar asset or liability in an active market or
model-derived valuations in which all significant inputs are observable for substantially the full term of the asset or liability.
• Level 3-inputs to the valuation methodology are unobservable and significant to the fair value measurement of the asset or liability.
2014 2013 Trade receivables $24,691 $23,888 Other receivables 10,854 10,522
35,545 34,410 Allowance for doubtful accounts (88) (9)
Total $35,457 $34,401
2014 2013 Raw materials $ 6,413 $ 5,754 Finished goods 10,363 10,496 Stores inventory 26,461 25,460
Total $43,237 $41,710

5. PROPERTY, PLANT, AND EQUIPMENT, NET
Property, plant, and equipment as of December 31, 2014 and 2013 consists of the following:
Depreciation, depletion and amortization expense on property, plant and equipment was $21,235 and $22,723, for the years ended December 31, 2014 and 2013, respectively.
6. ACCRUED EXPENSES
Accrued expenses as of December 31, 2014 and 2013 consists of the following:
7. DEBT
Long-term debt as of December 31, 2014 and 2013 consists of the following:
12
2014 2013 Land and land improvements $ 192 $ 192 Depletable land 2,957 1,982 Buildings and building improvements 129,514 128,927 Internal-use computer software 4,468 4,141 Machinery and equipment 567,289 566,361
Total 704,420 701,603 Less accumulated depreciation, depletion and amortization (536,163) (531,191)
Total net book value 168,257 170,412 Construction in progress 33,145 22,865
Property, plant, and equipment, net $ 201,402 $ 193,277
2014 2013 Accrued freight costs $ 1,373 $ 464 Accrued energy costs 5,718 6,128 Accrued royalty costs 4,445 3,995 Accrued employee compensation 6,739 5,116 Accrued other taxes 4,608 4,154 Accrued derivatives 748 1,091 Other accruals 5,657 5,151
Total $29,288 $26,099
2014 2013 Variable Rate Demand Revenue Bonds, principal due October 1, 2018,
interest payable monthly, bearing monthly interest rate of 0.14% (2014) and 0.16% (2013) $ 11,400 $ 11,400
Variable Rate Demand Revenue Bonds, principal due August 1, 2017, interest payable monthly, bearing monthly interest rate of 0.14% (2014) and 0.16% (2013) 8,600 8,600
OCI Wyoming Credit Facility, unsecured principal due July 18, 2018, interest payable quarterly, bearing quarterly variable interest at 1.9781% (2014) and 1.996% (2013). 125,000 135,000
Total debt 145,000 155,000 Less current portion of long-term debt — —
Total long-term debt $145,000 $155,000

Aggregate maturities required on long-term debt at December 31, 2014 are as follows:
Revenue Bonds
The above revenue bonds require the Company to maintain standby letters of credit totaling $20,333 at December 31, 2014. These letters of credit require compliance with certain covenants, including minimum net worth, maximum debt to net worth, and interest coverage ratios. As of December 31, 2014, the Company was in compliance with these debt covenants.
OCI Wyoming Credit Facility
On July 18, 2013, the Company entered into a $190,000 senior unsecured revolving credit facility, as amended on October 30, 2014 (as amended, the “OCI Wyoming Credit Facility”), with a syndicate of lenders, which will mature on the fifth anniversary of the closing date of such credit facility. The OCI Wyoming Credit Facility provides for revolving loans to fund working capitalrequirements, capital expenditures, to consummate permitted acquisitions and for all other lawful Company purposes. The OCI Wyoming Credit Facility has an accordion feature that allows OCI Wyoming to increase the available revolving borrowings under the facility by up to an additional $75,000, subject to the Company receiving increased commitments from existing lenders or new commitments from new lenders and the satisfaction of certain other conditions. In addition, the OCI Wyoming Credit Facility includes a sublimit up to $20,000 for same-day swing line advances and a sublimit up to $40,000 for letters of credit. The Company’s obligations under the OCI Wyoming Credit Facility are unsecured.
The OCI Wyoming Credit Facility contains various covenants and restrictive provisions that limit (subject to certain exceptions) the Company’s ability to:
The OCI Wyoming Credit Facility also requires quarterly maintenance of a leverage ratio (as defined in the OCI Wyoming Credit Facility) of not more than 3.00 to 1.00 and a fixed charge coverage ratio (as defined in the OCI Wyoming Credit Facility) of not less than 1.10 to 1.00 for the 2014 and 2015 fiscal years, respectively and not less than 1.15 to 1.00 thereafter. The OCI Wyoming Credit Facility also requires that consolidated capital expenditures, as defined in the OCI Wyoming Credit Facility, not exceed $50 million in any fiscal year.
In addition, the OCI Wyoming Credit Facility contains events of default customary for transactions of this nature, including (i) failure to make payments required under the OCI Wyoming Credit Facility, (ii) events of default resulting from failure to comply with covenants and financial ratios in the OCI Wyoming Credit Facility, (iii) the occurrence of a change of control, (iv) the institution of insolvency or similar proceedings against OCI Wyoming and (v) the occurrence of a default under any other material indebtedness OCI Wyoming may have. Upon the occurrence and during the continuation of an event of default, subject to the terms and conditions of the OCI Wyoming Credit Facility, the lenders may terminate all outstanding commitments under the OCI Wyoming Credit Facility and may declare any outstanding principal of the OCI Wyoming Credit Facility debt, together with accrued and unpaid interest, to be immediately due and payable.
13
2017 $ 8,600 2018 136,400
Total $145,000
• make distributions on or redeem or repurchase units;
• incur or guarantee additional debt;
• make certain investments and acquisitions;
• incur certain liens or permit them to exist;
• enter into certain types of transactions with affiliates of the Company;
• merge or consolidate with another Company; and
• transfer, sell or otherwise dispose of assets.
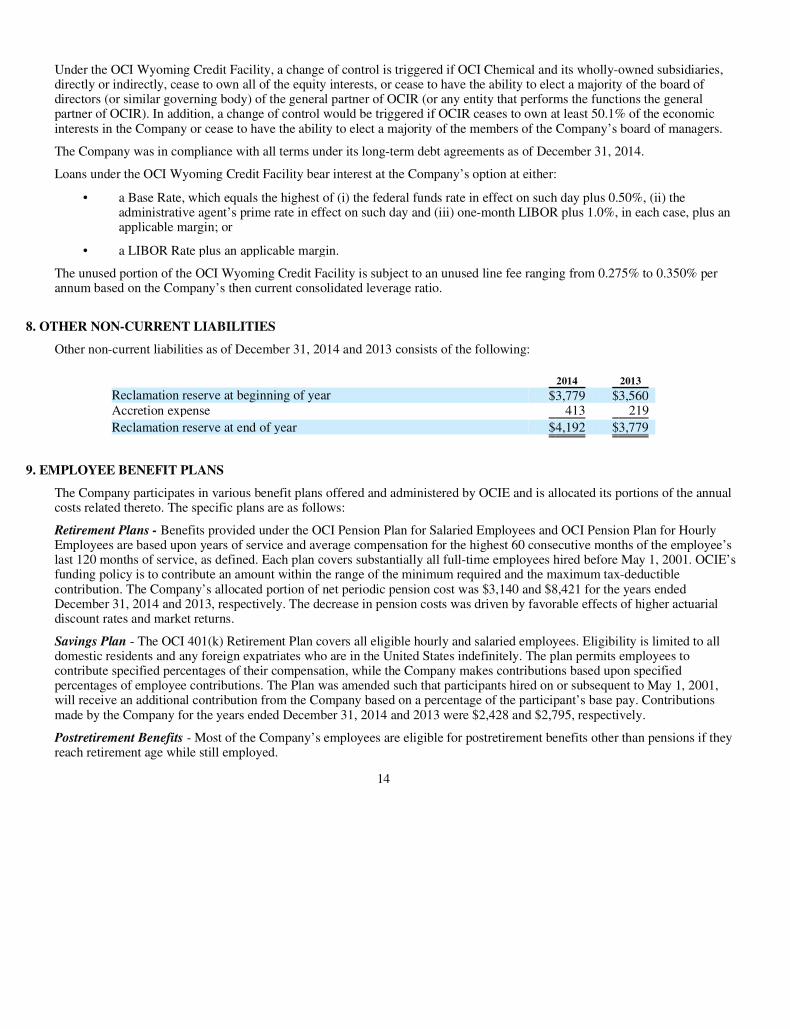
Under the OCI Wyoming Credit Facility, a change of control is triggered if OCI Chemical and its wholly-owned subsidiaries, directly or indirectly, cease to own all of the equity interests, or cease to have the ability to elect a majority of the board of directors (or similar governing body) of the general partner of OCIR (or any entity that performs the functions the general partner of OCIR). In addition, a change of control would be triggered if OCIR ceases to own at least 50.1% of the economic interests in the Company or cease to have the ability to elect a majority of the members of the Company’s board of managers.
The Company was in compliance with all terms under its long-term debt agreements as of December 31, 2014.
Loans under the OCI Wyoming Credit Facility bear interest at the Company’s option at either:
The unused portion of the OCI Wyoming Credit Facility is subject to an unused line fee ranging from 0.275% to 0.350% per annum based on the Company’s then current consolidated leverage ratio.
8. OTHER NON-CURRENT LIABILITIES
Other non-current liabilities as of December 31, 2014 and 2013 consists of the following:
9. EMPLOYEE BENEFIT PLANS
The Company participates in various benefit plans offered and administered by OCIE and is allocated its portions of the annual costs related thereto. The specific plans are as follows:
Retirement Plans - Benefits provided under the OCI Pension Plan for Salaried Employees and OCI Pension Plan for Hourly Employees are based upon years of service and average compensation for the highest 60 consecutive months of the employee’s last 120 months of service, as defined. Each plan covers substantially all full-time employees hired before May 1, 2001. OCIE’s funding policy is to contribute an amount within the range of the minimum required and the maximum tax-deductible contribution. The Company’s allocated portion of net periodic pension cost was $3,140 and $8,421 for the years ended December 31, 2014 and 2013, respectively. The decrease in pension costs was driven by favorable effects of higher actuarial discount rates and market returns.
Savings Plan - The OCI 401(k) Retirement Plan covers all eligible hourly and salaried employees. Eligibility is limited to all domestic residents and any foreign expatriates who are in the United States indefinitely. The plan permits employees to contribute specified percentages of their compensation, while the Company makes contributions based upon specified percentages of employee contributions. The Plan was amended such that participants hired on or subsequent to May 1, 2001, will receive an additional contribution from the Company based on a percentage of the participant’s base pay. Contributions made by the Company for the years ended December 31, 2014 and 2013 were $2,428 and $2,795, respectively.
Postretirement Benefits - Most of the Company’s employees are eligible for postretirement benefits other than pensions if they reach retirement age while still employed.
14
• a Base Rate, which equals the highest of (i) the federal funds rate in effect on such day plus 0.50%, (ii) the
administrative agent’s prime rate in effect on such day and (iii) one-month LIBOR plus 1.0%, in each case, plus an applicable margin; or
• a LIBOR Rate plus an applicable margin.
2014 2013 Reclamation reserve at beginning of year $3,779 $3,560 Accretion expense 413 219
Reclamation reserve at end of year $4,192 $3,779

OCIE accounts for postretirement benefits on an accrual basis over an employee’s period of service. The postretirement plan, excluding pensions, are not funded, and OCIE has the right to modify or terminate the plan. Effective January 1, 2013, the postretirement benefits for non-grandfathered retirees were amended to replace the medical coverage for post-65-year-old members with a fixed dollar contribution amount. As a result of the amendment, the accumulated and projected benefit obligation for OCIE’s postretirement benefits decreased by $8.7 million and resulted in a prior service credit of $7.7 million which will be recognized as a reduction of net periodic postretirement benefit costs in future years. The Company’s allocated portion of postretirement benefit costs was income of $260 and $55 for the years ended December 31, 2014 and 2013, respectively.
10. COMMITMENTS AND CONTINGENCIES
The Company leases mineral rights from the U.S. Bureau of Land Management, the state of Wyoming, Rock Springs Royalty Corp., a wholly owned subsidiary of Anadarko Holding Company (AHC), and other private parties. All of these leases provide for royalties based upon production volume. The remaining leases provide for minimum lease payments as detailed in the table below. The Company has a perpetual right of first refusal with respect to these leases and intends to continue renewing the leases as has been its practice.
The Company entered into a 10 year rail yard switching and maintenance agreement with a third party, Watco Companies, LLC, on December 1, 2011. Under the agreement, Watco provides rail-switching services at the Company’s rail yard. The Company’s rail yard is constructed on land leased by Watco from Rock Springs Grazing Association and Anadarko Land Corp; the Rock Springs Grazing Association land lease is renewable every 5 years for a total period of 30 years, while the Anadarko Land Corp. lease is perpetual. The Company has an option agreement with Watco to assign these leases to the Company at any time during the land lease term.
The Company entered into a 10 year track lease agreement with Union Pacific Company for certain rail track used in connection with the rail yard.
OCICC, on behalf of the Company, typically enters into operating lease contracts with various lessors for railcars to transport product to customer locations and warehouses. Rail car leases under these contractual commitments range for periods from 1 to 10 years. OCICC’s obligations related to these rail car leases are $9,664 in 2015, $7,153 in 2016, $5,665 in 2017, $4,402 in 2018, $3,585 in 2019 and $4,421 in 2020 and thereafter.
As of December 31, 2014, the total minimum rental commitments under the Company’s various operating leases, including renewal periods are as follows:
From time to time, the Company has various litigation, claims, and assessments that arise in the normal course of business. Management does not believe, based upon its evaluation and discussion with counsel, that the ultimate outcome of any current matters, individually or in the aggregate, would have a material effect on the Company’s financial position, results of operations, or cash flows.
Off-Balance Sheet Arrangements - The Company has a self-bond agreement with the Wyoming Department of Environmental Quality under which we commit to pay directly for reclamation costs. As of December 31, 2014, the amount of the bond was $33,875, which is the amount we would need to pay the State of Wyoming for reclamation costs if we cease mining operations currently. The amount of this self-bond increased in August 2013 and is subject to change upon periodic re-evaluation by the Land Quality Division.
15
Leased Land Track Lease Total 2015 $ 75 $ 33 $ 108 2016 75 33 108 2017 75 33 108 2018 75 33 108 2019 75 33 108
2020 and thereafter 1,575 66 1,641
Total $ 1,950 $ 231 $2,181

11. AFFILIATES TRANSACTIONS
OCICC is the exclusive sales agent for the Company and through its membership in ANSAC, OCICC is responsible for promoting and increasing the use and sale of soda ash and other refined or processed sodium products produced. All actual sales and marketing costs incurred by OCICC are charged directly to the Company. Selling, general and administrative expenses also include amounts charged to the Company by OCIE, OCICC, and OCIR principally consisting of salaries, benefits, office supplies, professional fees, travel, rent and other costs of certain assets used by the Company. These transactions do not necessarily represent arm’s length transactions and may not represent all costs if the Company operated on a standalone basis.
The total costs charged to the Company by affiliates for the years ended December 31, 2014 and 2013 are as follows:
ANSAC allocates its expenses to ANSAC’s members using a pro rata calculation based on sales.
Cost of products sold includes logistics services charged by ANSAC. For the years ended December 31, 2014 and 2013 these costs were $9,194 and $6,692, respectively.
Net sales to affiliates for the years ended December 31, 2014 and 2013 are as follows:
As of December 31, 2014 and 2013, the Company had receivables and payables representing arm’s length transactions with affiliated entities as follows:
16
2014 2013 OCIE $ 8,955 $ 5,537 OCICC 3,415 4,387 ANSAC 2,930 2,582 OCIR 892 —
Total selling, general and administrative expenses - affiliates $16,192 $12,506
2014 2013 ANSAC $230,762 $200,413 OCI Alabama LLC 5,923 7,282 OCI Company Limited — 3,950
Total $236,685 $211,645
2014 2013
Receivables from
Affiliates Payables toAffiliates
Receivables fromAffiliates
Payables toAffiliates
OCIE $ 1,594 $ 2,848 $ 110 $ 252 OCICC 8,268 1,171 10,460 — OCI Chemical Europe NV 9,183 — 7,822 — OCI Company Limited — — 1,919 — Other 444 1,328 83 123
Total $ 19,489 $ 5,347 $ 20,394 $ 375

12. MAJOR CUSTOMERS AND SEGMENT REPORTING
Our operations are similar in nature of products we provide and type of customers we serve. As the Company earns substantially all of its revenues through the sale of soda ash mined at a single location, we have concluded that we have one operating segment for reporting purposes. The net sales by geographic area for the years ended December 31, 2014 and 2013 are as follows:
The Company’s largest customer by sales is ANSAC. There were no other customers who individually accounted for ten percent or more of total net sales for the years ended December 31, 2014 and 2013.
13. SUBSEQUENT EVENTS
On January 15, 2015, the members of the board of managers of OCI Wyoming LLC approved the payment on January 16, 2015 of a cash distribution to the general partners and the limited partners in the aggregate amount of $22,250.
In February 2015, the Company entered into a natural gas forward contract with a notional value of approximately $17,568 and maturity dates ranging from 2015 to 2020, to mitigate volatility in the gas prices. The maturity of the notional value is $911 in 2015, $2,889 in 2016, $3,179 in 2017, $3,385 in 2018, $3,552 in 2019 and $3,652 in 2020.
******
17
2014 2013 Domestic $194,801 $195,062 International:
ANSAC 230,762 200,413 Other 39,469 46,657
Total international 270,231 247,070
Total net sales $465,032 $442,132
W

WN
Partnership Headquarters
601 Jefferson Street Suite 3600 Houston, TX 77002 713.751.7507
Operations Headquarters
5260 Irwin Road Huntington, WV 25705 304.522.5757
Investor Relations
Kathy Roberts 601 Jefferson Street Suite 3600 Houston, TX 77002 713.751.7555 Email: [email protected]
Stock Exchange
Our units are listed on the New York Stock Exchange under the symbol NRP.
Independent Auditors
Ernst & Young LLP 5 Houston Center 1401 McKinney, Suite 1200 Houston, TX 77001-2007
Transfer Agent & Registrar
American Stock Transfer and Trust Company Client Operations 6201 15th Avenue Brooklyn, NY 11219 Website: www.amstock.com Email: [email protected] 800.937.5449
Website
www.nrplp.com
Information regarding Natural Resource Partners L.P. is located on the partnership’s website. On the site are operational and financial information as well as all SEC filings and our corporate governance documents, including our Code of Business Conduct and Ethics, our Corporate Governance Guidelines and all Board of Directors’ Committee Charters. Requests for copies of the annual report or other data may be made through the website or by contacting Investor Relations free of charge.
Contact NRP Board
We have established procedures for contacting the non-management members of the NRP Board of Directors. To communicate any concerns or issues to the Board of Directors, please direct any correspondence to:
Chairman of the CNG Committee NRP Board of Directors 601 Jefferson, Suite 3600 Houston, TX 77002
Schedule K-1
Unitholders receive Schedule K-1 packages that summarize their allocated share of the partnership’s reportable tax items for the calendar year. Generally, these K-1s are available on NRP’s website no later than the end of February. Unitholders should refer questions regarding their Schedule K-1 to the following:
Natural Resource Partners L.P. Tax Package Support P.O. Box 799060 Dallas, TX 75379-9060 Fax: 1.866.554.3842 Toll Free: 1.888.334.7102
Forward-Looking Statements
Statements included in this annual report may constitute forward-looking statements. In addition, we and our representatives may from time to time make other oral or written statements which are also forward-looking statements.
Such forward-looking statements include, among other things, statements regarding capital expenditures and acquisitions, expected commencement dates of mining, projected quantities of future production by our lessees producing from our reserves, and projected demand or supply for coal, trona, soda ash, aggregates and oil and gas that will affect sales levels, prices and royalties realized by us.
These forward-looking statements speak only as of the date hereof and are made based upon management’s current plans, expectations, estimates, assumptions and beliefs concerning future events impacting us and therefore involve a number of risks and uncertainties. We caution that forward-looking statements are not guarantees and that actual results could differ materially from those expressed or implied in the forward-looking statements.
You should not put undue reliance on any forward-looking statements. Please read “Item 1A. Risk Factors” of the Form 10-K for important factors that could cause our actual results of operations or our actual financial condition to differ.
Unitholder Information
Design: Savage Brands, Houston TX

Natural Resource Partners L.P.
601 Jefferson StreetSuite 3600
Houston, TX 77002
www.nrplp.com