Embed Size (px)
Citation preview
ED 417 865
AUTHORTITLEINSTITUTIONISBNISSNPUB DATENOTE
AVAILABLE FROM
PUB TYPEEDRS PRICEDESCRIPTORS
IDENTIFIERS
ABSTRACT
DOCUMENT RESUME
PS 026 445
Bellamy, CarolThe State of the World's Children 1998: Focus on Nutrition.United Nations Children's Fund, New York, NY.ISBN-0-19-829401-8ISSN-0265-718X1998-00-00135p.; For 1997 report, see ED 407 108; for 1997 summaryreport, see ED 407 109.UNICEF, UNICEF House, 3 UN Plaza, New York, NY 10017; WorldWide Web: http:// www.unicef.org; e-mail: [email protected] - Descriptive (141)MF01/PC06 Plus Postage.Child Health; Childhood Needs; *Children; Developed Nations;Developing Nations; Foreign Countries; Hunger; *Nutrition;Poverty; Statistical Surveys; *Well BeingIndicators; UNICEF; United Nations Convention on Rights ofthe Child; World Summit for Children 1990
This report on the well-being of the world's childrenfocuses on the issue of malnutrition and its impact on children's lives.Chapter 1: (1) discusses the incidence of malnutrition and the complexinterplay of factors that Jause malnutrition, including poor health servicesand discrimination against women; (2) presents several approaches toameliorating malnutrition, including community involvement, foodfortification, growth monitoring and promotion, and supplementation programs;and (3) spotlights some of the scientific breakthroughs reducingmalnutrition. Chapter 2 provides statistics related to basic indicators fornutrition, health, education, demographics, economic indicators and thesituation of women, rates of progress, and regional summaries for 193countries (listed alphabetically). It also lists countries in descendingorder of their estimated 1996 under-5 mortality rates. Included throughoutthe report are panel sections highlighting specific nutrition programs orscientific findings. Seven "Spotlights" feature information on the World FoodSummit, breastfeeding, and several nutrients. (Contains approximately 68references). (KB)
*********************.A*********************************************************** Reproductions supplied by EDRS are the best that can be made *
* from the original document. *
********************************************************************************

U S DEPARTMENT OF EDUCATIONOffice of Educational Research and Improvement
EDUCATIONAL RESOURCES INFORMATIONNieCENTER (ERIC)
This document has been reproduced asceived from the person or organization
originating it
0 Minor changes have been made toimprove reproduction quality
Points of view or opinions stated in thisdocument do not necessarily representofficial OERI position or policy
PERMISSION TO REPRODUCE ANDDISSEMINATE THIS MATERIAL
HAS BEEN GRANTED BY
tc,\($3,(\ C\kdeNN\mqe.\\
TO THE EDUCATIONAL RESOURCESINFORMATION CENTER (ERIC)
BF 1 t

THE STATE OF THE WORLD'S CHILDREN1998

Oxford University Press, Walton Street,
Oxford, OX2 6DP, Oxfordshire, UK.
Oxford, New York, Toronto, Delhi, Bombay,
Calcutta, Madras, Karachi, Kuala Lumpur,
Singapore, Hong Kong, Tokyo, Nairobi,
Dar es Salaam, Cape Town, Melbourne,
Auckland and associated companies in
Berlin and Ibadan.
Oxford is a trade mark of Oxford
University Press.
Published in the United States by
Oxford University Press, New York.
Any part of THE STATE OF THE WORLD'S CHILDREN
may be freely reproduced with the appropriate
acknowledgement.
British Library Cataloguing in
Publication Data
The state of the world's children 1998
1. Children Care and hygiene
613'0432 R1101
ISBN 0-19-829401-8
ISSN 0265-718X
The Library of Congress has catalogued this
serial publication as follows:
The state of the world's children Oxford and
New York: Oxford University Press
for UNICEF
v.; ill.; 20cm. Annual. Began publication
in 1980.
I. Children Developing countries Periodicals.
2. Children Care and hygiene Developing
countries Periodicals. I. UNICEF.
HQ 792.2. S73 83-647550 362.7'1'091724
UNICEF, UNICEF House, 3 UN Plaza,
New York, NY 10017, USA.
E-mail: [email protected]
Web site: www.unicef.org
UNICEF, Palais des Nations, CH-1211,
Geneva 10, Switzerland.
Cover photo
India, 1996, 96- 0163/Dominica
Back cover photo
Sudan, 1993, UNICEF/93-1007/Press
4

THE STATEOF THE WORLD'S
CHILDREN1998
Carol Bellamy, Executive Director,United Nations Children's Fund
unicefUnited Nations Children's Fund
Published for UNICEF by
Oxford University Press

Contents
Foreword by Kofi A. Annan, Secretary-General of the United Nations 6
Chapter IMalnutrition: Causes, consequences and solutions 7
Malnutrition is rarely regarded as an emergency; the children affected are not facing famine and betray few orno obvious signs. Yet the largely invisible crisis of malnutrition is implicated in more than half of all childdeaths worldwide and violates children's rights in profound ways, compromising their physical and mentaldevelopment and helping perpetuate poverty. More widespread than many suspect with one out of everythree children affected malnutrition lowers the productivity and abilities of entire societies. This chapterexamines the scale of this intractable tragedy, the approaches that are helping resolve it and the new light thatscientific research is shedding on it.
The silent emergency: In this section, the scale of malnutrition and the complex interplay of factors that 9cause it, including poor health services and discrimination against women, are presented.
Approaches that work: Community involvement, food fortification, growth monitoring and promotion, 37supplementation programmes these are some of the many and often overlapping approaches that arechanging, and saving, children's lives.
Bringing science to bear: Vitamin A reduced maternal death rates by 44 per cent on average, according to 71
a recent study. This section spotlights some of the breakthroughs that science is making in the fight for betternutrition.
Chapter IIStatistical tables 91
Statistics, vital indicators of the care, nurture and resources that children receive in their communities andcountries, help chart progress towards the goals set at the 1990 World Summit for Children. The eight tablesin this report have been expanded to give the broadest possible coverage of important basic indicators for nu-trition, health, education, demographics, economic indicators and the situation of women, plus rates ofprogress and regional summaries. They also include complete data, as available, on less populous countries,covering 193 countries in all, listed alphabetically. Countries are shown on page 93 in descending order oftheir estimated 1996 under-five mortality rates, which is also the first basic indicator in table 1.
Panels
1 VITAMIN A SUPPLEMENTS SAVE PREGNANT WOMEN'S LIVES 12
2 WHAT IS MALNUTRITION? 14
3 STUNTING LINKED TO IMPAIRED INTELLECTUAL DEVELOPMENT 16
4 RECOGNIZING THE RIGHT TO NUTRITION 20
5 GROWTH AND SANITATION: WHAT CAN WE LEARN FROM CHICKENS? 26
6 BREASTMILK AND TRANSMISSION OF HIV 30
7 HIGH-ENERGY BISCUITS FOR MOTHERS BOOST INFANT SURVIVAL BY 50 PER CENT 32
8 UNICEF AND THE WORLD FOOD PROGRAMME 38
9 TRIPLE A TAKES HOLD IN OMAN 40
10 CELEBRATING GAINS IN CHILDREN'S HEALTH IN BRAZIL 42
11 REWRITING ELIAS'S STORY IN MBEYA 6 44
4

12 WOMEN IN NIGER TAKE THE LEAD AGAINST MALNUTRITION 46
13 BFHI: BREASTFEEDING BREAKTHROUGHS 50
14 TACKLING MALNUTRITION IN BANGLADESH 52
15 KIWANIS MOBILIZE TO END IODINE DEFICIENCY'S DEADLY TOLL 56
16 INDONESIA MAKES STRIDES AGAINST VITAMIN A DEFICIENCY 62
17 MAKING FOOD ENRICHMENT PROGRAMMES SUSTAINABLE 64
18 ZINC AND VITAMIN A: TAKING THE STING OUT OF MALARIA 74
19 PROTECTING NUTRITION IN CRISES 80
20 PROGRESS AGAINST WORMS FOR PENNIES 84
21 CHILD NUTRITION A PRIORITY FOR THE NEW SOUTH AFRICA 86
SpotlightsWORLD FOOD SUMMIT 39
TEN STEPS TO SUCCESSFUL BREASTFEEDING 49
VITAMIN A 76
ZINC 77
IRON 78
IODINE 79
FOLATE 83
Text figuresFIG. 1 MALNUTRITION AND CHILD MORTALITY 11
FIG. 2 TRENDS IN CHILD MALNUTRITION, BY REGION 18
FIG. 3 FROM GOOD NUTRITION TO GREATER PRODUCTIVITY AND BEYOND 19
FIG. 4 POVERTY AND MALNUTRITION IN LATIN AMERICA AND THE CARIBBEAN 21
FIG. 5 CAUSES OF CHILD MALNUTRITION 24
FIG. 6 INADEQUATE DIETARY INTAKE/DISEASE CYCLE 25
FIG. 7 INTERGENERATIONAL CYCLE OF GROWTH FAILURE 34
FIG. 8 BETTER NUTRITION THROUGH TRIPLE A 41
FIG. 9 IODINE DEFICIENCY DISORDERS AND SALT IODIZATION 55
FIG. 10 PROGRESS IN VITAMIN A SUPPLEMENTATION PROGRAMMES 59
FIG. 11 MEASLES DEATHS AND VITAMIN A SUPPLEMENTATION 72
FIG. 12 ZINC SUPPLEMENTATION AND CHILD GROWTH (ECUADOR, 1986) 73
FIG. 13 MATERNAL HEIGHT AND CAESAREAN DELIVERY (GUATEMALA, 1984-1986) 75
References 88
Index 128
Glossary 131
5

Foreword
To look into some aspects of the future, we do not need projections by supercomputers.
Much of the next millennium can be seen in how we care for our children today.
Tomorrow's world may be influenced by science and technology; but more than
anything, it is already taking shape in the bodies and minds of our children.
In The State of the World's Children 1998, UNICEF the only United Nations agency
dedicated exclusively to children spells out a simple but most pressing truth. Sound nutrition
can change children's lives, improve their physical and mental development, protect their health
and lay a firm foundation for future productivity.
Over 200 million children in developing countries under the age of five are malnourished.
For them, and for the world at large, this message is especially urgent. Malnutrition contributes to
more than half of the nearly 12 million under-five deaths in developing countries each year.
Malnourished children often suffer the loss of precious mental capacities. They fall ill more often.
If they survive, they may grow up with lasting mental or physical disabilities.
This human suffering and waste happen because of illness much of it preventable: because
breastfeeding is stopped too early; because children's nutritional needs are not sufficiently under-
stood; because long-entrenched prejudices imprison women and children in poverty.
The world knows what is needed to end malnutrition. With a strong foundation of cooperation
between local communities, non-governmental organizations, governments and international
agencies, the future and the lives of our children can take the shape we want and they deserve,
of healthy growth and development, greater productivity, social equity and peace.
Kofi A. Annan
Secretary-General of the United Nations
a6

Chapter I
Malnutrition: Causes,consequences and solutions
A healthy baby girl waits in a maternal and child health centre in Benin.
7
o-r
sp)r ")It'
0-- -Aiti
ak,
,
1.
I I

The silent emergency
/t is implicated in more than half ofall child deaths worldwide a
proportion unmatched by any in-fectious disease since the Black Death.Yet it is not an infectious disease.
Its ravages extend to the millionsof survivors who are left crippled,chronically vulnerable to illnessand intellectually disabled.
It imperils women, families and,ultimately, the viability of whole soci-eties. It undermines the struggle of theUnited Nations for peace, equity andjustice. It is an egregious violation ofchild rights that undermines virtuallyevery aspect of UNICEF's work forthe survival, protection and full devel-opment of the world's children.
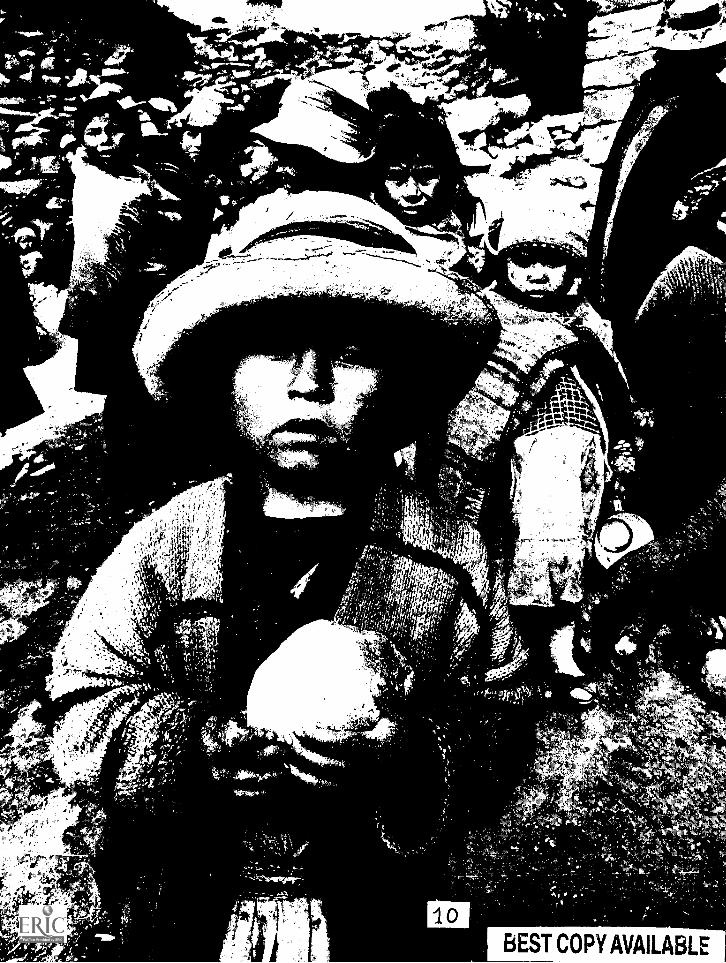
Yet the worldwide crisis of malnu-trition has stirred little public alarm,despite substantial and growing scien-tific evidence of the danger. More at-tention is lavished on the gyrations ofworld stock markets than on malnutri-tion's vast destructive potential oron the equally powerful benefits ofsound nutrition, including mountingevidence that improved nutrition,such as an adequate intake of vitaminA and iodine, can bring profound ben-efits to entire populations.
Malnutrition is a silent emergency.But the crisis is real, and its persis-
Photo: Improved nutrition brings profound
benefits. A Bolivian girl holds a piece of bread.
tence has profound and frighteningimplications for children, society andthe future of humankind.
Malnutrition is not, as many think,a simple matter of whether a child cansatisfy her appetite. A child who eatsenough to satisfy immediate hungercan still be malnourished.
And malnutrition is not just a silentemergency it is largely an invisibleone as well. Three quarters of the chil-dren who die worldwide of causesrelated to malnutrition are what nutri-tionists describe as mildly to moderatelymalnourished and betray no outwardsigns of problems to a casual observer.
Malnutrition's global toll is alsonot mainly a consequence of famines,wars and other catastrophes, as iswidely thought; in fact, such eventsare responsible for only a tiny part ofthe worldwide malnutrition crisis. Butsuch emergencies, like the ongoingcrises in the Great Lakes region ofCentral Africa and in the DemocraticPeople's Republic of Korea, oftenresult in the severest forms of malnu-trition. Meeting food needs in thesesituations is essential, but so is protect-ing people from illness and ensuringthat young children and other vulner-able groups receive good care.
Child malnutrition is not confinedto the developing world. In someindustrialized countries, widening in-come disparities, coupled with reduc-
1
More attention is lavished onthe gyrations of world stockmarkets than on malnutrition'svast destructive potentialor on the equally powerfulbenefits of sound nutrition.
9

Reducing malnutrition should he an urgentglobal priority; inaction is a scandalousaffront to the human right to survival.A malnourished child with his motherin Afghanistan.
10
tions in social protection, are havingworrying effects on the nutritionalwell-being of children.
Whatever the misconceptions, thedimensions of the malnutrition crisisare clear. It is a crisis, first and fore-most, about death and disability of chil-dren on a vast scale, about women whobecome maternal mortality statisticspartly because of nutritional deficien-cies and about social and economiccosts that strangle development andsnuff out hope.
Malnutrition has long been recog-nized as a consequence of poverty. Itis increasingly clear that it is also a cause.
In some parts of the world, notablyLatin America and East Asia, therehave been dramatic gains in reducingchild malnutrition. But overall, theabsolute number of malnourished chil-dren worldwide has grown.
Half of South Asia's children are mal-nourished. In Africa, one of every threechildren is underweight, and in sev-eral countries of the continent, the nu-tritional status of children is worsening.
Malnourished children are muchmore likely to die as a result of a com-mon childhood disease than thosewho are adequately nourished. Andresearch indicates a link between mal-nutrition in early life including theperiod of foetal growth and the de-velopment later in life of chronic con-ditions like coronary heart disease,diabetes and high blood pressure, giv-ing the countries in which malnutri-tion is already a major problem newcause for concern.
The most critically vulnerablegroups are developing foetuses, chil-dren up to the age of three and womenbefore and during pregnancy andwhile they are breastfeeding. Amongchildren, malnutrition is especiallyprone to strike those who lack nutri-tionally adequate diets, are not pro-tected from frequent illness and donot receive adequate care.
12
Illness is frequently a consequenceof malnutrition and malnutrition isalso commonly the result of illness.Malaria, a major cause of child deathsin large parts of the world, also takesa major toll on child growth and de-velopment. In parts of Africa wheremalaria is common, about one third ofchild malnutrition is caused by malaria.The disease also has dangerous nutri-tional consequences for pregnantwomen. In addition, pregnant womenare more susceptible to malaria, andchildren born to mothers with malariarun a greater chance of being bornunderweight and anaemic.
There is no one kind of malnutri-tion. It can take a variety of forms thatoften appear in combination and con-tribute to each other, such as protein-energy malnutrition, iodine deficiencydisorders and deficiencies of iron andvitamin A, to name just a few.
Many involve deficiencies of `rni-cronutrients' substances like vita-min A and iodine that the human bodycannot make itself but that are needed,often in only tiny amounts, to orches-trate a whole range of essential physi-ological functions.
Each type of malnutrition is the re-sult of a complex interplay of factorsinvolving such diverse elements ashousehold access to food, child andmaternal care, safe water and sanitationand access to basic health services.
And each wreaks its own particu-lar kind of havoc on the human body.
Iodine deficiency can damage in-tellectual capacity; anaemia is a factorin the pregnancy and childbirth com-plications that kill 585,000 womenannually; folate deficiency in expec-tant mothers can cause birth defects ininfants, such as spina bifida; and vita-min D deficiency can lead to poorbone formation, including rickets.
Vitamin A deficiency, which af-fects about 100 million young chil-dren worldwide, was long known to

cause blindness. But it has become in-creasingly clear that even mild vita-min A deficiency also impairs theimmune system, reducing children'sresistance to diarrhoea, which kills2.2 million children a year, andmeasles, which kills nearly 1 millionannually. And new findings stronglysuggest that vitamin A deficiency is acause of maternal mortality as well,especially among women in impover-ished regions (Panel 1).
At its most basic level, malnutri-tion is a consequence of disease andinadequate dietary intake, which usu-ally occur in a debilitating and oftenlethal combination. But many moreelements social, political, economic,cultural are involved beyond thephysiological.
Discrimination and violence againstwomen are major causes of malnutrition.
Women are the principal providersof nourishment during the most cru-cial periods of children's develop-ment, but the caring practices vital tochildren's nutritional well-being in-variably suffer when the division oflabour and resources in families andcommunities favours men, and whenwomen and girls face discriminationin education and employment.
A lack of access to good educationand correct information is also a causeof malnutrition. Without informationstrategies and better and more acces-sible education programmes, the aware-ness, skills and behaviours neededto combat malnutrition cannot bedeveloped.
There is, in short, nothing simpleabout malnutrition except perhapsthe fact of how vast a toll it is taking.
Of the nearly 12 million childrenunder five who die each year in de-veloping countries mainly from pre-ventable causes, the deaths of over6 million, or 55 per cent, are eitherdirectly or indirectly attributable tomalnutrition (Fig. 1).
Some 2.2 million children die fromdiarrhoeal dehydration as a result ofpersistent diarrhoea that is often ag-gravated by malnutrition.
And anaemia has been identifiedas a contributing factor, if not a prin-cipal cause, in 20 per cent to 23 percent of all post-partum maternaldeaths in Africa and Asia: an estimatemany experts regard as conservative.
If there were no other conse-quences of malnutrition, these horrificstatistics would be more than enoughto make its reduction an urgent globalpriority and inaction a scandalousaffront to the human right to survival.
But the issue goes beyond childsurvival and maternal mortality andmorbidity. Malnourished children,unlike their well-nourished peers, notonly have lifetime disabilities andweakened immune systems, but theyalso lack the capacity for learning thattheir well-nourished peers have.
In young children, malnutritiondulls motivation and curiosity and re-duces play and exploratory activities.These effects, in turn, impair mentaland cognitive development by reduc-ing the amount of interaction childrenhave both with their environment, andwith those who provide care.
Malnutrition in an expectant mother,especially iodine deficiency, can pro-duce varying degrees of mental retar-dation in her infant.
In infancy and early childhood,iron deficiency anaemia can delaypsychomotor development and impaircognitive development, lowering IQby about 9 points.
Anaemic pre-schoolers have beenfound to have difficulty in maintainingattention and discriminating betweenvisual stimuli. Poor school achieve-ment among primary school and ado-lescent children has also been linkedto iron deficiency.'
Low-birthweight babies have IQsthat average 5 points below those of
0 13
Fig. 1 Malnutrition and childmortality
If a child is even mildly underweight, the mortality
risk is increased. WHO estimates that malnutrition
was associated with over half of all child deaths
that occurred in developing countries in 1995.
Perinatalcauses
18%
Acute respiratoryinfections (ARI)
19%
Diarrhoea19%
Malnutrition55%
Other32%
Malaria5%
Source: WHO, based on C.J.L. Murray and A.D. Lopez, The
Global Burden of Disease, Harvard University Press,
Cambridge (USA), 1996; and D.L. Pelletier, E.A. Frongillo and
J.P. Habicht, 'Epidemiological evidence for a potentiating
effect of malnutrition on child mortality', in American Journal
of Public Health, 1993:83.
I I

Panel 1
Vitamin A supplements savepregnant women's lives
Each year, nearly 600,000 womendie worldwide from pregnancy-related causes. Prenatal vitamin
A supplements will help reduce thismassive toll, according to prelimi-nary results from a major new study.By measuring the impact of lowweekly doses of the vitamin on thehealth and survival of pregnantwomen in southern Nepal, the studyfound that deaths among women re-ceiving either low-dose vitamin A orbeta-carotene supplements droppeddramatically, by an average 44 per cent.
Like many parts of the developingworld, Nepal has a notoriously highmaternal mortality rate 125 timesthat of the United States and vita-min A deficiency is common, par-ticularly among pregnant women.Night-blindness, long ignored by themedical establishment and viewedby women as a routine consequenceof pregnancy, but in reality a worry-ing sign of vitamin A deficiency, de-
12
velops in 10 to 20 per cent of preg-nant women.
Researchers from Johns HopkinsUniversity in the United States andthe National Society for Eye Healthand Blindness Prevention in Nepal,supported by the United StatesAgency for International Develop-ment (USAID) and Task Force Sightand Life, based in Switzerland, con-ducted the study to see whethermaternal, foetal or infant mortalitycould be lowered by providing wo-men of childbearing age one low-dose vitamin A capsule each week.Night-blindness and anaemia in wo-men in the study and birth defectsin their infants were also carefullyinvestigated.
Approximately 44,000 young mar-ried women, nearly half of whom be-came pregnant during the study,were given either vitamin A supple-ments' or placebos. The supplementswere in the form of either pure vita-
14
min A or beta-carotene, the vitaminA-active ingredient found in fruitsand vegetables that the body con-verts to vitamin A.
Among the women receiving purevitamin A there were 38 per centfewer deaths and among those re-ceiving beta-carotene there were 50per cent fewer deaths, during preg-nancy and the three months follow-ing childbirth, than among womenreceiving no supplements.b Anaemia,which is usually associated with irondeficiency and which is known to bea contributing cause of maternaldeaths, was a surprising 45 per centlower in the women receiving sup-plements who were not infected withhookworm.
Women suffering from night-blindness (an inability to see at duskor in dim light) were found to bemore likely to get infections, to beanaemic and underweight and tobe at greater risk of death. Night-blindness was reduced by 38 percent and 16 per cent, respectively, inthe vitamin A and beta-carotenegroups, leaving questions about themost appropriate mix of nutrients,and the amounts needed, to preventthe condition. No reduction in foetalor infant mortality through sixmonths of age was apparent in chil-dren born to women in the study.
The scientists have not yet com-pleted analysing the effects of sup-plements on the different causes ofmaternal deaths. However, deathsfrom infection are one importantcause of high maternal mortalityrates, and vitamin A is known to beessential for the effective functioningof the immune system that reducesthe severity of infection.
The results of this study indicatethat where vitamin A deficiency iscommon, the regular and adequate

intake of vitamin A' or beta-carotene by women during theirreproductive years can markedlyreduce their risk of pregnancy-related mortality. Adequate intakeof vitamin A may also dramaticallyreduce anaemia in pregnant wo-men if combined with deworming.
This study helps highlight theurgent need to improve the nutri-tion of girls and women as part ofa multi-pronged approach to re-duce the tragedy of maternal mor-tality in the developing world andopens the way to new preventionstrategies that can be widely im-plemented in the near future.
NOTES
a. The low-dose supplements contained7,000 Ng of retinol equivalents (RE)(23,300 IU) of vitamin A, or a similaramount of beta-carotene, which isapproximately equivalent to a woman'sweekly requirement.
b. Deaths were reduced from 713 per100,000 pregnancies in the group ofwomen not receiving supplements to 443and 354 deaths per 100,000 respectivelyin women receiving the weekly vitaminA and beta-carotene supplements.
c. Although found in many foods,vitamin A has powerful biological effectsand care is essential to prevent themisuse of supplements, especially bypregnant women. High-dose (200,000 IU)vitamin A supplements of the typeroutinely provided at four to six monthlyintervals to young children in developingcountries should never be taken bywomen of childbearing age because ofthe risk of possible harm to a developingfoetus. High-dose supplements may,however, be safely given to womenwithin eight weeks following childbirth.Low-dose weekly vitamin A supple-ments, like those given in this study,and even lower-dose daily supplementscan be taken by women during theirreproductive years with little risk tomother or foetus and with considerablebenefit wherever deficiency is likely.
Photo: A mother and child in Nepal, where
a recent study showed that weekly vitamin
A supplements given to pregnant women
substantially reduced maternal deaths.
healthy children. And children whowere not breastfed have IQs that are 8points lower than breastfed children.
The depletion of human intelli-gence on such a scale for reasonsthat are almost entirely preventableis a profligate, even criminal, waste.
Robbed of their mental as well asphysical potential, malnourished chil-dren who live past childhood facediminished futures. They will becomeadults with lower physical and intel-lectual abilities, lower levels of pro-ductivity and higher levels of chronicillness and disability, often in soci-eties with little economic capacity foreven minimal therapeutic and rehabil-itative measures.
At the family level, the increasedcosts and pressures that malnutrition-linked disability and illness place onthose who care for them can be devas-tating to poor families especially tomothers, who receive little or no helpfrom strained social services in devel-oping countries.
And when the losses that occur inthe microcosm of the family are re-peated millions of times at the societallevel, the drain on global developmentis staggering.
In 1990 alone, the worldwide lossof social productivity caused by fouroverlapping types of malnutrition nu-tritional stunting and wasting, iodinedeficiency disorders and deficienciesof iron and vitamin A amounted toalmost 46 million years of productive,disability-free life, according to onereckoning.'
Vitamin and mineral deficienciesare estimated to cost some countriesthe equivalent of more than 5 per centof their gross national product in lostlives, disability and productivity. Bythis calculation, Bangladesh and Indiaforfeited a total of $18 billion in 1995.4
Malnourished children's low resis-tance to illness diminishes the effec-tiveness of the considerable resources
Vitamin and mineraldeficiencies are estimatedto cost some countries theequivalent of more than5 per cent of their grossnational product in lost lives,disability and productivity.
13

Panel 2
What is malnutrition?
Malnutrition is usually the re-sult of a combination of in-adequate dietary intake and
infection (Fig. 6). In children, malnu-trition is synonymous with growthfailure malnourished children areshorter and lighter than they shouldbe for their age. To get a measure ofmalnutrition in a population, youngchildren can be weighed and mea-sured and the results compared tothose of a 'reference population'known to have grown well. Meas-uring weight and height is the mostcommon way of assessing malnutri-tion in populations.
Although many people still referto growth failure as 'protein-energymalnutrition,' or PEM, it is now rec-ognized that poor growth in childrenresults not only from a deficiency ofprotein and energy but also from aninadequate intake of vital minerals(such as iron, zinc and iodine) and vi-tamins (such as vitamin A), and oftenessential fatty acids as well. Theseminerals are needed in tiny quantities,on the order of a few thousandths ofa gram or less each day. They are con-
14
a' a
sequently called micronutrients. Mi-cronutrients are needed for the pro-duction of enzymes, hormones andother substances that are required toregulate biological processes leadingto growth, activity, development andthe functioning of the immune andreproductive systems.
All of the minerals that the bodyneeds calcium, phosphorous, iron,zinc, iodine, sodium, potassium andmagnesium, for example have tocome either from the food we eat orfrom supplements. While the bodymanufactures many of the complexorganic molecules it needs from sim-pler building blocks, the vitaminsA, the B complex, C and so on arenot synthesized. Vitamin D is excep-tional in that it can be made in theskin, providing a person has sufficientexposure to direct sunlight.
While micronutrients are neededat all ages, the effects of inadequateintake are particularly serious duringperiods of rapid growth, pregnancy,early childhood and lactation. We arelearning more every day about theimportance of micronutrients for the
16
physical and the cognitive develop-ment of children.
While widespread moderate mal-nutrition may not be obvious unlesschildren are weighed and measured,some severely malnourished chil-dren develop clinical signs that areeasily observed severe wasting (ormarasmus) and the syndrome knownas kwashiorkor, with skin and hairchanges and swelling of arms andlegs. Despite years of research, thereasons why some children developkwashiorkor and why others developmarasmus remains a mystery. Whatis clear is that left untreated, childrenwith either condition are at high riskof dying from severe malnutrition,and that both kwashiorkor and mares-mus can be prevented by ensuringan adequate intake of nutritious foodand freedom from repeated infec-tions. Less severe forms of malnutri-tion also cause death, mostly becausethey weaken children's resistance toillness (Fig. 1).
The 1990 World Summit forChildren singled out deficiencies ofthree micronutrients iron, iodine,and vitamin A as being particularlycommon and of special concern forchildren and women in developingcountries. Recently, knowledge of theprevalence and importance of zinc forchild growth and development hasplaced it in that league as well. VitaminD deficiency is now recognized as amajor problem of children in countriessuch as Mongolia, the northern partsof China and some of the countries ofthe Commonwealth of IndependentStates that have long winters.
Throughout this report, the termmalnutrition is used to refer to the con-sequences of the combination of aninadequate intake of protein energy,micronutrients and frequent infections.
Photo: Three sisters at a health centre in Haiti.

that are spent to ensure that familieshave access to basic health servicesand sanitation. And investments inbasic education by governments andtheir partners are compromised bymalnutrition's pernicious effects onbrain development and intellectualperformance.
Iodine deficiency and iron defi-ciency anemia, which threaten mil-lions of children, are especially worri-some factors as countries strive toimprove their educational systems.
Iron-deficient children under theage of two years show problems withcoordination and balance and appearmore withdrawn and hesitant. Suchfactors can hinder a child's ability tointeract with and learn from the envi-ronment and may lead to lower intel-lectual abilities.'
Severe iodine deficiency in uterocan cause the profound mental retar-dation of cretinism. But milder defi-ciencies also take an intellectual toll.In the republic of Georgia, for in-stance, a widespread iodine defi-ciency, recently detected, is estimatedto have robbed the country of 500,000IQ points in the 50,000 babies born in1996 alone.6
Many children suffer from multi-ple types of malnutrition, so numberstend to overlap. But it is reliably esti-mated that globally 226 million chil-dren are stunted shorter than theyshould be for their age, and shorterthan could be accounted for by anygenetic variation (Panel 2). Stuntingis particularly dangerous for women,as stunted women are more likely toexperience obstructed labour and arethus at greater risk of dying while giv-ing birth. Stunting is associated with along-term reduction in dietary intake,most often closely related to repeatedepisodes of illness and poor-quality diets.
A study in Guatemala found thatseverely stunted men had an averageof 1.8 fewer years of schooling than
those who were non-stunted, whileseverely stunted women had, on aver-age, one year less. The differences areimportant since every additional yearof schooling translated into 6 per centmore in wages' (Panel 3).
Some 67 million children are esti-mated to be wasted, which meansthey are below the weight they shouldbe for their height the result of re-duced dietary intake, illness, or both.
About 183 million children weighless than they should for their age. Inone study, children who were severelyunderweight' were found to be two toeight times more likely to die withinthe following year as children of nor-mal weight for their age.'
More than 2 billion people prin-cipally women and children areiron deficient,' and the World HealthOrganization (WHO) has estimatedthat 51 per cent of children under theage of four in developing countriesare anaemic."
In most regions of the developingworld, malnutrition rates have beenfalling over the last two decades, butat markedly different paces (Fig. 2).The exception is sub-Saharan Africa,where malnutrition rates began in-creasing in most countries during theearly 1990s, following the regionaleconomic decline that began in thelate 1980s. As government budgetsshrank, basic social services andhealth services were hit particularlyhard. Per capita incomes also de-clined, affecting people's ability topurchase food.
In the United States, researchersestimate that over 13 million childrenmore than one in every four under theage of 12 have a difficult time get-ting all the food they need, a problemthat is often at its worst during the lastweek of the month when families'social benefits or wages run out."Over 20 per cent of children in theUnited States live in poverty, more
Iron-deficient children underthe age of two years showproblems with coordinationand balance and appear morewithdrawn and hesitant. Suchfactors can hinder a child'sability to interact with andlearn from the environmentand may lead to lowerintellectual abilities.
15

Panel 3
Stunting linked to impaired intellectual development
Malnutrition early in life islinked to deficits in children'sintellectual development that
persist in spite of schooling and im-pair their learning ability, accordingto a recent study in the Philippines.The study analysed stuntingwhich is low height for age and abasic indicator of malnutritionamong more than 2,000 children liv-ing in metropolitan Cebu, the Phil-ippines' second largest city. Nearlytwo thirds of the children studiedwere stunted. Those stunted earliestin life, before six months of age, werethe most severely stunted by agetwo, the study found. The same chil-dren scored significantly lower on in-telligence tests at 8 and 11 years of agethan children who were not stunted.
The study holds profound impli-cations on a global level: 226 millionchildren under age five in developingcountries, nearly 40 per cent of thisage group, suffer from moderate orsevere stunting. "High levels of stunt-ing among children suggest that therewill also be long-term deficits in men-
The effects of stuntingIn a non-verbal intelligence test given to eight-
year-olds in the Philippines, scores strongly
correlated with children's level of stunting at
age two. Children severely stunted at age two
had the lowest test scores, while non-stunted
children had scores on average 11 points higher.
60
55
50
45
g 40None
Level of stunting
Mild Moderate Severe
16
tal and physical development thatcan leave children ill-prepared to takemaximum advantage of learning op-portunities in school. This can alsohave consequences for children's suc-cess later in life," says Linda S. Adair,Ph.D., Associate Professor of Nu-trition at the University of NorthCarolina, in Chapel Hill (US), one ofthe researchers.
"Stunting does not directly causepoor intellectual development in chil-dren," emphasizes Professor Adair."Rather, the same underlying factorsthat cause stunting are also likely toimpair children's intellectual growth."Among children in Cebu, the causesinclude low birthweight, insufficientbreastfeeding, nutritionally inade-quate food given to complement orreplace breastmilk, and frequent di-arrhoea and respiratory infections.Stunted children tend to enter schoollater and miss more days of schoolthan well-nourished children, thestudy also found.
The study, part of a collaborativeresearch programme of the Office ofPopulation Studies at the Universityof San Carlos in Cebu and the Uni-versity of North Carolina, found that28 per cent of the children surveyedwere severely stunted. At age two,these children were nearly 11 cen-timeters (5 inches) shorter than chil-dren who were not stunted. The IQscores of the severely stunted chil-dren at eight years of age were 11points lower than those of the chil-dren who were not stunted.
When the children in the studywere tested again at age 11, thosewho had been most severely stuntedat age 2 still scored lower on the in-telligence test than children who hadnot been stunted, although the gapwas narrower at about 5 IQ points.Children who were severely stunted
Nearly 40 per cent of all children under five inthe world are stunted due to malnutrition. Many
of them will also face challenges in school asa result. Here, a contrast in stature is apparentbetween two girls the same age in Bangladesh.
also had significantly lower scores onlanguage and math achievement tests.
Most of the children in the studywere from poor families, and theirdiets, and those of their mothers, werebelow the nutritional levels recom-mended by the Philippine Govern-ment. They came from densely pop-ulated, poor urban communities, fromnewly settled areas on the outskirts ofthe city and from rural communities.
This study underscores the impor-tance and lasting impact of nutritionin the crucial months of infancy andbeginning before birth with soundmaternal nutrition. Infants denied astrong start in life face problems inmaking up the lost ground, and theimpact on their own developmentand that of their societies can be alasting one.

than double the rate of most other in-dustrialized countries.'
In the United Kingdom, childrenand adults in poor families face healthrisks linked to diet, according to a re-cent study that cited high rates ofanaemia in children and adults, andof premature and low-weight births,dental diseases, diabetes, obesity andhypertension.'
In Central and Eastern Europe,economic dislocations accompanyingthe transition to market economiesand major cutbacks in state-run socialprogrammes are having a more pro-found effect on the most vulnerable.
In the Russian Federation, theprevalence of stunting among chil-dren under two years of age increasedfrom 9 per cent in 1992 to 15 per centin 1994.'5 And in the Central Asian re-publics and Kazakstan, 60 per cent ofpregnant women and young childrenare now anaemic.
The effects of malnutrition alsocross generations. The infants ofwomen who are themselves malnour-ished and underweight are likely to besmall at birth.
Overall, 60 per cent of women ofchildbearing age in South Asiawhere half of all children are under-weight are themselves underweight.In South-East Asia, the proportion ofunderweight women is 45 per cent; itis 20 per cent in sub-Saharan Africa.
The power of goodnutritionThe devastation of malnutrition ishard to overstate, but so is the coun-tervailing power of nutrition. Not onlyis good nutrition the key to the healthydevelopment of individuals, familiesand societies, but there is also grow-ing reason to believe that improvingthe nutrition of women and childrenwill contribute to overcoming some ofthe greatest health challenges facing
the world, including the burden ofchronic and degenerative disease, ma-ternal mortality, malaria and AIDS.
The most obvious proof of thepower of good nutrition can be seen inthe taller, stronger, healthier childrenof many countries, separated by onlya generation from their shorter, lessrobust parents, and by the better dietsand more healthful, nurturing envi-ronments they enjoy.
Stronger children grow intostronger, more productive adults. Well-nourished girls grow into women whoface fewer risks during pregnancy andchildbearing, and whose children setout on firmer developmental paths,physically and mentally. And historyshows that societies that meet women'sand children's nutritional needs alsolift their capacities for greater socialand economic progress (Fig. 3).
Approximately half of the eco-nomic growth achieved by the UnitedKingdom and a number of WesternEuropean countries between 1790 and1980, for example, has been attributedto better nutrition and improved healthand sanitation conditions, social in-vestments made as much as a century
Even in countries or regions wherepoverty is entrenched, the health anddevelopment of children and womencan be greatly protected or improved(Fig 4). In parts of Brazil, for example,the percentage of underweight childrenplummeted from 17 per cent in 1973 tojust under 6 per cent in 1996, at a timewhen poverty rates almost doubled.
Much has already been achieved.For example, 12 million children everyyear are being spared irreversiblemental impairment from iodine defi-ciency because of iodized salt. Andmore than 60 per cent of young chil-dren around the world are receivingvitamin A supplements.
Some effects of even severe malnu-trition on a child's mental development
Approximately half of theeconomic growth achieved bythe United Kingdom and anumber of Western Europeancountries between 1790 and1980, for example, has beenattributed to better nutritionand improved health andsanitation conditions, socialinvestments made as muchas a century earlier.
17

Fig. 2 Trends in child malnutrition, by region
The chart shows trends in malnutrition in 41 countries, in four regions, covering
over half of children under five years old in the developing world. Countries with
under-five populations below 1 million are not included, even where trend data
were available.
80
70
60
50 50
40
30
Burundi
Niger zMali
MadagascarCongo Dem. Rep.
Ghana
Senegal Uganda
-=,; 20 COte-d'Ivoire
Cameroon10
g-`' 0 ._
1985
Malawi
Sub-Saharan Africa
1990
Zimbabwe
1995
Zambia
Tanzania
Kenya
40
30
20
is
10
o
Nepal
Bangladesh
China
1985 1990 1995
Asia and Pacific
50 50
40
30 I
20
10
1985
Algeria
Middle East and North Africa
1990
Egypt
Turkey
1995
Note: Malnutrition is measured as the percentage of under-five children below -2 standarddeviations of the median value far the National Center for Health Statistics (NCHS) reference
population for weight-for-age. Rates have been adjusted for age; data for some countries reflect
rates for the under-three population.
Source: UNICEF, 1997.
18
40
;
Guatemala
30
Haiti
HondurasDominican Rep
2 20
10Colombia
Chile Brazil
a? 0
1985 1990
Latin America and the Caribbean
1995
Peru

can be at least partially reversed. Theintelligence of severely malnourishedchildren was found to improvemarkedly, for example, when healthcare, adequate food and stimulationwere provided continually.'
And there is increasing evidencethat good nutrition helps the body re-sist infection; that when infection oc-curs, nutrition relieves its severity andseriousness; and that it speeds recovery.
Thirty years ago, most peoplecould readily accept the notion that a`good diet' was beneficial to overallhealth. But the idea that specific nutri-ents could help fend off or, evenmore outlandishly, help treat specificdiseases smacked of 'fringe science'.
Today, through clinical trials andstudies, the fringe is edging closer tothe mainstream, as nutrition scientists aswell as immunologists, paediatriciansand gerontologists test the implica-tions for public policy of large-scaleinterventions to improve nutrition andits effects on an array of critical phys-iological processes.
Malnutrition, reflected in the poorgrowth of children and adolescents andthe high prevalence of low-birthweightbabies, already has well-known ef-fects on a child's capacity to resist ill-ness. It is thus reasonable to arguethat in the global fight to reduce child-hood death and illness, initiatives toimprove nutrition may be as powerfuland important as, for example, immu-nization programmes.
There are now numerous scientificstudies that suggest, but do not yetprove, that vitamin A deficiency in amother infected with the human im-munodeficiency virus (HIV) may in-crease her risk of transmitting thevirus to her infant.
Early in the next millennium, it isthought that between 4 million and 5million children will be infected withHIV. The majority, mostly in sub-Saharan Africa, will acquire the infec-
tion directly from their mothers.Although it will take another year ortwo to be absolutely sure, improvingthe vitamin A status of populationswhere both HIV infection and vitaminA deficiency are common may makesome contribution to reducing thetransmission of the virus.
The right to goodnutritionHowever far-reaching the benefits ofnutrition may be, ensuring good nutri-tion is a matter of international law,articulated in variously specific lan-guage in international declarationsand human rights instruments datingback to the adoption of the Declara-
Fig. 3 From good nutrition to greater productivity and beyond
Good early nutrition is most likely to result where there is economic growth, especially equitable growth; when
social services become affordable and accessible; and when adequate investment is made in human resources,
including the empowerment of women. Good nutrition, in turn, contributes to greater productivity and thus to
economic growth.
Increased productivity
4
Economic growth
Social-sectorinvestments
Source: Adapted from Stuart Gillespie, John Mason and Reynaldo Ma rtorell, How Nutrition Improves, ACC/SCN, Geneva, 1996.
21 19

Panel 4
Recognizing the right to nutrition
Nutrition has been expressed asa right in international humanrights instruments since 1924.
Among these are declarations, whichare non-binding, and conventionsand covenants, which are treatiescarrying the force of law.
Some of these human rights mile-stones are noted below.
1924: Declaration of the Rights ofthe Child (also known as theDeclaration of Geneva). Adoptedafter World War I by the League ofNations through the efforts of Britishchild rights pioneer Eglantyne Jebb,the Declaration marks the beginningof the international child rightsmovement and is also the first inter-national affirmation of the right tonutrition. The Declaration affirmsthat "the child must be given themeans needed for its normal devel-opment, both materially and spiritu-ally" and states that "the hungrychild should be fed."
1948: Universal Declaration ofHuman Rights. This human rightslandmark, adopted by the UnitedNations General Assembly, proclaimsin article 25 that "everyone has theright to a standard of living adequatefor the health and well-being of him-self and of his family, including food,clothing, housing and medical careand necessary social services ...."This article also affirms that "mother-hood and childhood are entitled tospecial care and assistance."
1959: Declaration of the Rights ofthe Child. Adopted unanimously bythe United Nations General Assem-bly, the Declaration states in principle4 that children "shall be entitled togrow and develop in health" and thatchildren "shall have the right to ade-
20
quate nutrition, housing, recreationand medical services."
1966: International Covenant onEconomic, Social and Cultural Rights.Adopted by the United Nations andratified by 137 States as of mid-September 1997, this Covenant wasthe first to spell out States' obliga-tions to respect people's economic,social and cultural rights. Article 11affirms the right of everyone to anadequate standard of living, includingadequate food, and the "fundamen-tal right of everyone to be free fromhunger." The Covenant also man-dates States parties to take steps torealize this right, including measures"to improve methods of production,conservation and distribution of food."
1986: Declaration on the Right toDevelopment. Article 1 of the Dec-laration, which was adopted by theUnited Nations General Assembly,proclaims that the right to devel-opment "is an inalienable humanright," with all people entitled to par-ticipate in and enjoy economic, so-cial, cultural and political develop-ment "in which all human rights andfundamental freedoms can be fullyrealized." Article 8 calls for all Statesto ensure equal opportunity for all inaccess to health services and food.
1989: Convention on the Rights ofthe Child. The most widely ratifiedhuman rights treaty, the Conventionestablishes as international law allrights to ensure children's survival,development and protection. Article24 mandates States parties to recog-nize children's right to the "highestattainable standard of health" and totake measures to implement thisright. Among key steps, States aremandated to provide medical assis-
22
tance and health care to all children,with an emphasis on primary healthcare; combat disease and malnutri-tion, within the framework of pri-mary health care, through the pro-vision of adequate nutritious foods,and safe drinking water and ade-quate sanitation; and provide fami-lies with information about the ad-vantages of breastfeeding.
Ratifications: 191 States as of mid-September 1997, with only two coun-tries Somalia and the UnitedStates yet to ratify.
1990: World Declaration and Planof Action on the Survival, Protectionand Development of Children. Theunprecedented numbers of worldleaders attending the World Summitfor Children committed themselvesto "give high priority to the rights ofchildren" in the Summit's WorldDeclaration. The Summit's Plan ofAction set out the steps in 7 majorand 20 supporting goals for imple-menting the Declaration. Reducingsevere and moderate malnutrition byhalf of 1990 levels among under-fivechildren by the end of the century isthe main nutrition goal.
The 7 supporting nutrition goalsare: reduction of low-weight births toless than 10 per cent of all births;reduction of iron deficiency anaemiain women by one third of 1990 levels;virtual elimination of iodine defici-ency disorders; virtual elimination ofvitamin A deficiency; empowermentof all women to exclusively breast-feed their children for about the firstsix months; institutionalization ofgrowth monitoring and promotion;and dissemination of knowledge andsupporting services to increase foodproduction to ensure household foodsecurity.

tion of the Rights of the Child in 1924(Panel 4).
Under the 1979 Convention on theElimination of All Forms of Dis-crimination against Women, for ex-ample, States parties must ensure thatwomen receive full and equal accessto health care, including adequate nu-trition during pregnancy and lactation.And the 1990 World Summit forChildren, with a Plan of Action thatrecognized the devastating effects ofmalnutrition on women and their chil-dren, set specific nutritional goals forchildren and women, including accessto adequate food during pregnancyand lactation; the promotion, protec-tion and support of breastfeeding andcomplementary feeding practices; growth
monitoring with appropriate follow-upactions; and nutritional surveillance.
But the right to nutrition receivesits fullest and most ringing expressionin the 1989 Convention on the Rightsof the Child, whose 191 ratificationsas of late 1997 make it the mostuniversally embraced human rightsinstrument in history.
Under the Convention, whichcommits States parties to realize thefull spectrum of children's political,civil, social, economic and culturalrights, virtually every government inthe world recognizes the right of allchildren to the highest attainable stan-dard of health, to facilities for thetreatment of illness and for the reha-bilitation of health specifically in-cluding the right to good nutrition andits three vital components: food, healthand care.
Under the Convention's pre-eminentguiding principle, good child nutritionis a right because it is in the "best in-terests of the child."
Article 24 of the Convention spec-ifies that States parties must take "ap-propriate measures" to reduce infantand child mortality, and to combatdisease and malnutrition through the
use of readily available technologyand through the provision of adequate,nutritious foods and safe drinking water.
The world is obligated to easechild malnutrition on the basis of in-ternational law, scientific knowledge,practical experience and basic morality.
The ravages caused by malnutri-tion on individuals, families and soci-eties are preventable. The measuresneeded to reduce and end it are be-coming increasingly well understood.And the gains for humanity fromdoing so in greater creativity, energy,productivity, well-being and happi-ness are immeasurable.
Why time is ofthe essenceA child's organs and tissues, blood,brain and bones are formed, and intel-lectual and physical potential is
shaped, during the period from concep-tion through age three.
Since human development pro-ceeds particularly rapidly for the first18 months of life, the nutritional statusof pregnant and lactating mothers andyoung children is of paramount im-portance for a child's later physical,mental and social development. It is notan exaggeration to say that the evolu-tion of society as a whole hinges onthe nutrition of mothers and childrenduring this crucial period of their lives.
The healthy newborn who devel-ops from a single cell roughly thesize of the period at the end of thissentence will have some 2 billioncells and weigh an average of 3,250grams.' Under optimal conditions,the infant will double its birthweightin the first four months of life; by itsthird birthday, a healthy child will befour and a half times as heavy.
Brain cells proliferate at the rate of250,000 a minute, beginning in thethird week of gestation.' By the timeof birth, a child will have 100 billion
23
Fig. 4 Poverty and malnutrition inLatin America and the Caribbean
Malnutrition in Latin America decreased from an
estimated 21% in 1970 to 7.2% in 1997, while
the rate of poverty, measured by income level,
fluctuated only slightly over the last three
decades, dropping from 45% in 1970 to 44% in
1997. These trends show that the reduction of
malnutrition is not solely dependent on increases
in income. In Latin America, the gains in reducing
malnutrition are attributed at the underlying level
to good care practices and access to basic health
services, including family planning, and
water/sanitation services; and at the basic level
to women's empowerment in terms of their
education and the cash resources they control.
so
40Per cent of families withincome below poverty level
Per cent of underweightchildren
30
20
i10
01970 1975 1980 1985 1990 1995 2000
Source: Aaron Lechtig, 'Child Undernutrition in Latin America
and the Caribbean: Trends, reasons and lessons', presented
to the Workshop on the Changing Conditions of the Child in
Latin America and the Caribbean, University of Notre Dame,
South Bend (USA), 26 September 1997, based on ACC/SCN,
'Update of the Nutrition Situation 1996', Summary of results
for the Third Report on the World Nutrition Situation,
ACC/SCN, Geneva, 1996,and ECLAC, Social Panorama of
Latin America 1996, Santiago (Chile), 1996.
21

Women need rest and protection from
overwork during pregnancy. As long as theunequal division of labour so common aroundthe world persists, the caring practices vital tothe nutritional well-being of children willsuffer. In Niger, a pregnant woman carriesseveral large howls of sorghum.
22
neurons, linked by synapses, the com-plex nerve junctions that begin form-ing in the 13th week of gestation."
Proliferating most rapidly afterbirth, in large part because of thestimulation and care a child receives,millions upon millions of these junc-tions will be forged by the time ahealthy child reaches the age of twoand a half. Physical, mental andcognitive development depend onthese communication links betweenneurons. Without them, messageswould dead-end, muscles would notflex, and the complex processes ofthought and learning would not bepossible.
Growth during the foetal stage de-pends on how well nourished awoman was before pregnancy, as wellas how much weight she gains whileshe is pregnant. Gains in weight areessential for the development of newmaternal and foetal tissues, and formaternal body maintenance and energy.
Since the foetus relies entirely onthe mother for nutrients, pregnantwomen not only need to gain weightbut also must maintain an optimal in-take of essential nutrients such as ironand iodine.
But fulfilling these interlockingfood, health and care needs can be astruggle for many women in the de-veloping world, where economic,social and cultural factors may be abarrier to good nutrition.
Currently about 24 million low-birthweight babies are born everyyear, which is about 17 per cent of alllive births. Most are born in develop-ing countries, where the main causeof low birthweight is not prematurebirth, as it is in the industrializedworld, but poor foetal growth.
Low-birthweight babies, definedas weighing less than 2.5 kilograms,are at greater risk of dying than infantsof average weight. If they survive,they will have more episodes of ill-
24
ness, their cognitive development maybe impaired, and they are also morelikely to become malnourished. Evi-dence is also mounting that low birth-weight predisposes children to a highrisk of diabetes, heart disease andother chronic conditions later in life.
The measures that are essentialfor an expectant mother care andrest, a reduced workload and a well-balanced diet that affords ample en-ergy, protein, vitamins, minerals andessential fatty acids are equally im-portant when a woman is breastfeed-ing her child.
Breastfeeding perfectly combinesthe three fundamentals of sound nutri-tion food, health and care and isthe next critical window of nutritionalopportunity after pregnancy. Whilenot all children are breastfed, it re-mains an important protection forchildren (see also page 47).
Because breastmilk contains allthe nutrients, antibodies, hormonesand antioxidants an infant needs tothrive, it plays a pivotal role in pro-moting the mental and physical devel-opment of children.
Breastfed infants not only showbetter immune responses to immuni-zations, but their intake of breastmilkalso protects the mucous membranesthat line their gastrointestinal and res-piratory tracts, thus shielding themagainst diarrhoea and upper respira-tory tract infections.'
In countries where infant mortalityrates are high or moderately high,a bottle-fed baby in a poor communityis 14 times more likely to die fromdiarrhoeal diseases and 4 times morelikely to die from pneumonia than ababy that is exclusively breastfed."
Breastfeeding also has cognitivebenefits. In one study, breastfed sub-jects generally had IQs that wereabout 8 points higher than childrenwho had been bottle-fed, and higherachievement scores as well." Nutri-

tionists theorize that the effect may bethe result of the growth-promotinglong-chain fatty acids of breastmilk.It may also be related to the fact thatbreastfed infants have fewer infectionsand, as healthier infants, they take agreater interest in their environmentand thus learn more than ill infants.
However, for mothers infectedwith HIV, breastfeeding's enormousvalue as a bulwark against malnutri-tion, illness and death must be weighedagainst the 14 per cent risk that theymay transmit the virus to their infantsthrough breastmilk and the vastlygreater risk, especially in poor com-munities with inadequate water andsanitation, that feeding their childrenartificially will lead to infant deathsfrom diarrhoeal dehydration and res-piratory infections.
During the second half of a child'sfirst year, synaptic growth in the pre-frontal cortex of the brain, the seat offorethought and logic, consumes twicethe amount of energy required by anadult brain. Much of this synapticgrowth is believed to result from thecaring stimulation that an infant andyoung child receives the nurturing,feeding and learning play in whichparents engage their children.
After about six months, for opti-mal growth and development, a childneeds to be fed frequently with energy-rich, nutrient-dense foods. The failureto make such investments at the righttime can never be remedied later. Anadequate intake of micronutrients,especially iodine, iron, vitamin A andzinc, remains crucial.
Spotlighting the causesAn understanding of the complex andsubtle causes of malnutrition is im-portant to appreciate the scale anddepth of the problem, the progressachieved to date and the possibilitiesfor further progress that exist.
Malnutrition, clearly, is not a simpleproblem with a single, simple solu-tion. Multiple and interrelated deter-minants are involved in why malnutri-tion develops, and a similarly intricateseries of approaches, multifaceted andmultisectoral, are needed to deal withit (Fig. 5).
Immediate causesThe interplay between the two mostsignificant immediate causes of mal-nutrition inadequate dietary in-take and illness tends to create avicious circle: A malnourished child,whose resistance to illness is com-promised, falls ill, and malnourish-ment worsens. Children who enterthis malnutrition-infection cycle canquickly fall into a potentially fatalspiral as one condition feeds off theother (Fig. 6).
Malnutrition lowers the body'sability to resist infection by under-mining the functioning of the mainimmune-response mechanisms. Thisleads to longer, more severe and morefrequent episodes of illness.
Infections cause loss of appetite,malabsorption and metabolic and be-havioural changes. These, in turn, in-crease the body's requirements fornutrients, which further affects youngchildren's eating patterns and howthey are cared for (see also page 27).
Underlying causesThree clusters of underlying causeslead to inadequate dietary intake andinfectious disease: inadequate accessto food in a household; insufficienthealth services and an unhealthful en-vironment; and inadequate care forchildren and women.
U Household food securityThis is defined as sustainable accessto safe food of sufficient quality andquantity including energy, proteinand micronutrients to ensure ade-
25
A complex interplay of factors such as
household access to food, women's status,
caring practices, disease and access to safe
water, sanitation and basic health services
affect a child's nutrition. A girl stands in the
doorway of her home in Lebanon.
23

Fig. 5 Causes of child malnutrition
This conceptual framework on the causes of malnutrition was developed in 1990 as part of the UNICEF Nutrition Strategy. The framework shows that causes of
malnutrition are multisectoral, embracing food, health and caring practices. They are also classified as immediate (individual level), underlying (household or family
level) and basic (societal level), whereby factors at one level influence other levels. The framework is used, at national, district and local levels, to help plan effective
actions to improve nutrition. It serves as a guide in assessing and analysing the causes of the nutrition problem and helps in identifying the most appropriate mixture
of actions.
firrUnn. . IlWif,.f';
t
t 4
-11111111..
Inadequate and/or
inappropriate knowledge and
discriminatory attitudes limit
household access to actual
resources 111140.
Political, cultural, religious,
economic and social systems,
including women's status, limit
the utilization of potential
resources
Source: UNICEF, 1997.
24
t
ry
r:
(Wt011::1,
I i,)1f,
r(4i
ga.ollumnT!vi
26
::Aozr:Prrr
tPoor ini"sanitatioinadeservice
Outcomes
Immediate causes
Underlying causes athousehold/family level

quate intake and a healthy life for allmembers of the family.
In rural areas, household foodsecurity may depend on access toland and other agricultural resourcesto guarantee sufficient domesticproduction.
In urban areas, where food islargely bought on the market, a rangeof foods must be available at accessi-ble prices to ensure food security.Other potential sources of food areby exchange, gifts from friends orfamily and in extreme circumstancesfood aid provided by humanitarianagencies.
Household food security dependson access to food financial, physi-cal and social as distinct from itsavailability. For instance, there maybe abundant food available on themarket, but poor families that cannotafford it are not food secure.
For the poor, therefore, householdfood security is often extremely pre-carious. Agricultural production varieswith the season and longer-term envi-ronmental conditions. Families sell-ing crops may find themselves paidfluctuating prices depending on a va-riety of factors beyond their control,while those who need to buy foodmay encounter exorbitant prices.
Families living on the edge of sur-vival have few opportunities to buildup sufficient stocks of food, or to de-velop alternatives that would cushionthem in times of hardship. So whilepoor families may have adequate ac-cess to food for one month, what is es-sential is access that is consistent andsustainable.
Women have a special role to playin maintaining household food secu-rity. In most societies, they are solelyresponsible for preparing, cooking,preserving and storing the family'sfood and in many societies theyhave the primary responsibility ofproducing and purchasing it. For
Fig. 6 Inadequate dietary intake/disease cycle
Inadequate dietary intake and infection operate in a vicious cycle that accounts for much of the high morbidity
and mortality seen in developing countries. When children don't eat enough or well enough, their immune
system defences are lowered, resulting in greater incidence, severity and duration of disease. Disease speeds
nutrient loss and suppresses appetite so sick children tend not to eat as they should and the cycle
continuos
At
Source: Andrew Tomkins and Fiona Watson, Malnutrition and Infection, ACC/SCN, Geneva, 1989.
household food security to translateinto good nutrition, this often over-whelming burden of work must beredistributed or reduced so that otherneeds of children, also related to nu-trition, can be met.
O Health services, safe waterand sanitation
An essential element of good health isaccess to curative and preventivehealth services that are affordable andof good quality.
Families should have a health cen-tre within a reasonable distance, andthe centre's staff should be qualifiedand equipped to give the advice andcare needed. According to the UnitedNations Development Programme(UNDP), access varies widely, but inas many as 35 of the poorest countries30 to 50 per cent of the population mayhave no access to health services at all."
In Africa, the programme knownas the Bamako Initiative was launched
27 25

Panel 5
Growth and sanitation:What can we learn from chickens?
poultry farmers have known forsome time that a chicken livingin a dirty environment is a
chicken that grows poorly. Even if itis not overtly sick all the time, it gainslittle weight.
Is there a message here about thegrowth of children? Because growth,like other nutrition outcomes, is deter-mined most immediately by diet andillness status, the answer, at least inpart, may be yes. Infectious illnesswhich spreads more easily in unsani-tary conditions leads to poorer di-etary intake and poor use of thenutrients ingested. This, in turn,leads to lower resistance to infection,and so on, in a vicious diet-infectioncycle (Fig. 6).
Now studies suggest that an un-sanitary environment may have ef-fects beyond those associated withparticular bouts of illness. Research-ers believe that children living insuch conditions may suffer from afairly constant, low-level challenge totheir immune systems that impairs
26
their growth, as has been shown indomestic fowl. Dr. Noel Solomons ofthe Centre for Studies of SensoryImpairment, Aging and Metabolismand colleagues suggest that alongwith classifying children as healthy(having no clinical illness) andacutely infected (with signs of illnessreadily detectable), there is also acategory of "inapparently infected."Children who are inapparently in-fected have no signs of clinical illnessbut do have abnormal levels of someimmunological indicators. Such in-apparent infections and the chroniclow-level stimulation of the immunesystem associated with life in unsan-itary conditions may mean thatnutrients go to support the body's im-mune response rather than growth.
Poverty occurs in both South Asiaand sub-Saharan Africa, but rates ofmalnutrition, especially stunting, aremuch higher in South Asia. A num-ber of hypotheses have been ad-vanced to explain this difference, andone is that it is due to poorer sanita-
28
tion and hygiene practices, the muchgreater population density and de-gree of overcrowding in South Asia.
Certainly, the dangers posed bypoor access to potable water are wellknown. A recent review of data col-lected by the Demographic and HealthSurveys, a USAID-supported project,indicates that health and nutritionbenefits from improved sanitation,especially improved excreta dis-posal, may be even greater thanthose associated with better accessto safe water alone.
A group led by Dr. ReynaldoMartorell of Emory University (US)has designed a study to shed light onthe relationship between sanitationand growth stunting. This studywould follow 800 children in two lo-cations in South Asia and 800 morein two locations in sub-SaharanAfrica from the time their mothersbecome pregnant to when they aretwo years old and would collect awide range of information on sanita-tion, hygiene practices and other as-pects of the household environment.The children's growth would be meas-ured frequently along with indicatorsof feeding practices, diet quality, ill-ness and many other factors. UNICEFis helping to secure funds for thisstudy.
Establishing a link between sani-tation conditions and child growth ina cause-and-effect way will go a longway to clarifying priorities for actionin this area. Such a link will alsoreveal just how useful the 'dirtychicken' model is for understandingstunted growth among children.
Photo: Unsanitary living conditions cause
illnesses that threaten children's health and
growth. New research now suggests that growth
is harmed in unhygienic surroundings even
before acute infection occurs. In Egypt, a girl
amid mounds of garbage and animal waste.

in 1987 to address the crisis in healthcare that came on the heels of budgetcuts and economic decline in the1980s. It is a strategy for improvinghealth services by moving their con-trol, management and even some oftheir financing out of central jurisdic-tion and into communities.
Now in place in a number of coun-tries in Africa, the Initiative's princi-ples are being adopted and adapted inother regions as well. The results arepromising: The supply of basic drugsin health centres is more consistent,and management committees, com-posed of village residents, help ensurethat people pay reasonable fees forbasic services and that the funds gen-erated are well used.
Nevertheless, the fact remains thatmany people do not have access tohealth care and may be further de-terred from seeking timely and appro-priate care by user fees for health careservices.
The additional challenge of creat-ing a climate where preventive healthand nutritional care components arealso integrated into the Bamako modelis harder to realize. Because they areless tangible to communities, preven-tive health and nutrition services arealso often less in demand than cura-tive care. Prevention, nonetheless, isvital and cost-effective.
In terms of environmental health,the lack of ready access to a safewater supply and proper sanitationand the unhygienic handling of foodas well as the unhygienic conditionsin and around homes, which causemost childhood diarrhoea, have sig-nificant implications for the spread ofinfectious diseases.
Moreover, when food is handledunder unhygienic conditions and theenvironment is unhealthful, litteredwith animal and human wastes, youngchildren are also more prone to infec-tion by intestinal parasites, another
cause of poor growth and malnutrition(Panels 5 and 20).
Also, women and children are usu-ally responsible for fetching the waterneeded for domestic use, a task thatdrains considerable time and energy.Depending on how much the distanceto the water source is shortened, it hasbeen estimated that women couldconserve large reserves of energy, asmany as 300 to 600 calories a day."
Progress has been made in improv-ing access to safe water. But morethan 1.1 billion people lack this funda-mental requirement of good nutrition."
As for sanitary waste disposal, theworld is actually losing ground, withthe rate of coverage falling in bothurban and rural areas. Only 18 per centof rural dwellers had access to adequatesanitation services at the end of 1994,"and overall some 2.9 billion peoplelack access to adequate sanitation."
LI Caring practicesExperience has taught that even whenthere is adequate food in the houseand a family lives in a safe and health-ful environment and has access tohealth services, children can still be-come malnourished.
Inadequate care for children andwomen, the third element of malnutri-tion's underlying causes, has onlyrecently been recognized and under-stood in all its harmful ramifications.
Care is manifested in the ways achild is fed, nurtured, taught andguided. It is the expression by individ-uals and families of the domestic andcultural values that guide them.
Nutritionally, care encompasses allmeasures and behaviours that trans-late available food and health re-sources into good child growth anddevelopment. This complex of caringbehaviours is often mistakenly as-sumed to be the exclusive domain ofmothers. It is, in fact, the responsibil-ity and domain of the entire family
Experience has taught thateven when there is adequatefood in the house and afamily lives in a safe andhealthful environment andhas access to health services,children can still becomemalnourished.
27

The introduction ofcomplementary foods is acritical stage. A child willbe put at increased risk ofmalnutrition and illness ifthese foods are introducedmuch before the age of sixmonths, or if the preparationand storage of food in thehome is not hygienic.
28
and the community, and both mothersand children require the care of theirfamilies and communities.
In communities where mothers aresupported and cared for, they are, inturn, better able to care for youngchildren.
Among the range of caring behav-iours that affects child nutrition andhealth, the following are most critical:
Feeding: As we have seen, exclu-sive breastfeeding for about sixmonths, and then continued breast-feeding with the addition of safe,high-quality complementary foodsinto the second year of life, providesthe best nourishment and protectschildren from infection.
The introduction of complemen-tary foods is a critical stage. A childwill be put at increased risk of mal-nutrition and illness if these foodsare introduced much before the ageof six months, or if the preparationand storage of food in the home isnot hygienic.
On the other hand, a child musthave complementary foods at the six-month point, since breastmilk nolonger meets all nutritional needs.Delaying the switch-over much be-yond six months of age can cause achild's growth to falter.
From about 6 months to 18 monthsof age, the period of complementaryfeeding, a child needs frequent feed-ing at least four times daily, de-pending on the number of times achild is breastfed and other factorsand requires meals that are both densein energy and nutrients and easy todigest.
The foods a family normally eatswill have to be adapted to the needs ofsmall children, and time must bemade available for preparing themeals and feeding children.
Good caring practices need to begrounded in good information and
30
knowledge and free of cultural biasesand misperceptions. In many cultures,for instance, food and liquids arewithheld during episodes of diar-rhoea in the mistaken belief that doingso will end the diarrhoea. The practiceis dangerous because it denies thechild the nutrients and water vital forrecovery.
Other behaviours that affect nutri-tion include whether children are fedfirst or last among family members,and whether boys are fed preferen-tially over girls. In a number of cul-tures and countries, men, adult guestsand male children eat before womenand girls.
The level of knowledge about hy-giene and disease transmission is an-other important element of care. Itinvolves food preparation and storage,and whether both those who preparethe food and those who eat it washtheir hands properly before handling it.
Ideas concerning appropriate childbehaviour are also important. If, forinstance, it is considered disrespectfulfor a child to ask for food, feedingproblems can occur.
Protecting children's health: Sim-ilarly rooted in good knowledge andinformation is the caring act of seeingthat children receive essential healthcare at the right time. Early treatmentcan prevent a disease from becomingsevere.
Immunizations, for example, haveto be carried out according to a spe-cific schedule. Sound health informa-tion needs to be available to commu-nities, and families and those caringfor children need to be supported inseeking appropriate and timely healthcare.
Therapeutic treatment for a se-verely malnourished child in thehospital is far more expensive thanpreventive care. According to a 1990US Department of Agriculture study,
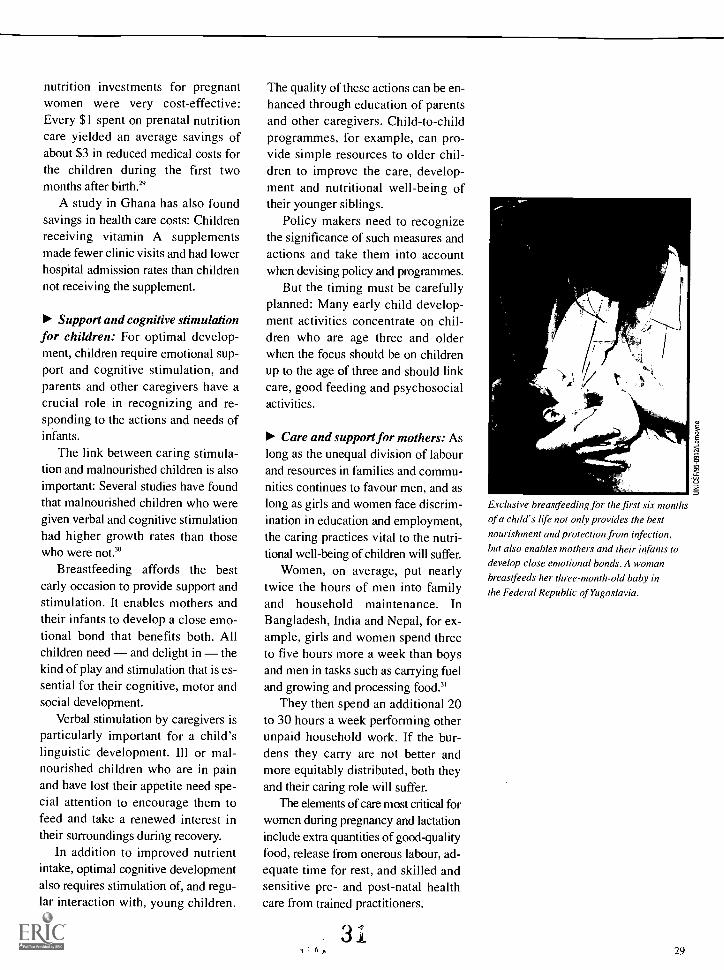
nutrition investments for pregnantwomen were very cost-effective:Every $1 spent on prenatal nutritioncare yielded an average savings ofabout $3 in reduced medical costs forthe children during the first twomonths after birth."
A study in Ghana has also foundsavings in health care costs: Childrenreceiving vitamin A supplementsmade fewer clinic visits and had lowerhospital admission rates than childrennot receiving the supplement.
Support and cognitive stimulationfor children: For optimal develop-ment, children require emotional sup-port and cognitive stimulation, andparents and other caregivers have acrucial role in recognizing and re-sponding to the actions and needs ofinfants.
The link between caring stimula-tion and malnourished children is alsoimportant: Several studies have foundthat malnourished children who weregiven verbal and cognitive stimulationhad higher growth rates than thosewho were not."
Breastfeeding affords the bestearly occasion to provide support andstimulation. It enables mothers andtheir infants to develop a close emo-tional bond that benefits both. Allchildren need and delight in thekind of play and stimulation that is es-sential for their cognitive, motor andsocial development.
Verbal stimulation by caregivers isparticularly important for a child'slinguistic development. Ill or mal-nourished children who are in painand have lost their appetite need spe-cial attention to encourage them tofeed and take a renewed interest intheir surroundings during recovery.
In addition to improved nutrientintake, optimal cognitive developmentalso requires stimulation of, and regu-lar interaction with, young children.
The quality of these actions can be en-hanced through education of parentsand other caregivers. Child-to-childprogrammes, for example, can pro-vide simple resources to older chil-dren to improve the care, develop-ment and nutritional well-being oftheir younger siblings.
Policy makers need to recognizethe significance of such measures andactions and take them into accountwhen devising policy and programmes.
But the timing must be carefullyplanned: Many early child develop-ment activities concentrate on chil-dren who are age three and olderwhen the focus should be on childrenup to the age of three and should linkcare, good feeding and psychosocialactivities.
Care and support for mothers: Aslong as the unequal division of labourand resources in families and commu-nities continues to favour men, and aslong as girls and women face discrim-ination in education and employment,the caring practices vital to the nutri-tional well-being of children will suffer.
Women, on average, put nearlytwice the hours of men into familyand household maintenance. InBangladesh, India and Nepal, for ex-ample, girls and women spend threeto five hours more a week than boysand men in tasks such as carrying fueland growing and processing food.'
They then spend an additional 20to 30 hours a week performing otherunpaid household work. If the bur-dens they carry are not better andmore equitably distributed, both theyand their caring role will suffer.
The elements of care most critical forwomen during pregnancy and lactationinclude extra quantities of good-qualityfood, release from onerous labour, ad-equate time for rest, and skilled andsensitive pre- and post-natal healthcare from trained practitioners.
4
4 p
Exclusive hreastfeeding for the first six months
of a child's life not only provides the best
nourishment and protection from infection,
but also enables mothers and their infants to
develop close emotional bonds. A woman
breastfeeds her three-month-old baby in
the Federal Republic of Yugoslavia.
29

Panel 6
Breastmilk and transmission of HIV
Breastfeeding confers enormousbenefits, preventing malnutri-tion and illness, saving lives
and money. It is also, however, oneway an HIV-positive mother couldtransmit the virus to her infant. Achild stands the greatest riskbelieved to be 20 per cent of verti-cal or mother-to-child transmissionduring the time of late pregnancyand childbirth. There is an additional14 per cent risk that an infant will be-come infected through breastmilk.
This risk of infection throughbreastfeeding needs to be weighedagainst the great dangers posed byartificial feeding: In communitieswhere sanitation is inadequate andfamilies are poor, death from diar-rhoea is 14 times higher in artificiallyfed infants than in those who arebreastfed. If HIV-positive women andthose who fear HIV (without actuallybeing infected) were to abandonbreastfeeding in large numbers, with-out safe and reliable alternatives forfeeding their children, the ensuinginfant deaths from diarrhoea and res-piratory infections could vastly out-number those from HIV.
The dilemma facing an HIV-positivewoman who does not have easy ac-cess to safe water, who does nothave enough fuel to sterilize feedingbottles and prepare alternatives tobreastmilk, or who cannot afford tobuy sufficient formula to ensure herchild's nutrition is a wrenching onethat no mother can solve on her own.Support for women facing this dilem-ma is imperative, as the Joint UnitedNations Programme on HIV/AIDS(UNAIDS) made clear in 1996. Thefollowing measures are importantstarting points:
Pregnant women should have ac-cess to voluntary and confidential
30
counselling and testing to deter-mine their health status. If theyare HIV positive, they should re-ceive appropriate treatment toreduce the risk of vertical trans-mission. If they are HIV negative,health education is vital to helpthem and their partners remainthat way.
HIV-positive mothers should beinformed of the risks of both verti-cal transmission through breast-feeding and infections associatedwith artificial feeding in their localenvironment. Each woman shouldbe assisted by HIV counsellors orhealth professionals to under-stand these risks and then makeher own decision.
If an HIV-positive mother has ac-cess to adequate breastmilk sub-stitutes that she can preparesafely, then she should considerartificial feeding. Other alterna-tives include wet-nursing by anHIV-negative woman, which maybe acceptable in some cultures.Heat treatment of expressed breast-milk (62.5°C for 30 minutes) de-stroys the virus, which may be agood choice for some women.
When mothers who test positivefor HIV choose not to breastfeedbut are unable to or cannot affordfeeding alternatives, help will beneeded from a range of parties, in-cluding governmental and partneragencies. Attention must be paidto the needs of the most disad-vantaged women, which includeimproved water and sanitationand attentive family health care.
These measures should be part ofan integrated strategy to reduce ver-
tical transmission since breastfeed-ing is only a small part of the prob-lem. Access to voluntary, confidentialtesting and counselling is key to anystrategy to reduce vertical transmis-sion. Access to a range of prenataland obstetric care measures associ-ated with reduced transmission riskis also essential.
Studies now in progress will soongive a better understanding of themechanisms, timing and risks of ver-tical transmission. It may be possiblein a few years to offer all women low-cost, easily delivered services thatwill minimize or even eliminate therisk of vertical transmission. For now,access to the testing, counselling, in-formation and other services notedabove should be high priorities.

The AIDS pandemic has intro-duced new and volatile considerationsand aspects of care into already sensi-tive areas of human behaviour and in-teraction. High priority should begiven to improving access to servicesthat help minimize the risk of HIVtransmission to women before, duringand after pregnancy, as well as to theirpartners (Panel 6).
Cultural norms and misconcep-tions affect the care women receiveduring pregnancy. In some culturallyconservative communities in parts ofAsia, for example, fish, meat, eggsand fat are not part of the diets ofpregnant women because it is fearedthey will make a baby too large anddifficult to deliver. Research shows,however, that better maternal diet canimprove the birthweight of children inmany cases without causing signifi-cantly increased head circumferenceof the newborn, which is the factormost likely to put small women at risk(Panel 7).
The adjustment of workload is an-other aspect of the care accordedwomen during pregnancy and onewith powerful ramifications.
A survey in one village in theGambia, for example, found that evenduring periods of relatively low sea-sonal agricultural activity, womengained on average just 5.5 kilogramsduring pregnancy only about halfof the recommended weight gain thatwomen need to sustain their develop-ing foetus."
Reductions in a woman's workloadduring pregnancy, combined with morefood of good quality, improve the nu-tritional status of a woman and herunborn child and reduce the risk thatthe child will have a low birthweight.
In Viet Nam, when men assumedsome of their pregnant wives' respon-sibilities during the third trimester ofpregnancy, women rested more, and
their infants weighed more at birth.In Indonesia, infants born to womenwho received a food supplement did notweigh more at birth, but they developedbetter during the first year of life.
The fact that women are usuallythe primary caregivers does notmean that men, families and commu-nities are exempt from care-givingresponsibilities.
The often oppressive and demand-ing patriarchal environment in whichmillions of women live must give wayto an equal partnership in whichwomen enjoy autonomy and the senseof accomplishment that comes frombuilding skills and capacities.
At the same time, girls need to befree from pressures to marry early. Astudy in West Africa, for example,found that nearly 20 per cent of girlsin rural areas of the Gambia andSenegal and 45 per cent of girls inNiger marry before the age of 15.
Figures such as these underscorethe great need for girls and women tobe involved in major personal deci-sions, including not only their marry-ing age but also how closely the birthsof their children will be spaced.
Adolescent pregnancy is a majorrisk factor for both mother and infant,as the girl may not have finishedgrowing before her first pregnancy,making childbirth dangerous.
The infant of a very young mothermay have a low birthweight (Fig. 7).Higher risks of toxaemia, haemor-rhage, anaemia, infection, obstructedlabour and perinatal mortality areall associated with childbearing inadolescence.
A number of measures are essen-tial, therefore, to enable women andgirls to develop their skills and abilities.These include ensuring their access tofamily and community resources,such as credit, and to education andinformation.
The often oppressive anddemanding patriarchalenvironment in whichmillions of women livemust give way to anequal partnership.
31

Panel 7
High-energy biscuits for mothers boostinfant survival by 50 per cent
oo
P'"ooso owow owow
owor_ ..
.7.0"400
oli
'to
0
In the Gambia, well-targeted inter-ventions to improve the nutrition ofpregnant women are making a dif-
ference in the birthweight of their ba-bies, and at the same time sharplyreducing the risk of babies dying dur-ing, or shortly after, birth.
A large, controlled study in thecountry's rural West Kiang region hasdetermined that the number of low-birthweight babies fell by nearly 40per cent and that stillbirth and peri-natal mortality rates in infants werealmost 50 per cent lower when preg-nant women received a daily rationof locally prepared, energy-rich bis-cuits. These remarkable resultsstrengthen the argument for provid-ing food supplements to pregnantwomen to reduce low birthweight.
"The study clearly demonstratesthat improved maternal nutrition, de-liverable through a primary healthcare system, can have highly benefi-cial effects when efficiently targeted
32
at women in genuine need," saysone of the study's authors, Dr. SanaCeesay, of the Dunn Nutrition Centreaffiliated with the University of Cam-bridge, which has been working inpartnership with the Gambian HealthDepartment. The findings were pub-lished in the British Medical Journalin September 1997.
UNICEF estimates that each yearover 24 million babies are bornbelow the low-birthweight thresholdof 2.5 kg, and that 95 per cent ofthese births occur in the developingworld. Low birthweight puts infantsat a greatly increased risk of neonataldeath and is an important cause ofpoor growth and development inlater childhood. It can be due to anumber of factors, including a
woman's small size, uterine infec-tions, smoking, low oxygen levels inthe blood (due to excessive work orhigh altitude) and malarial infection.However, when all these factors are
34
equal, the incidence of low birth-weight is higher in economically de-prived mothers than in affluent ones.
The most likely explanation forthe difference is that inadequatematernal nutrition suppresses foetalgrowth. It has often been difficult,nevertheless, to show real benefits toinfants from improvements to amother's diet during pregnancy. Thestudy in the Gambia provides suchevidence.
In this part of West Africa, previ-ous studies had indicated that preg-nant women challenged as manywomen are by the high energy de-mands of water and fuel collection,agricultural work and child-care ac-tivities but also by the energy andother nutrient needs of pregnancydid not eat enough or well enough tomeet all these needs. The growth oftheir babies was thus threatened.
The five-year, prenatal supple-mentation trial covered 28 villages inone region of the Gambia. In the in-tervention villages, pregnant moth-ers received daily high-energygroundnut-based biscuits, providing1,000 kcal/day on average after 20weeks of pregnancy. The biscuitswere made from local ingredientsand were baked by two village bak-ers in traditional clay ovens. Womenin control villages received anti-malarials, iron/folate supplementsand antenatal care as did women inthe intervention villages, but they didnot receive the biscuits during preg-nancy. Field workers weighed all thewomen in the study at regular inter-vals, and weighed and measured allinfants at delivery.
The biscuit supplement caused ahighly significant increase in birth-weight, reducing the numbers of in-fants classified as low birthweight by39 per cent. Particularly noteworthy

was the reduction in low birth-weight occurring in births duringthe annual 'hungry season', whenbirthweights normally are lowerthan in the harvest season, as aresult of poor maternal nutritioncombined with hard seasonalagricultural work. (It is unlikelythat food supplements wouldhave the same impact on preg-nant women who are not chroni-cally energy-deficient.)
In addition to these remarkablebenefits, this study refutes theidea prevailing in some circlesthat improving the diet of preg-nant women will cause them tosuffer higher rates of obstetricalcomplications because of thelarger size of their newborns.Birthweight was indeed higher inthe children of women who re-ceived the biscuits, but head cir-cumference, which is the factormore closely related to pelvic dis-proportion in birth, was onlyslightly greater. The rate of obstet-ric complications of this kind wasnot higher in the supplementedwomen.
Photo: A healthy newborn sleeps
peacefully in the Gambia.
Basic causesIt is often said that poverty at the fam-ily level is the principal cause of childmalnutrition. While it is true that alack of resources and malnutritionoften go hand in hand, this statementtells only part of the story.
Many poor families do in fact re-ceive adequate nutrition, and malnutri-tion is found in many better-off families.
The broader explanation lies with-in a fuller understanding of the differ-ent types of resources necessary forgood nutrition, and of the factors thataffect families' ability to access andcontrol these resources.
The three components of nutri-tion food, health and care inter-act closely in their influence onfamily life. Often efforts to fulfil oneprecondition for good nutrition com-pete for the same resources requiredto fulfil another condition.
For example, if a woman has tospend excessive time in producingfood to achieve household food secu-rity, her ability to provide adequatechild care can be compromised. The re-sult may be malnutrition in her youngchild.
Political, legal and cultural factors atthe national and regional levels maydefeat the best efforts of householdsto attain good nutrition for all members.
These include the degree to whichthe rights of women and girls areprotected by law and custom; the po-litical and economic system thatdetermines how income and assets aredistributed; and the ideologies and poli-cies that govern the social sectors.
For example, where it is known andappreciated by everyone in societymen and boys, women and girls,teachers and religious leaders, doctorsand nurses that women in the latestages of pregnancy need rest and pro-tection from overwork, families aremore apt to receive the social supportthey need to ensure this protection.
3
How women are valued and treated in society,
including their level of education, affects their
ability to feed and care for their children.
A first-grader in Colombia takes lunchbefore class begins.
33
E

34
Fig. 7 Intergenerational cycle of growth failure
The cycle of poor nutrition perpetuates itself across generations. Young girls who grow poorly become
stunted women and are more likely to give birth to low-birthweight infants. If those infants are girls, they are
likely to continue the cycle by being stunted in adulthood, and so on, if something isn't done to break the
cycle. Adolescent pregnancy heightens the risk of low birthweight and the difficulty of breaking the cycle.
Support is needed for good nutrition at all these stages infancy, childhood, adolescence and adulthood
especially for girls and women.
*owLow weight andheight in teenagers
Source: ACC/SCN, Second Report on the World Nutrition Situation: Vol. I: Global and Regional Results, ACC/SCN, Geneva, 1992.
In places where there is a traditionof non-discrimination against womenin law and custom, women are morelikely to have good access to re-
There is no doubt that whileeconomic poverty is not theonly kind of poverty that
eventually affects nutrition, it is stillan important factor.
Overcoming entrenched povertyand underdevelopment requires re-sources and inputs that few develop-ing countries, particularly the poorest,can muster, either on their own, throughexisting levels of private external in-vestment and loans, or through cur-
36
sources, including credit, and to thedecision-making power that can en-able them to make the best use of ser-vices for themselves and their children.
rent patterns of official assistance andloans.
In 1995, for example, aggregate re-source flows to the developing worldfrom all sources totalled $232 billion,including $59 billion in official devel-opment loans and grants and $156billion in private resources. Middle-income countries were the biggest re-cipients of the private investments andloans: Two thirds went to them andone third to low-income countries.
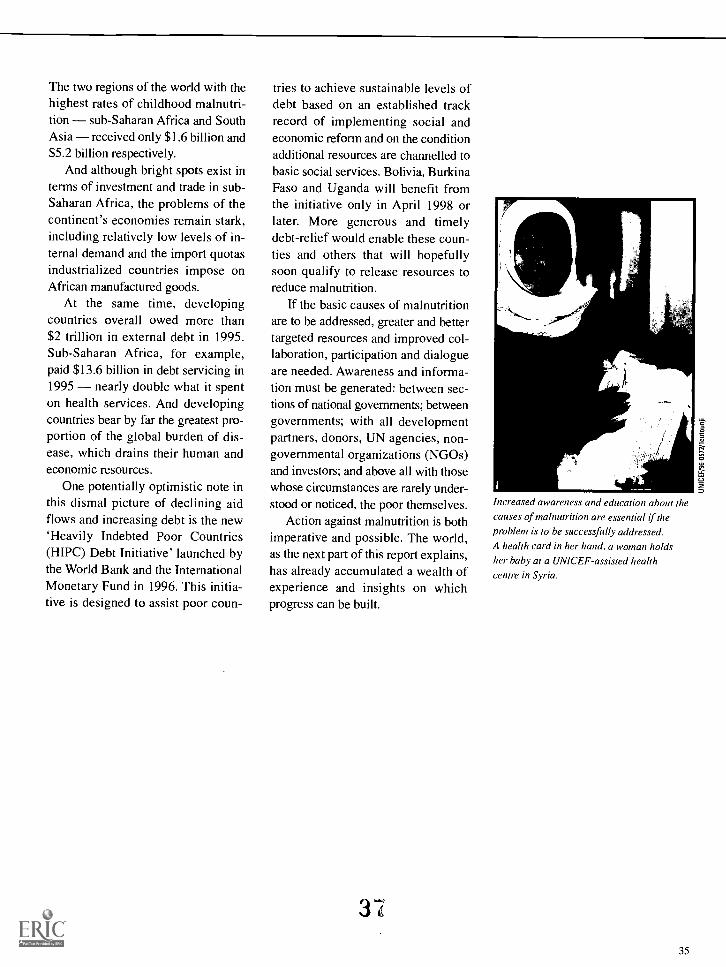
The two regions of the world with thehighest rates of childhood malnutri-tion sub-Saharan Africa and SouthAsia received only $1.6 billion and$5.2 billion respectively.
And although bright spots exist interms of investment and trade in sub-Saharan Africa, the problems of thecontinent's economies remain stark,including relatively low levels of in-ternal demand and the import quotasindustrialized countries impose onAfrican manufactured goods.
At the same time, developingcountries overall owed more than$2 trillion in external debt in 1995.Sub-Saharan Africa, for example,paid $13.6 billion in debt servicing in1995 nearly double what it spenton health services. And developingcountries bear by far the greatest pro-portion of the global burden of dis-ease, which drains their human andeconomic resources.
One potentially optimistic note inthis dismal picture of declining aidflows and increasing debt is the new`Heavily Indebted Poor Countries(HIPC) Debt Initiative' launched bythe World Bank and the InternationalMonetary Fund in 1996. This initia-tive is designed to assist poor coun-
tries to achieve sustainable levels ofdebt based on an established trackrecord of implementing social andeconomic reform and on the conditionadditional resources are channelled tobasic social services. Bolivia, BurkinaFaso and Uganda will benefit fromthe initiative only in April 1998 orlater. More generous and timelydebt-relief would enable these coun-ties and others that will hopefullysoon qualify to release resources toreduce malnutrition.
If the basic causes of malnutritionare to be addressed, greater and bettertargeted resources and improved col-laboration, participation and dialogueare needed. Awareness and informa-tion must be generated: between sec-tions of national governments; betweengovernments; with all developmentpartners, donors, UN agencies, non-governmental organizations (NGOs)and investors; and above all with thosewhose circumstances are rarely under-stood or noticed, the poor themselves.
Action against malnutrition is bothimperative and possible. The world,as the next part of this report explains,has already accumulated a wealth ofexperience and insights on whichprogress can be built.
Increased awareness and education about thecauses of malnutrition are essential if theproblem is to he successfully addressed.
A health card in her hand, a woman holdsher baby at a UNICEF-assisted healthcentre in Syria.
35

N
t
5"*:,....1 .4:V5'5540. #157,5a;
t7A.,e11.1
sa_
F.
.^55
: .
S.
38 2
tiEST COPY AVAILABV4 , _
uc
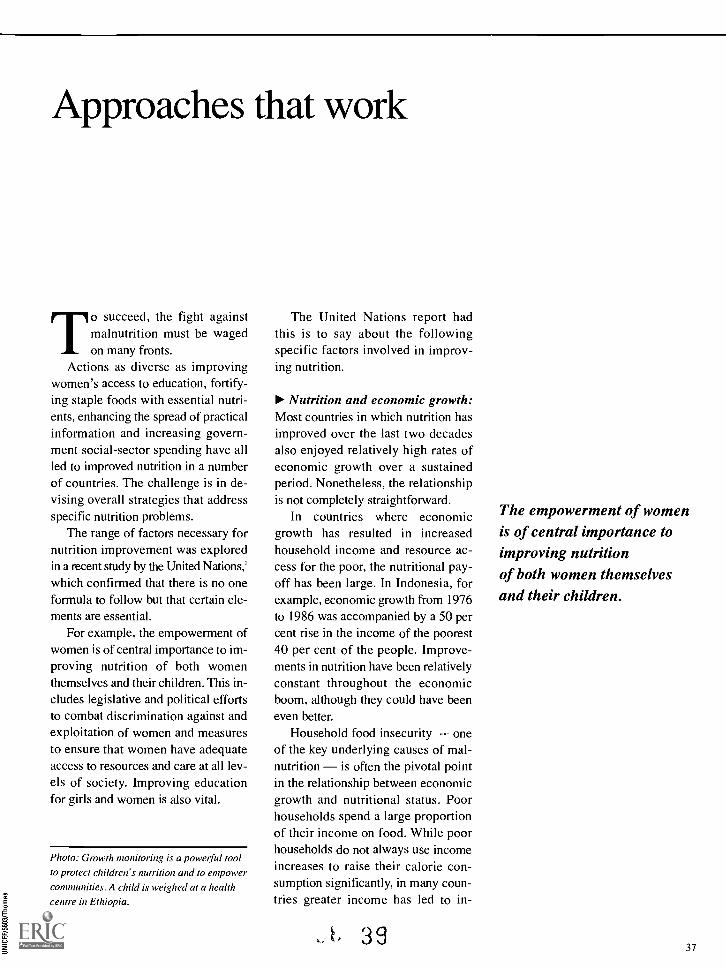
E
a
Approaches that work
To succeed, the fight againstmalnutrition must be wagedon many fronts.
Actions as diverse as improvingwomen's access to education, fortify-ing staple foods with essential nutri-ents, enhancing the spread of practicalinformation and increasing govern-ment social-sector spending have allled to improved nutrition in a numberof countries. The challenge is in de-vising overall strategies that addressspecific nutrition problems.
The range of factors necessary fornutrition improvement was exploredin a recent study by the United Nations,'
which confirmed that there is no oneformula to follow but that certain ele-ments are essential.
For example, the empowerment ofwomen is of central importance to im-proving nutrition of both womenthemselves and their children. This in-cludes legislative and political effortsto combat discrimination against andexploitation of women and measuresto ensure that women have adequateaccess to resources and care at all lev-els of society. Improving educationfor girls and women is also vital.
Photo: Growth monitoring is a powerful toolto protect children's nutrition and to empowercommunities. A child is weighed at a health
centre in Ethiopia.
The United Nations report hadthis is to say about the followingspecific factors involved in improv-ing nutrition.
Nutrition and economic growth:Most countries in which nutrition hasimproved over the last two decadesalso enjoyed relatively high rates ofeconomic growth over a sustainedperiod. Nonetheless, the relationshipis not completely straightforward.
In countries where economicgrowth has resulted in increasedhousehold income and resource ac-cess for the poor, the nutritional pay-off has been large. In Indonesia, forexample, economic growth from 1976to 1986 was accompanied by a 50 percent rise in the income of the poorest40 per cent of the people. Improve-ments in nutrition have been relativelyconstant throughout the economicboom, although they could have beeneven better.
Household food insecurity oneof the key underlying causes of mal-nutrition is often the pivotal pointin the relationship between economicgrowth and nutritional status. Poorhouseholds spend a large proportionof their income on food. While poorhouseholds do not always use incomeincreases to raise their calorie con-sumption significantly, in many coun-tries greater income has led to in-
-1 r 39
The empowerment of womenis of central importance toimproving nutritionof both women themselvesand their children.
37

Panel 8
UNICEF and the World Food Programme
The World Food Programme(WFP), the food aid organiza-tion of the United Nations sys-
tem, began operations in 1963 and isnow the largest such organization inthe world. WFP responds to foodneeds associated with emergenciesand development, often working withthe other two Rome-based agencies,the Food and Agriculture Organiza-tion of the United Nations (FAO) andthe International Fund for Agricul-tural Development (IFAD).
WFP provides three broad cate-gories of food aid: emergency rationsfor victims of natural and man-madedisasters (Food-For-Life); food aiddistributed through health clinics,schools and other community cen-tres to particularly vulnerable groups(Food-For-Growth); and food rationsprovided in exchange for work on de-velopment projects (Food-For-Work).In all three categories, much of WFP'swork is linked to the priorities andefforts of UNICEF.
The link between the two sisteragencies goes beyond organizationalcoordination. Their work is comple-mentary, and they share commongoals. Both recognize that childrenare at once the most vulnerablegroup in society and yet the futureof every community. Together, thetwo agencies have the tools to attackmalnutrition, helping to ensure ac-cess to adequate nutrition, with food,health and care, and to fight with aunified voice for the elimination ofhunger.
In crisis situations requiring Food-For-Life assistance, UNICEF and WFPcollaborate to provide therapeuticand supplementary feeding to savethe lives of young children duringemergencies, as occurred in the re-cent past in the countries of formerYugoslavia. They also share logistics
38
capacity, for example in Uganda,where WFP stored UNICEF's healthkits and supplementary feeding sup-plies, subsequently transporting themto Rwanda during the sudden returnof refugees in late 1996. And they co-operate in making joint assessmentsof the problem of inadequate nutri-tion and priority needs for addressingit, as in the case of the DemocraticPeople's Republic of Korea, where anutrition assessment was completedin September 1997. In southern Sudan,the two agencies, together with NGOsand counterparts, lead an annualneeds assessment mission, which notonly examines food security but also'health security', based on nutritionalstatus and access to health services.
UNICEF and WFP also work to-gether on post-conflict projects, suchas the demobilization of child sol-diers. In Bukavu, in eastern Demo-cratic Republic of the Congo, WFPprovides food to a centre set upby UNICEF to help children whofought in the civil conflict reintegratein society.
Food-For-Growth, the cornerstoneof one of WFP's major priorities, isparticularly close to the concerns ofUNICEF. This type of food aid isdesigned to provide assistance tomothers and children and other vul-nerable groups at critical times intheir lives. In Zambia, UNICEF workedclosely with WFP in 1994 to ensurethat a food supplement, aimed at pre-venting malnutrition in young chil-dren during prolonged drought, wasappropriately formulated and fortified.The high-energy protein supplementwas used as part of a coordinatedprogramme to provide both food andhealth care to children judged to beat particularly high risk of malnutrition.
In Madagascar, UNICEF and WFPwork together to rehabilitate schools
4u
in the poorer regions of the south.UNICEF provides school kits andequipment, and WFP contributesschool meals.
The two agencies also work to-gether on Food-For-Work projectswhen such aid dovetails with UNICEFmandates. In Malawi, for example,following the introduction of free pri-mary education in 1994, WFP andUNICEF later designed a school feed-ing programme with the aim of'Keeping kids in school'. Mothers ofschoolchildren are 'paid' a food allo-cation in exchange for the prepara-tion of school meals.

creased consumption of higher-qualityfoods that tend to be rich in proteinand micronutrients the vitaminsand minerals needed in very small butregular amounts to assure nutrition.
But while economic growth mustbe understood as a frequent contribu-tor to nutrition improvement, it is nota necessary condition for it. A numberof countries, such as the UnitedRepublic of Tanzania in the case de-scribed below, have achieved wide-spread nutrition improvement withoutsignificant overall economic growth.
Nutrition and the status ofwomen: A major conclusion of theUnited Nations report is that in coun-tries where nutrition improvement haslagged behind economic growth, so-cial discrimination against women iscommon. In Pakistan, for example,widespread discrimination againstgirls and women is behind high levelsof illiteracy among women and girls,a very high fertility rate and lower fe-male life expectancy. Child malnutri-tion rates in Pakistan are among thehighest in the world, as is the propor-tion of low-birthweight infants, at 25per cent.
Some experts place the majorblame for the very high child malnu-trition and low birthweight through-out much of South Asia on suchfactors as women's poor access to ed-ucation and low levels of employ-ment, compared with other regions.
On the other hand, women inThailand, where nutrition has im-proved remarkably in the last twodecades, have very high literacy, highparticipation in the labour force, and astrong place in social and household-level decision-making.
Nutrition and social-sector spend-ing: Investment in health, education,sanitation and other social sectors
especially with emphasis on access ofwomen and girls to these servicesis among the most important policytools for improving nutrition.
As a child survival and develop-ment measure, UNICEF has cham-pioned the 20-20 Initiative theallocation of at least 20 per cent ofgovernment spending to basic socialservices to be matched by 20 per centof donor funding in these areas. Thevalue of such investment is becomingincreasingly apparent. For example,there is evidence from Sri Lanka anda number of other countries that in-creases in spending on public healthservices are more strongly associatedwith reduced infant mortality and bet-ter nutrition than are overall increasesin income.
After Zimbabwe achieved inde-pendence in 1980, explicit policieswere followed to redress the lack ofaccess of many communities to basicservices. As a result, there were vastimprovements in health services andimmunization, family planning and arange of educational services for thepoor all of them important deter-minants of the improvements in nutri-tion that the country has enjoyed.
The approaches described aboveare all essential and driven by theright of children and women to ade-quate services and resources.
Actions that are more directed tonutrition improvement as a principaloutcome improving the quality ofstaple foods through fortification, im-proving local-level nutritional surveil-lance capacity, protecting women'sright to breastfeed, sharing informationon better complementary foodsmay have a more rapid and focusedeffect on nutrition.
A number of these more direct ap-proaches that have worked are de-scribed below.
41
Spotlight
WORLD FOODSUMMIT
The World Food Summit, in which 186
countries participated, was organized by
the Food and Agricultural Organization of
the United Nations (FAO) in Rome in
November 1996. The Summit was an
important contribution in the effort to
refocus international attention on the
need to tackle the problems of both food
insecurity and malnutrition. The Summit's
Plan of Action focused on ways of achiev-
ing sustainable food security for all, one
of the necessary conditions for good
nutrition.
The Plan of Action called for an enabling
social and economic environment to
achieve food security and drew attention
to the special contribution that women
can make to ensuring family and child
nutrition, the importance of breastfeeding
and the particular importance of giving
priority to children, especially girls. Other
objectives related to the need to reduce
inequality and poverty and the need for
participatory and sustainable rural devel-
opment policies and for trade policies
conducive to the achievement of food
security for all. A commitment was made
to realize the rights of all to adequate
food and to freedom from hunger.
39

Panel 9
Triple A takes hold in Oman
Over the last 27 years, Omanhas made great strides inchild survival and develop-
ment. Child mortality dropped from215 per 1,000 live births in 1970 to 25in 1995. School enrolment, particu-larly among girls, has increased dra-matically. Revenues from oil haveprovided an economic foundationOman's GNP per capita in 1995 was$4,820 but these gains would nothave been possible without theGovernment's commitment to im-proving people's lives.
Progress has been slower, how-ever, in terms of child nutrition. TheMinistry of Health, with support fromUNICEF, has been working to ad-dress this challenge since 1993. Toimprove children's nutritional status,a community-based programme ofgrowth monitoring, counselling andnutrition education was devised. Aparticular focus is 105 villages of AlDakhiliya, an arid, rocky region inupper-central Oman where a 1995survey found that nearly one third ofthe children under the age of fivewere underweight.
The results to date are impressive.Since the project's inception, therehas been a significant drop in thenumber of underweight children, ac-cording to an appraisal in 1996. Later
40
the same year another appraisal de-scribed the project as well focused,effectively managed and clearly build-ing a momentum towards nationwidenutritional improvement. Motivation,commitment and participation werehigh among mothers and communityvolunteers. And women enjoy theopportunity the programme offers tomeet together and find common groundin helping their children grow better.
The driving force of the pro-gramme is called 'triple A': three con-secutive steps in a problem-solvingcycle of Assessing the problem,Analysing its causes and initiatingActions to improve children's nutri-tion. Triple A is an iterative processthat repeats the cycle of reassess-ment, re-analysis and re-action, lead-ing to regular modifications and im-provements in the approaches taken.
True to this model, the people ofthe small villages and nomadic orsemi-nomadic settlements of AlDakhiliya were involved from thevery start, attending meetings toidentify the problems, discuss solu-tions and select from among them-selves the volunteers who would becentral to the effort.
Every month throughout the re-gion, at public meetings or duringvisits to homes, these volunteersweigh children and chart their growth,referring severely underweight chil-dren to health care centres. They ad-vise families on how to feed childrenand to improve caring practices, onhow to keep children healthy andmanage illness when it occurs andon how to space births. They also re-inforce other public health activities,encouraging pregnant women toregister early for antenatal care, forexample, and helping in communityimmunization campaigns and na-tional health days.
4'
Regional trainers were brought into teach the volunteers about the in-cidence and causes of malnutrition,and how to improve and support ap-propriate feeding and caring prac-tices, using the triple A methodologyto solve problems. A programme co-ordinator at the regional level linksthe communities with programmesupport structures at the nationallevel and supervises, monitors andtrains trainers. There are programmecoordinators at the district level aswell. Finally, back-up support for thevolunteers is provided by teams ofhealth staff from nearby health centres.
A nutritional monitoring systemhas also been created: At the monthlyweighing sessions, the volunteers fillout forms for all children, recordingtheir age and weight. The informa-tion on the nutritional status of all thechildren in a village goes on the formvolunteers send every month to thedistrict health supervisor, who then re-ports the status of the district's chil-dren to the regional coordinator.
The tangible change for familiesand children in Al Dakhiliya has beenso positive that the programme isbeing expanded to additional vil-lages in the region and has been in-troduced in another five regions ofthe country.
Photo: A woman reviews her child's growth
chart with a volunteer nutrition adviser, part
of a community-based effort to promote
better child nutrition in Oman.

Dramatic results fromsmall beginnings
In villages across Tanzania, a seem-ingly modest process began in theearly 1980s when villagers, many ofthem in poor and remote areas, beganto track the weight of their children.With financial support from theGovernment of Italy and day-to-daytechnical support from UNICEF, theChild Survival and Development(CSD) Programme began in five dis-tricts in the Iringa region, eventuallyreaching more than half the popula-tion of the country.
The result was the virtual disap-pearance of severe malnutritionand striking reductions in mild andmoderate malnutrition. The lives ofthousands of children were saved.These improvements were accom-plished against the backdrop of previ-ously high mortality and malnutritionrates among young children thatbegan to climb in Tanzania followingthe economic decline in the 1970s and1980s. Of crucial importance was theGovernment's continued commit-ment, even during this difficult period,to policies worked out with the fullparticipation of communities andfamilies. This approach that was toprove one of the greatest strengths ofthe CSD Programme.
A community-wide pictureA major feature was community-basedgrowth monitoring, which allowed theparents and other community mem-bers to assess the nutritional well-being of their own and other childrenin the village. The results could thenbe compared with figures for neigh-bouring villages and those throughoutthe country.
These assessments provided abaseline at the start of the programmeand were repeated every three monthsthereafter to follow the progress of in-
dividual children. When the resultsfor all the children in the village wereadded together, they provided a con-crete measure of nutritional well-beingand development for the whole com-munity. These quarterly weighing ses-sions sparked the participation notonly of fathers and mothers, but alsoof the whole community in analysingwhy children were malnourished andwhy some seemed to thrive while othersdid not.
An improved understanding of thefactors involved in the nutritionalwell-being of their children in turnhelped the villagers to plan and initi-ate actions that would contribute tobetter growth and overall child health.
Subsequent weighing sessionshelped parents and villagers evaluatethe results and effectiveness of the ac-tions taken and consider new or modi-fied actions. In this way, continuouscycles that combined assessment,analysis and action the 'triple A'approach were established, helpingspark successive nutrition improve-ments in the programme villages(Fig. 8; Panels 9 and 10).
The steps the villagers took wereaimed at increasing feeding fre-quency; encouraging better use ofbasic health services; training healthworkers, including skilled birth atten-dants and healers; improving thehome treatment of diarrhoea andother illnesses; strengthening house-hold technology to improve the por-ridge made for young children;reducing vitamin and mineral defi-ciencies; supporting activities such assmall animal husbandry and homegardening; and improving sanitation.
From bystandersto participantsThe simple tool of growth monitoringallowed the villagers to make betteruse of their own creativity and re-sources, to express their requests for
4,3
Fig. 8 Better nutrition throughtriple AThe 'triple A' cycle of Assessing a problem,
Analysing its causes and taking Action based on
this analysis can be used at all levels of society to
create processes whereby people's right to good
nutrition is fulfilled.
Action
Source: UNICEF, 1997.
Assessment
Analysis
41

Panel 10
Celebrating gains in children's health in Brazil
Residents of the Morro de Causlum in Rio de Janeiro nor-mally have little time for cele-
brations. But on a recent Saturdayafternoon, 40 mothers, their childrenand community leaders affiliated withthe Brazilian Child Pastorate gath-ered under the trees outside a parishhall. The community leaders set thechildren one by one on a scale, re-cording their weight in notebooksand consulting with the mothers onany nutrition or health problems. Theweighing over, the occasion turnedfestive. Community leaders broughtout trays of home-baked cakes andcookies; the yard filled with conver-sation and laughter and the happyshrieks of children at play.
The Child Pastorate's success inprotecting the health and develop-ment of poor children in Brazil is def-initely cause for celebration. ThePastorate estimates that in the com-munities where the programme is inplace, the malnutrition rate amongchildren under five does not exceed
42
8 per cent, compared to 16.3 per centnationally as found in a 1996 Dem-ographic and Health Survey applyingthe same criteria*. Additionally, theChild Pastorate estimates that the in-cidence of low birthweight babies is6 per cent in communities it assists,while the incidence is 9.2 per centnationally.
The Child Pastorate is one of thelargest NGOs in the world devoted tochild health, nutrition and develop-ment. Its aim is to empower the poorboth to improve their children's livesand to participate in transformingtheir communities and their country.
The National Conference of Brazil-ian Bishops founded the NGO in1983, with efforts beginning in onecommunity in Parana state. Now theChild Pastorate operates in 22,000communities, in cities large and small,as well as in rural areas, and serves2.1 million families, including over 3.1million children under the age of sixand nearly 144,000 pregnant women.
The Pastorate's nearly 83,000 com-munity volunteers, mainly women,are the backbone of the programme,working directly with 10 to 20 fami-lies in their neighbourhoods. "Theyare like shepherds, looking after theircommunities," says Dr. Zilda ArnsNeumann, a paediatrician and thenational coordinator of the NGO sinceits inception. Community leaders aretrained in basic child and maternalnutrition and health skills, includingmonitoring growth, tracking immu-nizations, supporting breastfeeding,treating diarrhoea with oral rehydra-tion therapy (ORT) and preventingand detecting pneumonia.
The Pastorate makes nutrition acommunity issue: Families get help,
*Percentage of children below the 10th per-centile of the National Center for Health Sta-tistics (US) reference weight-for-age standard.
44
encouragement and support fromneighbours in improving their chil-dren's well-being. Community lead-ers visit the homes of children whoare malnourished, monitoring theirweight frequently and referring fami-lies to local health facilities if neces-sary. They screen pregnant womenfor indications of malnutrition andrefer them to medical facilities forprenatal care and delivery, and afterbirth, support for breastfeeding is amain priority. Families also learnhow to prepare nutritious meals withlow-cost ingredients that are avail-able locally. The Pastorate promoteschild development through play andactivities to improve speech andmotor skills; its basic education pro-gramme serves 46,000 teenagersand adults.
The Child Pastorate's work isguided by a four-part methodology.The first three 'see' (observe thesituation), 'judge' (define the causes)and 'act' (take action based on thecauses) are similar to UNICEF'striple A approach. The fourth is 'cele-brate' (rejoice in the gains made inchildren's nutrition and health).
The Child Pastorate uses its part-nerships with the Government atall levels, with other NGOs and withthe media to maximum effect,planning budget and activities tocomplement those of the Ministry ofHealth. It works through municipalcouncils to help maintain public ser-vices in communities, from the qual-ity of tap water to health services toeducation.
The broadcast media are strongallies. Nutrition and health messagesdeveloped by the Child Pastorate areaired on a 15-minute radio pro-gramme, Viva a Vida (Enjoy Life),once or twice a week by 910 radiostations. Since 1995, the Child Pas-

torate has received about one quar-ter of the proceeds of the annualfund-raising television campaign'Crianca Esperanca' (Child Hope),sponsored by UNICEF and GloboTV, to assist municipalities withhigh infant mortality rates through-out the country. The Pastorate es-timates that in the campaign'sfirst year, malnutrition declinedby 14 per cent in the municipali-ties featured on the programme.
The Child Pastorate is able tooperate at low cost, in part be-cause of the considerable effortsof its volunteers and the logisticalnet provided by the CatholicChurch. Training, transportationand other support for the pro-gramme's community leaders areamong the main expenses. TheChild Pastorate received assis-tance from UNICEF in its earlyyears. Since 1987, the BrazilianMinistry of Health has providedsupport, with additional fundsraised from the private sector.
Photo: In Brazil, Child Pastorate
volunteers weigh a young girl duringa growth monitoring session.
external support more clearly and tobecome less dependent on such support.
One thing the Tanzanian CSDProgramme did not do was increasethe production or availability of basicfood. While food is obviously essen-tial for good nutrition, the success ofthe Tanzanian approach suggestedthat an overall lack of food at thehousehold level was not the majorcause of malnutrition in young chil-dren and pregnant women in the vil-lages. Less tangible, but singularlyimportant, was the transformation thatmany communities underwent. Frompassively enduring economic declineand marginalization, villagers becameactive participants for change, formu-lating and carrying out policies thatled to better lives for their childrenand themselves. A major feature ofthis transformation was the emer-gence of women as central players,making decisions at both the commu-nity and household levels, with localsupport in the form of start-up financingfor their income-generating activities.
Two other factors underpinnedthe success of the programme: univer-sal education, including adult educa-tion, and a high level of politicalmobilization in Tanzanian villagesthat provided an organized system ofcommunication.
Despite setbacks,durable progressThe Tanzanian experience was hardlyperfect. When decisions are madethrough a repetitive, collective pro-cess, false starts and mistakes are in-evitable. Gains also have been difficultto sustain in some areas. But durableprogress has been made: Commun-ities have actively taken up the fightagainst malnutrition, and they havecollected and analysed informationthemselves. The sense of power andcommitment gained through such aprocess is not quickly relinquished.
45
When women are respected and manage
resources in a community, their own and
their children's nutritional status improves.Women in Bangladesh gain experience
through their own small businesses.
43

Panel 11
Rewriting Elias's story in Mbeya
My name is Elias. I am two-and-a-half years old and I live on the outskirts ofMbeya with my mother, father, two older brothers and an older sister.
We are poor and our house has no toilet. My mother gets up early to fetchwater from the river since our house has no tap. Then she goes to her farmplot, leaving me with my sister, Sophia, who is seven. Sophia collects fire-wood and does other chores for my mother, so she doesn't have much timeto spend with me.
When my mother returns from her plot, she cooks a meal, usually maizeporridge. Last year my mother grew enough maize, but this year she had tosell some to get money to buy other things. Now she says she doesn't knowwhat we will eat when our maize stock runs out.
When I was younger, my mother breastfed me. Since she stopped, I haveoften been ill with fevers and diarrhoea. When I last had a fever, the nurse atthe dispensary said it was probably malaria. My mother bought medicine butI didn't get better. Now I feel very ill and I don't have much energy.
From a drama staged by HANDS' community organizers
Elias's story is a cautionary taleof how poor sanitation, the ces-sation of breastfeeding, disease
and poverty converge all too often inmalnutrition or even death for youngchildren. The Health and NutritionDistrict Support (HANDS) project ishelping people in Mbeya, a largeurban centre in south-west Tanzania,rewrite this tale with a healthier,
happier ending for their children.Launched by the Tanzanian Govern-ment in 1992 with support from theUnited Kingdom Overseas Develop-ment Administration, HANDS' suc-cess has been impressive.
Moderate malnutrition in chil-dren fell to 22 per cent in 1995 from33 per cent in 1992, and severe mal-nutrition dropped to 0.4 per cent
44 46
from 3.3 per cent in areas whereHANDS operates. In contrast, mal-nutrition increased by 7 percentagepoints among children under five inMbeya as a whole.
In the same period, in HANDS'areas, the percentage of pregnantwomen with anaemia declined from37 per cent to 33 per cent, and the in-cidence of low birthweight was alsoreduced. Ninety-nine per cent of chil-dren between the ages of one andfive were fully vaccinated, up from 86per cent. The proportion of house-holds with access to safe water in-creased from 60 to 96 per cent, andthose with pit latrines from 75 to 92per cent. In all, about 125,000 peoplebenefited directly and indirectly.
An important strategy of HANDSlies in careful targeting: The projectfocuses on areas with the highestlevels of child malnutrition and infec-tious diseases, lowest levels of do-mestic sanitation and most limitedaccess to health facilities. Equally im-portant, the community has been in-timately involved, from planningthrough implementation and man-agement, with evaluation. The pooridentified their priorities and becamepartners with government staff inimplementing a range of health-enhancing development activities.
Donor support has been critical inproviding training, essential equip-ment and transport. An investmentwas also made in council and com-munity development funds, enablingthe council to improve health ser-vices and access to safe water, up-grade sanitation and promote house-hold hygiene in targeted areas.
Revitalized maternal and childhealth services in the communitynow are responsible for child vacci-nation, antenatal and post-natal care,family planning, diarrhoea! disease

control, treatments for commonchildhood illnesses and growthpromotion activities. Health andnutrition education activities arestronger and focus on children'svulnerability during the periodwhen complementary foods arebeing introduced, on the nutri-tional needs of pregnant womenand on home-based oral rehydra-tion therapy. Outreach servicesnow support households withmalnourished children, and com-munity-based day-care centreshave improved the well-being ofyoung children.
Four new water schemes serveover 50,000 people, and threehealth centres were upgraded,now reaching 80,000 people. Af-fordable latrines and basic hygieneare promoted, and innovative workis being done on low-cost publictoilets.
Thanks to seminars, formaltraining and drama sessions runby Tanzanian women lawyers, therights of women and children arehigher on the public agenda. Asubsequent survey found that fa-thers are making greater contribu-tions to child welfare.
The HANDS project is now in asecond phase: Tanzanians havereplaced international staff, andproject management lies withlocal council committees. Thecommitment and participation oflocal government staff and com-munity members indicate that theproject is sustainable.
Photo: As one way to improve child
nutrition and maternal health, the
HANDS project has brought safe water
and sanitation to thousands of people.
Women and their children in Tanzania.
About 10 years after the first suc-cesses in Iringa were reported, a com-parable approach is now achievingvery similar results in Mbeya, anotherpart of Tanzania (Panel 11). Virtuallythe same community-based approachthat had proven successful in Iringaand elsewhere in Tanzania was intro-duced in Mbeya. The improvement inthe nutritional status of children there,again carefully monitored and docu-mented, independently confirms thevalidity of this approach.
Nor is the community learning ap-proach used in Tanzania by anymeans unique. In the heart of theSahel, villagers in the Maradi regionof Niger, with support from UNICEFand bilateral donors, have also begunto record their children's weight on aregular basis. These villagers facemany obstacles that communities inTanzania did not have little rainfalland a very short growing season,much less experience with participa-tory development, less support fromthe central level and a history ofvillage-level decision-making that ex-plicitly excluded women. But malnu-trition has been significantly reduced,and the scale of their activities seemson track to rival that of Tanzania(Panel 12).
In Thailand,another success storyOn the other side of the globe, Thai-land has achieved stunning improve-ments in the nutrition of millions ofits children through a combination ofapproaches, aided by a booming econ-omy. The Thai Government estimatesthat malnutrition of under-five chil-dren fell from about 51 per cent in1982 (measured as a proportion ofunderweight children) to about 19 percent in 1990, and that severe malnu-trition virtually disappeared duringthat period. At the local level, growth
47
Thailand has achievedstunning improvements inthe nutrition of millions ofits children through acombination of approaches,aided by a booming economy.
45

Panel 12
Women in Niger take the lead against malnutrition
Better seeds and fertilizer, a
diesel-powered mill and twodonkey carts: With these mod-
est improvements, women in KwarenTsabre, a village in central Niger, arelessening their workloads and begin-ning to overcome the widespreadmalnutrition threatening their children.
The problems seemed intractablejust a few years ago. Over half theyoung children in the village of 680inhabitants were underweight, andmany showed signs of serious vita-min A deficiencywhich can lead toblindness and death.
Progress is being made thanks toa close partnership between thecommunity and district-based gov-ernment agents, founded on the peo-ple's own assessment and analysis oftheir situation. The problems wereacute: As in many villages in theheart of the Sahel region in WestAfrica, Kwaren Tsabre experiencedchronic shortages of staple foods;diets lacked richness and diversity;
46
J
women were grossly overworkedand had little access to education andinformation; and health services wereremote and often of poor quality.
Because women were most seri-ously and directly affected, it wasnecessary to put them at the centreof decision-making and have thembenefit from the new initiatives. Awomen's group the Village Wo-men's Committee was formed,with members trained by govern-ment agents in the district. The firststep, as Zouera, the first President ofthe Committee, explained, was toidentify actions that could bringabout measurable improvements innutrition.
"We realized that because ourworkdays were so long between14 and 17 hours we couldn't carefor our children as well as we wantedto," she said. Getting a loan for adiesel mill to relieve the women ofthe arduous task of hand-poundingsorghum and millet was one re-
48
sponse. Another was to purchasetwo donkey carts to reduce the hoursspent carrying wood and water. Bothmill and carts save time and generateincome: The villagers of KwarenTsabre and their neighbours frommiles around agreed to pay modestfees to grind grain and use the carts.
With technical help, better irriga-tion and improved seeds and fertil-izer, staple crop yields have nearlytripled and new vitamin A-rich foodsare also being produced, includingamaranth and baobab leaves. Thewomen incorporated these vitamin Asources and small amounts of oilinto their usual meals and soonbegan noticing a decrease in night-blindness (a symptom of vitamin Adeficiency) among their children.Women in neighbouring villageshave reported that night-blindnesshas also been reduced among preg-nant women.
Zouera and her colleagues in theCommittee also decided, in consulta-tion with government technical staff,to set up a cooperative cereal bank.This bank purchases and stores grainsafely after the harvest and givespoor families a place to buy grain atreasonable prices during pre-harvestseasons, when they cannot affordthe market price.
In a short time, the cereal bankpaid for itself and even turned aprofit. "With this money we're subsi-dizing other activities, such as thedistribution of peanut butter as acomplementary food for very youngchildren who are still breastfeeding,"Zouera said. The Committee alsogives a small cash bonus to thewomen who supervise the regulargrowth monitoring of children. Themonitoring enables women to seefor themselves what is happeningwith their children, and they can use

the information to analyse and acton problems in their own homesand community.
Children's malnutrition rates inKwaren Tsabre have fallen by10 percentage points in a shorttime between 1995 and 1996. Andthis is only the beginning. Poor-quality and inaccessible healthservices are still a problem and animpediment to further gains againstmalnutrition.
But the women of KwarenTsabre now know that they havethe tools and a process for ad-dressing even that difficult prob-lem with the help of their partners.Multiply the achievements ofKwaren Tsabre by the 326 villagesacross the Maradi Province ofNiger into which this programmehas spread, and one begins to seevictory emerging in the age-oldbattle against child malnutrition.
Photo: Long hours spent carrying water
and fuel and other arduous work
drastically reduce women's time to care
for their children. Cooperative efforts
help reduce the burden. Members of an
agricultural cooperative in Niger build
a terrace to prevent soil erosion.
monitoring and promotion (GMP)coverage increased nationwide fromabout 1 million children to about 2.6million.
GMP was combined with supple-mentary feeding activities in some lo-cations. In addition to this increasedattention to nutrition, a number ofpolicy and programme measures con-
tributed to reducing malnutrition andpoverty. Targeted to poorer regions,these included: school lunch pro-grammes; surveillance of 'basic mini-mum needs' indicators; village-levelplanning to ensure that priority needswere met; rural job creation; andsupport for small-scale food produc-ers. Community participation, in vary-ing degrees, was part of all Thaiprogrammes.
There is general recognition thatmore needs to be done in Thailand,but these remarkable gains are a solid
foundation for the future.
Protecting, promotingand supportingbreastfeedingVirtually all of the community-basedprogrammes that have resulted in re-ductions in malnutrition have focusedon improvements in infant feeding,especially the protection, promotionand support of breastfeeding.
While community-based supportfor breastfeeding is a major achieve-ment, even the efforts of communitieswell aware of the central importanceof breastfeeding can be foiled bylarger economic and institutionalpressures.
The blitz of inappropriate advertis-ing and promotion by manufacturersof breastmilk substitutes mostlyinfant formula has been a centralchallenge in the fight to protect andpromote breastfeeding. While infantformula is an important product forthe minority of children who for some
.447

.:4
Keeping babies close to their mothers isfundamental in a baby-friendly hospital.A mother and child in Brazil 'room in'.
48
reason are not, or cannot be, breast-fed, sales and promotional activitiesaround it have sometimes been basedon untrue claims of its value com-pared with that of breastmilk.
Promotional activities, such asproviding free or subsidized suppliesof infant formula, bottles and teats inmaternity wards, have also under-mined the best intentions and the con-fidence of new mothers to breastfeed.
In 1981, the World Health As-sembly, which consists of the healthministers of almost all countries, re-sponded vigorously to inappropriatepromotional efforts of the infant-foodindustry by adopting the InternationalCode of Marketing of BreastmilkSubstitutes, drafted by WHO, UNICEF,NGOs and representatives of the in-fant food industry.'
The Code establishes minimumstandards to regulate marketing prac-tices by setting out the responsibilitiesof companies, health workers, gov-ernments and others and providesstandards for the labelling of breast-milk substitutes. Among its provi-sions are that health facilities mustnever be involved in the promotion ofbreastmilk substitutes and that freesamples should not be provided topregnant women or new mothers.
Progress has been relatively slowin translating the Code's minimumprovisions into national laws. As ofSeptember 1997, only 17 countrieshad approved laws that put them intofull compliance with the Code. Train-ing and development of model legis-lation are now accelerating action inthis area. Support from the Govern-ment of Sweden has enabled UNICEFto provide greater technical assistanceon Code implementation and otherlegal aspects of breastfeeding support.
A recent report, Cracking theCode, by the Interagency Group onBreastfeeding Monitoring, based inthe United Kingdom, highlights the
5
work that remains to be done. It docu-ments widespread violations Of theCode by multinational companies infour countries: Bangladesh, Poland,South Africa and Thailand.
The Baby-FriendlyHospital InitiativeAs a complement to community-based efforts to protect, promote andsupport breastfeeding and to promul-gate the Code, UNICEF and WHO in1991 began an intensive effort to trans-form practices in maternity hospitals.
The Baby-Friendly Hospital Ini-tiative (BFHI), as the effort is called,brought a structured programme tobreastfeeding support and, in just sixyears, has helped transform over 12,700hospitals in 114 countries into centresof support for good infant feeding.These baby-friendly hospitals arehavens of protection for breastfeed-ing, where women and children arenot subject to advertising and promo-tional activities for infant formula orfeeding bottles, and where they canreceive effective and well-informedhelp for a sound start to breastfeeding.
BFHI has a simple but thoroughapproach. Through a WHO-UNICEFtraining programme that has beentranslated into the official languagesof the United Nations and into manyothers, the professional staffs of ma-ternity hospitals are trained in lacta-tion management and support. Staffmembers, along with the directors ormanagers of their health facility, makea commitment to fulfil the initiative's`Ten steps to successful breastfeed-ing' (see sidebar). These include pledg-ing to ensure that women and new-borns can remain together all the timeand that women must be free to beginbreastfeeding promptly after birth andto continue exclusive breastfeedingon demand during their hospital stay.
Step 10 calls for setting up breast-feeding support groups that new mothers

can rely on. Hospitals can be awarded`baby-friendly' status only when spe-cially trained independent evaluatorshave ensured that all 10 steps are met.
It is hard to overestimate the suc-cess of BFHI. More than a millionpeople are working to implement itsprogramme, and the overall pace ofhospital certifications has not slowed.Patterns of declining breastfeeding,particularly in urban areas, have beenreversed in country after countryfollowing BFHI implementation(Panel 13).
The success of the initiative canalso be measured in the health ofyoung children. In Panama, the Min-istry of Health reported a 58 per centreduction in respiratory infections anda 15 per cent decline in diarrhoea ininfants in just one year in a singlebaby-friendly facility, the AmadorGuerrero Hospital. In north-easternBrazil, Acari Hospital credits BFHIwith dramatic cost savings from de-creased hospitalization of infants andreduced case fatality among them. Inthe first two years of BFHI implemen-tation at the Central Hospital ofLibreville in Gabon, it was estimatedthat there was a 15 per cent reductionin cases of neonatal diarrhoea, a 14per cent reduction in dehydration andan 8 per cent reduction in mortality.
LI Successes outside thedeveloping world
BFHI is not just for non-industrializedcountries.
An evaluation in the Republic ofMoldova, once part of the formerSoviet Union near the Romanian bor-der, showed an average reduction inall neonatal infections in four baby-friendly hospitals from about 18 percent to 7.5 per cent in two years of theprogramme. The neonatal infectionrate in the hospital that had been certi-fied as baby-friendly the longestdropped from 23 per cent to 3.4 per
cent. Rates of breastfeeding initiationin the country rose appreciably, andrates of continued breastfeeding at 6and 12 months were significantlyhigher over the period of implementa-tion of the programme.
Similar results are being reportedfrom Asia and Latin America, andsome countries are in the process ofconducting extensive evaluations ofBFHI's impact. In the United States,there is an active BFHI programme,and 11 hospitals have been declaredbaby-friendly.
BFHI was conceived by a smallgroup of experts with vision and lead-ership and was tested, modified andthen introduced globally. But it couldnot have succeeded without the en-gagement of local institutions andcommunities. Local NGOs have playeda significant role in the promotion andsustenance of BFHI in many coun-tries. And an international NGO, theWorld Alliance for Breastfeeding Ac-tion (WABA), founded in 1991, hashelped solidify actions in support ofthe initiative and breastfeeding beyondthe hospital through its work in network-
ing, information sharing and advocacy.National breastfeeding commit-
tees, though often established prior toBFHI, were energized by the initia-tive's concrete achievements. Paedi-atric and obstetric professional asso-ciations have endorsed the programmeand have been educated by it.
BFHI has also helped establishbreastfeeding firmly on the politicalagenda. The challenge for the futureis to use the political energy behindBFHI to ensure that breastfeedingpromotion and support extend beyondhospital walls and that breastfeedingsupport groups become a constant prior-ity for communities and governments.
1:1 Complementing breastfeeding
Good infant feeding includes not onlysupport for breastfeeding but also en-
Spotlight
TEN STEPS TOSUCCESSFUL
BREASTFEEDING
Every facility providing maternity services
and care for newborn infants should:
1. Have a written breastfeeding policy
that is routinely communicated to all
health care staff.
2. Train all health care staff in skills
necessary to implement this policy.
3. Inform all pregnant women about the
benefits and management of breast-
feeding.
4. Help mothers initiate breastfeeding
within a half-hour of birth.
5. Show mothers how to breastfeed
and how to maintain lactation even
if they should be separated from
their infants.
6. Give newborn infants no food or
drink other than breastmilk, unless
medically indicated.
7. Practise rooming-in allow moth-
ers and infants to remain together
24 hours a day.
8. Encourage breastfeeding on demand.
9. Give no artificial teats or pacifiers
(also called dummies or soothers) to
breastfeeding infants.
10. Foster the establishment of breast-
feeding support groups and refer
mothers to them on discharge from
the hospital or clinic.
In addition, facilities should refuse to ac-
cept free and low-cost supplies of breast-
milk substitutes, feeding bottles and
teats.
From Protecting, Promoting and Supporting
Breastfeeding: The special role of maternity services:
A Joint WHO/UNICEF Statement (WHO, 19891 and
The Global Criteria for the WHO/UNICEF Baby-
Friendly Hospital Initiative' (UNICEF, 19921
49

Panel 13
BFHI: Breastfeeding breakthroughs
Smiling at her infant in her arms,Elba Diaz awaits Juanito'ssix-month check-up at a pri-
mary health care centre in southernSantiago. Her third child draws noth-ing but compliments from healthworkers, unlike Ms. Diaz's first twochildren, who were not so healthy.The difference is that Juanito bornat the Barros Luco Hospital, one of 19baby-friendly hospitals in Chile isthe only child she has been able tobreastfeed exclusively.
"Immediately after Juanito wasborn," recalls Ms. Diaz, "he was laidon my body. Words can't describehow blissful I was, feeling hiswarmth and looking at his flushedface so close to me. I began nursinghim at the breast while we were stillin the delivery room, and he was be-side me always, receiving only mybreastmilk."
In Chile, breastfeeding supportand counselling for mothers have ledto enormous health benefits for tens
50
of thousands of children like Juanitoin little more than a decade. In 1985,only 4 per cent of infants were exclu-sively breastfed for the first sixmonths of their lives. Remarkably,only a year after the Baby-FriendlyHospital Initiative (BFHI) was launchedin 1991, a study of 9,200 infants na-tionwide showed that the rate hadrisen to 25 per cent. And preliminaryresults of a national survey in 1996suggest that the exclusive breast-feeding rate for the first six months isnow about 40 per cent.
What lies behind this transforma-tion? Training is an important part ofthe answer. With support from theNGO Wellstart International andUNICEF, training materials wereadapted, and in just four years over7,500 health workers learned to helpwomen breastfeed effectively. Strongsupport from the Ministry of Healthwas another factor, and UNICEF pro-vided sustained advocacy. The Na-tional Breastfeeding Commission,
J4
organized in 1992, has also keptbreastfeeding high on Chile's childhealth agenda.
Another effective measure wasexpanding 'baby-friendly' practicesinto primary health care centres,where trained staff offer breastfeed-ing education and support. "The staffacquainted me with breastfeedingduring my pregnancy," said onemother. "The first week after deliv-ery, I joined a group session at theclinic to share my concerns withother breastfeeding mothers. I feelvery secure, having easy access toprofessional advice on any breast-feeding questions."
These achievements in Chile havebeen replicated across the worldthrough BFHI and related efforts. InCuba, only about 63 per cent of new-borns were breastfed exclusively atthe time they left the hospital in 1990.Now, six years after BFHI was intro-duced, an estimated 98 per cent ofnewborns are exclusively breastfedwhen they leave the maternity ward.And more strikingly, about 72per cent of those infants are exclu-sively breastfed through four monthsof age, up from 25 per cent in 1990.All 44 hospitals handling over 1,000deliveries a year and 42 per cent ofsmaller hospitals in the country arebaby-friendly. In 1996, Cuba ex-tended the baby-friendly programmeto the community level by putting itinto practice at small communityhealth centres attended by familydoctors.
On the other side of the globe,China had over 6,300 baby-friendlyhospitals at the end of 1996. Thanksto BFHI and some regulation of themarketing of breastmilk substitutes,48 per cent of infants in urban areasand 68 per cent in rural areas arenow exclusively breastfed for four
months, a 1994 survey found. Justtwo years earlier, the rates were10 and 29 per cent respectively.Considering that about 20 millioninfants are born each year inChina, this represents a remark-able accomplishment.
Iran, which began promotingbreastfeeding in the 1980s, hasheld training workshops for over30,000 health professionals eachyear between 1991 and 1996 afterBFHI was introduced. The nationalsupport has led to a leap in the ex-clusive breastfeeding rate from 10to 53 per cent in that period. Anadded windfall is the more than$50 million that the country savesannually, as infant formula im-ports dropped by 75 per cent from48 million tins in 1991 to 12 mil-lion in 1996.
Because of the many benefitsof breastfeeding since BFHIstarted, it is impossible to calcu-late the lives saved and thosemade better though they cer-tainly number in the millions. It isdifficult to imagine any other wayin which these results could havebeen achieved so effectively andin such a short time. Baby-friendlyhospitals have surely made theworld a friendlier place for babiesand their families.
Photo: A woman breastfeeds her newborn
at a hospital in China. BFHI has increased
breastfeeding rates significantly in thecountry.
suring good complementary feedingpractices for children more than sixmonths old whose nutritional needscan no longer be fully met by breast-feeding, though sustained breastfeed-ing well into the second year of liferemains important (Panel 14).
The CSD Programme in Tanzaniabrought about a number of significantimprovements in household-level prep-aration of good-quality complemen-tary foods, including porridges withreduced viscosity designed to increaseconsumption by young children.
Until recently, however, there hasnot been good scientific consensus ona number of questions related to theadditional food needs of older breast-fed children. WHO and UNICEF re-cently brought together a group ofinternationally renowned scientistsand programme practitioners familiarwith these problems, and a consensusreport will soon be published that willoffer technical guidance for improv-ing complementary feeding.
Targeting specificnutritional deficienciesIn assessing nutrition problems andimplementing programmes to attackthem, it is not possible to separateprotein-energy malnutrition from vit-amin and mineral deficiencies. Inte-grated community-based programmesthat have achieved reductions in over-all malnutrition have usually done soby addressing both micronutrient andprotein-energy deficiencies. But amongthe kinds of malnutrition identified atthe 1990 World Summit for Children,progress has been more rapid in re-ducing some deficiencies than others.
Grains of salt: Reducingiodine deficiency disordersThe reduction in iodine deficiency,the world's leading cause of prevent-able mental retardation, is a global
.3
174 J 3
The reduction in iodinedeficiency, the world'sleading cause of preventablemental retardation, is aglobal success story byany standard.
51

Panel 14
Tackling malnutrition in Bangladesh
Anew project in Bangladeshis helping to reduce malnu-trition among children and
mothers by improving caring prac-tices, supporting breastfeedingand empowering women and theircommunities.
Some 56 per cent of Bangladeshichildren under five suffer from mod-erate and severe malnutrition, 21per cent of whom are severely under-weight, and studies show that morethan 70 per cent of pregnant andbreastfeeding women are also mal-nourished. Protein-energy malnutri-tion is the main problem but, as oftenhappens, it occurs together with suchconditions as iron deficiency anaemiaand vitamin A deficiency. In Bangla-desh, lack of food is not the maincause of malnutrition; the lack ofproper caring practices for childrenand pregnant women is an importantcontributing factor.
Recognizing that malnutrition ishindering national development, the
52
Government has formulated a Na-tional Nutrition Policy and launcheda nationwide nutrition interventionprogramme, the Bangladesh Inte-grated Nutrition Project. The initia-tive aims to address malnutritiondirectly and help promote fastersocio-economic development.
Community nutrition promotersare the backbone of the project.Earning about $12 a month, they aretrained for two months, includingone month on the job. They learnhow to understand the causes andsigns of malnutrition and techniquesfor its treatment and prevention.They canvass their communities,persuading mothers to bring theirchildren to the Community NutritionCentres for monthly weighing andgrowth monitoring, and explainingthe importance of child care, includ-ing children's needs for exclusivebreastfeeding in the first six months;the need for smaller, more frequentand nutritious meals up to age three;
.54
and for extra feeding during and afterillnesses to prevent malnutrition.
Marium Begum, one of the nutri-tion promoters, has already startedto achieve results in her village.During growth monitoring sessionsat her Community Nutrition Centre,situated in one of the homes in hervillage, Ms. Begum could see thatShewli, a one-year-old girl, was suf-fering from severe malnutrition. Ms.Begum explained to Shewli's mother,Shamsun, how to give her daughtera special locally made diet supple-ment. She also helped Shamsun tounderstand that she had been unableto breastfeed because she had notbeen eating enough herself. Fol-lowing local tradition, Shamsun wasaccustomed to eating last, after serv-ing food to her family, and there wasoften little food left. Ms. Begumexplained how to re-lactate that is,to resume lactation after it hasstopped for some time and ar-ranged for intensive counselling atthe Community Nutrition Centre.
Improving the nutrition of adoles-cent girls and pregnant and lactatingwomen is another priority of the pro-ject. The nutrition promoters urgewomen to use iodized salt in theirhouseholds to prevent iodine defi-ciency disorders, and to use oral re-hydration therapy when a child hasdiarrhoea to prevent dehydration.They discuss the use of vitamin Aand iron supplementation.
Special diet supplements are pro-vided to malnourished women andchildren. Village Women's Groups,comprising up to 11 volunteers ineach community, buy ingredients forthe supplement a carefully weighedmixture of rice, lentils, molasses andoil at local markets to prepare andpackage them. Each member of thegroup earns about $10 per month

through the sale of packets to thenutrition centres.
The Ministry of Health andFamily Welfare, with the assis-tance of the Bangladesh RuralAdvancement Committee (BRAG,has established nearly 1,000 Com-munity Nutrition Centres in peo-ple's homes, each operating sixdays a week. The centres cover65,000 children and 16,000 preg-nant and lactating women. By theyear 2001, the goal is to have8,000 community nutrition pro-moters reaching 100,000 pregnantor lactating women and 500,000children under the age of two.
In the case of Shamsun, herdiet has improved with the guid-ance and encouragement ofMarium Begum. She was able tobreastfeed her daughter, comple-menting the breastmilk with nor-mal family food and the specialdietary supplement. And insteadof selling the eggs her six henslay, she feeds them to her family.Shewli, although still small andthin, has resumed healthy growth.
Photo: Better caring practices, includingimproved personal hygiene, are essential
to reducing malnutrition. In Bangladesh,a nutrition promoter helps women who
are about to feed their children to wash
their hands.
success story by any standard. Thisachievement, which began to showsignificant results beginning in 1992,involved a coordinated internationaleffort to change diets in a subtle butimportant way an approach thathas had an impact on probably morepeople worldwide than any previousnutrition initiative.
A diet deficient in iodine exerts itssaddest and most significant effect onthe developing embryo, starting ataround 12 weeks after conception. In-adequate iodine results in insufficientthyroid hormone, which in turn leadsto a failure of normal growth of thebrain and nervous system. The resultis all too often a child born with a life-time disability.
The practice of using iodized saltas a safe, cheap and effective way tocombat iodine deficiency disorders(IDD) had a long track record by1992. It was introduced in Switzer-land in 1922, in the United States in1924, and in the Andean countries ofSouth America in the 1950s and 1960s.
Among the goals adopted at theWorld Summit for Children, the vir-tual elimination of IDD was regardedby UNICEF as one of the most ac-hievable. Universal salt iodizationall salt destined for both human andanimal consumption was the ob-vious strategy to advance the attackon IDD.
Getting the job done, a continuingeffort, is a process that uses the 'tripleA' approach assessment, analysisand action on a global scale.
In some countries, the problem ofiodine deficiency was known, but rig-orous assessments using such indi-cators as goitre prevalence and urinaryiodine excretion were needed toconvince policy makers and salt pro-ducers of the need for action. The nextstep was to analyse these results,along with the workings of com-mercial salt networks and the organi-
55
Rapid gains in salt iodization worldwide
demonstrate the effectiveness of public- and
private-sector cooperation in combating
nutritional deficiencies. In Bolivia, a man
seals a packet of iodized salt.
53

UNICEF estimates thatnearly 60 per cent of alledible salt in the world isnow iodized, and amongcountries in the world withrecognized IDD problems,all but seven have passedappropriate legislation toensure universal iodization.
54
zation of the salt industry. Using ad-vocacy and attention to legal detail, itwas also necessary to pass appropri-ate legislation to ensure correct levelsof salt iodization, and to protect io-dized salt producers by eliminatingnon-iodized salt from the market.
Actually getting iodine into saltsupplies was another matter. The taskwas addressed in ways that rangedfrom relatively easy adaptations byresource-rich major industrial saltproducers that supply whole countries,to providing support for small producersto enable them to iodize salt without lossof income. Quality control and evalu-ation of the impact of salt iodizationremain continuing challenges. Thanksto support from many quarters, all ofthese steps have been realized in ashort time in an extraordinary numberof countries. UNICEF estimates thatnearly 60 per cent of all edible salt inthe world is now iodized, and amongcountries in the world with recog-nized IDD problems, all but sevenhave passed appropriate legislation toensure universal iodization.
Of the countries that had IDDproblems in 1990, 26 now iodize over90 per cent of their edible salt or im-port that proportion if they are not saltproducers. Another 14 countriesiodize between 75 per cent and 90 percent of their salt. As late as 1994, 48countries with established IDD prob-lems had no programmes at all. Ofthese, 14 now iodize more than halftheir salt (Fig. 9).
At the level of children and theirfamilies, these results, though still in-complete, are improving lives by thethousands. It is estimated that up until1990, about 40 million children wereborn each year at some risk of mentalimpairment due to iodine deficiencyin their mothers' diets. By 1997, thatfigure was probably closer to 28 mil-lion' still too many, but represent-ing a clear and rapid decrease.
56
The number of children born eachyear with cretinism is difficult to esti-mate, but in 1990 it was on the orderof 120,000. It is probably about halfthat now.
It is impossible to measure the im-pact of IDD on miscarriages, whichare rarely well reported in health sta-tistics, but the improvements are surelynoticeable by affected women and theirfamilies. In highly iodine-deficientareas, infant mortality was long knownto be elevated, but recent research nowindicates that increasing the iodine in-take of young infants to adequate levelsmay improve their survival to a fargreater degree than previously ex-pected, probably through improve-ments in their immune systems.
The gains in salt iodization cameabout largely because of the work ofan alliance of responsive and knowl-edgeable partners. WHO, in collabo-ration with UNICEF and the Inter-national Council for the Control ofIodine Deficiency Disorders (ICCIDD),not only helped raise awareness of theimportance of IDD but also worked toensure scientific consensus and infor-mation on standards for: levels of saltiodization, the safety of iodized salt inpregnancy, and indicators for moni-toring and evaluation. UNICEF, WHOand ICCIDD also provided technicaland financial support for many stepsof the process.
Kiwanis International, a global ser-vice organization, provides fundingsupport and continues to educate itsgrass-roots membership about IDD(Panel 15).
The Government of Canada was amajor player in all stages of this work,supporting UNICEF programmes inmany countries and supporting theOttawa-based Micronutrient Initia-tive, which in turn has extended tech-nical support and funding to fieldprogrammes, including the develop-ment of monitoring guidelines. In

Fig. 9 Iodine deficiency disorders and salt iodization
Iodine deficiency disorders (IDD) were still a major public health problem in many parts of the world in 1990. Today, programmes to produce or import iodized salt are in
place in most developing countries.
Global prevalence of IDD (circa 1990)
IDD is a public health problem El IDD is not a public health problem No data Countries not assisted by UNICEF
Percentage of households consuming iodized salt (1992-1996)
III Less than 50% 50% to 89% 90% or more No data Countries not assisted by UNICEF
Source: IDD data from UNICEF, 'Report on Progress Towards Universal Salt Iodization', 1994. Salt iodizatiopat&gompiled by UNICEF, 1997.Note: The boundaries shown on this map do not imply official endorsement or acceptance by UNICEF. Dotted line rtysers approximately the Line of Control in Jammu and Kashmir agreed upon by India and Pakistan.
55

Panel 15
Kiwanis mobilize to endiodine deficiency's deadly toll
Hundreds of times during thepast several years, the Rev-erend Bob Wildman, a retired
Protestant pastor, has ambled intoKiwanis International Club meetingsall over Illinois and eastern Iowain the Midwestern United States.Usually, he is granted only a fewminutes to win over some very toughaudiences.
Many of the men and womenwho make up these Kiwanis clubsare business executives and profes-sionals who have supported the or-ganization's service projects helpingchildren and others in need in theirown communities. The 73-year-oldRev. Wildman, a veteran Kiwanisleader, is determined to expand theirnotion of neighbourhood to includethe global village.
He has added his preacher's voiceto the Kiwanians' first internationalservice project: the campaign to wipeout one of the world's most devastat-ing nutritional problems iodinedeficiency disorders (IDD). Kiwanis
56
leaders have brought to this globaleffort the fund-raising muscle of their600,000 members in 83 countries.
An estimated 28 million babiesare born each year at risk of mentalimpairment due to insufficient iodinein their mothers' diets. Hundreds ofthousands of children and adults suf-fer the most debilitating effect ofiodine deficiency: a condition knownas cretinism.
Rev. Wildman's challenge has beento make club members in his areacare about villagers in remote regionsof Africa, Asia and Latin America. Inmany developing countries, lack ofiodine has taken a horrendous toll onchildren from physical deformitiesto mental retardation. Iodization oftable salt a method of fortificationnow taken for granted in industrial-ized nations and costing less than 5cents per person per year can ridthe world of this tragedy.
Before he speaks, Rev. Wildmanplaces on the podium a poster-sizedcopy of a cherished photo of a tiny
58
boy named Abdul Alim whom hemet in a 1994 visit to a village inBangladesh. Abdul is an eight-year-old in a four-year-old's deformed andmalfunctioning body. He is pro-foundly mentally retarded and deafand is held by a young man from thevillage because he cannot walk.
Rev. Wildman describes Abdul'sdisabilities and the severe hardshipshis care places on a village economy.The picture of this small child bridgesgeographical and cultural divides, andsoon his audiences are ready to climbon the IDD campaign bandwagon.
When Kiwanis International join-ed the campaign against IDD in 1994,they pledged to raise $75 million byJuly 1998. Since then, they have be-come a key part of the campaign,with over $20 million raised orpledged so far for programmes inover 50 countries through Kiwanians'efforts. UNICEF estimates that thiscontribution has saved around 3 mil-lion children from irreversible mentalretardation.
Kiwanis leaders like Rev. Wildmanhave been shrinking the distance be-tween their home towns and placeslike Abdul Alim's tiny village in Bang-ladesh, and the concept of thinkingglobally while acting locally is takinghold in creative ways around theworld.
The Kiwanis Club of Ried imInnkreis in Austria staged a perfor-mance of the Chinese Dance andAcrobats Ensemble, for example,raising $9,000 for the IDD campaign.Kiwanians in Atikokan in Ontario(Canada) brought in the Jolly Ukran-ians, a folk group, netting the cam-paign $2,000. Kiwanis Clubs in thePhilippines are supporting the cam-paign in their own country, whereiodine deficiency is still a threat,through community education pro-

jects and the distribution ofiodized salt.
Kiwanians in the Netherlandshave pledged to raise $600,000through the sale of salt pots and aphoto essay book. Hong KongKiwanians took in $10,000 for thecampaign by obtaining sponsor-ships for completing a rugged 60-mile hike. The Kiwanis Club ofBergerac (France) donated pro-ceeds from a masked ball, whileKiwanians in Christchurch (NewZealand) raised $1,300 with abowling tournament. The KiwanisClub of Spanish Town (Jamaica)convinced a local salt factory toiodize salt, sponsored IDD educa-tion events and set up an IDDprevention billboard on a majorhighway.
The 95-member Kiwanis chap-ter in Rockford, Illinois, Rev.
Wildman's home town, has man-aged to more than double its orig-inal goal of $30,000 through fund-raising efforts large and small.When Kathleen Sullivan was re-cently installed as the chapter'snew president at a dinner ban-quet, instead of buying expensiveflower arrangements for eachtable, Ms. Sullivan decided onhome-made centrepieces an-chored with boxes of salt. "Themoney saved went to the IDD
campaign," says Ms. Sullivan,"and when I was making thesecentrepieces with my daughters, Iexplained what IDD was doing tochildren just like them. I like to be-lieve they have a better view of theworld because of the campaign."
Photo: Checking for signs of iodine
deficiency, a nurse examines the thyroid
gland of a woman at a UNICEF-assisted
health centre in Myanmar.
1995, UNICEF estimated that over 7million children were born free of themental impairments of IDD largelybecause of the Canadian contribution.
Partly because of Canada's earlyand unambiguous support to combat-ing IDD, other donors and govern-ments in affected countries were drawninto the battle. The approximately $20million invested by the Governmentof Canada catalysed other investors.Total investment by public- and private-sector partners in this effort since1986 is now estimated to exceed$1 billion.'
In country after country, advocacyfor salt iodization legislation has brought
together teachers, consumer groups,women's groups and health profes-sionals. Primary schoolchildren bythe millions are armed with test kitsthat enable them to check whether thesalt in their homes is iodized andto get a valuable chemistry lesson inthe process. In Indonesia, for exam-ple, the enormous challenge of saltiodization in a country of almost 14thousand islands, with highly decen-tralized salt production, is being over-come by a coalition that includesmillions of the country's schoolchild-ren and teachers.
The elimination of IDD as a publichealth problem is, of course, not com-plete, and momentum must not belost. But the effort has already had re-sults beyond these tangible benefits inthe lives of individuals.
The fight against IDD has broughtto the attention of policy makers andcommunities the importance of goodnutrition in ensuring the physical andmental development of children andpopulations. It has opened the door toaccelerated work on other nutrient de-ficiencies with public health signifi-cance. It has demonstrated the valueof public- and private-sector partner-ships in pursuit of a well-defined goalin favour of children.
r-J
0-
A drop of testing solution added to a pinch
of salt indicates whether iodine is present.
57

At a day-care centre in Viet Nam, babies eatvitamin A-rich vegetables grown in communitygardens.
58
The success of the drive for univer-sal iodization of salt shows that thediets of children, women and familiesworldwide can be changed in smallbut very beneficial ways in just a fewyears as a result of concerted global,national and local action. It is impera-tive that this experience be built uponin attacking some of the other nutri-tional deficiencies that can begin im-pairing the development of a childeven before birth.
Capitalizing onvitamin A's benefitsAlthough the value of vitamin A forprotecting children against blindnesshas been known for decades, vitaminA's amazing ability to strengthen re-sistance to infection and reduce thechances of children dying has only re-cently won general acceptance by thescientific and medical establishment.
Following a dramatic report fromIndonesia in 1986 of a 34 per cent re-duction in pre-school child mortalitywith vitamin A,5 seven additionallarge studies were carried out over thenext seven years. Most of these studies,involving more than 160,000 Africanand Asian children, reported large andsignificant reductions in mortalitywhen children were given additionalvitamin A through supplements orfortified food products. When theseresults were combined statistically in1993, it was firmly established thatvitamin A supplementation couldreduce child mortality by about 23per cent where there is a risk of defi-ciency.' These conclusions, strength-ened further by evidence that thevitamin has an even greater life-saving effect on children with measles,brought widespread acceptance thatmeasures to prevent vitamin A defi-ciency could have an enormous im-pact on child survival.
Adequate vitamin A status doeslittle to prevent children from being
60
infected but has a major effect on re-ducing the severity of illness, espe-cially persistent diarrhoea, dysentery,measles and malaria (Panel 18). Vita-min A's power to reduce the severityof illness was clearly evident inGhana, where periodic distribution ofthe vitamin led to a reduction in localclinic attendance by 12 per cent andhospital admissions by 38 per cent.'Vitamin A can thus have a double-barrelled effect: It not only reducesthe severity of illness and saves livesbut also may ease the demand onoften overworked health workers andfacilities.
The effect of the discovery of vita-min A as a child survival tool led torenewed global interest in updatingknowledge about the extent and pub-lic health significance of vitamin Aand other micronutrient deficiencies.Numerous surveys of clinical and sub-clinical vitamin A deficiency have ledto an estimate that in 1990 there wereover 100 million young children inthe world at risk from the deficiencybecause of inadequate diets, althoughtoday the immediate risk for many ofthese children has been diminished byeffective interventions, including reg-ular vitamin A supplements.
Some countries still lack good as-sessments, but vitamin A deficiency,its underlying causes and its conse-quences for health and survival are muchbetter understood now than ever before.
The age-old condition of maternalnight-blindness has finally come to berecognized as a major public healthproblem. Long ignored by both af-flicted women and the medical estab-lishment, maternal night-Blindness isnow recognized to be widespread,with an estimated 1 million to 2 mil-lion pregnant women affected at anygiven time in South Asia alone.Women describe how they are able tosee adequately during the day butafter sunset are unable to move about

and carry out their household chores.They consider it a common problemof pregnancy that goes away once thechild is born. But recent work inNepal shows that women with night-blindness during pregnancy are sixtimes more likely to have been nightblind in a previous pregnancy' andthat the condition is a marker for aconstellation of risk factors, includingdietary vitamin A inadequacy and de-ficiency; iron deficiency anaemia;protein-energy malnutrition; increasedmorbidity during pregnancy; andmortality up to two years after diag-nosis (Panel 1).
Combining a varietyof approachesSeveral approaches exist to preventvitamin A deficiency, each with itsown strengths and limitations, butwhich can be highly effective if ap-plied in complementary ways. Theseinclude vitamin A supplements (com-monly administered in capsule form),fortification of food and gardening orother methods to improve diets.
Vitamin A can be boosted throughhomestead gardening or adapting foodpreservation or preparation methodsthat can enhance retention. And forti-fying food with vitamin A has becomeincreasingly feasible as fortifiable foodspenetrate the markets of the poor in anumber of countries. These food-basedapproaches combine increased vita-min A supply with nutrition educationthat promotes the consumption ofvitamin A-rich foods by young chil-dren and women.
Periodic supplementation that pro-vides high-dose vitamin A capsulesboth to children from 6 months to5 years and beyond, and to mothers assoon after childbirth as possiblehas proved to be a very valuable inter-vention, offering immediate help tochildren who are at risk of vitamin A
deficiency in situations where food-based options are limited. Expertsestimate that periodic high-dosesupplements for young children havethe potential of eliminating 90 percent of blindness and other ocularconsequences of vitamin A defi-ciency and about 23 per cent of mor-tality in early childhood wherever thedeficiency is common.
Successes insupplementationIt is a major global achievement thatby mid-1997, some 30 years after thefirst vitamin A supplementation pro-grammes began in India, the policy ofproviding children with periodic high-dose supplements has been adopted inall but 3 of the 38 countries whereclinical vitamin A deficiency still ex-isted, and in all but 13 of the addi-tional 40 countries with documentedsubclinical deficiency.
At least 35 countries also routinelyprovide vitamin A supplements withimmunizations during 'national im-munization days'. And many coun-tries link vitamin A supplementationto regular immunization activities orto periodic deworming of children, asin India and Mauritania.
Overall, UNICEF estimates thatmore than half of all young childrenin countries where vitamin A defi-ciency is known to be common re-ceived high-dose vitamin A capsulesin 1996, compared to about one thirdin 1994 (Fig. 10). This includes suchlarge countries as Bangladesh, India,Nigeria and Viet Nam. Between 1993and 1996, UNICEF purchased nearlya half-billion high-dose vitamin Acapsules that were distributed in 136countries, helping to bring or keepvitamin A deficiency under control.At roughly 2 cents per capsule andperhaps 20 to 25 cents per delivereddose, few other child health or nu-trition interventions are as cost-
61
Fig. 10 Progress in vitamin Asupplementation programmes
In the 78 countries where vitamin A deficiency is a
recognized public health problem, supplementation
programmes are on the rise.
0 10 20 30 40 50 60 70 78
Number of countries
Countries where policies to supplementpost-partum mothers are in place
iteE911996
0 10 20 30 40 50 60 70 78
Number of countries
Countries where young children routinelyreceive vitamin A supplements
et--1,16111.1.
0 10 20 30 40 50 60
Number of countries
Countries where more than 500/0 of youngchildren routinely receive vitamin Asupplements
70 78
Source: UNICEF/MI/Tulane University, 'Progress in controlling
vitamin A deficiency 1997' (draft).
59

Iron deficiency anaemia isprobably the most prevalentnutritional problem in theworld...and progress inreducing its prevalence andimpact has been slower thanmight be hoped.
60
effective in reducing mortality anddisability throughout life as vitamin Asupplements.
Breastmilk nearly always providesenough vitamin A to protect a childfrom severe deficiency, even if thismeans that the child's mother becomesdeficient. However, both mothers andinfants can be protected against defi-ciency if mothers receive a high doseof vitamin A soon after they give birth.Some 50 countries have adopted apolicy of routine high-dose supple-ments for women soon after child-birth, which protects their children forabout six months. New informationon the impact of vitamin A deficiencyon women's health makes post-partumsupplementation an even greater pri-ority (Panel 1).
j Sugar fortification:A sweet success
Several countries have chosen anotherroute to improved vitamin A status oftheir populations: fortifying the sugarsupply.
Guatemala has led the developingworld in fortifying sugar with vitaminA since the mid-1970s. Despite nearlya decade of civil disturbance and alapse in fortification for several yearsin the early 1980s, an evaluation of 82villages in 1990 concluded that sugarfortification had brought vitamin Adeficiency under control among Gua-temalan children.
Sugar is also being fortified inparts of Bolivia, Brazil, El Salvador,Honduras and the Philippines, andZambia is planning to begin fortifica-tion in 1998, with other countrieslikely to follow or to find other staplefoods to fortify with vitamin A. ThePhilippines, for example, has success-fully tested and fortified a local, non-refrigerated margarine with vitamin Aand is testing the impact of fortifyingthe wheat flour used in its nationalbread, pan de sal.
6 2
The success of fortification de-pends on a number of factors: Thoseat risk of the deficiency must con-sume the fortified food regularly andin great enough quantities to make adifference, the fortification must notalter the palatability of the product forconsumers and it must not put the prod-uct out of their financial reach. If theseconditions are met, this can be a veryeffective approach, as the Guatemalanexperience has shown. Supplementationmay be an important complementarystrategy for fortification if fortified foodsdo not reach all affected individuals.
Countries also need to ensure thatsugar fortification programmes do notpromote increased consumption ofsugar but are aimed at informing con-sumers that whatever sugar they doconsume should be fortified.
j Improving diets toboost vitamin A
In many countries, vegetable garden-ing around the home and food preser-vation and preparation methods thatenhance the vitamin content of thediet have been promoted as a meansof improving vitamin A intake. InWest Africa and Haiti, for instance,drying of mangoes has extendedaccess to this important vitamin Asource beyond the months of themango season.
In Bangladesh, home gardens offruits and vegetables have been adoptedby families of low socio-economicstatus in one fifth of the country in re-cent years, the result of systematic in-troduction of village nurseries, theavailability of low-cost seeds, and re-liable extension services. This workhas been supported by the NGOHelen Keller International. Initialevaluations suggest that this pro-gramme has curbed the incidence ofnight-blindness, especially in familiesthat grow and consume a variety ofvegetables. This is one of relatively

few such projects where careful eval-uations have made it possible toassess the impact of activities onvitamin A status.
There is evidence that eating a va-riety of foods rich in carotene theprecursor form of vitamin A found infruits and vegetables coupled withsome vitamin A from animal sourcescan alleviate moderate to severe vitaminA deficiency in children and women.
The absence of more evidence thatgardening projects improve vitamin Astatus may be because of the low avail-ability of some carotenoids in plantfoods for the body, the lack of com-plementary fats and animal foods inthe diet, or inadequate evaluationmethods. In addition, it is not clearwhich vegetables or fruits are most ef-fective in improving vitamin A status.This question is an important researchchallenge.
Promoting increased consumptionof vitamin A through animal foodsmay be possible in some countries. Arecent project in Central Java (Indo-nesia), supported by Helen KellerInternational, the Micronutrient Ini-tiative and UNICEF, promoted theconsumption of eggs, which are af-fordable, to reduce vitamin A defi-ciency. As a result, egg consumptionincreased and vitamin A status im-proved significantly among youngchildren in this project (Panel 16).Helen Keller International also suc-cessfully promoted increased con-sumption of vitamin A-rich liver bychildren in Niger, where animal prod-ucts are relatively accessible in someregions.
Responding to anaemiaIron deficiency anaemia is probablythe most prevalent nutritional problemin the world. Over half the women indeveloping countries and a large per-centage of young children suffer fromit,9 and progress in reducing its preva-
lence and impact has been slower thanmight be hoped. As with vitamin A,several approaches have been pursued.
The consequences of anaemia forpregnant women and their newbornchildren are often disastrous. The con-dition puts women at higher risk ofdeath because of the greater likeli-hood of haemorrhage in childbirthand other factors, and their newbornsface a high risk of poor growth anddevelopment. Many countries haveadopted policies to ensure that womenwho seek prenatal care have access todaily iron supplements to help themmeet the very high needs of preg-nancy and childbirth. UNICEF is amajor supplier of iron/folate tablets.A total of 2.7 billion were provided to122 countries from 1993 to 1996.
However, since many pregnantwomen enter pregnancy alreadyanaemic and it is difficult to re-solve pre-existing anaemia duringpregnancy more attention is beingpaid in some countries to improvingthe iron and folate status of girls andyoung women before their first preg-nancy. There is evidence from small-scale trials that in cases where it isdifficult to reach young women withdaily iron/folate supplements, ensur-ing weekly or twice-weekly supple-mentation may still be effective inbuilding iron stores.'° In Malaysia,weekly supplementation over severalmonths resolved the anaemia in over80 per cent of adolescent girls in acommunity where anaemia was highlyprevalent. Similar results have beenreported from other countries.
Fortification of foods with ironis also an effective means of address-ing anaemia. Wheat flour and flourproducts are the most common vehi-cles for iron fortification in placeswhere they are widely consumed andcentrally processed, particularly inLatin America and the Middle East(Panel 17).
6
CAP"'"ki-Jr
Vitamin A supplementation reduces the
severity of illness and the risk of death in
children in areas where the vitamin is
deficient, resulting in dramatic increases in
child survival. In Mali, a girl holds a mango,
a good source of vitamin A.
61

Panel 16
Indonesia makes strides againstvitamin A deficiency
A
One of the great and stillevolving nutritional suc-cess stories is the progress
made by Indonesia towards eliminat-ing vitamin A deficiency. Two decadesago, in this nation of islands with apopulation of 200 million the fourthhighest in the world the problemwas serious. High levels of vitamin Adeficiency, which can cause blind-ness and damage the immune sys-tem, greatly increasing the risk ofillness and death, affected more than2 million Indonesians.
The Government, in cooperationwith UNICEF and other internationalpartners, tackled the problem throughthe distribution of high-dose vitaminA capsules to children ages one tofive, reducing deficiency levels dra-matically. The rate of severe vitaminA deficiency has declined by morethan 75 per cent, according to a na-tional survey in 1993, sparing theeyes, health and lives of millions ofchildren. Blindness among children
62
due to vitamin A deficiency was elim-inated in 1994.
Indonesia has not fully solved thevitamin A problem, however. Severedeficiency remains a problem in threeprovinces, and the survey also foundthat approximately half of all childrenunder five had inadequate levels ofvitamin A. Studies among school-children and breastfeeding womenin West Java have shown mild andmoderate deficiency to be prevalent.
In response, the Indonesian Gov-ernment has set the goal of eliminat-ing vitamin A deficiency by the year2000, using four strategies. The firstis continued distribution of vitamin Acapsules to children ages one to fivethrough posyandu (community healthposts), an effort which reached 60-70per cent of children in this age groupin 1993-1994. The second strategy isdistribution of high-potency vitaminA capsules to mothers after they givebirth, which will require special ef-forts, as only 35 per cent of births
64
occur under medical supervision.The other strategies are food fortifi-cation with vitamins and minerals,including vitamin A (which is alreadyunder way by noodle manufacturers),and promotion of increased con-sumption of foods rich in the vitamin.
In support of this effort, the Gov-ernment, with assistance from HelenKeller International, the Micronu-trient Initiative and UNICEF, haslaunched the Central Java Project toimprove vitamin A intake amongchildren in this region in the first twoyears of life.
The project undertook three majorefforts beginning in 1996, with theIndonesian system of posyandu andits cadre of midwives and birth atten-dants at the centre. First, a supple-mentation programme was launchedto give one high-potency vitamin Acapsule to all new mothers duringthe first month after delivery, alongwith two doses of deworming pills,to improve their health and nutrition.Ensuring mothers' adequate intakeof vitamin A also ensures that babiesreceive the amount they need throughbreastfeeding.
In the first six months of the pro-ject, nearly 20 per cent of new mothersin Central Java received vitamin Acapsules, almost double the rate inthe previous two years. The goal ofthe project is to reach at least 80 percent coverage.
A second element of the project isa large-scale social marketing cam-paign to promote consumption offoods rich in vitamin A, focusing oneggs and dark green leafy vegeta-bles. Research found, for example,that while a number of vitamin A-richfoods such as eggs, liver, spinach,cassava leaves and papaya areavailable year-round, few mothers orcommunity leaders recognized these

as good sources of vitamin A.Therefore a series of radio andtelevision spots, posters, banners,advertising and one-on-one coun-selling methods were developedto publicize the benefits forpregnant and breastfeeding womenand for children between the agesof 6 and 24 months in particularof eating eggs and vitamin A-richfoods.
Third, a nutritional surveillancesystem was instituted to provideinformation on nutritional status,food consumption patterns andupdates on the effectiveness ofthe project.
Thus far, the project clearly hasimproved the understanding ofnutrition and diet patterns in Cen-tral Java. Within three months ofthe start of the social marketingcampaign, egg consumption byboth children and mothers hadincreased, correlated with highervitamin A levels.
Vitamin A capsules will con-tinue to be an important measurebecause people's diets are still notsufficiently high in the vitamin.But the project has demonstratedthat enriching diets through eggs,an available and rich source of vit-amin A, is an important and sus-tainable step towards ensuringthat mothers and children receivethe vitamin A that they need tohelp them live and grow.
Photo: A health and nutrition worker in
Indonesia explains the benefits of eggs,
a good source of vitamin A.
In 1993, Venezuela began fortify-ing all wheat and maize flour withiron and B vitamins. A 1996 evalua-tion showed large reductions in theprevalence of anaemia in children andadolescents following the fortifica-tion, even though during this periodthe country was suffering from a gen-eral economic decline."
At a meeting in 1996, countries ofthe Middle East and North Africamade a joint commitment to fortify-ing wheat flour with iron as a princi-pal strategy for anaemia reduction inthe region, where wheat is a staple.
Anaemia is made worse by someillnesses, particularly hookworm in-fection. Malaria is also a major causeof anaemia, although this is not di-rectly related to iron losses. In severalcountries, deworming of schoolchil-dren has been shown to reduce theprevalence and severity of anaemia.'2Preventing malaria and improving itscurative treatment, which are priori-ties of UNICEF and WHO for 1998and beyond, will undoubtedly go along way to reducing anaemia in chil-dren and adults alike.
Improving basic healthservicesThe nutritional well-being of childrenaround the world has benefited greatlyfrom the enormous achievementssince 1990 in improving children'saccess to basic health services, bothcurative and preventive.
The success of child immunizationprogrammes has been a major boostto child health. Immunization alsoprotects vitamin A levels, which plum-met during acute measles infections.So, the spectacular achievement ofover 90 per cent immunization cover-age in 89 countries and over 80 per centin another 40 countries by 1996including a 79 per cent global measlesimmunization rate" means that formillions of children, vitamin A levels
65
The nutritional well-beingof children around the worldhas benefited greatly fromthe enormous achievementssince 1990 in improvingchildren's access to basichealth services, bothcurative and preventive.
63

Panel 17
Making food enrichment programmes sustainable
Fortification of food staples withiron, vitamin A, iodine and othermicronutrients is the most cost-
effective, sustainable option for elim-inating micronutrient deficiencies.Salt iodization, reaching an additional1.5 billion consumers worldwidesince 1990 and sparing millions ofbabies from mental retardation eachyear, is testimony to how successfulfortification programmes can be.
But as positive as the end resultsare, fortification is a complex under-taking that requires government andindustry to commit to working to-gether as partners. Recent experienceshows that fortification succeeds whenproducers are involved from the startin formulating regulations and inresolving the marketing and techni-cal issues that can make or break aprogramme.
It's the law: Effective legislation isa basic requirement, helping to setgoals and define roles of food pro-ducers, the health and nutrition au-thorities and scientific institutions.Without such a framework, a pro-gramme is more vulnerable to weakimplementation, uneven results and
64
possible failure. That was the experi-ence of South Africa, where a maize-enrichment programme launched in1983 without compulsory legislationwas pronounced a failure after 10years. Efforts are now being made toreview the programme, with a focuson legislation and the role of the foodindustry.
Even then, legislation must be en-forced and supported by policies.Guatemala passed a law in 1975mandating that sugar be fortifiedwith vitamin A. Not only was the lawunenforced but the programme alsoquickly fell apart for lack of the for-eign exchange needed to purchasethe vitamin and because producerswere not convinced of the pro-gramme's effectiveness. A decadepassed before fortification was re-sumed, after the Institute of Nutritionof Central America and Panama(INCAP) and UNICEF worked withproducers to explain the importanceof fortification, provided technicalassistance and helped them obtainvitamin A at below-market prices orthrough donation. Guatemala's Min-istry of Health now enforces the law:
66
Producers whose sugar shows lowlevels of vitamin A in random testsare first warned and then are eitherfined or shut down.
Pricing and marketing: Start-upcosts of equipment and training canbe high, but these are primarily one-off. Costs of the fortificant, labourand equipment maintenance are re-current. Fortifiers' competitive posi-tion in the market place can befurther eroded by price controls ortaxation, and governments can playa helpful role in these areas. WhenBrazil's Government removed pricecontrols and reduced a value-addedtax on milk, for example, dairy pro-duction received a boost and fortifi-cation of milk became more attrac-tive to producers.
Laws can eliminate the price ad-vantage enjoyed by non-fortifiedproducts. In 1997, Oman bannedlocal production and importation ofwhite wheat flour not fortified withiron and folate, and Bolivia mandatedthat all wheat local, imported ordonated be fortified with iron, folicacid and vitamin B complex.
Yet government intervention doesnot always succeed in lowering coststo workable levels. In Indonesia, ef-forts to fortify monosodium gluta-mate (MSG) with vitamin A wereunsuccessful because technical prob-lems of maintaining vitamin stabilityand colour consistency were toocostly to solve. In the Philippines, itwas so expensive to develop fortifiedmargarine that only one multina-tional corporation carried throughwith it.
Questions of quality: Fortificationcan have commercial consequences,since any change in the way a prod-uct tastes, looks or smells can hurtsales and market share. For example,when Venezuela in the late 1980s de-

cided to fortify maize flour withferrous fumarate (iron), in producttests the flour turned from its fa-miliar white to grey. Sensing thatconsumers would not buy theproduct, producers baulked. Thesituation was resolved in 1992,when the National Institute ofNutrition allowed producers tofortify with a blend of iron compo-nents that did not change thecolour of the flour.
Follow-up: It is vital to keeptabs on the process to ensure thatfortified products maintain po-tency standards and reach con-sumers. Chile began fortifyingwheat flour with iron in the early1950s, but it was not until 1967that a system for monitoring andquality control was established,and only in 1975, when a nationalsurvey revealed the iron status ofthe population, that the pro-gramme's efficacy from that pointon could begin to be evaluated.
Commitment and coordina-tion: "Authorities must be con-vinced of the need to makefortification compulsory. And toeliminate any possible resistance,producers must be convinced offortification's benefits," says JorgeDavid, head of the Latin AmericanMillers Association (ALIM).
In 1996, Bolivia became thefirst country certified to have vir-tually eliminated iodine defi-ciency as a public health problem.The phenomenal success stemsfrom legislation that expressed a
public policy decision to iodizeand 13 years of coordinated workby salt producers, the Govern-ment and international coopera-tion agencies.
Photo: In Ghana, workers gather salt tobe taken to a processing plant for iodization.
undisturbed by measles episodes willcontinue to help protect them fromillness.
Programmes to improve hygieneand sanitation are also likely to be ofcrucial importance almost everywherethere is malnutrition in impoverishedcommunities. Improved water sup-plies or support to food productionmay also be very critical, dependingon local circumstances. Analyses inseveral countries have found that thestrongest predicting factors for mal-nutrition are lack of safe water, inade-quate sanitation and high fertility rates.
Each year over 1 million morechildren are saved from death throughthe use of oral rehydration therapy(ORT)." ORT promotion includes sup-port for continued feeding during andafter diarrhoea as well as the use oforal rehydration salts (ORS) to pre-vent and treat dehydration. Continuedprogress is needed in diarrhoea pre-vention, treatment, nutritional man-agement and cure to ensure that growthlost during diarrhoea episodes is rapidlycaught up, but the achievements so farhave been of great nutritional benefitto millions of children. Similarly, thegains already achieved in access tosafe water and sanitation facilitieshave translated into nutritional bene-fits around the world. Millions morechildren than before have been able toavoid plunging deeper into the spiralof infection and poor dietary intakebecause so many illness episodes areprevented or readily cured.
An especially important advancein the health world has been the revi-talization of basic health servicesthrough such measures as the BamakoInitiative, the set of policy measureslaunched by African governments in1987 in response to the rapid deterio-ration of public health systems inAfrica in the 1970s and 1980s. Nowoperating in other regions, the BamakoInitiative measures have meant that
,
rij
AL
Diarrhoea, often in conjunction with
malnutrition, claims the lives of 2.2 million
children each year. Increased use of ORT
as well as improvements in hygiene and
sanitation are helping stem the toll.
In Syria, a woman gives her baby oralrehydration solution.
65
There is no single, globallyapplicable solution to theoverall problem, and there isno substitute for assessmentand analysis done with thefull and active participationof the families mostthreatened by nutritionalproblems and most familiarwith their impact and causes.
66
health centres in remote areas vir-tually abandoned in the 1980s for lackof basic drugs and supplies areagain thriving and serving the com-munities whose active involvement intheir management has helped resusci-tate them. The results have been strik-ing. In addition to ensuring access tobasic curative services, the initiativehas sustained increased coverage ofimmunization and other preventiveactivities. In Guinea, for example, pre-natal care coverage went from lessthan 5 per cent before the initiative toalmost 80 per cent in the mid-1990s.
With WHO and other partners,UNICEF is committed to acceleratedaction in malaria control, includingthe promotion of insecticide-treatedbednets and support for improveddrug use in malaria treatment. A com-bined programme for prevention of bothiron deficiency anaemia throughiron supplementation, fortification anddietary improvement and parasite-induced anaemia through malariacontrol and deworming is oneemerging approach for effectively ad-dressing these age-old problems.
Programmes featuringimproved educationand informationThe programmes described above inNiger and Tanzania included importanteducation, information and communi-cation components. In some cases, thisincluded reinforcing classroom educa-tion, as in Niger, where literacy andother non-formal instruction to womenin participating villages only served tohighlight the need to improve formaleducation for their children, especiallytheir daughters. One donor agencyinvolved in supporting community-based programmes in Niger, in fact,encouraged the inclusion of formaleducation for girls as part of the activi-ties meant to improve nutrition.
68
School-based programmes in casessuch as this, as well as non-formalprogrammes for youth and adults,such as literacy and parent educationcourses, are a useful complement andsometimes a principal vehicle forother activities promoting better nu-trition. It is easy and usually very ap-propriate to ensure that curricula usedin these programmes include strongnutrition components.
Schools, teachers and educationprogrammes can serve as mobilizersof community participation in manyways, such as through village educa-tion committees and parent-teacherassociations. These can also serve as aresource for nutrition and help orga-nize relevant community-based as-sessment, analysis and action as wellas promote good practices and shareinformation concerning nutrition.
In the Lao People's DemocraticRepublic, for example, early child-hood development volunteers in thecommunity and parents are mobilizedthrough participatory processes todevelop, among other skills, betternutrition practices, both traditionaland modern. The essential role ofteachers and schoolchildren in pro-moting the use of iodized salt and eventesting its quality in Indonesia wasmentioned earlier. In this case, mes-sages about salt iodization and itsimportance have even been formallyincorporated into teacher trainingcourses across the country.
Eight useful lessonsWhat have these success stories shown?While there is no single prescription,these eight points bear noting.
1. Solutions must involvethose most directly affected.Malnutrition has many causes andmanifests itself in several ways. Thereis no single, globally applicable solu-

tion to the overall problem, and thereis no substitute for assessment andanalysis done with the full and activeparticipation of the families mostthreatened by nutritional problemsand most familiar with their impactand causes. People who suffer orwhose children suffer from malnutri-tion cannot be passive recipients ofprogrammes. If they are not the mainplayers in problem assessment andanalysis, then actions to reduce mal-nutrition are likely to be inappropriateor unsustainable.
2. A balance of approachesis necessary.A central challenge for nutrition pro-grammes, as well as other develop-ment efforts, is finding a balance ofapproaches that work. Processes in-volving assessment, analysis and ac-tion the triple A approach areessential for formulating appropriate`bottom-up' solutions, particularlywith respect to the ways in which pro-grammes are organized, managed andmonitored. But there are some aspectsof resolving malnutrition that can beappropriately formulated at higherlevels, using wide and more 'top-down' application of appropriatestrategies and technologies, based onthe best scientific knowledge and themost effective technologies available.
UNICEF experience indicates thatfor many problems, a combination oftop-down and bottom-up actions maybe best. BFHI was formulated as aglobal strategy, but its success hastaken many forms, depending on theengagement of national and local in-stitutions and groups.
Vitamin A supplementation wassuggested by the mortality reductionit enabled in many places and endorsedglobally as a strategy, but its applica-tion has depended greatly on existinghealth measures and the involvementof community-based institutions.
Salt iodization has been enhancedby consumer advocacy and legislativechange at the local and national levelsand by the fact that communities pre-viously affected by IDD can see andfeel a difference.
The essence of a triple A approachis not necessarily to establish newcycles but, as much as possible, tobuild upon existing ones. Assessment-analysis-action cycles are the logicalsteps everyone tries to follow in orderto cope with their problems better. Byunderstanding how nutritionally use-ful mechanisms work and where theweaknesses are, a nutrition programmecan build upon and improve existinggood practices, rather than estab-lishing new systems and proceduresthat may be difficult to accept andadopt, and are therefore difficult tosustain.
In the case of the Tanzanian CSDProgramme, there were many compo-nents but the main focus was to im-prove people's capacity to assess theproblem through growth monitor-ing and thereby help them makebetter use of their resources.
3. Nutrition components workbetter in combination.Because malnutrition is the result of somany factors, it is not surprising thatit has been attacked most effectivelyin situations in which several sectorsand strategies have been brought to bear.
Combining improved infant feed-ing, better household access to foodoverall and improved and more acces-sible health services and sanitation isclearly more effective in reducingmalnutrition where food, health andcare are a problem than any of thesemeasures taken alone. In support ofthese various approaches that work,relevant social services health,education, communication and socialmobilization must be more clearlyfocused on nutrition. This is not done
6 9
Community -hased growth monitoring is a
central component of the triple A approach.
A child's growth chart is updated during a
growth monitoring session in Mauritania.
67

4
Governments, communities and families need
to work together to fulfil their children'srights to good nutrition. In Cambodia,a girl carries her baby sibling.
68
by creating new 'nutrition projects' inthese areas, but rather by incorporat-ing nutrition components in ongoingcommunity-based activities. Exper-ience shows the usefulness of build-ing such nutrition components into allprogrammes, wherever possible.
The impact on nutrition of health,education and other social servicesshould also be monitored, with the re-sults used both for a better under-standing of nutrition problems and asa means to motivate policy makers,programme staff and communitiesthemselves to increase their efforts toreduce malnutrition. Based on the mon-itoring of nutrition impact, viable andsuccessful programmes should be re-designed so as to have the best effect.
Communication plays a special rolein nutrition programmes in armingparents, educators and other care-givers not only with basic nutrition in-formation but also with the ability tomake informed decisions and theskills and knowledge needed to takeaction to support improved nutritionin their communities.
Communication should be carriedout simultaneously at various levels toinclude parents, other family mem-bers, teachers, volunteers and com-munity leaders who can in turn teachand support good practices. In addi-tion, personnel of provincial and dis-trict health offices, staff in agriculture,rural development and education it-self, media representatives, researchersand persons in positions of power ofany kind must be reached and theirhelp enlisted.
4. Progress hinges oncontinuing research.All of these gains against malnutritionhave depended upon programmati-cally relevant research, but more isneeded. Both motivated researchersand processes to support such researchare needed. For example, it took the
70
urging of United Nations agencies andfinancing from the Government ofCanada to ensure an analysis of the mor-
tality impact of vitamin A deficiency.There is a need for more research
to improve programmes that affect thehardest-to-reach people, and for de-termining the effectiveness of feasibleinterventions for example, how toencourage increased consumption ofgreen leafy vegetables. Research in-stitutions, both industry-based andacademic, need to include the poorand their day-to-day nutrition prob-lems on the research agenda.
5. Food production isimportant but not enough.As was demonstrated in the Tan-zanian programmes of Iringa andMbeya, nutrition can be improvedeven in rather poor communities with-out increasing overall food availabil-ity. Increasing food production isoften necessary, but it is never enoughto ensure improvement in nutrition.
Programmes that aim to increasefood production countrywide or in partsof countries should not claim that nu-trition will be improved in young chil-dren and women unless other specificand focused measures are imple-mented to better their situation.
6. Everyone has an obligationto child rights.Children have a valid claim to goodnutrition. The government has anobligation and many other membersof society and the community, in-cluding parents, have duties to real-ize the child's right to good nutrition.All of these groups need to becomeaware of the nutrition problem, itscauses and consequences, the possi-bilities of solutions, and their obliga-tion to respect, protect, facilitate andfulfil child rights. They need to knowwhat to do and how to do it. Advo-cacy, information, education and

training are all important strategiesto create or increase this necessaryawareness.
7. Community and family-based involvement is vital.Children's rights give them validclaims on society. In order for poorpeople to carry out their duties to-wards children, the poor must be rec-ognized as key actors rather than aspassive beneficiaries.
All available resources, even thosecontrolled outside the community,should be used to support processeswithin households and the communitythat contribute to improved nutrition.Such processes involve decisions aboutthe use of resources and the monitor-ing of the impact of these decisions.
As described above, householdsand communities learn how to searchfor better solutions through the processof assessing the existing situation,analysing the causes and acting asavailable resources permit. Community-based monitoring is important in therepeated assessment of the evolvingsituation. Analyses by the communityand by all supporters outside the com-munity are facilitated by an improvedunderstanding of the causes of the nu-trition problem.
Outside support includes advo-cacy, information, education, trainingand direct service delivery. Govern-ment and NGO staff may work out-side the community, but should be infrequent contact with the community,functioning as facilitators. They shouldfocus their support and dialogue oncommunity mobilizers: people whoare a part of the community and enjoyits trust and respect.
There is no pre-defined package ofinputs or services that can work.Instead, the community is constantlylearning about the best mix of inter-ventions, a mix that can changesignificantly over time. Community
development means that desirableoutcomes, such as good nutrition, areachieved through participatory andsustainable processes. A combinationof top-down advocacy and mobiliza-tion and a bottom-up demand for sup-port will ensure that both communityand government feel ownership ofsuccessful changes.
8. Government policies mustreflect the right to nutrition.Some national policies affect nutritiondirectly, such as salt iodization or im-munization programmes, for exam-ple. Others, like income and pricepolicies, affect nutrition indirectly.
With the ratification of the Con-vention on the Rights of the Child,governments have the obligation torespect, protect, facilitate and fulfilthe rights enshrined in the Conven-tion. All policies should therefore beanalysed in terms of their real andpotential impact on the right to goodnutrition.
The most important strategies fornutrition include those for food, health,breastfeeding, education, and waterand sanitation, and national nutritioninformation systems should be estab-lished to provide valid data about theirimpact. Policies should be based onknowledge from relevant research andbe constantly evaluated for their realimpact on nutrition in communities.Nutrition information systems shouldbe as decentralized as the existingadministrative systems, starting withcommunity-based monitoring.
69

I i !
It
41°-

Bringing science to bear
Science and technology willnever solve all of the problemsassociated with the inadequate
food and care and the lack of healthservices and sanitation that lead tochildhood malnutrition. But the suc-cesses stemming from breakthroughsbeing made and insights reached havestirred new hope for healthier, moreproductive lives for both children andadults. This section describes some ofthe crucial scientific advances that arehelping to shape specific interven-tions to reduce malnutrition or thatmay do so in the future.
Some of this knowledge, such asthe strengthening effect of vitamin Aon the immune system, is well estab-lished; other knowledge is just emerg-ing and is worth watching. Some ofthe new science is likely to accelerateefforts to reduce malnutrition, and atthe same time generate new under-standing of how reducing malnutritionin childhood or during the prenatalperiod may lessen chronic disease inadulthood and the onerous public healthburden it causes. There are also new
Photo: Over a million pre-school-age
children suffer from vitamin A deficiency,
which affects immune-system functioning.
Vitamin A supplementation is estimated to
lower a child's risk of dying by 23 per cent.
In Bangladesh, a boy receives a vitamin A
capsule.
tools to tackle the essential task of nu-tritional assessment and new waysthat agricultural science can bebrought to bear on the problem.
Nutritionally acquiredimmune deficiency
It is estimated that the immune sys-tems of some 23 million peopleworldwide have been damaged byHIV.' It is less well known that mal-nutrition impairs the immune systemsof at least 100 million young childrenand several million pregnant women,none of them infected by HIV. But un-like the situation with AIDS, the`cure' for immune deficiency due tomalnutrition has been known for cen-turies: It is achieved by ensuring anadequate dietary intake containing allessential nutrients. Today, more isbeing learned about the specific roleof individual nutrients in the function-ing of the immune system, knowledgethat will help in the design of inter-ventions that can improve the situationin the near future. This knowledgealso reinforces the importance of striv-ing to ensure that everyone in theworld has access to a diet that is ade-quate in both quality as well as quantity.
Scientists have known for sometime that malnutrition and infectionare connected. A 1968 monograph byWHO, entitled 'Interactions of Nutri-
7
The 'cure' for immunedeficiency due tomalnutrition has beenknown for centuries:It is achieved by ensuringan adequate dietary intakecontaining all essentialnutrients.
71

Fig. 11 Measles deaths and vitaminA supplementation
In three separate trials of children hospitalized with
measles one as early as 1932 deaths among
children given high-dose vitamin A supplements
were significantly lower than among children not
supplemented. The consistent results suggest that
a change in vitamin A status can rapidly alter basic
physiological functions concerned with cellular
repair and resistance to infection, thereby saving
lives.
16
14
12
10
6
4
2
d 01932 1987
United Kingdom Tanzania
U Non-supplementedSupplemented
1990
South Africa
Source: Alfred Sommer and Keith P. West Jr., Vitamin A
Deficiency: Health, survival and vision, Oxford University
Press, New York, 1996.
72
tion and Infection', was one of the firstcomprehensive statements of some ofthese links.
The threat that vitamin A defi-ciency poses to the lives of youngchildren has already been described.Within a few years, the scientific com-munity went from calling the fact thatvitamin A supplements could reducechild mortality "too good to be true"to calling it "too good not to be true."But the many ways vitamin A defi-ciency increases child deaths were notwell understood until recently. Nowthe results of a dozen field studies,conducted in Brazil, Ghana, India,Indonesia, Nepal and elsewhere, indi-cate that supplementing the diets ofchildren who are at risk of vitamin Adeficiency can reduce deaths fromdiarrhoea. Four of the studies that fo-cused on diarrhoea showed that deathswere reduced by 35-50 per cent. Thevitamin can also halve the number ofdeaths due to measles' (Fig. 11).
In Bangladesh, breastfed infantswhose mothers were given a single oralhigh-dose supplement of vitamin Ashortly after giving birth had signifi-cantly fewer days of sickness becauseof respiratory infections and febrileillnesses during the first six months oflife than did infants born to unsupple-mented mothers from the same socio-economic group in the same area?
Zinc is another micronutrient thathas long been known to be essentialfor the growth and development ofcells and for the functioning of theimmune system. However, becausezinc deficiency is extremely difficultto measure, little attention was paiduntil recently to the possibility that itmight impair child health and devel-opment (Fig. 12).
Trials in Bangladesh, India andIndonesia have already shown reduc-tions of about one third in the durationand severity of diarrhoea in childrenreceiving zinc supplements and a
7 4
median 12 per cent decline in the inci-dence of pneumonia.' In these investi-gations, zinc supplements did themost good for those children whostarted out the most malnourished.
A study recently completed inLima (Peru) found that the benefits ofzinc supplementation on immunitycan begin even before birth. Re-searchers from the Johns HopkinsSchool of Public Health in Baltimore(US) and the Instituto de Investi-gacion Nutricional in Lima have beenadding zinc to the iron and folatesupplements of pregnant women andtesting its impact on the health of theirnewborn children, including its effectson immune system activity. Initialanalysis shows that antibody levelsjust after birth are higher in the chil-dren of zinc-supplemented mothersthan in those receiving a placebo.
Zinc supplementation appears soeffective in reducing the incidence ofdiarrhoea and pneumonia in poorcountries that one scientist, RobertBlack of Johns Hopkins University,has suggested that zinc supplementsare as significant a public health inter-vention for diarrhoea reduction as im-provements in water and sanitation.And major new research indicates thateven the effects of malaria, a deadlyenemy of both children and adults, maybe lessened by zinc and vitamin A(Panel 18).
Iron deficiency can also damagethe immunity of a growing child,impairing the body's ability to killinvading pathogens and leading toincreased illness in iron-deficientpopulations.' In studies in Egypt,anaemic children had longer andmore severe episodes of diarrhoeathan did their iron-fortified peers.
Basic science is now able to ex-plain why these astonishing resultsoccur. Thus far, zinc and vitamin Aare the two micronutrients that haveproved to be the most closely linked
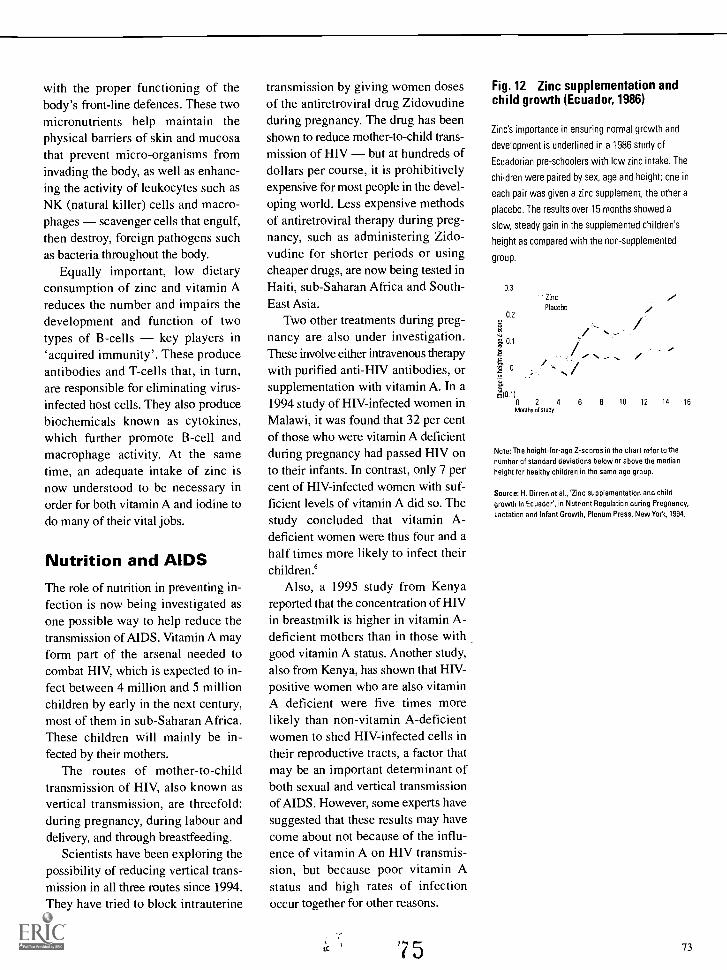
with the proper functioning of thebody's front-line defences. These twomicronutrients help maintain thephysical barriers of skin and mucosathat prevent micro-organisms frominvading the body, as well as enhanc-ing the activity of leukocytes such asNK (natural killer) cells and macro-phages scavenger cells that engulf,then destroy, foreign pathogens suchas bacteria throughout the body.
Equally important, low dietaryconsumption of zinc and vitamin Areduces the number and impairs thedevelopment and function of twotypes of B-cells key players in`acquired immunity'. These produceantibodies and T-cells that, in turn,are responsible for eliminating virus-infected host cells. They also producebiochemicals known as cytokines,which further promote B-cell andmacrophage activity. At the sametime, an adequate intake of zinc isnow understood to be necessary inorder for both vitamin A and iodine todo many of their vital jobs.
Nutrition and AIDSThe role of nutrition in preventing in-fection is now being investigated asone possible way to help reduce thetransmission of AIDS. Vitamin A mayform part of the arsenal needed tocombat HIV, which is expected to in-fect between 4 million and 5 millionchildren by early in the next century,most of them in sub-Saharan Africa.These children will mainly be in-fected by their mothers.
The routes of mother-to-childtransmission of HIV, also known asvertical transmission, are threefold:during pregnancy, during labour anddelivery, and through breastfeeding.
Scientists have been exploring thepossibility of reducing vertical trans-mission in all three routes since 1994.They have tried to block intrauterine
transmission by giving women dosesof the antiretroviral drug Zidovudineduring pregnancy. The drug has beenshown to reduce mother-to-child trans-mission of HIV but at hundreds ofdollars per course, it is prohibitivelyexpensive for most people in the devel-oping world. Less expensive methodsof antiretroviral therapy during preg-nancy, such as administering Zido-vudine for shorter periods or usingcheaper drugs, are now being tested inHaiti, sub-Saharan Africa and South-East Asia.
Two other treatments during preg-nancy are also under investigation.These involve either intravenous therapywith purified anti-HIV antibodies, orsupplementation with vitamin A. In a1994 study of HIV-infected women inMalawi, it was found that 32 per centof those who were vitamin A deficientduring pregnancy had passed HIV onto their infants. In contrast, only 7 percent of FIW-infected women with suf-ficient levels of vitamin A did so. Thestudy concluded that vitamin A-deficient women were thus four and ahalf times more likely to infect theirchildren.'
Also, a 1995 study from Kenyareported that the concentration of HIVin breastmilk is higher in vitamin A-deficient mothers than in those withgood vitamin A status. Another study,also from Kenya, has shown that HIV-positive women who are also vitaminA deficient were five times morelikely than non-vitamin A-deficientwomen to shed HIV-infected cells intheir reproductive tracts, a factor thatmay be an important determinant ofboth sexual and vertical transmissionof AIDS. However, some experts havesuggested that these results may havecome about not because of the influ-ence of vitamin A on HIV transmis-sion, but because poor vitamin Astatus and high rates of infectionoccur together for other reasons.
75
Fig. 12 Zinc supplementation andchild growth (Ecuador, 1986)
Zinc's importance in ensuring normal growth and
development is underlined in a 1986 study of
Ecuadorian pre-schoolers with low zinc intake. The
children were paired by sex, age and height; one in
each pair was given a zinc supplement, the other a
placebo. The results over 15 months showed a
slow, steady gain in the supplemented children's
height as compared with the non-supplemented
group.
0.3
0.2
0.1
:E7d 0
?Am
Zinc
Placebo
0 2 4 6 8 10 12 14 16Months of study
Note: The height-for-age Z-scores in the chart refer to the
number of standard deviations below or above the median
height for healthy children in the same age group.
Source: H. Dirren et al., 'Zinc supplementation and child
growth in Ecuador', in Nutrient Regulation during Pregnancy,
Lactation and Infant Growth, Plenum Press, New York, 1994.
73

Panel 18
Zinc and vitamin A: Taking the sting out of malaria
Earty evidence from a study inPapua New Guinea suggeststhat zinc and vitamin A sup-
plements may boost children's resis-tance to one of the world's mostinsidious infectious diseases: malaria.
Two fifths of the world's popula-tion, in 90 countries across sub-Saharan Africa, Asia and Central andSouth America, is at risk of contract-ing malaria. At least 300 million peo-ple worldwide endure its recurrentfevers, malaise, anaemia and risk ofseizures or coma. Malaria kills from1.5 million to 2.7 million people an-nually. It is the sixth leading cause ofdisability among children under fouryears of age in the developing world.Some 600,000 young children die ofmalaria alone each year; over 1 mil-lion die of malaria in conjunctionwith other illnesses a rate of onechild every 30 seconds.
Many approaches have alreadybeen tried to combat the disease.However, the parasite that causesmalaria is no longer vulnerable to
74
some of the most powerful anti-malarial compounds available. For atime, the widespread use of pesti-cides in the 1950s managed to sup-press the Anopheles mosquito thattransmits the parasite, but it, too, hasdeveloped resistance.
Arming the body to defend itselfthrough immunization is one ap-proach to preventing the disease.But vaccines are difficult to developsince the parasite moves betweenorgans, changing its appearancefrom stage to stage and hiding fromthe immune system in a place thatthe immune system doesn't check:inside red blood cells. Consequently,the best vaccines to date have man-aged to protect only around 30 percent of test populations from infection.
However, naturally acquired resis-tance does develop over time as peo-ple are repeatedly exposed to theparasite. A recent study by the JohnsHopkins School of Public Health andthe Papua New Guinea Institute ofMedical Research investigated the
76
ability of vitamin A and zinc to helpboost such natural resistance.
Nearly 800 children under the ageof five were enrolled in the study. Allof the children lived in an area ofnorth-western Papua New Guineawhere malarial infection is common.The parasite that is responsible forthe disease can be found in the bloodof over 40 per cent of under-fives inthe region, and it is the major causeof death among children from theage of six months to four years.
In controlled trials, regular vita-min A and zinc supplementation ap-peared to be complementary indecreasing the burden of malaria inchildren. According to Dr. AnurajShankar of Johns Hopkins Univer-sity, chief researcher of the study,vitamin A reduced by more than athird the febrile illnesses due to mildto moderately high levels of malariaparasites in children and significantlyreduced spleen swelling, an indicatorof chronic malaria. However, it hadlittle influence on the worst cases,where children had a very high num-ber of parasites in their blood.
Zinc, on the other hand, helpedblunt the severity of the worst cases.As a result, there were over a thirdfewer malaria cases seen at healthcentres among those given zinc thanamong those given a placebo. In addi-tion, overall clinic visits by those chil-dren who had received zinc decreasedby a third, and signs of other infec-tions (cough and diarrhoea, for exam-ple) were reduced by 20-50 per cent.
The Papua New Guinea experi-ence shows that vitamin A and zincstatus in children may be as im-portant in reducing malaria as othercommonly used malaria-control tech-niques, such as insecticide sprayingand the use of insecticide-treatedbed nets. And the cost is minimal:

A year's supply of zinc supple-ments costs $1 per child, with anadditional 10 cents for vitamin Acapsules.
A second study is under way inthe Peruvian Amazon to measurethe effectiveness of vitamin A andzinc in boosting the efficacy ofantimalarial drugs. Peruvian sci-entists at the Loreto Departmentof Health and colleagues fromJohns Hopkins are studying morethan 1,000 children who are suf-fering from malaria to see if a short,five-day course of zinc or vitaminA in conjunction with antimalarialdrugs improves their health. Somechildren are receiving both themicronutrients, in the hope thatthe zinc-vitamin A combinationwill be more effective, as zinc isknown to promote vitamin A me-tabolism in the body.
Despite the surge of interna-tional interest in malaria fromboth the public sector and privateindustry and the promise that vit-amin A and zinc may hold, fund-ing for research into diseaseprevention and treatment unfortu-nately remains meagre. Currently,funding levels run at roughly $42per malaria death, compared with$3,274 for each AIDS fatality.
Photo: Women and their children wait
outside a UNICEF-assisted health centre
in the Peruvian Amazon, where malaria is
a major health concern.
Based on the findings of the firststudies and to demonstrate whetherthe connection between vitamin A andHIV transmission is causal fourclinical trials were begun recently toexamine HIV transmission rates inwomen who have received vitamin Asupplements during the second or thirdtrimester of pregnancy. Results fromthese studies, conducted in Malawi,South Africa, Tanzania and Zimbabweon a total of nearly 3,000 HIV-infectedwomen, are expected soon.
Using nutrition toreduce maternaldeathsMaternal mortality is a tragedy insocial, economic and public healthterms. WHO and UNICEF have notedthat of the 585,000 yearly maternaldeaths around the world, the vast ma-jority are preventable. About 80 per centof these deaths are the result of fivedirect obstetric causes: haemorrhage,infection, obstructed labour, unsafeabortion and a convulsive disorder inlate pregnancy called eclampsia.'
As already noted, obstructedlabour is more likely to occur amongwomen who were stunted in child-hood (Fig. 13). It is estimated thatanaemia may be responsible for asmuch as 20 per cent of maternal mor-tality, particularly those deaths fromhaemorrhage and possibly infection.Anaemia also increases the risk ofmorbidity and mortality associatedwith any major surgical intervention,including Caesarean section.
Programmes already exist toreduce anaemia in pregnant women.More work is needed, however, notonly to make iron/folate supplementa-tion programmes more effective, butalso to improve the treatment and pre-vention of malaria and hookworm.Both of these are conditions that alsocontribute to maternal anaemia.
7
Fig. 13 Maternal height andCaesarean delivery (Guatemala,1984-1986)
The importance of good nutrition for girls and
women is affirmed in a mid-1980s' study of
pregnant Guatemalan women, which found that
the risk of having an intrapartum Caesarean
delivery was 2.5 times higher in short mothers
than in tall mothers. Short stature in women is
often a consequence of poor growth in early
childhood.
eo
ra 603E
40
20
0
125 135 145
Maternal height (cm)
With foetal distress
Without foetal distress
155 165 175
Source: Kathleen M. Merchant and Jose Villar, 'How do
maternal and newborn size affect risk of foetal distress
and intrapartum Caesarean delivery?' (draft).
185
75

Spotlight: Vitamin A
Impact of deficiency
Vitamin A deficiency makes children es-
pecially vulnerable to infection and wors-
ens the course of many infections.
Supplementation with vitamin A is esti-
mated to lower a child's risk of dying by
approximately 23 per cent. The deficiency
is also the single most important cause of
blindness among children in developing
countries.
Who is affected
Over 100 million pre-school-age children
suffer from vitamin A deficiency. Vitamin
A deficiency is also likely to be wide-
spread among women in their reproduc-
tive years in many countries.
What vitamin A does
Vitamin A, stored normally in the liver, is
crucial for effective immune-system func-
tioning, protecting the integrity of epithe-
lial cells lining the skin, the surface of the
eyes, the inside of the mouth and the
alimentary and respiratory tracts. When
this defence breaks down in a vitamin A-
deficient child, the child is more likely to
develop infections, and the severity of an
infection is likely to be greater.
Depending on the degree of the defi- '
ciency, a range of abnormalities also ap-
pears in the eyes of vitamin A-deficient
children. In the mildest form, night-
blindness occurs because the rods in the
eye no longer produce rhodopsin, a pig-
ment essential for seeing in the dark. In
more severe forms, lesions occur on the
conjunctiva and the cornea that if left
untreated can cause irreversible damage,
including partial or total blindness.
Sources
Vitamin A is found as retinol in breastmilk,
liver, eggs, butter and whole cow's milk.
Carotene, a precursor of vitamin A that is
converted to retinol in the abdominal
walls, is found in green leafy vegetables,
orange and yellow fruits, and red palm oil.
76
Even if an adequate nutritional sta-tus were achieved in adolescent girlsand women before their first preg-nancy, this would never eliminate theneed for good medical care in preg-nancy and childbirth. But some day itmay help reduce the tragic burden ofmaternal mortality and the need forcertain medical interventions. Someof the connections between nutritionand maternal mortality suggestedbelow are not yet definitively demon-strated or part of programme activi-ties, but they hold great promise forthe future. A few are especially worthmentioning:
Even given the many known bene-fits of good vitamin A status, it isnonetheless remarkable to find thatimproving the vitamin A status ofpregnant women whose intake of thevitamin is low also dramatically re-duces maternal mortality (Panel 1).Deadly infections in pregnancy, as inchildhood, find a formidable adver-sary in vitamin A. The use of low-cost, low-dose vitamin A capsules aswell as improvements in diet make ithighly probable that this new re-search will be easily incorporated intoprogrammes.
Zinc deficiency, increasingly rec-ognized as widespread among womenin developing countries, is associatedwith long labour, which increases therisk of death. Severe zinc deficiencyis also believed to impair foetal devel-opment in a number of ways. Zinc isimportant for the synthesis of hor-mones and enzymes essential tochildbirth especially estrogen-dependent functions such as expulsionof the placenta and proper contractionof uterine muscles during birth aswell as for immune-system develop-ment. A number of studies around theworld have found that zinc supple-mentation has reduced complicationsof pregnancy. Several studies areunder way that will soon help define
the impact of improved zinc status onpregnant women.
It has long been known that iodinedeficiency in women increases therisk of stillbirths and miscarriages.And there is evidence that, in highlyiodine-deficient areas, another resultof this deficiency may be increasedmaternal mortality through severehypothyroidism.
A recent study in the United Statesshowed that calcium supplementationdid not reduce the risk of hyperten-sion in pregnancy that could result indeath, but a number of experts havesuggested that supplementation mightreduce this risk in areas where womenare especially calcium deficient.
Folate deficiency, now well knownto induce neural-tube birth defects ifit is present during the first month ofpregnancy, may also represent a riskfor maternal morbidity and mortality,as well as increase the risk of lowbirthweight.
The clear message emerging fromthese connections is that improvingwomen's nutritional status by in-creasing their intake of micronutrientsas well as their overall food consump-tion, and by taking steps to reducetheir workload and improve theiraccess to health care may offerconsiderable, low-cost benefits in re-ducing maternal deaths. But there isstill no international consensus on thebenefits to be gained by supplementa-tion during pregnancy with nutrientsother than iron and folate.
The real challenge is to reachwomen well before they becomepregnant indeed, to help adoles-cent girls achieve the best nutritionalstatus possible before they enter theirreproductive years. This would notonly help reduce maternal mortalitybut would also reduce the prevalenceof low birthweight, the risk of birthdefects and the rates of stillbirths andearly infant mortality. All of these re-

main scientific and programmaticchallenges, along with the imperativeof ensuring that women's health ispositioned high on the health anddevelopment agendas of all countries.
Breastfeeding:Good for mothers'health tooIn addition to the nutritional status ofadolescent girls and women, there isanother important connection betweennutrition and maternal mortality. Anumber of studies have shown a stronglink between the early initiation ofbreastfeeding and reduced risk ofpostpartum haemorrhage.
Initiating breastfeeding immedi-ately following birth, as most womendo in baby-friendly hospitals, stimu-lates the contraction of the uterus andreduces blood loss. For this reason,the continuing spread of the Baby-Friendly Hospital Initiative shouldalso contribute to the reduction ofmaternal mortality.
In recent years, research has alsodemonstrated that this immediatepost-partum benefit is by no meansthe only way in which breastfeedingcan improve women's health. A re-cent large-sample study in the UnitedStates demonstrated that women whobreastfed their children had a lowerrisk of breast cancer in the pre-menopausal period, and the longerthey breastfed, the lower the risk!These results show that protecting,promoting and supporting breastfeed-ing has benefits for women that go be-yond the remarkable effects, alreadywell understood, that protect theirchildren from illness and death.
Prevention of chronicdiseases
Chronic degenerative diseases arelargely regarded as diseases of afflu-
ence. In industrialized countries, im-provements in living standards andhealth care have led to increased lifeexpectancy, allowing people to livelong enough to develop such chronicillnesses. Chronic diseases are alsoassociated with the sedentary lifestyleand over-abundant diet prevalent inmany industrialized nations.
Arguments are being made, how-ever, that these chronic diseases inlarge measure may also be diseases ofpoverty particularly poverty earlyin life and during foetal development.The hypothesis is particularly intrigu-ing in light of the fact that ischaemicheart disease is projected to be theworld's leading cause of death anddisability in the year 2020.9
Professor David Barker and hiscolleagues at the Medical ResearchCouncil (MRC) Environmental Epi-demiology Unit in Southampton (UK),first raised the "foetal origins of adultdisease" hypothesis over a decade ago,noting a link between low birthweightand the incidence of cardiovasculardisease among middle-aged men andwomen born in the United Kingdom.'
Since then, over 30 studies aroundthe world have indicated that low-birthweight babies who were not bornprematurely have a higher incidenceof hypertension later in life than thosewith a normal birthweight," indepen-dent of their social class and suchadult risk factors as smoking, drink-ing and overeating.
Low birthweight, as well as thin-ness at birth, has also been correlatedwith glucose intolerance in childhood'2and non-insulin dependent diabetes inlater life.'
Professor Barker and his colleaguesspeculate that maternal dietary imbal-ances at critical periods of devel-opment in the womb can trigger aredistribution of foetal resources, af-fecting a foetus's structure and metab-olism in ways that predispose the
7 9
Spotlight: Zinc
Impact of deficiency
Zinc deficiency in malnourished children
contributes to growth failure and suscep-
tibility to infections. Zinc deficiency is
also thought to be associated with
complications of childbirth.
Who is affected
Data on the prevalence of zinc deficiency
are unavailable, as there is no reliable
method of determining zinc status at the
population level. Zinc deficiency is likely
to be a public health problem, however,
in areas where overall malnutrition is
prevalent; it is now recognized as such
in many countries.
What zinc does
Zinc promotes normal growth and
development. It forms part of the
molecular structure of 80 or more known
enzymes that work with red blood cells
to move carbon dioxide from tissues to
lungs. Zinc also helps maintain an effec-
tive immune system. Severe zinc defi-
ciency causes growth retardation,
diarrhoea, skin lesions, loss of appetite,
hair loss and, in boys, slow sexual
development. Zinc has now been
shown to have a therapeutic effect
on diarrhoea cases.
Sources
Breastmilk has small amounts of zinc
that are readily absorbed. Other sources
include whole-grain cereals, legumes,
meat, chicken and fish. Vegetables and
fruits contain little zinc but when eaten
with cereals may increase the bio-
availability of zinc in cereals.
77

Spotlight: Iron
Impact of deficiency
Iron deficiency anaemia, the most common
nutritional disorder in the world, impairs
immunity and reduces the physical and
mental capacities of populations. In infants
and young children, even mild anaemia
can impair intellectual development.
Anaemia in pregnancy is an important
cause of maternal mortality, increasing
the risk of haemorrhage and sepsis
during childbirth. Infants born to anaemic
mothers often suffer from low birthweight
and anaemia themselves. Causes include
blood loss associated with menstruation
and parasitic infections such as hookworm,
but an inadequate intake of iron is the
main cause.
Who is affected
Nearly 2 billion people are estimated to
be anaemic and even more are iron
deficient, the vast majority of them women.
Between 40 and 50 per cent of children
under five in developing countries
and over 50 per cent of pregnant
women are iron deficient.
What iron does
The body needs iron to produce haemo-
globin, the protein in red blood cells re-
sponsible for carrying oxygen. Iron is also
a component of the many enzymes essen-
tial for the adequate functioning of brain,
muscle and the immune-system cells.
A certain amount of iron is stored in
the liver, spleen and bone marrow. Iron
deficiency develops as these stores are
depleted and there is insufficient iron
absorption. In anaemia, the iron deficiency
is so severe that the production of
haemoglobin is significantly reduced.
The main symptoms and signs are pale-
ness of the tongue and inside the lips,
tiredness and breathlessness. Deficiencies
of folic acid, vitamin A, ascorbic acid,
riboflavin and various minerals can also
contribute to anaemia.
Sources
Iron is found in liver, lean meats, eggs,
whole-grain breads and molasses.
78
individual to later cardiovascular andendocrine diseases. The correlationbetween low birthweight and latercardiovascular disease and diabetesmay arise from the fact that nutri-tional deprivation in utero 'pro-grammes' a newborn for a life ofscarcity. The problems arise when thechild's system is later confronted by aworld of plenty."
In central India, an ambitious studyhas been funded by UK Welhome Trustand coordinated by Dr. Ranjan Yajnikat the King Edward Memorial Hos-pital Research Centre in Pune (India)and Dr. Caroline Fall at the MRCEnvironmental Epidemiology Unit. Itis exploring the impact that a mother'snutrition may have on the develop-ment of diabetes, high blood pressureand coronary heart disease in her off-spring when they reach adulthood.The results could resolve some of theuncertainties about causation of chronicillness, offering nutritional informa-tion relevant to both developing andindustrialized countries.
The study has followed over 800women through pregnancy, monitor-ing foetal growth, maternal weightgain and biochemical indicators of nu-tritional status:5 The nutritional valueof the women's daily food intakeincluding calorie, protein and micro-nutrient content was measured andrecorded. Within 24 hours of birth,both infant and placenta were weighedand other body measurements made.16Almost one third of the nearly 800 in-fants born during the study were clas-sified as low birthweight, under 2.5 kg."An interesting early finding suggeststhat birthweights are most strongly as-sociated with the size of the mothernot just her weight gain during preg-nancy, a well-known determinant ofnewborn size, but also her weight,height, percentage of body fat andhead circumference before conception.The weight and body mass index of
U00 u
many of the women before pregnancysuggested chronic undernutrition. Thestudy also suggested that women'sdiet during pregnancy did not appearto have influenced foetal size substan-tially, although regular consumptionof two particular items green leafyvegetables and dairy products wasassociated with larger birth size. Theseearly findings lend support to thepremise that building a sturdy babydepends on good nutrition for the ex-pectant mother throughout her life.
The children from the Pune studyare growing up in a society of increas-ing urbanization and prosperity. Urbandwellers in India are already fivetimes more likely to develop diabetesthan their rural relatives:8 and thosewho have migrated to industrializedcountries like the United Kingdom diein significantly larger numbers fromcoronary heart disease than theirindigenous white counterparts.'9
In 1999, the first of the children inthe study will be tested for signs ofglucose intolerance and insulin resis-tance; these are early hints of diabetesthat have already been noted in chil-dren of low birthweight in Pune.'Soon after, blood pressure monitoringwill begin in an effort to look for ini-tial signs of hypertension. As thestudy progresses, findings can be re-lated back to birth size, foetal growthand maternal diet before and duringpregnancy. From an undertaking of thismagnitude, clear evidence may emergeabout the importance of improvingmaternal nutrition as a means of pre-venting chronic later-life disease inchildren before these children havechildren of their own.
New ways to reducemalnutrition deathsin emergenciesThe sheer extent of mild and moderatemalnutrition makes these conditions

responsible for much more sicknessand death globally than does severemalnutrition. But a severely malnour-ished child usually defined as under70 per cent of the median weight-for-height reference or having oedema(water retention and swelling) at leastin the feet is at very high risk ofdeath, and requires prompt and inten-sive care in a health facility.
Until recently, health professionalsdealing with severe malnutrition inemergency situations or in large hos-pitals in poor countries had beenusing an approach practised for years.The protocol was to treat infectiousconditions, correct rehydration andfeed, at least in the early stages, withhigh-energy milk usually a com-bination of dried skim milk, veg-etable oil and sugar. In the last fewyears, however, with the help ofWHO and the benefit of the experi-ence of a number of NGOs specializ-ing in this field, the new protocol isimproving the treatment of severemalnutrition.
While the new protocol retainssome elements of former standardpractices, there are significant changes.The milk now recommended for theearly stages of therapeutic feeding,for example, is enhanced by the addi-tion of both oil and a vitamin andmineral mix, which addresses thespecial micronutrient imbalance thataccompanies severe malnutrition.Called F-100 because it gives 100kilocalories per 100 grammes, themilk optimizes the chance for rapidweight gain and the eventual recoveryof a severely malnourished child.
Another important change is a newrecommendation calling for modifica-tion of the standard oral rehydrationsalts (ORS) to address the specialelectrolyte needs of severely malnour-ished children. The use of standardORS has been known to increase riskof heart failure and sudden death
among certain severely malnourishedchildren. The revised ORS reducesthat risk. Known as ReSoMal (rehy-dration solution for malnutrition), itcontains more potassium and differ-ent concentrations of elements fromthose in standard ORS.
The new protocol for the care ofthe severely malnourished also em-phasizes elements that have beenknown by nutrition workers for sometime, but perhaps not well enough tobe integrated into regular practice.These include the need for rapid at-tention to clinical factors, such as lowbody temperature (hypothermia) andlow body sugar (hypoglycaemia), aswell as to less strictly medical factorssuch as meeting malnourished chil-dren's great needs for emotional sup-port, intellectual stimulation and play.Experienced emergency nutrition per-sonnel working in places such as theGreat Lakes region of Central Africaand the Democratic People's Republicof Korea have adopted this methodand noted how quickly it helps reducemortality. One challenge is to ensurethat supplies of the appropriate high-energy milk and rehydration solutionare steady and sufficient (Panel 19).
New ways to measuremalnutritionMuch of the new knowledge de-scribed above will contribute to effec-tive actions to reduce malnutritionand related conditions. But even whenactions are effective, assessing theirimpact is often difficult. Measuringmalnutrition initially can also poseproblems and make it difficult toplace the issue on the policy and pro-gramme agenda.
There is thus a need for assessmentand analysis techniques that are lowin cost, produce rapid results and areeasy to use and understand. Here aresome of the promising new tools:
Spotlight: Iodine
Impact of deficiency
Iodine deficiency is the single most
important cause of preventable brain
damage and mental retardation, most of
the damage occurring before birth. It also
significantly raises the risk of stillbirth
and miscarriage for pregnant women.
Who is affected
The successful global campaign to iodize
all edible salt is reducing the risk associ-
ated with this deficiency, which threat-
ened 1.6 billion people as recently as
1992. Nevertheless, it is estimated that
43 million people worldwide are suffering
from varying degrees of brain damage;
there are an estimated 11 million overt
cretins. Some 760 million people have
goitres.
What iodine does
Iodine is needed by the thyroid gland for
normal mental and physical development.
Most commonly and visibly associated
with goitre (a swelling of the neck as the
enlarged thyroid works to collect iodine
from the blood), iodine deficiency takes a
graver toll in impaired mental acuity.
Persons suffering from IDD face a range
of serious impairments including cretinism,
spastic diplegia (a spastic paralysis of the
lower limbs) and dwarfism. Less severe
deficiencies in both adults and children
can mean the loss of 10 to 15 intelligence
quotient (IQ) points, as well as impaired
physical coordination and lethargy.
Sources
Iodized salt is the best source of iodine.
Sea fish and some seaweed also contain
iodine, although sea salt does not.
79

Panel 19
Protecting nutrition in crises
When refugees stream into acountry, when families losetheir homes, fields and
crops in war or disaster, when chil-dren cry from hunger, it is not sur-prising that food can seem like theonly priority and the only answer toaverting widespread malnutrition.
But in emergencies as well as inother situations, food, health andcare are all crucial to saving lives.Access to basic health services andwater and sanitation facilities is es-sential in emergencies not only tokeep children alive, but also to pro-tect their growth and development.To prevent outbreaks of measles,mass immunization usually alongwith the distribution of vitamin Asupplements has become standardpractice in emergencies. In Haiti, forexample, a measles vaccination cam-paign in 1994-1995 reached almost 3million children, helping end an epi-demic that began when the countrywas in the midst of civil unrest.
80
J.
'.111
Preventing death and malnutri-tion from cholera and other diar-rhoea) diseases through adequatesanitation, access to safe water andoral rehydration therapy savedthousands of children's lives in therecent emergencies in Rwanda andSomalia. This is standard practice inthe current emergency in Burundi,for example.
Breastfeeding is an important ele-ment of nutrition-related 'care' inemergencies. There has been markedprogress in this area as governmentsand agencies become increasinglysensitive to supporting women's abil-ity to breastfeed. Workers with someNGOs that specialize in preventingmalnutrition in times of crisis havehad success in recent years in pro-moting relactation helping womenwho may have been separated fromtheir children to begin breastfeedingagain after having stopped.
Sometimes infant formula mustbe used in emergencies for in-
stance, when young children havebeen separated from their mothers.In these cases, all UN agencies work-ing in emergencies and many NGOshave committed to supplying onlygenerically labelled (no brand name)formula, to prevent commercial ex-ploitation of emergency situations.During the conflict in Bosnia andHerzegovina, UNICEF and other UNagencies jointly urged that infant for-mula distribution be severely limited,and relief organizations subsequentlyended mass distribution programmesin January 1995. UNICEF and WHOstrongly promoted breastfeeding,targeting health workers and joiningwith local health professionals dur-ing and after the war to develop a na-tional policy on infant feeding.
Children ages 6 to 18 months,pregnant women and women whoare breastfeeding all need energy-dense, nutrient-dense foods. In emer-gencies, the approach to meetingthese special needs varies. Agenciesthat are part of the International Fed-eration of Red Cross and Red Cres-cent Societies, for example, try toprovide a family ration to meet every-one's requirements, including thoseof children and pregnant and breast-feeding women. The World Food Pro-gramme and some other agenciesgenerally distribute a ration that meetsminimum needs and, in addition, theycover vulnerable groups with supple-mentary feeding programmes. Thecomparative benefits of the two ap-proaches need to be evaluated.
Triple A assessment, analysisand action is an essential approachin emergencies as well as in other sit-uations. Monitoring children's nutri-tional status, with weight-for-heighta commonly used indicator, is crucialduring emergencies to help target re-sources and reach the most affected.

Early warning systems andemergency preparedness are cost-effective means to prevent mal-nutrition in emergencies. TheUnited Nations Department ofHumanitarian Affairs' early warn-ing system draws on the work ofsimilar systems within and out-side the United Nations in prepar-ing comprehensive assessmentsof potential emergency situations,and UNHCR and other agencieshave set up rapid deploymentmechanisms for emergencies.Nonetheless, early warning sys-tems and emergency planningand preparedness remain sadlyunderfinanced, a shortfall that en-dangers children in particular whencrises loom.
Photo: Health workers vaccinate two
girls at a camp for unaccompanied
Rwandan refugee children in the
Democratic Republic of the Congo.
A simplified way to look for vitaminA: Population-level surveys of vitaminA status have been a particular chal-lenge. In the past, when it was thoughtthat the main impact of vitamin A defi-ciency was damaged eyes and blind-ness, population surveys of vitamin Astatus involved examining children'seyes for early signs of damage. Nowthat it is understood that this deficiencyhas lethal consequences on a subclinicallevel that is, at levels of deficiencythat do not yet show up as damage tothe eye more sensitive methods ofdetecting its presence are needed.
Most of the national or regional vi-tamin A surveys that have been con-ducted in recent years have usedblood retinol as the principal indicatorof vitamin A status. There are somedifficulties with the interpretation ofthis indicator, and it is expensive anddifficult to collect and analyse thevenous blood samples needed forthese surveys.
A new technique that promises tobe easier, cheaper and less invasive is`dark adaptometry'. This method,which has been tested and found ef-fective in several field situations,'takes advantage of the fact that in veryearly stages of vitamin A deficiencythe ability of the pupil of the eye toconstrict under illumination is im-paired. By flashing a simple hand-held light at one pupil and coveringthe other, the degree of impairment ofthe pupillary reflex can be estimated.It is hoped that this simple method,which is non-invasive, will becomewidely available soon.
'Dipsticks' for iodine deficiency:Iodine deficiency disorders (IDD) canbe assessed in populations by palpat-ing goitres, but this method requires ahigh level of training and is less use-ful as goitres begin to disappear withbetter access to iodized salt.
8381

r.
Interaction and stimulation are essential tosound nutrition as well as intellectual andemotional development. In China, a boydelights in his meal and the attention ofhis aunt.
82
Since iodine excreted in the urineis a good indicator of iodine con-sumed, IDD can be reliably detectedby analysing urine samples. Manycountries have undertaken urinary io-dine surveys, which involve collectingsamples, preserving them carefullyand sending them to a laboratory foranalysis in a central location.
A new technique may eliminatesome of those steps and much of thecost. A reagent-treated testing strip or`dipstick' now being developed willsimplify the procedure by allowingthe iodine content of urine to beanalysed and read directly on the spotwithout transporting samples to a lab-oratory. It is hoped that this tool willsoon be available for field surveys.
Improved test kits for iodized salt:Simple iodized salt test kits havehelped make salt-testing a communityaffair. Anyone can use the small plas-tic bottles of test solution that causesalt to turn blue if it is iodized, andsome countries have distributed thesekits to schoolchildren, teachers andcommunity workers. The test kits,however, have a limited shelf life, andthey do not distinguish very sensi-tively among levels of salt iodization.Work is now under way to improve thetest kit in both these respects and makeit an even more useful assessment tool.
Computerizing anaemia surveys:Thanks to computer chips, assess-ment of anaemia at the populationlevel is becoming easier. There havebeen methods for some time to assessperipheral blood (from a fingertip, forexample) without sending the sam-ples to a laboratory, but some of themare slow and inaccurate.
Portable electronic haemoglobi-nometers are now available, however,that enable blood to be drawn easilyfrom a finger into a small cuvette thatis inserted directly into a machine that
84
gives a digital read-out of the precisehaemoglobin level in a few seconds.The wider use of these machines inpopulation surveys will help to raiseawareness of the enormous magni-tude of the anaemia problem.
New ways toenrich dietsThere are many ways to enhancefoods to improve the content of the vi-tamins and minerals that are so impor-tant for the well-being of children andtheir families. Food fortification isone very important way of doing this,and has already helped overcomemicronutrient deficiencies in manyindustrialized countries and somedeveloping ones.
But many of the world's poorestpeople eat locally grown crops thatcannot be fortified. Agricultural sci-entists are now demonstrating thatstaple crops can be modified in sev-eral ways at the breeding stage, withgreat nutritional benefit.
The grains and tubers on whichthe vast majority of people in the de-veloping world depend have certaininherent shortcomings nutritionally.For one thing, these staples tend notto provide all the minerals and vita-mins needed to ensure good nutri-tion. In addition, cereals, dependingon several factors, including the de-gree to which they are refined, con-tain substances that impede the`bioavailability' of some importantminerals the ability of the body toabsorb and use them. The most im-portant of these substances is knownas phytate, a molecule containingphosphorus. Micronutrients usuallycome from non-staple foods ani-mal products, vegetables and fruits.But the poorest populations oftencannot afford these foods and dependon the grains and tubers they can af-ford. This fact helps explain the high

prevalence of some micronutrientdeficiencies.
Agricultural research has turned tothe science of plant breeding to im-prove this situation. The goal is to de-velop staple food crops that containhigher quantities of essential mi-cronutrients or lower amounts ofphytate. In this connection, work iscurrently being done in the UnitedStates to develop low-phytate grainfoods for animal consumption. Suchgrains hold nutritional promise forpeople as well, according to the re-sults of a recent study, which foundthat human volunteers absorbed ironat a significantly higher rate fromfoods prepared using a new low-phytate strain of corn than from anolder higher-phytate strain."
The Consultative Group on Inter-national Agricultural Research, madeup of 17 internationally funded agri-cultural research centres, is trying toraise farm productivity and food con-sumption in developing countries.The group is now coordinating aglobal effort to increase the micronu-trient content of five major staple foodcrops: rice, wheat, maize, beans andcassava. The aim is to breed plantsthat load high amounts of vitaminsand minerals into their edible partsand also into their seeds, allowingthem to enrich themselves for subse-quent harvests without changing theirtaste, texture, or the ease with whichthey are grown.
In developed countries, such cropshave already been successfully pro-duced: high-zinc wheat, for example,is being grown in Australia. Estimatesare that it will take 6 to 10 years tobreed comparable new plants in de-veloping countries. Scientists believethat they will not only improve thedaily dietary intake in the developingworld but will also significantlyincrease crop yields because thesemicronutrient-dense plants have better
germination and more resistance to in-fection at the vulnerable seedling stage.
More effective actionfor nutritionimprovementThe technical advances described inthis report, whether new research onnutrition and illness or better ways todetect problems, are not magic bul-lets. They will contribute to sustain-able improvement in nutrition only ifthey sharpen the ability of people, in-cluding the poor, to assess and analysethe causes of malnutrition aroundthem and to plan and carry out ap-propriate responses.
Recent advances in the fields ofsocial science and communicationwill also help accelerate and sharpenpeople's ability to take control ofactions to reduce malnutrition.
Actions described here to improvechild nutrition and thereby improvegrowth, resistance to illness and cog-nitive development need to be cou-pled with other highly effectivelow-cost interventions that have al-ready been proven to prevent diseaseand improve child development.
Some of these have yet to bewidely exploited. For example, in-testinal worms, which contribute topoor growth and development, can becombated through routine dewormingusing low-cost drugs that are bothvery safe and highly effective (Panel20). And child deaths from malariacan be reduced through the use of in-secticide-impregnated mosquito nets.These measures have not received ad-equate global attention and resources,even though every child has a right totheir benefits.
Actions to prevent malnutrition inyoung children also need to be linkedto efforts to promote early child de-velopment through stimulating playand early learning, and by strengthen-
85
Spotlight: Folate
Impact of deficiency
Fo late deficiency causes birth defects in
the developing foetus during the earliest
weeks of pregnancy before most
women are aware that they are pregnant.
Folate deficiency has been found to be
associated with a high risk of pre-term
delivery and low birthweight, though it is
not clear that this would hold in all popu-
lations. Folate deficiency also contributes
to anaemia, especially in pregnant and
lactating women.
Who is affected
Although data are not abundant, in several
developing countries women in their
reproductive years have been found to
have very high rates of folate deficiency.
Young children are also likely to be at risk.
What folate does
This B vitamin helps in the formation of
red blood cells. Folate also regulates the
nerve cells at the embryonic and foetal
stages of development, helping to pre-
vent serious neural tube defects (of the
brain and/or spinal cord).
Sources
Folate is found in almost all foods, but
the best sources are liver, kidney, fish,
green leafy vegetables, beans and
groundnuts.
83

Panel 20
Progress against worms for pennies
Asked to name the most wide-spread diseases, few peoplewould think of including worms.
Yet, helminth (worm) infections areindeed one of the most commonand neglected of diseases, affect-ing more than 30 per cent of theworld's people. Health, productivityand physical and mental capacitymay all suffer.
Children in developing countriesare the most severely affected, par-ticularly those between the ages of 5and 14, in whom intestinal worms ac-count for up to 12 per cent of totaldisease burden the largest singlecontributor. While the impact ofworms on health and growth is com-monly believed to be most signifi-cant in children after they reach theage of five, a new study in India linksworm infection with growth falteringin children between one and fouryears old.
As many as 150,000 children dieeach year from intestinal obstruction
and other abdominal complicationscaused by large adult worms. In mil-lions more, worms are a significantcause of malnutrition, stunting growthand causing severe anaemia, dysen-tery, delayed puberty and problemswith learning and memory. In 1990,an estimated 44 million pregnantwomen were infected with hook-worm; their foetuses, therefore, wereat risk of retarded intrauterine growth,prematurity and low birthweight.
Transmission is insidiously easy,especially where hygiene and sanita-tion are inadequate. A child walkingbarefoot can pick up hookworm; byputting a dirty finger in her mouth,she may ingest roundworm eggs. Itis not uncommon for a child to carryup to 1,000 hookworms, round-worms and whipworms that depleteblood and nutrients.
Overall, about 1.5 billion peoplehave roundworms, making it thethird most common human infectionin the world. Whipworm infects 1 bil-
84 8 6
lion people, including nearly one thirdof all children in Africa. More than 1.3billion people carry hookworm intheir gut, and 265 million people areinfected with schistosomes, the para-sites that cause the debilitating dis-ease of schistosomiasis.
Worms affect nutrition in severalways, ingesting blood and leading tothe loss of iron and other nutrients.Worms also cause the lining of theintestines to change, which reducesthe surface membrane available fordigestion and absorption. As a result,fat, certain carbohydrates, proteinsand several vitamins (including vita-min A) are not absorbed properly.Lactose intolerance and poor use ofavailable iron can also result.
Treatment is simple and relativelyinexpensive. A single dose of anti-worm medicine such as Meben-dazole costs as little as 3 cents andcan eliminate or significantly reduceintestinal worm infections. The totalcost of treatment programmes is typ-ically $1 to $2 per year per person.Controlled experiments in India,Indonesia, Malaysia, Myanmar andTanzania have proved that the ther-apy works for months at a time.UNICEF, WHO and the World Bankhave identified pre-school and school-age children, women of childbearingage and adolescent girls as thosewho would benefit most from wormcontrol programmes.
The benefits are impressive. Aninnovative study in Kenya in 1994,which used motion detectors on thethighs of school children, found thatridding the youngsters of high levelsof hookworm improved physical ac-tivity. Dewormed children reportedbetter appetites and an end to ab-dominal pains and headaches. Withinnine weeks, the treated group showedbetter growth, weight gain (both in

terms of fat deposits and musclemass), physical activity and ap-petite than the untreated group.Numerous studies have alsonoted the mental and cognitive ef-fects of anaemia in children in-fected with worms, with intellec-tual performance improving aftertreatment.
In a large-scale study done inIndia in 1996, two groups of chil-dren ages one to four years re-ceived twice-yearly vitamin A sup-plements; one group was alsogiven deworming tablets. At theend of the trial, the children in thegroup given worm treatmentwere on average 1 kg heavierthan the children who were nottreated. The study shows not onlythat mass deworming can im-prove the weights of young chil-dren in areas where worms arecommon, but it also opens up thepractical possibility of combiningworm treatment with vitamin Asupplementation in areas at risk.
Some believe that dewormingis not a satisfactory solution be-cause it must be repeated in theabsence of improved sanitation,hygiene and health education,and reinfection occurs frequently.Nevertheless, periodic deworm-ing reduces helminths' drain onchildren's development at criticaltimes in their lives, at least untilthe causes and conditions of envi-ronmental contamination and in-fection are successfully addressed.
Photo: One of the most common infections
in the world, worms impede children's
growth and cause anaemia. Learning and
memory suffer Here, a girl attends
school in India.
ing interaction with parents and peers.The parents of young children every-where need regular contact withpeople who can help check their chil-dren's growth and development andcan provide advice and support onbreastfeeding and complementaryfeeding. In many communities, par-ents and caregivers will also needboth advice on and access to supple-ments of vitamin A, iron, iodine andother micronutrients. Support in theseareas might best be provided throughestablished formal institutionshealth centres, clinics or pre-schoolcentres (Panel 21). But where such fa-cilities do not exist or do not function,children cannot wait for them to bebuilt or staffed.
Communities must receive over-all support in their efforts to ensurethat all families have access to basicpreventive actions to improve thenutrition of children and pregnantwomen. This includes strengthenedhealth services to prevent and treatdisease, and increased support tostimulate early child learning, careand development.
None of the preventive and sup-portive actions to promote child growthand development described in this re-port require a doctor or nurse or atrained educator. Communities can behelped to organize themselves to pro-vide or administer these services, andin most communities, groups that cantake on these responsibilities alreadyexist. Communities can also behelped to assess their own priorityproblems and can learn to monitor theeffectiveness of their actions, re-designing their own programmes ac-cordingly. Combined with the use ofeffective low-cost technologies, theadoption of these measures could re-sult in rapid improvements not only inchild survival but also in child devel-opment, nutritional status and learn-ing capacity.
87
A girl enjoys an ear of corn in the United
States, where researchers have developed a
new strain of corn that increases the body's
ability to absorb iron.
85

Panel 21
Child nutrition a priority for the new South Africa
Under apartheid, South Africahad a highly sophisticatedmedical research infrastruc-
ture that served the white minority,pioneering heart transplants, for ex-ample. Yet the majority of the peoplewere left with poor health and nutri-tion care. The advent of democraticrule in 1994, however, changed allthat. The Government is now reori-enting the health system to theneeds of the majority, and child nu-trition is a priority.
Establishing a community-levelnutrition monitoring system is an im-portant part of this effort, and onearea where this approach is takingshape is the Bergville district ofKwaZulu-Natal Province. Child healthand nutrition problems in the prov-ince are among the most challengingin the country. Over half the children
86
live in poverty, nearly 40 per centhave vitamin A deficiency, up to onequarter of the children in rural areasare stunted, and iodine deficiency isa problem in mountainous areas. Tenper cent of children ages six monthsto five years suffer from anaemia,which is also prevalent among preg-nant women, and low birthweight iscommon.
In the Bergville district, with apopulation of 120,000, a network ofcommunity health workers and healthassistants is being trained as part ofthe new Child Survival Programme.The approach, based on regularweighing of young children in theirhomes to monitor growth, is similarto that used successfully in other de-veloping countries during the pastdecade. Health workers will use theweighing sessions to discuss chil-
8 6
dren's growth with their families, re-inforcing positive trends and ex-ploring reasons behind falteringgrowth to devise solutions. To carryout the programme, the number ofcommunity health workers in the dis-trict will be expanded significantly.The main objective is to cover allfamilies, including the poorest andmost marginalized.
Community participation in plan-ning and operating health services isat the core of the programme. Com-munity members formed a healthforum in 1994, which serves as thesteering committee of the Child Sur-vival Programme. The group hashelped establish a district hospitalboard and local committees to su-pervise health workers and has or-ganized workshops on the newprogramme.
Since 1996, resources for healthcare have been channelled more eq-uitably to disadvantaged provincessuch as KwaZulu-Natal, and this willhelp finance the improved health ser-vices. The University of Natal inPietermaritzburg is taking a leadingrole in supporting child growth mon-itoring in the Bergville district. In ad-dition, World Vision of South Africa,an NGO which has been active inthe district since 1980, has helped laythe groundwork for the programmethrough various community devel-opment projects. These include localleadership training, skills training forwomen's groups, support for a pre-school and crèche programme andcooperation with the health servicein addressing malnutrition.
The new system for monitoringgrowth is sorely needed, accordingto a recent survey, which found thatwhile most mothers had a health ser-vices card for monitoring child growth,many of the cards were either left

blank or were incomplete. Thesurvey also found that very littlenutritional counselling had ac-companied growth monitoring.
The new programme facesmany difficulties: Resources arestretched, personnel must betrained and there must be out-reach into communities. Nonethe-less, the new partnerships beingforged between government, theuniversity, NGOs and communi-ties represent an approach thatholds promise for the future.
A major effort to tackle vitaminA deficiency is also under way.Within months after the new Gov-ernment took office, the SouthAfrican Vitamin A ConsultativeGroup launched the country'slargest-ever nutrition survey, cov-ering nearly 20,000 households.The survey found that one third ofchildren ages six months to fiveyears are vitamin A deficient or onthe borderline. The Governmentand non-governmental partnersare gearing up to address the prob-lem. Steps planned include givingvitamin A supplements to youngchildren and to mothers shortlyafter giving birth, fortifying staplefoods with vitamin A and encour-aging the production and con-sumption of vitamin A-rich foods.
Photo: In South Africa, community healthworkers weigh children and discussgrowth promotion with their families.
It has often been said that meetingthis challenge is a matter of politicalwill. In a $28 trillion global economy,the problem is surely not a lack of re-sources. But it may be more useful tosee the challenge as a matter of politi-cal choice. Governments in poor andrich countries alike may choose toallow children to be intellectually dis-abled, physically stunted and vulnera-ble to illness in childhood and laterlife. This is the price of doing little ornothing to ensure good nutrition.
But governments could instead re-solve to move to consolidate lessonsalready learned about reducing mal-nutrition. They could do everythingpossible to mount massive actionsthat can clearly succeed and that canbe implemented by communities them-selves. And they could encourageresearch on, and implementation of,new and better actions.
For the well-being and protectionof children and the human develop-ment of the world, the course of ac-tion is clear.
89
Governments could insteadresolve to move to consolidatelessons already learned aboutreducing malnutrition. Theycould do everything possibleto mount massive actions thatcan clearly succeed and thatcan be implemented bycommunities themselves.
87

References
The silent emergency
1. Gillespie, Stuart, 'Increased MaternalMortality Risk', section 5.1 in MajorIssues in Developing EffectiveApproaches for the Prevention andControl of Iron Deficiency: Anoverview prepared for theMicronutrient Initiative and UNICEF,work in progress, September 1996(first draft).
2. Draper, Alizon, 'Child Development andIron Deficiency: Early action is criticalfor healthy mental, physical and socialdevelopment', The Oxford Brief,Opportunities for MicronutrientInterventions, Washington, D.C.,May 1997.
3. World Bank, World DevelopmentReport 1993: Investing in health,Oxford University Press, Washington,D.C., 1993, p. 77, col. 1.
4. World Bank, Enriching Lives:Overcoming vitamin and mineralmalnutrition in developing countries,World Bank, Washington, D.C., 1994,p. 2; 'Total GDP Table 1995', WorldDevelopment Indicators 1997(CD-ROM), International Bank forReconstruction and Development/World Bank, Washington, D.C., 1997.
5. Draper, Alizon, op. cit., p. 1.
6. Maberly, Glenn E, 'Iodine Deficiencyin Georgia: Progress towardselimination, Summary Report', TheProgram Against MicronutrientMalnutrition, Atlanta, April-May 1997,p. 1, col. 3.
7. Martorell, Reynaldo, 'The Role ofNutrition in Economic Development',Nutrition Reviews, Vol. 54, No. 4, April1996, p. S70.
8. In accordance with internationalterminology recommended by WHO,readings that are three or morestandard deviations from thereference median (based on areference population of Americanchildren) are referred to as 'severelymalnourished', while those between
88
two and three standard deviations arecalled 'moderately malnourished'.
9. Young, Helen and Susanne Jaspars,Nutrition Matters: People, food andfamine, Intermediate TechnologyPublications, London, 1995, p. 17.
10. UNICEF, 'Food, Health and Care',UNICEF, New York, updated edition,November 1996, p. 13.
11. Draper, Alizon, op cit., p. 1.
12. What Governments Can Do: Seventhannual report on the state of worldhunger, Bread for the World Institute,Silver Spring, 1997, p. 8.
13. Ibid., p. 10.
14. Philip, W. et al., 'The contribution ofnutrition to inequalities in health',British Medical Journal, Vol. 314,British Medical Association, London,24 May 1997, p. 1545.
15. 'Children at Risk in Central and EasternEurope: Perils and promises',Economies in Transition Studies,Regional Monitoring Report, No. 4,UNICEF, International Child DevelopmentCentre, Florence, 1997, p. 43.
16. Fogel, Robert W., 'Economic Growth,Population Theory and Physiology:The bearing of long-term processeson the making of economic policy',The American Economic Review, Vol.84, No. 3, The American EconomicAssociation, Nashville, June 1994,pp. 369-395.
17. Grantham-McGregor, Sally, 'A Reviewof Studies of the Effect of SevereMalnutrition on Mental Development',The Journal of Nutrition, Supplement,Vol. 125, No. 8S, The AmericanInstitute of Nutrition, Bethesda, 1995,p. 2235S.
18. Cole, Michael and Sheila R. Cole,'Prenatal Development', TheDevelopment of Children, ScientificAmerican Books, New York andOxford, 1989, p. 72.
90.
19. Nash, Madeleine J., 'Fertile Minds',Special Report, Time, Vol. 149, No. 5,3 February 1997, p. 52.
20. Landers, Cassie, 'A Theoretical Basisfor Investing in Early ChildDevelopment: Review of currentconcepts', Innocenti Global Seminaron Early Child Development, UNICEFInternational Child DevelopmentCentre, Florence, 1989, p. 4.
21. Hanson, Lars A. et al., 'Effects ofbreastfeeding on the baby and on itsimmune system', Food and NutritionBulletin, Vol. 17, No. 4, United NationsUniversity Press, Tokyo, December1996, p. 384.
22. De Zoysa, I., M. Rea and J. Martines,'Why promote breastfeeding indiarrhoeal disease controlprogrammes?', Health Policy Planning,Oxford University Press, 1991, 6:371-379,as cited in 'A warm chain forbreastfeeding', The Lancet, Vol. 344,No. 8932, 5 Nov. 1994, p. 1239.
23. Glick, Daniel, 'Rooting for Intelligence,'Newsweek, Special Edition, Newsweek,New York, Spring/Summer 1997, p. 32.
24.
25.
26.
27.
UNDP, Human Development Report1997, UNDP, New York, pp. 164-165.
UNICEF, WATERfront, Issue 8, UNICEF,New York, August 1996, p. 16.
UNDP, Human Development Report1997, p. 29.
United Nations, Progress made inproviding safe water supply andsanitation for all during the first half ofthe 1990s: Report of the Secretary-General, United Nations, New York,A/50/213-E/1995/87, 8 June 1995, table1, p. 5.
28. UNICEF, The Progress of Nations 1997,p. 12.
29. US Department of Agriculture study(1990) cited in Tufts University, Schoolof Nutrition, Center on Hunger, Povertyand Nutrition Policy, 'Statement on theLink Between Nutrition and CognitiveDevelopment in Children', 1995, p. 8.
30. Landers, op. cit., p. 7.
31. United Nations, The World's Women1995: Trends and statistics, SocialStatistics and Indicators, Series K,No.12, United Nations, New York, 1995,p. 108.
32. Holmboe-Ottesen, Gerd, OpheliaMascarenhas and Margareta Wandel,'Women's Role in Food Chain Activitiesand the Implications for Nutrition',ACC/SCN State-of-the-Art Series,Nutrition Policy Discussion Paper No.4, United Nations, New York, May1989, p. 37.
Approaches that work
1. Gillespie, Stuart, John Mason andReynaldo Martorell, 'How NutritionImproves', ACC/SCN State -of- the -ArtSeries, Nutrition Policy DiscussionPaper No. 15, United Nations, NewYork, July 1996.
2. 'International Code of Marketing ofBreastmilk Substitutes', World HealthOrganization, Geneva, 1981, pp. 6-7.
3. UNICEF, The Progress of Nations 1997,UNICEF, New York, 1997, p. 21.
4. Micronutrient Initiative, Ottawa,facsimile dated 14 Oct. 1997.
5. Sommer, Alfred et al., 'Impact ofvitamin A supplementation onchildhood mortality: A randomisedcontrolled community trial', TheLancet, 1986, Vol. 1, pp. 1169-1173.
6. Beaton, G. H. et al., 'Effectiveness ofVitamin A Supplementation in theControl of Young Child Morbidity andMortality in Developing Countries',ACC/SCN State-of-the-Art Series,Nutrition Policy Discussion PaperNo. 13, United Nations, December1993, p. 61.
7. Ross, David A. et al., 'Vitamin Asupplementation in northern Ghana:Effects on clinic attendances, hospitaladmissions and child mortality', TheLancet, Vol. 342, 3 July 1993, pp. 7-12.
8. Katz, J. et al., 'Night blindness isprevalent during pregnancy andlactation in rural Nepal', Departmentof International Health, Johns HopkinsSchool of Hygiene and Public Health,Baltimore, Journal of Nutrition,August 1995.
9. Gillespie, Stuart, John Kevany andJohn Mason, 'Controlling IronDeficiency: A report based on anACC/SCN workshop', United Nations,Geneva, February 1991, p. 4.
10. Alnwick, David, 'More for Less inCombating Iron Deficiency? Update onthe Effectiveness of WeeklySupplements', Research in Action, No.2, UNICEF, New York, November 1995,p. 1; Schultink, W. et al., 'Effect of dailyvs. twice weekly iron supplementationin Indonesian preschool children withlow iron status', American Journal ofClinical Nutrition, Vol. 61, AmericanSociety for Clinical Nutrition, 1995,pp. 111-115.
11. Layrisse, M. et al., 'Early response tothe effect of iron fortification in theVenezuelan population', AmericanJournal of Clinical Nutrition, Vol. 64,1996, pp. 905-906.
12. Stoltzfus, R. J. et al., 'Epidemiologyiron deficiency in Zanzibarischoolchildren: The importance ofhookworms', American Journal ofClinical Nutrition, Vol. 65, 1997, p. 157.
13. United Nations, Progress at Mid-Decade on Implementation of GeneralAssembly resolution 45/217 on theWorld Summit for Children: Report ofthe Secretary-General, UnitedNations, New York, A/51/256, 26 July1996, p. 30, para. 130.
14. Lewnes, Alexia, Oral RehydrationTherapy: Elixir of life, UNICEF,New York, February 1997, p. 3.
Bringing science to bear
1. Piot, Peter, 'Fighting AIDS together',The Progress of Nations 1997, UNICEF,New York, 1997, p. 23.
BEST COPY AVAILABLE91
2. Sommer, Alfred and Keith P. West, Jr.,Vitamin A Deficiency: Health, survivaland vision, Oxford University Press,New York and Oxford, 1996, pp. 41, 48,66-70.
3. Roy, S. K. et al., 'Impact of a singlemegadose of vitamin A at delivery onbreastmilk of mothers and morbidity oftheir infants', European Journal ofClinical Nutrition, No. 51, StocktonPress, 1997.
4. 'Zinc for Child Health: Child HealthResearch Project Special Report',Report of a meeting, Baltimore,Maryland, 17-19 Nov. 1996, Vol. 1,No. 1, June 1997, p. 8.
5. 'Improving Iron and Zinc Nutrition inInfancy and Early Childhood:Proceedings of the Bali ConsultationMeeting for the Planning of Multi-Country Iron and Zinc InterventionTrials', in Bali, Indonesia, 4-6 February1997, UNICEF, 1997, pp. 6-7.
6. Semba, Richard D., 'Will vitamin Asupplementation reduce mother-to-child transmission of HIV?' Researchin Action, No. 5, UNICEF, New York,July 1996.
7. Adamson, Peter, 'A failure ofimagination', The Progress of Nations1996, UNICEF, New York, 1996, p. 8.
8. Rasmussen, Kathleen M. and MichelleK. McGuire, 'Effects of breastfeedingon maternal health and well-being',Food and Nutrition Bulletin, Vol. 17,No. 4, United Nations University Press,1996, p. 366.
9. Murray, Christopher J. L. and Alan D.Lopez (eds.), The Global Burden ofDisease, Harvard School of PublicHealth, Cambridge, 1996, pp. 360-367.
10. Barker, David J. P., Mothers, Babiesand Disease in Later Life, BMJPublishing, London, 1994.
11. Law, Catherine M. and Alistair W.Shiell, 'Is blood pressure inverselyrelated to birth weight? The strengthof evidence from a systematic reviewof the literature', Journal of
89

Hypertension, Vol. 14, No. 8,1996,pp. 935-941.
12. Law, C. M. et al., 'Thinness at birth andglucose tolerance in seven-year-oldchildren', Diabetic Medicine, 1995,12:24-29.
13. Hales, C. N. et al., 'Fetal and infantgrowth and impaired glucosetolerance at age 64', British MedicalJournal, Vol. 303, 26 Oct. 1991, pp.1019-1022; Phipps, K. et al., 'Fetalgrowth and impaired glucosetolerance in men and women,Diabetologia, 1993, 36:225-228;McCance, David R. et al., 'Birth weightand non-insulin dependent diabetes:Thrifty genotype, thrifty phenotype, orsurviving small baby genotype?',British Medical Journal, Vol. 308, 1994,pp. 942-945.
14. Barker, op. cit.; Hales, C. N. andD. J. P. Barker, 'Type 2 (non-insulindependent) diabetes mellitus:The thrifty phenotype hypothesis',Diabetologia, 1992, 35:595-601.
15. The Smallest Babies in the World,video, MRC EnvironmentalEpidemiology Unit, Southampton, 1996.
16. A study of maternal nutrition andintrauterine fetal growth, King EdwardMemorial Hospital Research CentreAnnual Report 1995-1996, KEMHRC,Pune, 1996, p. 36.
17. 'Proceedings of the Third AnnualWorkshop on the Fetal and EarlyOrigins of Adult Disease', meeting inKhandala, Maharashtra, India,September 1996, p. 6.
18. Fall, Caroline, Ranjan Yajnik andShobha Rao, personalcommunication, 1997.
19. McKeigue, P. M., G. J. Miller andM. G. Marmot, 'Coronary heartdisease in South Asians overseas:A review', Journal of ClinicalEpidemiology, Vol. 42, No. 7, UnitedKingdom, 1989, pp. 597-609.
9290
20. Among 201 four-year-old childrenborn in Pune of known birthweight,those who were 2.4 kg or less at birthhad mean glucose and insulinconcentrations 8.1 mM (micromole)and 321 pM (picamole) respectively30 minutes after an oral glucosechallenge; in comparison childrenborn 3.0 kg or heavier had a meanglucose concentration of 7.5 mM anda mean blood insulin level of 289 pM.From Yajnik, M. et al., 'Fetal growthand glucose and insulin metabolism infour-year-old Indian children',Diabetic Medicine, Vol. 12, 1995,pp. 330-336.
21. Congdon, N. et al., 'Pupillary andvisual thresholds in young childrenas an index of population vitamin Astatus', American Journal of ClinicalNutrition, Vol. 61, The AmericanSociety of Clinical Nutrition, May1995, pp. 1076-1082; Sanchez, A. M. etal., 'Pupillary threshold as an index ofpopulation vitamin A status amongchildren in India', American Journalof Clinical Nutrition, Vol. 65, January1997, pp. 61-66.
22. Mendoza, C. et al., 'Effect ofGenetically Modified, Low-PhytateMaize on Iron Absorption fromTortillas', article submitted toExperimental Biology '97(unpublished).

Chapter II
Statistical tables
Economic and social statistics on the nations of the world, withparticular reference to children's well-being.
GENERAL NOTE ON THE DATA PAGE 92
EXPLANATION OF SYMBOLS PAGE 92
UNDER-FIVE MORTALITY RANKINGS PAGE 93
REGIONAL SUMMARIES COUNTRY LIST PAGE 122
GLOSSARY PAGE 131
Tables1 BASIC INDICATORS PAGE 94
2 NUTRITION PAGE 98
3 HEALTH PAGE 102
4 EDUCATION PAGE 106
5 DEMOGRAPHIC INDICATORS PAGE 110
6 ECONOMIC INDICATORS PAGE 114
7 WOMEN PAGE 118
8 THE RATE OF PROGRESS PAGE 124
91

General noteon the data
Explanation ofsymbols
92
Four major changes have been made to the
statistical tables in The State of the World's
Children 1998 report.
First, the less populous countries, which
were previously presented in a separate table,
have been merged into the main tables. Each
of the eight tables now lists 193 countries.
Second, only independent, sovereign coun-
tries are listed; these include all countriesthat are members of the United Nations and
all countries that have ratified the Convention
on the Rights of the Child.
Third, countries are now listed alphabeti-
cally in each table rather than in descending
order of their under-five mortality rate (U5MR).
However, because this rate is a crucial indicator,
countries ranked in order of their U5MR are
listed on the page opposite this note. Every
table also includes a column providing theU5MR rank of each country. The index tocountries, which appeared before table 1 in
previous reports, has been eliminated.
Fourth, the regional summary for eachtable now appears with its relevant table.
The data presented in these tables areaccompanied by definitions, sources and ex-
planations of symbols. The tables are derived
from many sources and thus will inevitably
contain a wide range of data quality. Official
government data received by the responsible
United Nations agency have been used when-
ever possible. In the many cases where there
are no reliable official figures, estimatesmade by the responsible United Nationsagency have been used. Where such interna-
tionally standardized estimates do not exist,
the tables draw on other sources, particularly
data received from the appropriate UNICEF
field office. Where possible, only comprehen-
sive or representative national data havebeen used.
Data quality is likely to be adverselyaffected for countries that have recently
Since the aim of this statistics chapter is to
provide a broad picture of the situation ofchildren and women worldwide, detailed data
qualifications and footnotes are seen as more
appropriate for inclusion elsewhere. Onlythree symbols are used to classify the table
data.
94
suffered from man-made or natural disasters.
This is particularly so where basic countryinfrastructure has been fragmented or major
population movements have occurred.
Data for life expectancy, total fertilityrate, crude birth and death rates, etc. are part
of the regular work on estimates and projec-
tions undertaken by the United NationsPopulation Division. These and other interna-
tionally produced estimates are revisedperiodically, which explains why some of the
data will differ from those found in earlierUNICEF publications.
In addition, the statistical tables in thepresent report contain new data from recent
Multiple Indicator Cluster Surveys. Thesesurveys were carried out in 1995 and 1996 by
more than 60 countries worldwide as ameans of assessing the progress made for
children in the context of the goals of theWorld Summit for Children.
Two new indicators have also been intro-
duced. 'Per cent of routine EPI vaccinesfinanced by government', the first of thesenew indicators, appears in table 3. This indi-
cator reflects a country's capacity to immu-
nize children as an integral part of its health
care system. It replaces the previous indica-
tor entitled 'per cent of population with access
to health services', which although of interest
to many has been eliminated because of the
poor quality of the data.
'Per cent of population below $1 per day',
the second new indicator, can be found intable 6. This indicator is now used by theWorld Bank and is a more explicit monetary
measure of international poverty than the in-
dicator it replaces. Previous reports defined
absolute poverty as the income level below
which a minimum nutritionally adequate diet,
plus essential non-food requirements, was
not affordable.
Indicates data are not available.
x Indicates data that refer to years or periods
other than those specified in the column
heading, differ from the standard defini-
tion, or refer to only part of a country.
y Indicates that survey data were used for
estimating net primary school enrolment
(in table 4 only).

Under-five mortalityrankingsThe following list ranks countries in descending
order of their estimated 1996 under-five mortality
rate (U5MR). Countries are listed alphabeti-
cally in the tables that follow.
U5MR U5MRCountry rate rank
Niger 320 1
Angola 292 2
Sierra Leone 284 3
Afghanistan 257 4
Liberia 235 5
Guinea-Bissau 223 6
Mali 220 7
Malawi 217 8
Mozambique 214 9
Somalia 211 10
Guinea 210 11
Congo, Dem. Rep. 207 12
Zambia 202 13
Nigeria 191 14
Mauritania 183 15
Ethiopia 177 16
Burundi 176 17
Equatorial Guinea 173 18
Cambodia 170 19
Rwanda 170 19
Central African Rep. 164 21
Madagascar 164 21
Burkina Faso 158 23
Djibouti 157 24
C6te d'Ivoire 150 25
Myanmar 150 25
Chad 149 27
Gabon 145 28
Tanzania 144 29
Uganda 141 30
Benin 140 31
Lesotho 139 32
Pakistan 136 33
Haiti 134 34
Lao People's Dem. Rep. 128 35
Bhutan 127 36
Senegal 127 36
Togo 125 38
Comoros 122 39
Iraq 122 39
Eritrea 120 41
Nepal 116 42
Sudan 116 42
Bangladesh 112 44
Papua New Guinea 112 44
India 111 46
Ghana 110 47
Congo 108 48
Gambia 107 49
Yemen 105 50
Bolivia 102 51
Cameroon 102 51
Swaziland 97 53
Marshall Islands 92 54
Kenya 90 55
Guyana 83 56
Sao Tome and Principe 80 57
Egypt 78 58
U5MR U5MR U5MR U5MR
Country rate rank Country rate rank
Turkmenistan 78 58 Antigua and Barbuda 22 127
Namibia 77 60 Bahrain 22 127
Kiribati 76 61 Saint Lucia 22 127
Maldives 76 61 Uruguay 22 127
Tajikistan 76 61 Yugoslavia, Fed. Rep. 22 127
Morocco 74 64 Qatar 21 132
Cape Verde 73 65 Dominica 20 133
Zimbabwe 73 65 Latvia 20 133
Indonesia 71 67 Panama 20 133
Mongolia 71 67 Bulgaria 19 136
South Africa 66 69 Seychelles 19 136
Libya 61 70 Sri Lanka 19 136
Uzbekistan 60 71 Belarus 18 139
Peru 58 72 Lithuania 18 139
Nicaragua 57 73 Oman 18 139
Dominican Rep. 56 74 United Arab Emirates 18 139
Guatemala 56 74 Bosnia and Herzegovina 17 143
Tuvalu 56 74 Trinidad and Tobago 17 143
Samoa 53 77 Estonia 16 145
Vanuatu 53 77 Costa Rica 15 146
Brazil 52 79 Kuwait 14 147
Botswana 50 80 Poland 14 147
Kyrgyzstan 50 80 Chile 13 149
China 47 82 Malaysia 13 149
Turkey 47 82 San Marino 13 149
Ka za kstan 45 84 Barbados 12 152
Azerbaijan 44 85 Hungary 12 152
Belize 44 85 Brunei Darussalam 11 154
Viet Nam 44 85 Croatia 11 154
Albania 40 88 Jamaica 11 154
Ecuador 40 88 Malta 11 154
El Salvador 40 88 Slovakia 11 154
Lebanon 40 88 Cuba 10 159
Algeria 39 92 Cyprus 10 159
Philippines 38 93 Greece 9 161
Saint Kitts and Nevis 38 93 Israel 9 161
Thailand 38 93 United States 8 163
Iran 37 96 Belgium 7 164Honduras 35 97 Canada 7 164Palau 35 97 Czech Rep. 7 164
Tunisia 35 97 Ireland 7 164
Paraguay 34 100 Italy 7 164
Syria 34 100 Korea, Rep. of 7 164
Mexico 32 102 Liechtenstein 7 164
Moldova, Rep. of 32 102 Luxembourg 7 164
Colombia 31 104 New Zealand 7 164
Grenada 31 104 Portugal 7 164
Nauru 31 104 United Kingdom 7 164
Suriname 31 104 Andorra 6 175
Armenia 30 108 Australia 6 175
Cook Islands 30 108 Austria 6 175
Korea, Dem. People's Rep. 30 108 Denmark 6 175
Saudi Arabia 30 108 France 6 175
TFYR Macedonia 30 108 Germany 6 175
Georgia 29 113 Japan 6 175
Solomon Islands 29 113 Monaco 6 175
Venezuela 28 115 Netherlands 6 175
Micronesia, Fed. States of 27 116 Norway 6 175
Argentina 25 117 Slovenia 6 175
Jordan 25 117 Iceland 5 186
Romania 25 117 Spain 5 186
Russian Federation 25 117 Switzerland 5 186
Fiji 24 121 Finland 4 189
Ukraine 24 121 Singapore 4 189
Bahamas 23 123 Sweden 4 189
Mauritius 23 123 Holy See no dataSaint Vincent/Grenadines 23 123 Niue no dataTonga 23 123
93

Table 1: Basic indicators
Under-5mortality
rank
Afghanistan 4
Albania 88
Algeria 92
Andorra 175
Angola 2
Antigua and Barbuda 127
Argentina 117
Armenia 108
Australia 175
Austria 175
Azerbaijan 85
Bahamas 123
Bahrain 127
Bangladesh 44
Barbados 152
Belarus 139
Belgium 164
Belize 85
Benin 31
Bhutan 36
Bolivia 51
Bosnia and Herzegovina 143
Botswana 80
Brazil 79
Brunei Darussalam 154
Bulgaria 136
Burkina Faso 23
Burundi 17
Cambodia 19
Cameroon 51
Canada 164
Cape Verde 65
Central African Rep. 21
Chad 27
Chile 149
China 82
Colombia 104
Comoros 39
Congo 48
Congo, Dem. Rep. 12
Cook Islands 108
Costa Rica 146
Me d'Ivoire 25
Croatia 154
Cuba 159
Cyprus 159
Czech Rep. 164
Denmark 175
Djibouti 24
Dominica 133
Dominican Rep. 74
Ecuador 88
Egypt 58
El Salvador 88
Equatorial Guinea 18
Eritrea 41
Estonia 145
Ethiopia 16
Under-5mortality
rate
Infantmortality
rate(under 1)
Totalpopulation(thousands)
Annualno. ofbirths
(thousands)
Annualno. of
under-5deaths
(thousands)
GNP
per capita(US$)
Lifeexpectancy
at birth(years)
Totaladult
literacyrate
Primaryschool
enrolmentratio
(gross)
% shareof household
income1990-96
lowest highest1960 1996 1960 1996 1996 1996 1996 1995 1996 1995 1990-95 40% 20%
360 237 215 165 20883 1127 290 250x 45 32 48
151 40 112 34 3401 75 3 670 71 98
255 39 152 34 28784 857 33 1600 68 62 105 18x 46x
6 5 71 1 0 c
345 292 208 170 11185 546 159 410 47 42x 88
22 18 66 1 0 6980x 75 95x 100x
72 25 60 22 35219 709 18 8030 73 96 111
48 30 38 25 3638 50 2 730 71 100 90
24 6 20 6 18057 262 2 18720 78 107 16x 42x
43 6 37 5 8106 86 0 26890 77 103
75 44 55 34 7594 154 7 480 71 100 117
68 23 51 19 284 5 0 11940 73 98 97
203 22 130 18 570 12 0 7840 73 85 111
247 112 151 83 120073 3186 357 240 57 38 79 23 38
90 12 74 11 261 3 0 6560 76 97 90
47 18 37 14 10348 106 2 2070 70 99 97 26 33
35 7 31 6 10159 115 1 24710 77 99 22x 36x
104 44 74 36 219 7 0 2630 74 80x 111
310 140 184 84 5563 238 33 370 54 37 72
300 127 175 90 1812 76 10 420 52 42 25x
252 102 152 71 7593 258 26 800 61 83 95 15 48
155 17 105 15 3628 43 1 a 73
170 50 117 40 1484 52 3 3020 52 70 115 11x 59x
177 52 115 44 161087 3211 167 3640 67 83 114 7x 68x
87 11 63 9 300 6 0 25160 75 88 109
70 19 49 16 8468 86 2 1330 71 98 86 21 39
318 158 183 82 10780 501 79 230 46 19 39
255 176 151 106 6221 272 48 160 46 35 69
217 170 146 108 10273 360 61 270 53 65x 118
264 102 156 63 13560 539 55 650 56 63 89
33 7 28 6 29680 367 2 19380 79 97x 103 18x 40x
164 73 110 54 396 12 1 960 66 72 131
343 164 195 103 3344 127 21 340 49 60 71x
325 149 195 92 6515 275 41 180 47 48 55
138 13 107 11 14421 294 4 4160 75 95 99 10 61
209 47 140 38 1232083 20712 973 620 69 82 118 15 48
130 31 82 26 36444 878 27 1910 71 91 121 11 56
248 122 165 83 632 26 3 470 57 57 75
220 108 143 81 2668 115 12 680 51 75
302 207 175 128 46812 2135 442 120 53 77 68
30 26 19 0 0 1550x 99x 98
112 15 80 13 3500 86 1 2610 77 95 106 13x 51x
300 150 195 90 14015 523 78 660 51 40 68 18x 44x
98 11 70 10 4501 48 1 3250 72 98 86
54 10 39 10 11018 149 2 1170x 76 96 104
36 10 30 9 756 12 0 10260x 77 94x 100
25 7 22 6 10251 111 1 3870 73 100 24 37
25 6 22 6 5237 68 0 29890 75 99 17x 39x
289 157 186 112 617 24 4 780x 50 46 38
20 17 71 2 0 2990 73
149 56 102 45 7961 198 11 1460 71 82 103 12x 56x
180 40 115 31 11699 309 12 1390 70 90 123 14 53
282 78 189 57 63271 1690 132 790 65 51 98 21 41
210 40 130 34 5796 166 7 1610 69 72 79
316 173 188 111 410 17 3 380 49 79 149x
250 120 170 78 3280 135 16 100x 50 49
52 16 40 13 1471 13 0 2860 69 98 101 17 46
280 177 175 113 58243 2856 506 100 49 36 27 21x 41x
94 96

...Table 1
Under-5mortality
Under-5mortality
rate
Infantmortality
rate(under 1)
Totalpopulation
(thousands)
Annualno. ofbirths
(thousands)
Annualno. of
under-5deaths
(thousands)
GNP
per capita(USS)
Lifeexpectancy
at birth(years)
Totaladult
literacyrate
Primaryschool
enrolmentratio
(gross)
% shareof household
income1990-96
lowest highest1960 1996 1960 1996rank 1996 1996 1996 1995 19% 1995 1990-95 40% 20%
Fiji 121 97 24 71 20 797 18 0 2440 72 92 128
Finland 189 28 4 22 4 5126 62 0 20580 76 100 18x 38x
France 175 34 6 29 5 58333 692 4 24990 79 105 17x 42x
Gabon 28 287 145 171 87 1106 41 6 3490 55 63
Gambia 49 375 107 213 78 1141 46 5 320 46 39 67
Georgia 113 70 29 52 23 5442 77 2 440 73 99 82
Germany 175 40 6 34 5 81922 774 4 27510 76 97 19x 40x
Ghana 47 213 110 126 70 17832 692 76 390 57 65 76 20 42
Greece 161 64 9 53 8 10490 104 1 8210 78 97 95
Grenada 104 31 25 92 2 0 2980 96x 88x
Guatemala 74 204 56 140 43 10928 405 23 1340 66 56 84 8x 63x
Guinea 11 380 210 215 130 7518 359 75 550 46 36 46 11 50
Guinea-Bissau 6 336 223 200 132 1091 44 10 250 44 55 60x 9 59
Guyana 56 126 83 100 60 838 19 2 590 64 98 112x
Haiti 34 260 134 170 94 7259 250 34 250 54 45 56
Holy See 1
Honduras 97 204 35 137 29 5816 201 7 600 69 73 112 11 57
Hungary 152 57 12 51 11 10049 104 1 4120 69 99 97 24 37
Iceland 186 22 5 17 5 271 4 0 24950 79 98
India 46 236 111 144 73 944580 24381 2706 340 62 52 102 21 43
Indonesia 67 216 71 127 47 200453 4732 336 980 64 84 115 21 41
Iran 96 233 37 145 33 69975 2446 91 1033x 69 69 101
Iraq 39 171 122 117 94 20607 770 94 1036x 61 58 91
Ireland 164 36 7 31 6 3554 46 0 14710 76 104
Israel 161 39 9 32 8 5664 115 1 15920 77 95x 95 18x 40x
Italy 164 50 7 44 6 57226 528 4 19020 78 98 98 19x 41x
Jamaica 154 76 11 58 10 2491 56 1 1510 74 85 109 16 48
Japan 175 40 6 31 4 125351 1281 8 39640 80 102 22x 38x
Jordan 117 139 25 97 21 5581 211 5 1510 69 87 94 16 50
Kazakstan 84 74 45 55 38 16820 312 14 1330 68 100 87 20 40
Kenya 55 202 90 120 61 27799 1027 92 280 54 78 91 10 62
Kiribati 61 76 56 80 2 0 920 58 93x 91
Korea, Dem. People's Rep, 108 120 30 85 23 22466 493 15 970x 72 104x
Korea, Rep. of 164 127 7 90 6 45314 688 5 9700 72 98 95 20x 42x
Kuwait 147 128 14 89 13 1687 40 1 17390 76 79 69
Kyrgyzstan 80 115 50 80 39 4469 117 6 700 68 97 111 10 57
Lao People's Dem. Rep. 35 235 128 155 102 5035 227 29 350 53 57 107 23 40
Latvia 133 44 20 35 16 2504 25 1 2270 68 100 83 23 37
Lebanon 88 85 40 65 33 3084 76 3 2660 69 92 112
Lesotho 32 203 139 137 96 2078 74 10 770 58 71 99 9x 60x
Liberia 5 288 235 190 157 2245 121 28 490x 48 38 35x
Libya 70 269 61 160 50 5593 227 14 5540x 65 76 110
Liechtenstein 164 7 6 31 0 0 c 100x
Lithuania 139 70 18 52 14 3728 41 1 1900 70 99 96 20 42
Luxembourg 164 41 7 33 7 412 5 0 41210 76 91
Madagascar 21 364 164 219 100 15353 643 105 230 58 46 73 16 50
Malawi 8 365 217 206 137 9845 487 106 170 41 56 120
Malaysia 149 105 13 73 11 20581 539 7 3890 72 84 93 13x 54x
Maldives 61 258 76 158 54 263 11 1 990 64 93 134
Mali 7 500 220 285 134 11134 539 119 250 47 31 32
Malta 154 42 11 37 10 369 5 0 7910x 77 91 108
Marshall Islands 54 92 63 57 2 0 1680x 91x 95
Mauritania 15 330 183 175 124 2333 90 16 460 53 38 74 14x 47x
Mauritius 123 84 23 62 20 1129 22 1 3380 71 83 106
Mexico 102 148 32 103 27 92718 2351 75 3320 72 90 111 12 55
Micronesia, Fed. States of 116 27 21 126 4 0 2010 81x 100
Moldova, Rep. of 102 88 32 64 26 4444 61 2 920 68 99 94 19 42
Monaco 175 6 5 32 0 0 c
9 95

Table 1: Basic indicators
Under-5mortality
Under-5mortality
rate
Infantmortality
rate(under 1)
Totalpopulation(thousands)
Annualno. ofbirths
(thousands)
Annualno. of
under-5deaths
(thousands)
GNPper capita
(US$)
Lifeexpectancy
at birth(years)
Totaladult
literacyrate
Primaryschool
enrolmentratio
(gross)
% shareof household
income1990-96
lowest highest1960 1996 1960 19%rank 1996 1996 1996 1995 1996 1995 1990-95 40% 20%
Mongolia 67 185 71 128 55 2515 70 5 310 65 83 84
Morocco 64 220 74 135 64 27021 714 53 1110 66 44 80 17 46
Mozambique 9 280 214 163 133 17796 763 163 80 47 40 65
Myanmar 25 237 150 158 105 45922 1276 191 220x 59 83 100
Namibia 60 206 77 129 60 1575 57 4 2000 56 76x 137
Nauru 104 31 25 11 0 0
Nepal 42 315 116 212 82 22021 822 95 200 56 28 109 19 45
Netherlands 175 22 6 18 5 15575 190 1 24000 78 97 21x 37x
New Zealand 164 26 7 22 7 3602 56 0 14340 77 102 16x 45x
Nicaragua 73 209 57 140 44 4238 145 8 380 68 66 104 12 55
Niger 1 320 320 191 191 9465 484 155 220 48 14 30 19 44
Nigeria 14 204 191 122 114 115020 4975 950 260 52 57 89 13 49
Niue 2 0 99x
Norway 175 23 6 19 5 4348 59 0 31250 77 99 19x 37x
Oman 139 280 18 164 15 2302 102 2 4820 70 59x 83
Pakistan 33 226 136 139 95 139973 5207 708 460 63 38 69 21 40
Palau 97 35 25 17 1 0 790x 98x 103
Panama 133 104 20 67 18 2677 62 1 2750 74 91 106 8x 60x
Papua New Guinea 44 204 112 137 79 4400 144 16 1160 57 72 82
Paraguay 100 90 34 66 28 4957 158 5 1690 69 92 109
Peru 72 234 58 142 45 23944 615 36 2310 68 89 123 14 50
Philippines 93 107 38 77 32 69282 2029 77 1050 68 95 111 17x 48x
Poland 147 70 14 62 12 38601 463 6 2790 71 99 23 37
Portugal 164 112 7 81 7 9808 110 1 9740 75 90 117
Qatar 132 239 21 145 17 558 10 0 11600 71 79 87
Romania 117 82 25 69 21 22655 247 6 1480 70 98 94 24 35
Russian Federation 117 65 25 48 20 148126 1427 36 2240 65 99 109 12 54
Rwanda 19 210 170 124 105 5397 263 45 180 36 61 77 23x 39x
Saint Kitts and Nevis 93 38 31 41 1 0 5170 69 90x
Saint Lucia 127 22 18 144 4 0 3370 71 95x
Saint Vincent/Grenadines 123 23 19 113 2 0 2280 72 82x 95x
Samoa 77 210 53 134 42 166 4 0 1120 69 98x 100
San Marino 149 13 12 25 0 0
Sao Tome and Principe 57 BO 62 135 6 0 350 69 57x
Saudi Arabia 108 292 30 170 25 18836 657 20 7040 71 63 77
Senegal 36 300 127 173 74 8532 356 45 600 51 33 60 11 59
Seychelles 136 19 15 74 3 0 6620 72 84x 102x
Sierra Leone 3 385 284 219 164 4297 207 59 180 37 31 51
Singapore 189 40 4 31 4 3384 56 0 26730 77 91 107 15x 49x
Slovakia 154 40 11 33 10 5347 64 1 2950 71 101 28 31
Slovenia 175 45 6 37 6 1924 18 0 8200 73 99x 100 23 38
Solomon Islands 113 185 29 120 24 391 14 0 910 71 62x 97
Somalia 10 294 211 175 125 9822 504 106 110x 48 24x 11x
South Africa 69 126 66 89 50 42393 1280 84 3160 65 82 117 9 63
Spain 186 57 5 46 5 39674 387 2 13580 78 97 104 22x 37x
Sri Lanka 136 130 19 90 17 18100 322 6 700 73 90 105 22 39
Sudan 42 210 116 125 73 27291 929 108 310x 54 46 55
Suriname 104 96 31 70 25 432 9 0 880 71 93 127x
Swaziland 53 233 97 157 68 881 33 3 1170 59 77 122
Sweden 189 20 4 16 4 8819 108 0 23750 78 100 21x 37x
Switzerland 186 27 5 22 5 7224 80 0 40630 78 101 17x 45x
Syria 100 201 34 136 28 14574 450 15 1120 68 71 103
Tajikistan 61 140 76 95 56 5935 184 14 340 67 100 89
Tanzania 29 240 144 142 93 30799 1281 184 120 51 68 70 18 45
TFYR Macedonia 108 177 30 120 26 2174 32 1 860 72 87
Thailand 93 148 38 103 31 58703 996 38 2740 69 94 87 14 53
Togo 38 267 125 158 78 4201 179 22 310 50 52 102
Tonga 123 23 19 98 2 0 1630 69 99x 98x
96 98

Table 2: Nutrition
Under-5mortality
rank
5'. of infantswith low
birthweight1990-94
% of children (1990-96) who are: % of under-fives (1990-97) suffering from:
Total goitre rate(6 -11 years)
(%)1985-94
% ofhouseholdsconsumingiodized salt
1992-96
exclusivelybreastfed
(0-3 months)
breastfed withcomplementary
food(6 -9 months)
stillbreastfeeding(20-23 months)
underweight
moderate& severe severe
wastingwast
moderate& severe
stunting
moderate& severe
Afghanistan 4 20 20
Albania 88 7 41
Algeria 92 9 48 29 21 13 3 9 18 9 92
Andorra 175
Angola 2 19 3 83 53 7 10
Antigua and Barbuda 127 8 10x 4x 10x Ox
Argentina 117 7 8 90
Armenia 108 10
Australia 175 6
Austria 175 6
Azerbaijan 85 20
Bahamas 123
Bahrain 127 6
Bangladesh 44 50 51 56 21 18 55 50 44
Barbados 152 10 5x lx 4x 7x
Belarus 139 22 37
Belgium 164 6 5
Belize 85 10 24 49 0 90
Benin 31 24 35
Bhutan 36 38x 4x 56x 25 96
Bolivia 51 12 53 78 36 8 2 1 29 21 92
Bosnia and Herzegovina 143
Botswana 80 8 41x 82x 23x 15x 44x 8 27
Brazil 79 11 42 30 17 6 1 2 11 14x 95
Brunei Darussalam 154
Bulgaria 136 6 20
Burkina Faso 23 21 12 30 8 13 29 16 23
Burundi 17 89x 66x 73x 37 11 9 43 42 BO
Cambodia 19 40 7 8 38 15
Cameroon 51 13 7 77 35 14 3 3 24 26 86
Canada 164 6
Cape Verde 65 11 19x 3x 26x
Central African Rep. 21 15 23 27 8 7 34 63 65
Chad 27 15 31
Chile 149 5 77 17 1 0 3 9x 95
China 82 9 64 16 20 51
Colombia 104 9 16 61 17 8 1 1 15 7 90
Comoros 39 8 5 87 45 26 8 8 34
Congo 48 16 43x 95x 27x 24x 3x 4x 21x 8
Congo, Dem. Rep. 12 15 32 40 64 34 10 10 45 9 12
Cook Islands 108 3
Costa Rica 146 7 35 47 12 2 4 89
Cote d'Ivoire 25 14 62 54 24 6 8 24 6
Croatia 154 24 100
Cuba 159 8 lx 10 45
Cyprus 159
Czech Rep. 164 6
Denmark 175 6 5
Djibouti 24 11 23 9 11 22
Dominica 133 10 5x On 2x 6x
Dominican Rep. 74 11 25 47 7 6 1 1 11 5 40
Ecuador 88 13 29 52 34 17x On 2x 34x 10 97
Egypt 58 10 53 37 15 4 6 25 5 0
El Salvador 88 11 20 71 28 11 1 1 23 25 91
Equatorial Guinea 18 20
Eritrea 41 13 66 45 60 44 17 16 38 BO
Estonia 145
Ethiopia 16 16 74 35 48 16 8 64 31 0
98
100

...Table 1
Under-5mortality
Under-5mortality
rate
Infantmortality
rate(under 1)
Totalpopulation(thousands)
Annualno. ofbirths
(thousands)
Annualno. of
under-5deaths
(thousands)
GNP
per capita(USE)
Lifeexpectancy
at birth(years)
Totaladult
literacyrate
Primaryschool
enrolmentratio
(gross)
% shareof household
income1990-96
lowest highest1960 1996 1960 1996rank 1996 1996 1996 1995 1996 1995 1990-95 40% 20%
Trinidad and Tobago 143 73 17 61 15 1297 21 0 3770 73 98 94
Tunisia 97 254 35 170 28 9156 223 8 1820 69 67 118 16 46
Turkey 82 219 47 163 41 61797 1371 64 2780 68 82 97
Turkmenistan 58 150 78 100 57 4155 122 10 920 65 98x 18 43
Tuvalu 74 56 40 10 0 0 650x 99x 101
Uganda 30 224 141 133 88 20256 1040 147 240 41 62 67 17 48
Ukraine 121 53 24 41 18 51608 511 12 1630 69 99 87 24 35
United Arab Emirates 139 240 18 160 15 2260 42 1 17400 75 79 110
United Kingdom 164 27 7 23 6 58144 706 5 18700 77 114 15x 44x
United States 163 30 8 26 8 269444 3827 32 26980 76 99x 107 16x 42x
Uruguay 127 56 22 48 20 3204 54 1 5170 73 97 109
Uzbekistan 71 122 60 84 46 23209 674 40 970 68 100 77
Vanuatu 77 225 53 141 41 174 5 0 1200 67 64x 106
Venezuela 115 70 28 53 24 22311 570 16 3020 72 91 94 11 58
Viet Nam 85 219 44 147 33 75181 1975 87 240 67 94 114 19 44
Yemen 50 340 105 230 78 15678 756 79 260 57 33x 83
Yugoslavia, Fed. Rep. 127 120 22 87 19 10294 131 3 b 72 98 70
Zambia 13 213 202 126 112 8275 356 72 400 43 78 82 12 50
Zimbabwe 65 181 73 109 49 11439 436 32 540 49 85 115 10 62
Regional summaries
Sub-Saharan Africa 257 170 154 105 576069 24777 4224 501 51 57 73 11 58
Middle East and North Africa 241 65 154 50 318201 10248 662 1710 65 59 93
South Asia 239 119 146 80 1267705 35132 4173 345 61 49 94 21 42
East Asia and Pacific 201 54 133 41 1797840 34355 1843 1043 68 84 114 17 46
Latin America and Caribbean 157 43 105 35 479139 11201 484 3271 69 87 110 9 61
CEE/CIS and Baltic States 101 36 76 29 474657 6649 237 2086 68 97 97 18 44
Industrialized countries 37 7 31 6 838679 10056 70 25926 77 98 104 18 40
Developing countries 216 97 137 66 4577675 118889 11546 1101 62 71 99 15 51
Least developed countries 280 171 171 109 594510 23695 4041 220 51 48 69 20 43
World 192 88 123 60 5752290 132418 11694 4812 63 75 100 18 42
Countries in each region are listed on page 122.
Definitions of the indicators Main data sources
Under-five mortality rate Probability of dying between birth and exactly five years of ageexpressed per 1,000 live births.
Infant mortality rate Probability of dying between birth and exactly one year of ageexpressed per 1,000 live births.
GNP per capita Gross national product (GNP) is the sum of gross value added by all
resident producers, plus any taxes that are not included in the valuation of output, plus net
receipts of primary income from non-resident sources, GNP per capita is the gross national
product, converted to United States dollars using the World Bank Atlas method, divided bythe mid-year population.
Life expectancy at birth The number of years newborn children would live if subject tothe mortality risks prevailing for the cross-section of population at the time of their birth.
Adult literacy rate Percentage of persons aged 15 and over who can read and write.
Gross primary school enrolment ratio The number of children enrolled in primaryschool, regardless of age, divided by the population of the age group that officially
corresponds to primary schooling.
Income share Percentage of income received by the 20 per cent of households with thehighest income and by the 40 per cent of households with the lowest income.
Under-five and infant mortality rates -- UNICEF, United Nations Population Division andUnited Nations Statistics Division.
Total population United Nations Population Division.
Births United Nations Population Division.
Under-five deaths UNICEF.
GNP per capita World Bank.
Life expectancy United Nations Population Division.
Adult literacy United Nations Educational, Scientific and Cultural Organization (UNESCO).
School enrolment United Nations Educational, Scientific and Cultural Organization(UNESCO).
Household income World Bank.
Notes a: Range $765 or less
b: Range $765 to $3035c: Range $9386 or more
- Data not available.
x Indicates data that refer to years or periods other than those specified in
the column heading, differ from the standard definition, or refer to only part of a country.
x
93 97
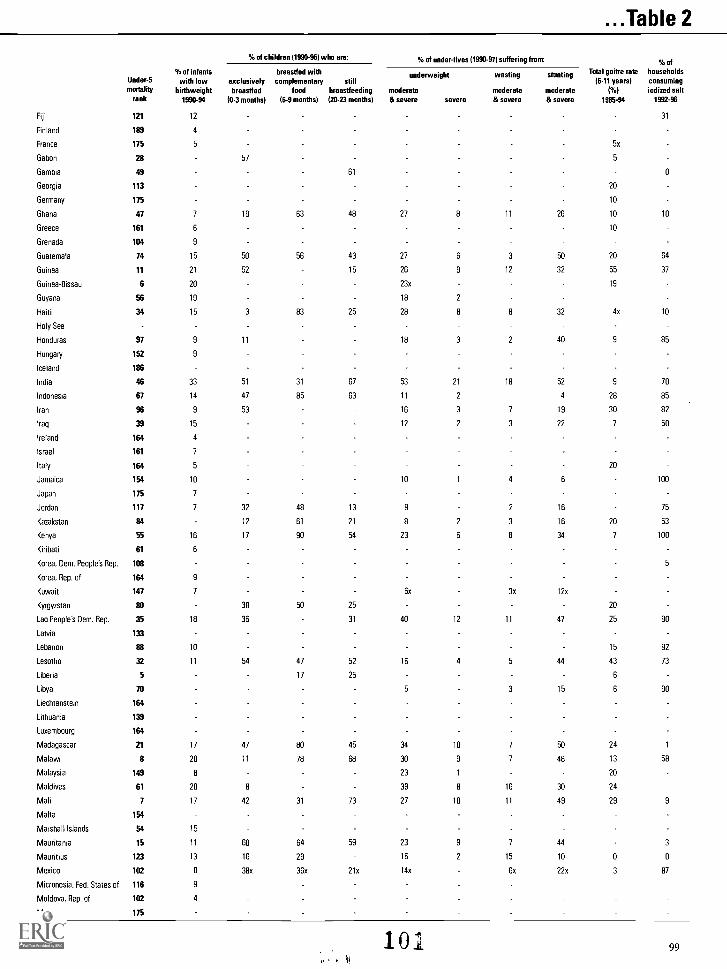
...Table 2
% of children (1990-96) who are: % of under-fives (1990-97) suffering from: % of% of infants breastfed with underweight wasting stunting Total goitre rate households
Under-5 with low exclusively complementary still (6-11 years) consumingmortality hirthweight hreastfed food breastfeeding moderate moderate moderate ( %) iodized salt
rank 1990-94 (0-3 months) (6-9 months) (20-23 months) & severe severe & severe & severe 1985-94 1992-96
Fiji
Finland
France
121
189
175
12
4
5 5x
31
Gabon 28 57 5
Gambia 49 61 0
Georgia 113 20
Germany 175 10
Ghana 47 7 19 63 48 27 8 11 26 10 10
Greece 161 6 10
Grenada 104 9
Guatemala 74 15 50 56 43 27 6 3 50 20 64
Guinea 11 21 52 15 26 9 12 32 55 37
Guinea-Bissau 6 20 23x 19
Guyana 56 19 18 2
Haiti 34 15 3 83 25 28 8 8 32 4x 10
Holy See
Honduras 97 9 11 18 3 2 40 9 85
Hungary 152 9
Iceland 186
India 46 33 51 31 67 53 21 18 52 9 70
Indonesia 67 14 47 85 63 11 2 4 28 85
Iran 96 9 53 16 3 7 19 30 82
Iraq 39 15 12 2 3 22 7 50
Ireland 164 4
Israel 161 7
Italy 164 5 20
Jamaica 154 10 10 1 4 6 100
Japan 175 7
Jordan 117 7 32 48 13 9 2 16 75
Kazakstan 84 12 61 21 8 2 3 16 20 53
Kenya 55 16 17 90 54 23 6 8 34 7 100
Kiribati 61 6
Korea, Dem. People's Rep. 108 5
Korea, Rep. of 164 9
Kuwait 147 7 6x 3x 12x
Kyrgyzstan 80 38 50 25 20
Lao People's Dem. Rep. 35 18 36 31 40 12 11 47 25 90
Latvia 133
Lebanon 88 10 15 92
Lesotho 32 11 54 47 52 16 4 5 44 43 73
Liberia 5 17 25 6
Libya 70 5 3 15 6 90
Liechtenstein 164
Lithuania 139
Luxembourg 164
Madagascar 21 17 47 80 45 34 10 7 50 24 1
Malawi 8 20 11 78 68 30 9 7 48 13 58
Malaysia 149 8 23 1 20
Maldives 61 20 8 39 8 16 30 24
Mali 7 17 42 31 73 27 10 11 49 29 9
Malta 154
Marshall Islands 54 15
Mauritania 15 11 60 64 59 23 9 7 44 3
Mauritius 123 13 16 29 16 2 15 10 0 0
Mexico 102 8 38x 36x 21x 14x 6x 22x 3 87
Micronesia, Fed. States of 116 9
Moldova, Rep. of 102 4
Monaco 175
101It
99

Table 2: Nutrition
% of children (1990-96) who are: % of under-fives (1990-97) suffering from: % of
% of infants hreastfed with Total goitre rate householdsunderweight wasting stuntingUnder-5 with low exclusively complementary still (6-11 years) consumingmortality hirthweight breastfed food hreastfeeding moderate moderate moderate (%) iodized salt
rank 1990-94 (0-3 months) (6-9 months) (20-23 months) & severe severe & severe & severe 1985-94 1992-96
Mongolia 67 6 12 2 26 28 42
Morocco 64 9 31 33 20 9 2 2 23 20
Mozambique 9 20 27 11 5 55 20 62
Myanmar 25 16 30 40 56 43 16 8 45 18 14
Namibia 60 16 22 65 23 26 6 9 28 35 80
Nauru 104
Nepal 42 83 63 88 47 16 11 48 44 93
Netherlands 175 3
New Zealand 164 6
Nicaragua 73 15 11 48 17 12 2 24 4 98
Niger 1 15 67 52 36 12 16 32 9 83
Nigeria 14 16 2 52 43 36 12 9 43 10 83
Niue
Norway 175 4
Oman 139 8 28 85 64 23 3 13 23 10 35
Pakistan 33 25 16 31 56 38 13 32 19
Palau 97 8
Panama 133 9 32 38 21 7 1 1 9 13 92
Papua New Guinea 44 23 35x 30
Paraguay 100 5 7 61 8 4 1 0 17 49 77
Peru 72 11 63 83 43 8 1 1 26 36 90
Philippines 93 15 33 52 18 30 5 8 33 15 15
Poland 147 10
Portugal 164 5 15
Qatar 132
Romania 117 11 10
Russian Federation 117 30
Rwanda 19 17 90 68 85 29 6 4 48 49 90
Saint Kitts and Nevis 93 9
Saint Lucia 127 8
Saint Vincent/Grenad nes 123 8
Samoa 77 6
San Marino 149
Sao Tome and Principe 57 7 17x 5x 26x
Saudi Arabia 108 7
Senegal 36 11 9 87 22 7 23 12 9
Seychelles 136 10 6x Ox 2x 5x
Sierra Leone 3 11 94 41 29 9 35 7 75
Singapore 189 7
Slovakia 154
Slovenia 175
Solomon Islands 113 20
Somalia 10 16 7
South Africa 69 9 1 3 23 2 40
Spain 186 4 10
Sri Lanka 136 25 24 60 66 38 7 16 24 14 7
Sudan 42 15 14x 45x 44x 34 11 13 33 20
Suriname 104 13
Swaziland 53 10 37 51 20 10x lx 30x 26
Sweden 189 5
Switzerland 186 5
Syria 100 11 50 13 4 9 21 73 36
Tajikistan 61 20 20
Tanzania 29 14 40 27 8 6 42 37 74
TFYR Macedonia 108 100
Thailand 93 13 4x 69x 34x 26x 4x 6x 22x 8 50
Togo 38 20 25 99 19 4 34 22 1
Tonga 123 2
100 102

...Table 2
% of infantsUnder-5 with lowmortality birthweight
rank 1990-94
% of children (1990-96) who are: % of under-fives (1990-97) suffering from:
Total goitre rate(6-11 years)
(%)1985-94
exclusivelybreastfed
(0-3 months)
breastfed withcomplementary
food(6-9 months)
stillbreastfeeding(20-23 months)
underweight
moderate& severe Mere
wasting
moderate& severe
stunting
moderate& severe
Trinidad and Tobago 143 10 10x 39x 16x 7x Ox 4x 5x
Tunisia 97 8 12 16 9 4 23 4x
Turkey 82 8 14 17 14 10 3 36
Turkmenistan 58 5 54 20
Tuvalu 74 2
Uganda 30 70 64 40 26 7 5 38 7
Ukraine 121 10
United Arab Emirates 139 6 26
United Kingdom 164 7
United States 163 7
Uruguay 127 8 7x 2x 16x
Uzbekistan 71 4 18
Vanuatu 77 7 20x 19x
Venezuela 115 9 6x 2x fix 11
Viet Nam 85 17 45 11 12 47 20
Yemen 50 19 31 39 13 39 32
Yugoslavia, Fed. Rep. 127
Zambia 13 13 13 88 34 28 9 6 53 51x
Zimbabwe 65 14 16 93 26 16 3 6 21 42
Regional summaries
Sub-Saharan Africa 16 32 61 47 30 10 8 42 18
Middle East and North Africa 11 43 39 17 5 7 23 20
South Asia 33 46 32 65 51 19 17 52 18
East Asia and Pacific 11 56 70 20 21
Latin America and Caribbean 10 38 44 22 10 1 3 18 12
CEE/CIS and Baltic States 20
Industrialized countries 6
Developing countries 18 44 45 50 30 11 11 37 18
Least developed countries 23 46 56 51 39 13 10 47 29
World 17 44 45 50 30 11 11 37 18
Countries in each region are listed on page 122.
% ofhouseholdsconsumingiodized salt
1992-96
98
18
0
69
4
0
65
59
21
70
90
80
50
52
61
52
87
25
57
38
56
Definitions of the indicators Main data sources
Low hirthweight Less than 2,500 grams. Low birthweight World Health Organization (WHO).
Underweight Moderate and severe below minus two standard deviations from median
weight for age of reference population; severe below minus three standard deviations
from median weight for age of reference population.
Wasting Moderate and severe below minus two standard deviations from median
weight for height of reference population.
Stunting Moderate and severe below minus two standard deviations from median
height for age of reference population.
Total goitre rate Percentage of children aged 6-11 with palpable or visible goitre. This is an
indicator of iodine deficiency, which causes brain damage and mental retardation,
Breastfeeding Demographic and Health Surveys, Multiple Indicator Cluster Surveys (MICS)
and World Health Organization (WHO).
Underweight, wasting and stunting Demographic and Health Surveys, Multiple Indicator
Cluster Surveys (MICS) and World Health Organization (WHO).
Salt iodization UNICEF and Multiple Indicator Cluster Surveys (MICS).
Goitre rate World Health Organization (WHO).
Notes Data not available.
x Indicates data that refer to years or periods other than those specified in the column heading, differ from the standard definition, or refer to only part of a country.
103101

Table 3: Health% of routine
% of population % of population EPI vaccineswith access to with access to financed by .1. fully immunized 1995-96
safe water adequate sanitation government ORTUnder-5 1990-96 1990-96 1995-96 1-year-old children pregnant use ratemortality women 1%)
rank total urban rural total urban rural total TB OPT polio measles tetanus 1990-97
Afghanistan 4 12 39 5 8 38 1 0 47 31 31 42 37
Albania 88 94 98 100 92
Algeria 92 78 91 64 91 99 80 94 75 75 68 34 98
Andorra 175
Angola 2 32 69 15 16 34 8 74 42 42 65 28
Antigua and Barbuda 127 96 100 100 100 100
Argentina 117 71 77 29 68 73 37 100 100 83 90 100 63
Armenia 108 0 82 86 97 89
Australia 175
Austria 175 90 90 60
Azerbaijan 85 90 95 97 99
Bahamas 123 100 85 85 92 75x
Bahrain 127 100 100 98 98 95 54 5
Bangladesh 44 97 99 96 48 79 44 74 88 66 66 59 72 96
Barbados 152 100 100 100 100 100 100 100 88 85 100 100
Belarus 139 93x 95 94 74
Belgium 164 97 94 70
Belize 85 89 96 82 57 23 87 100 90 85 85 81 88
Benin 31 50 41 53 20 54 6 15 90 80 80 74 75 60
Bhutan 36 58 75 54 70 90 66 0 98 87 86 86 70 85
Bolivia 51 63 86 32 58 74 37 65 90 76 76 87 52 41
Bosnia and Herzegovina 143 97 88 86 88
Botswana 80 93x 100x 91x 55 91 41 100 67 83 81 82 61
Brazil 79 76 88 25 70 80 30 100 90 75 73 74 45 54
Brunei Darussalam 154 100x 100x 100x 100x 50x
Bulgaria 136 98 100 94 93
Burkina Faso 23 42 66 37 37 41 33 34 61 48 48 54 27 100
Burundi 17 52 92 49 51 60 50 77 63 63 50 33
Cambodia 19 36 65 33 14 81 8 0 90 75 76 72 36
Cameroon 51 50 57 43 50 64 36 54 46 46 46 12 43
Canada 164 93 89 98
Cape Verde 65 51 70 34 24 40 10 100 80 73 73 66 4
Central African Rep. 21 38 55 21 27 38 16 94 53 53 46 15 100
Chad 27 24 48 17 21 73 7 100 40 19 19 28 50
Chile 149 95 98 81 86 100 96 92 92 96
China 82 67 97 56 24 74 7 100 97 95 96 97 13 85
Colombia 104 85 97 56 85 97 56 99 98 92 93 95 57 53
Comoros 39 53 76 45 23 40 16 89 60 57 48 34 32
Congo 48 34 53 7 69 0 50 47 47 42 55 41
Congo, Dem. Rep. 12 42 89 26 18 53 6 51 36 36 41 20 90
Cook Islands 108 100 100 100 100 100 100 50 90 75 75 72 64
Costa Rica 146 96 100 92 84 95 70 100 91 84 84 86 90 31
C8te d'Ivoire 25 42 56 32 39 71 17 100 68 55 55 65 22 73
Croatia 154 90 91 91 91 91 5
Cuba 159 93 96 85 66 71 51 99 100 93x 94 61x
Cyprus 159 100 96 98 98 90 57x
Czech Rep. 164 96 97 98 97
Denmark 175 89x 100x 88x
Djibouti 24 90 77 100 55 64 24 58 49 49 47 39
Dominica 133 96 97 95 80 80 85 100 100 100 100 100
Dominican Rep. 74 65 80 78 76 83 100 98 58 48 78 96 39
Ecuador 88 68 80 49 76 95 49 100 100 88 89 79 25 64
Egypt 58 87 97 79 88 98 79 100 91 77 77 85 55 95
El Salvador 88 69 85 46 81 91 65 100 100 100 100 97 69 69
Equatorial Guinea 18 95 88 100 54 61 48 99 64 64 61 63
Eritrea 41 22 60 8 13 48 0 52 46 46 38 23 38
Estonia 145 99 90 93 86
Ethiopia 16 25 91 19 19 97 7 0 87 67 67 54 36 95
102 1u4

...Table 3% of routine
% of population % of population EPI vaccineswith access to with access to financed by % fully immunized 1995-96
safe water adequate sanitation government UTUnder-5 1990-96 199D-96 1995-96 1-year-old children pregnant use ratemortality women I%)
rank total urban rural total urban rural total TB DPT polio measles tetanus 1990-97
Fiji 121 100 100 100 92 100 85 50 100 97 99 94 100
Finland 189 100 100 100 98
France 175 83 96 97 82
Gabon 28 68x 90x 50x 54 41 41 38 4 25
Gambia 49 48 67 37 83 23 100 99 97 97 89 92
Georgia 113 30 58 82 63 14
Germany 175 45 80 75
Ghana 47 65 88 52 55 62 44 50 65 51 52 53 9 93
Greece 161 70 78 95 90
Grenada 104 100 80 80 85 80
Guatemala 74 77 76 78 83 95 74 100 76 73 73 69 81 22
Guinea 11 46 69 36 31 54 19 59 48 48 49 43 31
Guinea-Bissau 6 59 32 67 30 24 32 0 72 56 58 53 43
Guyana 56 61 90 45 81 82 80 100 88 83 83 91 56
Haiti 34 37 50 28 25 49 17 0 68 34 34 31 49 31
Holy See
Honduras 97 87 96 79 87 97 78 100 100 93 94 91 99 32
Hungary 152 100 100 100 100
Iceland 186 98x 99x 98x
India 46 81 85 79 29 70 14 100 96 89 90 81 78 67
Indonesia 67 62 78 54 51 73 40 100 99 91 90 92 75 97
Iran 96 90 98 82 81 86 74 100 90 96 97 95 50 37
Iraq 39 78 92 44 70 85 37 0 99 94 95 97 65
Ireland 164
Israel 161 92 93 94
Italy 164 50 98 50
Jamaica 154 86 89 100 80 100 98 92 92 99 82
Japan 175 97x 100x 85x 85x 91 85 91 68
Jordan 117 98 77 99 99 98 41 41
Kazakstan 84 93 99 84 99 100 98 20 93 94 98 97 31
Kenya 55 53 67 49 77 69 81 0 56 46 43 38 21 76
Kiribati 61 100 100 100 100 100 100 75 100 79 82 64 41
Korea, Dem. People's Rep. 108 81 60 96 58 60 95
Korea, Rep. of 164 93 100 76 100 100 100 93x 93x 93x 92x
Kuwait 147 100x 100 100 99 21
Kyrgyzstan 80 71 94 90 82 81 80 98
Lao People's Dem. Rep. 35 44 18 0 62 28 33 62 45
Latvia 133 100 64 77 82 64
Lebanon 88 94 96 88 63 81 8 94 94 85 82
Lesotho 32 62 91 57 38 56 35 55 58 58 82 10 84
Liberia 5 46 79 13 30 56 4 0 84 45 45 44 35 94
Libya 70 97 97 97 98 99 94 99 96 96 92 45x 49
Liechtenstein 164
Lithuania 139 98 91 93 96
Luxembourg 164 95x 90x 80x
Madagascar 21 34 68 21 41 77 29 10 87 73 73 68 33 85
Malawi 8 37 80 32 6 22 4 95 90 82 89 56 78
Malaysia 149 78 96 66 94 97x 90x 90x 81x 79x
Maldives 61 96 100 81 66 100 54 98 95 95 94 93
Mali 7 66 87 55 6 12 3 65 70 29 30 35 32 29
Malta 154 96 84 92 51
Marshall Islands 54 74 100 45 74 100 45 100 88 74 75 69 15x
Mauritania 15 74 88 59 32 44 19 0 93 50 50 53 28 51
Mauritius 123 98 95 100 100 100 100 100 87 90 90 61 79
Mexico 102 83 92 57 72 85 32 100 97 83 84 75 69 81
Micronesia, Fed. States of 116 100 100 100 100 100 100 100 50 83 81 90 44
Moldova, Rep. of 102 55x 98x 18x 50x 90x 8x 98 97 99 98
Monaco 175 -
105 103

Table 3: Health% of routine
% of population % of population EPI vaccineswith access to with access to financed by % fully immunized 1995-96
safe water adequate sanitation government ORTUnder-5 1990-96 1990-96 1995-96 1-year-old children pregnant use ratemortality women 1 %)
rank total urban rural total urban rural total TB DPT polio measles tetanus 1990-97
Mongolia 67 40 73 3 86 99 74 92 90 90 88
Morocco 64 65 98 34 58 94 24 100 96 95 95 93 100 29
Mozambique 9 63 54 0 83 60 60 67 61 83
Myanmar 25 60 78 50 43 56 36 0 92 88 87 86 79 96
Namibia 60 57 87 42 34 77 12 79 70 71 61 75 66
Nauru 104
Nepal 42 63 88 60 18 58 12 40 73 51 48 45 11x 29
Netherlands 175 97 97 94
New Zealand 164 97x 100x 82x 20 84 84 87
Nicaragua 73 61 81 27 31 34 27 99 93 78 86 78 96 54
Niger 1 48 76 44 17 79 5 0 63 33 33 59 31 85
Nigeria 14 50 80 39 57 82 48 100 49 28 32 45 36 86
Niue 100 100 100 100 100 100 25 100 100 100 100
Norway 175 92 92 93
Oman 139 82 78 100 96 100 100 98 98 85
Pakistan 33 74 82 69 47 77 22 100 93 77 77 78 54 97
Palau 97 88 98 100 100 100 100 55
Panama 133 93 83 100 100 93 93 92 24 94
Papua New Guinea 44 28 84 17 22 82 11 78 55 57 44 50
Paraguay 100 60 41 65 14 100 89 80 81 81 69 33
Peru 72 67 84 33 72 89 37 100 93 72 66 71 51 55
Philippines 93 84 93 80 75 89 63 88 82 70 67 72 47 87
Poland 147 94 95 95 91
Portugal 164 91 95 95 99
Qatar 132 100 100 98 92 92 86 71
Romania 117 100 100 98 97 94
Russian Federation 117 97 87 97 95
Rwanda 19 79 85 93 98 98 76 43 47
Saint Kitts and Nevis 93 100 100 100 100 98 100 100 100 98 100
Saint Lucia 127 100 89 88 88 95
Saint Vincent/Grenadines 123 89 100 85 98 100 100 100 100 100 100 100
Samoa 77 82 100 77 94 100 92 30 98 95 95 96 96
San Marino 149
Sao Tome and Principe 57 82 35 85 66 61 57 49 74
Saudi Arabia 108 95x 100x 74x 86x 100x 30x 91 93 93 92 60 58
Senegal 36 63 90 44 39 71 15 100 80 62 62 60 34 84
Seychelles 136 100 100 100 98 100
Sierra Leone 3 34 58 21 11 17 8 3 77 65 65 79 65
Singapore 189 100x 100x 97 95 93 88
Slovakia 154 98 98 98 99
Slovenia 175 99x 98x 98x 91x
Solomon Islands 113 61 82 58 11 73 2 60 71 72 72 67 63
Somalia 10 31 46 28 43 69 35 0 43 21 21 33 28 97
South Africa 69 99 99 53 53 85 12 100 95 73 72 76 26x
Spain 186 88 90 90x
Sri Lanka 136 57 88 52 63 68 62 100 88 90 91 86 81 34
Sudan 42 50 66 45 22 79 4 0 96 79 80 75 44 35
Suriname 104 43 100 80 79 78 99x
Swaziland 53 60 89 46 70 92 59 68 70 71 59 65 99
Sweden 189 99 99 96
Switzerland 186
Syria 100 86 95 77 67 96 31 100 100 96 96 95 78 27
Tajikistan 61 60 82 49 46 96 93 96 80
Tanzania 29 38 73 29 86 96 84 0 96 85 80 81 92 91
TFYR Macedonia 108 14 98 93 94 90 91x
Thailand 93 89 94 88 96 98 95 98 94 94 85 88 95
Togo 38 55 82 41 41 76 22 0 63 82 82 39 43 94
Tonga 123 100 100 100 100 100 100 50 99 95 93 94 88
104106

...Table 3
Under-5mortality
rank
% of populationwith access to
safe water1990-96
total urban rural
% of populationwith access to
adequate sanitation1990-96
total urban rural
% of routineEPI vaccinesfinanced bygovernmeM
1995-96
total
%fully immunized 1995-96
1-year-old childrenORT
pregnant use ratewomen 1%)
TB DPT polio measles tetanus 1990-97
Trinidad and Tobago 143 97 99 91 79 99 98 100 89 90 88 19x
Tunisia 97 98 100 95 80 96 52 100 86 91 91 86 80 41
Turkey 82 49 63 28 62 83 31 100 69 84 83 84 32 100
Turkmenistan 58 74 91 9 88 80 83 66 98
Tuvalu 74 97 100 95 87 90 85 70 88 87 85 94 53
Uganda 30 46 77 41 57 75 55 35 96 68 67 66 55 49
Ukraine 121 92x 94x 95x 96x
United Arab Emirates 139 95 77 93 22 98 90 90 90
United Kingdom 164 94 96 92
United States 163 94 84 89
Uruguay 127 95 98 100 98 89 89 85 13x
Uzbekistan 71 62 82 49 22 46x 16 95 89 99 81
Vanuatu 77 87x 91x 100 72 67 68 61 15
Venezuela 115 79 80 75 59 64 30 100 90 57 73 64 60
Viet Nam 85 43 47 42 21 43 15 29 95 94 94 96 82
Yemen 50 61 88 55 24 47 17 0 59 59 59 51 55 92
Yugoslavia, Fed. Rep. 127 0 97 91 94 81x
Zambia 13 27 50 17 64 89 43 10 100 83 81 93 48 99
Zimbabwe 65 79 99 69 52 96 32 90 74 80 80 77 65 60
Regional summaries
Sub-Saharan Africa 49 79 36 44 73 33 48 70 52 53 56 38 81
Middle East and North Africa 81 95 67 72 91 52 71 91 86 87 86 57 59
South Asia 80 85 78 33 71 19 93 93 83 83 77 71 73
East Asia and Pacific 67 93 57 35 76 18 89 95 92 92 92 35 87
Latin America and Caribbean 77 88 46 71 81 41 97 93 79 79 78 58 58
CEE/CIS and Baltic States 89 89 93 89
Industrialized countries 86 89 83
Developing countries 70 88 61 42 78 23 82 88 79 80 78 51 76
Least developed countries 54 78 48 35 66 28 21 78 60 60 59 48 80
World 71 89 61 42 78 23 82 89 80 81 79 51 76
Countries in each region are listed on page 122.
Definitions of the indicators
Government funding of vaccines Percentage of vaccines routinely administered in
a country to protect children against TB, DPT, measles and polio that are financed by the
national government.
EPI Extended Programme on Immunization: the immunizations in this programme include
those against TB, DPT, polio and measles, as well as protecting babies against neonatal
tetanus by vaccination of pregnant women. Other vaccines (e.g. against hepatitis B or
yellow fever) may be included in the programme in some countries.
DPT Diphtheria, pertussis (whooping cough) and tetanus.
ORT use Percentage of all cases of diarrhoea in children under five years of age treated
with oral rehydration salts and/or recommended home fluids.
Main data sources
Access to safe drinking water and adequate sanitation facilities UNICEF,
World Health Organization (WHO) and Multiple Indicator Cluster Surveys (MICS).
Government funding of vaccines UNICEF.
Immunization World Health Organization (WHO), UNICEF, Multiple Indicator ClusterSurveys (MICS) and Demographic and Health Surveys (DHS).
ORT use Multiple Indicator Cluster Surveys (MICS), Demographic and Health Surveys and
World Health Organization (WHO).
Notes - Data not available.
x Indicates data that refer to years or periods other than those specified in the column heading, differ from the standard definition, or refer to only part of a country.
107 105

Table 4: Education
Under-5mortality
rank
Adult literacy rateNo. of sets
per 1000
population1994
Primary school enrolment ratio% of primary
schoolchildrenreachinggrade 51990-95
Secondary schoolenrolment ratio
1990-95
(gross)1980 1995 1960 (gross) 1990- 95(gross) 1993- 97(net)
male female male female radio television male female male female male female male female
Afghanistan 4 33 6 47 15 118 10 14 2 63 32 36y 11y 43x 32 11
Albania 88 190 91 102 86 98 99 95 97 82 36 37
Algeria 92 55 24 74 49 236 79 55 37 111 98 99 91 95 66 58
Andorra 175 211 367
Angola 2 16x 7x 56x 29x 30 7 30 14 95 87 34
Antigua and Barbuda 127 427 370
Argentina 117 94 94 96 96 673 219 99 99 108 107 70 75
Armenia 108 100 99 225 87 93 80 90
Australia 175 1291 489 103 103 107 106 98 98 99 83 86
Austria 175 619 480 106 104 103 103 100 100 96 109 104
Azerbaijan 85 100 99 120 115 87 85
Bahamas 123 98 96 99 98 735 226 125 112 100 103 92x 96x 78 95 95
Bahrain 127 80 60 89 79 556 430 103 50 110 113 99 100 94 97 100
Bangladesh 44 41 17 49 26 47 6 80 31 84 73 82y 82y 47x 25 13
Barbados 152 97 94 98 97 877 279 116 101 90 91 78x 78x 90x 80x
Belarus 139 100 99 285 226 98 95 97 94 98 92 97
Belgium 164 99x 99x 774 453 111 108 99 100 98 98 103 104
Belize 85 70 70 581 167 113 109 100 98 70 46 52
Benin 31 28 10 49 26 91 6 40 15 88 44 74 43 61 17 7
Bhutan 36 41 15 56 28 17 5 0 31x 19x 82 7x 2x
Bolivia 51 81 59 91 76 670 113 70 43 99 90 90y 89y 60 40 34
Bosnia and Herzegovina 143 227
Botswana 80 70 43 81 60 125 17 37 43 114 115 94 99 89 54 58
Brazil 79 76 73 83 83 393 209 58 56 93y 94y 70
Brunei Darussalam 154 86 68 93 83 271 241 117 101 113 106 91 91 95 67 73
Bulgaria 136 99 98 454 363 94 92 88 84 98 96 95 68 72
Burkina Faso 23 19 4 30 9 28 6 12 5 48 31 37 24 79 12 6
Burundi 17 37 12 49 23 64 2 31 10 76 62 56x 48x 74 8 5
Cambodia 19 74x 23x 80x 53x 108 8 85 48 130 106 50 31 18
Cameroon 51 59 30 75 52 148 24 81 40 93 84 69y 60y 66 32 22
Canada 164 1051 685 108 105 104 102 96 94 97 106 106
Cape Verde 65 64 38 81 64 176 3 40 28 132 130 100 100 28 26
Central African Rep. 21 41 19 69 52 73 5 52 11 88x 55x 70y 55y 24 17x 6x
Chad 27 47 19 62 35 246 1 30 4 75 36 28 13 3
Chile 149 92 91 95 95 345 211 87 86 100 98 87 85 92 66 70
China 82 79 53 90 73 184 189 131 78 120 116 99 98 92 60 51
Colombia 104 87 87 91 91 178 118 71 72 118 120 90y 91y 58 57 68
Comoros 39 56 40 64 50 129 0 22 4 81 69 58 48 45 21 17
Congo 48 65 40 83 67 115 7 54
Congo, Dem. Rep. 12 75 45 87 68 98 2 93 34 78 58 71 50 64 33 15
Cook Islands 108 99x 700 179
Costa Rica 146 92 91 95 95 260 142 99 96 107 105 86x 87x 89 47 51
Cote d'Ivoire 25 34 14 50 30 143 60 64 23 78 59 59y 46y 73 33 17
Croatia 154 98 97 261 253 87 86 83 82 98 75 81
Cuba 159 91 87 96 95 347 171 109 108 104 103 99 99 94 70 79
Cyprus 159 98x 91x 300 320 100 100 96 96 100 96 98
Czech Rep. 164 631 478 100 100 98 98 99 90 94
Denmark 175 1036 539 103 103 99 99 98 99 99 113 117
Djibouti 24 45 18 60 33 81 44 32 12 43 33 37 28 82 15 10
Dominica 133 600 75 84
Dominican Rep. 74 75 74 82 82 173 90 75 74 103 104 79 83 58 34 47
Ecuador 88 86 79 92 88 327 88 82 75 124 122 91 92 77 54 56
Egypt 58 54 26 64 39 307 109 79 52 105 91 83y 72y 98 82 71
El Salvador 88 66 60 74 70 443 443 59 56 79 80 78 80 58 27 30
Equatorial Guinea 18 77 45 90 68 424 10 92 54
Eritrea 41 87 0 54 43 33 30 79 19 13
Estonia 145 98 98 467 367 103 100 93 94 97 92 90
Ethiopia 16 32 14 46 25 197 4 9 3 33 21 28 19 51 11 10
.1 '. i 108106

...Table 4
No. of sets % of primary Secondary schoolAdult literacy rate per 10I80 Primary school enrolment ratio school enrolment ratio
population children 1990-95Under-5 1980 1995 1999 1960 (gross) 1990-95 (gross) 1993-97 (net) reaching (gross)mortality grade 5
rank male female male female radio television male female male female male
99x
99
99
87y
51y
81
100
70y
98x
Fiji 121 87 79 94 89 607 17 110 96 128 127
Finland 189 1003 511 100 95 100 100
France 175 99x 98x 891 591 144 143 107 105
Gabon 28 54 28 74 53 147 38
Gambia 49 37 13 53 25 163 3 21 10 79 56
Georgia 113 100 99 550 459 82 81
Germany 175 935 560 97 98
Ghana 47 59 31 76 54 229 89 58 31 83 70
Greece 161 93x 76x 98 95 418 206 104 101 95 95
Grenada 104 595 337
Guatemala 74 56 41 63 49 68 53 48 39 89 78
Guinea 11 34 11 50 22 43 8 30 11 61 30
Guinea Bissau 6 53 26 68 43 40 35 15 77x 42x
Guyana 56 96 93 99 98 491 39 110 99 113x 111x
Haiti 34 36 29 48 42 50 5 39 31 58 54
Holy See
Honduras 97 64 61 73 73 408 78 68 67 111 112
Hungary 152 98x 98x 99 99 625 429 103 100 97 97
Iceland 186 793 350 100 96
India 46 55 25 66 38 81 40 83 44 113 91
Indonesia 67 78 58 90 78 148 62 78 58 117 113
Iran 96 61 37 78 59 237 62 57 27 104 97
Iraq 39 55 25 71 45 218 75 94 36 98 83
Ireland 164 636 302 107 112 104 104
Israel 161 93x 83x 97x 93x 478 275 99 97 95 95
Italy 164 95x 92x 99 98 802 437 112 109 98 99
Jamaica 154 73 81 81 89 436 142 78 79 109 108
Japan 175 100x 99x 912 681 103 102 102 102
Jordan 117 82 54 93 79 243 76 94 95
Kazakstan 84 100 99 376 250 86 86
Kenya 55 72 44 86 70 88 11 62 29 92 91
Kiribati 61 92x 209
Korea, Dem. People's Rep. 108 126 43 108x 101x
Korea, Rep. of 164 97 90 99 97 1017 323 108 94 95 96
Kuwait 147 73 59 82 75 445 380 132 99 69 69
Kyrgyzstan 80 99 95 110 111
Lao People's Dem. Rep. 35 56 28 69 44 127 8 43 20 123 92
Latvia 133 100 100 662 465 85 81
Lebanon 88 91 82 95 90 889 360 111 105 114 110
Lesotho 32 71 45 81 62 33 10 73 109 93 104
Liberia 5 38 11 54 22 228 19 40 14
Libya 70 73 31 88 63 226 100 70 18 110 110
Liechtenstein 164 100x 100x 661 337
Lithuania 139 100 99 387 386 97 95
Luxembourg 164 636 374 88 94
Madagascar 21 56x 43x 60 32 192 20 74 57 75 72
Malawi 8 64 28 72 42 226 50 26 126 114
Malaysia 149 80 60 89 78 432 157 108 79 93 94
Maldives 61 91 89 93 93 118 25 2 3 136 133
Mali 7 20 9 39 23 44 1 15 6 39 25
Malta 154 91 92 530 747 110 107
Marshall Islands 54 90x
Mauritania 15 41 19 50 26 147 25 12 3 81 66
Mauritius 123 82 67 87 79 367 222 97 90 107 106
Mexico 102 86 80 92 87 256 163 82 77 114 110
Micronesia, Fed. States of 116 79x
Moldova, Rep. of 102 98 99 679 271 95 94
Monaco 175 1016 741
10'0
61y
39y
60x
90
68y
89
92
75y
99
99y
83x
100
100x
100
89x
85y
98
65
86y
70y
86
60
59y
98x
62y
100
91
30
100
64
96
female 1990-95 male female
100x 87 64 65
99 100 110 130
99 96 104 107
86y 50x
43y 87 25 13
82 98 82 76
100 99 101 100
69y 80 45 29
98x 100 99 96
55y 25 23
26y 54 18 6
33x 20x 9x 4x
89 93 56x 59x
69y 47 22 21
91 29 37
94 98 79 83
105 105
61y 62 59 38
95 90 49 41
93y 90 76 62
74x 72x 53 34
100 100 110 115
100 83 89
97 81 82
100x 96 62 70
100 100 98 99
89x 98 52 54
89 92
83y 68 28 23
90
99 100 100 99
65 100 65 64
87y 92 84 89
67y 53 31 19
82 96 84 89
75 83
71 79 23 34
53y
96x 95 95
98 80 84
78 78
61y 28 14 14
100 94 6 4
92 94 58 64
93 49 49
19 86 11 6
99 97 93 83
55 63 19 11
96 99 58 60
85 57 58
93 71 74
100
107

Table 4: Education
Under-5mortality
rank
Adult literacy rataNo. of sets
per 1000
population1994
Primary school enrolment ratio% of primary
schoolchildrenreachinggrade 51990-95
Secondary schoolenrolment ratio
1990-95
(gross)1980 1995 1960 (gross) 1990-95 (gross) 1993-97 (net)
male female male female radio television male female male female male female male female
Mongolia 67 82 63 89 77 136 42 74 75 82 87 78 81 50 70
Morocco 64 42 16 57 31 219 79 60 24 92 68 81 62 78 43 32
Mozambique 9 44 12 58 23 37 4 57 34 75 54 45 35 47 10 6
Myanmar 25 86 68 89 78 82 5 60 53 112 108 85y 85y 23 23
Namibia 60 78x 74x 139 23 43 48 136 138 76 57 69
Nauru 104 - 577
Nepal 42 31 7 41 14 35 5 20 3 129 88 80y 60y 52 46 23
Netherlands 175 - 909 494 105 104 96 98 99 99 129 118
New Zealand 164 - 991 510 110 106 103 101 100 100 94 111 114
Nicaragua 73 61 61 65 67 262 67 57 58 102 105 82 85 47 40 47
Niger 1 14 3 21 7 61 5 8 3 35 21 34y 19y 77 9 5
Nigeria 14 47 23 67 47 196 38 54 31 100 79 60y 58y 80 33 28
Niue 99x 563
Norway 175 - 799 428 100 100 99 99 99 99 100 118 114
Oman 139 71x 46x 583 662 85 80 72 70 96 67 61
Pakistan 33 38 15 50 24 88 19 39 11 94 42 71y 62y 48 33 17
Palau 97 97x
Panama 133 86 85 91 90 227 170 90 86 108 104 91x 92x 82 60 65
Papua New Guinea 44 70 45 81 63 76 3 24 15 88 75 59 17 11
Paraguay 100 90 84 94 91 172 83 106 94 111 108 89 89 71 38 40
Peru 72 89 71 95 83 255 99 98 74 91 90
Philippines 93 91 89 95 94 144 48 98 93 110 111 89y 91y 70
Poland 147 99x 97x 99x 98x 441 308 110 107 100 98 97 96 100 95 96
Portugal 164 78x 65x 92 87 233 321 132 129 122 118 100 100 63 74
Qatar 132 72 65 79 80 428 398 111 63 89 84 81 80 95 82 82
Romania 117 98x 93x 99 97 204 201 101 95 94 93 92 92 99 77 78
Russian Federation 117 100 99 339 377 109 108 100 100 84 91
Rwanda 19 55 30 70 52 67 65 29 78 76 76x 76x 60 11 9
Saint Kitts and Nevis 93 - 666 213
Saint Lucia 127 764 189 96
Saint Vincent/Grenadines 123 667 147
Samoa 77 98x 462 39 100 99
San Marino 149 592 352 100
Sao Tome and Principe 57 73x 42x 270 162
Saudi Arabia 108 60 32 72 50 294 255 32 3 79 75 63 61 94 57 47
Senegal 36 31 12 43 23 117 37 36 18 68 51 60 48 81 21 11
Seychelles 136 83x 86x 490 88 97
Sierra Leone 3 30 9 45 18 233 11 30 15 60 42 22 12
Singapore 189 92 74 96 86 645 390 122 101 109x 107x 100x 69x 71x
Slovakia 154 568 474 101 101 97 88 93
Slovenia 175 100x 99x 378 320 100 100 100 99 98 89 91
Solomon Islands 113 56x 122 6 104 90 81 21 14
Somalia 10 8x lx 36x 14x 41 13 4 1
South Africa 69 77 75 82 82 314 101 119 115 95 96 65 76 88
Spain 186 94x 86x 98 96 312 402 106 116 104 105 100 100 98 107 120
Sri Lanka 136 91 BO 93 87 201 50 125 112 106 104 98 71 79
Sudan 42 43 17 58 35 258 80 29 11 61 48 59y 52y 94 24 19
Suriname 104 92 84 95 91 680 141 113 106 129x 125x 50x 58x
Swaziland 53 64 57 78 76 163 20 58 58 125 119 95 96 78 53 51
Sweden 189 879 475 95 96 100 100 100 100 98 99 100
Switzerland 186 - 841 416 118 118 100 102 100 100 100 93 89
Syria 100 72 34 86 56 257 62 89 39 108 97 95 87 91 50 41
Tajikistan 61 100 100 91 88 83 75
Tanzania 29 66 34 79 57 26 2 33 16 71 69 47 48 83 6 5
TFYR Macedonia 108 182 166 88 87 86 84 99 55 56
Thailand 93 92 84 96 92 190 117 92 84 98 97 88 38 37
Togo 38 49 18 67 37 212 8 64 25 122 81 98 72 71 34 12
Tonga 123 99x 561 16 92
108 110

...Table 4
Under-5mortality
rank
Adult literacy rateNo. of sets
per 1000
population1994
Primary school enrolment ratio% of primary
schoolchildrenreachinggrade 51990-95
Secondary schoolenrolment ratio
1990-95
(gross)1980 1995 1960 (gross) 1990-95 (gross) 1993-97 (net)
male female male female radio television male female male female male female male female
Trinidad and Tobago 143 97 93 99 97 491 317 111 108 94 94 83 94 95 74 78
Tunisia 97 61 32 79 55 199 81 88 43 123 113 98 95 92 58 53
Turkey 82 81 50 92 72 162 181 90 58 101 94 98 94 95 76 50
Turkmenistan 58 99x 97x 180 81y 80y
Tuvalu 74 310 96
Uganda 30 62 32 74 50 107 11 39 18 74 59 65y 63y 55 14 8
Ukraine 121 98 99 812 340 87 87 54 88 95
United Arab Emirates 139 72 64 79 80 312 107 112 108 84 82 98 88 97
United Kingdom 164 - 1429 439 92 92 114 114 100 100 93 95
United States 163 99x 99x - 2122 817 107 106 96 97 99 98 97
Uruguay 127 94 95 97 98 606 232 117 117 110 109 95 95 96 74 88
Uzbekistan 71 100 100 81 190 78 76 83y 83y 99 87
Vanuatu 77 60x 294 13 105 107 76x 72x 61 23 18
Venezuela 115 86 82 92 90 443 164 73 74 93 96 87x 90x 78 29 41
Viet Nam 85 90 78 97 91 104 43 103 74
Yemen 50 14x 3x 53x 26x 32 28 118 47 73y 39y 37 9
Yugoslavia, Fed, Rep. 127 99 97 207 179 68 71 69x 70x 100 61 63
Zambia 13 65 43 86 71 83 27 54 36 85 79 76 75 31 19
Zimbabwe 65 83 68 90 80 86 27 82 65 119 111 91y 90y 90 49 39
Regional summaries
Sub-Saharan Africa 51 30 66 47 147 26 47 24 81 67 61 55 67 27 22
Middle East and North Africa 55 27 70 47 255 99 65 34 99 85 85 76 91 62 51
South Asia 52 24 63 36 80 34 77 39 107 82 75 63 59 52 33
East Asia and Pacific 80 58 91 76 196 156 119 76 117 113 98 96 90 57 49
Latin America and Caribbean 82 77 88 85 349 170 74 70 107 105 89 90 74 52 56
CEE/CIS and Baltic States 92 81 98 96 379 308 100 86 98 96 95 94 89 84 82
Industrialized countries 98 96 98 96 1287 623 109 109 105 104 98 98 99 98 99
Developing countries 68 46 79 62 178 105 92 58 105 92 83 76 75 52 41
Least developed countries 47 24 60 38 96 10 48 23 78 62 64 55 58 22 13
World 74 56 81 66 359 197 95 64 105 93 85 79 77 58 50
Countries in each region are listed on page 122.
Definitions of the indicators
Adult literacy rate Percentage of persons aged 15 and over who can read and write.
Gross primary or secondary school enrolment ratio The number of children enrolled in
a level (primary or secondary), regardless of age, divided by the population of the age group
which officially corresponds to the same level.
Net primary school enrolment ratio The number of children enrolled in primary school,who belong to the age group that officially corresponds to primary schooling, divided by the
total population of the same age group. Data from household surveys on children attending
school have been used to fill blanks and to replace UNESCO reported data that are three
years or more older than the survey data. Such data are identified by a 'y'.
Children reaching grade 5 of primary school Percentage of the children entering the
first grade of primary school who eventually reach grade 5.
Main data sources
Adult literacy United Nations Educational, Scientific and Cultural Organization (UNESCO).
Radio and television United Nations Educational, Scientific and Cultural Organization
(UNESCO).
Net primary school enrolment United Nations Educational, Scientific and Cultural
Organization (UNESCO). Multiple Indicator Cluster Surveys (MICS) and Demographic and
Health Surveys.
Gross school enrolment and reaching grade 5 United Nations Educational, Scientificand Cultural Organization (UNESCO).
Notes - Data not available.
x Indicates data that refer to years or periods other than those specified in the column heading, differ from the standard definition, or refer to only part of a country.
y Indicates net primary school data derived from household surveys.
1 1 1109

Table 5: Demographic indicators
Under-5mortality
Population(thousands)
1996
Populationannual
growth rate(%)
Crudedeath rate
Crudebirth rate
Lifeexpectancy
Totalfertility
rate
% ofpopulationurbanized
Averageannual
growth rateof urban
population (%)
under under1965-80 1980-96 1970 1996 1970 1996 1970 1996 1965-80 1980-96rank 18 5 1996 1996
Afghanistan 4 9685 3734 1.9 1.6 27 21 52 52 37 45 6.9 20 5.3 3.3
Albania 88 1246 363 2.4 1.5 8 6 33 22 67 71 2.7 38 2.9 2.2
Algeria 92 13138 3900 3.0 2.7 16 6 49 30 53 68 4.0 57 4.0 4.3
Andorra 175 15 4 6.4 4.6 94 6.2 4.4
Angola 2 6049 2200 2.0 2.9 27 19 49 49 37 47 6.8 32 5.4 5.5
Antigua and Barbuda 127 23 7 0.6 0.5 6 26 17 67 75 36 0.3 0.8
Argentina 117 12130 3439 1.5 1.4 9 8 23 20 67 73 2.7 88 2.1 1.8
Armenia 108 1213 285 2.3 1.0 6 7 24 15 72 71 1.8 69 3.4 1.3
Australia 175 4601 1312 1.6 1.3 9 7 20 14 71 78 1.9 85 1.9 1.3
Austria 175 1721 463 0.3 0.4 13 10 15 11 70 77 1.4 64 0.2 0.4
Azerbaijan 85 2828 790 2.0 1.3 7 7 29 20 68 71 2.4 56 2.5 1.7
Bahamas 123 96 24 2.7 1.9 7 5 27 18 66 73 2.0 87 2.9 2.8
Bahrain 127 207 65 4.0 3.1 9 4 40 22 62 73 3.1 91 3.8 3.8
Bangladesh 44 57200 13377 2.8 1.9 21 10 48 27 44 57 3.2 19 6.7 5.2
Barbados 152 72 19 0.4 0.3 9 9 22 15 69 76 1.7 48 1.1 1.4
Belarus 139 2655 584 0.8 0.4 9 12 17 11 71 70 1.5 72 3.4 1.9
Belgium 164 2166 594 0.3 0.2 12 11 15 11 71 77 1.6 97 0.4 0.3
Belize 85 106 33 2.1 2.5 8 4 40 32 66 74 3.8 47 1.7 2.2
Benin 31 3050 1024 2.4 3.0 25 13 53 43 43 54 6.0 39 7.6 5.2
Bhutan 36 887 306 2.0 2.1 23 14 43 41 40 52 5.9 6 4.4 5.2
Bolivia 51 3556 1160 2.4 2.2 20 9 45 34 46 61 4.5 62 3.2 4.1
Bosnia and Herzegovina 143 933 205 0.9 -0.5 7 7 23 11 66 73 1.4 43 3.9 0.7
Botswana 80 745 237 3.3 3.1 15 12 50 36 52 52 4.6 63 12.5 12.0
Brazil 79 60228 15626 2.4 1.8 10 7 35 20 59 67 2.3 79 4.3 2.9
Brunei Darussalam 154 118 35 4.2 2.8 7 3 36 23 67 75 2.8 70 5.1 3.7
Bulgaria 136 1903 433 0.5 -0.3 9 13 16 10 71 71 1.5 69 2.4 0.4
Burkina Faso 23 5821 2054 2.3 2.8 25 18 53 46 40 46 6.7 16 5.6 6.9
Burundi 17 3292 1130 1.7 2.6 20 18 44 44 44 46 6.4 8 6.2 6.3
Cambodia 19 4822 1564 0.4 2.9 21 13 42 35 43 53 4.6 21 1.3 6.2
Cameroon 51 6879 2322 2.6 2.8 21 12 45 40 44 56 5.4 46 6.9 5.2
Canada 164 7185 2003 1.5 1.2 7 7 17 13 73 79 1.6 77 1.7 1.3
Cape Verde 65 190 59 1.6 2.0 12 8 41 32 57 66 3.7 56 3.4 7.4
Central African Rep. 21 1626 537 2.1 2.3 22 17 43 38 42 49 5.1 40 4.0 3.1
Chad 27 3241 1127 2.0 2.3 26 18 45 42 38 47 5.6 23 6.9 3.5
Chile 149 4961 1465 1.8 1.6 10 6 30 20 62 75 2.5 84 2.6 1.8
China 82 378019 101412 2.1 1.3 9 7 33 17 61 69 1.8 31 2.8 4.2
Colombia 104 14640 4303 2.4 2.0 9 6 37 24 61 71 2.8 73 3.6 2.8
Comoros 39 336 112 3.1 3.1 19 11 50 42 47 57 5.7 31 5.5 4.9
Congo 48 1392 490 2.7 2.9 20 15 46 43 46 51 6.0 59 4.3 5.2
Congo, Dem. Rep. 12 25140 9084 2.9 3.4 20 14 48 46 45 53 6.4 29 3.5 3.5
Cook Islands 108 8 2 -0.4 0.3 63 0.0 1.1
Costa Rica 146 1424 422 2.9 2.7 7 4 35 25 67 77 3.0 50 3.7 3.6
Cote d'Ivoire 25 7192 2239 4.0 3.4 20 14 52 38 44 51 5.3 44 6.7 4.8
Croatia 154 1034 245 0.4 0.2 10 12 15 11 69 72 1.6 56 2.8 0.9
Cuba 159 2867 776 1.5 0.8 7 7 29 14 70 76 1.6 76 2.6 1.5
Cyprus 159 226 63 0.3 1.3 10 8 20 17 71 77 2.3 54 1.6 2.4
Czech Rep. 164 2400 595 0.4 0.0 13 12 16 11 70 73 1.5 66 2.1 0.2
Denmark 175 1108 341 0.5 0.1 10 12 16 13 73 75 1.8 85 1.0 0.3
Djibouti 24 292 96 6.4 4.9 23 15 48 39 40 50 5.5 82 8.4 5.6
Dominica 133 25 7 0.8 -0.3 11 6 26 23 73 69 2.8 0.3
Dominican Rep. 74 3255 953 2.7 2.1 11 5 42 25 58 71 2.9 63 5.1 3.4
Ecuador 88 4973 1455 2.9 2.4 12 6 42 26 58 70 3.2 60 4.5 3.9
Egypt 58 27791 7800 2.2 2.3 17 7 40 27 51 65 3.5 45 2.7 2.5
El Salvador 88 2565 771 2.7 1.5 12 6 44 29 57 69 3.2 45 3.2 2.1
Equatorial Guinea 18 202 71 -1.5 4.0 25 17 42 42 40 49 5.6 44 -1.2 6.9
Eritrea 41 1650 569 2.6 2.0 21 15 47 41 43 50 5.5 18 4.8 3.6
Estonia 145 358 73 0.9 0.0 11 13 15 10 70 69 1.4 73 1.7 0.3
Ethiopia 16 30615 11257 2.4 2.9 24 17 50 48 40 49 7.0 16 4.5 5.6
110 I_ 4

...Table 5
Under-5mortality
Population(thousands)
1996
Populationannual
growth rate( % )
Crudedeath rate
Crudebirth rate
Lifeexpectancy
Totalfertility
rate
% ofpopulationurbanized
Averageannual
growth rateof urban
population (%)
under under1965-80 1980-96 1970 1996 1970 1996 1970 1996 1965-80 1980-96rank 18 5 1996 1996
Fiji 121 326 87 2.1 1.4 7 5 35 23 64 72 2.8 41 3.1 1.9
Finland 189 1170 326 0.3 0.4 10 10 15 12 70 76 1.8 63 2.4 0.8
France 175 13492 3563 0.7 0.5 11 9 17 12 72 79 1.7 75 1.3 0.6
Gabon 28 487 167 2.2 2.9 21 15 32 37 44 55 5.3 51 5.5 5.5
Gambia 49 535 189 3.1 3.6 28 18 49 41 36 46 5.3 30 5.5 6.2
Georgia 113 1529 405 0.8 0.4 10 9 19 14 68 73 2.0 59 1.7 1.3
Germany 175 15836 3978 0.2 0.3 12 11 14 9 71 76 1.3 87 0.6 0.6
Ghana 47 9110 2987 2.1 3.1 17 11 46 39 49 57 5.4 36 3.3 4.1
Greece 161 2168 517 0.8 0.5 8 10 17 10 72 78 1.4 59 2.1 0.7
Grenada 104 33 10 -0.6 0.2 37 -0.2 1.0
Guatemala 74 5563 1824 2.8 2.9 15 7 45 37 52 66 5.0 39 3.4 3.2
Guinea 11 4027 1462 1.6 3.3 28 19 52 49 37 46 6.7 30 4.9 6.0
Guinea-Bissau 6 523 181 2.8 2.0 27 21 41 41 36 44 5.5 22 3.9 3.6
Guyana 56 315 92 1.1 0.6 11 8 38 23 60 64 2.4 36 1.4 1.6
Haiti 34 3389 1091 1.7 1.9 19 13 39 34 47 54 4.7 32 3.7 3.9
Holy See 100
Honduras 97 2924 939 3.1 3.1 15 6 48 35 53 69 4.5 44 5.1 4.6
Hungary 152 2250 561 0.4 -0.4 11 15 15 11 69 69 1.5 65 1.8 0.4
Iceland 186 78 23 1.1 1.1 7 7 22 17 74 79 2.2 92 1.6 1.3
India 46 382891 111216 2.2 2.0 17 9 39 26 49 62 3.2 27 3.6 3.0
Indonesia 67 77807 21884 2.3 1.8 18 8 40 24 48 64 2.7 36 4.6 4.9
Iran 96 35706 11348 3.1 3.6 16 6 45 35 55 69 4.9 60 4.9 4.8
Iraq 39 10116 3158 3.3 2.9 16 9 48 37 55 61 5.4 75 5.0 3.8
Ireland 164 1039 241 1.1 0.3 11 9 22 13 71 76 1.9 58 2.0 0.5
Israel 161 1950 568 2.8 2.4 7 6 26 21 71 77 2.8 90 3.4 2.5
Italy 164 10492 2686 0.5 0.1 10 10 17 9 72 78 1.2 67 1.0 0.1
Jamaica 154 924 281 1.3 1.0 8 6 35 22 67 74 2.5 54 2.7 1.9
Japan 175 24730 6178 1.1 0.4 7 8 19 10 72 80 1.5 78 1.9 0.6
Jordan 117 2789 960 2.7 4.0 18 5 51 38 54 69 5.3 72 4.4 5.2
Kazakstan 84 5890 1519 1.5 0.7 9 8 26 19 64 68 2.4 60 2.4 1.4
Kenya 55 14739 4419 3.6 3.2 18 11 53 37 50 54 5.0 30 7.7 7.0
Kiribati 61 37 12 2.0 1.7 9 28 49 58 36 5.0 2.6
Korea, Dem. People's Rep. 108 6986 2311 2.5 1.5 10 6 40 21 60 72 2.1 62 4.1 2.0
Korea, Rep. of 164 12646 3387 1.9 1.1 10 6 30 15 60 72 1.7 82 5.7 3.4
Kuwait 147 756 187 7.1 1.3 6 2 47 22 66 76 2.9 100 8.1 2.0
Kyrgyzstan 80 1904 564 2.3 1.3 11 7 31 26 62 68 3.3 39 2.7 1.4
Lao People's Dem. Rep. 35 2574 917 1.8 2.8 23 14 44 45 40 53 6.7 21 5.0 5.7
Latvia 133 609 133 0.7 -0.1 11 14 14 10 70 68 1.5 73 1.6 0.4
Lebanon 88 1223 376 1.4 0.9 11 7 35 25 64 69 2.9 87 4.1 2.0
Lesotho 32 1010 326 2.3 2.6 20 11 43 36 48 58 5.0 25 7.3 6.5
Liberia 5 1107 331 3.0 1.1 21 19 49 48 46 48 6.5 48 6.1 3.1
Libya 70 2896 987 4.2 3.8 16 7 49 41 52 65 6.1 86 10.4 5.2
Liechtenstein 164 7 2 2.2 1.3 19 1.5 1.1
Lithuania 139 957 229 0.9 0.5 9 12 17 11 71 70 1.6 72 3.0 1.6
Luxembourg 164 88 26 0.6 0.8 12 10 13 13 70 76 1.7 90 2.1 1.6
Madagascar 21 8185 2761 2.6 3.3 19 10 47 42 45 58 5.8 27 5.3 5.8
Malawi 8 5266 1868 2.9 2.9 25 22 56 49 40 41 6.8 14 7.1 5.6
Malaysia 149 8916 2668 2.5 2.5 10 5 37 26 61 72 3.4 54 4.7 4.1
Maldives 61 140 47 2.5 3.2 17 8 40 42 50 64 6.8 27 6.6 4.5
Mali 7 5995 2183 2.2 3.0 26 18 51 48 38 47 6.8 28 4.8 5.5
Malta 154 98 26 0.4 0.8 9 8 17 14 70 77 2.1 89 1.2 1.3
Marshall Islands 54 26 8 3.4 3.0 70 2.4 4.3
Mauritania 15 1157 380 2.3 2.6 22 13 45 39 43 53 5.1 53 9.7 6.7
Mauritius 123 377 111 1.7 1.0 7 7 29 20 62 71 2.3 41 2.6 0.7
Mexico 102 38611 11234 3.0 2.0 10 5 44 25 61 72 2.9 74 4.2 2.6
Micronesia, Fed. States of 116 58 19 3.1 2.6 7 33 58 29 3.7 3.4
Moldova, Rep. of 102 1382 327 1.2 0.6 10 11 19 14 65 68 1.9 52 3.7 2.3
Monaco 175 7 2 1.4 1.1 100 1.4 1.1
113 I 1 1

Table 5: Demographic indicators
Under-5mortality
rank
Mongolia 67
Morocco 64
Mozambique 9
Myanmar 25
Namibia 60
Nauru 104
Nepal 42
Netherlands 175
New Zealand 164
Nicaragua 73
Niger 1
Nigeria 14
Niue
Norway 175
Oman 139
Pakistan 33
Palau 97
Panama 133
Papua New Guinea 44
Paraguay 100
Peru 72
Philippines 93
Poland 147
Portugal 164
Qatar 132
Romania 117
Russian Federation 117
Rwanda 19
Saint Kitts and Nevis 93
Saint Lucia 127
Saint Vincent/Grenadines 123
Samoa 77
San Marino 149
Sao Tome and Principe 57
Saudi Arabia 108
Senegal 36
Seychelles 136
Sierra Leone 3
Singapore 189
Slovakia 154
Slovenia 175
Solomon Islands 113
Somalia 10
South Africa 69
Spain 186
Sri Lanka 136
Sudan 42
Suriname 104
Swaziland 53
Sweden 189
Switzerland 186
Syria 100
Tajikistan 61
Tanzania 29
TFYR Macedonia 108
Thailand 93
Togo 38
Tonga 123
112
Population(thousands)
1996
Populationannual
growth rate(%)
Crudedeath rate
Crudebirth rate
Lifeexpectancy
Totalfertility
rate
% ofpopulationurbanized
Averageannual
growth rateof urban
population (%)under under
1965-80 1980-96 1970 19% 1970 1996 1970 1996 1965-80 1980-9618 5 1996 1996
1135 314 2.8 2.6 14 7 42 28 53 65 3.4 61 4.2 3.6
11526 3375 2.5 2.1 17 7 47 26 52 66 3.3 53 4.2 3,6
9114 3193 2.5 2.4 22 18 46 43 42 47 6.2 35 9.5 8.6
19055 5675 2.2 1.9 17 10 40 28 49 59 3.4 26 3.1 2.5
767 252 2.6 2.7 18 12 43 36 48 56 5.0 37 4.6 5.7
5 2 2.2 2.8 100 2.2 2.8
10887 3593 2.3 2.6 22 12 45 37 42 56 5.1 11 6.5 5.7
3394 976 0.9 0.6 8 9 17 12 74 78 1.6 89 1.2 0.6
988 292 1.1 0.9 9 8 22 16 72 77 2.1 86 1.5 1.1
2130 659 3.1 2.6 14 6 48 34 54 68 4.0 63 4.6 3.6
5197 1931 2.8 3.3 26 18 58 51 38 48 7.2 19 6.9 5.8
59722 21052 2.6 2.9 21 14 46 43 43 52 6.1 41 5.7 5.5
1 0 50
1000 298 0.6 0.4 10 11 17 14 74 77 1.9 73 2.0 0.6
1233 444 3.9 4.4 21 4 50 44 47 70 7.2 78 14.6 10.1
68346 22773 2.7 3.1 19 8 48 37 49 63 5.2 35 3.8 4.5
8 3 2.7 2.2 71 3.1 2.5
1040 305 2.7 2.0 8 5 37 23 65 74 2.7 56 3.5 2.6
2014 637 2.4 2.2 18 10 42 33 46 57 4.8 16 8.6 3.6
2361 743 2.7 2.9 9 6 37 32 66 69 4.3 53 3.6 4.4
10074 2901 2.8 2.0 14 7 42 26 54 68 3.1 71 4.2 2.6
30923 9602 2.7 2.3 10 6 39 29 57 68 3.7 55 3.9 4.7
10589 2422 0.8 0.5 8 11 17 12 70 71 1.7 64 1.8 1.1
2146 557 0.4 0.0 11 11 20 11 67 75 1.5 36 1.8 1.3
175 50 7.9 5.6 13 4 34 19 61 71 3.9 92 8.6 6.0
5646 1195 1.0 0.1 9 11 20 11 69 70 1.4 56 2.8 1.0
37115 7389 0.6 0.4 9 14 15 10 69 65 1.4 76 1.8 1.0
2880 950 3.2 0.3 21 27 53 43 44 36 6.2 6 6.8 1.9
15 4 -0.7 -0.4 11 12 - 20 69 34 0.4 -0.8
51 15 1.3 1.4 6 41 28 62 71 38 1.0 1.4
40 12 1.0 0.9 7 22 63 72 50 5.4 4.6
75 20 1.2 0.4 12 6 44 27 57 69 3.9 22 1.9 0.5
5 1 1.4 1.1 96 4.2 2.2
71 25 2.2 2.3 7 35 69 44 5.3 4.4
9033 2977 4.6 4.2 18 4 48 35 52 71 6.0 84 8.2 5.7
4359 1470 2.8 2.7 25 15 49 42 39 51 5.8 44 3.4 4.0
39 13 2.0 1.0 7 - 22 72 55 4.9 3.1
2163 765 1.9 1.8 30 27 49 47 34 37 6.2 34 5.5 4.0
888 294 1.7 2.1 5 5 23 16 69 77 1.8 100 1.7 2.1
1468 348 0.9 0.4 10 11 19 12 70 71 1.6 59 3.1 1.3
426 92 0.8 0.3 10 11 17 10 70 73 1.3 52 3.4 0.7
199 65 3.4 3.4 10 4 46 37 60 71 5.1 18 4.6 6.6
5308 1941 3.1 2.4 24 17 50 50 40 48 7.0 26 3.9 3.4
18378 5761 2.6 2.3 14 8 39 30 53 65 3.9 50 2.7 2.5
8172 1935 1.1 0.3 9 9 20 10 72 78 1.2 77 2.2 0.7
6382 1588 1.9 1.3 8 6 30 18 65 73 2.1 22 2.4 1.5
13026 3999 2.8 2.4 21 12 47 34 43 54 4.7 32 5.6 5.4
173 50 0.4 1.2 8 6 37 23 63 71 2.5 50 0.1 1.9
439 144 2.8 2.8 19 10 48 37 46 59 4.6 32 9.5 6.5
1963 584 0.5 0.4 10 11 14 12 74 78 1.9 83 1.0 0.4
1500 423 0.5 0.8 9 9 16 11 73 78 1.5 61 1.0 1.3
7485 2103 3.3 3.2 14 5 47 31 56 68 4.2 53 4.3 4.0
2842 835 3.0 2.5 10 7 40 31 63 67 4.0 32 2.9 2.2
16154 5479 3.0 3.2 19 14 50 42 45 51 5.6 25 9.9 6.5
636 164 1.3 1.2 8 7 25 15 66 72 2.0 60 3.2 1.9
19529 4830 2.8 1.4 10 6 38 17 58 69 1.8 20 4.7 2.5
2197 766 3.2 3.0 20 15 46 43 44 50 6.2 31 7.9 4.9
41 12 1.5 0.4 6 28 69 42 2.6 3.9
i
114

...Table 5
Under-5mortality
Population(thousands)
1996
Populationannual
growth rateI%)
Crude
death rateCrude
birth rateLife
expectancyTotal
fertilityrate
% ofpopulationurbanized
Averageannual
growth rateof urban
population (%)under under
1965-80 1980-96 1970 1996 1970 1996 1970 1996 1965-80 1980-96rank 18 5 1996 1996
Trinidad and Tobago 143 467 108 1.3 1.1 7 6 28 17 66 73 2.2 72 1.2 2.0
Tunisia 97 3742 1044 2.2 2.2 14 6 39 24 54 69 3.0 63 4.0 3.4
Turkey 82 22986 6388 2.4 2.1 13 7 37 22 56 68 2.6 71 4.0 5.0
Turkmenistan 58 1887 570 2.8 2.3 11 8 38 30 60 65 3.7 45 2.8 2.1
Tuvalu 74 4 1 1.9 1.4 40 4.6 4.3
Uganda 30 11239 4066 3.3 2.7 19 21 50 51 46 41 7.1 13 5.3 5.1
Ukraine 121 12377 2771 0.7 0.2 9 14 15 10 71 69 1.5 71 2.0 1.0
United Arab Emirates 139 781 213 13.0 5.0 11 3 36 19 61 75 3.6 84 15.6 6.0
United Kingdom 164 13333 3681 0.2 0.2 12 11 16 12 72 77 1.7 89 0.4 0.2
United States 163 70382 20014 1.0 1.0 9 9 17 14 71 76 2.0 76 1.1 1.2
Uruguay 127 941 263 0.5 0.6 10 10 21 17 69 73 2.3 90 0.9 1.0
Uzbekistan 71 10614 3162 3.0 2.3 10 7 36 29 63 68 3.6 41 3.9 2.4
Vanuatu 77 86 27 3.0 2.5 14 6 46 34 53 67 4.5 19 6.4 2.8
Venezuela 115 9411 2770 3.4 2.4 7 5 38 26 65 72 3.1 86 4.5 3.0
Viet New 85 32318 9558 2.2 2.1 15 7 38 26 49 67 3.1 19 3.3 2.2
Yemen 50 8498 3084 2.3 4.0 23 11 53 48 41 57 7.6 34 6.3 7.4
Yugoslavia, Fed. Rep. 127 2678 655 0.8 0.5 9 10 19 13 68 72 1.8 57 3.0 1.8
Zambia 13 4562 1483 3.1 2.3 19 18 49 43 46 43 5.6 43 6.6 2.8
Zimbabwe 65 5822 1951 3.1 3.0 16 14 50 38 50 49 4.8 33 6.0 5.3
Regional summaries
Sub-Saharan Africa 298349 103119 2.7 2.9 21 15 48 43 44 51 5.9 32 5.2 5.0
Middle East and North Africa 150639 46229 2.9 3.0 17 7 45 32 52 65 4.5 56 4.8 4.3
South Asia 536418 156634 2.3 2.1 18 9 41 28 48 61 3.5 27 3.8 3.4
East Asia and Pacific 598624 165346 2.2 1.5 11 7 35 19 58 68 2.1 33 3.4 4.1
Latin America and Caribbean 189383 53761 2.5 1.9 10 6 37 23 60 69 2.8 74 3.8 2.7
CEE/CIS and Baltic States 137929 33210 1.1 0.7 9 11 20 14 66 68 1.9 67 2.3 1.7
Industrialized countries 191260 51706 0.8 0.6 10 9 17 12 72 77 1.7 78 1.2 0.8
Developing countries 1827055 540175 2.3 2.0 14 9 38 26 53 62 3.2 38 3.9 3.8
Least developed countries 298758 97112 2.5 2.5 22 14 48 40 43 51 5.3 23 5.4 5.0
World 2102602 610005 2.0 1.7 13 9 32 23 56 63 2.9 46 2.8 2.8
Countries in each region are listed on page 122.
Definitions of the indicators Main data sources
Life expectancy at birth - The number of years newborn children would live if subject to the Life expectancy - United Nations Population Division.mortality risks prevailing for the cross-section of population at the time of their birth.
Child population- United Nations Population Division.Crude death rate - Annual number of deaths per 1,000 population.
Crude death and birth rates - United Nations Population Division.Crude birth rate -Annual number of births per 1,000 population.
Fertility - United Nations Population Division.
Total fertility rate -The number of children that would be born per woman if she were tolive to the end of her childbearing years and bear children at each age in accordance with Urban population United Nations Population Division.
prevailing age-specific fertility rates.
Urban population Percentage of population living in urban areas as defined according to
the national definition used in the most recent population census.
Notes Data not available.
x Indicates data that refer to years or periods other than those specified in the column headinidifir m the standard definition, or refer to only part of a country.
113

Table 6: Economic indicators
Under-5mortality
rank
GNP percapita(US$)
1995
GNP per capitaaverage annualgrowth rate (%)
Annualrate of
inflation(%)
1985-95
% ofpopulationbelow $1
a day1990-96
°A of central governmentexpenditure allocated to
(1990-96)
ODA inflowin millions
US$
1995
ODA inflowes a % ofrecipient
GNP
1995
Debt serviceas a % ofexports of
goods and services
1965-80 1985-95 health education defence 1970 1995
Afghanistan 4 250x 0.6 214 5
Albania 88 670 -6.0x 27 6 2 7 179 8 1
Algeria 92 1600 4.2 -2.4 23 2x 310 1 3 37
Andorra 175 c
Angola 2 410 -6.1 170 6x 15x 34x 423 10 15
Antigua and Barbuda 127 6980x 2.7 4 2 0 2
Argentina 117 8030 1.7 1.8 256 2 5 7 222 0 22 26
Armenia 108 730 -15.1 183 213 8 1
Australia 175 18720 2.2 1.4 4 13 8 7
Austria 175 26890 4.0 1.9 3 14 10 2
Azerbaijan 85 480 -16.3 279 109 3 1
Bahamas 123 11940 -0.8 3 15 19 3 4 0
Bahrain 127 7840 0.2 0 9 13 17 49 1 2
Bangladesh 44 240 -0.3 2.1 6 5x 11x 10x 1269 4 0 15
Barbados 152 6560 0.8 3 -1 -0 10
Belarus 139 2070 -5.2 309 2 18 4 2
Belgium 164 24710 3.6 2.2 3 2x 12x 5x
Belize 85 2630 3.9 4 13 20 5 16 4
Benin 31 370 -0.3 -0.3 3 6x 31x 17x 276 14 2 13
Bhutan 36 420 4.9 8 8 10 73 25 10
Bolivia 51 800 1.7 1.8 18 7 6 19 8 692 12 11 26
Bosnia and Herzegovina 143 a
Botswana 80 3020 9.9 6.1 12 35x 5 21 12 92 2 1 4
Brazil 79 3640 6.3 -0.8 875 29x 5 3 3 366 0 12 29
Brunei Darussalam 154 25160 0 4 0
Bulgaria 136 1330 -2.6 46 3 3 4 6 11
Burkina Faso 23 230 1.7 -0.2 3 7 17 14 483 20 4 17
Burundi 17 160 2.4 -1.3 6 4x 16x 16x 288 29 4 22
Cambodia 19 270 2.0 71 567 21 2
Cameroon 51 650 2.4 -6.6 2 5 18 9 444 5 3 17
Canada 164 19380 3.3 0.4 3 5 3 6
Cape Verde 65 960 2.1 7 111 30
Central African Rep. 21 340 0.8 -2.4 4 161 14 5 3
Chad 27 180 -1.9 0.6 3 8x 8x 237 21 4 7x
Chile 149 4160 0.0 6.1 18 15 12 15 9 159 0 19 15
China 82 620 4.1 8.3 9 29 0 2 12 3521 0 Ox 10
Colombia 104 1910 3.7 2.6 25 7 5 19 9 231 0 12 27
Comoros 39 470 -1.4 4 43 18 2
Congo 48 680 2.7 -3.2 2 125 7 11 11
Congo, Dem. Rep. 12 120 -1.3 -8.5 1 1 4 189 4 5 6x
Cook Islands 108 1550x 13 16
Costa Rica 146 2610 3.3 2.8 18 19x 21 17 25 0 10 15
C6te d'Ivoire 25 660 2.8 -4.3 4 18x 4x 21x 4x 1200 13 7 18
Croatia 154 3250 15 7 21 2
Cuba 159 1170x 23x 10x 64 Ox
Cyprus 159 10260x 4.6 4 6 11 3 22 0
Czech Rep. 164 3870 -1.8 12 3 17 12 6 8
Denmark 175 29890 2.2 1.5 3 1 9 4
Djibouti 24 780x 103 7
Dominica 133 2990 4.1 4 24 11 6
Dominican Rep. 74 1460 3.8 2.1 26 20x 10 12 5 124 1 4 16
Ecuador 88 1390 5.4 0.8 46 30 11 18 13 235 1 9 21
Egypt 58 790 2.8 1.1 16 8 2 12 9 2017 4 26 21
El Salvador 88 1610 1.5 2.8 15 8 13 8 304 3 4 13
Equatorial Guinea 18 380 2.3 4 33 22 1
Eritrea 41 100x 145 46x
Estonia 145 2860 -4.3 77 6 17 9 3 0
Ethiopia 16 100 0.4 -0.3 6 34x 5 14 20 876 15 11 20
114 116

...Table 6
Under-5mortality
rank
GNP percapitaMSS/1995
GNP per capitaaverage annualgrowth rate ( %)
1965-80 1985-95
Fiji 121 2440 2.0
Finland 189 20580 3.6 -0.2
France 175 24990 3.7 1.5
Gabon 28 3490 5.6 -8.2
Gambia 49 320 0.3
Georgia 113 440 -17.0
Germany 175 27510 3.0x 1.9x
Ghana 47 390 -0.8 1.4
Greece 161 8210 4.8 1.3
Grenada 104 2980
Guatemala 74 1340 3.0 0.3
Guinea 11 550 1.3 1.4
Guinea-Bissau 6 250 -2.7 2.0
Guyana 56 590 0.6
Haiti 34 250 0.9 -5.2
Holy See
Honduras 97 600 1.1 0.1
Hungary 152 4120 5.1 -1.0
Iceland 186 24950 1.0
India 46 340 1.5 3.2
Indonesia 67 980 5.2 6.0
Iran 96 1033x 2.9 -1.5
Iraq 39 1036x
Ireland 164 14710 2.8 5.2
Israel 161 15920 3.7 2.5
Italy 164 19020 3.2 1.8
Jamaica 154 1510 -0.1 3.6
Japan 175 39640 5.1 2.9
Jordan 117 1510 5.8x -4.5
Kazakstan 84 1330 -8.6
Kenya 55 280 3.1 0.1
Kiribati 61 920 -0.6
Korea, Dem. People's Rep. 108 970x
Korea, Rep. of 164 9700 7.3 7.7
Kuwait 147 17390 0.6x 1.1
Kyrgyzstan 80 700 -6.9
Lao People's Dem. Rep. 35 350 2.7
Latvia 133 2270 -6.6
Lebanon 88 2660 2.7
Lesotho 32 770 6.8 1.2
Liberia 5 490x 0.5
Libya 70 5540x 0.0
Liechtenstein 164 c
Lithuania 139 1900 -11.7
Luxembourg 164 41210 0.9
Madagascar 21 230 -0.4 -2.2
Malawi 8 170 3.2 -0.7
Malaysia 149 3890 4.7 5.7
Maldives 61 990 5.9
Mali 7 250 2.1x 0.8
Malta 154 7910x 5.1
Marshall Islands 54 1680x
Mauritania 15 460 -0.1 0.5
Mauritius 123 3380 3.7 5.4
Mexico 102 3320 3.6 0.1
Micronesia, Fed. States of 116 2010
Moldova, Rep. of 102 920 -8.2
Monaco 175 c
Annualrate of
inflationf°14
1985-95
5
4
3
5
9
310
3
29
15
5
19
17
63
51
15
14
20
12
10
9
24
3
17
6
28
1
7
307
13
4
7
-1
172
23
73
46
13
151
5
18
22
3
9
5
3
5
7
9
37
5
% ofpopulationbelow S1
a day1990-96
% of central governmentexpenditure allocated to
(1990-961
ODA inflowin millions
USS
1995
ODA inflowas a % ofrecipient
GNP
1995
Debt serviceas a % ofexports of
goods and services
health education defence 1970 1995
9 18 6 43 2 4
3 11 4
16 7 6
143 4 6 13
7 12 4 46 13 1 11
209 9 4
17 1 7
7 22 5 644 10 5 15
7 9 9 9 17
10 17 10 4 13
53x 11 19 15 213 1 7 11
26 3x 11x 29x 392 11 13
87 1x 3x 4x 119 45 30
88 18 19
733 41 5 14
47 10x 19x 7x 411 12 3 32
1 8 3 4 31
23 12
53 2 2 14 1738 1 21 23
15 3 10 7 1389 1 7 23
9 16 6 183 0 19x
326 2x
14 13 3
9 13 18 336 0 3
11x 8x 4x
5 7x 11x 8x 108 3 3 17
2 6 4
3 8 16 21 536 8 4 21
58 0 3
50 5 19 6 707 9 6 23
15 21
14 Ox
1 21 17 58 0 20 3
6 11 25 6 0
19 283 9 7
311 18 8x
6 15 3 1
188 2 16
50x 13 21 6 114 8 1 17
5x 11x 9x 121 11 8
7 0
2 7 7 2 0
2 9 1
72 6 11 5 301 9 32 7
7x 12x 5x 429 26 8 22
6x 6 22 13 114 0 4 3
8 16 55 22
2x 9x 8x 542 22 1 7
11 12 2 9 0
39 41
31x 4x 23x 220 21 3 19
9 17 2 23 1 3 5
15 3 27 4 379 0 24 19
77 36
7 5
117115

Table 6: Economic indicators
Under-5mortality
rank
Mongolia 67
Morocco 64
Mozambique 9
Myanmar 25
Namibia 60
Nauru 104
Nepal 42
Netherlands 175
New Zealand 164
Nicaragua 73
Niger 1
Nigeria 14
Niue
Norway 175
Oman 139
Pakistan 33
Palau 97
Panama 133
Papua New Guinea 44
Paraguay 100
Peru 72
Philippines 93
Poland 147
Portugal 164
Qatar 132
Romania 117
Russian Federation 117
Rwanda 19
Saint Kitts and Nevis 93
Saint Lucia 127
Saint Vincent/Grenadines 123
Samoa 77
San Marino 149
Sao Tome and Principe 57
Saudi Arabia 108
Senegal 36
Seychelles 136
Sierra Leone 3
Singapore 189
Slovakia 154
Slovenia 175
Solomon Islands 113
Somalia 10
South Africa 69
Spain 186
Sri Lanka 136
Sudan 42
Suriname 104
Swaziland 53
Sweden 189
Switzerland 186
Syria 100
Tajikistan 61
Tanzania 29
TFYR Macedonia 108
Thailand 93
Togo 38
Tonga 123
116
GNP per
capitaCUSS)
1995
GNP per capitaaverage annualgrowth rate 1 %)
Annualrate of
inflation( /o)
1985-95
% ofpopulationbelow 61
a day1990-96
% of central governmentexpenditure allocated to
(1990-96)
ODA inflowin millions
US$1995
ODA inflowas a % ofrecipient
GNP
1995
Debt serviceas a % ofexports of
goods and services
1965-80 1985-95 health education defence 1970 1995
310 -3.8 52 4 7 12 208 27 9x
1110 2.7 0.9 5 1 3 18 14 494 2 8 39
80 3.6 52 5x 10x 35x 1102 81 58
220x 1.6 0.4 26 4 12 37 152 2x 18 15x
2000 2.9 10 10 22 7 188 6
200 2.4 12 53 5 14 4 430 10 3 8
24000 2.7 1.9 2 15 11 4
14340 1.7 0.8 4 16 15 4
380 -0.7 -5.4 962 44 13 15 6 662 40 11 57
220 -2.5 -2.1 1 62 268 14 4 9x
260 4.2 1.2 33 29 1x 3x 3x 208 1 4 22
8
31250 3.6 1.7 3 4 7 7
4820 9.0 0.3 -0 6 13 35 59 1 8
460 1.8 1.2 9 12 1 2 31 805 1 22 29
790x 142
2750 2.8 -0.4 2 26x 18 17 5 50 1 8 8
1160 2.3 5 8 15 4 372 7 1 10
1690 4.1 1.2 25 7 22 11 146 2 12 8
2310 0.8 -1.6 399 49 5 16 11 428 1 12 13
1050 3.2 1.5 10 28x 3 16 11 884 1 8 16
2790 1.2 92 7 6
9740 4.6 3.6 11 9x 11x Ox 7 16
11600 -4.2 3 0
1480 -3.8 69 18 8 10 7 Ox 4
2240 -5.1 149 1 2 2 12 8
180 1.6 -5.4 11 46x 5x 26x 711 63 1 28
5170 4.8 6 4 2
3370 3.9 3 47 9
2280 3.8 4 13 17 47 19
1120 0.2 11 43 23
350 -2.1 40 78 174 17
7040 4.0x -1.9 3 fix 14x 36x 21 0 1
600 -0.5 -1.2 4 54 663 13 4 12
6620 4.2 3 8 12 4 13 3 7
180 0.7 -3.6 62 10 13 10 205 27 11 27
26730 8.3 6.2 4 7 23 29 16 0 1
2950 -2.8 11 13 6
8200 3
910 3.2 12 47 14
110x -0.1 -2.3x 75 lx 2x 38x 191 20 2 7x
3160 3.2 -1.1 14 24 384 0 5
13580 4.1 2.6 6 6 4 3
700 2.8 2.6 12 4 6 10 15 553 4 11 11
310x 0.8 0.6 63 225 3 11 Ox
880 3.5 49 77 21
1170 -1.4 12 54 5 2
23750 2.0 -0.1 6 0 5 6
40630 1.5 0.2 3 20x 3x 6x
1120 5.1 0.9 16 3 9 28 347 2 11 3x
340 -13.0 147 65 3
120 0.8 1.0 32 16 6x 8x 16x 875 24 1 16
860 7
2740 4.4 8.4 5 0 8 22 14 863 1 3 3
310 1.7 -2.7 3 5x 20x 11x 188 15 3 5
1630 0.5 8 7 13 38 22
118

...Table 6
Under-5mortality
GNP percapita(US$)
GNP per capitaaverage annualgrowth rate ( %)
1965 -00 1985-95rank 1995
Trinidad and Tobago 143 3770 3.1 -1.7
Tunisia 97 1820 4.7 1.9
Turkey 82 2780 3.6 2.2
Turkmenistan 58 920 -9.6
Tuvalu 74 650x
Uganda 30 240 -2.2 2.7
Ukraine 121 1630 -9.2
United Arab Emirates 139 17400 -2.8
United Kingdom 164 18700 2.0 1.4
United States 163 26980 1.8 1.3
Uruguay 121 5170 2.5 3.1
Uzbekistan 71 970 -3.9
Vanuatu 77 1200 -1.1
Venezuela 115 3020 2.3 0.5
Viet Nam 85 240 4.2
Yemen 50 260
Yugoslavia, Fed. Rep. 127 b
Zambia 13 400 -1.2 -0.8
Zimbabwe 65 540 1.7 -0.6
Regional summaries
Sub-Saharan Africa 501 2.8 -0.9
Middle East and North Africa 1710 3.1 -0.9
South Asia 345 1.4 2.8
East Asia and Pacific 1043 4.9 7.4
Latin America and Caribbean 3271 4.0 0.5
CEE/CIS and Baltic States 2086 -3.3
Industrialized countries 25926 2.9 1.8
Developing countries 1101 3.7 2.9
Least developed countries 220 -0.1 0.0
World 4812 3.1 1.9
Countries in each region are listed on page 122.
Annualrate of
inflation1%)
1985-95
7
6
65
381
66
363
5
3
71
239
6
38
88
92
21
20
14
10
9
406
139
3
141
30
32
% ofpopulationbelow $1
a day
°iv of central governmentexpenditure allocated to
(1990 -96)
ODA inflowin millions
US$
ODA inflowas a % ofrecipient
GNP
Debt serviceas a % ofexports of
goods and services
health education defence 1970 19951990-96 1995 1995
26 1 5 16
4 6 17 6 69 0 18 17
3 12 10 303 0 16 27
5 26 1 4x
8
50 2x 15x 26x 805 17 3 18
2x
7 17 37 8 0
14 5 8
19 2 17
6 7 7 81 0 22 22
81 0 3
46 23
12 10x 20x 6x 49 0 3 17
826 5 4
5 21 30 173 4 5
85 14 15 2029 56 6 24
41 8x 24x 17x 490 8 2 20x
36 5 14 10 17379 6 6 11
6 15 21 5146 1 12 13
47 2 3 16 5137 1 17 22
26 2 12 14 9818 0 6 7
24 5 11 5 6026 0 13 21
4 4 7 10 9
12 4 9
32 4 11 12 45181 1 11 13
5 13 15 16465 14 6 14
30 11 6 10 45377 1 11 12
Definitions of the indicators Main data sources
GNP per capita - Gross national product (GNP) is the sum of gross value added by all resident
producers, plus any taxes that are not included in the valuation of output, plus net receipts
of primary income from non-resident sources. GNP per capita is the gross national product,
converted to United States dollars using the World Bank Atlas method, divided by the mid-
year population.
% of population below Si a day - Percentage of population living on less than $1 a day at1985 international prices, adjusted for purchasing power parity.
ODA - Official development assistance.
Debt service - The sum of interest payments and repayments of principal on external public
and publicly guaranteed long-term debts.
GNP per capita -World Bank.
% of population below $1 a day - World Bank.
Expenditure on health, education and defence - International Monetary Fund (IMF).
ODA - Organisation for Economic Co-operation and Development (DECO).
Debt service -World Bank.
Notes a: Range US$765 or less. Data not available.
b: Range US$766 to $3035.c: Range US$9386 or more.
x Indicates data that refer to years or periods other than those specified inthe column heading, differ from the standard definition, or refer to only part of a country.
117

Table 7: Women
Under-5mortality
Life expectancyfemales as a% of males
Adult literacy ratefemales as a% of males
Enrolment ratiosfemales as a % of males
1990-95
Contraceptiveprevalence
l % I
% ofpregnant women
immunized againsttetanus
% of birthsattendedby trained
healthpersonnel
Maternalmortality
rateprimary school secondary schoolrank 1996 1995 1990-97 1995-96 1990-96 1990
Afghanistan 4 102 32 51 34 2x 37 9x 1700
Albania 88 109 101 103 99x 65
Algeria 92 104 66 88 88 57 34 77 160
Andorra 175
Angola 2 107 52x 92 lx 28 15x 1500
Antigua and Barbuda 127 92 53x 90x
Argentina 117 110 100 99 107 74x 63 97 100
Armenia 108 110 99 107 113 50
Australia 175 108 99 104 76x 100 9
Austria 175 110 100 95 71x 100 10
Azerbaijan 85 112 99 96 98 22
Bahamas 123 110 99 103 100 62x 75x 100x 100
Bahrain 127 106 89 103 103 54x 54 97 60
Bangladesh 44 100 53 87 52 49 72 14 850
Barbados 152 107 99 101 89x 55x 100 98x 43
Belarus 139 117 99 97 105 50 100x 37
Belgium 164 108 101 101 79 100x 10
Belize 85 104 100x 96 113 47 88 77
Benin 31 110 53 50 41 9x 75 45x 990
Bhutan 36 106 50 61x 29x 19 70 15 1600
Bolivia 51 107 84 91 85 45 52 47 650
Bosnia and Herzegovina 143 109
Botswana 80 106 74 101 107 33x 61 78x 250
Brazil 79 113 100 96x 116x 77 45 88 220
Brunei Darussalam 154 107 89 94 109 50x 98 60
Bulgaria 136 110 99 95 106 76x 100x 27
Burkina Faso 23 104 30 65 50 8 27 42 930
Burundi 17 107 47 82 63 9x 33 19x 1300
Cambodia 19 106 66x 82 58 36 47x 900
Cameroon 51 106 69 90 69 16 12 64 550
Canada 164 108 98 100 73x 99x 6
Cape Verde 65 103 79 98 93 15x 4 30x
Central African Rep. 21 111 75 63x 35x 15 15 46 700
Chad 27 107 56 48 23 to 50 15 1500
Chile 149 108 100 98 106 43x 98x 65
China 82 104 81 97 85 83 13 84 95
Colombia 104 107 100 102 119 72 57 85 100
Comoros 39 102 78 85 81 21 34 52 950
Congo 48 110 81 55 890
Congo, Dem. Rep. 12 106 78 74 45 8 20 870
Cook Islands 108 50 64 99
Costa Rica 146 107 100 98 109 75 90 93x 55
C8te d'Ivoire 25 106 60 76 52 11 22 45 810
Croatia 154 112 99 99 108 91
Cuba 159 105 99 99 113 70x 61x 90x 95
Cyprus 159 107 93x 100 102 57x 100x 5
Czech Rep. 164 109 100 104 69 15
Denmark 175 107 100 104 78x 100x 9
Djibouti 24 106 55 77 67 39 79x 570
Dominica 133 96 50x 96x
Dominican Rep. 74 106 100 101 138 64 96 96 110
Ecuador 88 107 96 98 104 57 25 64 150
Egypt 58 105 61 87 87 48 55 46 170
El Salvador 88 109 95 101 111 53 69 87 300
Equatorial Guinea 18 106 76 63 58x 820
Eritrea 41 106 80 68 8 23 21 1400
Estonia 145 117 100 97 98 70 41
Ethiopia 16 106 54 64 91 4 36 14x 1400
118 120
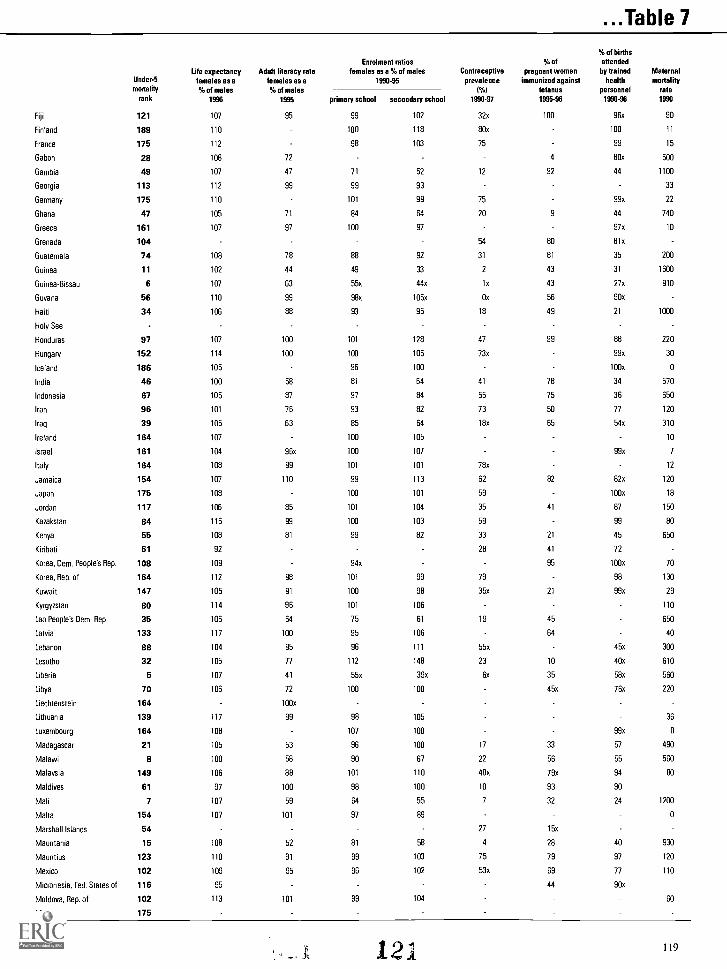
...Table 7
Under-5
mortalityrank
Life expectancyfemales as a9tu of males
1996
Adult literacy ratefemales as a% of males
1995
Enrolment ratiosfemales as a % of males
1990-95
Contraceptiveprevalence
1 %)
1990-97
°A of
pregnant womenimmunized against
tetanus1995-96
'Yo of births
attendedby trained
healthpersonnel
1990-96
Maternalmortality
rate1990primary school secondary school
Fiji 121 107 95 99 102 32x 100 96x 90
Finland 189 110 100 118 80x 100 11
France 175 112 98 103 75 99 15
Gabon 28 108 72 4 80x 500
Gambia 49 107 47 71 52 12 92 44 1100
Georgia 113 112 99 99 93 33
Germany 175 110 101 99 75 99x 22
Ghana 47 105 71 84 64 20 9 44 740
Greece 161 107 97 100 97 97x 10
Grenada 104 54 80 81x
Guatemala 74 108 78 88 92 31 81 35 200
Guinea 11 102 44 49 33 2 43 31 1600
Guinea-Bissau 6 107 63 55x 44x in 43 27x 910
Guyana 56 110 99 98x 105x On 56 90x
Haiti 34 106 88 93 95 18 49 21 1000
Holy See
Honduras 97 107 100 101 128 47 99 88 220
Hungary 152 114 100 100 105 73x 99x 30
Iceland 186 105 96 100 100x 0
India 46 100 58 81 64 41 78 34 570
Indonesia 67 105 87 97 84 55 75 36 650
Iran 96 101 76 93 82 73 50 77 120
Iraq 39 105 63 85 64 18x 65 54x 310
Ireland 164 107 100 105 10
Israel 161 104 96x 100 107 99x 7
Italy 164 108 99 101 101 78x 12
Jamaica 154 107 110 99 113 62 82 82x 120
Japan 175 108 100 101 59 100x 18
Jordan 117 106 85 101 104 35 41 87 150
Kazakstan 84 116 99 100 103 59 99 80
Kenya 55 108 81 99 82 33 21 45 650
Kiribati 61 92 28 41 72
Korea, Dem. People's Rep. 108 109 94x 95 100x 70
Korea, Rep. of 164 112 98 101 99 79 98 130
Kuwait '147 105 91 100 98 35x 21 99x 29
Kyrgyzstan 80 114 96 101 106 110
Lao People's Dem. Rep. 35 106 64 75 61 19 45 650
Latvia 133 117 100 95 106 64 40
Lebanon 88 104 95 96 111 55x 45x 300
Lesotho 32 105 77 112 148 23 10 40x 610
Liberia 5 107 41 55x 39x Ox 35 58x 560
Libya 70 106 72 100 100 45x 76x 220
Liechtenstein 164 100x
Lithuania 139 117 99 98 105 36
Luxembourg 164 108 107 100 99x 0
Madagascar 21 105 53 96 100 17 33 57 490
Malawi 8 100 58 90 67 22 56 55 560
Malaysia 149 106 88 101 110 48x 79x 94 80
Maldives 61 97 100 98 100 10 93 90
Mali 7 107 59 64 55 7 32 24 1200
Malta 154 107 101 97 89 0
Marshall Islands 54 27 15x
Mauritania 15 108 52 81 58 4 28 40 930
Mauritius 123 110 91 99 103 75 79 97 120
Mexico 102 109 95 96 102 53x 69 77 110
Micronesia, Fed. States of 116 95 44 90x
Moldova, Rep. of 102 113 101 99 104 60
Monaco 175
121 119

Table 7: Women
Under-5mortality
Life expectancyfemales as a% of males
Adult literacy ratefemales as a% of males
Enrolment ratiosfemales as a 9/. of males
1990-95
Contraceptiveprevalence
(%)
9,0 of
pregnant womenimmunized against
tetanus
% of birthsattendedby trained
healthpersonnel
Maternalmortality
rateprimary school secondary schoolrank 1996 1995 1990-97 1995-96 1990-96 1990
Mongolia 67 105 87 106 140 99x 65
Morocco 64 106 54 74 74 50 100 40 610
Mozambique 9 107 40 72 60 4x 61 25x 1500
Myanmar 25 105 88 96 100 17 79 57x 580
Namibia 60 104 95x 101 121 29 75 68 370
Nauru 104
Nepal 42 98 34 68 50 29 11x 9 1500
Netherlands 175 107 102 91 80 100x 12
New Zealand 164 107 98 103 70x 99x 25
Nicaragua 73 108 103 103 118 49 96 61 160
Niger 1 109 33 60 56 4 31 15 1200
Nigeria 14 106 70 79 85 6 36 31 1000
Niue
Norway 175 108 100 97 76x 100x 6
Oman 139 106 65x 94 91 9x 98 87x 190
Pakistan 33 103 48 45 52 12 54 19 340
Palau 97 38x 55 90
Panama 133 106 99 96 108 58x 24 86 55
Papua New Guinea 44 102 78 85 65 4x 50 20x 930
Paraguay 100 107 97 97 105 50 69 66 160
Peru 72 108 87 96x 91x 64 51 56 280
Philippines 93 106 99 101 102x 40 47 53 280
Poland 147 113 99x 98 101 75x 99x 19
Portugal 164 110 95 97 117 66x 90x 15
Qatar 132 107 101 94 100 32x 97x
Romania 117 111 98 99 101 57 100x 130
Russian Federation 117 122 99 99 108 75
Rwanda 19 106 74 97 82 21 43 26 1300
Saint Kitts and Nevis 93 93 100x 41x 100x
Saint Lucia 127 93 47x 99x
Saint Vincent/Grenadines 123 92 58x 73x
Samoa 77 106 21 96 95x 35
San Marino 149
Sao Tome and Principe 57 92 58x 10x 49 86x
Saudi Arabia 108 106 69 95 82 60 82x 130
Senegal 36 104 53 75 52 13 34 46 1200
Seychelles 136 91 104x 100 99x
Sierra Leone 3 109 40 70 55 4x 65 25x 1800
Singapore 189 105 90 98x 103x 74x 100x 10
Slovakia 154 113 100 t06 74
Slovenia 175 113 99x 100 102 13
Solomon Islands 113 107 87 67 25 63 87x
Somalia 10 106 39x 53x 56x lx 28 2x 1600
South Africa 69 110 100 97 116 50x 26x 82 230
Spain 186 109 98 101 112 59x 96x 7
Sri Lanka 136 106 94 98 111 66 81 94 140
Sudan 42 106 60 79 79 8 44 69 660
Suriname 104 107 96 97x 116x 99x 91x
Swaziland 53 109 97 95 96 21x 65 55x 560
Sweden 189 107 100 101 78x 100x 7
Switzerland 186 109 102 96 71x 99x 6
Syria 100 108 65 90 82 36 78 67 180
Tajikistan 61 109 100 97 90 130
Tanzania 29 106 72 97 83 16 92 53 770
TFYR Macedonia 108 106 99 102 91x
Thailand 93 109 96 99 97 74 88 71x 200
Togo 38 106 55 66 35 12x 43 54x 640
Tonga 123 93 39 88 92
120 12 r=

...Table 7
Life expectancy Adult literacy rateUnder-5 females as a females as amortality % of males % of males
rank 1996 1995
107 98
103 70
108 78
111 98x
105 68
116 101
103 101
108
110
109 101
111 100
106 84x
107 98
Trinidad and Tobago 143
Tunisia 97
Turkey 82
Turkmenistan 58
Tuvalu 74
Uganda 30
Ukraine 121
United Arab Emirates 139
United Kingdom 164
United States 163
Uruguay 127
Uzbekistan 71
Vanuatu 77
Venezuela 115
Viet Nam 85
Yemen 50
Yugoslavia, Fed. Rep. 127
Zambia 13
Zimbabwe 65
108 94
102 49x
107 98
102 83
104 89
Enrolment ratiosfemales es a % of males
1990-95
primary school secondary school
100 105
92 91
93 66
80 57
100 108
96 110
100 102
99 99
99 119
97 88
102 78
103 141
Regional summaries
Sub-Saharan Africa
Middle East and North Africa
South Asia
East Asia and Pacific
Latin America and Caribbean
CEE/CIS and Baltic States
Industrialized countries
Developing countries
Least developed countries
World
106 71
104 67
101 57
105 84
109 97
113 97
109 98
104 78
104 63
105 81
Countries in each region are listed on page 122.
94x
40
104
93
93
93x
24
103
61
80
82 80
86 82
77 63
97 88
97 109
98 98
100 101
88 81
79 59
90 86
Definitions of the indicators
Life expectancy at birth The number of years newborn children would live if subject
to the mortality risks prevailing for the cross-section of population at the time of their birth.
Adult literacy rate Percentage of persons aged 15 and over who can read and write.
Primary or secondary enrolment ratios The number of children enrolled in aschooling level (primary or secondary), regardless of age, divided by the population of the
age group which officially corresponds to that level.
Contraceptive prevalence Percentage of married women aged 15-49 years currently
using contraception.
Births attended Percentage of births attended by physicians, nurses, midwives, or
primary health care workers trained in midwifery skills.
Maternal mortality rate Annual number of deaths of women from pregnancy-related
causes per 100,000 live births. Several of the maternal mortality rates in table 7 are
substantially different from official government estimates. These and other rates are being
reviewed by WHO and UNICEF and will be revised where necessary, as part of the ongoing
process of improving maternal mortality estimates.
Contraceptiveprevalence
(%)
% ofpregnant women
immunized againsttetanus
% of birthsattendedhy trained
healthpersonnel
Maternalmortality
rate
1990-97 1995-96 1990-96 1990
53x 19x 98x 90
60 80 69x 170
63 32 76 180
55
53
15 55 38 1200
100x 50
96x 26
82 100x 9
74x 99x 12
84 13x 96x 85
56 55
15 15 86x 280
49x 60 69x 120
65 82 95x 160
7 55 16 1400
15 48 51 940
48 65 69 570
15 38 37 980
46 57 62 320
38 71 29 610
74 35 75 210
64 58 78 190
64 90 85
72 99 13
54 51 53 470
19 48 29 1100
57 51 57 430
Main data sources
Life expectancy United Nations Population Division.
Adult literacy United Nations Educational, Scientific and Cultural Organization
(UNESCO).
School enrolment United Nations Educational, Scientific and Cultural Organization
(UNESCO) and Demographic and Health Surveys.
Immunization World Health Organization (WHO), UNICEF, Multiple Indicator Cluster
Surveys (MICS) and Demographic and Health Surveys (OHS).
Contraceptive prevalence United Nations Population Division and Demographic and
Health Surveys.
Births attended World Health Organization (WHO).
Maternal mortality World Health Organization (WHO) and UNICEF.
Notes Data not available.
x Indicates data that refer to years or periods other than those specified in the column heading, differ from the standard definition, or refer to only part of a country.
123 121

Regional summaries country list
Regional averages given at the end of each
table are calculated using data from thecountries as grouped below.
Sub-Saharan Africa
Angola; Benin; Botswana; Burkina Faso;
Burundi; Cameroon; Cape Verde; CentralAfrican Rep.; Chad; Comoros; Congo; Congo,
Dem. Rep.; COte d'Ivoire; Equatorial Guinea;
Eritrea; Ethiopia; Gabon; Gambia; Ghana;Guinea; Guinea-Bissau; Kenya; Lesotho;
Liberia; Madagascar; Malawi; Mali; Mauritania;
Mauritius; Mozambique; Namibia; Niger;
Nigeria; Rwanda; Sao Tome and Principe;
Senegal; Seychelles; Sierra Leone; Somalia;
South Africa; Swaziland; Tanzania; Togo;Uganda; Zambia; Zimbabwe
Middle East and North Africa
Algeria; Bahrain; Cyprus; Djibouti; Egypt; Iran;
Iraq; Jordan; Kuwait; Lebanon; Libya; Morocco;
Oman; Qatar; Saudi Arabia; Sudan; Syria;Tunisia; United Arab Emirates; Yemen
South Asia
Afghanistan; Bangladesh; Bhutan; India;
Maldives; Nepal; Pakistan; Sri Lanka
East Asia and Pacific
Brunei Darussalam; Cambodia; China; Cook
Islands; Fiji; Indonesia; Kiribati; Korea, Dem.
People's Rep.; Korea, Rep. of; Lao People'sDem. Rep.; Malaysia; Marshall Islands;
Micronesia, Fed. States of; Mongolia;
Myanmar; Nauru; Niue; Palau; Papua NewGuinea; Philippines; Samoa; Singapore;
Solomon Islands; Thailand; Tonga; Tuvalu;Vanuatu; Viet Nam
Latin America and Caribbean
Antigua and Barbuda; Argentina; Bahamas;
Barbados; Belize; Bolivia; Brazil; Chile;
Colombia; Costa Rica; Cuba; Dominica;
Dominican Rep.; Ecuador; El Salvador;
Grenada; Guatemala; Guyana; Haiti; Honduras;
122
Jamaica; Mexico; Nicaragua; Panama;
Paraguay; Peru; Saint Kitts and Nevis; Saint
Lucia; Saint Vincent/Grenadines; Suriname;
Trinidad and Tobago; Uruguay; Venezuela
CEE/C1S and Baltic States
Albania; Armenia; Azerbaijan; Belarus; Bosnia
and Herzegovina; Bulgaria; Croatia; Czech
Rep.; Estonia; Georgia; Hungary; Kazakstan;
Kyrgyzstan; Latvia; Lithuania; Moldova, Rep.of; Poland; Romania; Russian Federation;Slovakia; Tajikistan; TFYR Macedonia; Turkey;
Turkmenistan; Ukraine; Uzbekistan; Yugoslavia,
Fed. Rep.
Industrialized countries
Andorra; Australia; Austria; Belgium; Canada;
Denmark; Finland; France; Germany; Greece;
Holy See; Iceland; Ireland; Israel; Italy; Japan;
Liechtenstein; Luxembourg; Malta; Monaco;
Netherlands; New Zealand; Norway; Portugal;
San Marino; Slovenia; Spain; Sweden;
Switzerland; United Kingdom; United States
Developing countries
Afghanistan; Algeria; Angola; Antigua andBarbuda; Argentina; Armenia; Azerbaijan;Bahamas; Bahrain; Bangladesh; Barbados;
Belize; Benin; Bhutan; Bolivia; Botswana;Brazil; Brunei Darussalam; Burkina Faso;
Burundi; Cambodia; Cameroon; Cape Verde;
Central African Rep.; Chad; Chile; China;Colombia; Comoros; Congo; Congo, Dem. Rep.;
Cook Islands; Costa Rica; Cote d'Ivoire; Cuba;
Cyprus; Djibouti; Dominica; Dominican Rep.;
Ecuador; Egypt; El Salvador; Equatorial Guinea;
Eritrea; Ethiopia; Fiji; Gabon; Gambia; Georgia;
Ghana; Grenada; Guatemala; Guinea; Guinea-
Bissau; Guyana; Haiti; Honduras; India;
Indonesia; Iran; Iraq; Israel; Jamaica; Jordan;
Kazakstan; Kenya; Kiribati; Korea, Dem.People's Rep.; Korea, Rep. of; Kuwait;
Kyrgyzstan; Lao People's Dem. Rep.; Lebanon;
Lesotho; Liberia; Libya; Madagascar; Malawi;
Malaysia; Maldives; Mali; Marshall Islands;
Mauritania; Mauritius; Mexico; Micronesia,
124
Fed. States of; Mongolia; Morocco;
Mozambique; Myanmar; Namibia; Nauru;Nepal; Nicaragua; Niger; Nigeria; Niue; Oman;
Pakistan; Palau; Panama; Papua New Guinea;
Paraguay; Peru; Philippines; Qatar; Rwanda;
Saint Kitts and Nevis; Saint Lucia; SaintVincent/Grenadines; Samoa; Sao Tome andPrincipe; Saudi Arabia; Senegal; Seychelles;
Sierra Leone; Singapore; Solomon Islands;Somalia; South Africa; Sri Lanka; Sudan;Suriname; Swaziland; Syria; Tajikistan; Tanzania;
Thailand; Togo; Tonga; Trinidad and Tobago;
Tunisia; Turkey; Turkmenistan; Tuvalu; Uganda;
United Arab Emirates; Uruguay; Uzbekistan;
Vanuatu; Venezuela; Viet Nam; Yemen; Zambia;
Zimbabwe
Least developed countries
Afghanistan; Angola; Bangladesh; Benin;
Bhutan; Burkina Faso; Burundi; Cambodia;
Cape Verde; Central African Rep.; Chad; Comoros;
Congo, Dem. Rep.; Djibouti; Equatorial Guinea;
Eritrea; Ethiopia; Gambia; Guinea; Guinea-Bissau; Haiti; Kiribati; Lao People's Dem. Rep.;
Lesotho; Liberia; Madagascar; Malawi; Maldives;
Mali; Mauritania; Mozambique; Myanmar;Nepal; Niger; Rwanda; Samoa; Sao Tome and
Principe; Sierra Leone; Solomon Islands;
Somalia; Sudan; Tanzania; Togo; Tuvalu;
Uganda; Vanuatu; Yemen; Zambia

Measuring human developmentAn introduction to table 8
If development in the 1990s is to assume a
more human face then there arises a corre-
sponding need for a means of measuring
human as well as economic progress. From
UNICEF's point of view, in particular, there is a
need for an agreed method of measuring the
level of child well-being and its rate ofchange.
The under-five mortality rate (U5MR) isused in table 8 (next page) as the principal in-
dicator of such progress.
The U5MR has several advantages. First,
it measures an end result of the development
process rather than an 'input' such as school
enrolment level, per capita calorie availability,
or the number of doctors per thousand popu-
lation all of which are means to an end.
Second, the U5MR is known to be the re-
sult of a wide variety of inputs: the nutritional
health and the health knowledge of mothers;
the level of immunization and ORT use; the
availability of maternal and child health ser-
vices (including prenatal care); income and
food availability in the family; the availability
of clean water and safe sanitation; and the
overall safety of the child's environment.
Third, the U5MR is less susceptible than,
say, per capita GNP to the fallacy of the aver-
age. This is because the natural scale does
not allow the children of the rich to be one
thousand times as likely to survive, even if the
man-made scale does permit them to have
one thousand times as much income. In other
words, it is much more difficult for a wealthy
minority to affect a nation's U5MR, and ittherefore presents a more accurate, if far from
perfect, picture of the health status of the ma-
jority of children (and of society as a whole).
For these reasons, the U5MR is chosen by
UNICEF as its single most important indicator
of the state of a nation's children. That is why
the tables rank the nations of the world not in
ascending order of their per capita GNP but in
descending order of their under-five mortality
rates.
The speed of progress in reducing theU5MR can be measured by calculating its av-
erage annual reduction rate (AARR). Unlike
the comparison of absolute changes, theAARR reflects the fact that the lower limits to
U5MR are approached only with increasing
difficulty. As lower levels of under-five mor-
tality are reached, for example, the same ab-
solute reduction obviously represents agreater percentage of reduction. The AARR
therefore shows a higher rate of progress for,
say, a 10-point reduction if that reduction hap-
pens at a lower level of under-five mortality.
(A fall in U5MR of 10 points from 100 to 90
represents a reduction of 10 per cent, whereas
the same 10-point fall from 20 to 10 repre-sents a reduction of 50 per cent).
When used in conjunction with GNPgrowth rates, the U5MR and its reduction rate
can therefore give a picture of the progress
being made by any country or region, and over
any period of time, towards the satisfaction of
some of the most essential of human needs.
As table 8 shows, there is no fixed rela-
tionship between the annual reduction rate of
the U5MR and the annual rate of growth in
per capita GNP. Such comparisons help to
throw the emphasis on to the policies, priori-
ties, and other factors which determine the
ratio between economic and social progress.
Finally, the table gives the total fertilityrate for each country and its average annual
rate of reduction. It will be seen that many of
the nations that have achieved significant re-
ductions in their U5MR have also achieved
significant reductions in fertility.
12 123

Table 8: The rate of progress
Under-5mortality
Under-5mortality
rate
Average annualrate of reduction 1%)
GNP per capitaaverage annualgrowth rate (%)
Totalfertility rate
Average annualrate of reduction ( %l
required1960 1980 1996 1965-80 1985-95 1960 1980 1996 1960-80 1980-96rank 1960-80 1980-96 1996-2000
Afghanistan 4 360 280 257 1.3 0.5 32.5 0.6 6.9 7.1 6.9 -0.1 0.2
Albania 88 151 57 40 4.9 2.2 9.6 -6.0x 5.9 3.8 2.7 2.2 2.1
Algeria 92 255 139 39 3.0 7.9 4.9 4.2 -2.4 7.3 6.8 4.0 0.4 3.3
Andorra 175 6
Angola 2 345 261 292 1.4 -0.7 35.7 -6.1 6.4 6.9 6.8 -0.4 0.1
Antigua and Barbuda 127 22 2.7
Argentina 117 72 38 25 3.2 2.6 7.3 1.7 1.8 3.1 3.3 2.7 -0.3 1.3
Armenia 108 48 28 30 2.7 -0.4 9.3 -15.1 4.5 2.4 1.8 3.1 1.8
Australia 175 24 13 6 3.0 4.7 0.0 2.2 1.4 3.3 2.0 1.9 2.5 0.3
Austria 175 43 17 6 4.6 7.1 -3.4 4.0 1.9 2.7 1.6 1.4 2.6 0.8
Azerbaijan 85 75 52 45 1.8 0.9 10.7 -16.3 5.5 3.3 2.4 2.6 2.0
Bahamas 123 68 35 23 3.3 2.6 4.4 -0.8 3.8 2.8 2.0 1.5 2.1
Bahrain 127 203 42 22 7.9 4.0 9.1 0.2 7.1 4.9 3.1 1.9 2.9
Bangladesh 44 247 211 112 0.8 4.0 11.8 -0.3 2.1 6.7 6.4 3.2 0.2 4.3
Barbados 152 90 29 12 5.7 5.5 9.2 0.8 4.5 2.1 1.7 3.8 1.3
Belarus 139 47 26 18 3.0 2.3 7.6 -5.2 2.7 2.1 1.5 1.3 2.1
Belgium 164 35 15 7 4.3 5.0 1.5 3.6 2.2 2.6 1.6 1.6 2.4 0.0
Belize 85 104 70 44 2.0 2.9 7.4 3.9 6.5 5.8 3.8 0.6 2.6
Benin 31 310 176 140 2.8 1.4 17.3 -0.3 -0.3 6.9 7.1 6.0 -0.1 1.1
Bhutan 36 300 227 127 1.4 3.6 14.9 4.9 5.9 5.9 5.9 0.0 0.0
Bolivia 51 252 170 102 2.0 3.2 9.4 1.7 1.8 6.7 5.6 4.5 0.9 1.4
Bosnia and Herzegovina 143 155 38 17 7.0 5.0 6.1 4.0 2.1 1.4 3.2 2.5
Botswana BO 170 94 50 3.0 3.9 4.8 9.9 6.1 6.8 6.1 4.6 0.5 1.8
Brazil 79 177 92 52 3.3 3.6 6.6 6.3 -0.8 6.2 4.0 2.3 2.2 3.5
Brunei Darussalam 154 87 22 11 6.9 4.3 10.9 6.9 4.1 2.8 2.6 2.4
Bulgaria 136 70 25 19 5.1 1.7 11.5 -2.6 2.2 2.1 1.5 0.2 2.1
Burkina Faso 23 318 246 158 1.3 2.8 20.4 1.7 -0.2 6.7 7.8 6.7 -0.8 1.0
Burundi 17 255 193 176 1.4 0.6 23.0 2.4 -1.3 6.8 6.8 6.4 0.0 0.4
Cambodia 19 217 330 170 -2.1 4.1 22.2 2.0 6.3 4.6 4.6 1.6 0.0
Cameroon 51 264 173 102 2.1 3.3 9.4 2.4 -6.6 5.8 6.4 5.4 -0.5 1.1
Canada 164 33 13 7 4.8 4.0 4.0 3.3 0.4 3.8 1.7 1.6 4.0 0.4
Cape Verde 65 164 95 73 2.7 1.7 10.1 2.1 7.0 6.5 3.7 0.4 3.5
Central African Rep. 21 343 180 164 3.2 0.6 21.3 0.8 -2.4 5.6 5.8 5.1 -0.2 0.8
Chad 27 325 206 149 2.3 2.0 18.9 -1.9 0.6 6.0 5.9 5.6 0.1 0.3
Chile 149 138 35 13 6.9 6.2 -0.9 0.0 6.1 5.3 2.8 2.5 3.2 0.7
China 82 209 65 47 5.9 2.0 10.2 4.1 8.3 5.7 2.9 1.8 3.4 3.0
Colombia 104 130 58 31 4.0 3.9 3.7 3.7 2.6 6.8 3.8 2.8 2.9 1.9
Comoros 39 248 167 122 2.0 2.0 13.9 -1.4 6.8 7.1 5.7 -0.2 1.4
Congo 48 220 125 108 2.8 0.9 10.8 2.7 -3.2 5.9 6.3 6.0 -0.3 0.3
Congo, Dem. Rep. 12 302 210 207 1.8 0.1 27.1 -1.3 -8.5 6.0 6.6 6.4 -0.5 0.2
Cook Islands 108 37 30 1.3 8.6
Costa Rica 146 112 29 15 6.8 4.0 8.7 3.3 2.8 7.0 3.7 3.0 3.2 1.3
Cote d'Ivoire 25 300 170 150 2.8 0.8 19.1 2.8 -4,3 7.2 7.4 5.3 -0.1 2.1
Croatia 154 98 23 11 7.2 4.6 5.9 2.3 2.0 1.6 0.7 1.4
Cuba 159 54 22 10 4.5 4.7 4.5 4.2 2.0 1.6 3.7 1.4
Cyprus 159 36 20 10 2.9 4.7 4.6 4.6 3.5 2.4 2.3 1.9 0.3
Czech Rep. 164 25 19 7 1.4 6.6 -2.9 -1.8 2.3 2.2 1.5 0.2 2.4
Denmark 175 25 10 6 4.4 3.1 1.2 2.2 1.5 2.6 1.6 1.8 2.4 -0.7
Djibouti 24 289 199 157 1.9 1.5 20.2 7.0 6.6 5.5 0.3 1.1
Dominica 133 20 6.7 4.1
Dominican Rep. 74 149 92 56 2.4 3.1 6.4 3.8 2.1 7.4 4.3 2.9 2.7 2.5
Ecuador 88 180 101 40 2.9 5.8 4.6 5.4 0.8 6.7 5.1 3.2 1.4 2.9
Egypt 58 282 175 78 2.4 5.1 2.7 2.8 1.1 7.0 5.2 3.5 1.5 2.5
El Salvador 88 210 120 40 2.8 6.9 2.6 1.5 2.8 6.8 5.1 3.2 1.4 2.9
Equatorial Guinea 18 316 243 173 1.3 2.1 22.6 2.3 5.5 5.7 5.6 -0.2 0.1
Eritrea 41 250 195 120 1.2 3.0 13.5 6.6 6.1 5.5 0.4 0.6
Estonia 145 52 25 16 3.7 2.8 3.3 -4.3 2.0 2.1 1.4 -0.2 2.5
Ethiopia 16 280 213 177 1.4 1.2 23.2 0.4 -0.3 6.9 6.9 7.0 0.0 -0.1
124 126

...Table 8
Under-5mortality
Under-5mortality
Me
Average annualrate of reduction ( %)
GNP per capitaaverage annualgrowth rate ( %)
Totalfertility rate
Average annualrate of reduction ( %)
required1960 1980 1996 1965-80 1985-95 1960 1980 1996 1960-80 1980-96rank 1960-80 1980-96 1996-2000
Fiji 121 97 42 24 4.2 3.5 3.6 2.0 6.4 3.9 2.8 2.5 2.1
Finland 189 28 9 4 5.9 4.4 -1.1 3.6 -0.2 2.7 1.7 1.8 2.3 -0.4
France 175 34 13 6 4.9 5.2 -2.6 3.7 1.5 2.8 1.9 1.7 1.9 0.7
Gabon 28 287 194 145 2.0 1.8 18.2 5.6 -8.2 4.1 4.4 5.3 -0.4 -1.2
Gambia 49 375 250 107 2.0 5.3 10.6 0.3 6.4 6.5 5.3 -0.1 1.3
Georgia 113 70 44 29 2.3 2.6 8.4 -17.0 2.9 2.3 2.0 1.2 0.9
Germany 175 40 16 6 4.7 6.2 -0.4 3.0x 1.9x 2.4 1.5 1.3 2.4 0.9
Ghana 47 213 155 110 1.6 2.1 11.3 -0.8 1.4 6.9 6.5 5.4 0.3 1.2
Greece 161 64 23 9 5.2 5.9 4.6 4.8 1.3 2.2 2.1 1.4 0.2 2.5
Grenada 104 31 5.7
Guatemala 74 204 140 56 1.9 5.7 1.2 3.0 0.3 6.9 6.3 5.0 0.5 1.4
Guinea 11 380 300 210 1.2 2.2 27.5 1.3 1.4 7.0 7.0 6.7 0.0 0.3
Guinea-Bissau 6 336 290 223 0.7 1.7 29.0 -2.7 2.0 5.1 5.7 5.5 -0.6 0.2
Guyana 56 126 90 83 1.7 0.5 8.1 0.6 6.5 3.6 2.4 3.0 2.5
Haiti 34 260 200 134 1.3 2.5 16.2 0.9 -5.2 6.3 5.3 4.7 0.9 0.8
Holy See
Honduras 97 204 101 35 3.5 6.6 0.7 1.1 0.1 7.5 6.3 4.5 0.9 2.1
Hungary 152 57 26 12 3.9 4.8 2.4 5.1 -1.0 2.0 2.0 1.5 0.0 1.8
Iceland 186 22 9 5 4.5 3.3 12.6 1.0 4.0 2.3 2.2 2.8 0.3
India 46 236 177 111 1.4 2.9 11.5 1.5 3.2 5.9 4.7 3.2 1.1 2.4
Indonesia 67 216 128 71 2.6 3.7 2.9 5.2 6.0 5.5 4.4 2.7 1.1 3.1
Iran 96 233 126 37 3.1 7.7 -1.5 2.9 -1.5 7.2 6.7 4.9 0.4 2.0
Iraq 39 171 83 122 3.6 -2.4 33.5 7.2 6.5 5.4 0.5 1.2
Ireland 164 36 14 7 4.6 4.4 4.2 2.8 5.2 3.8 3.2 1.9 0.9 3.3
Israel 161 39 19 9 3.6 5.0 2.8 3.7 2.5 3.9 3.3 2.8 0.8 1.0
Italy 164 50 17 7 5.3 5.7 1.5 3.2 1.8 2.5 1.7 1.2 1.9 2.2
Jamaica 154 76 39 11 3.4 7.8 0.9 -0.1 3.6 5.4 3.8 2.5 1.8 2.6
Japan 175 40 11 6 6.6 3.5 9.5 5.1 2.9 2.0 1.8 1.5 0.5 1.1
Jordan 117 139 64 25 3.9 5.9 1.0 5.8x -4.5 7.7 7.1 5.3 0.4 1.8
Kazakstan 84 74 57 45 1.3 1.5 8.5 -8.6 4.5 3.0 2.4 2.0 1.4
Kenya 55 202 112 90 2.9 1.4 10.1 3.1 0.1 8.0 7.8 5.0 0.1 2.8
Kiribati 61 76 6.5 -0.6
Korea, Dem. People's Rep. 108 120 43 30 5.1 2.3 6.3 5.8 2.8 2.1 3.6 1.8
Korea, Rep. of 164 127 18 7 9.8 5.9 3.9 7.3 7.7 6.0 2.7 1.7 4.0 2.9
Kuwait 147 128 35 14 6.6 5.6 6.4 0.6x 1.1 7.3 5.4 2.9 1.5 3.9
Kyrgyzstan 80 115 73 50 2.3 2.4 7.7 -6.9 5.1 4.1 3.3 1.1 1.4
Lao People's Dem. Rep. 35 235 200 128 0.8 2.8 15.1 2.7 6.2 6.7 6.7 -0.4 0.0
Latvia 133 44 26 20 2.6 1.6 10.2 -6.6 1.9 2.0 1.5 -0.3 1.8
Lebanon 88 85 40 40 3.8 0.0 10.1 2.7 6.3 4.0 2.9 2.3 2.0
Lesotho 32 203 168 139 0.9 1.2 17.1 6.8 1.2 5.8 5.7 5.0 0.1 0.8
Liberia 5 288 235 235 1.0 0.0 30.3 0.5 6.6 6.8 6.5 -0.1 0.3
Libya 70 269 118 61 4.1 4.1 4.0 0.0 7.1 7.3 6.1 -0.1 1.1
Liechtenstein 164 7
Lithuania 139 70 25 18 5.1 2.1 7.6 -11.7 2.5 2.1 1.6 0.9 1.7
Luxembourg 164 41 16 7 4.6 4.8 6.5 0.9 2.3 1.5 1.7 2.1 -0.8
Madagascar 21 364 216 164 2.6 1.7 21.3 -0.4 -2.2 6.6 6.6 5.8 0.0 0.8
Malawi 8 365 290 217 1.1 1.8 28.3 3.2 -0.7 6.9 7.6 6.8 -0.5 0.7
Malaysia 149 105 42 13 4.6 7.3 -1.3 4.7 5.7 6.8 4.2 3.4 2.4 1.3
Maldives 61 258 129 76 3.5 3.3 7.6 5.9 7.0 6.9 6.8 0.1 0.1
Mali 7 500 300 220 2.6 1.9 28.6 2.1x 0.8 7.1 7.1 6.8 0.0 0.3
Malta 154 47 17 11 4.6 2.8 4.3 5.1 3.4 2.0 2.1 2.7 -0.3
Marshall Islands 54 92 10.2
Mauritania 15 330 175 183 3.2 -0.3 24.0 -0.1 0.5 6.5 6.3 5.1 02 1.3
Mauritius 123 84 42 23 3.4 3.9 6.9 3.7 5.4 5.8 2.8 2.3 3.6 1.2
Mexico 102 148 87 32 2.7 6.3 5.3 3.6 0.1 6.9 4.8 2.9 1.8 3.1
Micronesia, Fed. States of 116 27 6.6
Moldova, Rep. of 102 88 52 32 2.6 3.0 6.5 -8.2 3.3 2.5 1.9 1.4 1.7
Monaco 175 6
127125

Table 8: The rate of progress
Under-5mortality
Under-5mortality
rate
Average annualrate of reduction (%)
GNP per capitaaverage annualgrowth rate (%)
Totalfertility rate
Average annualrate of reduction (%)
required1960 1980 1996 1965-80 1985-95 1960 1980 1996 1960-80 1980-96rank 1960-80 1980-96 1996-2000
Mongolia 67 185 112 71 2.5 2.8 5,8 -3.8 6.0 6.2 3.4 -0.2 3.8
Morocco 64 220 152 74 1.8 4.5 7.3 2.7 0.9 7.2 5.5 3.3 1.3 3.2
Mozambique 9 280 280 214 0.0 1.7 27.9 3.6 6.3 6.5 6.2 -0.2 0.3
Myanmar 25 237 146 150 2.4 -0.2 19.1 1.6 0.4 6.0 5.1 3.4 0.8 2.5
Namibia 60 206 114 77 3.0 2.5 8.1 2.9 6.0 5.9 5.0 0.1 1.0
Nauru 104 31
Nepal 42 315 195 116 2.4 3.2 12.6 2.4 5.8 6.2 5.1 -0.3 1.2
Netherlands 175 22 11 6 3.4 3.8 3.2 2.7 1.9 3.1 1.5 1.6 3.6 -0.4
New Zealand 164 26 16 7 2.5 4.7 -0.3 1.7 0.8 3.9 2.1 2.1 3.1 0.0
Nicaragua 73 209 143 57 1.9 5.7 3.3 -0.7 -5.4 7.3 6.2 4.0 0.8 2.7
Niger 1 320 320 320 0.0 0.0 38.0 -2.5 -2.1 7.3 8.1 7.2 -0.5 0.7
Nigeria 14 204 196 191 0.2 0.1 25.1 4.2 1.2 6.5 6.5 6.1 0.0 0.4
Niue
Norway 175 23 11 6 3.8 4.1 -0.9 3.6 1.7 2.9 1.8 1.9 2.4 -0.3
Oman 139 280 95 18 5.4 10.4 -2.6 9.0 0.3 7.2 7.2 7.2 0.0 0.0
Pakistan 33 226 161 136 1.7 1.1 16.6 1.8 1.2 6.9 6.8 5.2 0.1 1.7
Palau 97 39 35 0.7 10.2
Panama 133 104 31 20 6.0 2.7 9.1 2.8 -0.4 5.9 3.8 2.7 2.2 2.1
Papua New Guinea 44 204 112 112 3.0 0.0 11.8 2.3 6.3 5.6 4.8 0.6 1.0
Paraguay 100 90 61 34 1.9 3.7 8.0 4.1 1.2 6.5 5.2 4.3 1.1 1.2
Peru 72 234 126 58 3.1 4.8 3.7 0.8 -1.6 6.9 5.0 3.1 1.6 3.0
Philippines 93 107 69 38 2.2 3.7 2.3 3.2 1.5 6.9 4.9 3.7 1.7 1.8
Poland 147 70 24 14 5.3 3.6 3.3 1.2 3.0 2.3 1.7 1.3 1.9
Portugal 164 112 31 7 6.4 9.1 -9.9 4.6 3.6 3.1 2.2 1.5 1.7 2.4
Qatar 132 239 55 21 7.3 6.0 -3.4 -4.2 7.0 5.8 3.9 0.9 2.5
Romania 117 82 36 25 4.1 2.2 4.2 -3.8 2.3 2.4 1.4 -0.2 3.4
Russian Federation 117 65 36 25 3.0 2.3 5.6 -5.1 2.6 2.0 1.4 1.3 2.2
Rwanda 19 210 218 170 -0.2 1.6 22.2 1.6 -5.4 7.5 8.3 6.2 -0.5 1.8
Saint Kitts and Nevis 93 38 6.5 4.8
Saint Lucia 127 22 10.1 3.9
Saint Vincent/Grenadines 123 23 7.1 3.8
Samoa 77 210 100 53 3.7 4.0 6.2 0.2 8.3 5.9 3.9 1.7 2.6
San Marino 149 13
Sao Tome and Principe 57 80 7.2 -2.1
Saudi Arabia 108 292 85 30 6.2 6.5 0.0 4.0x -1.9 7.2 7.3 6.0 -0.1 1.2
Senegal 36 300 218 127 1.6 3.4 14.9 -0.5 -1.2 7.0 6.9 5.8 0.1 1.1
Seychelles 136 19 7.6 4.2
Sierra Leone 3 385 301 284 1.2 0.4 35.0 0.7 -3.6 6.2 6.5 6.2 -0.2 0.3
Singapore 189 40 13 4 5.6 7.1 -5.8 8.3 6.2 5.5 1.8 1.8 5.6 0.0
Slovakia 154 40 23 11 2.7 4.7 1.9 -2.8 3.1 2.4 1.6 1.3 2.5
Slovenia 175 45 18 6 4.6 6.8 -2.3 2.4 2.1 1.3 0.7 3.0
Solomon Islands 113 185 56 29 6.0 4.1 4.7 3.2 6.4 6.7 5.1 -0.2 1.7
Somalia 10 294 246 211 0.9 1.0 27.6 -0.1 -2.3x 7.0 7.0 7.0 0.0 0.0
South Africa 69 126 91 66 1.6 2.0 7.6 3.2 -1.1 6.5 4.9 3.9 1.4 1.4
Spain 186 57 16 5 6.2 7.1 -2.3 4.1 2.6 2.8 2.2 1.2 1.2 3.8
Sri Lanka 136 130 52 19 4.6 6.3 9.3 2.8 2.6 5.3 3.5 2.1 2.1 3.2
Sudan 42 210 145 116 1.9 1.4 12.6 0.8 0.6 6.7 6.5 4.7 0.2 2.0
Suriname 104 96 52 31 3.0 3.3 4.8 3.5 6.6 3.8 2.5 2.8 2.6
Swaziland 53 233 151 97 2.2 2.7 8.2 -1.4 6.5 6.3 4.6 0.2 2.0
Sweden 189 20 9 4 4.1 5.1 -1.3 2.0 -0.1 2.3 1.6 1.9 1.8 -1.1
Switzerland 186 27 11 5 4.5 4.5 0.5 1.5 0.2 2.4 1.5 1.5 2.4 0.0
Syria 100 201 73 34 5.1 4.8 3.5 5.1 0.9 7.3 7.4 4.2 -0.1 3.5
Tajikistan 61 140 94 76 2.0 1.3 9.5 -13.0 6.3 5.7 4.0 0.5 2.2
Tanzania 29 240 176 144 1.6 1.3 18.0 0.8 1.0 6.8 6.8 5.6 0.0 1.2
TFYR Macedonia 108 177 69 30 4.7 5.2 2.4 4.2 2.6 2.0 2.4 1.6
Thailand 93 148 58 38 4.7 2.6 8.3 4.4 8.4 6.4 3.6 1.8 2.9 4.3
Togo 38 267 175 125 2.1 2.1 14.5 1.7 -2.7 6.6 6.6 6.2 0.0 0.4
Tonga 123 23 6.1 0.5
126 126

...Table 8
Under-5mortality
rank
Trinidad and Tobago 143
Tunisia 97
Turkey 82
Turkmenistan 58
Tuvalu 74
Uganda 30
Ukraine 121
United Arab Emirates 139
United Kingdom 164
United States 163
Uruguay 127
Uzbekistan 71
Vanuatu 77
Venezuela 115
Viet Nam 85
Yemen 50
Yugoslavia, Fed. Rep. 127
Zambia 13
Zimbabwe 65
Regional summaries
Sub-Saharan Africa
Middle East and North Africa
South Asia
East Asia and Pacific
Latin America and Caribbean
CEE/CIS and Baltic States
Industrialized countries
Developing countries
Least developed countries
World
Countries in each region are listed on page 122.
Under-5mortality
rate
Average annualrate of reduction (%)
GNP per capitaaverage annualgrowth rate ( %)
Totalfertility rate
Average annualrate of reduction (%)
required1960 1980 1996 1965-80 1985-95 1960 1980 1996 1960-80 1980-961960-80 1980-96 1996-2000
73 40 17 3.0 5.3 lA 3.1 -1.7 5.1 3.3 2.2 2.2 2.5
254 100 35 4.7 6.6 0.2 4.7 1.9 7.1 5.3 3.0 1.5 3.6
219 133 47 2.5 6.5 0.2 3.6 2.2 6.3 4.3 2.6 1.9 3.1
150 95 78 2.3 1.2 9.5 -9.6 6.4 5.1 3.7 1.1 2.0
77 56 2.0 10.2
224 180 141 1.1 1.5 17.5 -2.2 2.7 6.9 7.0 7.1 -0.1 -0.1
53 28 24 3.2 1.0 10.1 -9.2 2.2 2.0 1.5 0.5 1.8
240 64 18 6.6 7.9 2.9 -2.8 6.9 5.4 3.6 1.2 2.5
27 14 7 3.1 4.6 4.0 2.0 1.4 2.7 1.8 1.7 2.0 0.4
30 15 8 3.3 3.8 5.4 1.8 1.3 3.5 1.8 2.0 3.3 -0.7
56 43 22 1.3 4.1 8.4 2.5 3.1 2.9 2.7 2.3 0.4 1.0
122 78 60 2.2 1.6 8.9 -3.9 6.3 4.9 3.6 1.3 1.9
225 110 53 3.6 4.6 3.2 -1.1 7.2 5.4 4.5 1.4 1.1
70 42 28 2.6 2.6 12.2 2.3 0.5 6.6 4.2 3.1 2.3 1.9
219 105 ,44 3.7 5.4 4.7 4.2 6.1 5.1 3.1 0.9 3.1
340 198 105 2.7 4.0 10.1 7.6 7.6 7.6 0.0 0.0
120 44 22 5.0 4.3 2.4 2.7 2.3 1.8 0.8 1.5
213 149 202 1.8 -1.9 26.5 -1.2 -0.8 6.6 7.1 5.6 -0.4 1.5
181 125 73 1.8 3.4 7.9 1.7 -0.6 7.5 6.4 4.8 0.8 1.8
257 197 171 1.3 0.9 23.0 2.8 -0.9 6.6 6.6 5.9 0.0 0.7
241 134 65 2.9 4.6 7.6 3.1 -0.9 7.1 6.2 4.5 0.7 2.0
239 181 119 1.4 2.6 13.4 1.4 2.8 6.1 5.1 3.5 0.9 2.4
201 80 54 4.6 2.5 8.8 4.9 7.4 5.8 3.3 2.1 2.8 2.8
157 87 43 3.0 4.4 6.2 4.0 0.5 6.0 4.2 2.8 1.8 2.6
101 56 36 2.9 2.8 5.2 -3.3 3.0 2.5 1.9 0.9 1.9
37 14 7 4.7 4.6 3.5 2.9 1.8 2.8 1.8 1.7 2.2 0.4
216 136 97 2.3 2.1 14.5 3.7 2.9 6.0 4.4 3.2 1.6 2.0
280 214 171 1.4 1.4 22.3 -0.1 0.0 6.6 6.5 5.3 0.0 1.3
192 121 88 2.3 2.0 14.2 3.1 1.9 5.0 3.8 2.9 1.4 1.7
Definitions of the indicators Main data sources
Under-five mortality rate - Probability of dying between birth and exactly five yearsof age expressed per 1,000 live births.
GNP per capita- Gross national product (GNP) is the sum of gross value added by allresident producers, plus any taxes that are not included in the valuation of output, plus net
receipts of primary income from non-resident sources. GNP per capita is the gross national
product, converted to United States dollars using the World Bank Atlas method, divided bythe mid-year population.
Total fertility rate - The number of children that would be born per woman if she wereto live to the end of her childbearing years and bear children at each age in accordancewith prevailing age-specific fertility rates.
Average annual rate of reduction required 1996-2000 -The average annualreduction rate required, for the period 1996-2000, to achieve an under-five mortality rate in
the year 2000 of 70 per 1,000 live births or two thirds the 1990 rate, whichever is less.
Under-five mortality - UNICEF, United Nations Population Division and UnitedNations Statistics Division.
GNP per capita - World Bank.
Fertility - United Nations Population Division.
Notes Data not available.
x Indicates data that refer to years or periods other than those specified in the column heading, differ from the standard definition, or refer to only part of a country.
.12S 127

Index
AAdair, Linda S., 16adolescent pregnancy, 31advertising of infant formula, 47-48Africa, 10, 15
Bamako Initiative in, 25-27, 65-66children with HIV in, 19, 73early marriage by girls in, 31economic resources in, 35sanitation and stunting in, 26underweight women in, 17
agriculture, 82-83AIDS (acquired immune deficiency
syndrome), 17, 31, 71, 73
see also HIVanaemia, 10, 11, 15, 61-63, 72, 78
maternal deaths from, 75programme to control, 66tests for, 82vitamin A supplements and, 12
Arns, Zilda, 42Asia, 18
BBaby-Friendly Hospital Initiative
(BFH I), 48-51, 67, 77Bamako Initiative (Africa), 25-27, 65-66Bangladesh, 13, 29, 52-53, 56, 59, 60, 72
Barker, David, 77Begum, Marium, 52beta-carotene, 12birthweight, 78
see also low-birthweight babiesBlack, Robert, 72Bolivia, 64, 65Bosnia and Herzegovina, 80brain, development of, 21-23, 53Brazil, 17, 42-43, 49, 64breastfeeding, 28-29, 77
Baby-Friendly Hospital Initiative (BFHI)and, 48-51
complementary feeding and, 49-51during crises, 80HIV and, 30, 73ID scores and, 13nutrition and, 22-23stimulation in, 29vitamin A and, 60, 72
Ccalcium, 14, 76Canada, 54-57, 68Caribbean, 18caring practices, 27-31carotene, 61Cebu (Philippines), 16
128
Ceesay, Sana, 32Central Asian republics, 17Central Europe, 17child mortality
breastfeeding and, 22Convention on the Rights of the Child on, 21from malaria, 74in Oman, 40linked to malnutrition, 9, 11vitamin A supplements to reduce, 72
Child Pastorate (Brazil), 42-43Child Survival and Development (CSD)
Programme (Tanzania), 41-43, 51, 67
Chile, 50, 65China, 50-51chronic diseases, 10, 13, 77-78cognitive development, 11, 16, 29community involvement, 41-45, 69, 85
in Bangladesh, 52-53in Niger programme, 46-47in Oman, Triple A approach, 40in South African health services, 86through schools and education, 66
Consultative Group on International AgriculturalResearch, 83
Convention on the Elimination of All Forms ofDiscrimination against Women (1979),
Convention on the Rights of the Child (1989), 20,
21, 69
cretinism, 15, 54, 56Cuba, 50
Ddark adaptometry, 81David, Jorge, 65deaths
chronic disease as cause of, 77from malaria, 74from malnutrition, 9, 78-79of mothers, 11,12, 71-76see also child mortality
Declaration of the Rights of the Child(1924; 1959), 19-21
Declaration on the Right to Development(1986), 20
development (physical), 11, 21-22, 26
diabetes, 77, 78diarrhoea, 22, 28, 42, 58, 65, 72
diarrhoeal dehydration, 11diet
boosting vitamin A in, 60-61enrichment of, 82-83see also nutrition
discrimination against women, 11, 29, 39
disease, 10, 77-78
130
EEastern Europe, 17eclampsia, 75economic growth, nutrition and, 17, 19, 37-39economic resources, 34-35Ecuador, 73education, 15, 66eggs, 61
Egypt, 72
FF-100 milk, 79Fall, Caroline, 78families, impact of malnutrition on, 13feeding of children, 28flour, iron supplementation in, 61-65foetal development, 21-22folate deficiency, 10, 76, 83foods
during crises, 80enrichment of, 64-65, 82-83household food security and, 23-25, 37-39iron supplementation in, 61-63production, 68vitamin A in, 60-63
fortification of foods, 59-65, 82
Gabon, 49Gambia, 31, 32
gardening, 59-61Georgia (republic of), 15girls, early marriage by, 31government policies, 69, 87growth (physical)
iodine needed for, 53monitoring of, 41, 45-47stunting and, 15, 16, 26Triple A approach to, in Oman, 40see also development
growth failure, 14, 34Guatemala, 15, 60, 64, 75
Guinea, 66
HHaiti, 60, 80Health and Nutrition District Support (HANDS)
project (Tanzania), 44-45health of children, protection of, 28-29health services, 25-27, 63-66
during crises, 80-81in South Africa, 86-87
heart disease, 77Heavily Indebted Poor Countries (HIPC)
Debt Initiative, 35

height, 14-16see also stunting
Helen Keller International, 60-62helminth (worm) infections, 84HIV (human immunodeficiency virus), 19,23,30,
31,71,73-75hookworms, 63,75,84hospitals, Baby-Friendly Hospital Initiative
(BFHI) and, 48-51,77household food security, 23-25,37-39hygiene, 27,65
immune systemAIDS and, 31,71,73,75malaria and, 74nutritionally acquired immune deficiency
and, 71-73zinc and, 72,77
immunizations, 28,59,63India, 59,78,85Indonesia, 31,37,57,61-64infant formula, 47-48,80infant mortality, see child mortalityinfants
Baby-Friendly Hospital Initiative (BFHI)and, 48-51
breastfeeding of, 22-23,47-48,77HIV transferred to, 30
infections, 19,71intellectual development, 16-19
see also cognitive developmentInternational Code of Marketing of Breastmilk
Substitutes (1981), 48International Council for Control of Iodine
Deficiency Disorders (ICCIDD), 54International Covenant on Economic, Social
and Cultural Rights (19661, 20international human rights instruments, 20International Monetary Fund (IMF), 35intestinal worms, 83-85iodine, 14,64,79iodine deficiency disorders (IDD), 10,14,15,
51-58,79eliminated in Bolivia, 65in pregnant women, 76iodized salt for, 17testing for, 81-82
IQ scores, 11-13,15,22-23Iran, 51
Iringa (Tanzania), 45iron, 78iron deficiency anaemia, 11,14,15,61-63,
66,72,78iron supplements, 61
JJebb, Eglantyne, 20
KKazakstan, 17Kenya, 73,84Kiwanis International, 54,56-57kwashiorkor, 14
ILao People's Democratic Republic, 66Latin America, 18legislation, on food fortification, 64low-birthweight babies, 22,42
adult chronic diseases and, 77-78IQ scores of, 11nutritional intervention and, 32-33
Mmalaria, 10,63,66,72,74-75,83Malawi, 73Malaysia, 61malnutrition, 9-17,23-35,83-87
Child Pastorate programme on, 42-43Health and Nutrition District Support (Hands)
project (Tanzania) on, 44-45in Bangladesh, 52-53in Thailand, 45intellectual development linked to, 16measurement of, 14,79-82Niger programme on, 46-47nutritionally acquired immune deficiency
and, 71-73reducing deaths in emergency, 78-79research in, 68reversal of effects of, 17-19
marasmus (severe wasting), 14Martorell, Reynaldo, 26maternal height, 75maternal mortality, 11-13,75-76measles, 63
vitamin A and, 58,72Mebendazole (drug), 84mental impairments, 53,54,56Micronutrient Initiative, 54,61,62micronutrients, 10,14
immune system and, 71-73in foods, 64-65,82-83maternal deaths and, 76
Middle East, 18milk, 79minerals, 14miscarriages, 54Moldova, Republic of, 49mothers, 29-31
1 3 1
breastfeeding and health of, 77HIV transferred to children from, 73vitamin A supplementation for, 60
NNepal, 12 -13newborns
breastfeeding of, 47-51head circumference, 31low-birthweight babies, 22,32-33,78see also breastfeeding
Niger, 31,45-47,61,66night-blindness, 12,58-59nutrition, 17-19,20
action for improvement in, 83-87adult chronic disease and maternal, 78AIDS and, 73as right, 19-21,68-69boosting vitamin A in diet, 60-61breastfeeding and, 22-23,47-48child development and, 21-22combined approach to, 67-68during crises, 80-81economic growth and improved, 37-39enrichment of foods for, 64-65,82-83for pregnant women, 21,29,32-33immune system and, 71-73iodine deficiency disorders and, 51-58maternal deaths reduced by, 75-76social-sector spending and, 39status of women and, 39Tanzanian programmes on, 41-45Triple A approach to, in Oman, 40
nutritionally acquired immune deficiency, 71-73
0obstructed labour, 15,75Oman, 40,64oral rehydration salts (ORS), 79oral rehydration therapy (ORT), 65
PPakistan, 39Panama, 49Papua New Guinea, 74parasite-induced anaemia, 66Peru, 72,75Philippines, 16,60,64poverty, 10,34-35
as cause of malnutrition, 33-35chronic diseases and, 77household food security and, 25in Latin America and Caribbean, 19in South Africa, 86in United States, 15-17
129

pregnant womenin Bangladesh, malnutrition among, 52care received by, 31consequences of iodine deficiency disorders
in, 54
deaths of, 75-76foetal development and weight gain by, 22impact of malnutrition on, 11iron deficiency anaemia in, 61, 78malaria among, 10nutrition for, 21, 29, 32-33vitamin A supplements for, 12-13with HIV, 73
prenatal care, 12-13preventive health care, 27protein-energy malnutrition (PEM), 14
in Bangladesh, 52
RRio de Janeiro (Brazil), 42roundworms, 84rural areas, 25Russian Federation, 17
Ssalt, iodized, 17, 53, 54, 55, 56, 57, 64, 67, 79, 82
sanitation, 26, 27, 65schistosomes, 84Senegal, 31Shankar, Anuraj, 74social services, 39Solomons, Noel, 26South Africa, 64, 86-87South Asia, 10, 17, 26, 35, 39
South-East Asia, 17Sri Lanka, 39stunting, 15, 16, 26, 75
sanitation and, 26sub-Saharan Africa, see Africasugar, 60Sullivan, Kathleen, 57
TTanzania, 41-45, 51, 66, 67Thailand, 39, 45-47Triple A approach, 40, 41, 53, 67, 8020-20 Initiative, 39
UUNICEF
Baby-Friendly Hospital Initiative (BFHI) and, 50Child Pastorate (Brazil) and, 43iron supplements supplied by, 61on food fortified with vitamin A, 64on malaria control, 66
130
salt iodization and, 5420-20 Initiative of, 39vitamin A supplementation by, 59, 62
United Kingdom, 17United Nations, 20, 81United Nations Development Programme
(UNDP), 25United States, 15-17, 49, 76Universal Declaration of Human Rights (1948), 20urban areas, 25, 78
VVenezuela, 63-65Viet Nam, 31vitamin A, 71-73, 76
HIV and, 19, 73, 75in resistance to malaria, 74-75measurement of, 81
vitamin A deficiency, 10-14, 46, 58-59, 72-73, 76HIV and, 19, 73, 75
improving diet for, 60-61in Indonesia, 61-63
vitamin A supplements, 12-13, 29, 58-60, 62-63,67, 76
child deaths reduced by, 59-60, 72during crises, 80food fortified with, 64maternal deaths reduced by, 12-13
vitamin B, 83vitamin D, 14vitamin D deficiency, 10, 14vitamin and mineral deficiencies, 13, 14
wwater, 25, 26, 65weight
gained by pregnant women, 22, 31in assessment of malnutrition, 14in Tanzanian child nutrition programme, 41severe underweight in children, 15
whipworms, 84Wildman, Bob, 56-57women
anaemia among, 10, 11, 61, 78care and, 27-28discrimination against, 11, 29, 39empowerment of, 37household food security and, 25in Niger, 46-47in Tanzanian child nutrition programme, 43malnutrition and, 17nutrition and status of, 39pregnancy-related deaths of, 12, 75-76right to nutrition of, 21stunting among, 15see also pregnant women
132
work, during pregnancy, 31World Alliance for Breastfeeding Action
(WABA), 49World Bank, 35World Declaration and Plan of Action on the
Survival, Protection and Development ofChildren (1990), 20
World Health Assembly, 48World Health Organization, 11, 15, 48, 51, 54, 63,
66, 71, 75, 79World Summit for Children (1990), 14, 20, 21, 51,53
World Vision of South Africa, 86worms, intestinal, 83-85
Yajnik, Haitian, 78
zZidovudine (drug), 73Zimbabwe, 39zinc, 72-75, 77zinc deficiency, 72, 76, 77

Glossary
ACC/SCNHIV
PEM
Administrative Committee on Coordination/ human immunodeficiency virusprotein-energy malnutrition
Subcommittee on Nutrition
AIDSacquired immune deficiency syndrome
ICCIDDInternational Council for the Control of
Iodine Deficiency Disorders
U5MRunder-five mortality rate
UN
ALIMIDD
United Nations
Latin American Millers Associationiodine deficiency disorders
UNAIDS
ARIIFAD
Joint United Nations Programme on
acute respiratory infectionsInternational Fund for Agricultural HIV/AIDS
Development
BFHI
UNDP
Baby-Friendly Hospital Initiative IMFUnited Nations Development Programme
International Monetary Fund
BRAC
UNHCR
Bangladesh Rural AdvancementINCAP
Office of the United Nations High
CommitteeInstitute of Nutrition of Central America
Commissioner for Refugees
and Panama
CSD
UNICEF
Child Survival and DevelopmentIQ
United Nations Children's Fund
Programme (Tanzania)intelligence quotient
ECLAC
Economic Commission for Latin America
and the Caribbean
MCR
Medical Research Council (UK)
USAIDUnited States Agency for International
Development
MIWABA
FAOMicronutrient Initiative (Canada)
World Alliance for Breastfeeding Action
Food and AgricultureOrganization of the
United NationsNCHS
WFP
National Center for Health StatisticsWorld Food Programme
GDP
gross domestic productNGO
WHO
non-governmental organizationWorld Health Organization
GMPgrowth monitoring and promotion
ODA
official development assistance
GNP
gross national productORS
oral rehydration salts
HANDSHealth and Nutrition District Support
ORT
(Tanzania)oral rehydration therapy
Note: All dollars are US dollars.
133 1:

unicef 0UNICEF Headquarters3 UN Plaza
New York, NY 10017, USA
UNICEF Regional Office for EuropePalais des Nations
CH-1211 Geneva 10, Switzerland
UNICEF Regional Office forCentral and Eastern Europe,Commonwealth of Independent States,and Baltic States
Palais des Nations
CH-1211 Geneva 10, Switzerland
UNICEF Regional Office forEastern and Southern AfricaP.O. Box 44145
Nairobi, Kenya
UNICEF Regional Office forWest and Central AfricaP.O. Box 443
Abidjan 04, Cote d'Ivoire
UNICEF Regional Office for theAmericas and the CaribbeanApartado 7555Santa Fe de Bogota, Colombia
UNICEF Regional Office forEast Asia and the PacificP.O. Box 2-154
Bangkok 10200, Thailand
UNICEF Regional Office for theMiddle East and North AfricaP.O. Box 811721
11181 Amman, Jordan
UNICEF Regional Officefor South AsiaP.O. Box 5815
Lekhnath MargKathmandu, Nepal
UNICEF Office for JapanUN Headquarters Building8th floor53-70, Jingumae 5-chomeShibuya-kuTokyo 150, Japan
134

Malnutrition is largely a silent and invisible emergency, exacting a terrible tollon children and their families. The result of multiple causes, including a lackof food, common and preventable infections, inadequate care and unsafe water,it plays a role in more than half of the nearly 12 million deaths each year ofchildren under five in developing countries, a proportion unmatched since theBlack Death ravaged Europe in the 14th century. Malnutrition blunts intellectsand saps the productivity and potential of entire societies. Poverty, one of thecauses of malnutrition, is also a consequence, a tragic bequest by malnourishedparents to the next generation.
The State of the Worlds Children 1998 report details the scale of theloss and the steps being taken to stem it. Sentinels of progress are lighting theway: Nearly 60 per cent of the world's salt is now iodized, and millions of chil-dren every year are spared mental retardation as a result. Vitamin A supple-mentation is helping bolster disease resistance in children and may soonbecome an important measure in helping reduce maternal deaths around theworld. Communities are working together to identify their problems, decide ontheir options and take action, with women emerging to play leadership rolesthat spark numerous other changes in people's lives.
Children have the right, recognized in international law, to good nutri-tion. The world has the obligation to protect that right, building on both thegreat experience gained and the scientific knowledge achieved. Action is bothpossible and imperative.
OXFORD UNIVERSITY PRESS£6.95 net in UK $12.95 in USAISBN 0-19-829401-8

(9/92)
rs -4 CO 4-1- f S
U.S. DEPARTMENT OF EDUCATIONOffice of Educational Research and Improvement (OERI)
Educational Resources Information Center (ERIC)
NOTICE
REPRODUCTION BASIS
!ERIC'
This document is covered by a signed "Reproduction Release(Blanket)" form (on file within the ERIC system), encompassing allor classes of documents from its source organization and, therefore,does not require a "Specific Document" Release form.
This document is Federally-funded, or carries its own permission toreproduce, or is otherwise in the public domain and, therefore, maybe reproduced by ERIC without a signed Reproduction Releaseform (either "Specific Document" or "Blanket").

e
Malnutrition is largely a silent and invisible emergency, exacting a terrible tollon children and their families. The result of multiple causes, including a lackof food, common and preventable infections, inadequate care and unsafe water,it plays a role in more than half of the nearly 12 million deaths each year ofchildren under five in developing countries, a proportion unmatched since theBlack Death ravaged Europe in the 14th century. Malnutrition blunts intellectsand saps the productivity and potential of entire societies. Poverty, one of thecauses of malnutrition, is also a consequence, a tragic bequest by malnourishedparents to the next generation.
The State of the World's Children 1998 report details the scale of theloss and the steps being taken to stem it. Sentinels of progress are lighting theway: Nearly 60 per cent of the world's salt is now iodized, and millions of chil-dren every year are spared mental retardation as a result. Vitamin A supple-mentation is helping bolster disease resistance in children and may soonbecome an important measure in helping reduce maternal deaths around theworld. Communities are working together to identify their problems, decide ontheir options and take action, with women emerging to play leadership rolesthat spark numerous other changes in people's lives.
Children have the right, recognized in international law, to good nutri-tion. The world has the obligation to protect that right, building on both the.great..experiencegained..and.the. scientific .knowledge achieved...Action. is..both.possible and imperative.
UNIVERSITY PRESSn UK $12.95 in USA-829401-8