Embed Size (px)
Citation preview
HAL Id: hal-00547308https://hal.archives-ouvertes.fr/hal-00547308
Submitted on 16 Dec 2010
HAL is a multi-disciplinary open accessarchive for the deposit and dissemination of sci-entific research documents, whether they are pub-lished or not. The documents may come fromteaching and research institutions in France orabroad, or from public or private research centers.
L’archive ouverte pluridisciplinaire HAL, estdestinée au dépôt et à la diffusion de documentsscientifiques de niveau recherche, publiés ou non,émanant des établissements d’enseignement et derecherche français ou étrangers, des laboratoirespublics ou privés.
A DOUBLE-BLIND, RANDOMIZED CLINICALTRIAL OF THE EFFECT OF ω-3 FATTY ACIDS ON
OXIDATIVE STRESS OF PRETERM NEONATESFED THROUGH PARENTERAL NUTRITION
Maria Skouroliakou, Dimitris Konstantinou, Katerina Koutri, ChristinaKakavelaki, Maria Stathopoulou, Marina Antoniadi, Nikolaos Xemelidis,
Victoria Kona, Markantonis Sophia
To cite this version:Maria Skouroliakou, Dimitris Konstantinou, Katerina Koutri, Christina Kakavelaki, MariaStathopoulou, et al.. A DOUBLE-BLIND, RANDOMIZED CLINICAL TRIAL OF THE EFFECTOF ω-3 FATTY ACIDS ON OXIDATIVE STRESS OF PRETERM NEONATES FED THROUGHPARENTERAL NUTRITION. European Journal of Clinical Nutrition, Nature Publishing Group,2010, �10.1038/ejcn.2010.98�. �hal-00547308�
A DOUBLE-BLIND, RANDOMIZED CLINICAL TRIAL OF THE EFFECT
OF ω-3 FATTY ACIDS ON OXIDATIVE STRESS OF PRETERM NEONATES
FED THROUGH PARENTERAL NUTRITION
Running title: ω-3 effect on preterm neonates’ oxidative stress
Skouroliakou Maria, PhD1, Konstantinou Dimitris, MD2, Koutri Katerina, RD2,
Kakavelaki Christina, RD1, Stathopoulou Maria, MSc1, Antoniadi Marina, RN2,
Xemelidis Nikolaos, MSc3, Kona Victoria, RD1, Markantonis Sophia, PhD3
1 Harokopio University, Department of Nutrition and Dietetics, Athens, Greece
2 “IASO” maternity hospital, Neonates Intensive Care Unit, Athens, Greece
3 University of Athens, Faculty of Pharmacy, Laboratory of Biopharmaceutics and
Pharmacokinetics, Athens, Greece
Corresponding author:
Maria Skouroliakou
Assistant Professor in Enteral and Parenteral Nutrition, Harokopio University
GR 17.671, Eleutheriou Venizelou 70, Athens Greece
Phone:+30-6944147897, Fax: +30-2109549050
e-mail: [email protected]

There was no financial support for the study. The company Fresenius Kabi offered the
lipid emulsion SMOFlipid.
ABSTRACT
Background/Objectives: The aim of this study was to research and draw conclusions
about the effect of a parenteral nutrition (PN) fat emulsion, rich in ω-3 fatty acids, on
the antioxidant markers of preterm infants, when compared with a standard fat
emulsion. That was a double-blind, parallel-group study conducted in Athens, Greece,
using an equal randomisation method.
Subjects/Methods: Thirty eight infants were selected using a double-blind method
and one computer-generated randomization list. Both groups received PN based on
the same protocols. Group A received SMOFlipid fat emulsion, while group B
received the standard fat emulsion (Intralipid). Serum levels of vitamins A, E and total
antioxidant potential (TAP) were measured on days 0, 7 and 14 of PN support.
Clinical and biochemical data were collected on days 0, 14 and the day of discharge.
Results: Serum levels of vitamins E and A were significantly increased in group A,
while only vitamin A was increased in group B, on the 14th day (Group A: vitamin E:
p-value=0.002, vitamin A: p-value=0.000, Group B: vitamin E: p-value=0.065,
vitamin A: p-value=0.000). TAP was increased only in the intervention group (Group
A: p-value=0.000, Group B: p-value=0.287). Mild anaemia was developed in both
groups, while no differences were detected in infection rate, days of hospitalization,
days of ventilator support and days of phototherapy.
Conclusions: Oxidative stress was significantly reduced in those neonates fed with ω-
3 fatty acids, while no effect was observed in the neonates fed with standard lipids.
Intervention had no effect on infants’ growth and clinical outcome.

Keywords: preterm neonates, oxidative stress, total antioxidant potential, parenteral
nutrition, ω-3 fatty acids.
INTRODUCTION
Oxidative stress is caused due to the imbalance between the production of free
radicals and the efficacy of body’s antioxidant system (Maltepe & Saugstad, 2009).
Free radicals are extremely unstable molecules, produced in the body during
physiological metabolic processes. They tend to react with other molecules
(polyunsaturated fatty acids of cell membranes, proteins, polysaccharides, and nucleic
acids) causing structural alterations on molecular basis, functional abnormalities of
the cell and tissue damage (Blackburn, 2005, Saugstad, 1996).
Overproduction of free radicals is possible to occur during perinatal period due to
ischemia-reperfusion, arachidonic acid cascade, free iron, nitric oxide cascade,
phagocyte activation, hypoxia, hyperoxia (Saugstad, 2001). Preterm neonates are
more vulnerable to the effects of oxidative stress compared to term neonates. That is
both due to their exposure to a highly hyperoxic environment and their immature
antioxidant systems (Buonocore et al., 2002, Thibeault, 2000). Oxidative stress in
preterm neonates plays a significant role in a number of morbidity conditions
including respiratory distress syndrome, chronic lung diseases, retinopathy,
intracranial hemorrhage and necrotizing enterocolitis (Sharda, 2006).
Therefore, one of the basic goals in the treatment of preterm infants is the
minimization of oxidative stress, either by reducing the production of free radicals or
by augmenting antioxidant defense mechanisms (Perrone et al., 2007). The use of
certain ingredients in parenteral nutrition (PN) formulas has been suggested as a
method of enhancing neonates’ antioxidant defence mechanisms (Yeung, 2006,
Perrone et al., 2007). Although ω-3 polyunsaturated fatty acids have abilities of
lowering the potential for in vivo generation of free radicals, their ability to modulate
oxidative stress in preterm infants through PN has not been assessed. (Perrone et al.,
2007). Their use in PN formulas for preterm infants has been regarded as safe and
well tolerated (Calder et al., 2009).
The aim of the present study was to assess the effect of an ω-3 enriched PN lipid
emulsion, on the levels of antioxidant vitamins (A and E) and total antioxidant
potential (TAP) in preterm infants. The study was conducted applying a randomized,
double-blind method, according to which preterm infants treated with standard lipid
emulsions were the control group (Gibson et al., 2001, Uauy & Hoffman, 2000).
Preterm infants treated with SMOFlipid emulsion were the intervention group, for
which the hypothesis was that there would be a reduction in oxidative stress.
MATERIALS/ SUBJECTS AND METHODS
Study design
A double-blind, parallel-group study conducted in Athens, Greece, using an equal
randomisation method.
Subjects and Settings
Infants born in “IASO” Maternity Hospital in Athens, and admitted in the neonates’
Intensive Care Unit (ICU) were candidates to be included in the study. Inclusion
criteria were a) gestational age <32weeks, b) birth weight <1500g, c) admission in the
ICU within 12 hrs after birth, d) >80% of total energy would be taken in through PN,
during the first 8 days of life e) onset of fat administration through PN would be on
the 2nd day of life the latest, with maximum lipid dose equal to 3g/kg/day, f)
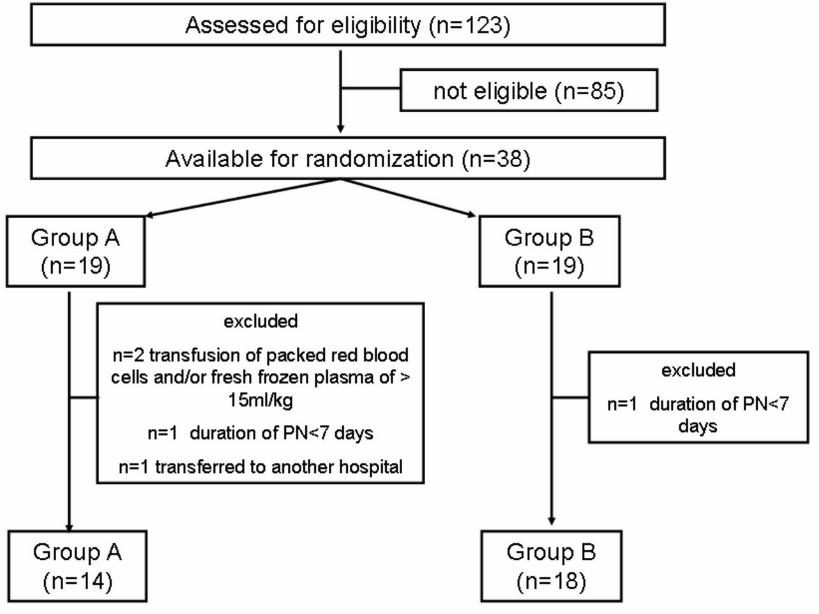
anticipated duration of PN would be >7days. Exclusion criteria included a) inherited
metabolic diseases, b) major congenital malformations, c) severe malformations of
visceral organs, kidneys, lungs or brain, d) participation in another drug research
study, e) transfusion of packed red blood cells and/or fresh frozen plasma > 15ml/kg.
All preterm neonates in IASO ICU were treated with ampicillin and gentamicin for
the first 10 days and then with amikacin and cefotaxime for the prevention of severe
infections.
The study protocol was approved by the Scientific and Ethical Committee of “IASO”
Maternity Hospital and the parents of the infants signed a consent form before infants’
enrolment in the study.
Sample size
Sample size calculation showed that in order to have a 0.8 power to detect a
significant difference (P = 0.05, two-sided) in the levels of antioxidant markers, 14
infants were required for each group.
Intervention
The preterm neonates were randomly divided into 2 groups, group A (intervention)
and group B (control), and received the two different PN treatments starting from the
day of birth (day 0).
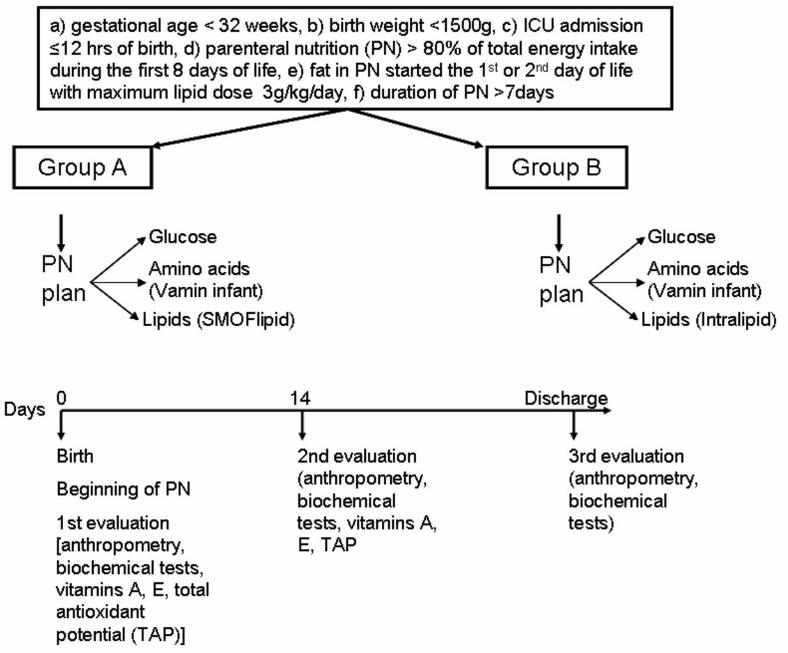
Four protocols had been created according to gestational age, birth weight, body
weight in the beginning of the parenteral support and clinical condition (Skouroliakou
et al., 2005). These were integrated into a software so that they could be used for
automatic calculations, design and production of individualized PN regimens and
were based on A.S.P.E.N guidelines (American Society of Parenteral and Enteral
Nutrition) (ASPEN, 1993, National Advisory Group on Standards and Practice
Guidelines for Parenteral Nutrition, 1997). For both subject groups, PN regimens
were designed and automatically produced based on these protocols (figure 1). Lipid
emulsion was added in the PN solution on the 1st or 2nd day of life, based on
gestational age. Macronutrients were provided, using the same products for glucose
and amino acid solutions in both groups. Amino acids derived from Vamin Infant
(Fresenius Kabi HELLAS, Athens, Greece). The source of fat was different for each
one of the two groups. Group A was administered SMOFlipid (Fresenius Kabi
HELLAS, Athens, Greece), a formulation containing MCTs (30%), lipids from soya
bean oil (30%), olive oil (25%) and fish oil (15%), while group B was administered
the standard lipid formulation with lipids from soya bean oil (Intralipid 20%,
Fresenius Kabi HELLAS, Athens, Greece). Infants in both groups had been receiving
the PN solutions for a trial period of at least 14 days, the end of which was when each
infant started oral feedings.
Enteral feeding was initiated as soon as possible, since it is considered as extremely
important for preterm neonates. However, the energy provided through oral feedings
was <20% of total energy intake.
Data and sample collection
Eligibility, based on the inclusion and exclusion criteria, was assessed by the
neonatologists of the ICU. A statistician used a computer-generated randomization
list. That was given to the pharmacist, who was responsible for the placement of each
infant in a group (intervention vs control) based on simple randomization procedures
(the computer-generated randomization list) and the preparation of the different PN
formulation in identical bags. The formulations were provided by the medical
personnel. The statistician and the pharmacist did not participate in infants’ care. All
medical personnel and participants were blinded to treatment assignment during the
whole course of study.
The primary aim, with respect to the effect of the different types of lipid emulsions,
was the reduction of oxidative stress in the intervention group as measured from
specific antioxidant markers (vitamins A, E, TAP). As second was the evaluation of
the effect of the different types of PN solutions on growth (body weight), blood count,
clinical condition and length of hospitalization.
Collection and assessment of data was performed on day 0 (date of birth and initiation
of PN), day 14 and at the time of discharge by the hospital. Collected data included
anthropometry (weight, length and head circumference), biochemical tests,
measurements of the levels of antioxidant vitamins and evaluation of TAP. TAP gives
the total amount of radicals that can be cleared by an antioxidant or a biological
sample, through the processes of radical scavenging, prevention of radical formation
and activation of antioxidant enzymes (Griffiths et al., 2002). Weight was measured
using a digital baby scale (WM2300, Weigh South, Inc., Asheville, North Carolina,
USA) with precision to 2g, crown-heel length was measured using a neonatometer
(Harpenden neonatometer, Holtain Ltd, Crymych, UK), and head circumference was
measured with a non-stretch tape. Blood tests were performed 6 hours after the
cessation of enteral nutrition and included complete blood count [hematocrit levels
(HCT), platelets, mean platelets volume (MPV), white blood cells (WBC)], c-reactive
protein (CRP), bilirubin and creatinine levels. Vitamins E and A were measured in
serum samples using HPLC techniques. An isocratic system was used, with HPLC
pump, injector and UV-detector (AGILENT 1100, Agilent Technologies, Inc, Santa
Clara, California, USA) using the appropriate reagent kits (Chromsystems Instruments
& Chemicals GmbH, Germany) for each reaction. Flow rate for vitamins A and E was
1.5ml/min. TAP was estimated using Bioxytech AOP-490 kit (OxisResearch, OXIS
Health Products, Inc., Portland, Oregon, USA). Vitamins E, A and TAP were assessed
on day 0, 7 and 14 of PN.
Medical data concerning gestational age, diagnosis, clinical conditions and
medications were collected from the medical records. Heart rate, blood pressure and
body temperature were daily monitored and recorded on days 0, 14 and at the time of
discharge. Data concerning the clinical condition, infection rate, days of ventilation
support and days of phototherapy were also collected. The number of days of PN
support as well as the total number of the days of hospitalization were recorded
(figure 1).
Statistical analysis
An independent t-test was used to compare the demographic characteristics of the two
groups at baseline (group A vs group B). A 2x2 analysis of variance with repeated
measures (RMANOVA) was used to assess the changes in the dependent variables
between the two groups over time (day 0 to day 14 and day 0 to the day of discharge).
The threshold for significance in all tests was set at P=0.05. Statistical analysis was
performed with SPSS for Windows, version 16 (SPSS Inc, Chicago, Illinois, USA).
All values are presented as mean±standard deviation.
RESULTS
Participants’ distribution and grouping are presented in the flow diagram in figure 2.
Recruitment was performed between November 2008 and April 2009. Neonates’
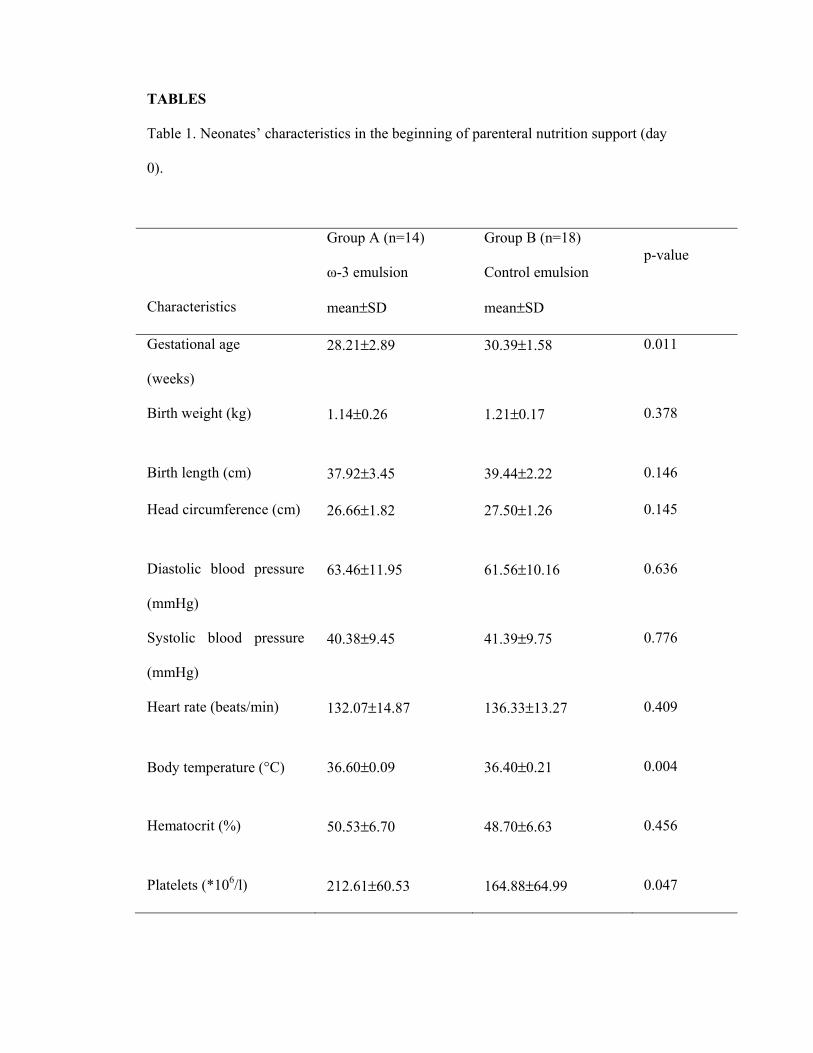
characteristics at birth are presented in table 1. Gestational age was lower in neonates
of group A compared to group B. Body weight was <10th centile for gestational age in
3 infants of group A (21%) and 4 infants of group B (22%). There were no differences
between the two groups concerning birth weight, length and head circumference. All
the other parameters were within normal ranges with the exception of blood pressure
that was low. Levels of vitamins A and E were below normal in both groups. Body
temperature, platelet concentration and vitamin A levels were higher in group A
compared to group B, while there were no differences between the two groups,
concerning other parameters.
Based on neonates’ gestational age, lipid emulsion was included in the PN plan on
their 2nd day of life. There was no statistically significant difference between the two
groups concerning the delivered constituents of PN (macro- and micronutrients) (table
2).
Three infants in group A and two in group B experienced an elevation of blood
glucose up to a maximum of 200mg/dl. In such cases, the reduction of glucose
delivery rate is recommended according to hospital’s protocol, so that blood glucose
levels switch to normal instantly. Therefore, glucose administration rate was
decreased by 4 gr/kg/day for a maximum of 3 days, until blood glucose levels were
normal and stable. Insulin was not administered in these cases of hyperglycemia.
The mean day of life for the onset of enteral nutrition (breast milk) was the same for
both groups (Group A: 8.56±4.67 days, Group B: 9.46 ±5.12 days, p-value: 0.702).
The volume and the rate of administration was not different between the two groups
(Group A: 31.78±17.19 ml, Group B: 21.03±12.15 ml, p-value: 0.208, Group A:
24.35±10.49 ml/kg, Group B: 16.76±9.52 ml/kg, p-value: 0.136 ). Also, enteral
nutrition was <20% of total daily energy intake, for the first 14 days of feeding.
Levels of vitamins E and TAP were significantly increased in group A, while in group
B only vitamin A was significantly increased (p-value<0.05, data not shown) on the
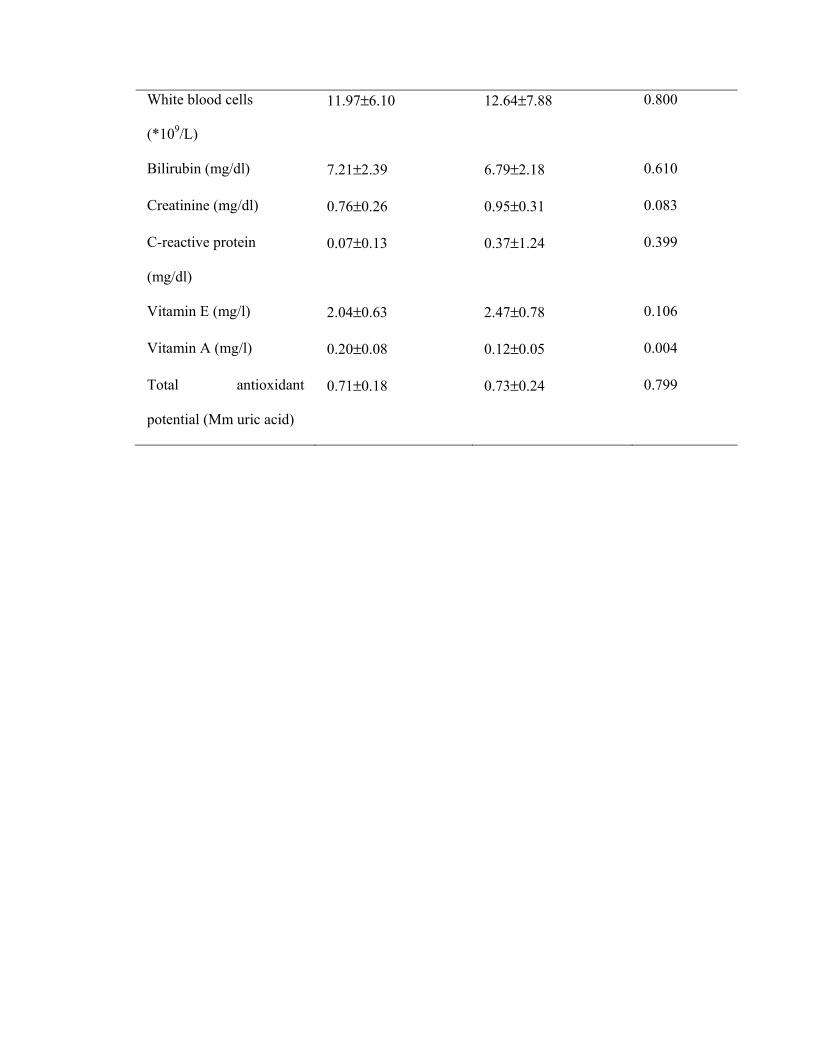
7th day of the intervention. Table 3 presents the results of the intervention on the 14th
day. Body weight was not significantly altered in any group. Blood pressure and heart
rate were significantly increased in both groups and at the same rate. Hematocrit was
decreased in both groups, again with no difference between them. Hematocrit values
were below normal ranges. Platelet values increased in both groups (within normal
ranges), while white blood cell count increased in group A, but still remained within
normal ranges. Creatinine decreased significantly in group B (within normal ranges).
Concerning vitamin levels, significant differences were observed between the two
groups. Vitamin E increased only in group A, whereas vitamin A increased in both
groups. However, there was no significant difference between the 2 groups
concerning vitamin E values, at the end of the 14th day. On the other hand, vitamin A
values were higher in group A compared to group B, at the end of the 14th day. This
could not be completely attributed to the different interventions because there was a
significant difference between vitamin A values in the beginning of PN. Also, the
repeated measures analysis revealed no time*group effect for vitamins E and A.
Interestingly, TAP was increased only in group A and the levels at the 14th day were
significantly higher in group A compared to group B. Also, significant time*group
effect was noticed regarding TAP levels (p-value=0.001).
Total days of PN (group A: 41.00±22.97, group B: 28.82±13.93, p-value=0.148) and
total days of hospitalization (group A: 54.00±24.81, group B: 58.94±21.55, p-
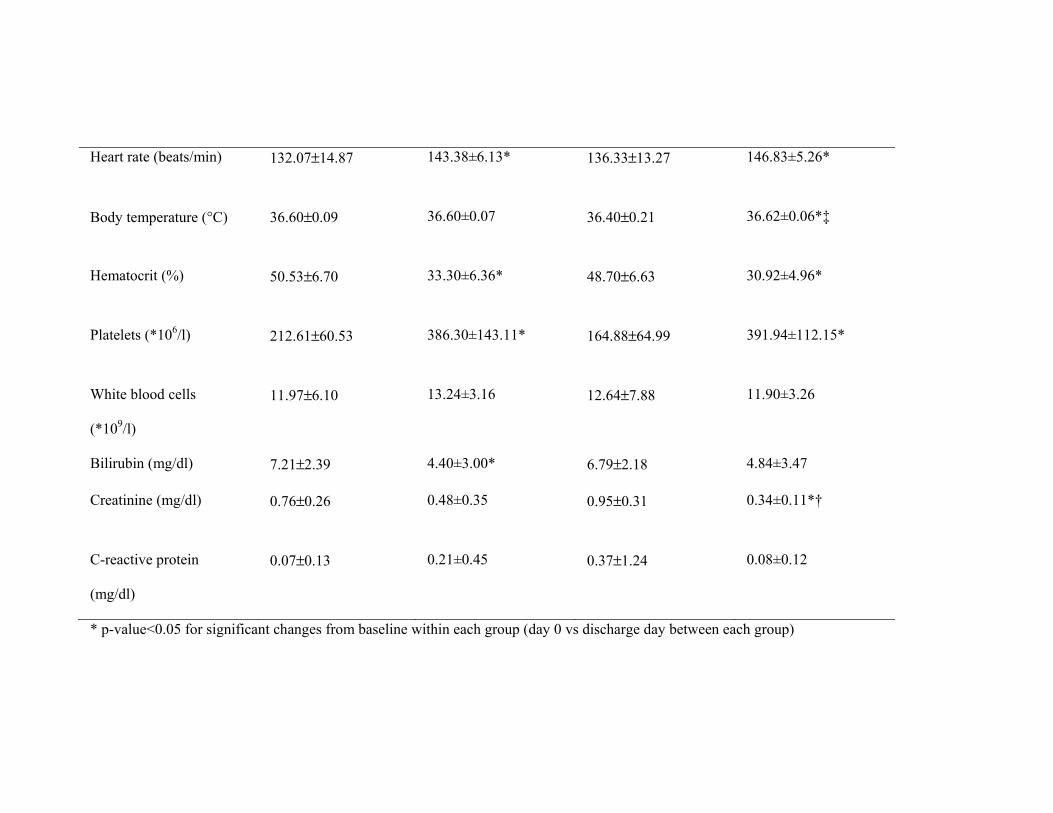
value=0.559) were the same for both groups. Table 4 presents information data for the
neonates in the beginning of the PN and upon discharge. Body weight, length, head
circumference, blood pressure and heart rate were significantly increased in both
group, but with no statistical significance between them. Hematocrit and creatinine
were decreased below normal ranges in both groups. There was no significant
difference in the type, dose and duration of antibiotic therapy (Group A: 39.50±22.69
days, Group B: 45.94±19.17 days, p-value=0.398), the days of ventilation support
(Group A: 12.20±8.18 days, Group B: 9.11±6.19 days, p-value=0.371), maximum
inspired oxygen fraction (Group A: 0.54±0.16%, Group B: 0.57±0.19% p-
value=0.538) and the days of phototherapy between the two groups (Group A:
6.36±4.08 days, Group B: 6.36±3.10 days, p-value=1.000). None of the children, in
any group, developed sepsis, and none manifested adverse effects attributed to the PN
formulation.
DISCUSSION
The primary aim of this study was to find the effects of ω-3 polyunsaturated fatty
acids on the antioxidant status of preterm infants, when those are administered
through PN. Intervention enhanced the antioxidant defence mechanisms in the group
that received the ω-3 lipid emulsion, compared to the group that received the standard
lipid emulsion.
In our sample, serum levels of vitamins A and E were below normal ranges at birth.
This is commonly observed in preterm neonates, probably due to the fact that their
adipose tissue stores are limited, and so are (Gitto et al., 2009, Debier, 2007, Orzalesi,
1987) alpha-tocopherol concentrations (alpha-tocopherol normally accumulates
during the 3rd trimester of pregnancy) (Mactier & Weaver, 2005). Both vitamins are
regarded as important biological antioxidants and their supplementation in preterm
neonates was documented many years ago (Orzalesi, 1987). Vitamin E
supplementation has been implicated in the prevention of bronchopulmonary
dysplasia and elevations in hemoglobin levels in preterm neonates (Petrich et al.,
1976) while vitamin A has been shown to prevent chronic lung disease,
bronchopulmonary dysplasia and sepsis (Atkinson, 2001, Tyson et al., 1999, Darlow
& Graham, 2007). In the present study, both groups were supplemented with the same
dose of fat soluble vitamins. However, only the group that received ω-3 fatty acids
increased their vitamin E serum levels. ω-3 fatty acids may have enhanced the
increase of vitamin E levels through the reduction of oxidative stress. Nevertheless,
on the 14th day, levels of vitamin E were not different between the two groups, despite
the fact that group A had lower vitamin E levels at baseline (not statistically
significant). Therefore, it seems that the intervention had a possible modest effect on
vitamin E, although the interpretation of the rise of vitamin E in group A is complex.
On the contrary, vitamin A was increased in both groups, in the same pattern.
Therefore, the intervention did not seem to have an effect on vitamin A status. Its
increase could be attributed to the supplementation with fat soluble vitamins. The
significant difference in vitamin A levels between the two groups, on the 14th day,
probably lies on the fact that serum levels of vitamin A were higher in group A since
birth.
The most interesting outcomes of the study were in reference with the changes in TAP
levels. These were increased only in the group that received ω-3 fatty acids and at the
14th day they were significantly higher in this group compared to the group that
received the standard lipid emulsion. The significant time*group effect on TAP levels
confirms the antioxidant effect of ω-3 fatty acids. TAP is a strong indicator of body’s
antioxidant defense potential. When oxidative stress is reduced, the body does not
consume its antioxidant molecules and therefore these are anticipated to accumulate in
the blood. Thus, the increase in TAP levels verified the reduction of oxidative stress
and since this was observed only in the intervention group, it could be assumed that
ω-3 fatty acids were responsible for the reduction of oxidative stress.
We are not aware of any studies where ω -3 fatty acids have been used in lipid
emulsions for PN, aiming at suppressing oxidative stress in preterm neonates. In
accordance with our study, Antebi et al showed that the use of the ω-3 enriched fat
emulsion SMOFlipid, in critically ill adult patients receiving PN, increased the levels
of antioxidant vitamins (especially vitamin E) (Antebi et al., 2004). Many randomized
clinical trials have assessed the effect of ω-3 fatty acid supplementation in terms of
visual and neural development in preterm infants and have shown that ω-3 have a
positive effect on these parameters. However, their effect on oxidative stress had not
been assessed (Gibsona et al., 2001). These results may be generalized to other
preterm infants population since the study sample included both sexes and a variety of
clinical conditions. Also, the population derived from a large Maternity Hospital,
where a significant proportion of preterm neonates from the whole country are born.
Growth was not affected by the intervention. Also, there was no significant difference
between the two groups concerning clinical characteristics. Neonates in both groups
developed mild anemia of prematurity, which is a common finding in preterm
neonates (Salsbury, 2001). Finally, the intervention had no effect on their clinical
outcome since there were no differences between the groups regarding infection rate,
days of hospitalization, days of ventilation support and days of phototherapy.
A limitation of the study was the small sample studied. Due to the characteristics of
the population and the severity of the exclusion criteria, the recruitment of a larger
number of participants was extremely difficult. Another limitation was the assessment
of a small number of biomarkers of oxidative stress, a fact that could limit results’
interpretation. However, the amount of blood available for our research was limited
due to the age of the sample studied.
In conclusion, administration of an ω-3 enriched PN fat emulsion resulted in
significant increase in vitamin E and TAP levels in preterm neonates during a 14 day
period of monitoring. Thus, the intervention resulted in decrease in the oxidative
stress due to the antioxidant effect of ω-3 fatty acids. No effects of ω-3 fatty acids
were observed concerning growth and clinical outcomes. These results have to be
verified through other studies using a larger number of samples.
ACKNOWLEDGEMENTS
We would like to thank the company Fresenius Kabi for offering the lipid emulsions
that were used for the intervention group (SMOFlipid). We also would like to thank
Mandy Persidi for editing the final version of the manuscript.
CONFLICT OF INTEREST
Authors declare no conflicts of interest.
REFERENCES
A.S.P.E.N. Board of Directors (1993). Nutrition support for low birth weight infants.
JPEN J Parent Enteral Nutr 17, 33SA-38SA.
Antebi H, Mansoor O, Ferrier C, Tetegan M, Morvan C, Rangaraj J, et al (2004).
Liver Function and Plasma Antioxidant Status in Intensive Care Unit Patients
Requiring Total Parenteral Nutrition: Comparison of 2 Fat Emulsions. JPEN J
Parenter Enteral Nutr 28, 142-148.
Atkinson SA (2001). Special nutritional needs of infants for prevention of and
recovery from bronchopulmonary dysplasia. J Nutr 131, 942S-946S.
Blackburn S (2005). Free radicals in perinatal and neonatal care, Part 1: the basics. J
Perinat Neonatal Nurs 19, 298-300.
Buonocore G, Perrone S, Longini M, Vezzosi P, Marzocchi B, Paffetti P, et al (2002).
Oxidative stress in preterm neonates at birth and on the seventh day of life. Pediatr
Res 52, 46–49.
Calder PC, Jensen GL, Koletzko BV, Singer P, Wanten GJA (2010). Lipid emulsions
in parenteral nutrition of intensive care patients: current thinking and future
directions. Intensive Care Med 36, 735-749.
Darlow BA, Graham PJ (2007). Vitamin A supplementation for preventing morbidity
and mortality in very low birthweight infants. Cochrane Database Syst Rev 4.
Debier C (2007). Vitamin E during pre- and postnatal periods. Vitam Horm 76, 357-
373.
Gibson RA, Chen W, Makrides M (2001). Randomized trials with polyunsaturated
fatty acid interventions in preterm and term infants: functional and clinical outcomes.
Lipids 36:873-883.
Gibsona RA, Chenb W, Makrides M (2001). Randomized trials with polyunsaturated
fatty acid interventions in preterm and term infants: functional and clinical outcomes.
Lipids 36, 873–883.
Gitto E, Pellegrino S, Gitto P, Barberi I, Reiter RJ (2009). Oxidative stress of the
newborn in the pre- and postnatal period and the clinical utility of melatonin. J Pineal
Res 46, 128-139.
Griffiths HR, Moller L, Bartosz G, Bast A, Bertoni-Freddari C, Collins A, et al
(2002). Biomarkers. Mol Aspects Med 23, 101-208.
Mactier H, Weaver LT (2005). Vitamin A and preterm infants: what we know, what
we don’t know, and what we need to know. Arch Dis Child Fetal Neonatal Ed 90,
103-108.
Maltepe E, Saugstad OD (2009). Oxygen in health and disease: regulation of oxygen
homeostasis--clinical implications. Pediatr Res 65, 261-268.
National Advisory Group on Standards and Practice Guidelines for Parenteral
Nutrition (1997). Safe Practices for parenteral nutrition formulations. JPEN J Parent
Enteral Nutr 22, 49-66.
Orzalesi M (1987). Vitamins and the premature. Biol Neonate 52 (suppl 1), 97-112.
Perrone S, Salvi G, Bellieni CV, Buonocore G (2007). Oxidative stress and nutrition
in the preterm newborn. J Pediatr Gastroenterol Nutr 45, S178-S182.
Petrich C, Voss HV, Lietke K, Gobel U (1976). Vitamin E concentrations in term and
preterm newborns and their clinical course. Eur J Pediatr 122, 275-279.
Salsbury DC (2001). Anemia of prematurity. Neonatal Netw 20, 13-20.
Saugstad OD (1996). Mechanism of tissue injury by oxygen radicals: implications for
neonatal disease. Acta Pediatr 85, 1-4.
Saugstad OD (2001). Update of oxygen radical disease in neonatology. Curr Opin
Obstet Gynecol 13, 147-153.
Sharda B (2006). Free radicals: Emerging challenge in environmental health research
in childhood and neonatal disorders. Int J Environ Res Public Health 3, 286-291.
Skouroliakou M, Konstantinou D, Papasarantopoulos P, Matthaiou C (2005).
Computer assisted total parenteral nutrition for pre-term and sick term neonates.
Pharm World Sci 27, 305-310.
Thibeault DW (2000). The precarious antioxidant defenses of the preterm infant. Am J
Perinat 17, 167-181.
Tyson JE, Wright LL, Oh W, Kennedy KA, Mele L, Ehrenkranz RA, et al (1999).
Vitamin A supplementation for extremely-low-birth-weight infants. National Institute
of Child Health and Human Development Neonatal Research Network. N Engl J Med
340, 1962-1968.
Uauy R, Hoffman DR (2000). Essential fat requirements of preterm infants. Am J Clin
Nutr 71, 245S-250S.
Valentine CJ, Puthoff TD (2007). Enhancing parenteral nutrition therapy for neonates.
Nutr Clin Pract 22, 183-193.
Yeung MY (2006). Influence of early postnatal nutritional management on oxidative
stress and antioxidant defense in extreme prematurity. Acta Pediatr 95, 153-163.
TABLES
Table 1. Neonates’ characteristics in the beginning of parenteral nutrition support (day
0).
Group A (n=14)
ω-3 emulsion
Group B (n=18)
Control emulsion p-value
Characteristics mean±SD mean±SD
Gestational age
(weeks)
28.21±2.89 30.39±1.58 0.011
Birth weight (kg) 1.14±0.26 1.21±0.17 0.378
Birth length (cm) 37.92±3.45 39.44±2.22 0.146
Head circumference (cm) 26.66±1.82 27.50±1.26 0.145
Diastolic blood pressure
(mmHg)
63.46±11.95 61.56±10.16 0.636
Systolic blood pressure
(mmHg)
40.38±9.45 41.39±9.75 0.776
Heart rate (beats/min) 132.07±14.87 136.33±13.27 0.409
Body temperature (°C) 36.60±0.09 36.40±0.21 0.004
Hematocrit (%) 50.53±6.70 48.70±6.63 0.456
Platelets (*106/l) 212.61±60.53 164.88±64.99 0.047
White blood cells
(*109/L)
11.97±6.10 12.64±7.88 0.800
Bilirubin (mg/dl) 7.21±2.39 6.79±2.18 0.610
Creatinine (mg/dl) 0.76±0.26 0.95±0.31 0.083
C-reactive protein
(mg/dl)
0.07±0.13 0.37±1.24 0.399
Vitamin E (mg/l) 2.04±0.63 2.47±0.78 0.106
Vitamin A (mg/l) 0.20±0.08 0.12±0.05 0.004
Total antioxidant
potential (Mm uric acid)
0.71±0.18 0.73±0.24 0.799
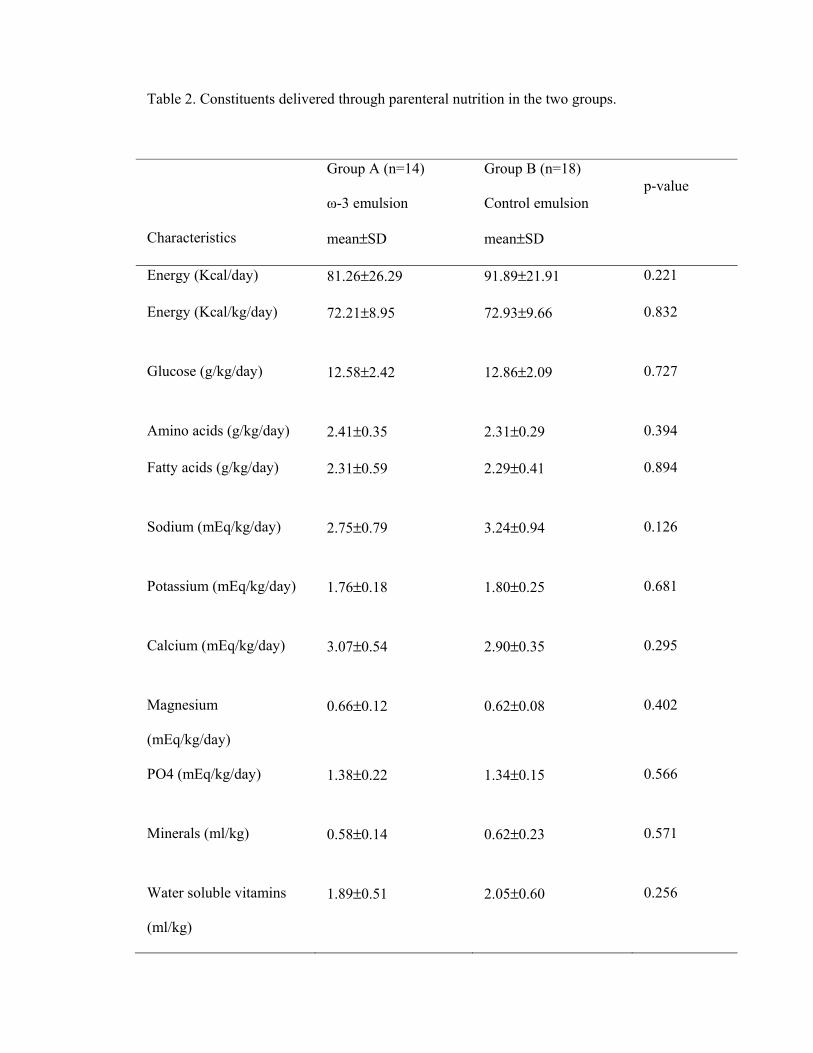
Table 2. Constituents delivered through parenteral nutrition in the two groups.
Group A (n=14)
ω-3 emulsion
Group B (n=18)
Control emulsion p-value
Characteristics mean±SD mean±SD
Energy (Kcal/day) 81.26±26.29 91.89±21.91 0.221
Energy (Kcal/kg/day) 72.21±8.95 72.93±9.66 0.832
Glucose (g/kg/day) 12.58±2.42 12.86±2.09 0.727
Amino acids (g/kg/day) 2.41±0.35 2.31±0.29 0.394
Fatty acids (g/kg/day) 2.31±0.59 2.29±0.41 0.894
Sodium (mEq/kg/day) 2.75±0.79 3.24±0.94 0.126
Potassium (mEq/kg/day) 1.76±0.18 1.80±0.25 0.681
Calcium (mEq/kg/day) 3.07±0.54 2.90±0.35 0.295
Magnesium
(mEq/kg/day)
0.66±0.12 0.62±0.08 0.402
PO4 (mEq/kg/day) 1.38±0.22 1.34±0.15 0.566
Minerals (ml/kg) 0.58±0.14 0.62±0.23 0.571
Water soluble vitamins
(ml/kg)
1.89±0.51 2.05±0.60 0.256

Lipid soluble vitamins
(ml/kg)
4.74±1.14 5.20±1.23 0.448
Fluid volume (ml/kg/day) 142.48±20.29 139.10±18.34 0.625
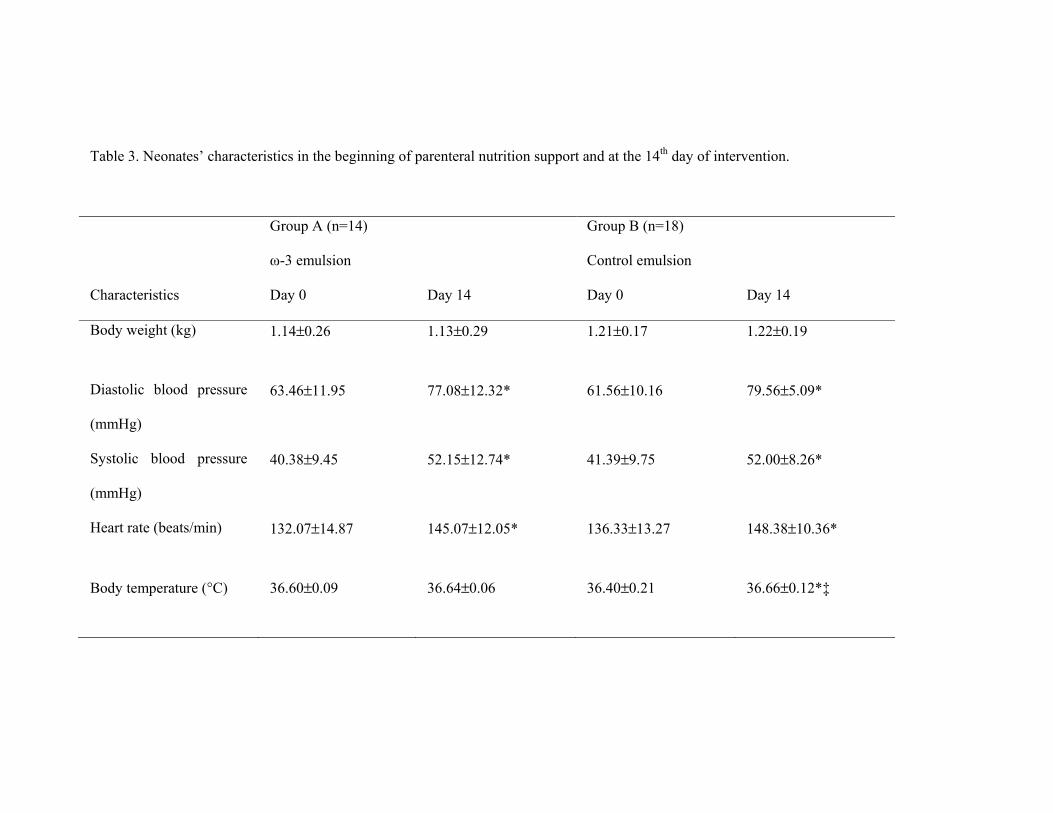
Table 3. Neonates’ characteristics in the beginning of parenteral nutrition support and at the 14th day of intervention.
Group A (n=14)
ω-3 emulsion
Group B (n=18)
Control emulsion
Characteristics Day 0 Day 14 Day 0 Day 14
Body weight (kg) 1.14±0.26 1.13±0.29 1.21±0.17 1.22±0.19
Diastolic blood pressure
(mmHg)
63.46±11.95 77.08±12.32* 61.56±10.16 79.56±5.09*
Systolic blood pressure
(mmHg)
40.38±9.45 52.15±12.74* 41.39±9.75 52.00±8.26*
Heart rate (beats/min) 132.07±14.87 145.07±12.05* 136.33±13.27 148.38±10.36*
Body temperature (°C) 36.60±0.09 36.64±0.06 36.40±0.21 36.66±0.12*‡
Hematocrit (%) 50.53±6.70 38.03±4.73* 48.70±6.63 36.43±3.51*
Platelets (*106/l) 212.61±60.53 365.23±159.23* 164.88±64.99 316.27±89.75*
White blood cells
(*109/l)
11.97±6.10 17.30±7.00* 12.64±7.88 14.95±5.21
Bilirubin (mg/dl) 7.21±2.39 5.85±2.61 6.79±2.18 6.13±2.72
Creatinine (mg/dl) 0.76±0.26 0.66±0.19 0.95±0.31 0.62±0.30*
C-reactive protein
(mg/dl)
0.07±0.13 0.15±0.20 0.37±1.24 0.19±0.27
Vitamin E (mg/l) 2.04±0.63 2.55±0.71* 2.47±0.78 2.68±0.99
Vitamin A (mg/l) 0.20±0.08 0.26±0.06* 0.12±0.05 0.19±0.07*†
Total antioxidant
potential (Mm uric acid)
0.71±0.18 1.086±0.29* 0.73±0.24 0.79±0.16†‡
* p-value<0.05 for significant changes from baseline within each group (day 0 vs day 14th between each group)

† p-value<0.05 for significant differences between values of the 2 groups at the end of the 14th day
‡ p-value<0.05 for time x group effect
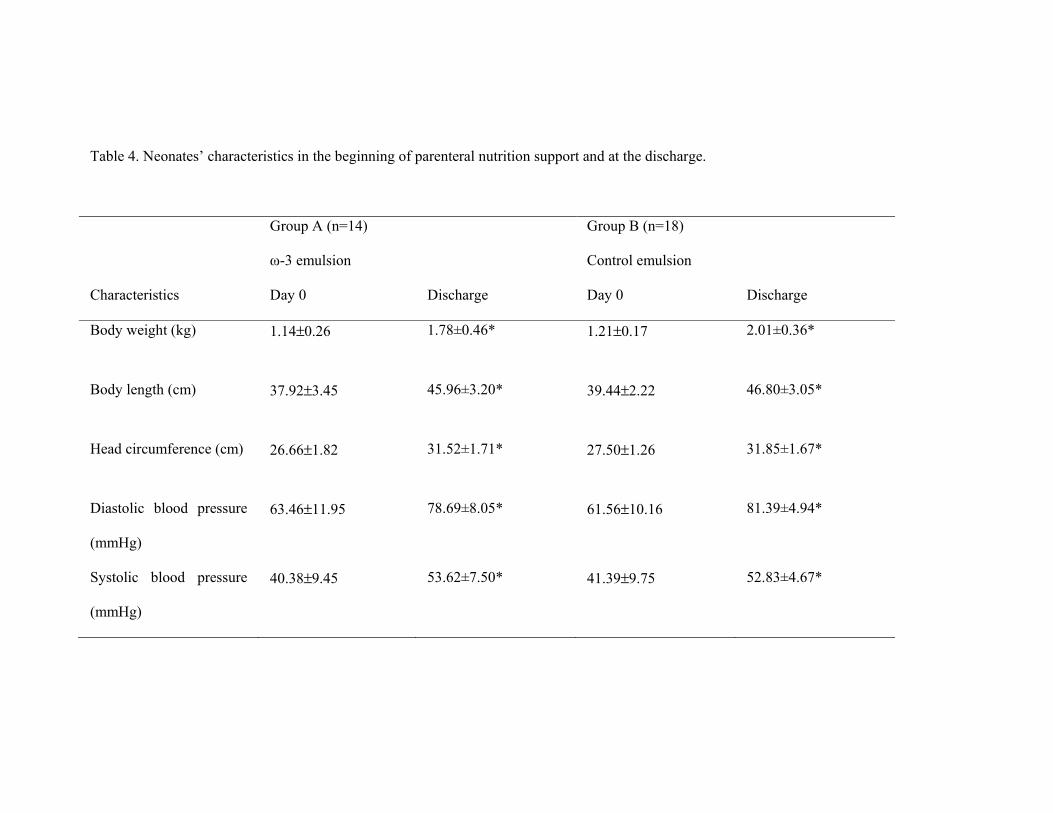
Table 4. Neonates’ characteristics in the beginning of parenteral nutrition support and at the discharge.
Group A (n=14)
ω-3 emulsion
Group B (n=18)
Control emulsion
Characteristics Day 0 Discharge Day 0 Discharge
Body weight (kg) 1.14±0.26 1.78±0.46* 1.21±0.17 2.01±0.36*
Body length (cm) 37.92±3.45 45.96±3.20* 39.44±2.22 46.80±3.05*
Head circumference (cm) 26.66±1.82 31.52±1.71* 27.50±1.26 31.85±1.67*
Diastolic blood pressure
(mmHg)
63.46±11.95 78.69±8.05* 61.56±10.16 81.39±4.94*
Systolic blood pressure
(mmHg)
40.38±9.45 53.62±7.50* 41.39±9.75 52.83±4.67*
Heart rate (beats/min) 132.07±14.87 143.38±6.13* 136.33±13.27 146.83±5.26*
Body temperature (°C) 36.60±0.09 36.60±0.07 36.40±0.21 36.62±0.06*‡
Hematocrit (%) 50.53±6.70 33.30±6.36* 48.70±6.63 30.92±4.96*
Platelets (*106/l) 212.61±60.53 386.30±143.11* 164.88±64.99 391.94±112.15*
White blood cells
(*109/l)
11.97±6.10 13.24±3.16 12.64±7.88 11.90±3.26
Bilirubin (mg/dl) 7.21±2.39 4.40±3.00* 6.79±2.18 4.84±3.47
Creatinine (mg/dl) 0.76±0.26 0.48±0.35 0.95±0.31 0.34±0.11*†
C-reactive protein
(mg/dl)
0.07±0.13 0.21±0.45 0.37±1.24 0.08±0.12
* p-value<0.05 for significant changes from baseline within each group (day 0 vs discharge day between each group)

† p-value<0.05 for the comparison within groups (discharge)
‡ p-value<0.05 for time x group effect

FIGURE LEGENDS
Figure 1. Study design
Figure 2. Participant flow diagram


![Results of the double-blind randomized controlled trial ... · procedure—excisional hemorrhoidectomy—causes the most pain to the patient [1]. Two recent large randomized trials](https://img.pdfslide.net/doc/110x75/5e80e7c9f642be310c605b5d/results-of-the-double-blind-randomized-controlled-trial-procedureaexcisional.jpg)