Embed Size (px)
Citation preview

A Dragging Recovery
Dr. Rajeev Dhawan Director
FORECAST OF THE NATION FEBRUARY 2011
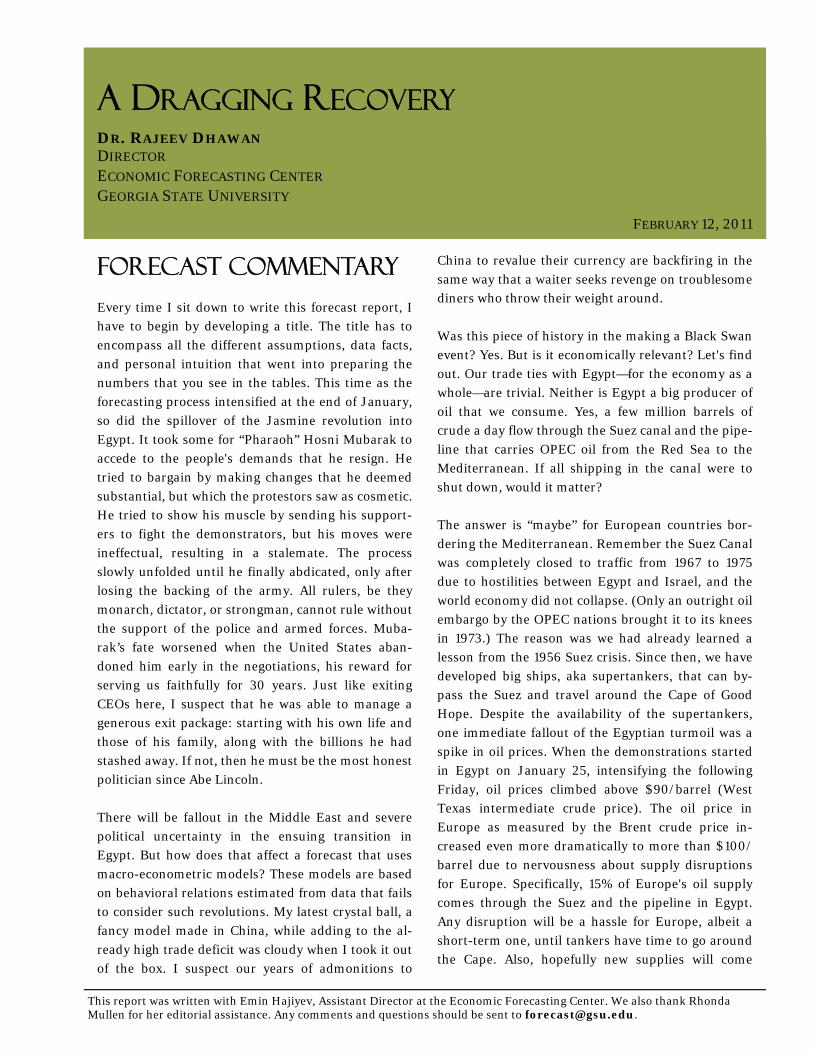
A DRAGGING RECOVERY DR. RAJEEV DHAWAN DIRECTOR ECONOMIC FORECASTING CENTER GEORGIA STATE UNIVERSITY
FORECAST COMMENTARY
Every time I sit down to write this forecast report, I
have to begin by developing a title. The title has to
encompass all the different assumptions, data facts,
and personal intuition that went into preparing the
numbers that you see in the tables. This time as the
forecasting process intensified at the end of January,
so did the spillover of the Jasmine revolution into
Egypt. It took some for “Pharaoh” Hosni Mubarak to
accede to the people's demands that he resign. He
tried to bargain by making changes that he deemed
substantial, but which the protestors saw as cosmetic.
He tried to show his muscle by sending his support-
ers to fight the demonstrators, but his moves were
ineffectual, resulting in a stalemate. The process
slowly unfolded until he finally abdicated, only after
losing the backing of the army. All rulers, be they
monarch, dictator, or strongman, cannot rule without
the support of the police and armed forces. Muba-
rak’s fate worsened when the United States aban-
doned him early in the negotiations, his reward for
serving us faithfully for 30 years. Just like exiting
CEOs here, I suspect that he was able to manage a
generous exit package: starting with his own life and
those of his family, along with the billions he had
stashed away. If not, then he must be the most honest
politician since Abe Lincoln.
There will be fallout in the Middle East and severe
political uncertainty in the ensuing transition in
Egypt. But how does that affect a forecast that uses
macro-econometric models? These models are based
on behavioral relations estimated from data that fails
to consider such revolutions. My latest crystal ball, a
fancy model made in China, while adding to the al-
ready high trade deficit was cloudy when I took it out
of the box. I suspect our years of admonitions to
China to revalue their currency are backfiring in the
same way that a waiter seeks revenge on troublesome
diners who throw their weight around.
Was this piece of history in the making a Black Swan
event? Yes. But is it economically relevant? Let's find
out. Our trade ties with Egypt—for the economy as a
whole—are trivial. Neither is Egypt a big producer of
oil that we consume. Yes, a few million barrels of
crude a day flow through the Suez canal and the pipe-
line that carries OPEC oil from the Red Sea to the
Mediterranean. If all shipping in the canal were to
shut down, would it matter?
The answer is “maybe” for European countries bor-
dering the Mediterranean. Remember the Suez Canal
was completely closed to traffic from 1967 to 1975
due to hostilities between Egypt and Israel, and the
world economy did not collapse. (Only an outright oil
embargo by the OPEC nations brought it to its knees
in 1973.) The reason was we had already learned a
lesson from the 1956 Suez crisis. Since then, we have
developed big ships, aka supertankers, that can by-
pass the Suez and travel around the Cape of Good
Hope. Despite the availability of the supertankers,
one immediate fallout of the Egyptian turmoil was a
spike in oil prices. When the demonstrations started
in Egypt on January 25, intensifying the following
Friday, oil prices climbed above $90/barrel (West
Texas intermediate crude price). The oil price in
Europe as measured by the Brent crude price in-
creased even more dramatically to more than $100/
barrel due to nervousness about supply disruptions
for Europe. Specifically, 15% of Europe's oil supply
comes through the Suez and the pipeline in Egypt.
Any disruption will be a hassle for Europe, albeit a
short-term one, until tankers have time to go around
the Cape. Also, hopefully new supplies will come
FEBRUARY 12, 2011
This report was written with Emin Hajiyev, Assistant Director at the Economic Forecasting Center. We also thank Rhonda Mullen for her editorial assistance. Any comments and questions should be sent to [email protected].
A dragging recovery
2 Economic Forecasting Center
from Russia, the largest supplier of oil to Europe.
Since the initial jump, oil prices have not risen fur-
ther, but neither have they retreated much.
High oil prices influence the mood of consumers
from the daily irritation of paying more at the pump
to nervousness about the future availability of oil
(and being able to afford it). If prices escalate sud-
denly in response to a real or perceived problem, the
result is a negative effect on both consumer and busi-
ness confidence. The biggest unknown is how the
Egyptian change of regime will affect other regimes
in the region, especially the oil producers who hap-
pen to have either monarchies or autocratic regimes
hostile to the West. But barring a cataclysmic top-
pling of major oil producing regimes in the Middle
East (with the exception of Jordan or Syria), we
should not be worried about oil crossing $100/barrel
on a sustained basis in the coming quarters. These
political Black Swan events, if they happen, will work
through the oil price channel. And the oil price is still
above $85/barrel. It was only $20/barrel in 2002.
But why is the oil price so high and will remain high?
The short answer is China's booming demand for oil
to produce goods for export to the West, namely the
United States. (We all know the origin of the products
in Walmart!) While American consumers may have
economized on oil consumption by substituting etha-
nol and undertaking energy efficiency measures, we
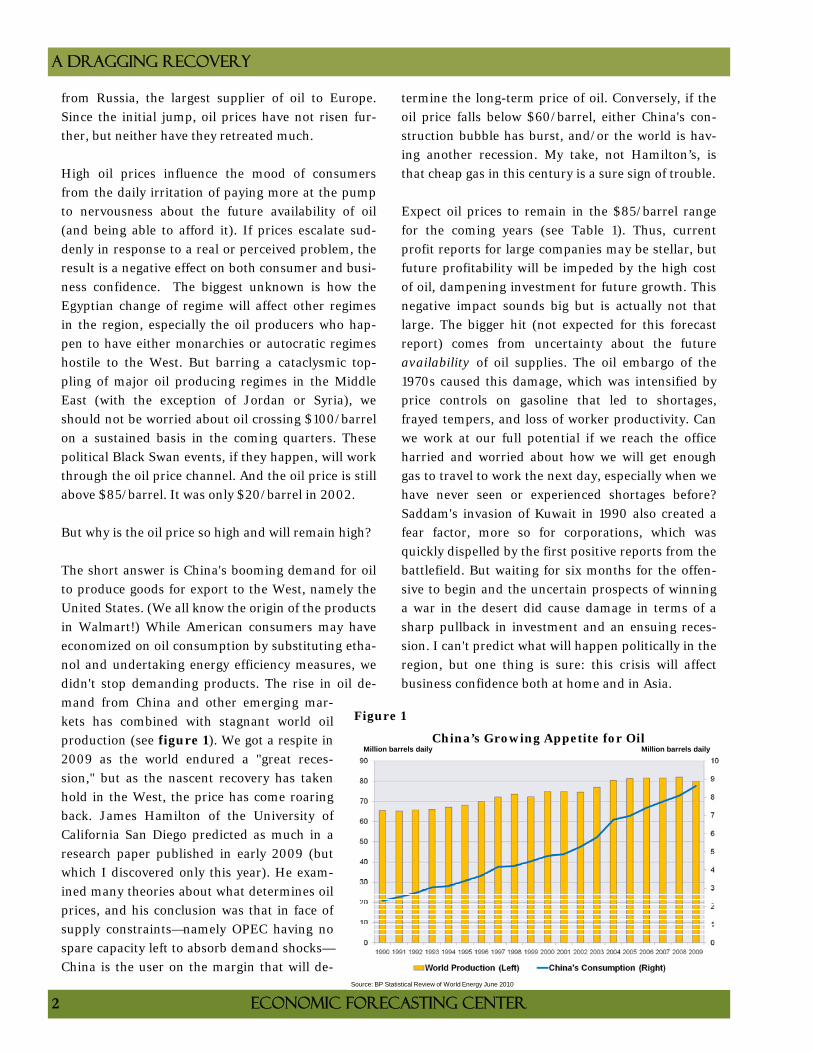
didn't stop demanding products. The rise in oil de-
mand from China and other emerging mar-
kets has combined with stagnant world oil
production (see figure 1). We got a respite in
2009 as the world endured a "great reces-
sion," but as the nascent recovery has taken
hold in the West, the price has come roaring
back. James Hamilton of the University of
California San Diego predicted as much in a
research paper published in early 2009 (but
which I discovered only this year). He exam-
ined many theories about what determines oil
prices, and his conclusion was that in face of
supply constraints—namely OPEC having no
spare capacity left to absorb demand shocks—
China is the user on the margin that will de-
termine the long-term price of oil. Conversely, if the
oil price falls below $60/barrel, either China's con-
struction bubble has burst, and/or the world is hav-
ing another recession. My take, not Hamilton’s, is
that cheap gas in this century is a sure sign of trouble.
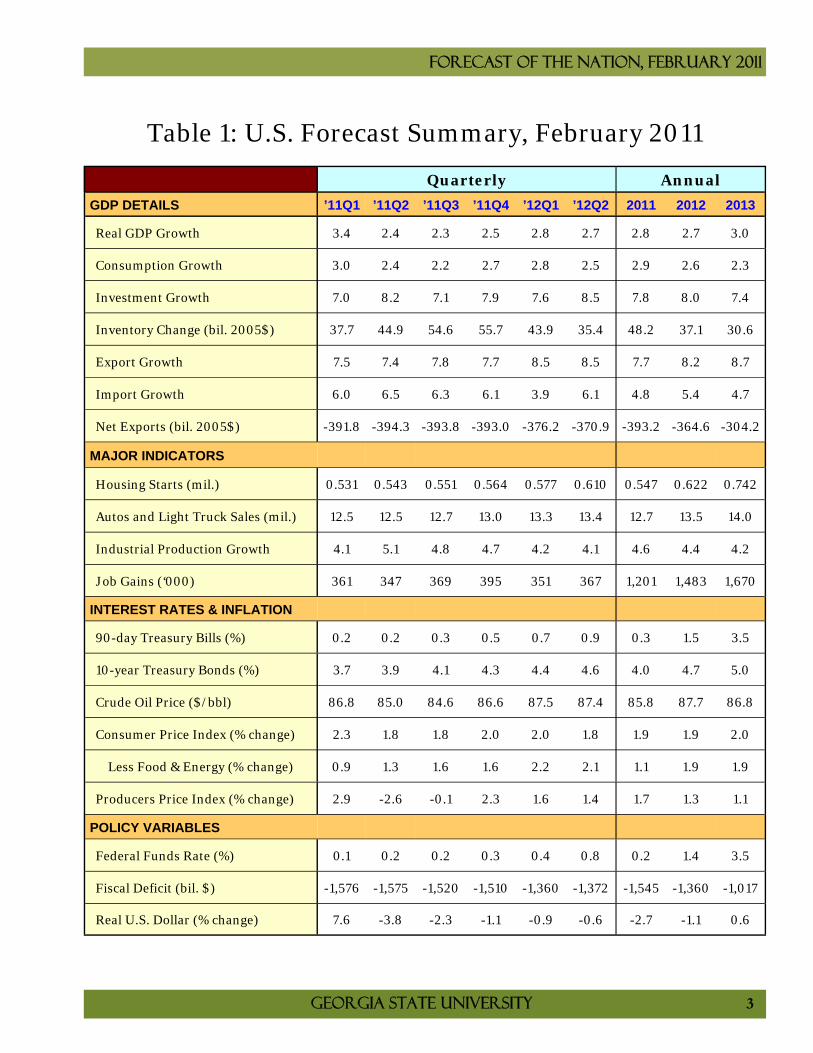
Expect oil prices to remain in the $85/barrel range
for the coming years (see Table 1). Thus, current
profit reports for large companies may be stellar, but
future profitability will be impeded by the high cost
of oil, dampening investment for future growth. This
negative impact sounds big but is actually not that
large. The bigger hit (not expected for this forecast
report) comes from uncertainty about the future
availability of oil supplies. The oil embargo of the
1970s caused this damage, which was intensified by
price controls on gasoline that led to shortages,
frayed tempers, and loss of worker productivity. Can
we work at our full potential if we reach the office
harried and worried about how we will get enough
gas to travel to work the next day, especially when we
have never seen or experienced shortages before?
Saddam's invasion of Kuwait in 1990 also created a
fear factor, more so for corporations, which was
quickly dispelled by the first positive reports from the
battlefield. But waiting for six months for the offen-
sive to begin and the uncertain prospects of winning
a war in the desert did cause damage in terms of a
sharp pullback in investment and an ensuing reces-
sion. I can't predict what will happen politically in the
region, but one thing is sure: this crisis will affect
business confidence both at home and in Asia.
Figure 1
Million barrels daily Million barrels dailyChina’s Growing Appetite for Oil
Source: BP Statistical Review of World Energy June 2010
Forecast of the Nation, February 2011
Georgia State University 3
Table 1: U.S. Forecast Summary, February 2011
Annual
GDP DETAILS ’11Q1 ’11Q2 ’11Q3 ’11Q4 ’12Q1 ’12Q2 2011 2012 2013
Real GDP Growth 3.4 2.4 2.3 2.5 2.8 2.7 2.8 2.7 3.0
Consumption Growth 3.0 2.4 2.2 2.7 2.8 2.5 2.9 2.6 2.3
Investment Growth 7.0 8.2 7.1 7.9 7.6 8.5 7.8 8.0 7.4
Inventory Change (bil. 2005$) 37.7 44.9 54.6 55.7 43.9 35.4 48.2 37.1 30.6
Export Growth 7.5 7.4 7.8 7.7 8.5 8.5 7.7 8.2 8.7
Import Growth 6.0 6.5 6.3 6.1 3.9 6.1 4.8 5.4 4.7
Net Exports (bil. 2005$) -391.8 -394.3 -393.8 -393.0 -376.2 -370.9 -393.2 -364.6 -304.2
MAJOR INDICATORS
Housing Starts (mil.) 0.531 0.543 0.551 0.564 0.577 0.610 0.547 0.622 0.742
Autos and Light Truck Sales (mil.) 12.5 12.5 12.7 13.0 13.3 13.4 12.7 13.5 14.0
Industrial Production Growth 4.1 5.1 4.8 4.7 4.2 4.1 4.6 4.4 4.2
Job Gains (‘000) 361 347 369 395 351 367 1,201 1,483 1,670
INTEREST RATES & INFLATION
90-day Treasury Bills (%) 0.2 0.2 0.3 0.5 0.7 0.9 0.3 1.5 3.5
10-year Treasury Bonds (%) 3.7 3.9 4.1 4.3 4.4 4.6 4.0 4.7 5.0
Crude Oil Price ($/bbl) 86.8 85.0 84.6 86.6 87.5 87.4 85.8 87.7 86.8
Consumer Price Index (% change) 2.3 1.8 1.8 2.0 2.0 1.8 1.9 1.9 2.0
Less Food & Energy (% change) 0.9 1.3 1.6 1.6 2.2 2.1 1.1 1.9 1.9
Producers Price Index (% change) 2.9 -2.6 -0.1 2.3 1.6 1.4 1.7 1.3 1.1
POLICY VARIABLES
Federal Funds Rate (%) 0.1 0.2 0.2 0.3 0.4 0.8 0.2 1.4 3.5
Fiscal Deficit (bil. $) -1,576 -1,575 -1,520 -1,510 -1,360 -1,372 -1,545 -1,360 -1,017
Real U.S. Dollar (% change) 7.6 -3.8 -2.3 -1.1 -0.9 -0.6 -2.7 -1.1 0.6
Quarterly
A dragging recovery
4 Economic Forecasting Center
Economic Health Indicators
JANOCTJULAPRJANOCTJULAPRJANOCTJULAPRJANOCTJULAPRJAN20112010200920082007
105
100
95
90
85
80
65
60
55
50
45
40
35
30
(Index 2002 = 100)Industrial Production and ISM Index
Ind. Production (Left) ISM Index (Right)
Graph iv
JANOCTJULAPRJANOCTJULAPRJANOCTJULAPRJANOCTJULAPRJAN20112010200920082007
120
100
80
60
40
20
18
16
14
12
10
8
(Index 1966 = 100) (Mil.)Consumer Confidence and Auto Sales
Consumer Confidence (Left) Auto Sales (Right)
Graph v
IVIIIVIIIVIIIVIIIVIIIVIIIVIIIVIIIVIIIVIIIVIIIVII201020092008200720062005200420032002200120001999
70
60
50
40
30
20
10
0
-10
-20
-30
-40
(%, Y-O-Y)
Chief Executive Confidence & Durable Goods OrdersExpectations of Business Conditions in Own Industry 6 Months Ahead
CEO Confidence (Left) Durable Goods Orders Growth (Right)
Graph i
JANDECNOVOCTSEPAUGJULJUNMAYAPRMARFEBJAN20112010
250
200
150
100
50
0
-50
-100
('000)Total Private Employment Growth
Graph ii
FEBNOVAUGMAYFEBNOVAUGMAYFEBNOVAUGMAYFEB2011201020092008
11
10
9
8
7
6
5
4
650
600
550
500
450
400
350
300
(%) ('000)
Unemployment Insurance Claimsand Unemployment Rate
Unemployment Rate (Left) U.I. Claims (Right)
Graph iii
DECSEPJUNMARDECSEPJUNMARDECSEPJUNMARDECSEPJUNMAR2010200920082007
10
8
6
4
2
0
-2
-4
-6
(%, Y-O-Y, 3-m. mov. avg.)CPI and PPI Inflation
CPI Index PPI
Graph vi
Forecast of the Nation, February 2011
Georgia State University 5
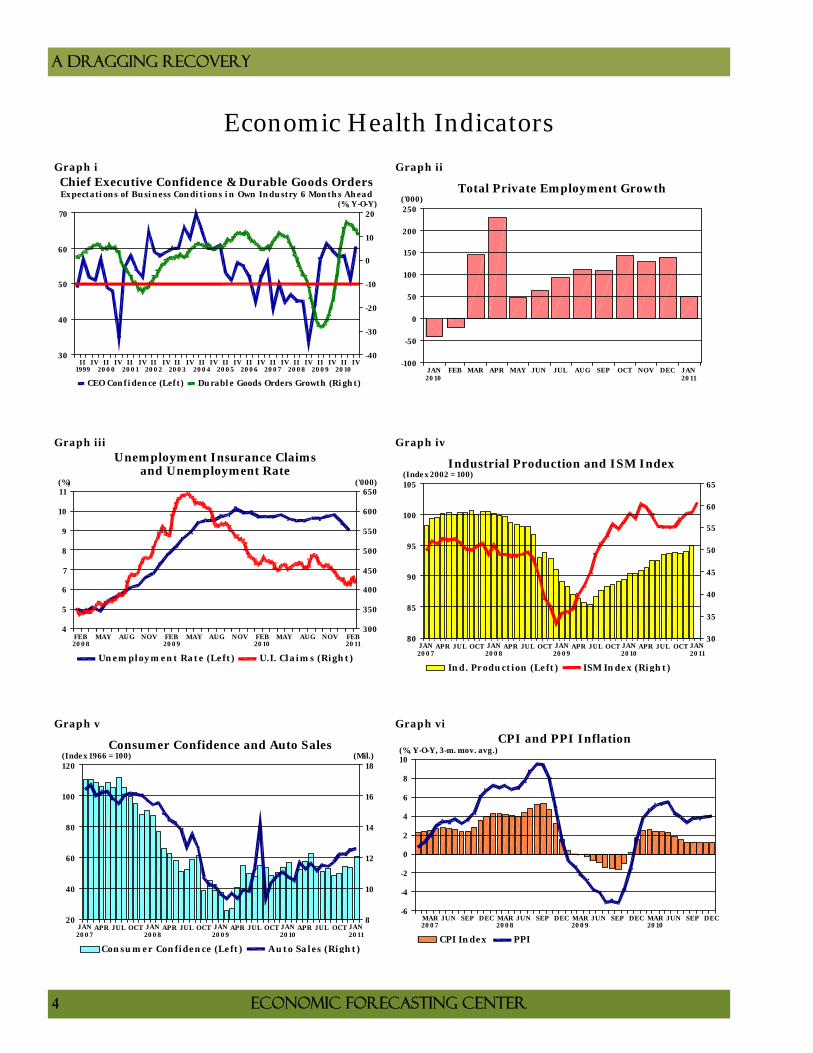
The graphs on the accompanying page depict differ-
ent facets of the recovery in the economy. Graph i
shows that the CEO confidence index, which has
risen from its nadir after the Lehman/AIG episode in
2009, started to decline during most of 2010. How-
ever, it did recover sharply in the fourth quarter of
2010 (most likely due to the Republican takeover of
the House, along with Republican gains in the Senate
that forced the White House to move more to the cen-
ter). My work at the Economic Forecasting Center
has shown that tech investment causes job growth,
and the driver for that investment is CEO confidence.
The lag between the recovery in the CEO confidence
index and subsequent job growth has been approxi-
mately six months. Thus, the sharp recovery of the
CEO confidence in 2009 showed its fruits in terms of
job growth, admittedly moderate, in 2010 (graph ii).
Note that most of the initial investment growth was
just to make up for the depreciation of assets that
were neglected during the recession. Thus, it took a
while before any new or net investments were made
that resulted in new hires. However, the impact of the
drop in the CEO confidence index of early 2010 was
evident in the fourth quarter GDP growth report.
Tech investment grew by only 5.8% in the fourth
quarter, after displaying solid double-digit growth in
the previous four quarters. Tech investment growth
will rebound in the coming quarters but won't be as
high as the 15.1% rate of 2010. But at 12.1% in 2011, it
will still be enough to generate 100,000 jobs a
month. This pace will grow in 2012 (to 127,000 jobs)
and in 2013 (to 140,000 jobs) as tech invest-
ment grows above 7% in 2012-13. However,
this growth is below par by historical stan-
dards.
The unemployment rate was recently 9.0%
and has dropped 0.8% in the last two months
(graph iii). So why am I predicting that it
will remain above 9% until late 2012?
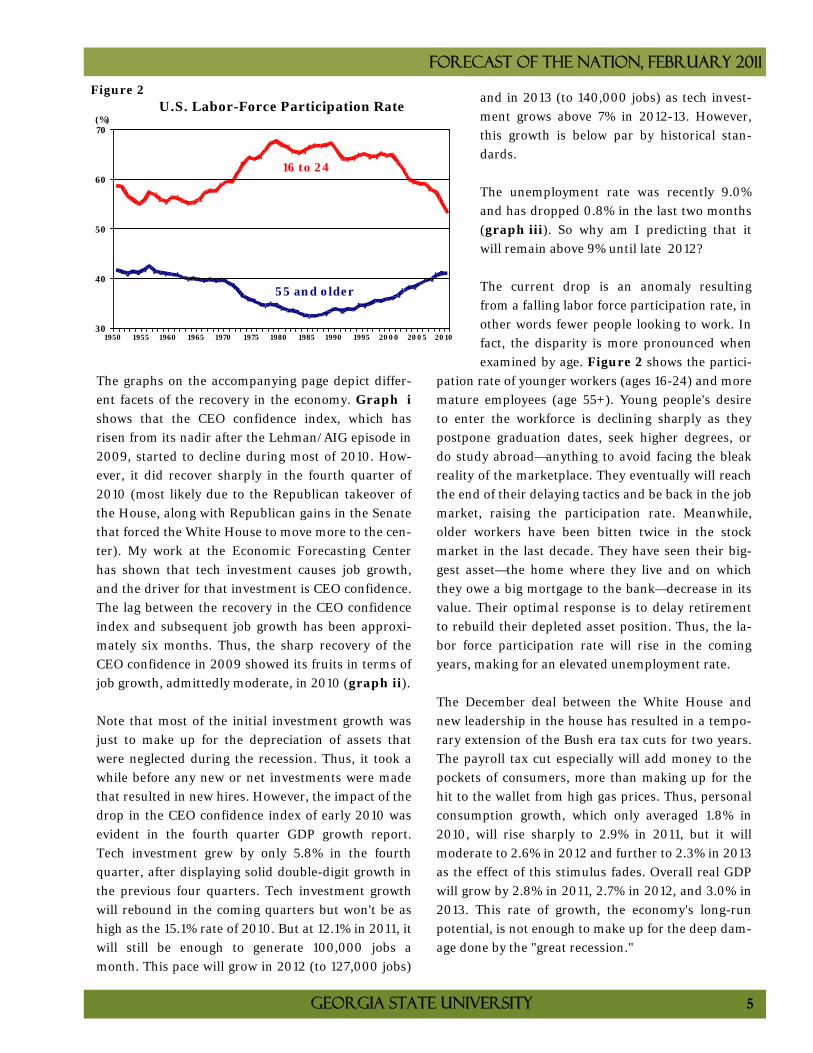
The current drop is an anomaly resulting
from a falling labor force participation rate, in
other words fewer people looking to work. In
fact, the disparity is more pronounced when
examined by age. Figure 2 shows the partici-
pation rate of younger workers (ages 16-24) and more
mature employees (age 55+). Young people's desire
to enter the workforce is declining sharply as they
postpone graduation dates, seek higher degrees, or
do study abroad—anything to avoid facing the bleak
reality of the marketplace. They eventually will reach
the end of their delaying tactics and be back in the job
market, raising the participation rate. Meanwhile,
older workers have been bitten twice in the stock
market in the last decade. They have seen their big-
gest asset—the home where they live and on which
they owe a big mortgage to the bank—decrease in its
value. Their optimal response is to delay retirement
to rebuild their depleted asset position. Thus, the la-
bor force participation rate will rise in the coming
years, making for an elevated unemployment rate.
The December deal between the White House and
new leadership in the house has resulted in a tempo-
rary extension of the Bush era tax cuts for two years.
The payroll tax cut especially will add money to the
pockets of consumers, more than making up for the
hit to the wallet from high gas prices. Thus, personal
consumption growth, which only averaged 1.8% in
2010, will rise sharply to 2.9% in 2011, but it will
moderate to 2.6% in 2012 and further to 2.3% in 2013
as the effect of this stimulus fades. Overall real GDP
will grow by 2.8% in 2011, 2.7% in 2012, and 3.0% in
2013. This rate of growth, the economy's long-run
potential, is not enough to make up for the deep dam-
age done by the "great recession."
2010200520001995199019851980197519701965196019551950
70
60
50
40
30
(%)U.S. Labor-Force Participation Rate
16 to 24
55 and older
Figure 2
A dragging recovery
6 Economic Forecasting Center
Asian Jitters
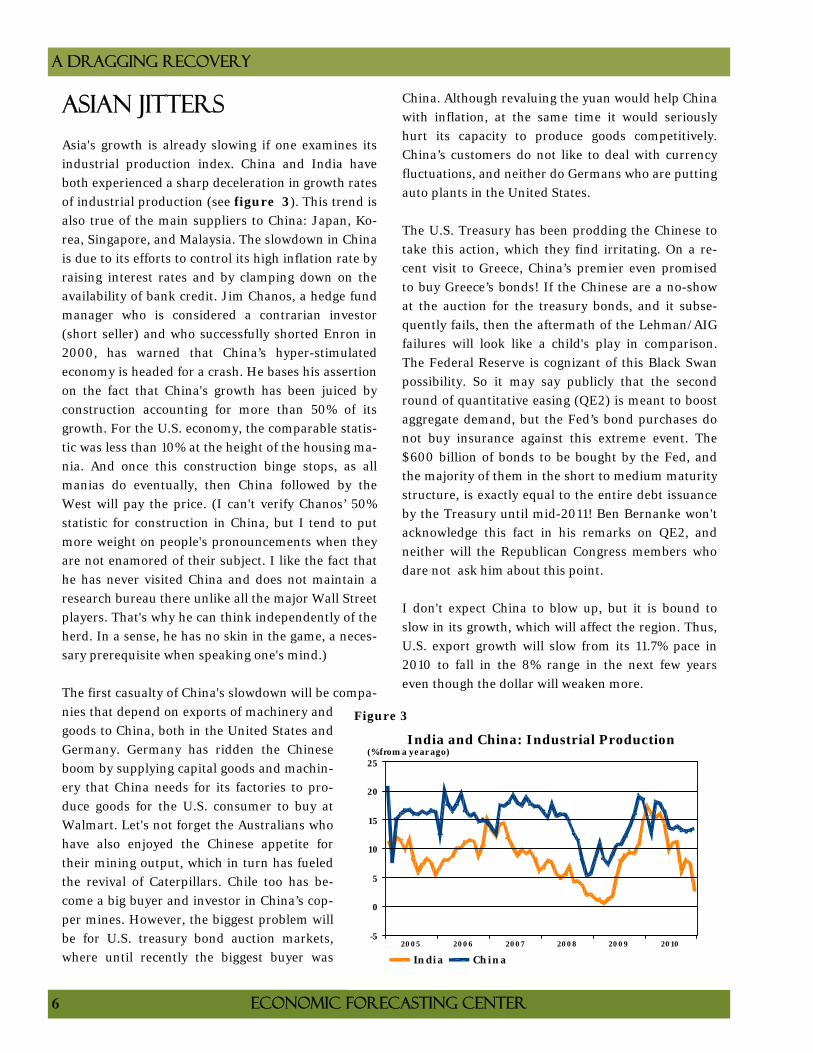
Asia's growth is already slowing if one examines its
industrial production index. China and India have
both experienced a sharp deceleration in growth rates
of industrial production (see figure 3). This trend is
also true of the main suppliers to China: Japan, Ko-
rea, Singapore, and Malaysia. The slowdown in China
is due to its efforts to control its high inflation rate by
raising interest rates and by clamping down on the
availability of bank credit. Jim Chanos, a hedge fund
manager who is considered a contrarian investor
(short seller) and who successfully shorted Enron in
2000, has warned that China’s hyper-stimulated
economy is headed for a crash. He bases his assertion
on the fact that China's growth has been juiced by
construction accounting for more than 50% of its
growth. For the U.S. economy, the comparable statis-
tic was less than 10% at the height of the housing ma-
nia. And once this construction binge stops, as all
manias do eventually, then China followed by the
West will pay the price. (I can't verify Chanos’ 50%
statistic for construction in China, but I tend to put
more weight on people's pronouncements when they
are not enamored of their subject. I like the fact that
he has never visited China and does not maintain a
research bureau there unlike all the major Wall Street
players. That's why he can think independently of the
herd. In a sense, he has no skin in the game, a neces-
sary prerequisite when speaking one's mind.)
The first casualty of China's slowdown will be compa-
nies that depend on exports of machinery and
goods to China, both in the United States and
Germany. Germany has ridden the Chinese
boom by supplying capital goods and machin-
ery that China needs for its factories to pro-
duce goods for the U.S. consumer to buy at
Walmart. Let's not forget the Australians who
have also enjoyed the Chinese appetite for
their mining output, which in turn has fueled
the revival of Caterpillars. Chile too has be-
come a big buyer and investor in China’s cop-
per mines. However, the biggest problem will
be for U.S. treasury bond auction markets,
where until recently the biggest buyer was
China. Although revaluing the yuan would help China
with inflation, at the same time it would seriously
hurt its capacity to produce goods competitively.
China’s customers do not like to deal with currency
fluctuations, and neither do Germans who are putting
auto plants in the United States.
The U.S. Treasury has been prodding the Chinese to
take this action, which they find irritating. On a re-
cent visit to Greece, China’s premier even promised
to buy Greece’s bonds! If the Chinese are a no-show
at the auction for the treasury bonds, and it subse-
quently fails, then the aftermath of the Lehman/AIG
failures will look like a child's play in comparison.
The Federal Reserve is cognizant of this Black Swan
possibility. So it may say publicly that the second
round of quantitative easing (QE2) is meant to boost
aggregate demand, but the Fed’s bond purchases do
not buy insurance against this extreme event. The
$600 billion of bonds to be bought by the Fed, and
the majority of them in the short to medium maturity
structure, is exactly equal to the entire debt issuance
by the Treasury until mid-2011! Ben Bernanke won't
acknowledge this fact in his remarks on QE2, and
neither will the Republican Congress members who
dare not ask him about this point.
I don't expect China to blow up, but it is bound to
slow in its growth, which will affect the region. Thus,
U.S. export growth will slow from its 11.7% pace in
2010 to fall in the 8% range in the next few years
even though the dollar will weaken more.
201020092008200720062005
25
20
15
10
5
0
-5
(% from a year ago)India and China: Industrial Production
India China
Figure 3
Forecast of the Nation, February 2011
Georgia State University 7
Inflation Worries, Not
The 10-year bond rate has jumped almost 80 basis
points since early December to be close to 3.7%. Is
this rise signaling that inflation pressures are build-
ing? Is the QE2 policy failing to achieve its objective
of keeping rates low?
First, inflation is not an issue in the Western hemi-
sphere. Yes, grain commodity prices have risen over
the past 12 months, but that scenario has to do with
one-off factors and our ethanol policy. Bad harvests
are compounding the grain shortage resulting from
the Western world, especially here in the United
States, where we are meeting an increased need for
oil by turning to ethanol. Our crude oil consumption
has remained steady at around 19 million barrels per
day since 1999 whereas real GDP has climbed by al-
most 23%. Thus, we substituted ethanol for oil to get
this extra GDP. (I doubt 100,000 Toyota Priuses have
given us the needed fuel savings.) Thus, the substitu-
tion of ethanol for oil has made it hard to provide
affordable grain to emerging economies and places
like Egypt, where the government heavily subsidizes
the price of bread. Additionally, grain prices are inti-
mately linked to the cost of fertilizer, which happens
to be an oil product. As oil prices have risen so have
the long-term prices for grain. Fluctuations on this
trend line happen when harvests fail abroad or esti-
mates of future domestic output from the USDA are
revised. (The fact that hedge funds and pension plans
are also playing this market to juice up returns add to
the volatility and upward momentum in prices.)
Core inflation, a creation of Fed chairman Arthur
Burns in the early 1970s, excludes these volatile com-
ponents and is still running much below 1.0%. But
why is inflation in the United States so low and in
emerging markets so high?
For the answer, we have to look at what causes infla-
tion. Inflation emerges when the economy is running
above its potential or its capacity to grow given the
limits of population and capital stock. In that situa-
tion, the saying "too much money chasing too few
goods" becomes applicable. Throw in the phenome-
non of rising inflation expectations (that get met),
and inflation can become a problem like we experi-
enced in the late 1970s. If China's economy is display-
ing inflation, and India's inflation rate has been
above 10% for the last few years, those figures indi-
cate that the government sector in these countries is
pursuing its growth policies either via its social
spending programs (India) or infrastructure develop-
ment (China), which in turn are putting a strain on
resources. The result is inflation. The only cure is to
dial back the government's fiscal programs and raise
interest rates, as China is half-heartedly trying. India,
on the other hand, seems to be blaming one-off fac-
tors for its inflation problems.
With unemployment still running high, auto sales
just above 12 million units, and housing starts barely
above 1/2 million units, we are nowhere near ap-
proaching our capacity constraint. The forecasted
real GDP growth is barely 3.0% by 2013. If it was go-
ing to be 6.0%, then we might worry about QE2 caus-
ing inflation. But I will welcome inflation anytime
because it will put all those people who lost jobs dur-
ing the great recession back to work. But this event
isn't happening.
The 10-year bond rate has risen because last Decem-
ber's tax cut extension has added to the fiscal deficit,
which is expected to remain well above $1 trillion in
coming years. There is no such thing as a free lunch,
and when the government finances tax cuts via bond
issuance, it adds to the supply of new bonds. The rest
of the world can only absorb so much. During the
Egyptian crisis, investors flew to safety in the mar-
kets, but the impact was swamped by the excessive
supply. As the situation settles in coming months,
this excess supply force will cause the 10-year bond
rate to rise slowly but surely towards 5.0%.
So how long will the Fed keep its short-term rate at
almost zero? I predict for another year. When we see
an uptick in employment creation that results in an
uptick in core inflation rate, which gets close to its
2.0% comfort zone, the Fed will have to start raising
rates. This timing also coincides with the fiscal pres-
sures on long-bond yields intensifying. Unlike in
2005, the Fed's rate hikes will be aggressive this time.
A dragging recovery
8 Economic Forecasting Center
Cautious Consumer
Personal consumption grew by 4.4% in the fourth
quarter of 2010, compared with an increase of 2.4%
in the third quarter. Consumption growth was only
0.9% just a year ago. So why can't the consumer keep
up this momentum to get us to the 5% growth needed
to solve all the problems we face? High unemploy-
ment, huge fiscal deficits, local and state budgets
shortfalls, and last but not least an idle construction
industry workforce are the reasons.
Let's start with the real estate sector. New home sales
were the lowest on record last year. Home prices have
fallen to be affordable even in Florida and California,
the Congress has showered tax credits, and the Fed is
keeping interest rates at historic lows. In 1990, when
the economy was in the middle of a recession, we had
more new home sales. They were even higher in 1982
when mortgage rates were close to 15%. Why couldn't
houses sell last year?
The answer is twofold. First, new household forma-
tion took a steep dive during this recession. From
forming about 1.5 million households in 2005-06, the
rate dropped to less than 300,000 in 2010. If young
people delay graduation, they also delay household
formation by not moving out of their parents’ base-
ment! Even if they graduate and move, they will be
unable to find a lender willing to give them a mort-
gage to buy a home. Today’s lenders want a long job
history and a requisite 20% down payment. Thus, any
new demand for housing by this group will be
in the rental category. Thus, in my forecast,
housing starts will remain well below 1 million
units even in 2013, but the multi-family starts
constitute one-third of that number.
The second reason for slow sales is that when
buyers purchase homes, they implicitly fore-
cast how much their assets will appreciate in
coming years. This rate of appreciation had
better be good enough to cover property taxes,
maintenance expenditures, and the ubiqui-
tous realtor fees when they sell. The conven-
tional wisdom that homes always appreciate
enough to cover these costs was dramatically dis-
proven in this great recession. Consumers don't want
to buy a house that may depreciate 10%-20% in the
future. Hence, buyers make a forecast about where
prices are headed—not only in this year but also in
the next few years.
MacroMarkets, which produces the S&P/Shiller
home price index, also started a survey last year to
gauge home prices in five years. The median value
from the latest survey was approximately 12% of cu-
mulative home price appreciation. This increase is
not enough to cover even property taxes and other
costs of owning a home. The highest quintile forecast
was less than 30% of price gains, and the lowest one
was a drop of 20%. Thus, 50% of the sample was
pretty pessimistic, and these predictions came from
practicing economists. I think the person on Main
Street is more fearful, which shows up in other
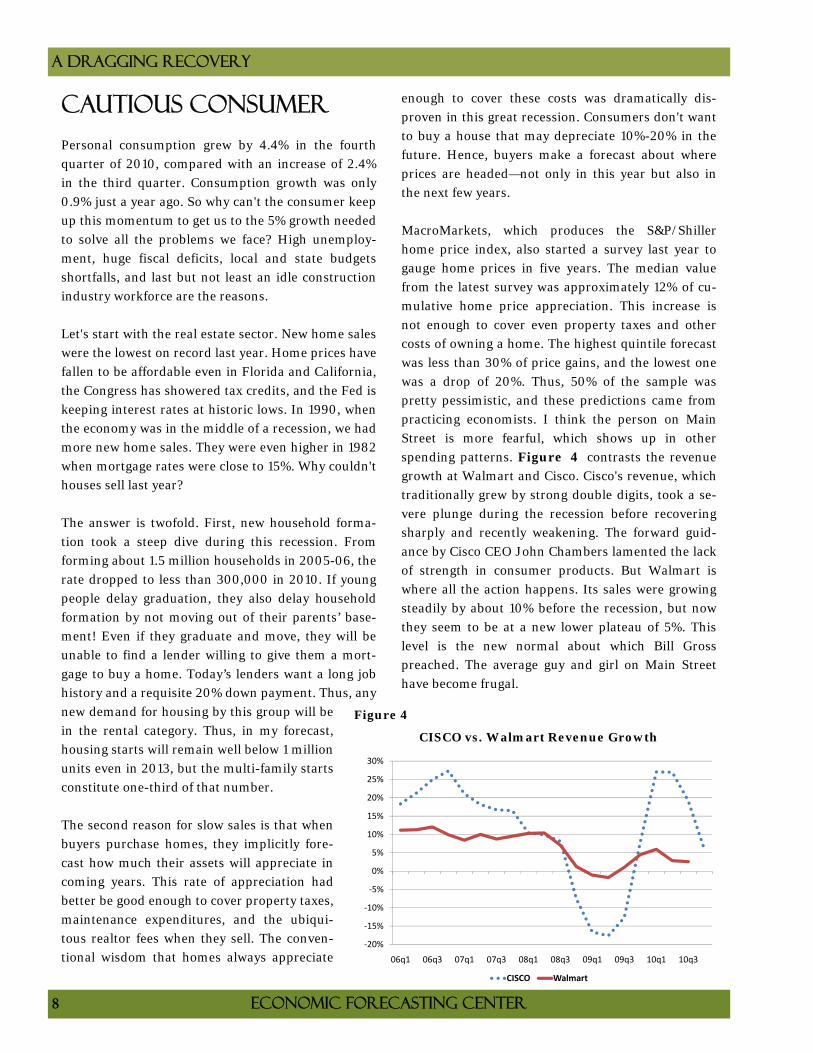
spending patterns. Figure 4 contrasts the revenue
growth at Walmart and Cisco. Cisco's revenue, which
traditionally grew by strong double digits, took a se-
vere plunge during the recession before recovering
sharply and recently weakening. The forward guid-
ance by Cisco CEO John Chambers lamented the lack
of strength in consumer products. But Walmart is
where all the action happens. Its sales were growing
steadily by about 10% before the recession, but now
they seem to be at a new lower plateau of 5%. This
level is the new normal about which Bill Gross
preached. The average guy and girl on Main Street
have become frugal.
CISCO vs. Walmart Revenue Growth
Figure 4
‐20%
‐15%
‐10%
‐5%
0%
5%
10%
15%
20%
25%
30%
06q1 06q3 07q1 07q3 08q1 08q3 09q1 09q3 10q1 10q3
CISCO Walmart

Detailed Forecast Tables
Economic Forecasting Center J. Mack Robinson College of Business
Georgia State University Copyright © 2011
FORECAST OF THE NATION FEBRUARY 2011
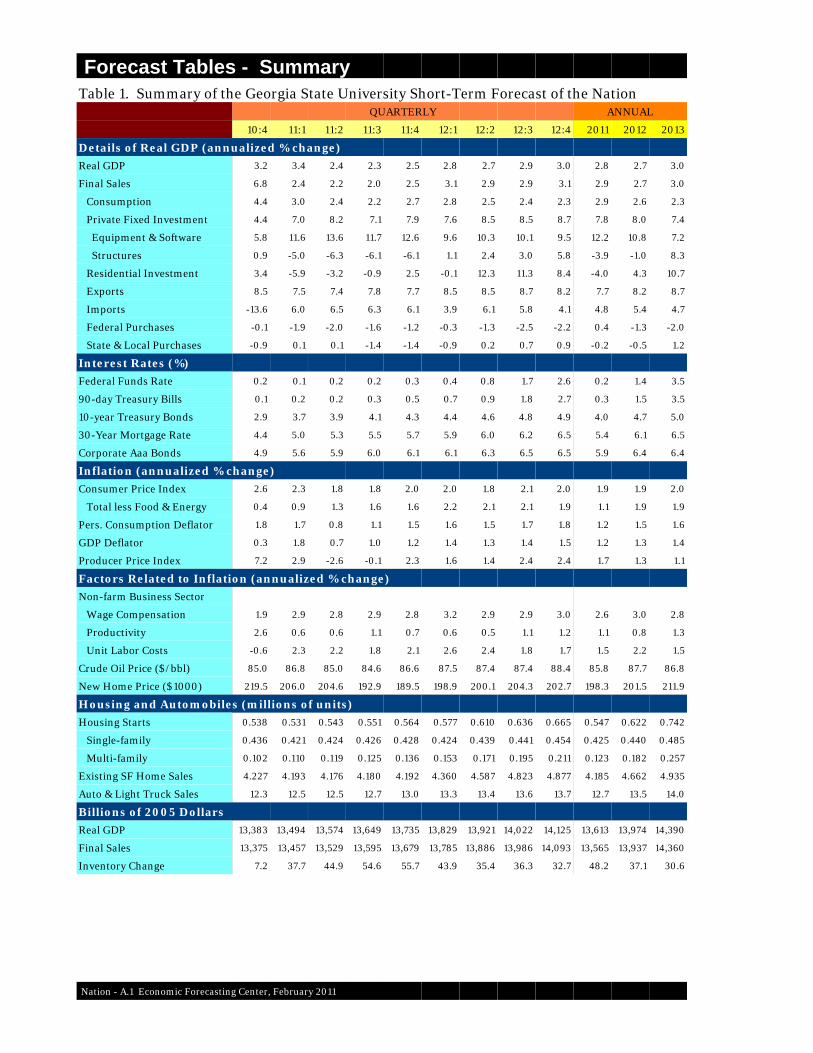
Forecast Tables - SummaryTable 1. Summary of the Georgia State University Short-Term Forecast of the Nation
QUARTERLY ANNUAL
10:4 11:1 11:2 11:3 11:4 12:1 12:2 12:3 12:4 2011 2012 2013
Details of Real GDP (annualized % change)
Real GDP 3.2 3.4 2.4 2.3 2.5 2.8 2.7 2.9 3.0 2.8 2.7 3.0
Final Sales 6.8 2.4 2.2 2.0 2.5 3.1 2.9 2.9 3.1 2.9 2.7 3.0
Consumption 4.4 3.0 2.4 2.2 2.7 2.8 2.5 2.4 2.3 2.9 2.6 2.3
Private Fixed Investment 4.4 7.0 8.2 7.1 7.9 7.6 8.5 8.5 8.7 7.8 8.0 7.4
Equipment & Software 5.8 11.6 13.6 11.7 12.6 9.6 10.3 10.1 9.5 12.2 10.8 7.2
Structures 0.9 -5.0 -6.3 -6.1 -6.1 1.1 2.4 3.0 5.8 -3.9 -1.0 8.3
Residential Investment 3.4 -5.9 -3.2 -0.9 2.5 -0.1 12.3 11.3 8.4 -4.0 4.3 10.7
Exports 8.5 7.5 7.4 7.8 7.7 8.5 8.5 8.7 8.2 7.7 8.2 8.7
Imports -13.6 6.0 6.5 6.3 6.1 3.9 6.1 5.8 4.1 4.8 5.4 4.7
Federal Purchases -0.1 -1.9 -2.0 -1.6 -1.2 -0.3 -1.3 -2.5 -2.2 0.4 -1.3 -2.0
State & Local Purchases -0.9 0.1 0.1 -1.4 -1.4 -0.9 0.2 0.7 0.9 -0.2 -0.5 1.2
Interest Rates (%)
Federal Funds Rate 0.2 0.1 0.2 0.2 0.3 0.4 0.8 1.7 2.6 0.2 1.4 3.5
90-day Treasury Bills 0.1 0.2 0.2 0.3 0.5 0.7 0.9 1.8 2.7 0.3 1.5 3.5
10-year Treasury Bonds 2.9 3.7 3.9 4.1 4.3 4.4 4.6 4.8 4.9 4.0 4.7 5.0
30-Year Mortgage Rate 4.4 5.0 5.3 5.5 5.7 5.9 6.0 6.2 6.5 5.4 6.1 6.5
Corporate Aaa Bonds 4.9 5.6 5.9 6.0 6.1 6.1 6.3 6.5 6.5 5.9 6.4 6.4
Inflation (annualized % change)
Consumer Price Index 2.6 2.3 1.8 1.8 2.0 2.0 1.8 2.1 2.0 1.9 1.9 2.0
Total less Food & Energy 0.4 0.9 1.3 1.6 1.6 2.2 2.1 2.1 1.9 1.1 1.9 1.9
Pers. Consumption Deflator 1.8 1.7 0.8 1.1 1.5 1.6 1.5 1.7 1.8 1.2 1.5 1.6
GDP Deflator 0.3 1.8 0.7 1.0 1.2 1.4 1.3 1.4 1.5 1.2 1.3 1.4
Producer Price Index 7.2 2.9 -2.6 -0.1 2.3 1.6 1.4 2.4 2.4 1.7 1.3 1.1
Factors Related to Inflation (annualized % change)
Non-farm Business Sector
Wage Compensation 1.9 2.9 2.8 2.9 2.8 3.2 2.9 2.9 3.0 2.6 3.0 2.8
Productivity 2.6 0.6 0.6 1.1 0.7 0.6 0.5 1.1 1.2 1.1 0.8 1.3
Unit Labor Costs -0.6 2.3 2.2 1.8 2.1 2.6 2.4 1.8 1.7 1.5 2.2 1.5
Crude Oil Price ($/bbl) 85.0 86.8 85.0 84.6 86.6 87.5 87.4 87.4 88.4 85.8 87.7 86.8
New Home Price ($1000) 219.5 206.0 204.6 192.9 189.5 198.9 200.1 204.3 202.7 198.3 201.5 211.9
Housing and Automobiles (millions of units)
Housing Starts 0.538 0.531 0.543 0.551 0.564 0.577 0.610 0.636 0.665 0.547 0.622 0.742
Single-family 0.436 0.421 0.424 0.426 0.428 0.424 0.439 0.441 0.454 0.425 0.440 0.485
Multi-family 0.102 0.110 0.119 0.125 0.136 0.153 0.171 0.195 0.211 0.123 0.182 0.257
Existing SF Home Sales 4.227 4.193 4.176 4.180 4.192 4.360 4.587 4.823 4.877 4.185 4.662 4.935
Auto & Light Truck Sales 12.3 12.5 12.5 12.7 13.0 13.3 13.4 13.6 13.7 12.7 13.5 14.0
Billions of 2005 Dollars
Real GDP 13,383 13,494 13,574 13,649 13,735 13,829 13,921 14,022 14,125 13,613 13,974 14,390
Final Sales 13,375 13,457 13,529 13,595 13,679 13,785 13,886 13,986 14,093 13,565 13,937 14,360
Inventory Change 7.2 37.7 44.9 54.6 55.7 43.9 35.4 36.3 32.7 48.2 37.1 30.6
Nation - A.1 Economic Forecasting Center, February 2011
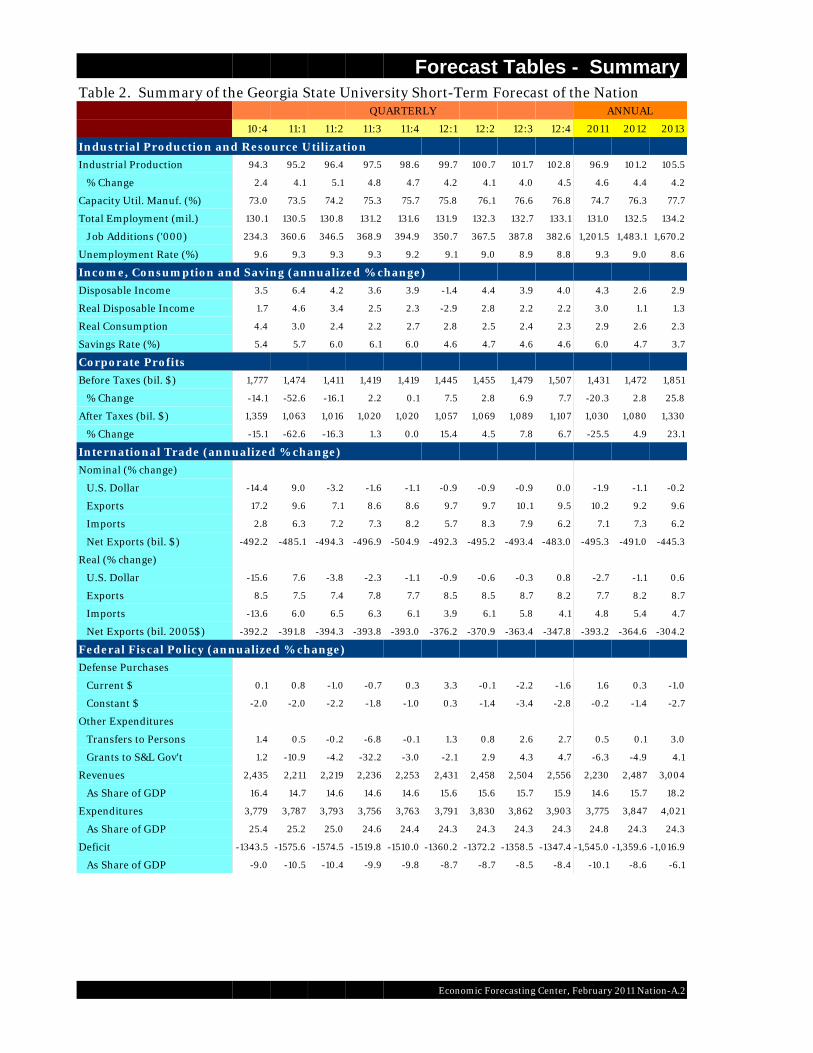
Forecast Tables - Summary Table 2. Summary of the Georgia State University Short-Term Forecast of the Nation
QUARTERLY ANNUAL
10:4 11:1 11:2 11:3 11:4 12:1 12:2 12:3 12:4 2011 2012 2013
Industrial Production and Resource Utilization
Industrial Production 94.3 95.2 96.4 97.5 98.6 99.7 100.7 101.7 102.8 96.9 101.2 105.5
% Change 2.4 4.1 5.1 4.8 4.7 4.2 4.1 4.0 4.5 4.6 4.4 4.2
Capacity Util. Manuf. (%) 73.0 73.5 74.2 75.3 75.7 75.8 76.1 76.6 76.8 74.7 76.3 77.7
Total Employment (mil.) 130.1 130.5 130.8 131.2 131.6 131.9 132.3 132.7 133.1 131.0 132.5 134.2
Job Additions ('000) 234.3 360.6 346.5 368.9 394.9 350.7 367.5 387.8 382.6 1,201.5 1,483.1 1,670.2
Unemployment Rate (%) 9.6 9.3 9.3 9.3 9.2 9.1 9.0 8.9 8.8 9.3 9.0 8.6
Income, Consumption and Saving (annualized % change)
Disposable Income 3.5 6.4 4.2 3.6 3.9 -1.4 4.4 3.9 4.0 4.3 2.6 2.9
Real Disposable Income 1.7 4.6 3.4 2.5 2.3 -2.9 2.8 2.2 2.2 3.0 1.1 1.3
Real Consumption 4.4 3.0 2.4 2.2 2.7 2.8 2.5 2.4 2.3 2.9 2.6 2.3
Savings Rate (%) 5.4 5.7 6.0 6.1 6.0 4.6 4.7 4.6 4.6 6.0 4.7 3.7
Corporate Profits
Before Taxes (bil. $) 1,777 1,474 1,411 1,419 1,419 1,445 1,455 1,479 1,507 1,431 1,472 1,851
% Change -14.1 -52.6 -16.1 2.2 0.1 7.5 2.8 6.9 7.7 -20.3 2.8 25.8
After Taxes (bil. $) 1,359 1,063 1,016 1,020 1,020 1,057 1,069 1,089 1,107 1,030 1,080 1,330
% Change -15.1 -62.6 -16.3 1.3 0.0 15.4 4.5 7.8 6.7 -25.5 4.9 23.1
International Trade (annualized % change)
Nominal (% change)
U.S. Dollar -14.4 9.0 -3.2 -1.6 -1.1 -0.9 -0.9 -0.9 0.0 -1.9 -1.1 -0.2
Exports 17.2 9.6 7.1 8.6 8.6 9.7 9.7 10.1 9.5 10.2 9.2 9.6
Imports 2.8 6.3 7.2 7.3 8.2 5.7 8.3 7.9 6.2 7.1 7.3 6.2
Net Exports (bil. $) -492.2 -485.1 -494.3 -496.9 -504.9 -492.3 -495.2 -493.4 -483.0 -495.3 -491.0 -445.3
Real (% change)
U.S. Dollar -15.6 7.6 -3.8 -2.3 -1.1 -0.9 -0.6 -0.3 0.8 -2.7 -1.1 0.6
Exports 8.5 7.5 7.4 7.8 7.7 8.5 8.5 8.7 8.2 7.7 8.2 8.7
Imports -13.6 6.0 6.5 6.3 6.1 3.9 6.1 5.8 4.1 4.8 5.4 4.7
Net Exports (bil. 2005$) -392.2 -391.8 -394.3 -393.8 -393.0 -376.2 -370.9 -363.4 -347.8 -393.2 -364.6 -304.2
Federal Fiscal Policy (annualized % change)
Defense Purchases
Current $ 0.1 0.8 -1.0 -0.7 0.3 3.3 -0.1 -2.2 -1.6 1.6 0.3 -1.0
Constant $ -2.0 -2.0 -2.2 -1.8 -1.0 0.3 -1.4 -3.4 -2.8 -0.2 -1.4 -2.7
Other Expenditures
Transfers to Persons 1.4 0.5 -0.2 -6.8 -0.1 1.3 0.8 2.6 2.7 0.5 0.1 3.0
Grants to S&L Gov't 1.2 -10.9 -4.2 -32.2 -3.0 -2.1 2.9 4.3 4.7 -6.3 -4.9 4.1
Revenues 2,435 2,211 2,219 2,236 2,253 2,431 2,458 2,504 2,556 2,230 2,487 3,004
As Share of GDP 16.4 14.7 14.6 14.6 14.6 15.6 15.6 15.7 15.9 14.6 15.7 18.2
Expenditures 3,779 3,787 3,793 3,756 3,763 3,791 3,830 3,862 3,903 3,775 3,847 4,021
As Share of GDP 25.4 25.2 25.0 24.6 24.4 24.3 24.3 24.3 24.3 24.8 24.3 24.3
Deficit -1343.5 -1575.6 -1574.5 -1519.8 -1510.0 -1360.2 -1372.2 -1358.5 -1347.4 -1,545.0 -1,359.6 -1,016.9
As Share of GDP -9.0 -10.5 -10.4 -9.9 -9.8 -8.7 -8.7 -8.5 -8.4 -10.1 -8.6 -6.1
Economic Forecasting Center, February 2011 Nation-A.2
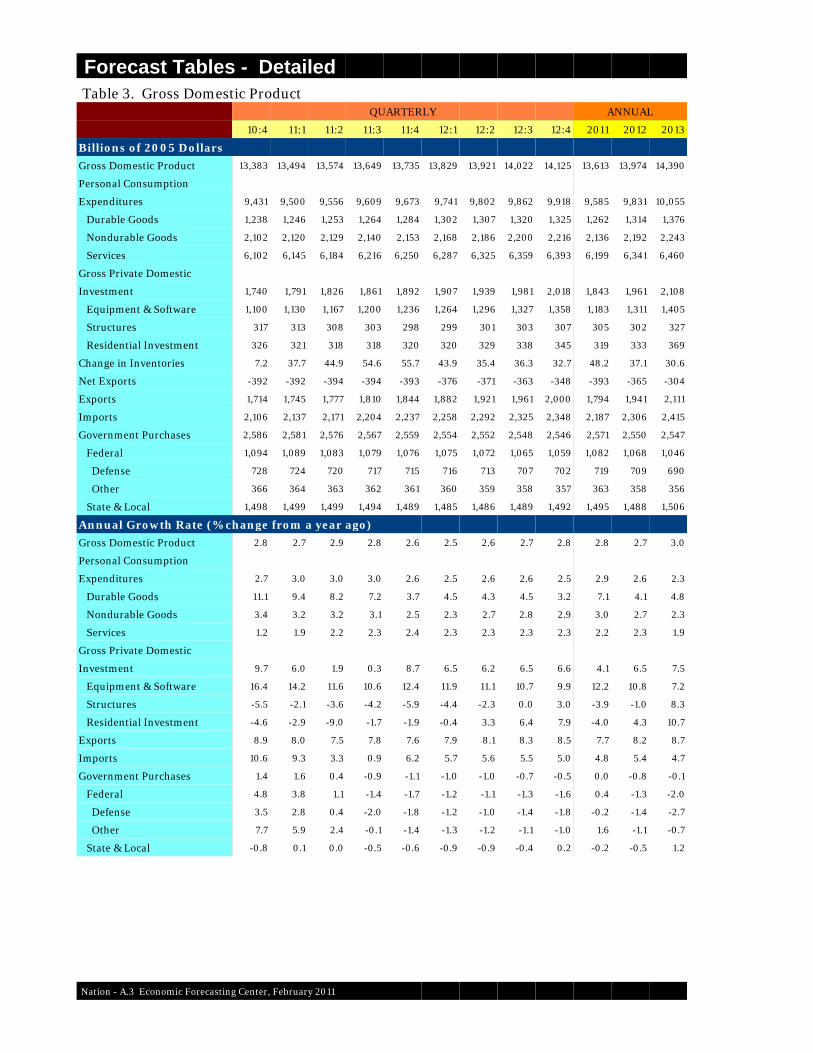
Forecast Tables - Detailed Table 3. Gross Domestic Product
QUARTERLY ANNUAL
10:4 11:1 11:2 11:3 11:4 12:1 12:2 12:3 12:4 2011 2012 2013
Billions of 2005 Dollars
Gross Domestic Product 13,383 13,494 13,574 13,649 13,735 13,829 13,921 14,022 14,125 13,613 13,974 14,390
Personal Consumption
Expenditures 9,431 9,500 9,556 9,609 9,673 9,741 9,802 9,862 9,918 9,585 9,831 10,055
Durable Goods 1,238 1,246 1,253 1,264 1,284 1,302 1,307 1,320 1,325 1,262 1,314 1,376
Nondurable Goods 2,102 2,120 2,129 2,140 2,153 2,168 2,186 2,200 2,216 2,136 2,192 2,243
Services 6,102 6,145 6,184 6,216 6,250 6,287 6,325 6,359 6,393 6,199 6,341 6,460
Gross Private Domestic
Investment 1,740 1,791 1,826 1,861 1,892 1,907 1,939 1,981 2,018 1,843 1,961 2,108
Equipment & Software 1,100 1,130 1,167 1,200 1,236 1,264 1,296 1,327 1,358 1,183 1,311 1,405
Structures 317 313 308 303 298 299 301 303 307 305 302 327
Residential Investment 326 321 318 318 320 320 329 338 345 319 333 369
Change in Inventories 7.2 37.7 44.9 54.6 55.7 43.9 35.4 36.3 32.7 48.2 37.1 30.6
Net Exports -392 -392 -394 -394 -393 -376 -371 -363 -348 -393 -365 -304
Exports 1,714 1,745 1,777 1,810 1,844 1,882 1,921 1,961 2,000 1,794 1,941 2,111
Imports 2,106 2,137 2,171 2,204 2,237 2,258 2,292 2,325 2,348 2,187 2,306 2,415
Government Purchases 2,586 2,581 2,576 2,567 2,559 2,554 2,552 2,548 2,546 2,571 2,550 2,547
Federal 1,094 1,089 1,083 1,079 1,076 1,075 1,072 1,065 1,059 1,082 1,068 1,046
Defense 728 724 720 717 715 716 713 707 702 719 709 690
Other 366 364 363 362 361 360 359 358 357 363 358 356
State & Local 1,498 1,499 1,499 1,494 1,489 1,485 1,486 1,489 1,492 1,495 1,488 1,506
Annual Growth Rate (% change from a year ago)
Gross Domestic Product 2.8 2.7 2.9 2.8 2.6 2.5 2.6 2.7 2.8 2.8 2.7 3.0
Personal Consumption
Expenditures 2.7 3.0 3.0 3.0 2.6 2.5 2.6 2.6 2.5 2.9 2.6 2.3
Durable Goods 11.1 9.4 8.2 7.2 3.7 4.5 4.3 4.5 3.2 7.1 4.1 4.8
Nondurable Goods 3.4 3.2 3.2 3.1 2.5 2.3 2.7 2.8 2.9 3.0 2.7 2.3
Services 1.2 1.9 2.2 2.3 2.4 2.3 2.3 2.3 2.3 2.2 2.3 1.9
Gross Private Domestic
Investment 9.7 6.0 1.9 0.3 8.7 6.5 6.2 6.5 6.6 4.1 6.5 7.5
Equipment & Software 16.4 14.2 11.6 10.6 12.4 11.9 11.1 10.7 9.9 12.2 10.8 7.2
Structures -5.5 -2.1 -3.6 -4.2 -5.9 -4.4 -2.3 0.0 3.0 -3.9 -1.0 8.3
Residential Investment -4.6 -2.9 -9.0 -1.7 -1.9 -0.4 3.3 6.4 7.9 -4.0 4.3 10.7
Exports 8.9 8.0 7.5 7.8 7.6 7.9 8.1 8.3 8.5 7.7 8.2 8.7
Imports 10.6 9.3 3.3 0.9 6.2 5.7 5.6 5.5 5.0 4.8 5.4 4.7
Government Purchases 1.4 1.6 0.4 -0.9 -1.1 -1.0 -1.0 -0.7 -0.5 0.0 -0.8 -0.1
Federal 4.8 3.8 1.1 -1.4 -1.7 -1.2 -1.1 -1.3 -1.6 0.4 -1.3 -2.0
Defense 3.5 2.8 0.4 -2.0 -1.8 -1.2 -1.0 -1.4 -1.8 -0.2 -1.4 -2.7
Other 7.7 5.9 2.4 -0.1 -1.4 -1.3 -1.2 -1.1 -1.0 1.6 -1.1 -0.7
State & Local -0.8 0.1 0.0 -0.5 -0.6 -0.9 -0.9 -0.4 0.2 -0.2 -0.5 1.2
Nation - A.3 Economic Forecasting Center, February 2011
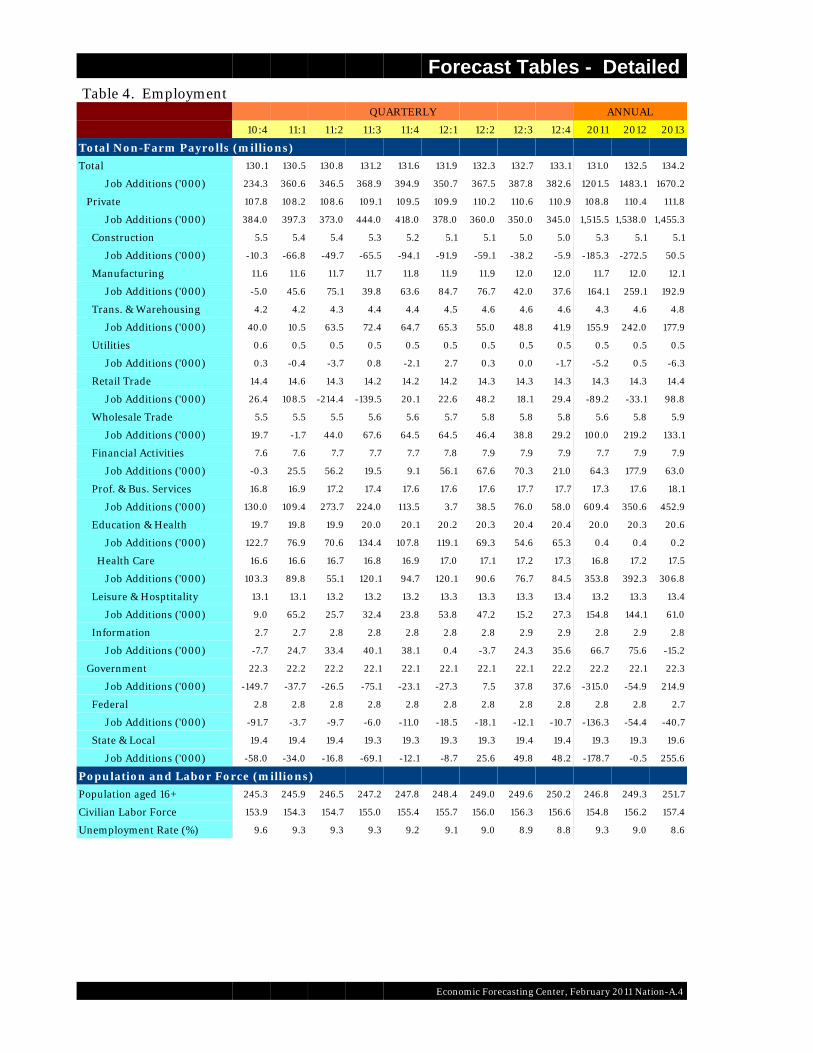
Forecast Tables - Detailed Table 4. Employment
QUARTERLY ANNUAL
10:4 11:1 11:2 11:3 11:4 12:1 12:2 12:3 12:4 2011 2012 2013
Total Non-Farm Payrolls (millions)
Total 130.1 130.5 130.8 131.2 131.6 131.9 132.3 132.7 133.1 131.0 132.5 134.2
Job Additions ('000) 234.3 360.6 346.5 368.9 394.9 350.7 367.5 387.8 382.6 1201.5 1483.1 1670.2
Private 107.8 108.2 108.6 109.1 109.5 109.9 110.2 110.6 110.9 108.8 110.4 111.8
Job Additions ('000) 384.0 397.3 373.0 444.0 418.0 378.0 360.0 350.0 345.0 1,515.5 1,538.0 1,455.3
Construction 5.5 5.4 5.4 5.3 5.2 5.1 5.1 5.0 5.0 5.3 5.1 5.1
Job Additions ('000) -10.3 -66.8 -49.7 -65.5 -94.1 -91.9 -59.1 -38.2 -5.9 -185.3 -272.5 50.5
Manufacturing 11.6 11.6 11.7 11.7 11.8 11.9 11.9 12.0 12.0 11.7 12.0 12.1
Job Additions ('000) -5.0 45.6 75.1 39.8 63.6 84.7 76.7 42.0 37.6 164.1 259.1 192.9
Trans. & Warehousing 4.2 4.2 4.3 4.4 4.4 4.5 4.6 4.6 4.6 4.3 4.6 4.8
Job Additions ('000) 40.0 10.5 63.5 72.4 64.7 65.3 55.0 48.8 41.9 155.9 242.0 177.9
Utilities 0.6 0.5 0.5 0.5 0.5 0.5 0.5 0.5 0.5 0.5 0.5 0.5
Job Additions ('000) 0.3 -0.4 -3.7 0.8 -2.1 2.7 0.3 0.0 -1.7 -5.2 0.5 -6.3
Retail Trade 14.4 14.6 14.3 14.2 14.2 14.2 14.3 14.3 14.3 14.3 14.3 14.4
Job Additions ('000) 26.4 108.5 -214.4 -139.5 20.1 22.6 48.2 18.1 29.4 -89.2 -33.1 98.8
Wholesale Trade 5.5 5.5 5.5 5.6 5.6 5.7 5.8 5.8 5.8 5.6 5.8 5.9
Job Additions ('000) 19.7 -1.7 44.0 67.6 64.5 64.5 46.4 38.8 29.2 100.0 219.2 133.1
Financial Activities 7.6 7.6 7.7 7.7 7.7 7.8 7.9 7.9 7.9 7.7 7.9 7.9
Job Additions ('000) -0.3 25.5 56.2 19.5 9.1 56.1 67.6 70.3 21.0 64.3 177.9 63.0
Prof. & Bus. Services 16.8 16.9 17.2 17.4 17.6 17.6 17.6 17.7 17.7 17.3 17.6 18.1
Job Additions ('000) 130.0 109.4 273.7 224.0 113.5 3.7 38.5 76.0 58.0 609.4 350.6 452.9
Education & Health 19.7 19.8 19.9 20.0 20.1 20.2 20.3 20.4 20.4 20.0 20.3 20.6
Job Additions ('000) 122.7 76.9 70.6 134.4 107.8 119.1 69.3 54.6 65.3 0.4 0.4 0.2
Health Care 16.6 16.6 16.7 16.8 16.9 17.0 17.1 17.2 17.3 16.8 17.2 17.5
Job Additions ('000) 103.3 89.8 55.1 120.1 94.7 120.1 90.6 76.7 84.5 353.8 392.3 306.8
Leisure & Hosptitality 13.1 13.1 13.2 13.2 13.2 13.3 13.3 13.3 13.4 13.2 13.3 13.4
Job Additions ('000) 9.0 65.2 25.7 32.4 23.8 53.8 47.2 15.2 27.3 154.8 144.1 61.0
Information 2.7 2.7 2.8 2.8 2.8 2.8 2.8 2.9 2.9 2.8 2.9 2.8
Job Additions ('000) -7.7 24.7 33.4 40.1 38.1 0.4 -3.7 24.3 35.6 66.7 75.6 -15.2
Government 22.3 22.2 22.2 22.1 22.1 22.1 22.1 22.1 22.2 22.2 22.1 22.3
Job Additions ('000) -149.7 -37.7 -26.5 -75.1 -23.1 -27.3 7.5 37.8 37.6 -315.0 -54.9 214.9
Federal 2.8 2.8 2.8 2.8 2.8 2.8 2.8 2.8 2.8 2.8 2.8 2.7
Job Additions ('000) -91.7 -3.7 -9.7 -6.0 -11.0 -18.5 -18.1 -12.1 -10.7 -136.3 -54.4 -40.7
State & Local 19.4 19.4 19.4 19.3 19.3 19.3 19.3 19.4 19.4 19.3 19.3 19.6
Job Additions ('000) -58.0 -34.0 -16.8 -69.1 -12.1 -8.7 25.6 49.8 48.2 -178.7 -0.5 255.6
Population and Labor Force (millions)
Population aged 16+ 245.3 245.9 246.5 247.2 247.8 248.4 249.0 249.6 250.2 246.8 249.3 251.7
Civilian Labor Force 153.9 154.3 154.7 155.0 155.4 155.7 156.0 156.3 156.6 154.8 156.2 157.4
Unemployment Rate (%) 9.6 9.3 9.3 9.3 9.2 9.1 9.0 8.9 8.8 9.3 9.0 8.6
Economic Forecasting Center, February 2011 Nation-A.4
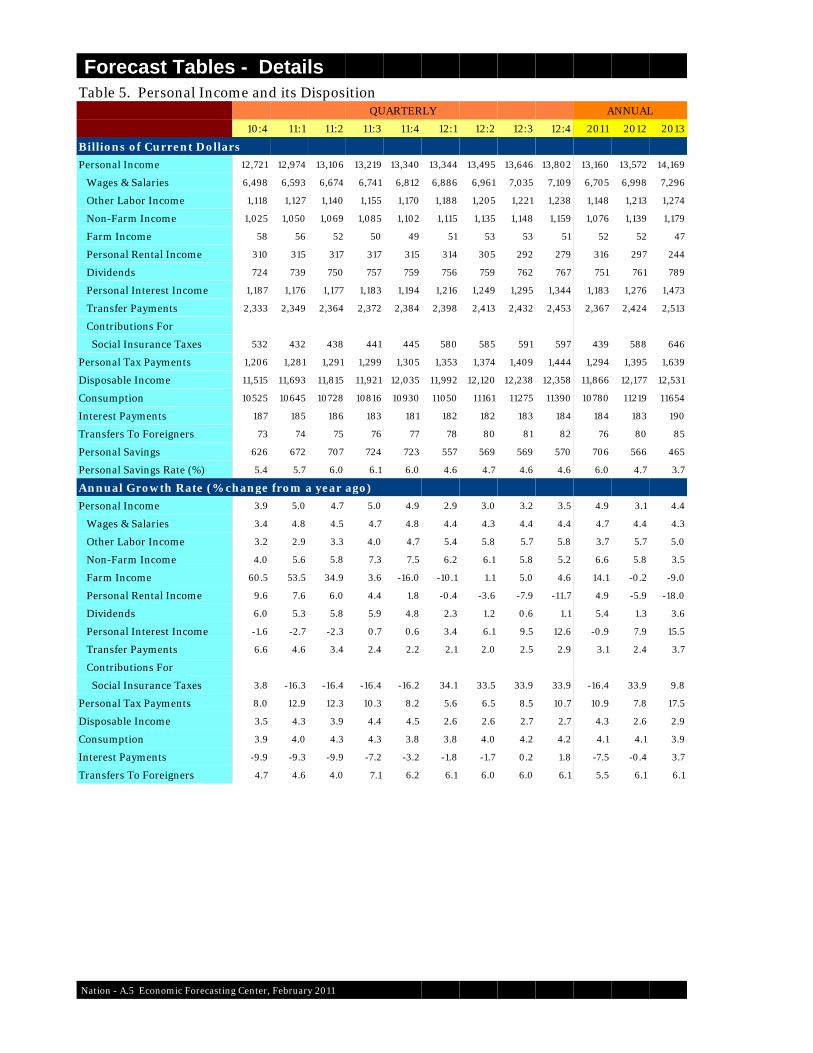
Forecast Tables - DetailsTable 5. Personal Income and its Disposition
QUARTERLY ANNUAL
10:4 11:1 11:2 11:3 11:4 12:1 12:2 12:3 12:4 2011 2012 2013
Billions of Current Dollars
Personal Income 12,721 12,974 13,106 13,219 13,340 13,344 13,495 13,646 13,802 13,160 13,572 14,169
Wages & Salaries 6,498 6,593 6,674 6,741 6,812 6,886 6,961 7,035 7,109 6,705 6,998 7,296
Other Labor Income 1,118 1,127 1,140 1,155 1,170 1,188 1,205 1,221 1,238 1,148 1,213 1,274
Non-Farm Income 1,025 1,050 1,069 1,085 1,102 1,115 1,135 1,148 1,159 1,076 1,139 1,179
Farm Income 58 56 52 50 49 51 53 53 51 52 52 47
Personal Rental Income 310 315 317 317 315 314 305 292 279 316 297 244
Dividends 724 739 750 757 759 756 759 762 767 751 761 789
Personal Interest Income 1,187 1,176 1,177 1,183 1,194 1,216 1,249 1,295 1,344 1,183 1,276 1,473
Transfer Payments 2,333 2,349 2,364 2,372 2,384 2,398 2,413 2,432 2,453 2,367 2,424 2,513
Contributions For
Social Insurance Taxes 532 432 438 441 445 580 585 591 597 439 588 646
Personal Tax Payments 1,206 1,281 1,291 1,299 1,305 1,353 1,374 1,409 1,444 1,294 1,395 1,639
Disposable Income 11,515 11,693 11,815 11,921 12,035 11,992 12,120 12,238 12,358 11,866 12,177 12,531
Consumption 10525 10645 10728 10816 10930 11050 11161 11275 11390 10780 11219 11654
Interest Payments 187 185 186 183 181 182 182 183 184 184 183 190
Transfers To Foreigners 73 74 75 76 77 78 80 81 82 76 80 85
Personal Savings 626 672 707 724 723 557 569 569 570 706 566 465
Personal Savings Rate (%) 5.4 5.7 6.0 6.1 6.0 4.6 4.7 4.6 4.6 6.0 4.7 3.7
Annual Growth Rate (% change from a year ago)
Personal Income 3.9 5.0 4.7 5.0 4.9 2.9 3.0 3.2 3.5 4.9 3.1 4.4
Wages & Salaries 3.4 4.8 4.5 4.7 4.8 4.4 4.3 4.4 4.4 4.7 4.4 4.3
Other Labor Income 3.2 2.9 3.3 4.0 4.7 5.4 5.8 5.7 5.8 3.7 5.7 5.0
Non-Farm Income 4.0 5.6 5.8 7.3 7.5 6.2 6.1 5.8 5.2 6.6 5.8 3.5
Farm Income 60.5 53.5 34.9 3.6 -16.0 -10.1 1.1 5.0 4.6 14.1 -0.2 -9.0
Personal Rental Income 9.6 7.6 6.0 4.4 1.8 -0.4 -3.6 -7.9 -11.7 4.9 -5.9 -18.0
Dividends 6.0 5.3 5.8 5.9 4.8 2.3 1.2 0.6 1.1 5.4 1.3 3.6
Personal Interest Income -1.6 -2.7 -2.3 0.7 0.6 3.4 6.1 9.5 12.6 -0.9 7.9 15.5
Transfer Payments 6.6 4.6 3.4 2.4 2.2 2.1 2.0 2.5 2.9 3.1 2.4 3.7
Contributions For
Social Insurance Taxes 3.8 -16.3 -16.4 -16.4 -16.2 34.1 33.5 33.9 33.9 -16.4 33.9 9.8
Personal Tax Payments 8.0 12.9 12.3 10.3 8.2 5.6 6.5 8.5 10.7 10.9 7.8 17.5
Disposable Income 3.5 4.3 3.9 4.4 4.5 2.6 2.6 2.7 2.7 4.3 2.6 2.9
Consumption 3.9 4.0 4.3 4.3 3.8 3.8 4.0 4.2 4.2 4.1 4.1 3.9
Interest Payments -9.9 -9.3 -9.9 -7.2 -3.2 -1.8 -1.7 0.2 1.8 -7.5 -0.4 3.7
Transfers To Foreigners 4.7 4.6 4.0 7.1 6.2 6.1 6.0 6.0 6.1 5.5 6.1 6.1
Nation - A.5 Economic Forecasting Center, February 2011
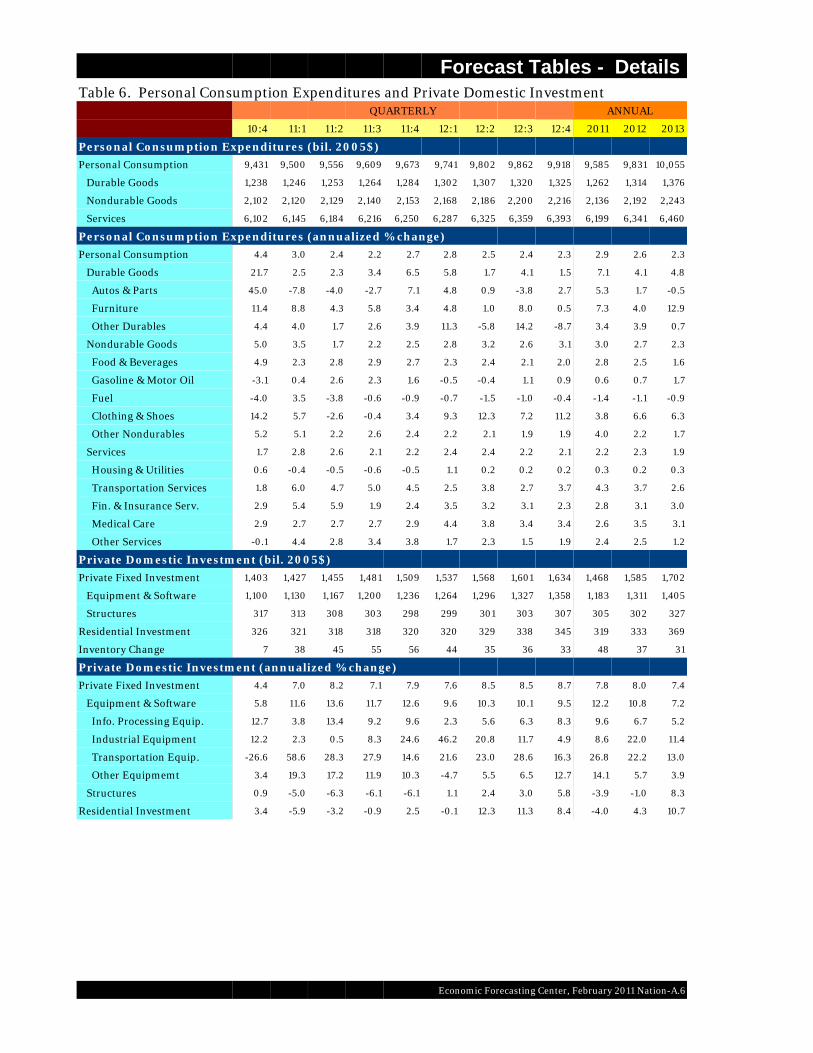
Forecast Tables - Details Table 6. Personal Consumption Expenditures and Private Domestic Investment
QUARTERLY ANNUAL
10:4 11:1 11:2 11:3 11:4 12:1 12:2 12:3 12:4 2011 2012 2013
Personal Consumption Expenditures (bil. 2005$)
Personal Consumption 9,431 9,500 9,556 9,609 9,673 9,741 9,802 9,862 9,918 9,585 9,831 10,055
Durable Goods 1,238 1,246 1,253 1,264 1,284 1,302 1,307 1,320 1,325 1,262 1,314 1,376
Nondurable Goods 2,102 2,120 2,129 2,140 2,153 2,168 2,186 2,200 2,216 2,136 2,192 2,243
Services 6,102 6,145 6,184 6,216 6,250 6,287 6,325 6,359 6,393 6,199 6,341 6,460
Personal Consumption Expenditures (annualized % change)
Personal Consumption 4.4 3.0 2.4 2.2 2.7 2.8 2.5 2.4 2.3 2.9 2.6 2.3
Durable Goods 21.7 2.5 2.3 3.4 6.5 5.8 1.7 4.1 1.5 7.1 4.1 4.8
Autos & Parts 45.0 -7.8 -4.0 -2.7 7.1 4.8 0.9 -3.8 2.7 5.3 1.7 -0.5
Furniture 11.4 8.8 4.3 5.8 3.4 4.8 1.0 8.0 0.5 7.3 4.0 12.9
Other Durables 4.4 4.0 1.7 2.6 3.9 11.3 -5.8 14.2 -8.7 3.4 3.9 0.7
Nondurable Goods 5.0 3.5 1.7 2.2 2.5 2.8 3.2 2.6 3.1 3.0 2.7 2.3
Food & Beverages 4.9 2.3 2.8 2.9 2.7 2.3 2.4 2.1 2.0 2.8 2.5 1.6
Gasoline & Motor Oil -3.1 0.4 2.6 2.3 1.6 -0.5 -0.4 1.1 0.9 0.6 0.7 1.7
Fuel -4.0 3.5 -3.8 -0.6 -0.9 -0.7 -1.5 -1.0 -0.4 -1.4 -1.1 -0.9
Clothing & Shoes 14.2 5.7 -2.6 -0.4 3.4 9.3 12.3 7.2 11.2 3.8 6.6 6.3
Other Nondurables 5.2 5.1 2.2 2.6 2.4 2.2 2.1 1.9 1.9 4.0 2.2 1.7
Services 1.7 2.8 2.6 2.1 2.2 2.4 2.4 2.2 2.1 2.2 2.3 1.9
Housing & Utilities 0.6 -0.4 -0.5 -0.6 -0.5 1.1 0.2 0.2 0.2 0.3 0.2 0.3
Transportation Services 1.8 6.0 4.7 5.0 4.5 2.5 3.8 2.7 3.7 4.3 3.7 2.6
Fin. & Insurance Serv. 2.9 5.4 5.9 1.9 2.4 3.5 3.2 3.1 2.3 2.8 3.1 3.0
Medical Care 2.9 2.7 2.7 2.7 2.9 4.4 3.8 3.4 3.4 2.6 3.5 3.1
Other Services -0.1 4.4 2.8 3.4 3.8 1.7 2.3 1.5 1.9 2.4 2.5 1.2
Private Domestic Investment (bil. 2005$)
Private Fixed Investment 1,403 1,427 1,455 1,481 1,509 1,537 1,568 1,601 1,634 1,468 1,585 1,702
Equipment & Software 1,100 1,130 1,167 1,200 1,236 1,264 1,296 1,327 1,358 1,183 1,311 1,405
Structures 317 313 308 303 298 299 301 303 307 305 302 327
Residential Investment 326 321 318 318 320 320 329 338 345 319 333 369
Inventory Change 7 38 45 55 56 44 35 36 33 48 37 31
Private Domestic Investment (annualized % change)
Private Fixed Investment 4.4 7.0 8.2 7.1 7.9 7.6 8.5 8.5 8.7 7.8 8.0 7.4
Equipment & Software 5.8 11.6 13.6 11.7 12.6 9.6 10.3 10.1 9.5 12.2 10.8 7.2
Info. Processing Equip. 12.7 3.8 13.4 9.2 9.6 2.3 5.6 6.3 8.3 9.6 6.7 5.2
Industrial Equipment 12.2 2.3 0.5 8.3 24.6 46.2 20.8 11.7 4.9 8.6 22.0 11.4
Transportation Equip. -26.6 58.6 28.3 27.9 14.6 21.6 23.0 28.6 16.3 26.8 22.2 13.0
Other Equipmemt 3.4 19.3 17.2 11.9 10.3 -4.7 5.5 6.5 12.7 14.1 5.7 3.9
Structures 0.9 -5.0 -6.3 -6.1 -6.1 1.1 2.4 3.0 5.8 -3.9 -1.0 8.3
Residential Investment 3.4 -5.9 -3.2 -0.9 2.5 -0.1 12.3 11.3 8.4 -4.0 4.3 10.7
Economic Forecasting Center, February 2011 Nation-A.6
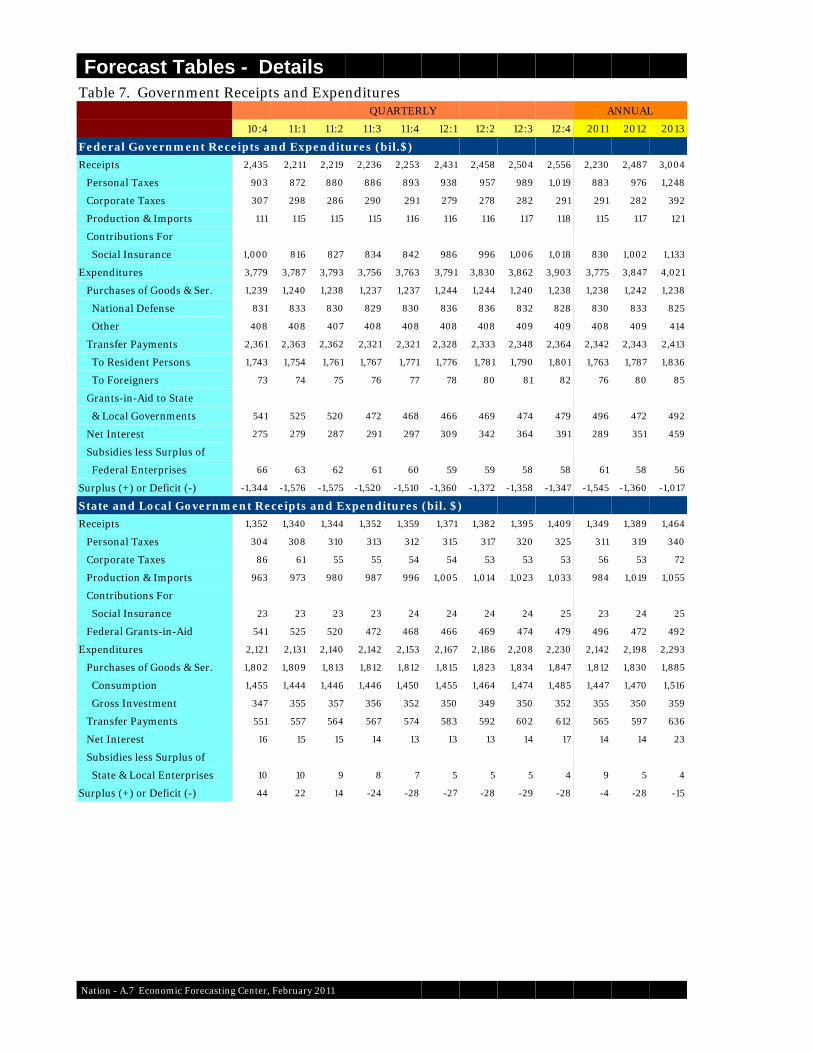
Forecast Tables - DetailsTable 7. Government Receipts and Expenditures
QUARTERLY ANNUAL
10:4 11:1 11:2 11:3 11:4 12:1 12:2 12:3 12:4 2011 2012 2013
Federal Government Receipts and Expenditures (bil.$)
Receipts 2,435 2,211 2,219 2,236 2,253 2,431 2,458 2,504 2,556 2,230 2,487 3,004
Personal Taxes 903 872 880 886 893 938 957 989 1,019 883 976 1,248
Corporate Taxes 307 298 286 290 291 279 278 282 291 291 282 392
Production & Imports 111 115 115 115 116 116 116 117 118 115 117 121
Contributions For
Social Insurance 1,000 816 827 834 842 986 996 1,006 1,018 830 1,002 1,133
Expenditures 3,779 3,787 3,793 3,756 3,763 3,791 3,830 3,862 3,903 3,775 3,847 4,021
Purchases of Goods & Ser. 1,239 1,240 1,238 1,237 1,237 1,244 1,244 1,240 1,238 1,238 1,242 1,238
National Defense 831 833 830 829 830 836 836 832 828 830 833 825
Other 408 408 407 408 408 408 408 409 409 408 409 414
Transfer Payments 2,361 2,363 2,362 2,321 2,321 2,328 2,333 2,348 2,364 2,342 2,343 2,413
To Resident Persons 1,743 1,754 1,761 1,767 1,771 1,776 1,781 1,790 1,801 1,763 1,787 1,836
To Foreigners 73 74 75 76 77 78 80 81 82 76 80 85
Grants-in-Aid to State
& Local Governments 541 525 520 472 468 466 469 474 479 496 472 492
Net Interest 275 279 287 291 297 309 342 364 391 289 351 459
Subsidies less Surplus of
Federal Enterprises 66 63 62 61 60 59 59 58 58 61 58 56
Surplus (+) or Deficit (-) -1,344 -1,576 -1,575 -1,520 -1,510 -1,360 -1,372 -1,358 -1,347 -1,545 -1,360 -1,017
State and Local Government Receipts and Expenditures (bil. $)
Receipts 1,352 1,340 1,344 1,352 1,359 1,371 1,382 1,395 1,409 1,349 1,389 1,464
Personal Taxes 304 308 310 313 312 315 317 320 325 311 319 340
Corporate Taxes 86 61 55 55 54 54 53 53 53 56 53 72
Production & Imports 963 973 980 987 996 1,005 1,014 1,023 1,033 984 1,019 1,055
Contributions For
Social Insurance 23 23 23 23 24 24 24 24 25 23 24 25
Federal Grants-in-Aid 541 525 520 472 468 466 469 474 479 496 472 492
Expenditures 2,121 2,131 2,140 2,142 2,153 2,167 2,186 2,208 2,230 2,142 2,198 2,293
Purchases of Goods & Ser. 1,802 1,809 1,813 1,812 1,812 1,815 1,823 1,834 1,847 1,812 1,830 1,885
Consumption 1,455 1,444 1,446 1,446 1,450 1,455 1,464 1,474 1,485 1,447 1,470 1,516
Gross Investment 347 355 357 356 352 350 349 350 352 355 350 359
Transfer Payments 551 557 564 567 574 583 592 602 612 565 597 636
Net Interest 16 15 15 14 13 13 13 14 17 14 14 23
Subsidies less Surplus of
State & Local Enterprises 10 10 9 8 7 5 5 5 4 9 5 4
Surplus (+) or Deficit (-) 44 22 14 -24 -28 -27 -28 -29 -28 -4 -28 -15
Nation - A.7 Economic Forecasting Center, February 2011
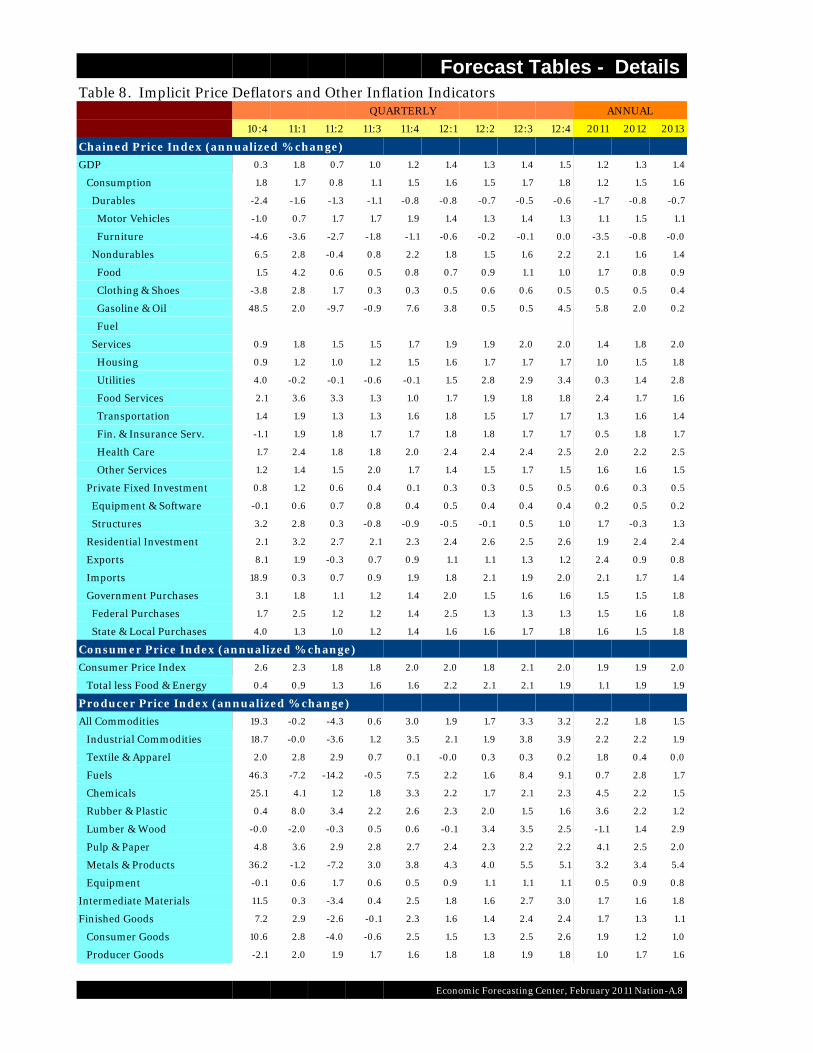
Forecast Tables - Details Table 8. Implicit Price Deflators and Other Inflation Indicators
QUARTERLY ANNUAL
10:4 11:1 11:2 11:3 11:4 12:1 12:2 12:3 12:4 2011 2012 2013
Chained Price Index (annualized % change)
GDP 0.3 1.8 0.7 1.0 1.2 1.4 1.3 1.4 1.5 1.2 1.3 1.4
Consumption 1.8 1.7 0.8 1.1 1.5 1.6 1.5 1.7 1.8 1.2 1.5 1.6
Durables -2.4 -1.6 -1.3 -1.1 -0.8 -0.8 -0.7 -0.5 -0.6 -1.7 -0.8 -0.7
Motor Vehicles -1.0 0.7 1.7 1.7 1.9 1.4 1.3 1.4 1.3 1.1 1.5 1.1
Furniture -4.6 -3.6 -2.7 -1.8 -1.1 -0.6 -0.2 -0.1 0.0 -3.5 -0.8 -0.0
Nondurables 6.5 2.8 -0.4 0.8 2.2 1.8 1.5 1.6 2.2 2.1 1.6 1.4
Food 1.5 4.2 0.6 0.5 0.8 0.7 0.9 1.1 1.0 1.7 0.8 0.9
Clothing & Shoes -3.8 2.8 1.7 0.3 0.3 0.5 0.6 0.6 0.5 0.5 0.5 0.4
Gasoline & Oil 48.5 2.0 -9.7 -0.9 7.6 3.8 0.5 0.5 4.5 5.8 2.0 0.2
Fuel
Services 0.9 1.8 1.5 1.5 1.7 1.9 1.9 2.0 2.0 1.4 1.8 2.0
Housing 0.9 1.2 1.0 1.2 1.5 1.6 1.7 1.7 1.7 1.0 1.5 1.8
Utilities 4.0 -0.2 -0.1 -0.6 -0.1 1.5 2.8 2.9 3.4 0.3 1.4 2.8
Food Services 2.1 3.6 3.3 1.3 1.0 1.7 1.9 1.8 1.8 2.4 1.7 1.6
Transportation 1.4 1.9 1.3 1.3 1.6 1.8 1.5 1.7 1.7 1.3 1.6 1.4
Fin. & Insurance Serv. -1.1 1.9 1.8 1.7 1.7 1.8 1.8 1.7 1.7 0.5 1.8 1.7
Health Care 1.7 2.4 1.8 1.8 2.0 2.4 2.4 2.4 2.5 2.0 2.2 2.5
Other Services 1.2 1.4 1.5 2.0 1.7 1.4 1.5 1.7 1.5 1.6 1.6 1.5
Private Fixed Investment 0.8 1.2 0.6 0.4 0.1 0.3 0.3 0.5 0.5 0.6 0.3 0.5
Equipment & Software -0.1 0.6 0.7 0.8 0.4 0.5 0.4 0.4 0.4 0.2 0.5 0.2
Structures 3.2 2.8 0.3 -0.8 -0.9 -0.5 -0.1 0.5 1.0 1.7 -0.3 1.3
Residential Investment 2.1 3.2 2.7 2.1 2.3 2.4 2.6 2.5 2.6 1.9 2.4 2.4
Exports 8.1 1.9 -0.3 0.7 0.9 1.1 1.1 1.3 1.2 2.4 0.9 0.8
Imports 18.9 0.3 0.7 0.9 1.9 1.8 2.1 1.9 2.0 2.1 1.7 1.4
Government Purchases 3.1 1.8 1.1 1.2 1.4 2.0 1.5 1.6 1.6 1.5 1.5 1.8
Federal Purchases 1.7 2.5 1.2 1.2 1.4 2.5 1.3 1.3 1.3 1.5 1.6 1.8
State & Local Purchases 4.0 1.3 1.0 1.2 1.4 1.6 1.6 1.7 1.8 1.6 1.5 1.8
Consumer Price Index (annualized % change)
Consumer Price Index 2.6 2.3 1.8 1.8 2.0 2.0 1.8 2.1 2.0 1.9 1.9 2.0
Total less Food & Energy 0.4 0.9 1.3 1.6 1.6 2.2 2.1 2.1 1.9 1.1 1.9 1.9
Producer Price Index (annualized % change)
All Commodities 19.3 -0.2 -4.3 0.6 3.0 1.9 1.7 3.3 3.2 2.2 1.8 1.5
Industrial Commodities 18.7 -0.0 -3.6 1.2 3.5 2.1 1.9 3.8 3.9 2.2 2.2 1.9
Textile & Apparel 2.0 2.8 2.9 0.7 0.1 -0.0 0.3 0.3 0.2 1.8 0.4 0.0
Fuels 46.3 -7.2 -14.2 -0.5 7.5 2.2 1.6 8.4 9.1 0.7 2.8 1.7
Chemicals 25.1 4.1 1.2 1.8 3.3 2.2 1.7 2.1 2.3 4.5 2.2 1.5
Rubber & Plastic 0.4 8.0 3.4 2.2 2.6 2.3 2.0 1.5 1.6 3.6 2.2 1.2
Lumber & Wood -0.0 -2.0 -0.3 0.5 0.6 -0.1 3.4 3.5 2.5 -1.1 1.4 2.9
Pulp & Paper 4.8 3.6 2.9 2.8 2.7 2.4 2.3 2.2 2.2 4.1 2.5 2.0
Metals & Products 36.2 -1.2 -7.2 3.0 3.8 4.3 4.0 5.5 5.1 3.2 3.4 5.4
Equipment -0.1 0.6 1.7 0.6 0.5 0.9 1.1 1.1 1.1 0.5 0.9 0.8
Intermediate Materials 11.5 0.3 -3.4 0.4 2.5 1.8 1.6 2.7 3.0 1.7 1.6 1.8
Finished Goods 7.2 2.9 -2.6 -0.1 2.3 1.6 1.4 2.4 2.4 1.7 1.3 1.1
Consumer Goods 10.6 2.8 -4.0 -0.6 2.5 1.5 1.3 2.5 2.6 1.9 1.2 1.0
Producer Goods -2.1 2.0 1.9 1.7 1.6 1.8 1.8 1.9 1.8 1.0 1.7 1.6
Economic Forecasting Center, February 2011 Nation-A.8
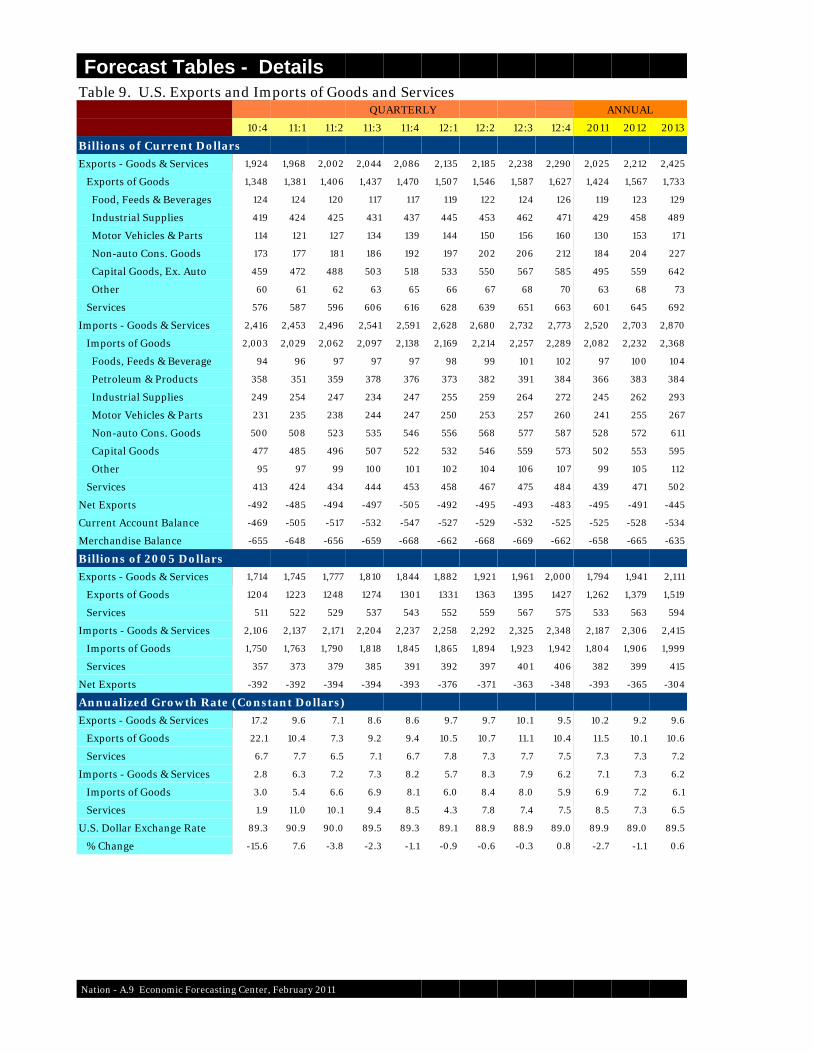
Forecast Tables - DetailsTable 9. U.S. Exports and Imports of Goods and Services
QUARTERLY ANNUAL
10:4 11:1 11:2 11:3 11:4 12:1 12:2 12:3 12:4 2011 2012 2013
Billions of Current Dollars
Exports - Goods & Services 1,924 1,968 2,002 2,044 2,086 2,135 2,185 2,238 2,290 2,025 2,212 2,425
Exports of Goods 1,348 1,381 1,406 1,437 1,470 1,507 1,546 1,587 1,627 1,424 1,567 1,733
Food, Feeds & Beverages 124 124 120 117 117 119 122 124 126 119 123 129
Industrial Supplies 419 424 425 431 437 445 453 462 471 429 458 489
Motor Vehicles & Parts 114 121 127 134 139 144 150 156 160 130 153 171
Non-auto Cons. Goods 173 177 181 186 192 197 202 206 212 184 204 227
Capital Goods, Ex. Auto 459 472 488 503 518 533 550 567 585 495 559 642
Other 60 61 62 63 65 66 67 68 70 63 68 73
Services 576 587 596 606 616 628 639 651 663 601 645 692
Imports - Goods & Services 2,416 2,453 2,496 2,541 2,591 2,628 2,680 2,732 2,773 2,520 2,703 2,870
Imports of Goods 2,003 2,029 2,062 2,097 2,138 2,169 2,214 2,257 2,289 2,082 2,232 2,368
Foods, Feeds & Beverage 94 96 97 97 97 98 99 101 102 97 100 104
Petroleum & Products 358 351 359 378 376 373 382 391 384 366 383 384
Industrial Supplies 249 254 247 234 247 255 259 264 272 245 262 293
Motor Vehicles & Parts 231 235 238 244 247 250 253 257 260 241 255 267
Non-auto Cons. Goods 500 508 523 535 546 556 568 577 587 528 572 611
Capital Goods 477 485 496 507 522 532 546 559 573 502 553 595
Other 95 97 99 100 101 102 104 106 107 99 105 112
Services 413 424 434 444 453 458 467 475 484 439 471 502
Net Exports -492 -485 -494 -497 -505 -492 -495 -493 -483 -495 -491 -445
Current Account Balance -469 -505 -517 -532 -547 -527 -529 -532 -525 -525 -528 -534
Merchandise Balance -655 -648 -656 -659 -668 -662 -668 -669 -662 -658 -665 -635
Billions of 2005 Dollars
Exports - Goods & Services 1,714 1,745 1,777 1,810 1,844 1,882 1,921 1,961 2,000 1,794 1,941 2,111
Exports of Goods 1204 1223 1248 1274 1301 1331 1363 1395 1427 1,262 1,379 1,519
Services 511 522 529 537 543 552 559 567 575 533 563 594
Imports - Goods & Services 2,106 2,137 2,171 2,204 2,237 2,258 2,292 2,325 2,348 2,187 2,306 2,415
Imports of Goods 1,750 1,763 1,790 1,818 1,845 1,865 1,894 1,923 1,942 1,804 1,906 1,999
Services 357 373 379 385 391 392 397 401 406 382 399 415
Net Exports -392 -392 -394 -394 -393 -376 -371 -363 -348 -393 -365 -304
Annualized Growth Rate (Constant Dollars)
Exports - Goods & Services 17.2 9.6 7.1 8.6 8.6 9.7 9.7 10.1 9.5 10.2 9.2 9.6
Exports of Goods 22.1 10.4 7.3 9.2 9.4 10.5 10.7 11.1 10.4 11.5 10.1 10.6
Services 6.7 7.7 6.5 7.1 6.7 7.8 7.3 7.7 7.5 7.3 7.3 7.2
Imports - Goods & Services 2.8 6.3 7.2 7.3 8.2 5.7 8.3 7.9 6.2 7.1 7.3 6.2
Imports of Goods 3.0 5.4 6.6 6.9 8.1 6.0 8.4 8.0 5.9 6.9 7.2 6.1
Services 1.9 11.0 10.1 9.4 8.5 4.3 7.8 7.4 7.5 8.5 7.3 6.5
U.S. Dollar Exchange Rate 89.3 90.9 90.0 89.5 89.3 89.1 88.9 88.9 89.0 89.9 89.0 89.5
% Change -15.6 7.6 -3.8 -2.3 -1.1 -0.9 -0.6 -0.3 0.8 -2.7 -1.1 0.6
Nation - A.9 Economic Forecasting Center, February 2011
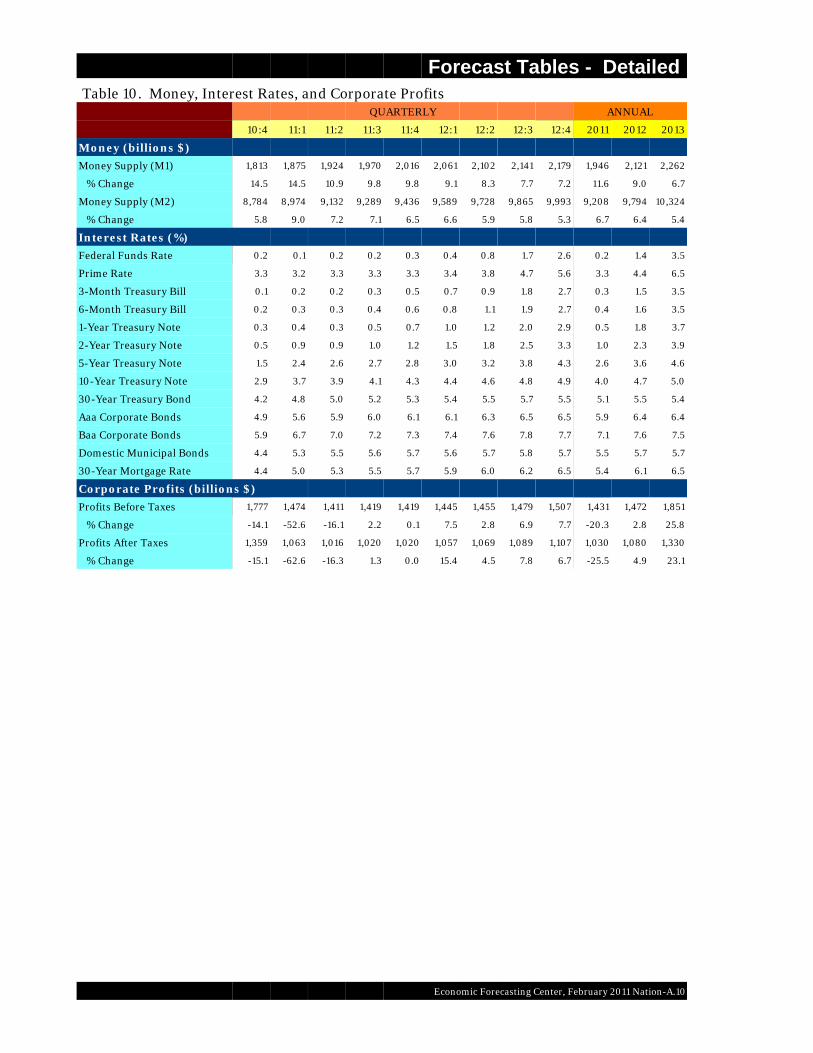
Forecast Tables - Detailed Table 10. Money, Interest Rates, and Corporate Profits
QUARTERLY ANNUAL
10:4 11:1 11:2 11:3 11:4 12:1 12:2 12:3 12:4 2011 2012 2013
Money (billions $)
Money Supply (M1) 1,813 1,875 1,924 1,970 2,016 2,061 2,102 2,141 2,179 1,946 2,121 2,262
% Change 14.5 14.5 10.9 9.8 9.8 9.1 8.3 7.7 7.2 11.6 9.0 6.7
Money Supply (M2) 8,784 8,974 9,132 9,289 9,436 9,589 9,728 9,865 9,993 9,208 9,794 10,324
% Change 5.8 9.0 7.2 7.1 6.5 6.6 5.9 5.8 5.3 6.7 6.4 5.4
Interest Rates (%)
Federal Funds Rate 0.2 0.1 0.2 0.2 0.3 0.4 0.8 1.7 2.6 0.2 1.4 3.5
Prime Rate 3.3 3.2 3.3 3.3 3.3 3.4 3.8 4.7 5.6 3.3 4.4 6.5
3-Month Treasury Bill 0.1 0.2 0.2 0.3 0.5 0.7 0.9 1.8 2.7 0.3 1.5 3.5
6-Month Treasury Bill 0.2 0.3 0.3 0.4 0.6 0.8 1.1 1.9 2.7 0.4 1.6 3.5
1-Year Treasury Note 0.3 0.4 0.3 0.5 0.7 1.0 1.2 2.0 2.9 0.5 1.8 3.7
2-Year Treasury Note 0.5 0.9 0.9 1.0 1.2 1.5 1.8 2.5 3.3 1.0 2.3 3.9
5-Year Treasury Note 1.5 2.4 2.6 2.7 2.8 3.0 3.2 3.8 4.3 2.6 3.6 4.6
10-Year Treasury Note 2.9 3.7 3.9 4.1 4.3 4.4 4.6 4.8 4.9 4.0 4.7 5.0
30-Year Treasury Bond 4.2 4.8 5.0 5.2 5.3 5.4 5.5 5.7 5.5 5.1 5.5 5.4
Aaa Corporate Bonds 4.9 5.6 5.9 6.0 6.1 6.1 6.3 6.5 6.5 5.9 6.4 6.4
Baa Corporate Bonds 5.9 6.7 7.0 7.2 7.3 7.4 7.6 7.8 7.7 7.1 7.6 7.5
Domestic Municipal Bonds 4.4 5.3 5.5 5.6 5.7 5.6 5.7 5.8 5.7 5.5 5.7 5.7
30-Year Mortgage Rate 4.4 5.0 5.3 5.5 5.7 5.9 6.0 6.2 6.5 5.4 6.1 6.5
Corporate Profits (billions $)
Profits Before Taxes 1,777 1,474 1,411 1,419 1,419 1,445 1,455 1,479 1,507 1,431 1,472 1,851
% Change -14.1 -52.6 -16.1 2.2 0.1 7.5 2.8 6.9 7.7 -20.3 2.8 25.8
Profits After Taxes 1,359 1,063 1,016 1,020 1,020 1,057 1,069 1,089 1,107 1,030 1,080 1,330
% Change -15.1 -62.6 -16.3 1.3 0.0 15.4 4.5 7.8 6.7 -25.5 4.9 23.1
Economic Forecasting Center, February 2011 Nation-A.10