Embed Size (px)
Citation preview

A Dual-Purpose Bridge Health Monitoring and
Weigh-In-Motion System
A Dual-Purpose Bridge Health Monitoring and
Weigh-In-Motion System
Anne-Marie McDonnell, P.E., Connecticut DOTRichard Christenson, Ph.D., University of CT
Susan Bakulski, University of CT
Anne-Marie McDonnell, P.E., Connecticut DOTRichard Christenson, Ph.D., University of CT
Susan Bakulski, University of CT
NATMEC June 2010NATMEC June 2010

• CT History of Bridge Health Monitoring & Weigh-In-Motion Research –Preliminary Test – Report NATMEC 2006–Short -Term Bridge Monitoring System
• Novel BWIM Method (Dr. Christenson)• Feasibility Test
–Field Data Collection, November 2008–Data Analysis & Results 2009
• Research Project : CT SPR-2265–Scope of Work –Status June 2010
• CT History of Bridge Health Monitoring & Weigh-In-Motion Research–Preliminary Test – Report NATMEC 2006–Short -Term Bridge Monitoring System
• Novel BWIM Method (Dr. Christenson)• Feasibility Test
–Field Data Collection, November 2008–Data Analysis & Results 2009
• Research Project : CT SPR-2265–Scope of Work –Status June 2010
OVERVIEWOVERVIEW

Short-Term Bridge Monitoring System
Short-Term Bridge Monitoring System
• Wireless Structural Testing System (STS-WiFi) – 8 strain gages; 2 nodes; 1 base
station
• Wireless Structural Testing System (STS-WiFi)– 8 strain gages; 2 nodes; 1 base
station

Christenson’s BWIM Method Theory
• Given: Area under strain is proportional to GVW (Ojio, ICWIM3)
• 2nd time derivative of strain indicates when axles pass over center of bridge
• Given: Area under strain is proportional to GVW (Ojio, ICWIM3)
• 2nd time derivative of strain indicates when axles pass over center of bridge

FEASIBILITY TEST

Test SiteTest Site• Typical Highway Bridge in Connecticut• I-91 Northbound at Exit 19: Meriden, CT• Typical Highway Bridge in Connecticut• I-91 Northbound at Exit 19: Meriden, CT

TEST BRIDGE – I-91 (NB)TEST BRIDGE – I-91 (NB)• Built in 1964: 3 Lanes• Single-Span, Simply-Supported• 8 Steel Girders with Composite Deck• 85 feet in length, skew angle: 12 degrees• Traffic ADT: 57,000 veh/day & 9% Trucks
• Built in 1964: 3 Lanes• Single-Span, Simply-Supported• 8 Steel Girders with Composite Deck• 85 feet in length, skew angle: 12 degrees• Traffic ADT: 57,000 veh/day & 9% Trucks
Street ViewStreet View

Half-Mile Prior to Weigh StationHalf-Mile Prior to Weigh Station

Weigh StationWeigh Station• Operated by CT Department of Public Safety
• Three static-platform scales- Scales were calibrated exactly one week prior to
testing (± 20 lb)
• Operated by CT Department of Public Safety
• Three static-platform scales- Scales were calibrated exactly one week prior to
testing (± 20 lb)

FIELD DATA COLLECTION November 20, 2008
FIELD DATA COLLECTION November 20, 2008

Installed Wireless Bridge Monitoring System
Installed Wireless Bridge Monitoring System
• 8 strain gages, mounted at mid-spanon the 6 inside girders
• 8 strain gages, mounted at mid-spanon the 6 inside girders

Strain SensorsStrain Sensors
• 8 strain gages, mounted at mid-span on the 6 inside girders – Six – 3” above the bottom flange– Two – 3” below the top flange
( on the two girders under lanes 1 and 2 )
• 8 strain gages, mounted at mid-span on the 6 inside girders – Six – 3” above the bottom flange– Two – 3” below the top flange
( on the two girders under lanes 1 and 2 )

Measurements At BridgeMeasurements At Bridge
• Strain gages (transducers) used to capture measurements of bridge response to traffic loading at the bridge
• Data captured at 100 Hz sample rate (0.01 sec) for 5 minute intervals
• Traffic stream captured on video at bridge when weigh station “OPEN” sign lighted
• Strain gages (transducers) used to capture measurements of bridge response to traffic loading at the bridge
• Data captured at 100 Hz sample rate (0.01 sec) for 5 minute intervals
• Traffic stream captured on video at bridge when weigh station “OPEN” sign lighted

Data Acquisition - BridgeData Acquisition - Bridge
• Truck passing events were identified manually flagged in data records and synchronized with video
• Measured trucks were directed into weigh station (next exit)
• Truck passing events were identified manually flagged in data records and synchronized with video
• Measured trucks were directed into weigh station (next exit)
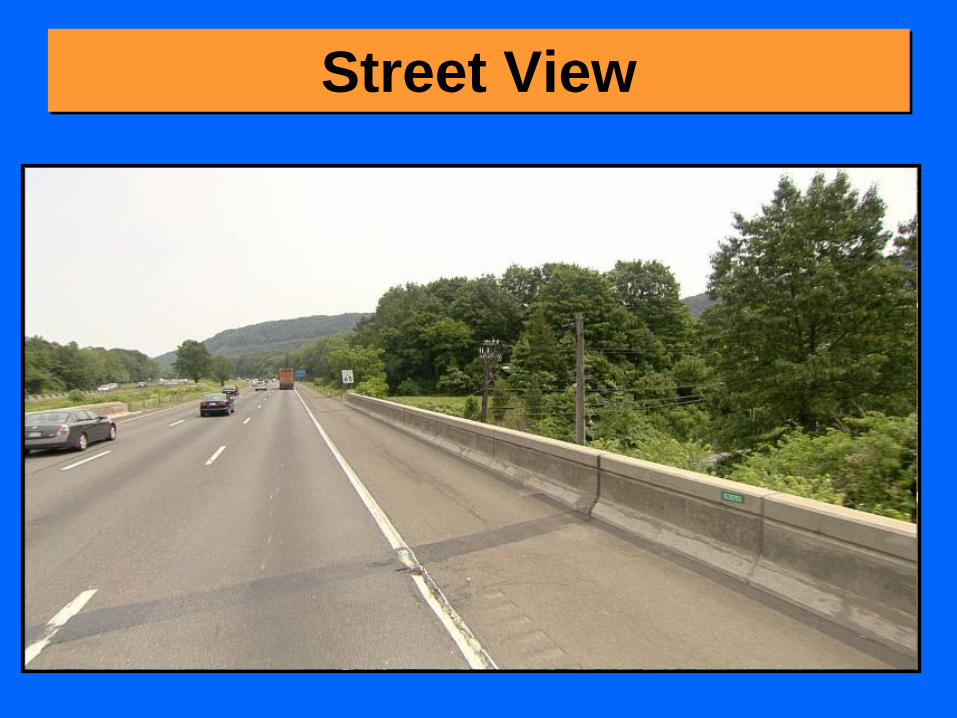
SyncronizationSyncronization
• 3 Video Cameras• 3-Point Radio Contact • 1 Still-frame Camera
• 3 Video Cameras• 3-Point Radio Contact • 1 Still-frame Camera

Data Acquisition – Weigh StationData Acquisition – Weigh Station
• Static Weight Records recorded manually and on video in scale house (GVW and axle weights)
• Vehicle Lengths acquired from still-frame photos taken across from scales
• Video verification of vehicle sequence acquired across from scale
• Static Weight Records recorded manually and on video in scale house (GVW and axle weights)
• Vehicle Lengths acquired from still-frame photos taken across from scales
• Video verification of vehicle sequence acquired across from scale


Control Vehicle : 5-Axle TruckControl Vehicle : 5-Axle Truck
Gross Vehicle Weight 67,420 lbsAxle Weight (1) 10,020 lbs
Axle Group Weight (2 & 3) 27,040 lbsAxle Group Weight (4 & 5) 30,360 lbs
Length (first to last axle) 44.6 feetAxle Spacing (1-2) 11.8 feetAxle Spacing (2-3) 4.4 feetAxle Spacing (3-4) 24.4 feetAxle Spacing (4-5) 4.1 feet

Data Analysis

5-Axle Truck of Known-Weight5-Axle Truck of Known-Weight• Total of 22 passes over the bridge
Example Output: 4 passes over lane 1 at 55 mph
• Total of 22 passes over the bridgeExample Output:
4 passes over lane 1 at 55 mph

Christenson’s BWIM Theory
• Area under strain is proportional to GVW (Ojio, ICWIM3)
• 2nd time derivative of strain indicates when axles pass over center of bridge
• Speed is critical calculation

Control VehicleM
icro
stra
in
Time (seconds)
Time (seconds)
Seco
nd D
eriv
ativ
e of
Str
ain
StrainOutput:
GVW
2nd Derivative of Strain:
speed, lengths &
axle weights

Actual Truck Traffic (125 sec sample)
Actual Truck Traffic (125 sec sample)
71,100 lbs78,000 lbs
8,800 lbs
34,300 lbs47,300 lbs
16,500 lbs
78,300 lbs
55,000 lbs
48,100 lbs

Bridge WeighBridge Weigh--InIn--Motion (BWIM)Motion (BWIM)

RESULTS

BWIM: Test Truck in Lane 1PERCENT DIFFERENCE( Based on 10 Passes ) Mean
Std Dev <E>0.95
GVW [%] 0.00* 2.45 [-6.31; 6.31]Axle Weight (P1 ) [%] 31.88 44.91 [-83.59; 147.36]
Axle Group Weight (P2 + P3 ) [%] 13.23 15.90 [-27.64; 54.11]
Axle Group Weight (P4 + P5 ) [%] -17.79 16.58 [-60.43; 24.85]
Wheelbase (sum of di ) [ft] 2.49 2.69 [-1.35; 2.88]Axle Spacing (d1 ) [ft] 0.16 1.15 [-0.85; 0.95]Axle Spacing (d2 ) [ft] 1.35 0.79 [-0.22; 1.04]Axle Spacing (d3 ) [ft] 0.52 1.25 [-0.82; 1.14]Axle Spacing (d4 ) [ft] 0.46 2.53 [-1.85; 2.13]
* Test Truck Data Used to Determine Calibration Factor
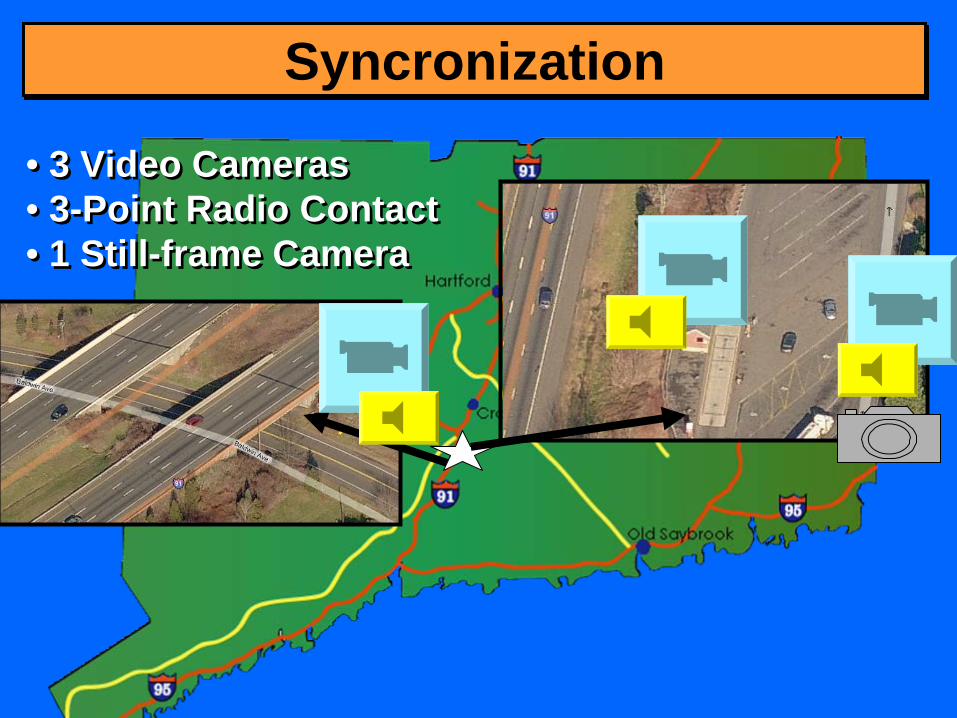
BWIM: Test Truck in Lane 2Percent Difference
(based on 5 passes) Mean StdDev <E>0.95
GVW [%] 0.01* 5.91 [-15.19; 15.20]
Axle Weight (P1 ) [%] 9.79 69.83 [–169.75; 189.32]
Axle Group Weight (P2 + P3 ) [%] -10.62 61.25 [–168.11; 146.86]
Axle Group Weight (P4 + P5 ) [%] 9.27 52.54 [-125.81; 144.35]
Wheelbase (sum of di ) [ft] 5.91 2.92 [-1.64; 13.45]
Axle Spacing (d1 ) [ft] 0.23 0.92 [-2.17; 2.62]
Axle Spacing (d2 ) [ft] 1.84 1.02 [-0.82; 4.46]
Axle Spacing (d3 ) [ft] -3.71 8.37 [-25.26; 17.81]
Axle Spacing (d4 ) [ft] 0.95 1.84 [-3.77; 5.64]

0102030405060708090
100
0 20 40 60 80 100
BWIM GVW (kips)
Stat
ic G
VW (k
ips)
Results From Traffic Stream

Range of Truck Traffic Weights• 122 trucks from the traffic stream• 122 trucks from the traffic stream
0
5
10
15
20
25
30
35
< 20 20-30 30-40 40-50 50-60 60-70 70-80 80-90 90-100
Weight Ranges (kips)
Num
ber o
f Tru
cks

BWIM Percent Difference from Static GVW
- Trucks from the Traffic Stream
Lane # Trucks Mean Std Dev
<E>0.95
1 109 -1.94 12.78 [-27.28; 23.39]
2 8 6.23 19.72 [-39.23; 51.70]

BWIM Percent Difference from Static GVW 5-Axle Trucks from the Traffic Stream
Lane # Trucks Mean Std Dev
<E>0.95
1 64 -1.13 8.22 [-17.52; 15,26]
2 5 14.18 20.31 [-38.03; 66.39]

Feasibility Results• Applied novel approach to calculate speed and axle
spacing and weights.
• Demonstrated Non-Intrusive Bridge Weigh-In-Motion using only Strain Measurements applied to a single- span steel girder bridge can produce gross vehicle weights, axle weights and speed.
• Seek improvements for acquisition of axle weights and speed data.
• Seek improvements for lane and multiple vehicle event configurations.
• Report Available Online
• Applied novel approach to calculate speed and axle spacing and weights.
• Demonstrated Non-Intrusive Bridge Weigh-In-Motion using only Strain Measurements applied to a single- span steel girder bridge can produce gross vehicle weights, axle weights and speed.
• Seek improvements for acquisition of axle weights and speed data.
• Seek improvements for lane and multiple vehicle event configurations.
• Report Available Online

Acknowledgement
Great cooperation from and between ConnDOT,
UCONN, CT State Police & FHWA.
Great cooperation from and between ConnDOT,
UCONN, CT State Police & FHWA.

“Development of a Dual-Purpose Bridge Health Monitoring (BHM) and
Bridge Weigh-In-Motion (BWIM) System For A Steel Girder Bridge”
“Development of a Dual-Purpose Bridge Health Monitoring (BHM) and
Bridge Weigh-In-Motion (BWIM) System For A Steel Girder Bridge”
CT - State Research Project: SPR- 2265

BHM integrated and focused on BWIM data collection abilities
System development Field DeploymentContinuous Data CollectionPeriodic ValidationAssess system robustness and
stability over time
BHM integrated and focused on BWIM data collection abilities
System development Field DeploymentContinuous Data CollectionPeriodic ValidationAssess system robustness and
stability over time
Research Project Key Elements

Sensors for Meriden Bridge
• Strain–Vibrating Wire Strain Gage–Quartz Strain Transducer
• Accelerometer(s)–Integrated Circuit
Piezoelectric (ICP) –Variable Capacitance
• Temperature–Surface Mount RTD
• Strain–Vibrating Wire Strain Gage–Quartz Strain Transducer
• Accelerometer(s)–Integrated Circuit
Piezoelectric (ICP)–Variable Capacitance
• Temperature–Surface Mount RTD

Innovative Sensor Technology: Quartz Strain Transducers
• Will allow for high sensitivity strain measurements
• Frequency range down to 0.1 Hz• Powered in the field from Compact Data
Acquisition (cDAQ) using Range Capacitor and Impedance Converter
• Will allow for high sensitivity strain measurements
• Frequency range down to 0.1 Hz• Powered in the field from Compact Data
Acquisition (cDAQ) using Range Capacitor and Impedance Converter

Innovative Sensor Technology: Capacitive Accelerometers
• Will allow for constant acceleration measurements
• Frequency Range: 0-250 Hz• Powered in the field from Compact Data
Acquisition Unit using DC power supply module and analog input module
• Will allow for constant acceleration measurements
• Frequency Range: 0-250 Hz• Powered in the field from Compact Data
Acquisition Unit using DC power supply module and analog input module

Proposed Sensor Layout
= STRAIN TYPE 1 = ACCEL TYPE 1 = TEMP= STRAIN TYPE 2 = ACCEL TYPE 2
MERIDEN BRIDGE I-91 NB

Installation – Summer 2010

PI’s Contact Information
Anne-Marie McDonnellConnecticut Department of Transportation
[email protected](860) 258-0308
Dr. Richard ChristensonUniversity of [email protected]
(860) 486-2270
Anne-Marie McDonnellConnecticut Department of Transportation
[email protected](860) 258-0308
Dr. Richard ChristensonUniversity of [email protected]
(860) 486-2270