Embed Size (px)
Citation preview

J Forensic Sci, Sept. 2005, Vol. 50, No. 5Paper ID JFS2004423
Available online at: www.astm.org
Mark D. Timken,1 Ph.D.; Katie L. Swango,1 Ph.D.; Cristian Orrego,1 Ph.D.;and Martin R. Buoncristiani,1 M.P.H.
A Duplex Real-Time qPCR Assay forthe Quantification of Human Nuclearand Mitochondrial DNA in ForensicSamples: Implications for Quantifying DNAin Degraded Samples∗
ABSTRACT: A duplex real-time qPCR assay was developed for quantifying human nuclear and mitochondrial DNA in forensic samples. Thenuclear portion of the assay utilized amplification of a ∼170–190 bp target sequence that spans the repeat region of the TH01 STR locus, and themitochondrial portion of the assay utilized amplification of a 69 bp target sequence in the ND1 region. Validation studies, performed on an ABI7000 SDS instrument using TaqMan R© detection, demonstrated that both portions of the duplex assay provide suitable quantification sensitivity andprecision down to 10–15 copies of each genome of interest and that neither portion shows cross-reactivity to commonly encountered non-humangenomes. As part of the validation studies, a series of DNase-degraded samples were quantified using three different methods: the duplex nuclear-mitochondrial qPCR assay, the ABI QuantifilerTM Human DNA Quantification Kit qPCR assay, which amplifies and detects a 62 bp nuclear targetsequence, and slot blot hybridization. For non-degraded and moderately degraded samples in the series, all three methods were suitably accuratefor quantifying nuclear DNA to achieve successful STR amplifications to yield complete profiles using the ABI AmpFlSTR R© IdentifilerTM kit.However, for highly degraded samples, the duplex qPCR assay provided better estimates of nuclear template for STR amplification than did eitherthe commercial qPCR assay, which overestimated the quantity of STR-sized DNA fragments, leading to an increased proportion of undetectedalleles at the larger STR loci, or slot blot hybridization, which underestimated the quantity of nuclear DNA, leading to an increased proportion ofSTR amplification artifacts due to amplification of excess template.
KEYWORDS: forensic sciences, DNA quantitation, quantitative polymerase chain reaction, degraded DNA, TH01, ND1, melt transition
The need to increase throughput in forensic DNA genotypinghas led to a growing interest in developing new DNA quantifica-tion methods that are more efficient than the slot blot hybridizationmethod currently used in many forensic DNA labs (1). The slot blotmethod, though it offers excellent specificity and good sensitivity(2,3), relies on a protocol that is time-consuming, labor-intensive,and not readily transferable to automation. In response, there havebeen a number of recent publications that describe alternative ap-proaches for quantifying DNA in forensic samples, including aliquid hybridization assay (4,5) and several end-point PCR assays(6–8). Another approach that is proving to be useful for foren-sic DNA quantifications is real-time quantitative PCR (qPCR), amethod widely used in biomedical research and molecular diag-nostics (9–13). Quantitative PCR assays have been developed forvarious forensic applications, including the quantification of hu-man nuclear DNA (14–16), human mitochondrial DNA (17–19),and human Y-chromosomal DNA (16,19). These assays exploit fea-tures of qPCR that make the technique particularly attractive for
1 California Department of Justice Jan Bashinski DNA Laboratory, 1001 W.Cutting Blvd., Suite 110, Richmond, CA 94804.
∗ This work was supported, in part, by Grant Number 2002-IJ-CX-K008awarded by the National Institute of Justice, Office of Justice Programs, USDOJ. Points of view presented are those of the authors and do not necessarilyrepresent the official position or policies of the US Department of Justice.
Received 2 Oct. 2004; and in revised form 30 March 2005; accepted 9 April2005; published 3 Aug. 2005.
forensic applications: (i) qPCR assays can be designed to quantifyspecific genomes of interest; (ii) the assays can be sensitive enoughto detect only a few copies or even a single copy of target DNA;(iii) qPCR dynamic detection ranges readily span the roughly threeorders of magnitude (e.g., 30 pg to 30 ng of nuclear DNA) neededfor most forensic applications; and (iv) the experimental protocolsfor real-time qPCR quantitations are straightforward, labor-saving,and amenable to automation. Moreover, the use of target-specificdetection chemistries (e.g., TaqMan R© (20) or Molecular Beacon(21) probes) makes it possible to design multiplex, real-time qPCRassays that can simultaneously quantify more than one target in asample, offering the possibility for saving time, labor, and extractedDNA.
In this report, we describe a duplex real-time qPCR assay for thesimultaneous quantification of human nuclear and mitochondrialDNA in forensic samples. This assay was designed to be of generalutility for forensic DNA quantifications, but to be particularly use-ful for the post-extraction analysis of samples that contain highlydegraded DNA. Such samples, though not uncommon in standardcasework, are more often encountered in instances of mass disas-ters, mass graves, and missing persons’ cases (22,23). Short tandemrepeat (STR) genotyping, due to its high power of discriminationfor human identification, is typically the analytical method of firstchoice. However, the quality and/or quantity of extracted nuclearDNA in these degraded samples often preclude successful STRgenotyping, resulting in partial or no STR profiles. Such samplescan then be analyzed by less discriminatory typing methods based
Copyright C© 2005 by ASTM International, 100 Barr Harbor Drive, PO Box C700, West Conshohocken, PA 19428-2959. 1

2 JOURNAL OF FORENSIC SCIENCES
on polymorphisms in hypervariable subregions I and II (HVI andHVII) of the human mitochondrial control region. Presently, theinitial decision as to how to proceed with analysis, either by nu-clear STR or mitochondrial typing, is commonly based on a slotblot quantification approach that: (i) has been reported to under-estimate the quantity of nuclear DNA in degraded samples (24)and in samples that contain high levels of microbial contamina-tion (23); (ii) provides no information about the quality (fragmentlength) of the quantified nuclear DNA; (iii) provides no direct in-formation about the quantity of human mitochondrial DNA in thesample; and (iv) has no predictive information on the existence ofinhibitors that might interfere with the PCR. Due to these quan-tification deficiencies, the actual forensic analysis of challengingsamples often begins by obtaining inadequate STR typing results,and then proceeds by using any remaining extracted DNA to at-tempt mitochondrial typing. It has been noted previously (17) thatthe efficiency and quality of this analysis procedure could be im-proved substantially by obtaining reliable estimates of the amountsof human nuclear and mitochondrial DNA in these samples prior tobeginning analysis. Based on such estimates, an optimal analyticalapproach could be selected at the outset, leading directly to optimalgenotyping or haplotyping results and to a concomitant savings intime, labor, reagent/kit costs and extracted DNA.
Several recent publications have addressed exactly these issuesfor forensic samples, particularly for degraded samples. For ex-ample, von Wurmb-Schwark et al. (25) have developed a duplexendpoint PCR assay to detect a nuclear target (164 bp amplicon atbetaglobin) and a mitochondrial target (260 bp at ND1). In theirassay, the endpoint PCR products were resolved and detected bycapillary electrophoresis (CE)/fluorescence and, though the resultswere not claimed to be quantitative, the intensities of the nuclearand mitochondrial signals were shown to be useful for selecting theappropriate forensic analysis tool for the typing of anthropologicalbone samples. Alonso et al. (19,26) have developed several qPCRassays for degraded and challenging samples, including a duplexassay that simultaneously quantifies human X- and Y-chromosomes(106 bp and 112 bp targets at the amelogenin gene). They have alsodeveloped two singleplex qPCR assays for quantifying the humanmitochondrial genome, one with a 113 bp HVI target and the otherwith a 287 bp HVI target. Due to the size difference between thetwo target sequences, they demonstrated that a comparison of thequantification results from these mitochondrial qPCR assays couldprovide information about the degree of DNA degradation. Lastly,Andreasson et al. (17) have described a nuclear-mitochondrial du-plex qPCR assay. The nuclear portion of this assay quantifies a79 bp target at the retinoblastoma (RB1) gene, and the mitochon-drial portion quantifies a 135 bp target spanning the junction ofthe tRNAlys and ATP8 genes. Their results demonstrated that theduplex qPCR approach provides useful and sensitive DNA quan-tifications while saving analyst time and often-limited DNA. It hasbeen noted elsewhere (1), however, that the choice of RB1 as aqPCR target sequence may not be ideal because cross-species se-quence homology investigations indicate that the nuclear RB1 targetsequence is relatively conserved. Consequently, though this assaycan be expected to provide accurate results for forensic samples ofknown human origin, it has not been demonstrated to be sufficientlyprimate-specific to be of general forensic utility.
We describe here a new nuclear-mitochondrial duplex qPCR as-say developed following the same general approach of Andreassonet al. (17), except that we have chosen alternative nuclear and mi-tochondrial target sequences for amplification and quantification.For the nuclear portion of the qPCR assay, we have chosen a tar-get sequence that spans the repeat region of the primate-specific
TH01 STR locus, a locus that has been used widely for forensicapplications. This target sequence is of direct interest for quantifi-cation, considering that the primary reason for quantifying humannuclear DNA in forensic samples is to determine the amount of ex-tract to amplify with a commercial multiplex STR PCR kit (8). Ourresults indicate that for degraded samples our choice of the rela-tively long TH01 target sequence (∼170–190 bp) leads to improvedSTR typing results, compared to results based on quantificationof a short target sequence (e.g., 62 bp in the Applied BiosystemsQuantifilerTM qPCR kit (16)) or via slot blot hybridization. Forthe mitochondrial portion the assay, we selected a relatively shorttarget sequence (69 bp) in the mitochondrial ND1 gene. This se-lection provides a sensitive means for determining the presence ofhuman mitochondrial DNA, degraded or not, in forensic samples.In addition to describing results on quantifying DNA in degradedsamples, we also cover aspects of development of the duplex qPCRassay, and details from forensic validation studies, including stud-ies of precision, reproducibility, sensitivity, species specificity, andapplications to casework-type samples.
Materials and Methods
Standards and Samples
Pre-quantified, high molecular weight, human genomic DNAextracts obtained from Promega (Female-#G1521) and from Ap-plied Biosystems (TaqMan R© Control DNA) were typically usedas qPCR quantification standards. Pre-quantified DNA extracts ob-tained from Applied Biosystems (genomic DNA standards from theQuantifilerTM and QuantiBlotTM kits), Promega (K562 and Male-#G1471), and ATCC (HL60) were also used as control samples inseveral studies.
Unless otherwise indicated, DNA extracts from reference, non-probative and simulated casework samples were obtained using theCalifornia Department of Justice casework organic extraction proto-col (ProK/SDS digestion, phenol/chloroform extraction, then Cen-tricon100 (Millipore) concentration into Tris-EDTA buffer (TE−4)).For simulated sexual assault samples, differential extractions ofsperm and epithelial fractions were performed using a DTT-baseddigestion protocol (27). For non-root hair shafts (2 cm portions),extractions were performed by either (i) a magnetic-bead-basedprotocol (28) or (ii) a protocol in which a tissue grinder was firstused to homogenize the hair shaft with 150 µL TE−4, after whichthe homogenate was extracted into 50 µL of boiling 20% Chelex(Bio-Rad). DNA extracts were stored at −20◦C, except for Chelex-extracted samples, which were stored at +4◦C.
For degradation studies, DNA samples were fragmented by treat-ment with DNase I (Invitrogen). Separate tubes of high molecularweight HL60 DNA, each tube containing 1.4 µg of DNA in 5 µLTE−4, were treated with 0.5 U of DNase I, 10x DNase I ReactionBuffer, and sterile water to bring the reaction volume to 10 µL.Increasing degrees of fragmentation were achieved by allowing thetubes to digest at room temperature for periods of 1, 2, 3, 4, 5, 15,30, 45, 60 min and overnight. At the end of each digestion period,DNase activity was quenched by adding 2 µL of 25 mM EDTA andheating each tube at 65◦C for 15 min. The samples were not furtherpurified or concentrated. A “0 min” sample of intact DNA whichcontained all reaction components for digestion except DNase Iwas treated identically to the samples in the degradation series. Thedegree of DNA fragmentation was assessed by gel electrophore-sis (2% agarose, ethidium bromide detection) using HyperLadderI (Bioline) and Ready-Load λ-DNA/Hind III (Invitrogen) sizemarkers.
TIMKEN ET AL. • NUCLEAR-MITOCHONDRIAL DUPLEX qPCR ASSAY 3
Non-human DNA samples were purchased as pre-quantified ge-nomic DNA extracts from several vendors: E. coli, C. perfringens(Sigma), B. subtilis, S. epidermidis, C. albicans (ATCC), mouse(Promega), and cat, chicken, cow, dog, fish, horse, monkey, pig, rat(Zyagen Labs, San Diego, CA).
STR Genotyping
The AmpFlSTR R© IdentifilerTM PCR Amplification kit (AppliedBiosystems) was used for STR genotyping. PCR amplifications of1 ng of nuclear DNA in a 25 µL reaction volume were performedaccording to vendor instructions on a GeneAmp R© 9700 PCR ther-mocycler (Applied Biosystems). STRs were resolved and detectedon a Prism R© 3100 Genetic Analyzer (Applied Biosystems) ac-cording to vendor instructions, except that the electrokinetic sam-ple injection time was dropped from the default of 10 seconds to5 seconds, and the data were analyzed with a baseline of 35 ratherthan the default of 51. Alleles were identified at a minimum thresh-old of 100 RFU using GeneScan R© (v.3.7.1/NT) and Genotyper R©(v.3.7/NT) (Applied Biosystems) for data analysis.
Mitochondrial HVI/HVII PCR
The HVI and HVII portions of the mitochondrial DNA controlregion were amplified in a duplex PCR using reagents from the LIN-EAR ARRAYTM Mitochondrial DNA HVI/HVII Region-SequenceTyping Kit (Roche Applied Science) (29,30). This kit producesnominal 444 bp (HVI) and 416 bp (HVII) amplicons. Templatequantities for PCR were determined either from our nuTH01 duplexqPCR assay (using 100 pg of nuclear DNA per duplex HVI/HVIIamplification) or from our mtND1 duplex qPCR assay to quantifythe mitochondrial genome (using ∼14,000 mitochondrial copiesper duplex HVI/HVII amplification). Post-amplification yields andpurities of the HVI and HVII PCR products were assessed by gelelectrophoresis (4% NuSieve 3:1 (FMC) agarose gel, ethidium bro-mide staining) of 5 µL of PCR product using Low DNA MassLadder (Invitrogen) as a size and quantity marker.
Slot Blot Quantification
The QuantiBlotTM Human DNA Quantification Kit (AppliedBiosystems) was used according to vendor instructions. Hybridizedprobes were detected by chemiluminescence (SuperSignal WestFemto (Pierce)) using a CCD camera system (CCDBio 16SC(Hitachi/MiraiBio)). CCD data were analyzed semi-automaticallyusing SlotQuant software running under the GeneTools (SynGene)analysis package. Quantification standards (DNA Standard A fromthe kit) ranged from 20 ng to 25 pg for each run.
QuantifilerTMqPCR Quantification
The QuantifilerTM Human DNA Quantification Kit (AppliedBiosystems), hereafter referred to as “QuantifilerTM qPCR,” wasused according to vendor instructions for data collection on anApplied Biosystems 7000 Prism R© SDS qPCR instrument.
qPCR Assay Design
Primers and probes (Table 1) for the nuTH01 TaqMan R© andmtND1 TaqManMGB R© (MGB = Minor Groove Binder) single-
TABLE 1—Oligonucleotide sequences for nuTH01 primers and probe,and for mtND1 primers, probe, and mitochondrial copy number standard.
Oligonucleotide Sequence {5′ → 3′}nuTH01-F AGG GTA TCT GGG CTC TGGnuTH01-R GGC TGA AAA GCT CCC GAT TATnuTH01-probe FAM-ATT CCC ATT GGC CTG TTC CTC
CCT T-BHQmtND1-F CCC TAA AAC CCG CCA CAT CTmtND1-R GAG CGA TGG TGA GAG CTA AGG TmtND1-probe VIC-CCA TCA CCC TCT ACA TC-MGB-NFQmtND1-standard GAG CGA TGG TGA GAG CTA AGG TCG
GGG CGG TGA TGT AGA GGG TGA TGG TAGATG TGG CGG GTT TTA GGG
plex qPCR assays were designed using Applied Biosystems’PrimerExpressTM v2.0 software. In general, design guidelines werefollowed as recommended by Applied Biosystems (31), althoughthe software settings in PrimerExpressTM were frequently relaxedto allow amplicon lengths to exceed the recommended maximumlength of 150 bp. DNA sequences for design work were downloadedfrom the GenBank resource at the National Center for Biotechnol-ogy Information (NCBI) website (32). Sequence information wasalso obtained from the STRBase (33) and MitoMap (34) websites.
The nuclear qPCR assay (nuTH01) was designed to span theSTR sequence at the human tyrosine hydroxylase (TH01) gene onchromosome 11 (11p15.5) using sequence from GenBank locusAF536811. In this design work, we configured PrimerExpressTM tofix the positions of the 3′ ends of the qPCR primers so as to matchknown or deduced primers from commercial STR amplificationkits (35,36). This was done so that the qPCR amplifications mightmore accurately predict quantifications for STR genotyping. Thepositions of the fluorogenic probe and the 5′ ends of the primerswere typically unconstrained for optimization by PrimerExpressTM.The mitochondrial qPCR assay (mtND1) was designed in the ND1gene of the human mitochondrial genome using sequence fromGenbank locus HUMMTCG (37). The ND1 gene expresses subunit1 of the mitochondrial NADH dehydrogenase protein.
For both the nuclear and mitochondrial assays, prior to order-ing any synthetic oligonucleotides for experimental work, potentialprimer and probe sequences were compared to DNA sequencesavailable through the NCBI website by using the Basic LocalAlignment Search Tool (BLASTn) (38). The purpose of thesecomparisons was to identify and avoid inadvertent homologies ofprimers and/or probes to non-target genomes that might lead toundesirable cross-species reactivities. In addition, attempts weremade to avoid known single nucleotide polymorphisms (SNPs) inthe primer and/or probe sequences. SNP information was obtainedfrom several sources: the NCBI SNPdB website (39), the On-LineMendelian Inheritance in Man (OMIM) website (40), and, for mito-chondrial sequences, the MitoMap website (34). Once developed,singleplex and duplex qPCR assays were optimized based on pub-lished recommendations (41,42).
nuTH01-mtND1 qPCR Quantifications
Primer and probe sequences for the nuTH01 and mtND1 qPCRassays are provided in Table 1. For nuTH01-mtND1 duplex qPCRamplifications, each assay was run as a 20 µL amplification that in-cluded 10 µL of TaqMan R© Universal Master Mix 2X, no UNG (Ap-plied Biosystems), 4 µL of sample, with the remaining 6 µL com-posed to give final concentrations of: 0.16 µg/µL non-acetylated

4 JOURNAL OF FORENSIC SCIENCES
BSA (Sigma); 600 nM in each nuTH01 primer; 200 nM in nuTH01-probe; 50 nM in each mtND1 primer; 100 nM in mtND1-probe.Primers (Qiagen-Operon (Alameda, CA)) were diluted in sterile,de-ionized water. Probes (Qiagen-Operon for nuTH01, AppliedBiosystems for mtND1) were diluted in TE−4.
For nuTH01 and mtND1 singleplex TaqMan R©/TaqManMGB R©qPCR amplifications, assays were run using the same reagents as de-scribed for the duplex qPCR assay, except to replace the non-desiredprimer/probe combination with sterile water or TE−4. SingleplexSYBR R© Green I assays were typically run as 20 µL amplificationsthat included 10 µL of 2X SYBR R© Green Master Mix (AppliedBiosystems) or 10 µL of 2X Brilliant R© QPCR Master Mix (Strata-gene), 4 µL of sample, with the remaining 6 µL composed to givefinal concentrations of 300 nM in each appropriate primer.
Real-time qPCR data were collected on an Applied BiosystemsPrism R© 7000 SDS instrument controlled by a computer runningversion 1.0 of the 7000 SDS Collection software. The instrumentwas typically configured for the following run conditions: 20 µLsample volumes; 9600 emulation mode; one 10 min 95◦C poly-merase activation step, followed by 45 cycles of 2-step qPCR (15 sof 95◦C denaturation, 60 s of 60◦C combined anneal/extension).Well-to-well variations in background fluorescence were correctedfor by use of a ROX-labeled passive reference, included as part ofthe Applied Biosystems qPCR Master Mix for each sample. Forruns that used SYBR R© Green detection, a melt curve was collectedafter the final cycle of PCR extension by configuring the SDSCollection software to monitor SYBR R© Green fluorescence as thetemperature was increased (∼1.8◦C /min) from 60◦C to 95◦C.
Amplification curves were analyzed by using empirically estab-lished cycle threshold and baseline settings for each type of assay(for nuTH01, threshold = 0.15, baseline 6–18 cycles; for mtND1,threshold = 0.06, baseline 3–13 cycles). For each qPCR run, theSDS Collection software generated a linear calibration plot of CT(cycle threshold) vs. log C0 (initial standard DNA concentration) byusing amplification results from a freshly prepared dilution series ofpre-quantified high molecular weight human genomic DNA stan-dard (Promega Female or Applied Biosystems TaqMan R©). DNAquantifications for unknown samples were interpolated from the re-sulting linear calibration curve. These calibration and interpolationsteps are semi-automatic features of the SDS Collection software.For the nuclear qPCR assay, calibration plots were constructed us-ing data from standard DNA dilutions containing 25, 5, 1, 0.5,0.1, and 0.05 (in duplicate) ng of total DNA per sample. For themitochondrial qPCR assay, the calibration plots were extended tolower quantities of template per sample (0.010, 0.001, and 0.0001(in duplicate) ng). At least one negative control, 4 µL of TE−4 orsterile water, was included in each run.
Nuclear DNA copy numbers were estimated using the ratio of onehaploid nuclear copy per 3.3 pg genomic DNA (43). Mitochondrialcopy numbers were estimated using a ratio of 400 mitochondrialcopies per 3.3 pg of Promega genomic standard DNA or 450 mito-chondrial copies per 3.3 pg of HL60 genomic standard DNA. Thesemitochondrial copy number ratios were empirically estimated byrunning the Promega and HL60 standard DNA samples against adilution series of quantified (UV-vis absorption) mtND1 syntheticoligonucleotide standard (see Table 1 for oligonucleotide sequenceof the mitochondrial copy number standard). For each qPCR run,we used the high molecular weight genomic DNA dilution seriesto generate two linear calibration plots, one for the nuclear portionand one for the mitochondrial portion of the duplex assay.
Where appropriate, qPCR amplification efficiencies were deter-mined from the slopes of the linear calibration curves (% PCRefficiency = 100[(10(−1/slope) − 1)] (44).
Oligonucleotide Melting Profile Calculations
Melting profiles for selected TH01 alleles were calculated usingMELT94, a DOS-based program available on-line (45). This pro-gram uses the theory and equations of Poland (46) and of Fixmanand Freire (47) to calculate variations in thermal stability alongthe sequence of a DNA fragment (48). Stacked melting profileswere constructed by exporting MELT94 output data (temperaturesfor 50% helical:50% melted states vs. sequence number) into anExcel R© spreadsheet.
Results and Discussion
Design and Development of the nuTH01-mtND1Duplex qPCR Assay
In the preceding Materials and Methods section of this report weincluded a brief outline of the procedures used to design our single-plex nuclear (nuTH01) and mitochondrial (mtND1) qPCR assays.In this section, we provide a more detailed discussion of selectedaspects of assay design and development, including: (i) choices oftarget DNA sequences; (ii) experimental results to establish thatthe singleplex nuTH01 and mtND1 qPCR assays work success-fully in a duplex amplification; and (iii) the observation of unusual,but predictable, SYBR R© Green melt curves for the TH01 qPCRtarget.
Selection and Design of the Nuclear TH01 Amplification Target
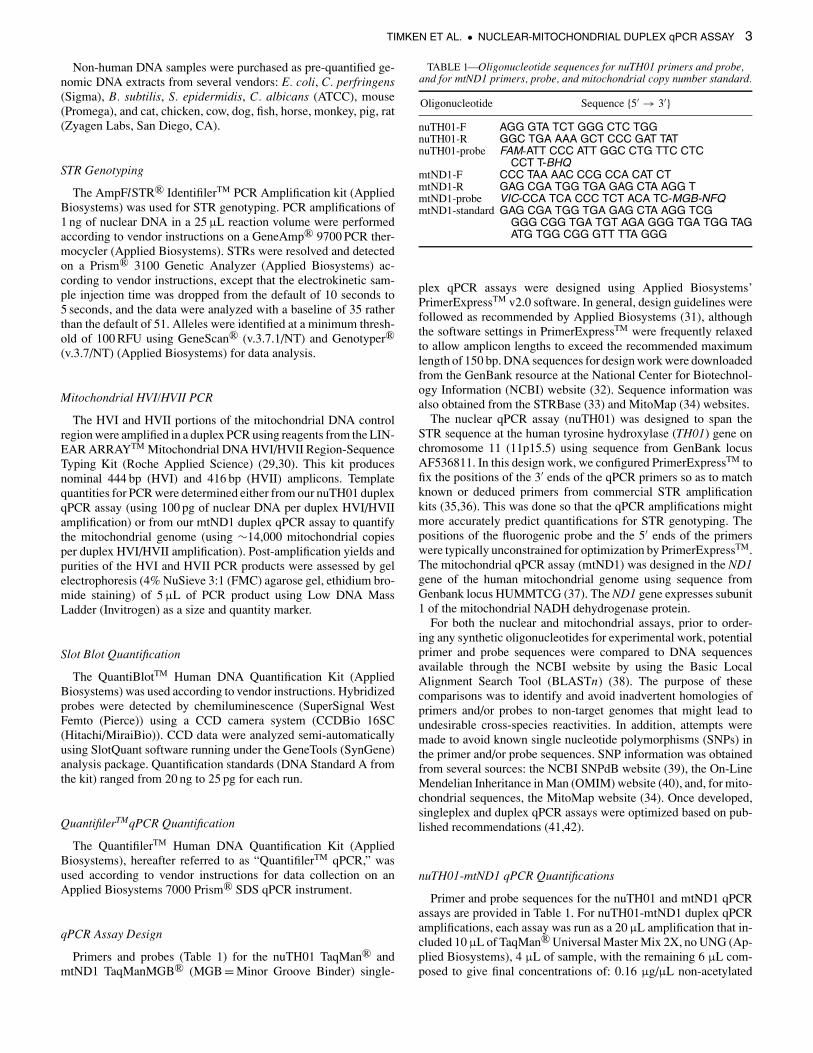
Because the primary reason for quantifying nuclear DNA inforensic samples is to determine the amount of template to useas input for STR genotyping, we anticipated that the quantificationof an STR target would be directly predictive of success for STRgenotyping. Furthermore, STR loci have been well characterizedwith respect to cross-species reactivity (49,50) and DNA mutationrates (51) because of their widespread use in forensic DNA analysisand in paternity investigations. Although initially we did not focussolely on the TH01 locus for assay development, an examination ofthe DNA sequences at each of the CODIS STR loci, in conjunctionwith assay design work using PrimerExpressTM, quickly identifiedthe TH01 locus as a promising target. The TH01 locus containssuitable sequence in both STR flanking regions for design andplacement of a TaqMan R© detection probe. The TH01 STR targetwas also attractive because the amplicons are of sufficient lengthsto place them roughly in the middle of the size range producedby the commercial STR kits, but are not long enough to overlycompromise the TaqMan R© qPCR efficiency. During development,we designed and tested a number of potential qPCR assays at theTH01 STR locus. These assays were evaluated by comparing theirqPCR properties (e.g., PCR efficiency (>90 %), sensitivity (lowCT), and precision (low variance in CT, especially at low templatequantities)) in order to identify an optimal assay, designated hereas nuTH01. The target sequence for the nuTH01 qPCR assay isshown in Fig. 1, which displays the relative positions of the PCRprimers, the STR repeat region, and the 5′-FAM/BHQ fluorogenicprobe.
Selection and Design of the Mitochondrial ND1Amplification Target
For design of the mitochondrial qPCR assay, we selected a regionof the ND1 (NADH dehydrogenase subunit 1) gene correspond-ing to bases 3485–3553 of the Cambridge Reference Sequence(CRS) (52). This target was chosen because previous cross-species
TIMKEN ET AL. • NUCLEAR-MITOCHONDRIAL DUPLEX qPCR ASSAY 5
FIG. 1—Sequence information for the nuTH01 portion of the duplexqPCR assay showing relative positions of the forward and reverse primers(horizontal arrows), the TaqMan R© detection probe (underlined on topstrand), and the (CATT)7 STR region (underlined on bottom strand). Thesmall, vertical arrow marks the sequence position that approximately sepa-rates the nuTH01 amplicon into low and high melting temperature domains.The position of this arrow corresponds to Sequence Number 96 in Fig. 5.
sequence homology studies (53, and personal communication withCummings MP) had indicated this sub-region of the ND1 gene tobe significantly non-conserved, a promising feature for developinga species-specific assay, and because this region of ND1 has fewknown SNPs, especially when compared to the HVI/HVII con-trol sub-regions. Using a number of web-based searching toolsand avoiding any well-known disease-associated SNPs such as theLHON-associated SNP at CRS 3460, we designed and evaluatedseveral assays at the ND1 target. Using the same criteria as for thenuTH01 qPCR assay, we selected an optimal mitochondrial qPCRassay, designated mtND1 (Table 1).
The mtND1 assay quantifies a relatively short (69 bp) target se-quence, one strand of which is shown in Table 1 as the sequencefor our mtND1 copy number standard. One advantage to selectingan assay with a short target sequence was that it allowed purchaseof a synthetic oligonucleotide which could then be used as a copynumber standard for the mitochondrial assay, rather than prepar-ing a standard by cloning or PCR product purification. Also, weanticipated that a short qPCR assay would detect more sensitivelythe presence of human mitochondrial DNA, even in degraded DNAsamples.
nuTH01 (single)CT = -3.51(log Co) + 31.51
R2
= 0.998Efficiency = 92.6%
nuTH01 (duplex)CT = -3.54(log Co) + 30.84
R2 = 0.995Efficiency = 91.5%
mtND1 (single)CT = -3.66(log Co) + 22.03
R2 = 0.999
Efficiency = 87.7%
mtND1 (duplex)CT = -3.54(log Co) + 21.99
R2 = 0.999
Efficiency = 91.7%
15
20
25
30
35
40
45
-3.5 -3 -2.5 -2 -1.5 -1 -0.5 0 0.5 1
log (Co in ng of nuclear DNA)
CT
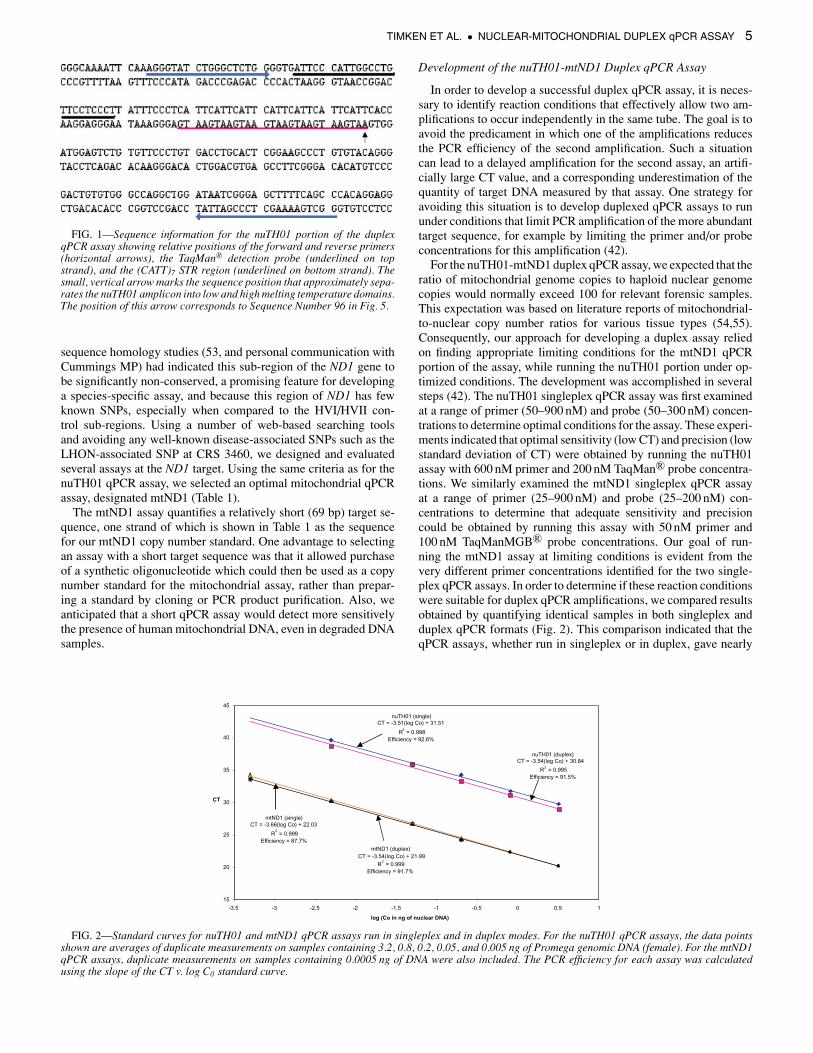
FIG. 2—Standard curves for nuTH01 and mtND1 qPCR assays run in singleplex and in duplex modes. For the nuTH01 qPCR assays, the data pointsshown are averages of duplicate measurements on samples containing 3.2, 0.8, 0.2, 0.05, and 0.005 ng of Promega genomic DNA (female). For the mtND1qPCR assays, duplicate measurements on samples containing 0.0005 ng of DNA were also included. The PCR efficiency for each assay was calculatedusing the slope of the CT v. log C0 standard curve.
Development of the nuTH01-mtND1 Duplex qPCR Assay
In order to develop a successful duplex qPCR assay, it is neces-sary to identify reaction conditions that effectively allow two am-plifications to occur independently in the same tube. The goal is toavoid the predicament in which one of the amplifications reducesthe PCR efficiency of the second amplification. Such a situationcan lead to a delayed amplification for the second assay, an artifi-cially large CT value, and a corresponding underestimation of thequantity of target DNA measured by that assay. One strategy foravoiding this situation is to develop duplexed qPCR assays to rununder conditions that limit PCR amplification of the more abundanttarget sequence, for example by limiting the primer and/or probeconcentrations for this amplification (42).
For the nuTH01-mtND1 duplex qPCR assay, we expected that theratio of mitochondrial genome copies to haploid nuclear genomecopies would normally exceed 100 for relevant forensic samples.This expectation was based on literature reports of mitochondrial-to-nuclear copy number ratios for various tissue types (54,55).Consequently, our approach for developing a duplex assay reliedon finding appropriate limiting conditions for the mtND1 qPCRportion of the assay, while running the nuTH01 portion under op-timized conditions. The development was accomplished in severalsteps (42). The nuTH01 singleplex qPCR assay was first examinedat a range of primer (50–900 nM) and probe (50–300 nM) concen-trations to determine optimal conditions for the assay. These experi-ments indicated that optimal sensitivity (low CT) and precision (lowstandard deviation of CT) were obtained by running the nuTH01assay with 600 nM primer and 200 nM TaqMan R© probe concentra-tions. We similarly examined the mtND1 singleplex qPCR assayat a range of primer (25–900 nM) and probe (25–200 nM) con-centrations to determine that adequate sensitivity and precisioncould be obtained by running this assay with 50 nM primer and100 nM TaqManMGB R© probe concentrations. Our goal of run-ning the mtND1 assay at limiting conditions is evident from thevery different primer concentrations identified for the two single-plex qPCR assays. In order to determine if these reaction conditionswere suitable for duplex qPCR amplifications, we compared resultsobtained by quantifying identical samples in both singleplex andduplex qPCR formats (Fig. 2). This comparison indicated that theqPCR assays, whether run in singleplex or in duplex, gave nearly

6 JOURNAL OF FORENSIC SCIENCES
FIG. 3—qPCR amplification curves for nuTH01-mtND1 duplex assays with 3 ng of control DNA plus 0, 106, 107, 108, and 109 excess copies ofsingle-stranded mtND1-standard. Assays were run in duplicate.
identical quantifications and efficiencies. The nuTH01 qPCR assayneither lost efficiency nor showed a delayed CT when run in duplexvs. singleplex. (Due to a small amount of “leakage” of the VICfluorescence signal into the FAM detection channel, the nuTH01qPCR assay actually appeared to amplify with a slightly lower CTwhen run in duplex than when run in singleplex format.) As a finaldevelopmental step, we challenged the duplex assay by spiking a3 ng control sample of DNA with increasing amounts of syntheticoligonucleotide mtND1 copy number standard, adding up to a one-billion-fold excess number of effective mitochondrial copies to theoriginal DNA sample. As shown in Fig. 3, the nuTH01 amplifica-tion curves and the corresponding CT values did not change signifi-cantly, even in the presence of an unrealistic excess of mitochondrialcopies.
Because we designed the duplex qPCR assay to limit the mtND1amplification conditions while running the nuTH01 amplificationunder robust conditions, the duplex assay was not optimized forsamples in which the number of nuclear genome copies is nearlyequivalent to or greater than the number of mitochondrial genomecopies. For such samples, the more robust nuTH01 amplificationcan lower the efficiency of the mtND1 amplification, resulting inan underestimation of the quantity of mitochondrial DNA. So far,we have encountered only one type of forensic sample—the largelytail-less sperm cells from differential extraction pellets—in whichthe ratio of mitochondrial genome copies to nuclear genome copiesis not large. Although such samples are not commonly used formitochondrial haplotyping, this limitation of the assay should bekept in mind when interpreting mtND1 quantification data.
TH01 SYBR R© Green Melt Curves
The selection of a qPCR target sequence that spans the repeatregion of an STR locus introduces the possibility that the resultingassay will depend in some way upon the STR genotype, for exam-ple, that the nuTH01 assay will give measurably different resultsfor a 6,6 TH01 genotype than for a 9,9.3 TH01 genotype. We havenot, within the precision and accuracy of our quantification exper-iments, seen any such effects for our nuTH01 qPCR assay. Theonly allele-dependent effect that we have seen was the observationof unusual SYBR R© Green melt curves. While this effect has nodetrimental impact on the quality of TH01 qPCR assay, it is noveland requires an explanation.
In initial developmental experiments, each potential assay wasevaluated by performing qPCR runs using SYBR R© Green Idetection. This detection method allows for early identification ofsub-optimal primer combinations, avoiding use of the more expen-sive, dye-labeled TaqMan R© detection probes. As part of these initialassessments, we evaluated the specificity of the PCR amplificationsby gel electrophoresis (4% NuSieve 3:1 agarose gel with EtBr stain-ing) of the post-run qPCR reaction mixtures and by using the qPCRinstrument to generate SYBR R© Green melt curves. During this de-velopmental work, for each of our potential TH01-based qPCRassays, we observed unusual SYBR R© Green melt curves (Fig. 4).
For qPCR assays detected with SYBR R© Green, a melt (or disso-ciation) curve can be generated at the end of the final PCR cycleby configuring the qPCR instrument to monitor the SYBR R© Greenfluorescence of each sample as the temperature is slowly increasedfrom ∼60◦C (the extension temperature of the final PCR cycle)to ∼95◦C. At temperatures corresponding to the melting of PCRproducts there will be concomitant decreases in SYBR R© Greenfluorescence due to de-intercalation of the reporter dye. In orderto easily visualize these changes in fluorescence, melt curves aretypically plotted as the negative first derivative of the change in flu-orescence (−dF/dT) so that each “melt transition” will appear to bea single peak in the plot. A well-designed qPCR assay is expectedto produce a single amplicon and, typically, a single transition inthe SYBR R© Green melt curve.
Figure 4, which shows the SYBR R© Green melt curves collectedfor several different samples using the TH01 qPCR assay, indicatesthat each sample shows not one, but two melt transitions—a highmelting temperature major peak (Tm ∼ 81◦C) and a lower melt-ing temperature “shoulder” (Tm ∼ 78–79◦C). This observation oftwo melt transitions was not anticipated because the TH01 qPCRassay was otherwise unremarkable; it showed evidence for onlyone PCR product in post-amplification yield gels, and there wasno evidence for spurious melt transitions in any negative controls.The two-step appearance of the melt transitions suggests the pres-ence of two sequence-dependent melting domains in each TH01amplicon. This suggestion is supported by calculations of allele-dependent melting profiles for the amplicons performed with a soft-ware package, MELT94, which uses sequence information to esti-mate the melting temperature of a DNA fragment along its double-stranded length (Fig. 5). Such calculations separate the TH01 ampli-con into two distinct melting domains—a low melting temperature

TIMKEN ET AL. • NUCLEAR-MITOCHONDRIAL DUPLEX qPCR ASSAY 7
(d) 6, 9
(a),(b) 6, 6
(c) 6, 7
(e) 8, 9.3
(f) 9, 9.3
(g) TE-4
FIG. 4—SYBR R© Green melting curves obtained for DNA extracts from six different individuals and a negative control sample using the TH01 qPCRassay. The TH01 genotype for each sample is indicated. Traces (a) and (b) are from two different individuals, both genotype 6, 6 at TH01.
64
66
68
70
72
74
76
78
80
0 20 40 60 80 100 120 140 160 180 200
Sequence Number
Tem
pera
ture
(C)
69.5
70
70.5
71
71.5
30 50 70 90
Sequence Number
Tem
p (C
)
5 Repeats - 71.35 C
6 Repeats - 70.95 C
7 Repeats - 70.58 C
8 Repeats - 70.24 C
9 Repeats - 69.92 C
10 Repeats - 69.63 C
FIG. 5—Calculated melting profiles for TH01 amplicons (STR alleles 5–10) as generated by MELT94 software. Sequence Number 96 corresponds tothe position of the small, vertical arrow in Fig. 1. The inset figure shows an expansion of the melting profiles in the STR region.
domain that includes the STR region (Sequence Number 0–∼96)and a high melting temperature domain (Sequence Number ∼96–∼180). These calculations predict that the melting temperature ofthe low-melt domain will decrease as the number of STRs in-creases (Fig. 5, inset), a prediction that is in qualitative agreementwith the trend seen for the experimental melting curves shown inFig. 4. This trend is due to an increase in the AT-percentage ofthe low-melting domain sequence as the number of CATT repeatsincreases. The melting profile of the high-melt domain is predictedto be independent of the TH01 genotype (Fig. 5), consistent withthe allele-independent, overlapping melt transitions (Tm ∼ 81◦C)shown in Fig. 4.
The stepwise melting of small DNA fragments due to sequence-dependent melting domains has been reported (56), and similarsequence-dependent denaturation phenomena form the basis forseparations by such techniques as denaturing gel gradient elec-trophoresis (DGGE) (57). To our knowledge, however, genotype-dependent stepwise melt transitions have not been previously re-ported for STR amplicons. It is intriguing that the SYBR R© Green
melt curves for the TH01 qPCR assay might form the basis for afairly simple and rapid, albeit low-resolution, means for STR geno-typing at this locus, as well as at other STR loci that show similarallele-dependent melt curves.
nuTH01-mtND1 Duplex qPCR Validation: Precision,Sensitivity, and Reproducibility
Precision of the nuTH01-mtND1 duplex qPCR assay was as-sessed by running 96 identical assays in a single wellplate using4 ng of pre-quantified standard DNA (Promega Human GenomicFemale DNA) per quantification. For the nuTH01 portion of the du-plex assay, we measured an average CT of 28.94 cycles with a stan-dard deviation (SD) of 0.13 cycles and a CT range of 0.59 cycles.For the mtND1 portion of the assay, we measured an average CT of22.63 cycles with a SD of 0.21 cycles and a CT range of 0.98 cycles.No systematic deviations in CT across rows or columns of the 96-well plate for either portion of the duplex assay were observed.Although we did not include a standard DNA dilution series in this

8 JOURNAL OF FORENSIC SCIENCES
TABLE 2—Intra-run sensitivity and precision results for the nuTH01-mtND1 duplex qPCR assay. Results are based on five replicate quantifications ofserially diluted Promega Female Genomic DNA standards. Quantities are per 4 µL of sample. Standard deviations are in parentheses.
mtND1 qPCRnuTH01 qPCR
Approx. Input Quantity Average QuantityInput DNA Quantity (ng) Average Quantity (ng) RSD (%) (mt copies) (mt copies) RSD (%)
100 95.8 (7.7) 8.0 1.2 × 10⁷ 8.6 (0.97) × 106 1110 10.7 (0.90) 8.4 1.2 × 10⁶ 1.3 (0.15) × 106 12
5 4.7 (0.088) 1.9 6.1 × 10⁵ 7.6 (0.95) × 105 121 1.2 (0.034) 3.0 1.2 × 10⁵ 1.3 (0.24) × 105 180.5 0.48 (0.057) 12 6.1 × 10⁴ 7.1 (1.4) × 104 200.1 0.10 (0.021) 21 1.2 × 10⁴ 1.0 (0.20) × 104 200.05 0.051 (0.013) 26 6.1 × 10³ 7.2 (1.5) × 103 210.01 0.0057∗ (0.0017) 30∗ 1.2 × 103 1.3 (0.21) × 103 170.005 — — 6.1 × 10² 7.1 (2.0) × 102 280.001 — — 1.2 × 10² 1.1 (0.39) × 102 350.0001 — — 1.2 × 101 1.1 (0.41) × 101 39
∗ Based on four replicates, because one quantification dropped out at this template quantity.
run, the standard deviation of CT can be used to estimate the rela-tive standard deviation (RSD or %CV) of genome copy number as100(2(SD of CT)−1); this estimation assumes 100% PCR efficiencyfor the assay. By this means, we estimate the intra-plate RSD ofgenome copy number to be ∼10% for the nuTH01 assay and ∼16%for the mtND1 assay.
Sensitivity of the duplex qPCR assay was assessed by quan-tifying Promega Human Genomic Female standard DNA usingtemplate quantities ranging from 100 ng to 1 fg. All quantifica-tions were performed in replicates of five in order to estimate theminimum level of input DNA at which stochastic effects (e.g.,qPCR signal dropout and reduced quantification precision) canbe expected to become significant. Results from these runs aresummarized in Table 2. As expected, these results indicate thatas the number of template copies diminishes, there is a generaldecrease in precision for both the nuTH01 and mtND1 portionsof the duplex assay. For the nuTH01 portion of the qPCR assay,adequate levels of precision (<30% RSD) are seen down to ap-proximately 50 pg of template DNA (∼15 haploid nuclear copies),and we have generally seen similar levels of precision down toapproximately 32 pg or ∼10 copies (data not shown). At lowerquantities of nuclear template, loss of precision, as well as anincrease in the proportion of “dropped out” amplification curvesoccurred (e.g., 20% of the nuTH01 qPCR assays dropped out andwere undetected at 10 pg of template, 30% at 5 pg, 80% at 1 pg,and 100% at <1 pg). This is probably due to stochastic effects insampling and in amplification at low levels of template. For themtND1 portion of the qPCR assay, adequate levels of quantifica-tion precision (<40% RSD) were seen down to at least 100 fg ofnuclear template, which corresponds to ∼12 mitochondrial tem-plate copies for the Promega genomic female standard DNA. AllmtND1 qPCR amplification curves dropped out at 10 fg of nucleartemplate.
Reproducibility of the duplex assay was assessed by comparingquantifications of six different high molecular weight control DNAsamples obtained from three independent qPCR runs as performedby two different analysts on two different days. Samples were quan-tified as single replicates in each run. The results are summarized inTable 3, where we estimate “reproducibility” as the effective RSDfor each sample by pooling the quantification results from the threeruns. These inter-plate RSD values are, on average, in reasonableagreement with the intra-plate RSD values reported in our discus-sion of assay precision and sensitivity. A notable exception is the
TABLE 3—Inter-run reproducibility results for nuTH01-mtND1 duplexqPCR quantifications of six commercial high molecular weight genomicDNA standards (samples A–F). Slot blot quantities are based on singlereplicate measurements for each sample. qPCR quantities are reported asaverages, based on pooling the results from the three single-replicate qPCRruns. Standard deviations are in parentheses. Promega Genomic Female
DNA was used as the quantification standard for all three qPCR runs.
mtND1 qPCRnuTH01 qPCR
AverageSlot Blot Average QuantityQuantity Quantity (1000 mt
Sample (ng/µL) (ng/µL) RSD (%) copies/µL) RSD (%)
A 0.85 0.64 (0.08) 12 130 (79) 62B 0.80 0.96 (0.10) 10 880 (150) 17C 0.34 0.53 (0.10) 20 310 (35) 11D 1.31 1.58 (0.31) 19 430 (31) 7E 0.97 1.51 (0.17) 11 790 (170) 21F 0.40∗ 0.45 (0.05) 12 360 (73) 21
∗ Sample F represents the calibration standard used for the slot blot quantifi-cations; the value for sample F (0.40 ng/µL) is a defined, rather than a measuredquantity.
single large RSD (62%) observed for the mtND1 quantification ofsample A.
nuTH01-mtND1 Duplex qPCR Validation: Species Specificity
To assess species specificity of the nuTH01 and mtND1 qPCRamplifications, the duplex assay was run using template DNAfrom each of fifteen different non-human species. Duplicate as-says, each containing 1 ng of template, were used for each species.No cross-reactivity to non-human DNA was observed for eitherthe nuTH01 or mtND1 portions of the duplex qPCR assay. Wefurther challenged the duplex assay by amplifying 100 ng por-tions of each of the microbial DNA samples, and we observedno amplifications above the level of background in either thenuTH01 or mtND1 quantifications. These results indicate that thenuTH01-mtND1 duplex qPCR assay is sufficiently specific forforensic applications. Although we did not test the assay withDNA from higher primates, based on previous work with the TH01STR locus (49,50) and on sequence homology investigations, we

TIMKEN ET AL. • NUCLEAR-MITOCHONDRIAL DUPLEX qPCR ASSAY 9
LH 0 1 2 3 4 5 15 30 45 60 LD LHLH
10 kbp
1.5 kb
1 kbp800 bp
600 bp
400 bp
200 bp
FIG. 6—HL60 DNase degradation series (EtBr-stained). Lanes labeled0 to 60 indicate DNase treatment time in minutes. Lanes labeled LH andLD represent λ-HindIII and low-mass DNA ladder, respectively.
anticipate that the nuTH01 qPCR assay would amplify and detectsuch samples.
nuTH01-mtND1 Duplex qPCR Validation: Degraded DNA
Forensic evidence samples often contain DNA that has been de-graded by environmental and/or microbial exposures. To assess theability of the nuTH01-mtND1 duplex qPCR to quantify DNA insuch samples, a DNA degradation series was prepared by treat-ing aliquots of high molecular weight genomic DNA (HL60) withDNase I for increasing periods of time ranging from one minute toovernight. Figure 6 shows a gel illustrating the degree of DNA frag-mentation for the DNase-treated samples. An increase in the degreeof DNA fragmentation during the first 5 min of DNase treatmentis evident from increased intensity of the low molecular weight“smear” in lanes 3 to 7 of the gel. During this time, the extent ofdegradation is best described as “moderate” given the consistentappearance of a fairly intense high molecular weight band in theselanes. For samples with at least 15 min of DNase treatment, how-ever, there is no evidence for the high molecular weight band. Forthe purpose of this discussion, we describe these samples as “highlydegraded.”
Samples from the DNA degradation series were quantified bythree different methods: slot blot hybridization, nuTH01-mtND1duplex qPCR, and the Applied Biosystems QuantifilerTM HumanDNA Quantification kit. Because the nuTH01 assay amplifies a∼170–190 bp target sequence, while the QuantifilerTM kit ampli-fies a 62 bp target sequence, we included the QuantifilerTM assay inour comparison as a means to evaluate the significance of ampliconsize for quantifying degraded DNA. For the qPCR assays, 2 µLof diluted sample (1:20 in TE−4) were quantified in duplicate foreach point in the degradation series. For the slot blot assays, singlequantifications were obtained on 4 µL of the same diluted sam-ples. Quantification results (nuclear quantifications only) for the
0.00
1.00
2.00
3.00
4.00
5.00
6.00
7.00
8.00
9.00
10.00
0.00 5.00 10.00 15.00 20.00 25.00 30.00 35.00 40.00 45.00 50.00
DNase I Exposure (min)
Nu
clea
r D
NA
Qu
anti
ty (
ng
/uL
)
nuTH01-mtND1 qPCR (solid line)
Slot Blot (dotted line)
Quantifiler qPCR (dashed line)
FIG. 7—Nuclear quantifications of DNase-degraded HL60 samples bynuTH01-mtND1 duplex qPCR, QuantifilerTM qPCR, and slot blot hy-bridization. For the qPCR assays, each point represents the average ofduplicate quantifications. For slot blot, each point represents a single quan-tification. Lines represent linear least-squares fits to early (0–5 min) andlate (15–45 min) time points in the degradation series.
three methods are summarized graphically in Fig. 7, from whicha number of conclusions can be drawn. First, for undigested, highmolecular weight DNA (0 min sample), the three methods pro-vide quantifications that are in good agreement with each other, aswell as in reasonable agreement with the concentration (∼6 ng/uL)estimated for a 1:20 dilution of the DNA stock. Second, for themoderately degraded samples (1–5 min of DNase treatment), thetwo qPCR-based quantification methods are in good agreement,but both give quantification values significantly higher than thoseobtained from the slot blot method. Third, for highly degradedsamples (>15 min of DNase treatment), none of the quantificationmethods agree. Relative to both qPCR-based methods, the slot blotmethod detects significantly less DNA. Even the nuTH01-mtND1duplex and QuantifilerTM qPCR assays disagree, the latter assaydetecting significantly more DNA than the former.
These results, which indicate that the quantity of DNA measuredin degraded samples depends upon the quantification method used,were not entirely unexpected. There have been previous reports thatthe slot blot method underestimates the quantity of nuclear DNAin degraded or compromised samples (14,23,24), and it has beensuggested that this effect is due to a lowered binding efficiencyof the degraded DNA fragments to the slot blot membrane (14).Some degree of difference in quantifying degraded DNA by qPCRwas also to be expected, considering the size difference betweenthe target sequences for the nuTH01 and QuantifilerTM assays. TheQuantifilerTM qPCR assay effectively measures the concentrationof nuclear DNA fragments at least 62bp long, whereas the nuTH01qPCR assay measures the concentration of fragments at least 170–190 bp long. For high molecular weight DNA samples these twoconcentrations are practically the same, but for highly degradedDNA samples there is a greater concentration of smaller than largerfragments. This concentration difference is indicated by the yieldgel shown in Fig. 6 and is reflected in the divergent DNA quantitiesmeasured by the QuantifilerTM and nuTH01 qPCR assays.
The primary reason for accurately quantifying nuclear DNA inforensic samples is to ensure the correct amount of template is usedfor STR amplification. When too little template DNA is amplified,incomplete STR profiles can result, while amplification of excesstemplate can cause such problems as poor inter-locus balance, in-creased stutter peak intensities, incomplete non-template-directednucleotide addition, off-scale signals, and signals due to cross-dye “pull-up,” each of which can complicate or preclude accurateSTR genotyping. For degraded samples, as we have seen, different

10 JOURNAL OF FORENSIC SCIENCES
quantification methods can provide very different estimates of DNAquantity. To investigate the implications of these differences, we at-tempted to determine which of the three quantification methodswould provide the most suitable estimates of nuclear DNA quantityfor STR typing of degraded samples. To this end, we used the quan-tification results shown in Fig. 7 to prepare nominal “1ng” portionsof nuclear DNA for each time-point in the DNase-degradation se-ries based on each of the three quantification methods. These “1ng”portions were then amplified and genotyped using the AmpFlSTR R©IdentifilerTM STR kit.
Figure 8 provides a qualitative, graphical overview of the STRgenotyping results for the entire set of DNase-degraded samples.Panel (A) in this figure suggests that for untreated and moderatelydegraded DNA samples (0–5 min DNase treatment), all three meth-ods were suitable for quantifying nuclear DNA for STR genotyping.At these moderate levels of degradation, regardless of the methodof quantification, all STRs were detected with signals greater than490 RFU per locus, and there was no evidence of artifacts thatwould complicate or preclude accurate genotyping. For the morehighly degraded DNA samples (15–60 min DNase treatment), how-ever, success rates for STR genotyping were seen to depend uponthe method of DNA quantification.
Panel (C) of Fig. 8 shows that for amplifications based onQuantifilerTM quantifications, a relatively large proportion of alleleswere undetected for all of the AmpFlSTR R© IdentifilerTM reporterdyes. As the extent of DNA fragmentation increased, the larger STRalleles for each reporter dye were the first that failed to reach the100 RFU analytical threshold. The implications for using a shortqPCR target sequence are evident. In these highly degraded sam-ples, there were more 62 bp than longer STR-sized DNA fragments.As a consequence, the QuantifilerTM assay overestimated the quan-tity of longer template fragments, leading to under-amplification ofthe longer STR alleles and, ultimately, to inadequate quantities ofPCR product for detection. With this quantification method, at veryhigh levels of degradation (45–60 min of DNase treatment) less thanhalf of the IdentifilerTM STR alleles were detected, and the overes-timation of DNA quantity was so pronounced that even the shorterSTR alleles lost significant intensity due to under-amplification(Figs. 8C and 9B, and Table 4).
By contrast, quantification of these same samples using thenuTH01-mtND1 duplex qPCR method led to an improvement in
TABLE 4—Selected AmpFlSTR R© IdentifilerTM STR intensities for DNase-degraded HL60 samples. All amplifications used nominal 1 ng nuclear templateamounts as quantified by nuTH01-mtND1 duplex qPCR, QuantifilerTM qPCR, and slot blot hydridization. STR intensities are provided as RFU per locus.For samples exposed to DNase for 0–5 min, the qPCR-based STR intensities are identical because only one STR amplification was performed basedon nearly identical quantifications of these samples by the nuTH01 and QuantifilerTM assays (see Fig. 7). Off-scale peaks, as identified by GeneScan R©
software, are indicated in bold. For HL60, the average IdentifilerTM STR allele sizes for TH01, D19, and D18 are 177 bp, 121 bp, and 293 bp, respectively(60).
nuTH01-mtND1 Duplex qPCR QuantifilerTM qPCR Slot Blot HybridizationDNase
Exposure TH01 D19 D18 TH01 D19 D18 TH01 D19 D18(min) (RFU) (RFU) (RFU) D19/D18 (RFU) (RFU) (RFU) D19/D18 (RFU) (RFU) (RFU) D19/D18
0 1824 2809 3677 0.76 1824 2809 3677 0.76 2724 2671 4780 0.561 1998 1851 2730 0.68 1998 1851 2730 0.68 2861 2360 3747 0.632 2883 2489 3253 0.77 2883 2489 3253 0.77 3636 2789 3849 0.723 2697 2400 3210 0.75 2697 2400 3210 0.75 3122 2465 3183 0.774 2417 2043 2519 0.81 2417 2043 2519 0.81 3791 2880 2637 1.095 2469 2119 3133 0.68 2469 2119 3133 0.68 2894 2469 3332 0.74
15 2393 3434 1537 2.23 955 1472 584 2.52 6389 7053 1566 4.5030 3108 5156 1329 3.88 1036 1786 543 3.29 7797 9103 1766 5.1545 2540 5408 738 7.33 534 1153 115∗ · · · 6563 9011 903 9.9860 1941 5249 473 11.10 349 825 · · · · · · 5916 8845 543 16.29
∗ Only one STR allele of heterozygous pair detected.
the success rate for STR genotyping (Fig. 8). Even for the mosthighly degraded samples (60 min of DNase treatment), more than75% of the HL60 alleles were detected. For the purpose of STRgenotyping highly degraded samples, these results indicate that the∼180 bp nuTH01 qPCR target is more appropriate for quantifyingDNA than is the shorter 62 bp target. Data provided in Table 4 showthat by basing DNA quantification on the medium-sized nuTH01target, the intensities of the detected TH01 STRs were maintainedat a fairly consistent level (∼1800–3100 RFU/locus) despite thevarying extent of DNA fragmentation. Even for highly degradedsamples, the short (∼121 bp) D19 STRs were not over-amplified tothe extent that they resulted in off-scale peaks, nor were the long(∼293 bp) D18 STRs under-amplified to the extent that they wentundetected.
STR amplifications based on slot blot quantifications resulted invery few undetected alleles, even for the most highly degraded sam-ples (Fig. 8). However, the electropherograms shown in panels (C)and (D) of Fig. 9 indicate the presence of several artifacts due to theover-amplification of excess template DNA. These artifacts includeshoulder peaks due to incomplete non-template-directed nucleotideaddition, cross-dye “pull-up” signals due to off-scale peaks in ad-jacent detector channels, and stutter peaks above 100 RFU. Forsome slot-blot quantified samples in the DNA degradation series,off-scale peaks led to pull-up signals as intense as 2700 RFU (datanot shown). Off-scale peaks are evident even for samples exposedto DNase for only 30 minutes (Table 4). Inter-locus balance, asrepresented by the D19/D18 ratios, was significantly worse for theslot-blot quantified samples than for the qPCR-quantified samples(Table 4). Although some of these artifacts (e.g., off-scale peaks,“pull-up” signals) are possibly remedied by reducing CE sampleinjection times, other artifacts (e.g., shoulders due to incompletenucleotide addition, poor inter-locus balance) are repairable onlyby re-amplification.
Highly degraded samples present analytical challenges for DNAquantification and for subsequent STR genotyping. The quantityand quality of DNA in such samples, which are typically comprisedof fragments with a wide range of sizes, cannot be represented byany single qPCR assay, which is fundamentally biased to detect andquantify the subpopulation of fragments that are at least as long asthe specific target sequence being amplified. In principle, the mostaccurate estimate of overall DNA quantity in degraded samples

TIM
KE
NE
TA
L.•N
UC
LEA
R-M
ITOC
HO
ND
RIA
LD
UP
LEX
qPC
RA
SS
AY11
D3 D16 D2 D19 vWA AML D5A) All Assays 12 13 29 30 11 12 13 14 16 7 8 8 11 11 17 14 16 8 11 14 15 X 12 22 24
0 min 100 - none -1 min 100 - none -2 min 100 - none -3 min 100 - none -4 min 100 - none -5 min 100 - none -
B)15 min 100 - none -30 min 96 - none -45 min 84 2 P60 min 76 - none -
C)15 min 84 - none -30 min 76 - none -45 min 48 - none -60 min 28 - none -
D)15 min 100 1 O, 2 P, 2 S, 3 A30 min 100 1 O, 3 P, 2 S, 3 A45 min 92 2 O, 3 P, 1 S, 3 A60 min 92 2 O, 3 P, 3 S, 4 A
* O = off-scale peak; P = detected pull-up signal; S = detected stutter signal; A = detected shoulder due to incomplete A addition
FGA
nuTH01-mtND1 qPCR
Quantifiler qPCR
Slot Blot Hybridization
DNaseTreatment
Percent of STR Alleles
Detected
Number of STR Artifacts*
THO1 D13 TPOX D18D8 D21 D7 CSFBlue (FAM) STRs Green (VIC) STRs Yellow (NED) STRs Red (PET) STRs
FIG. 8—Overview of AmpFlSTR R© IdentifilerTM STR results obtained for DNase-degraded HL60 DNA samples. Each shaded rectangle indicates the detection of an STR allele with intensity at least100 RFU. Un-shaded rectangles indicate alleles that were undetected at the 100 RFU analytical threshold. For each reporter dye, the IdentifilerTM alleles are presented left to right in order of increasingsize. STR amplifications used nominal 1 ng input levels of nuclear DNA, as quantified by the nuTH01-mtND1 duplex qPCR assay (panels A and B), by the QuantifilerTM assay (panels A and C), or by slotblot hybridization (panels A and D).

12 JOURNAL OF FORENSIC SCIENCES
D3 TH01 D13 D16 D2
BT
S PU
A A
BT BT BT
(A) nuTH01
(B) QuantifilerIM
(C) slot blot
(D) slot blot (10x)
FIG. 9—AmpFlSTR R© IdentifilerTM VIC-labeled STRs from DNase-degraded (45 min) HL60 samples. Panels show STR alleles for amplifications of “1 ng”amounts of nuclear template as determined by: (A) nuTH01-mtND1 duplex qPCR, (B) QuantifilerTM qPCR, and (C) slot blot hybridization. Panel (D) is a10-fold vertical scale expansion of panel (C). Detection and/or amplification artifacts are indicated as: BT = below detection threshold; PU = “pull-up”signal from adjacent detection channel; S = detected stutter signal; A = detected shoulder due to incomplete non-template nucleotide addition. Fullvertical-scale RFU values for the panels are: (A) 2500 RFU; (B) 500 RFU; (C) 3500 RFU; (D) 350 RFU.
should be provided by qPCR assays that use very short target se-quences. However, for the specific purpose of STR genotyping, theoverall DNA quantity in a degraded sample is not necessarily themeasurement of interest. Our results indicate that if qPCR methodsare to be used to quantify degraded DNA for STR genotyping, thereare advantages in selecting a qPCR target sequence that is of appro-priate length to detect those DNA fragments that are most relevantto the method of analysis. This is particularly true for the highlymultiplexed commercial STR genotyping kits that are used in mostforensic DNA labs, kits that recommend the use of a fairly narrowrange of template DNA to give optimal success rates for STR am-plification and detection. For the AmpFlSTR R© IdentifilerTM STRkit, which amplifies STRs ranging from ∼100 bp to ∼400 bp, ourgenotyping results indicate that “1 ng” quantities of highly degradedDNA are better estimated by using a ∼180 bp nuclear qPCR targetsequence, as in the nuTH01-mtND1 duplex assay, than by using a62 bp qPCR target sequence, as in the QuantifilerTM qPCR assay.Although this discussion is based on our experiments with a spe-cific set of DNase-degraded samples, the general conclusion thatthe target length of a qPCR assay is an important considerationfor quantifying DNA in degraded samples is sound. We are aware,however, that the degree of advantage gained by using a long targetsequence for qPCR will likely depend on precisely how the sampleis extracted and purified.
In addition to quantifying the amount of nuclear DNA, we alsoused the mtND1 portion of our duplex qPCR assay to estimatethe quantity of mitochondrial genome copies in this same set ofDNase-degraded samples. These mtND1 quantification results areprovided graphically in Fig. 10. In this figure, the mitochondrialquantification results shown at each time-point in the degradationseries are normalized relative to the quantification result for theuntreated sample (1.3 million mt copies/µL). For comparison, thefigure also shows normalized nuclear quantifications, as estimatedby the nuTH01 and QuantifilerTM qPCR assays for the same set of
DNase-degraded samples. Notice that the mtND1 and QuantifilerTM
assays generally measured higher normalized quantities of DNAthan did the nuTH01 assay. For example, both the mtND1 andQuantifilerTM assays indicated that ∼25% of the initial DNA re-mained after 45 minutes of DNase exposure, while the nuTH01assay detected only ∼5% of the initial DNA concentration. It islikely that because the mtND1 qPCR assay amplifies a relativelyshort target sequence (69 bp), the normalized quantifications forthe mtND1 and QuantifilerTM assays were very similar, despitequantifying entirely different genomes. Because we have alreadyseen that the selection of a short nuclear target has implicationsfor STR genotyping, we were motivated to learn if the selectionof a short mitochondrial quantification target would have a similardetrimental impact on HVI/HVII amplification success rates.
To address this issue, we performed two separate sets ofHVI/HVII duplex PCR amplifications on samples from the DNAdegradation series. In the first set, for each time-point in the serieswe amplified 100 pg of nuclear DNA, as measured by the nuTH01portion of the duplex qPCR assay. This approach, to use the quan-tity of nuclear DNA to indirectly estimate the amount of templatefor HVI/HVII PCR amplifications, is commonly used in the foren-sic analysis of mitochondrial DNA, if there is sufficient nuclearDNA to be quantified (30,58). In the second set, for each time pointwe amplified ∼14,000 mitochondrial genome copies, as estimateddirectly by the mtND1 portion of the duplex qPCR assay. (For pris-tine samples of HL60, we had previously determined that 100 pg ofnuclear DNA represented ∼14,000 mitochondrial genome copies.)The post-amplification yield gel results for both sets of HVI/HVIIduplex PCR amplifications are shown in Fig. 11.
A “successful” HVI/HVII duplex PCR amplification was con-sidered to produce sufficient quantities of the HVI and HVII PCRproducts for successful cycle sequencing. For cycle sequencing,our laboratory has validated a protocol that uses the AppliedBiosystems Terminator BigDye R© v1.1 Cycle Sequencing System

TIMKEN ET AL. • NUCLEAR-MITOCHONDRIAL DUPLEX qPCR ASSAY 13
0
0.2
0.4
0.6
0.8
1
1.2
0.00 5.00 10.00 15.00 20.00 25.00 30.00 35.00 40.00 45.00 50.00
DNase I Exposure (min)
Nor
mal
ized
DN
A Q
uant
ity
(rel
ativ
e to
zer
o-tim
e D
Nas
e ex
posu
re) Normalized Quantifiler qPCR (dashed line)
Normalized mtND1 qPCR (solid line)
Normalized nuTH01 qPCR (dotted line)
FIG. 10—Normalized quantifications of DNase-degraded HL60 samples by mtND1 (duplex) qPCR, QuantifilerTM qPCR, and nuTH01 (duplex) qPCR.Each point represents the average of duplicate quantifications. For each assay, the DNA quantities are normalized relative to the measured quantity at0 min of DNase-treatment, i.e., to 8.1 ng/µL for the QuantifilerTM assay, to 8.3 ng/µL for the nuTH01 assay, and to 1.3 × 10⁶ mt copies/µL for the mtND1qPCR assay. Lines represent linear least-squares fits to early (0–5 min) and late (15–45 min) time points in the degradation series.
(A) Amplification of 100 pg nuclear DNA
(B) Amplification of ~14,000 mitochondrial copies
L2 L4 0 1 2 3 4 5 15 30 45 60 ON L2 L4
L2 L4 0 1 2 3 4 5 15 30 45 60 ON L2 L4
FIG. 11—HVI/HVII post-amplification yield gel results for DNase-degraded HL60 samples. Gel is EtBr stained. Each pair of bands represents the HVI(∼444 bp) and HVII (∼416 bp) PCR products from 34 cycles of the duplex amplification. Numerical lane designations (0–60) represent DNase digestiontimes in minutes; ON represents overnight DNase digestion; L2 and L4 represent, respectively, 20 ng and 40 ng ladder bands (400 bp). In panel (A),amplifications used 100 pg of nuclear DNA as estimated by the nuTH01 portion of the duplex qPCR assay, except for the ON sample, which used 20 µL ofdigest. In panel (B), amplifications used 14,000 mitochondrial genome copies as estimated by mtND1 portion of the duplex qPCR assay.
(30). Although the manufacturer recommends using 3–10 ng/20 µLof PCR product in each 50 µL cycle-sequencing reaction (59),local validation studies indicate that successful sequencing can beroutinely achieved even with as little as 250 pg of PCR productper reaction. Even using the more conservative recommendationof 3–10 ng/20 µL, we can deduce that a “successful” HVI/HVIIamplification is one that produces at least 0.15 ng/µL of each PCRproduct. This concentration is well below the visual detection limitof our ethidium bromide-stained gel. Consequently, our criterionfor a successful HVI/HVII amplification is simply that the post-amplification yield gel shows visible evidence, even weak visi-ble evidence, for two appropriately sized product bands. Referringagain to Fig. 11, the visual appearance of two such bands for all ofthe amplifications indicates that both targets of the duplex qPCRassay successfully quantified mitochondrial DNA for HVI/HVII
duplex PCR and that all amplifications produced more than enoughof each PCR product for successful cycle sequencing. It is, how-ever, evident that there were implications for selecting a short targetsequence for the mtND1 qPCR assay. In particular, Fig. 11 (panel(B)) shows that for highly degraded samples (15 min—overnightDNase treatment) increasingly weak HVI/HVII bands are seen inthe post-amp yield gel. This trend indicates that the “short” mtND1qPCR assay overestimated the number of ∼400 bp mitochondrialgenome copies, just as the QuantifilerTM qPCR assay overestimatedthe quantity of 100–400 bp nuclear genome copies in these samesamples. However, because the mitochondrial cycle sequencingprotocol is capable of obtaining successful results over a very wideinput range of PCR product (250 pg–10 ng), these overestimationsof the quantity of mitochondrial DNA by the mtND1 qPCR assaydid not lead to any failed HVI/HVII amplifications.

14JO
UR
NA
LO
FF
OR
EN
SIC
SC
IEN
CE
S
TABLE 5—Summary of nuTH01-mtND1 qPCR quantification results for selected reference and casework-type samples. Where indicated, NSF and SF represent, respectively, the non-sperm fractionand sperm fraction from a differential extraction protocol. All quantification results, qPCR and slot blot, are from single replicate experiments. IS indicates that insufficient sample was available
for amplification.
Genome Copy Mitochondrial ApproximatenuTH01 Ratio— HVI/HVII Post- IdentifilerTM STR Data (RFUs per locus) MitochondrialqPCR Slot Blot mtND1 qPCR Mitochondrial: Amplification Copies Amp’ed for
Sample Number and Description (ng/4 µL) (ng/4 µL) (1000 copies/4 µL) Nuclear Yield Gel TH01 D19 D18 D19/D18 Limited Samples
1 liquid blood 0.42 0.60 200 1600 ± 1213 5199 255 20.42 liquid blood 1.22 0.95 380 1000 + 1349 1065 980 1.13 dried blood on black sateen 19.0 11.6 1400 240 + 1814 1444 1403 1.04 dried blood in potting mix 3.86 9.11 480 410 + 7829 6079 1033 5.95 dried blood on newspaper 0.51 0.45 60 390 + 2522 1586 1363 1.26 dried blood on denim 0.12 0.10 37 1000 + 4486 3562 775 4.67 dried blood on wool 2.25 1.50 300 440 + 2096 1335 1230 1.18 dried blood on carpet 0.46 0.39 86 620 + 2747 2204 1429 1.59 dried blood on leather 0.15 0.10 18 400 + 2562 1468 1292 1.1
10 dried blood on toothpick 1.48 0.66 290 650 + 2466 1399 1145 1.211 femur (powdered) 0.24 0.05 170 2300 + 2412 3231 378 8.612 non-root hair shaft (Chelex) 0 0 9.1 — + IS IS IS IS13 non-root hair shaft (DNA-IQ) 0 0 2.0 — ± IS IS IS IS 500014 toenail 4.83 0.88 9700 6600 + 2319 3038 459 6.615 toenail 1.06 0.22 1400 4400 + 1810 1523 333 4.616 semen on denim (NSF) 0.53 0.13 50 320 + 3459 2335 1323 1.817 semen on boxer shorts (NSF) 0.23 0.09 990 14000 ± 2867 4702 456 10.318 vaginal swab (NSF) 32.1 19.9 880 90 + 3046 1869 927 2.019 electric razor shavings 1.83 0.80 2900 5200 ± 1661 1920 484 4.020 swab of razor 0.42 0.07 210 1700 + 1218 915 534 1.721 bloody bandage 52.4 10.1 1700 110 + 1747 1319 1055 1.321 saliva from cigarette butt 0.77 0.29 470 2000 + 1814 1553 671 2.322 saliva from envelope 0.52 0.35 160 1000 + 1890 1308 847 1.524 toothbrush 1.85 1.06 390 700 + 1608 1314 749 1.825 saliva from coffee cup 0.84 0.29 270 1100 + 3017 2051 936 2.226 buccal swab 16.0 5.10 4800 990 + 1677 1182 1130 1.027 buccal swab 17.8 6.70 4900 910 + 1722 1476 937 1.628 buccal swab 5.49 2.13 2400 1400 + 2059 1335 1134 1.229 saliva from envelope 0.04 0 3.4 280 ± IS IS IS IS 130030 vaginal swab (SF) 0.04 0 0.036 2.7 0 1204 1417 1005 1.4 30031 vaginal swab (SF) 4.68 2.99 0.71 0.5 + 2464 1555 1101 1.432 semen on denim (SF) 2.03 1.61 0.014 0.02 + 1580 1067 1038 1.0 70033 semen on leather (SF) 0.27 0.09 0 0 + 3579 2635 1888 1.4 (20 µL)34 semen on cotton fabric (SF) 39.4 28.5 0.16 0.01 + 2164 1592 1272 1.3 700035 semen/blood on swab (SF) 0.74 1.06 0.046 0.2 + 1857 1832 1304 1.4 230036 semen on boxer shorts (SF) 0.40 0.15 38 310 ± 3963 3068 552 5.637 muscle tissue 133 31.4 20000 500 + 1323 620 696 0.938 baby tooth 0.26 0.23 38 480 ± 2017 1846 1354 1.439 baby tooth 10.6 2.19 800 250 + 2432 1780 1052 1.740 tooth 53.1 34.1 5300 330 + 1723 1197 1198 1.0

TIMKEN ET AL. • NUCLEAR-MITOCHONDRIAL DUPLEX qPCR ASSAY 15
nuTH01-mtND1 Duplex qPCR Validation: Referenceand Casework-type Samples
In order to further evaluate the nuTH01-mtND1 duplex qPCRassay, we quantified DNA extracts from a variety of referenceand simulated casework samples for subsequent STR genotyp-ing and mitochondrial HVI/HVII amplifications. A summary ofresults for a subset of 40 samples from this study is presentedin Table 5. For STR genotyping, each amplification used 1 ngof nuclear template DNA as determined by the nuTH01 portionof the duplex qPCR assay. STR results are represented in the ta-ble by the RFU values per locus for three of the 15 AmpFlSTR R©IdentifilerTM STR loci, TH01(163–202 bp), D19(102–136 bp), andD18(262–346 bp) (60). Data for these particular loci were selectedbecause their amplicons represent intermediate, short, and longSTR alleles, respectively, in the genotyping kit. The D19/D18 RFUratios are tabulated to provide a simple STR-based metric to in-dicate DNA degradation. For HVI/HVII amplifications, ∼14,000mitochondrial copies were used per reaction, as quantified by themtND1 portion of the duplex qPCR assay. For some samples, lim-ited quantities required amplification of fewer than 14,000 copies(last column in the table). HVI/HVII amplifications were evaluatedby post-amplification gel electrophoresis, where the gel results arerepresented by either a “+” (to indicate two visible HVI/HVII prod-uct bands with expected intensities), a “±” (to indicate two visibleproduct bands with lower than expected intensities), or a “0” (toindicate that no product bands were seen). Both “+” and “±” re-sults indicate that the amplifications provided more than enoughHVI/HVII product for cycle sequencing.
For nearly all of these casework-type samples, quantificationsprovided by the nuTH01-mtND1 duplex qPCR assay led to suc-cessful STR and HVI/HVII amplifications. With one exception,each sample that contained a sufficient quantity of nuclear DNAwas amplified to give a full STR profile. For the single exception,sample #1, only the CSF alleles were undetected, a result con-sistent with the very high degree of DNA degradation evident inthis sample (D19/D18 > 20). Sample #4 was inhibited, as indicatedby nuTH01 and mtND1 qPCR amplification curves with shallowslopes and reduced final plateau values (data not shown). Due tothe presence of co-extracted inhibitors in this sample, the nuTH01qPCR assay underestimated the quantity of nuclear DNA, leadingto STR amplification of excess template and to unusually intenseTH01 and D19 allele signals. Sample #30 gave an unsuccessfulHVI/HVII duplex amplification; this sample was extracted from asperm cell fraction that contained very little nuclear or mitochon-drial DNA. Several other sperm cell extracts (samples 31–35) gavesuccessful HVI/HVII duplex amplifications despite having verylow or even undetected quantities of mitochondrial DNA, indicat-ing that the mtND1 portion of the assay significantly underesti-mated the mitochondrial quantity in these particular samples. Asdiscussed earlier in this paper, such underestimations of DNA bythe mtND1 qPCR assay are expected when the ratio of mitochon-drial to nuclear genome copies is low, as is the case for these spermfraction samples. For non-sperm-cell-fraction samples, the empir-ical ratios of mitochondrial to nuclear genome copies (mt#:nu#)were seen to range from 90 to 14,000. The breadth of this rangeis likely due, in part, to intrinsic differences in the mt#:nu# for thevarious tissue types and, in part, due to differences in the extent ofDNA fragmentation in these samples, as the short mitochondrialND1 qPCR target sequence detects smaller DNA fragments thandoes the longer nuclear TH01 target sequence. It is worth notingthat for any sample exhibiting an empirical mt#:nu# greater than2000, there was corresponding evidence for DNA degradation in
the STR intensity ratios (D19/D18 > ∼4), suggesting that genomecopy number ratios estimated from the duplex qPCR assay canprovide useful information about DNA fragmentation.
Conclusions
We have developed a duplex qPCR assay for the specific quan-tification of human nuclear and mitochondrial genomes in a va-riety of forensic-type samples. The nuclear portion of the assay(nuTH01) quantifies DNA in samples with concentrations rangingfrom ∼10 pg/µL to at least 25 ng/µL, while the mitochondrial por-tion of the assay (mtND1) provides quantifications over the range∼4 copies/µL to ∼2 million copies/µL. The quantifications weresuitably accurate and precise for determining template quantities fornuclear STR genotyping and mitochondrial HVI/HVII sequencingapplications.
For quantifying DNA in highly degraded samples, our resultsindicate that the length of the qPCR target sequence is an impor-tant consideration when selecting an assay for forensic use. Forthe purpose of STR genotyping, the nuTH01 portion of the du-plex qPCR assay, which uses a ∼170–190 bp target sequence, wasfound to be well suited for estimating nuclear DNA quantities inhighly degraded samples. Because this assay detects and quantifiesDNA fragments that are of the same general length as the STRalleles amplified in commercial genotyping kits, it provided an op-timal estimate of the quantity of nuclear template to amplify forsuccessful STR genotyping. By contrast, less than optimal resultswere obtained when these same highly degraded samples werequantified using a nuclear qPCR assay with a much shorter targetsequence (62 bp). This assay, by detecting shorter DNA fragments,overestimated the quantity of STR-sized fragments, resulting in arelatively high proportion of under-amplified and undetected STRalleles. Slot blot quantifications of the same highly degraded sam-ples resulted in underestimated quantities of nuclear DNA, leadingto over-amplification of excess template, off-scale STR peaks, andundesired artifact signals.
Acknowledgments
We appreciate advice and assistance from a number of colleaguesat the State of California Jan Bashinski Department of Justice DNALab, including Mavis Date Chong, Ram Kishore, Sonja Klein,Jeanette Wallin, Eva Steinberger, and Cecilia von Beroldingen.For providing DNA extracts from a variety of sample types, weacknowledge the following colleagues: Angelynn Moore, AmyHoover, Christopher Gale, Jessica Battaglia, Dianne Burns, DeannaKacer and Jeanette Wallin.
References
1. Nicklas JA, Buel E. Quantification of DNA in forensic samples. AnalBioanal Chem 2003;376:1160–7. [PubMed]
2. Waye JS, Presley LA, Budowle B, Shutler GG, Fourney RM. A simpleand sensitive method for quantifying human genomic DNA in forensicspecimen extracts. Biotechniques 1989;7:852–5. [PubMed]
3. Walsh PS, Varlaro J, Reynolds R. A rapid chemiluminescent method forquantification of human DNA. Nucleic Acids Res 1992;20:5061–5. [PubMed]
4. Mandrekar MN, Erickson AM, Kopp K, Krenke BE, Mandrekar PV,Nelson R, et al. Development of a human DNA quantitation system.Croat Med J 2001;42:336–9. [PubMed]
5. Hayn S, Wallace MM, Prinz M, Shaler RC. Evaluation of an auto-mated liquid hybridization method for DNA quantification. J ForensicSci 2004;49:87–91. [PubMed]

16 JOURNAL OF FORENSIC SCIENCES
6. Sifis ME, Both K, Burgoyne LA. A more sensitive method for thequantitation of genomic DNA by Alu amplification. J Forensic Sci2002;47:589–92.[PubMed]
7. Nicklas JA, Buel E. Development of an Alu-based, QSY7-labeled primerPCR method for quantitation of human DNA in forensic samples.J Forensic Sci 2003;48:282–91.[PubMed]
8. Fox JC, Cave CA, Schumm JW. Development, characterization, andvalidation of a sensitive primate-specific quantification assay for forensicanalysis. Biotechniques 2003;34:314–22.[PubMed]
9. Mackay I, Arden KE, Nitsche A. Real-time PCR in virology. NucleicAcids Res 2002;30:1292–305.[PubMed]
10. Walker NJ. A technique whose time has come. Science 2002; 296:557–8.[PubMed]11. Bustin SA. Quantification of mRNA using real-time reverse transcript
PCR (RT-PCR): trends and problems. J Mol Endocrinol 2002;29:23–39.[PubMed]
12. Cockerill FR. Application of rapid-cycle real-time polymerase chainreaction for diagnostic testing in the clinical microbiology laboratory.Arch Pathol Lab Med 2003;127:1112–20.[PubMed]
13. Ginzinger DG. Gene quantification using real-time quantitative PCR: anemerging technology hits the mainstream. Exp Hematol 2002;30:503–12.[PubMed]
14. Nicklas JA, Buel E. Development of an Alu-based, real-time PCR methodfor quantitation of human DNA in forensic samples. J Forensic Sci2003;48:936–44.[PubMed]
15. Richard ML, Frappier RH, Newman JC. Developmental validation of areal-time quantitative PCR assay for automated quantification of humanDNA. J Forensic Sci 2003;48:1041–46.[PubMed]
16. Applied Biosystems. QuantifilerTM kits user’s manual (part number4344790B). Foster City, CA: Applied Biosystems, 2003.
17. Andreasson H, Gyllensten U, Allen M. Real-time DNA quantificationof nuclear and mitochondrial DNA in forensic analysis. Biotechniques2002;33:402–11.[PubMed]
18. von Wurmb-Schwark N, Higuchi R, Fenech AP, Elfstroem C, Meissner C,Oehmichen M, Cortopassi GA. Quantification of human mitochondrialDNA in real time PCR. Forensic Sci Int 2002;126:34–9.[PubMed]
19. Alonso A, Martin P, Albarran C, Garcia P, Primorac D, Garcia O, et al.Specific quantification of human genomes from low copy number DNAsamples in forensic and ancient DNA studies. Croat Med J 2003;44:273–80.[PubMed]
20. Heid CA, Stevens J, Livak KJ, Williams PM. Real time quantitative PCR.Genome Res 1996;6:986–94.[PubMed]
21. Tyagi S, Kramer F.R. Molecular beacons: probes that fluoresce uponhybridization. Nat Biotechnol 1996;14:303–8.[PubMed]
22. Whitaker JP, Clayton TM, Urquhart AJ, Millican ES, Downes TJ,Kimpton CP, Gill P. Short tandem repeat typing of bodies from a massdisaster: high success rate and characteristic amplification patterns inhighly degraded samples. Biotechniques 1995;4:670–7.
23. Alonso A, Andelinovic S, Martin P, Sutlovic D, Erceg I, Huffine E, et al.DNA typing from skeletal remains: evaluation of multiplex and megaplexSTR systems on DNA isolated from bone and teeth samples. Croat MedJ 2001;42:260–6.[PubMed]
24. Prinz M, Schmitt C. Effect of degradation on PCR based DNA typing.Adv Forensic Haemogenetics 1994;5:375–8.
25. von Wurmb-Schwark N, Schwark T, Harbeck M, Oehmichen M. A simpleduplex-PCR to evaluate the DNA quality of anthropological and forensicsamples prior to short tandem repeat typing. Leg Med (Tokyo) 2004;6:80–8.[PubMed]
26. Alonso A, Martin P, Albarran C, Garcia P, Garcia O, de Simon LF,et al. Real-time PCR designs to estimate nuclear and mitochondrial DNAcopy number in forensic and ancient DNA studies. Forensic Sci Int2004;139:141–9.[PubMed]
27. Gill P, Jeffreys AJ, Werrett DJ. Forensic application of DNA ‘finger-prints.’ Nature 1985;318:577–9.[PubMed]
28. Promega Corporation. Tissue and hair extraction kit protocol (TB307).Madison, WI: Promega Corporation, 2002.
29. Gabriel MN, Calloway CD, Reynolds RL, Primorac D. Identificationof human remains by immobilized sequence-specific oligonucleotideprobe analysis of mtDNA hypervariable regions I and II. Croat Med J2003;44:293–8.[PubMed]
30. Chong MD, Calloway CD, Klein SB, Orrego C, Buoncristiani MR.Optimization of a duplex amplification and sequencing strategy for theHVI/HVII regions of human mitochondrial DNA for forensic casework.Forensic Sci Int. In press.
31. Applied Biosystems. PrimerExpressTM software v2.0 user’s man-ual (part number 4329500A). Foster City, CA: Applied Biosystems,2001.
32. Benson DA, Karsch-Mizrachi I, Lipman DJ, Ostell J, Wheeler DL.GenBank: update. Nucleic Acids Res 2004;32:Database issue:D23–6.(http://www.ncbi.nih.gov/Genbank/GenbankOverview.html) [PubMed]
33. Ruitberg CM, Reeder DJ, Butler JM. STRBase: a short tandem repeatDNA database for the human identity testing community. Nucleic AcidsRes 2001;29:320–2. (http://www.cstl.nist.gov/biotech/strbase/) [PubMed]
34. Kogelnik AM, Lott MT, Brown MD, Navathe SB, Wallace DC.MITOMAP: A human mitochondrial genome database. Nucleic AcidsRes 1996;24:177–9. (http://www.mitomap.org/) [PubMed]
35. Masibay A, Mozer TJ, Sprecher C. Promega corporation revealsprimer sequences in its testing kits. J Forensic Sci 2000;45:1360–2. [PubMed]
36. Butler JM, Becker CH. Improved analysis of DNA short tandem re-peats with time-of-flight mass spectrometry. NIJ Science and Technol-ogy Research Report, 2001: Report NCJ 188292. (http://www.ncjrs.org/pdffiles1/nij/188292c.pdf)
37. Crews S, Ojala D, Posakony J, Nishiguchi J, Attardi G. Nucleotide se-quence of a region of human mitochondrial DNA containing the preciselyidentified origin of replication. Nature 1979;277:192–8. [PubMed]
38. http://www.ncbi.nlm.nih.gov/blast39. http://www.ncbi.nlm.nih.gov/SNP/40. http://www.ncbi.nlm.nih.gov/omim/41. Applied Biosystems. TaqMan R© universal PCR master mix protocol (part
number 4304449C). Foster City, CA: Applied Biosystems, 2002.42. Applied Biosystems. User bulletin #5 ABI 7700 sequence detection sys-
tem: multiplex PCR with TaqMan R© VIC probes (part number 4306236B).Foster City, CA: Applied Biosystems, 2001.
43. Creating standard curves with genomic DNA or plasmid DNA tem-plates for use in quantitative PCR. Applied Biosystems. (http://www.appliedbiosystems.com/support/tutorials/pdf/quant pcr.pdf)
44. Efficiency of PCR reactions. Stratagene Application Note #10 for theMx4000 Multiplex Quantitative PCR System. (http://www.stratagene.com/lit items/appnotes10.pdf)
45. http://web.mit.edu/osp/www/melt.html46. Poland D. Recursion relation generation of probability profiles for
specific-sequence macromolecules with long-range correlations.Biopolymers 1974;13:1859–71. [PubMed]
47. Fixman M, Freire JJ. Theory of DNA melting curves. Biopolymers1977;16:2693–704. [PubMed]
48. Lerman LS, Silverstein K. Computational simulation of DNA meltingand its application to denaturing gradient gel electrophoresis. MethodsEnzymol 1984;155:482–501.
49. van Oorschot RAH, Gutowski SJ, Robinson SL. HUMTH01: amplifica-tion, species specificity, population genetics and forensic applications.Int J Legal Med 1994;107:121–6. [PubMed]
50. Crouse CA, Schumm J. Investigation of species specificity us-ing nine PCR-based human STR systems. J Forensic Sci 1995;40:952–6. [PubMed]
51. Annual report summary for testing in 2002. American Association ofBlood Banks, 2003. (http://www.aabb.org/About the AABB/Stds andAccred/ptannrpt02.pdf)
52. Anderson S, Bankier AT, Barrell BG, deBruijn MH, Coulson AR, DrouinIC, et al. Sequence and organization of the human mitochondrial genome.Nature 1981;290:457–65. [PubMed]
53. Cummings MP, Otto SP, Wakeley J. Sampling properties of DNAsequence data in phylogenetic analysis. Mol Biol Evol 1995;12:814–22. [PubMed]
54. Szuhai K, van den Ouweland JM, Dirks RW, Lemaitre M, TruffertJC, Janssen GM, et al. Simultaneous A8344G heteroplasmy and mi-tochondrial DNA copy number quantification in myoclonus epilepsyand ragged-red fibers (MERRF) syndrome by a multiplex molec-ular beacon based real-time fluorescence PCR. Nucleic Acids Res2001;29:e13. [PubMed]
55. Gahan ME, Miller F, Lewin SR, Cherry CL, Hoy JF, Mijch A, et al.Quantification of mitochondrial DNA in peripheral blood mononuclearcells and subcutaneous fat using real-time polymerase chain reaction.J Clin Virol 2001;22:241–7. [PubMed]
56. Li W, Xi B, Yang W, Hawkins M, Schubart UK. Complex DNA meltingprofiles of small PCR products revealed using SYBR Green I. Biotech-niques 2003;35:702–6. [PubMed]

TIMKEN ET AL. • NUCLEAR-MITOCHONDRIAL DUPLEX qPCR ASSAY 17
57. Abrams ES, Murdaugh SE, Lerman LS. Intramolecular DNA meltingbetween stable helical segments: melting theory and metastable states.Nucleic Acids Res 1995;23:2775–83.[PubMed]
58. Budowle B, Smith J, Moretti T, DiZinno T. DNA typing protocols: molec-ular biology and forensic analysis. Natick, MA: Eaton Publishing, 2000.
59. Applied Biosystems. BigDye R© Terminator v1.1 cycle sequencing kitprotocol (part number 4337036A). Foster City, CA: Applied Biosystems,2002.
60. Applied Biosystems. Application Note: AmpFlSTR R© Identifiler R© PCRamplification kit (publication number 112AP02–01). Foster City, CA:Applied Biosystems, 2003.
Additional information and reprint requests:Martin R. Buoncristiani, M.P.H.California Dept. of Justice Jan Bashinski DNA Laboratory1001 W. Cutting Blvd., Suite 110Richmond, CA 94804