Embed Size (px)
Citation preview
A
Easy, Fast and Energy Efficient Object Detection on HeterogeneousOn-Chip Architectures1
Ehsan Totoni, University of Illinois at Urbana-ChampaignMert Dikmen, University of Illinois at Urbana-ChampaignMarıa Jesus Garzaran, University of Illinois at Urbana-Champaign
We optimize a visual object detection application (that uses Vision Video Library kernels) and show thatOpenCL is a unified programming paradigm that can provide high performance when running on the IvyBridge heterogeneous on-chip architecture. We evaluate different mapping techniques and show that run-ning each kernel where it fits the best and using software pipelining can provide 1.91 times higher perfor-mance, and 42% better energy efficiency. We also show how to trade accuracy for energy at runtime. Overall,our application can perform accurate object detection at 40 frames per second (fps) rate, in an energy effi-cient manner.
1. INTRODUCTIONMany computing platforms used by consumers are portable devices such as notebooks,tablets, smart phones and more. Since these devices are usually battery powered,achieving high energy efficiency is a crucial challenge. On the other hand, becauseof their portability, mobile devices encounter many situations where they are expectedto understand their environment in a natural way. For example, many photo applica-tions need to automatically adjust the focal range based on the size of faces looking at acamera. In addition, gestures are frequently preferred to classical keyboard and mousebased input. Furthermore, search engines can allow a query to be formulated using vi-sual inputs without requiring the user to provide the semantic translation of the visualcontent. Most natural interactions, such as the examples mentioned, require some us-age of vision and video analytics algorithms. These tend to be floating-point intensiveand computationally demanding, but also regular, which make them good candidatesfor parallelism.
Such data parallel algorithms adapt well to GPU type architectures, resulting inhigher performance and energy efficiency [Kumar et al. 2005]. However, general pur-pose programming of GPUs requires knowledge of new programming paradigms, suchas CUDA and OpenCL, which decreases programmer productivity.
Traditionally, the GPU has been a peripheral component, used as a computationalaid to the CPU (which is needed for latency-oriented functions such as the operatingsystem). However, deploying stand-alone GPUs may not be desirable (or even practical)for portable platforms for different reasons. First, using an extra chip increases thesystem design and implementation cost significantly. Second, the extra chip, along
1New Paper, Not an Extension of a Conference Paper
This work has been done at the Intel-Illinois Parallelism Center of Department of Computer Science at theUniversity of Illinois at Urbana-Champaign, Urbana, IL, 61801.Permission to make digital or hard copies of part or all of this work for personal or classroom use is grantedwithout fee provided that copies are not made or distributed for profit or commercial advantage and thatcopies show this notice on the first page or initial screen of a display along with the full citation. Copyrightsfor components of this work owned by others than ACM must be honored. Abstracting with credit is per-mitted. To copy otherwise, to republish, to post on servers, to redistribute to lists, or to use any componentof this work in other works requires prior specific permission and/or a fee. Permissions may be requestedfrom Publications Dept., ACM, Inc., 2 Penn Plaza, Suite 701, New York, NY 10121-0701 USA, fax +1 (212)869-0481, or [email protected]© YYYY ACM 1544-3566/YYYY/01-ARTA $15.00DOI:http://dx.doi.org/10.1145/0000000.0000000
ACM Transactions on Architecture and Code Optimization, Vol. V, No. N, Article A, Publication date: January YYYY.
A:2
with its associated overheads such as power supplies, increases the power and energyconsumption. Third, the off-chip connection between the CPU and the GPU may havehigh performance and energy overheads.
A reasonable alternative for deploying a GPU is to put it on the same chip as theCPU, and create a heterogeneous on-chip architecture. Advancements in system-on-chip design and increases in the number of available on-chip transistors has madehybrid architectures practical. Emerging examples such as Intel Ivy Bridge [Damarajuet al. 2012], AMD Fusion [Foley et al. 2012] and NVIDIA Tegra 250 [NVIDIA 2011]have implemented this idea.
For this study, we have chosen an application, object detection using ViVid [Dik-men et al. 2012], as a representative of vision applications. The domain of our studyis on-chip hybrid architectures, which are most predominantly found in mobile plat-forms. We believe that object detection is a representative mobile application becauseit is fairly computationally demanding and it processes streamed visual input from acamera. Similar to our study, most vision applications that would be utilized in mobiledevices (e.g. recognition, tracking, stabilization) consist of a pipeline of small numberof kernels, where kernels are the core compute intensive components of an application.Of course, there is a large variety of kernels across the spectrum of vision applications.However, from a computational perspective, the pipeline in this paper provides a goodmixture of kernels efficient on GPU, CPU or both. In addition, object detection is an im-portant application for future portable devices, which has not yet been realized beyondbasic face detection. Notice that our focus on one application allows us to go deeperinto the details of individual kernels. We describe and evaluate the steps one mighttake to improve performance and energy efficiency: (1) Code optimization, (2) Map-ping strategies, (3) Dynamic Voltage and Frequency Scaling (DVFS) [Mudge 2001] and(4) Algorithmic tradeoff of accuracy. We report the lessons learned, which would giveinsight to application developers and system designers.
In this paper, we evaluate and analyze different programming paradigms and strate-gies for energy efficiency. We implement and execute (on the Ivy Bridge architecture)four different code versions of ViVid using 1) OpenCL, 2) OpenMP + auto-vectorization,3) OpenMP + vector intrinsics, and 4) the OpenCV vision library. The OpenCL versionruns on both the CPU and the GPU, while the other versions only run on the CPU.Our experimental results show that OpenCL does not deliver the performance thatcan be attained when using lower level interfaces (e.g. vector intrinsics on CPU), butprovides a reasonable performance (Section 4). The OpenCL code processes 40 framesper second (fps) for accurate object detection (Section 5), so it can be used for appli-cations that require real-time object detection (33fps). Notice that the performance ofour OpenCL implementation is superior or similar to recent works using much morecapable discrete GPUs [Beleznai et al. 2011; Zhang and Nevatia 2008].
We also show that mapping each kernel to the device (CPU or GPU) where it exe-cutes more efficiently and overlapping the computation of the kernels is the best ap-proach. Our results show that with these heterogeneous platforms it is possible tofind mappings that, while executing relatively faster, are less energy efficient (this isdiscussed in Section 5). In addition, it is possible to gain better energy efficiency bysacrificing a small amount of accuracy algorithmically. For our application, we can re-duce 20% of the energy consumed at the cost of an increase of only 1% miss-rate onimage detection (Section 5.3).
Note that manufacturers do not know how to design hardware and software of futureportable devices to support new interfaces (e.g. for human interaction). For instance,specialized hardware accelerators and optimized vision libraries are considered. Weshow that using a unified programming paradigm (e.g. OpenCL), vision applicationscan deliver the required performance (for a typical number of frames per seconds) and
ACM Transactions on Architecture and Code Optimization, Vol. V, No. N, Article A, Publication date: January YYYY.
A:3
energy efficiency on heterogeneous on-chip architectures. To the best of our knowl-edge, the literature only considers large discrete GPUs with very different trade-offsin performance and energy efficiency for these applications.
The rest of this paper is organized as follows. Section 2 describes our application andexperimental setup briefly. Section 3 evaluates and analyzes different optimizationsfor our kernels using OpenCL for the CPU and the GPU. Next, Section 4 compares theperformance and programming effort of the OpenCL paradigm to others for the CPU.After that, Section 5 evaluates the performance and energy consumption of differentkernels on either the CPU or GPU. It also optimizes the full application’s performanceand energy consumption using different mapping methods. Finally, Section 6 reviewssome related work and Section 7 concludes the paper.
2. ENVIRONMENTAL SETUP2.1. ViVidWe focus our study on an object (e.g., face) detection algorithm [Dikmen et al. 2012]for finding objects with a specific shape or appearance in unconstrained visual input.This object detector is analogous to most practical approaches [Jones and Viola 2003;Felzenszwalb et al. 2010] to this problem, which follow a common work-flow called“sliding window object detection”. This process involves describing the visual infor-mation inside small rectangular regions of the image or video frame hypothesized tocontain the object, and applying a decision function that yields a binary output indi-cating the presence or absence of the object in each of such rectangles. Sliding windowdetection is the most established approach for the unconstrained object detection prob-lem. Other popular methods include generalized voting frameworks [Maji and Malik2009] or contour matching [Ma and Latecki 2011]. In all cases, object detection is a verycomputationally demanding application because image information needs to be eval-uated densely over all the potential locations which may contain the object. ViVid’ssliding window approach breaks up the problem into two distinct parts: 1) describingthe image information, and 2) classifying it. The image information is described bycorrelating the gray-scale image with numerous 3×3 patterns and summarizing thesecorrelations in terms of spatially local histograms. The classification is achieved byprocessing these histograms through linear support vector machines [Burges 1998].
Other than object detection, there are numerous applications of computer vision onmobile devices including video stabilization, panorama stitching, gesture recognitionetc. However, the data description followed by a data association work-flow is a com-mon pattern. Typically, the data description part touches every pixel at least onceand builds a summarization of structures of interest (e.g. colors, gradients, textures).The data association part measures the distance between the data summaries againststored exemplars. In classification applications, these can be templates for objects,and in segmentation applications these are usually cluster centers. The computationalstages in a mobile computer vision application may be computationally balanced orparticular stages may give rise to performance bottlenecks. In our selected object de-tection algorithm, the data description and data association steps are well balanced interms of their computational load. Therefore, we believe it comprises a good case studywith challenges in both stages.
To build our object detector pipeline, we use the ViVid library2. ViVid includes sev-eral atomic functions common to many vision algorithms. We have used ViVid success-fully in event detection applications [Dikmen et al. 2008; Yang et al. 2009].
2http://www.github.com/mertdikmen/vivid
ACM Transactions on Architecture and Code Optimization, Vol. V, No. N, Article A, Publication date: January YYYY.
A:4
For the purposes of this work, we extended ViVid by adding OpenCL equivalentsof several kernels. We use the C++ interface to orchestrate the calls to these OpenCLfunctions or kernels.
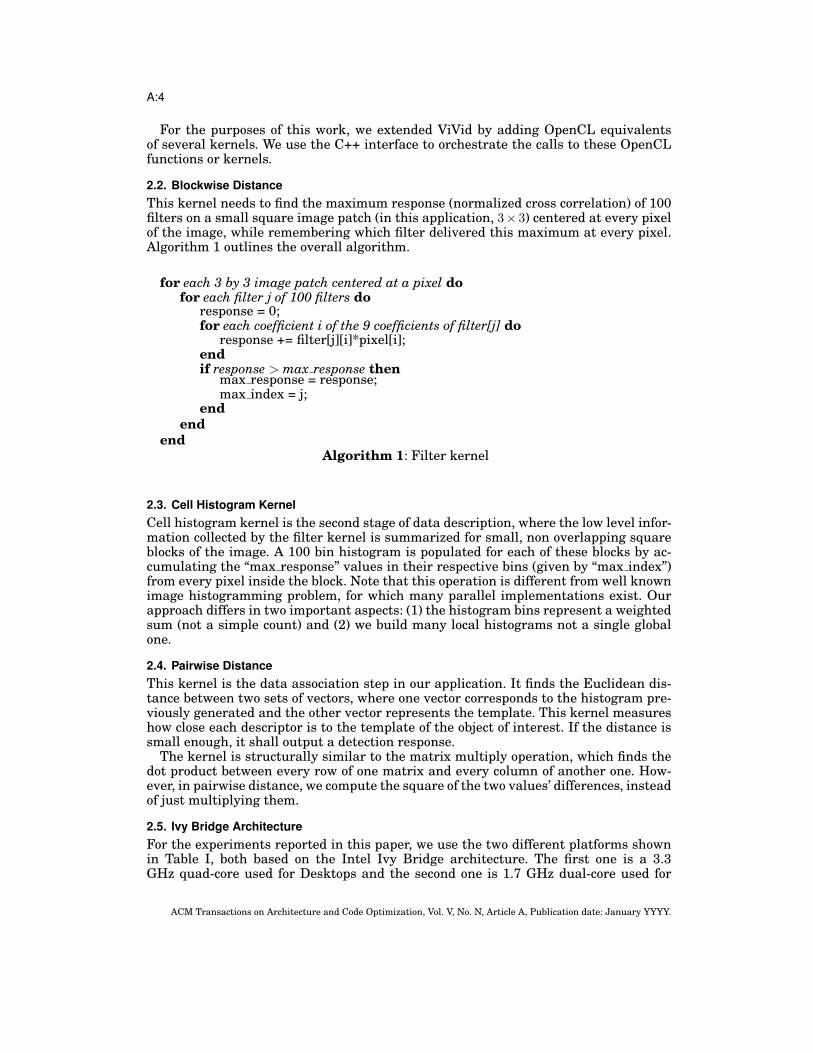
2.2. Blockwise DistanceThis kernel needs to find the maximum response (normalized cross correlation) of 100filters on a small square image patch (in this application, 3× 3) centered at every pixelof the image, while remembering which filter delivered this maximum at every pixel.Algorithm 1 outlines the overall algorithm.
for each 3 by 3 image patch centered at a pixel dofor each filter j of 100 filters do
response = 0;for each coefficient i of the 9 coefficients of filter[j] do
response += filter[j][i]*pixel[i];endif response > max response then
max response = response;max index = j;
endend
endAlgorithm 1: Filter kernel
2.3. Cell Histogram KernelCell histogram kernel is the second stage of data description, where the low level infor-mation collected by the filter kernel is summarized for small, non overlapping squareblocks of the image. A 100 bin histogram is populated for each of these blocks by ac-cumulating the “max response” values in their respective bins (given by “max index”)from every pixel inside the block. Note that this operation is different from well knownimage histogramming problem, for which many parallel implementations exist. Ourapproach differs in two important aspects: (1) the histogram bins represent a weightedsum (not a simple count) and (2) we build many local histograms not a single globalone.
2.4. Pairwise DistanceThis kernel is the data association step in our application. It finds the Euclidean dis-tance between two sets of vectors, where one vector corresponds to the histogram pre-viously generated and the other vector represents the template. This kernel measureshow close each descriptor is to the template of the object of interest. If the distance issmall enough, it shall output a detection response.
The kernel is structurally similar to the matrix multiply operation, which finds thedot product between every row of one matrix and every column of another one. How-ever, in pairwise distance, we compute the square of the two values’ differences, insteadof just multiplying them.
2.5. Ivy Bridge ArchitectureFor the experiments reported in this paper, we use the two different platforms shownin Table I, both based on the Intel Ivy Bridge architecture. The first one is a 3.3GHz quad-core used for Desktops and the second one is 1.7 GHz dual-core used for
ACM Transactions on Architecture and Code Optimization, Vol. V, No. N, Article A, Publication date: January YYYY.
A:5
Ultrabooks. Both platforms have an integrated GPU that can be programmed usingOpenCL3. GPUs exploit Single Instruction Multiple Thread (SIMT) type of parallelismby having an array of Compute Units (CUs). Each CU is assigned a work-group, wherework-items in each group run in lock-step, executing the same instruction on differentdata. GPUs are designed to efficiently exploit data parallelism. Branchy codes mayrun poorly on GPUs, as all the different paths in a control flow need to be serial-ized. Note that the Ivy Bridge’s GPU is simpler than Nvidia [Lindholm et al. 2008]or AMD/ATI [Zhang et al. 2011] GPUs. It has a small number of compute units andsimpler memory hierarchy, for instance.
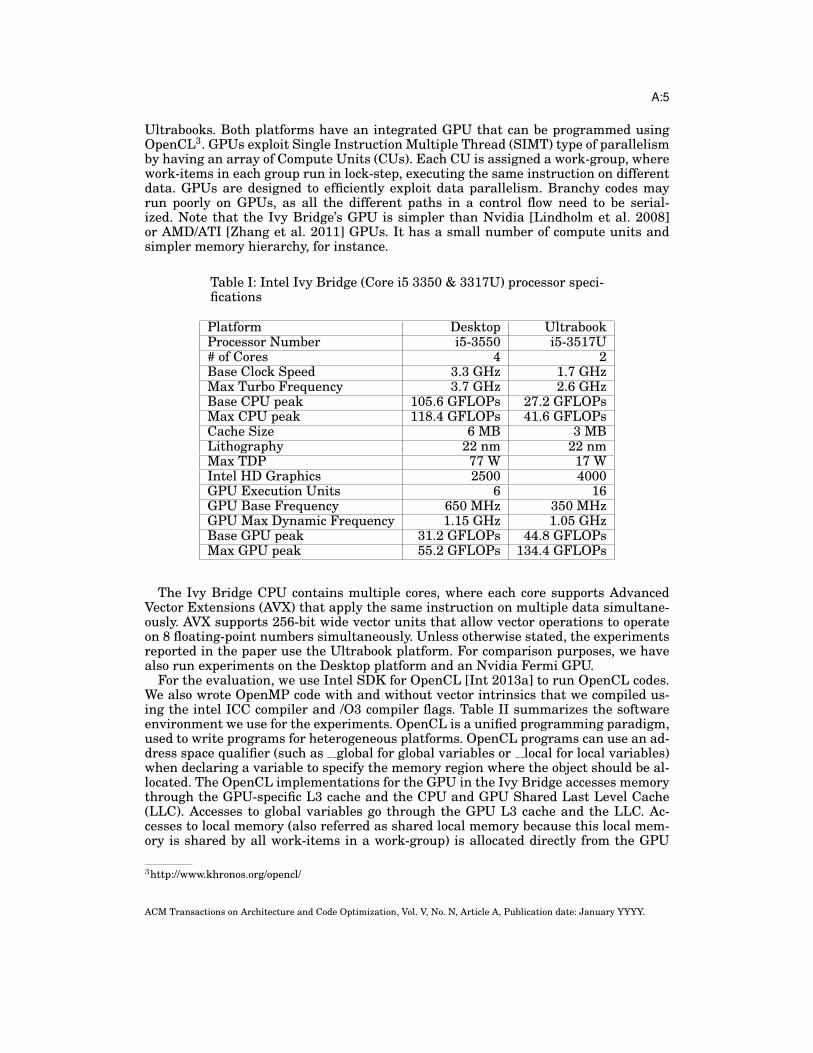
Table I: Intel Ivy Bridge (Core i5 3350 & 3317U) processor speci-fications
Platform Desktop UltrabookProcessor Number i5-3550 i5-3517U# of Cores 4 2Base Clock Speed 3.3 GHz 1.7 GHzMax Turbo Frequency 3.7 GHz 2.6 GHzBase CPU peak 105.6 GFLOPs 27.2 GFLOPsMax CPU peak 118.4 GFLOPs 41.6 GFLOPsCache Size 6 MB 3 MBLithography 22 nm 22 nmMax TDP 77 W 17 WIntel HD Graphics 2500 4000GPU Execution Units 6 16GPU Base Frequency 650 MHz 350 MHzGPU Max Dynamic Frequency 1.15 GHz 1.05 GHzBase GPU peak 31.2 GFLOPs 44.8 GFLOPsMax GPU peak 55.2 GFLOPs 134.4 GFLOPs
The Ivy Bridge CPU contains multiple cores, where each core supports AdvancedVector Extensions (AVX) that apply the same instruction on multiple data simultane-ously. AVX supports 256-bit wide vector units that allow vector operations to operateon 8 floating-point numbers simultaneously. Unless otherwise stated, the experimentsreported in the paper use the Ultrabook platform. For comparison purposes, we havealso run experiments on the Desktop platform and an Nvidia Fermi GPU.
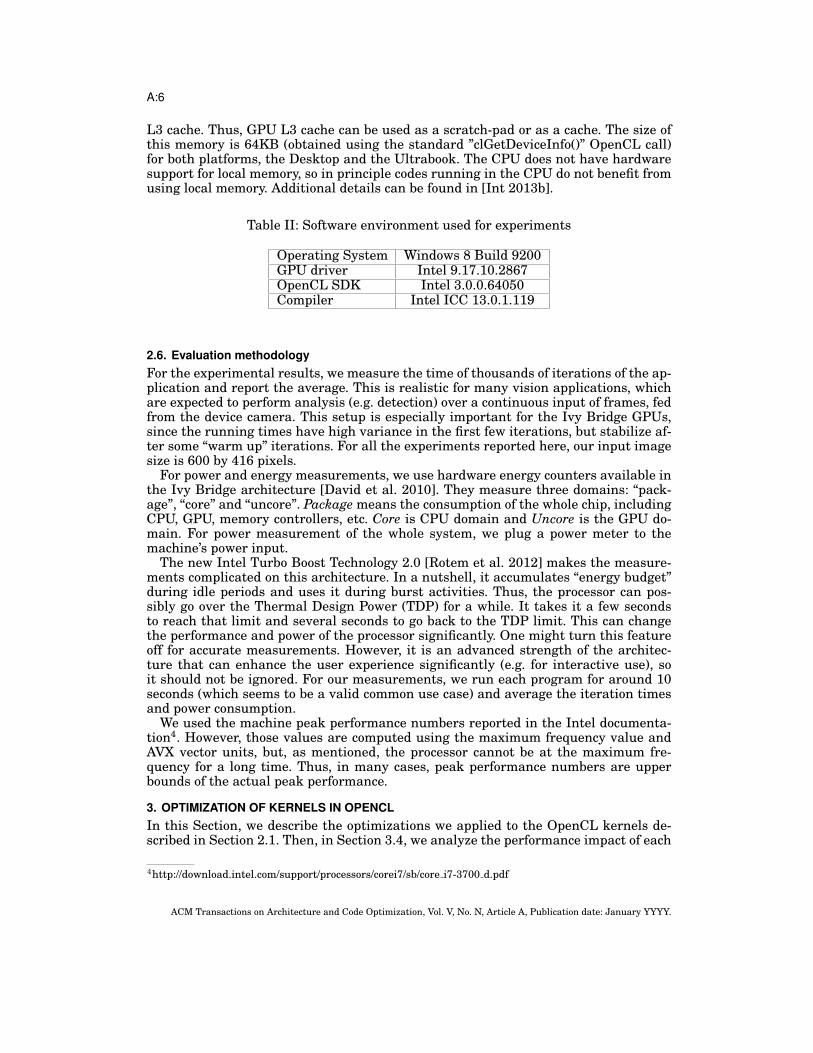
For the evaluation, we use Intel SDK for OpenCL [Int 2013a] to run OpenCL codes.We also wrote OpenMP code with and without vector intrinsics that we compiled us-ing the intel ICC compiler and /O3 compiler flags. Table II summarizes the softwareenvironment we use for the experiments. OpenCL is a unified programming paradigm,used to write programs for heterogeneous platforms. OpenCL programs can use an ad-dress space qualifier (such as global for global variables or local for local variables)when declaring a variable to specify the memory region where the object should be al-located. The OpenCL implementations for the GPU in the Ivy Bridge accesses memorythrough the GPU-specific L3 cache and the CPU and GPU Shared Last Level Cache(LLC). Accesses to global variables go through the GPU L3 cache and the LLC. Ac-cesses to local memory (also referred as shared local memory because this local mem-ory is shared by all work-items in a work-group) is allocated directly from the GPU
3http://www.khronos.org/opencl/
ACM Transactions on Architecture and Code Optimization, Vol. V, No. N, Article A, Publication date: January YYYY.
A:6
L3 cache. Thus, GPU L3 cache can be used as a scratch-pad or as a cache. The size ofthis memory is 64KB (obtained using the standard ”clGetDeviceInfo()” OpenCL call)for both platforms, the Desktop and the Ultrabook. The CPU does not have hardwaresupport for local memory, so in principle codes running in the CPU do not benefit fromusing local memory. Additional details can be found in [Int 2013b].
Table II: Software environment used for experiments
Operating System Windows 8 Build 9200GPU driver Intel 9.17.10.2867OpenCL SDK Intel 3.0.0.64050Compiler Intel ICC 13.0.1.119
2.6. Evaluation methodologyFor the experimental results, we measure the time of thousands of iterations of the ap-plication and report the average. This is realistic for many vision applications, whichare expected to perform analysis (e.g. detection) over a continuous input of frames, fedfrom the device camera. This setup is especially important for the Ivy Bridge GPUs,since the running times have high variance in the first few iterations, but stabilize af-ter some “warm up” iterations. For all the experiments reported here, our input imagesize is 600 by 416 pixels.
For power and energy measurements, we use hardware energy counters available inthe Ivy Bridge architecture [David et al. 2010]. They measure three domains: “pack-age”, “core” and “uncore”. Package means the consumption of the whole chip, includingCPU, GPU, memory controllers, etc. Core is CPU domain and Uncore is the GPU do-main. For power measurement of the whole system, we plug a power meter to themachine’s power input.
The new Intel Turbo Boost Technology 2.0 [Rotem et al. 2012] makes the measure-ments complicated on this architecture. In a nutshell, it accumulates “energy budget”during idle periods and uses it during burst activities. Thus, the processor can pos-sibly go over the Thermal Design Power (TDP) for a while. It takes it a few secondsto reach that limit and several seconds to go back to the TDP limit. This can changethe performance and power of the processor significantly. One might turn this featureoff for accurate measurements. However, it is an advanced strength of the architec-ture that can enhance the user experience significantly (e.g. for interactive use), soit should not be ignored. For our measurements, we run each program for around 10seconds (which seems to be a valid common use case) and average the iteration timesand power consumption.
We used the machine peak performance numbers reported in the Intel documenta-tion4. However, those values are computed using the maximum frequency value andAVX vector units, but, as mentioned, the processor cannot be at the maximum fre-quency for a long time. Thus, in many cases, peak performance numbers are upperbounds of the actual peak performance.
3. OPTIMIZATION OF KERNELS IN OPENCLIn this Section, we describe the optimizations we applied to the OpenCL kernels de-scribed in Section 2.1. Then, in Section 3.4, we analyze the performance impact of each
4http://download.intel.com/support/processors/corei7/sb/core i7-3700 d.pdf
ACM Transactions on Architecture and Code Optimization, Vol. V, No. N, Article A, Publication date: January YYYY.
A:7
optimization. The OpenCL codes run in both the CPU and the GPU, but it is possiblethat an optimization that works well for the GPU would hurt the performance whenrunning on the CPU or vice versa. From now on, we will refer to the Blockwise DistanceKernel as filter, the Cell Histogram Kernel as histogram, and the Pairwise Distancekernel as classifier.
3.1. Filter KernelHere, we describe the optimizations that we applied to the filtering algorithm shownin Figure 1.
3.1.1. Parallelism. We exploit parallelism by dividing the image across multiple work-groups with several work-items. Then, each work-item runs the 100 filters on its imageblock. We use 16 by 16 work-group size following Intel OpenCL SDK’s recommendation(considering also our working set memory size). In addition, we use the Kernel Builder(from the Intel OpenCL SDK) tool’s work-group size auto-tuning capabilities to makesure this is the best size.
3.1.2. Loop Unrolling. We completely unroll the inner loop, which has 9 iterations.
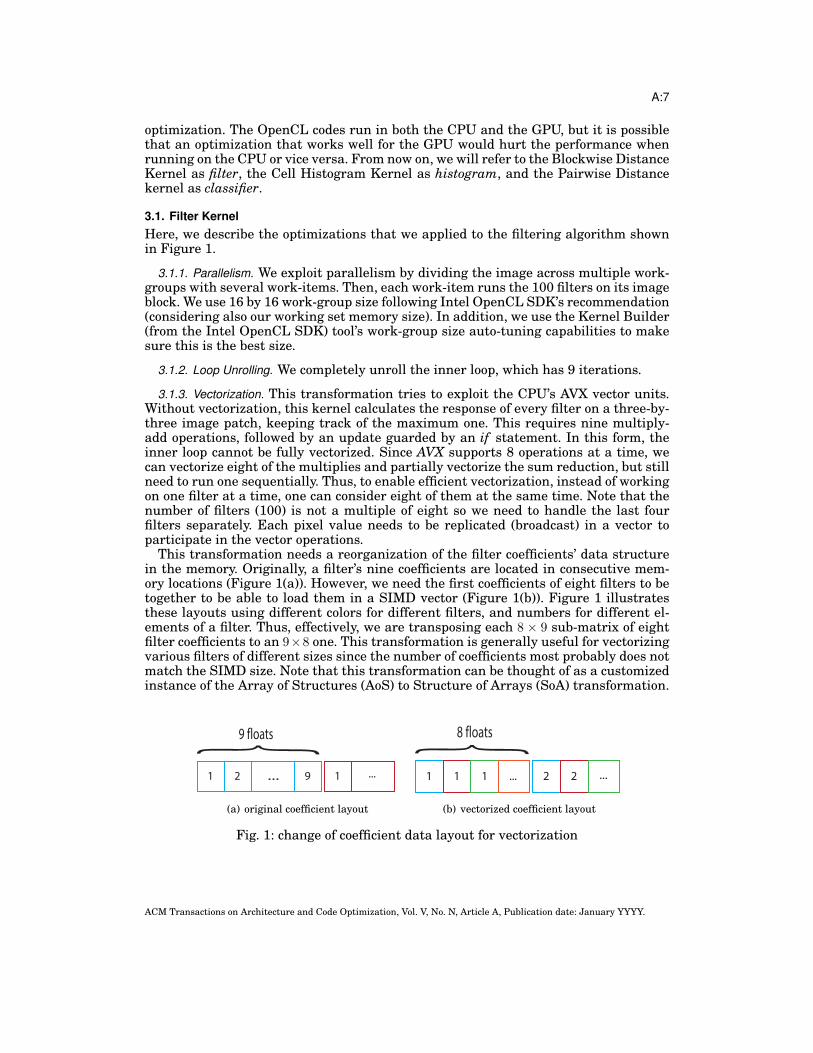
3.1.3. Vectorization. This transformation tries to exploit the CPU’s AVX vector units.Without vectorization, this kernel calculates the response of every filter on a three-by-three image patch, keeping track of the maximum one. This requires nine multiply-add operations, followed by an update guarded by an if statement. In this form, theinner loop cannot be fully vectorized. Since AVX supports 8 operations at a time, wecan vectorize eight of the multiplies and partially vectorize the sum reduction, but stillneed to run one sequentially. Thus, to enable efficient vectorization, instead of workingon one filter at a time, one can consider eight of them at the same time. Note that thenumber of filters (100) is not a multiple of eight so we need to handle the last fourfilters separately. Each pixel value needs to be replicated (broadcast) in a vector toparticipate in the vector operations.
This transformation needs a reorganization of the filter coefficients’ data structurein the memory. Originally, a filter’s nine coefficients are located in consecutive mem-ory locations (Figure 1(a)). However, we need the first coefficients of eight filters to betogether to be able to load them in a SIMD vector (Figure 1(b)). Figure 1 illustratesthese layouts using different colors for different filters, and numbers for different el-ements of a filter. Thus, effectively, we are transposing each 8 × 9 sub-matrix of eightfilter coefficients to an 9×8 one. This transformation is generally useful for vectorizingvarious filters of different sizes since the number of coefficients most probably does notmatch the SIMD size. Note that this transformation can be thought of as a customizedinstance of the Array of Structures (AoS) to Structure of Arrays (SoA) transformation.
1 2 ... 9 1 ...
1 1 1 ... 2 2 ...
#9 floats
#8 floats
(a) original coefficient layout
1 2 ... 9 1 ...
1 1 1 ... 2 2 ...
#9 floats
#8 floats
(b) vectorized coefficient layout
Fig. 1: change of coefficient data layout for vectorization
ACM Transactions on Architecture and Code Optimization, Vol. V, No. N, Article A, Publication date: January YYYY.

A:8
3.1.4. Local Memory. This optimization is specific to the GPU. The filter kernel oper-ates on an image and the 100 filter coefficients. The filter coefficients occupy 3.5KBthat we copy (using all the work-items in parallel) to the local memory. Each work-group also copies the image block it needs. This optimization may hurt performancewhen the code runs on the CPU due to the copying overheads. This is evaluated inSection 3.4.
3.2. Cell Histogram KernelThe parallelism is achieved through a scatter operation. Every work-item in a work-group accumulates a subset of the values inside the image block to their respectivehistogram bins. Note that this is a potential race if two or more work-items in thesame work-group try to increment the same histogram bin. This race can be avoidedif the language and the hardware allow for “atomic add” directives for floating pointnumbers. However, these atomic operations serialize memory accesses and can hurtthe performance significantly.
We allow this race in our OpenCL kernel because our Monte Carlo simulations haveshown that the probability of such a race is low given the distribution of filter indexesin natural image patches. Therefore we do not expect the race conditions to change theshape of the histograms drastically, and we have validated this through experiments.Unlike scientific applications, media programs do not need full accuracy in many cases,and we should exploit this for better performance and energy efficiency.
3.3. Classifier Kernel3.3.1. Parallelization. Parallelizing this code is similar to a tiled matrix multiply, where
a work-group is responsible for a tile of the output matrix (as with the filter, we use16x16 tiles).
3.3.2. Loop Unrolling. We manually unroll the innermost loop, which has 16 iterations.
3.3.3. Vectorization. Vectorizing this code is easy as operations are done in an elementby element fashion, with elements in consecutive memory locations. After accumulat-ing differences in a vector, a sum reduction is required (which we implement as a dotproduct with an identity vector).
3.3.4. Local Memory. All the work-items load the two blocks of elements they want towork on in parallel in the local memory.
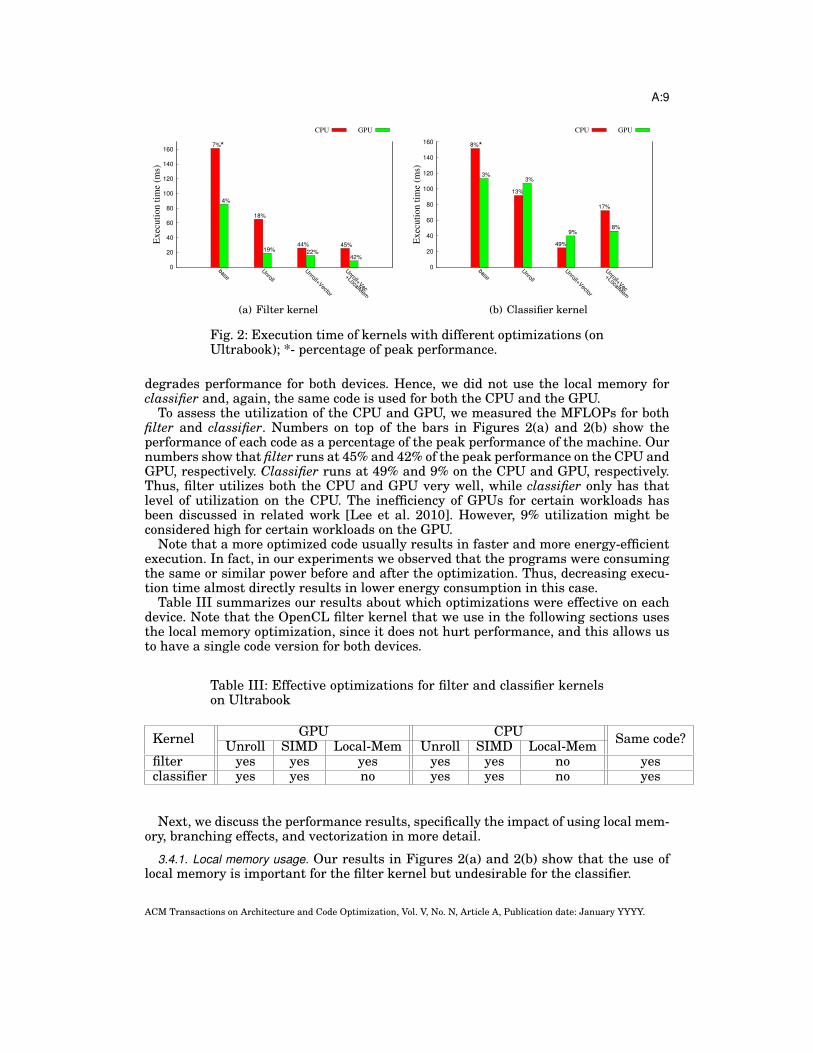
3.4. Performance evaluationIn this Section, we evaluate the performance impact of each of the optimizations. Fig-ure 2(a) shows the execution time for filter when running on the CPU or the GPU.The bars show the cumulative impact of the different transformations. Thus, Un-roll+Vec+LocalMem corresponds to the execution time after all the optimizations havebeen applied. As Figure 2(a) shows, after applying all the above optimizations, this ker-nel runs more than 10 times faster on the GPU than the original non-optimized code.It now takes only 8.46ms. It also made it 6.4 times faster on the CPU (takes 25.5ms forthe same image). Loop unrolling speeds up this kernel for both the CPU and the GPU.Vectorization speeds up filter for the CPU significantly. Also, even though the GPUdoes not have CPU-like vector units, execution times decreases by about 16% (this isdiscussed in Section 3.4.3). We also note that the use of the local memory for the filtercoefficients does not have a significant overhead on the CPU. Thus, the same kernelcode can be used for both architectures.
Figure 2(b) shows the results for the classifier. As the figure shows, both unroll andvectorization improve the performance significantly. However, the use of local memory
ACM Transactions on Architecture and Code Optimization, Vol. V, No. N, Article A, Publication date: January YYYY.
A:9
0
20
40
60
80
100
120
140
160
base
Unro
ll
Unro
ll+Vecto
r
Unro
ll+Vec
+Loca
lMem
Exe
cutio
n tim
e (m
s)
CPU
7%
18%
44% 45%
GPU
4%
19%22%
42%
*
(a) Filter kernel
0
20
40
60
80
100
120
140
160
base
Unro
ll
Unro
ll+Vecto
r
Unro
ll+Vec
+Loca
lMem
Exe
cutio
n tim
e (m
s)
CPU
8%
13%
49%
17%
3%3%
9%8%
GPU
*
(b) Classifier kernel
Fig. 2: Execution time of kernels with different optimizations (onUltrabook); *- percentage of peak performance.
degrades performance for both devices. Hence, we did not use the local memory forclassifier and, again, the same code is used for both the CPU and the GPU.
To assess the utilization of the CPU and GPU, we measured the MFLOPs for bothfilter and classifier. Numbers on top of the bars in Figures 2(a) and 2(b) show theperformance of each code as a percentage of the peak performance of the machine. Ournumbers show that filter runs at 45% and 42% of the peak performance on the CPU andGPU, respectively. Classifier runs at 49% and 9% on the CPU and GPU, respectively.Thus, filter utilizes both the CPU and GPU very well, while classifier only has thatlevel of utilization on the CPU. The inefficiency of GPUs for certain workloads hasbeen discussed in related work [Lee et al. 2010]. However, 9% utilization might beconsidered high for certain workloads on the GPU.
Note that a more optimized code usually results in faster and more energy-efficientexecution. In fact, in our experiments we observed that the programs were consumingthe same or similar power before and after the optimization. Thus, decreasing execu-tion time almost directly results in lower energy consumption in this case.
Table III summarizes our results about which optimizations were effective on eachdevice. Note that the OpenCL filter kernel that we use in the following sections usesthe local memory optimization, since it does not hurt performance, and this allows usto have a single code version for both devices.
Table III: Effective optimizations for filter and classifier kernelson Ultrabook
Kernel GPU CPU Same code?Unroll SIMD Local-Mem Unroll SIMD Local-Memfilter yes yes yes yes yes no yesclassifier yes yes no yes yes no yes
Next, we discuss the performance results, specifically the impact of using local mem-ory, branching effects, and vectorization in more detail.
3.4.1. Local memory usage. Our results in Figures 2(a) and 2(b) show that the use oflocal memory is important for the filter kernel but undesirable for the classifier.
ACM Transactions on Architecture and Code Optimization, Vol. V, No. N, Article A, Publication date: January YYYY.
A:10
Using the local memory is essential for the filter kernel on the GPU. The reasonis that a small set of constant data (the filter coefficients) are needed for the wholeexecution (all the iterations of the outer loop). Relying on the GPU L3 cache is noteffective because the data from the image that is being accessed at the same timemight replace the filter coefficient in the cache.
On the other hand, using the local memory is detrimental for the classifier kernelon the GPU of our Ivy Bridge Ultrabook. However, using the local memory for theclassifier improves the performance on the smaller GPU (HD Graphics 2500 device)of the Desktop platform by 35%, even though the architecture is essentially the same(the Desktop GPU has only 6 CUs, while the Ultrabook GPU has 16 CUs).
To understand the differences in performance (in the absence of performance coun-ters), we used the memory streaming micro-benchmark of uCLbench package [Thomanet al. 2011] that measures the effective bandwidth to memory. This benchmark allo-cates arrays in memory (either local or global), that are accessed by all the work-itemsrepeatedly. Our experimental results show that the effective bandwidth of local mem-ory is less for the Ultrabook GPU than for the Desktop GPU (7.8 GB/s for the Ultrabookvs. 10.3 GB/s for the Desktop) when local arrays are accessed. On the other hand, theeffective bandwidth of global memory is about the same for both machines (7 GB/s forthe Ultrabook vs. 7.4 GB/s for the Desktop) when global arrays are accessed. Noticethat the working set of the classifier is just the data that we are placing on the lo-cal memory and fits in the 64KB of the GPU L3 cache. Thus, since the Desktop hasa higher effective bandwidth when accessing the data in the local memory, the localmemory optimization reduces execution time. However, in the Ultrabook the band-width is similar and the use of local memory introduces some copying overheads.
Using local memory for the code running on the CPU introduces some extra copyingoverhead. While this overhead is not visible for filter because of the small size of thefilter coefficients data structure, it adds a significant overhead to the classifier kernel,due to the larger size of the data structure allocated in local memory.
3.4.2. Loop Unrolling and Branch Overhead. Unrolling results in a significant perfor-mance improvement in both kernels, classifier and filter, for both the CPU and GPU.In the CPU unrolling decreases loop overhead and increases Instruction Level Paral-lelism. In the GPU, unrolling reduces the number of branches.
Branches on the GPU can have a significant impact on performance, specially in thecase of divergent branches where work-items (threads) of a CU take different paths,and each branch path has to be serialized. On the other side, non-divergent branches,where all the work-items follow the same path, are usually fast.
To assess the impact of non-divergent branches on the Ivy Bridge integrated GPU,we modified the filter kernel, and replaced the “if” condition that finds the maximumfilter response with additions that sum the filter responses (notice that this branch,although data dependent, is mostly non-divergent, as work-items execute on neighbor-ing pixels that tend to be similar and hence the maximum response filter is mostlythe same for all the work-items). This change made this code run 13% faster on theintegrated GPU. We also ran both codes (with and without the “if” statements) on theFermi Nvidia GPU and found that the code without the branches had only 3% im-provement. In addition, we used the “branch overhead” benchmark of uCLbench pack-age [Thoman et al. 2011] to assess the difference in performance between divergentand non-divergent branches. In this benchmark, different cases of branch divergenceare compared. For example, a branch might be taken by all the work-items, a subset ofthem or only one. The experimental results show that the Ivy Bridge’s integrated GPUis performing much better for non-divergent branches, as benchmarks can be up to 10times slower on the Ivy Bridge’s integrated GPU when branches are divergent.
ACM Transactions on Architecture and Code Optimization, Vol. V, No. N, Article A, Publication date: January YYYY.

A:11
Overall, our experiments show that non-divergent branches have a higher effecton the Ivy Bridge GPU than on a Fermi GPU. Thus, loop unrolling (that removesnon-divergent branches) is an important optimization for this platform. Other non-divergent branches, such as the “if” associated with the max operator cannot be re-moved with loop unrolling, and would benefit from a better hardware support for non-divergent branches.
3.4.3. Vectorization. Vectorization speeds up both the codes for the CPU, as it makesit easier for the compiler to generate code using the AVX vector extensions in the IvyBridge. When running on the GPU, classifier is about 2.8 times faster with vectoriza-tion, despite the fact that vector units need to be emulated on the GPU, which mighthave some overheads. One reason is that the vector code has more unrolling on theGPU implicitly. Thus, to assess the effect of further unrolling, we unrolled the non-vectorized code’s outer loop as much as it is beneficial (and “jam” it into the inner loop,which is already unrolled). This code runs faster, but still 1.8 times slower than theSIMD version. The other reason for the difference in performance is found by lookingat the code generated by the compiler for both versions (with and without SIMD). Forthe code with SIMD, the compiler generates different memory load instructions withbetter alignment, which is important for performance.
As mentioned, filter kernel runs only slightly (13%) faster on the GPU when vector-ization is applied.
4. COMPARISON WITH OTHER PROGRAMMING PARADIGMSIn this section, we assess if OpenCL is a suitable paradigm for the CPU, since it isdesirable to have a single programming paradigm for both types of devices.
For that, we compare the programming effort and execution times of the OpenCLfilter code versus implementations of the same code written with other programmingmodels for the CPU. Filter code is chosen for the comparison because it is a computeintensive kernel, based on a convolution operation used by many computer vision ap-plications.
We run the experiments of this section on the Desktop’s CPU, since it is more power-ful and will reflect the effects better. In addition, the Ultrabook’s CPU does not supportSSE vector instructions. Note that for all the experiments we use 4 byte “float” preci-sion numbers (which are enough for the filter kernel).
4.1. OpenMP with Compiler VectorizationSince OpenMP is well suited to exploit data parallel computation in multicores, wecompare the OpenCL code with an OpenMP implementation. Although one could ex-pect perfect speedups, our results show an overhead of 8% with respect to perfectscaling. This is due to the overhead of spawning and joining threads for every loopinvocation on a different image.
To exploit the machine’s potential, we need to exploit the CPU’s vector units. Thesimplest way is to have the compiler do this task. The Intel compiler that we use (Sec-tion 2.5) can vectorize this code, but needs the “/fp:fast” flag, to enable optimizationsthat can cause minor precision loss in vectorization of reductions. In addition, by look-ing at the assembly code, we realized that it did not generate aligned loads, which wasfixed by using Intel compiler intrinsic function ( assume aligned()).
Furthermore, with the hope that the compiler would generate better code, we gener-ate another code version where we applied, at the source level, the transformation weapplied to vectorize the OpenCL filter kernel (Section 3.1).
ACM Transactions on Architecture and Code Optimization, Vol. V, No. N, Article A, Publication date: January YYYY.
A:12
4.2. OpenMP with Manual VectorizationWe vectorized the code manually using vector intrinsics that map directly to assemblyinstructions. A disadvantage of this approach is that the code is not portable as it istied to a specific machine’s instruction set and a compiler. Furthermore, it is close tothe assembly level and hence, the programming effort including code readability anddebugging will suffer. Nonetheless, if the performance difference can be very high, onemight prefer paying the cost. We wrote three versions: using AVX and SSE, using onlySSE and using only AVX.
4.2.1. AVX+SSE. The Ivy Bridge architecture supports the AVX and SSE instructionsets. AVX instructions can work on eight floating point elements, while SSE ones canonly handle four elements. We use SSE, since AVX does not have an instruction equiv-alent to SSE’s “ mm comigt ss” (that compares two values and returns a 1 or a 0 de-pending on which one is larger), which simplifies the coding. Thus, we use AVX formultiply and add operations and SSE for conditional comparisons. Note that mixingAVX and SSE instructions can have significant translation penalties on Ivy Bridge [avx2011]. However, we use “/Qxavx” flag to ask the compiler to generate AVX counterpartswhenever possible. In addition, we use Intel vTune Amplifier to make sure these penal-ties are avoided. Since this kernel needs to find which filter resulted in the maximumresponse value, we compare the max response against each response value. A sam-ple comparison is shown below, where we permute the result vector and compare thelowest index element using the “ mm comigt ss” intrinsic.__m128 p_tmp = _mm_extract_ps(response1 , 0x1);if(_mm_comigt_ss(p_tmp , max_response )) {
max_response = ptmp;best_filter = filter_ind +1;
}
Note that we provide code snippets to be able to compare the complexity of differentmethods. We refer the interested reader to Intel’s documentations to fully understandthe details.
4.2.2. SSE. We implemented an SSE version to evaluate AVX versus SSE and mea-sure the effect on performance of SIMD width.
4.2.3. AVX. We also implemented a version that only uses AVX instructions. The im-plementation compares all the responses in parallel, gathers the sign bits in an integermask and examines each bit separately. If the maximum response needs to be updated,we use a permutation instruction to broadcast the new maximum to the register, re-peat the comparison and update the integer mask. There is a small complication be-cause of “ mm256 permute ps” instruction’s semantics. Since it can only choose fromeach four element half of the register separately, we need to consider each half of theresponses separately and copy it to the other one. Thus, the initialization code for com-paring four elements of responses is shown below:// low 128 half// copy low to high__m256 response1 = _mm256_insertf128_ps(
response ,_mm256_extractf128_ps(response , 0), 1);
__m256 cpm = _mm256_cmp_ps(response , max_response , _CMP_GT_OS );
int r = _mm256_movemask_ps(cpm);
After that, we will have four tests of the mask with possible updates similar to theone below:
ACM Transactions on Architecture and Code Optimization, Vol. V, No. N, Article A, Publication date: January YYYY.
A:13
if(r&(1<<1)) {best_filter = filter_ind +6;int control = 1|(1 < <2)|(1 < <4)|(1 < <6);max_response = _mm256_permute_ps(
response1 , control );r=_mm256_movemask_ps( _mm256_cmp_ps(
max_response , max_response , _CMP_GT_OS ));}
4.3. OpenCV Library CallsOpenCV [Bradski 2000] is an open source library consisting of many low level imageprocessing algorithms, as well as many high level algorithms frequently used in com-puter vision. It is by far the most utilized common code base for vision research and ap-plications. We constructed the object detection algorithm using standard library datastructures and function calls to OpenCV in order to compare what is achievable interms of performance using the standard C++ interface. We link against the standarddistribution of the OpenCV binaries, which is not multithreaded5.
The filter kernel can be constructed simply by 100 calls to the OpenCV 2 dimensionalfiltering function. Between each OpenCV filtering function call, we do a pass over theoutput array to determine if the current filter response value is higher than the maxi-mum value observed and replace the assignments in the output array accordingly. Theclassifier kernel can be simply constructed by taking the norm of the differences forevery pair of rows in the two input matrices. Row isolation, vector differencing andvector norms are all standard library calls in OpenCV. The histogram kernel is notachievable through standard library calls, but the ViVid call can be used on standardOpenCV data types with minimal changes.
Our experimental results show that the OpenCV implementation of the filter kernelruns 15 times slower than the OpenCL version of ViVid running on the CPU of theUltrabook. Notice that our OpenCL code runs in parallel (two cores of the Ultrabook),while the OpenCV code runs sequential. Also, the OpenCV code that we use has hard-coded SSE2 intrinsics (we verified by looking at the library code), while our OpenCLcode uses the AVX vector instructions (when running on the CPU). However, these twopoints still do not justify the big difference in performance. This substantial differencein performance appears because the OpenCV code does not take advantage of local-ity, as we need to re-load the image 100 times. In our OpenCL code, each image pixelis loaded only once, as the 100 filters are applied to each pixel before moving to thenext one. Notice that experimental results for classifier show that the OpenCV code isalso significantly slower than our OpenCL code. The reason is that while the OpenCVlibrary has an efficient matrix multiplication call, what we need is a customized oper-ator (the square of the two value’s differences or Euclidean distance), which needs tobe realized in an inefficient manner (as mentioned above).
While the code using the library calls is very concise and straightforward, the non-perfect adoption of OpenCV library primitives for our algorithm results in performancedegradation. This is because each library call has some overhead, and no optimizationis possible across library primitives. Vision applications can benefit significantly fromspecific low level optimizations based on the expected input and output structures,as well as computational patterns of individual kernels. Thus, current vision librariesare unable to solve the entire parallel programming problem for vision applications, asthe resulting code is not fast enough for production use. However, ease of use has made
5Some OpenCV functions can be made multithreaded by linking against Intel Thread Building Blocks [Rein-ders 2007]
ACM Transactions on Architecture and Code Optimization, Vol. V, No. N, Article A, Publication date: January YYYY.
A:14
these libraries, such as OpenCV, very good candidates for application prototyping anddevelopment.
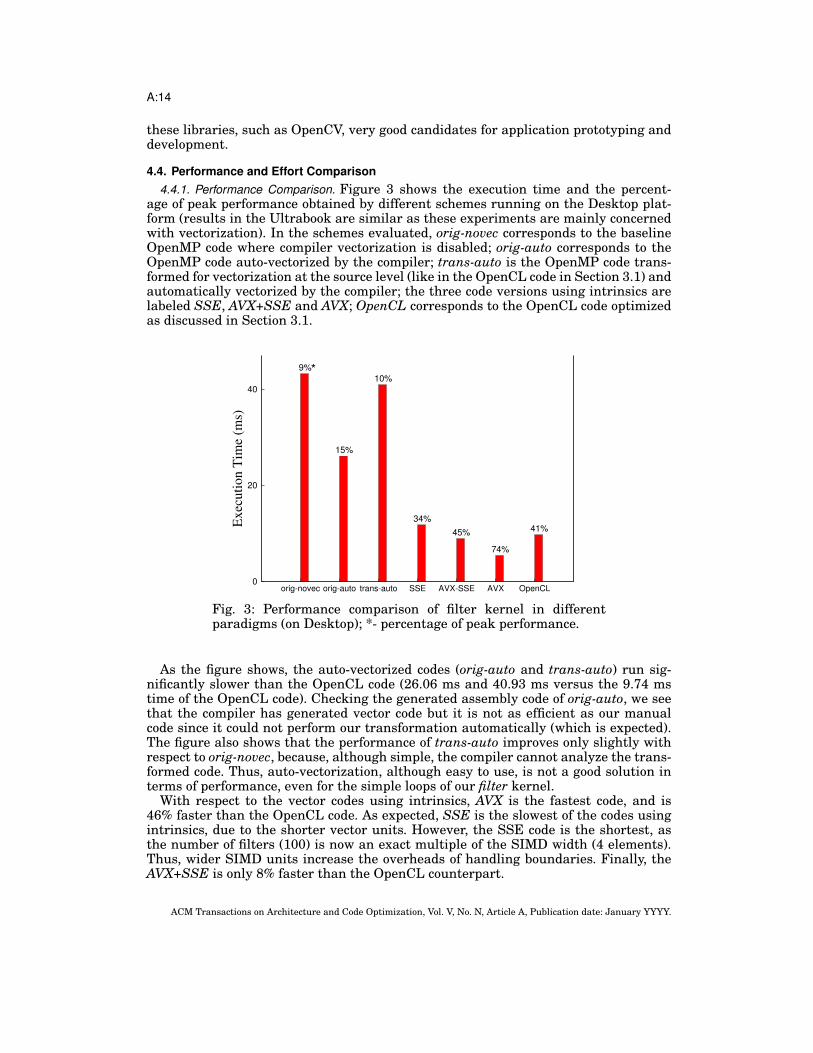
4.4. Performance and Effort Comparison4.4.1. Performance Comparison. Figure 3 shows the execution time and the percent-
age of peak performance obtained by different schemes running on the Desktop plat-form (results in the Ultrabook are similar as these experiments are mainly concernedwith vectorization). In the schemes evaluated, orig-novec corresponds to the baselineOpenMP code where compiler vectorization is disabled; orig-auto corresponds to theOpenMP code auto-vectorized by the compiler; trans-auto is the OpenMP code trans-formed for vectorization at the source level (like in the OpenCL code in Section 3.1) andautomatically vectorized by the compiler; the three code versions using intrinsics arelabeled SSE, AVX+SSE and AVX; OpenCL corresponds to the OpenCL code optimizedas discussed in Section 3.1.
0
20
40
orig-novec orig-auto trans-auto SSE AVX-SSE AVX OpenCL
Exe
cutio
n T
ime
(ms)
9%
15%
10%
34%
45%
74%
41%
*
Fig. 3: Performance comparison of filter kernel in differentparadigms (on Desktop); *- percentage of peak performance.
As the figure shows, the auto-vectorized codes (orig-auto and trans-auto) run sig-nificantly slower than the OpenCL code (26.06 ms and 40.93 ms versus the 9.74 mstime of the OpenCL code). Checking the generated assembly code of orig-auto, we seethat the compiler has generated vector code but it is not as efficient as our manualcode since it could not perform our transformation automatically (which is expected).The figure also shows that the performance of trans-auto improves only slightly withrespect to orig-novec, because, although simple, the compiler cannot analyze the trans-formed code. Thus, auto-vectorization, although easy to use, is not a good solution interms of performance, even for the simple loops of our filter kernel.
With respect to the vector codes using intrinsics, AVX is the fastest code, and is46% faster than the OpenCL code. As expected, SSE is the slowest of the codes usingintrinsics, due to the shorter vector units. However, the SSE code is the shortest, asthe number of filters (100) is now an exact multiple of the SIMD width (4 elements).Thus, wider SIMD units increase the overheads of handling boundaries. Finally, theAVX+SSE is only 8% faster than the OpenCL counterpart.
ACM Transactions on Architecture and Code Optimization, Vol. V, No. N, Article A, Publication date: January YYYY.
A:15
For comparison purposes, we implemented, using AVX, a filtering kernel withoutbranches and comparisons (that does not find the index of the best filter). It uses asmall “reduction tree” method to perform fewer SIMD max operation to find the max-imum from the eight responses. Our AVX version is just 5% slower than this one,showing that we have alleviated most of the comparison overheads by comparing inparallel and pushing other instructions inside the “if” statements.
4.4.2. Programming Effort Comparison. To quantify the programming effort of eachparadigm, we use the Halstead’s productivity metrics [Halstead 1977; Weyuker 1988;Gonzalez and Fraguela 2010]. In Halstead’s Elements Software Science [Halstead1977], a program is considered as a string of tokens, which can either be operandsor operators. The operands are either constants or variables, while the operators aresymbols or their combination that can affect the value or ordering of operands. Let η1be the number of unique operators, η2 the number of unique operands, N1 the numberof occurrences of operators, and N2 the number of occurrences of operands. Derivedmetrics that can be used to quantify programming complexity are defined as follows:
Program Volume: V = (N1 +N2) log2(η1 + η2)
Program Difficulty: D = 12η1N2
η2
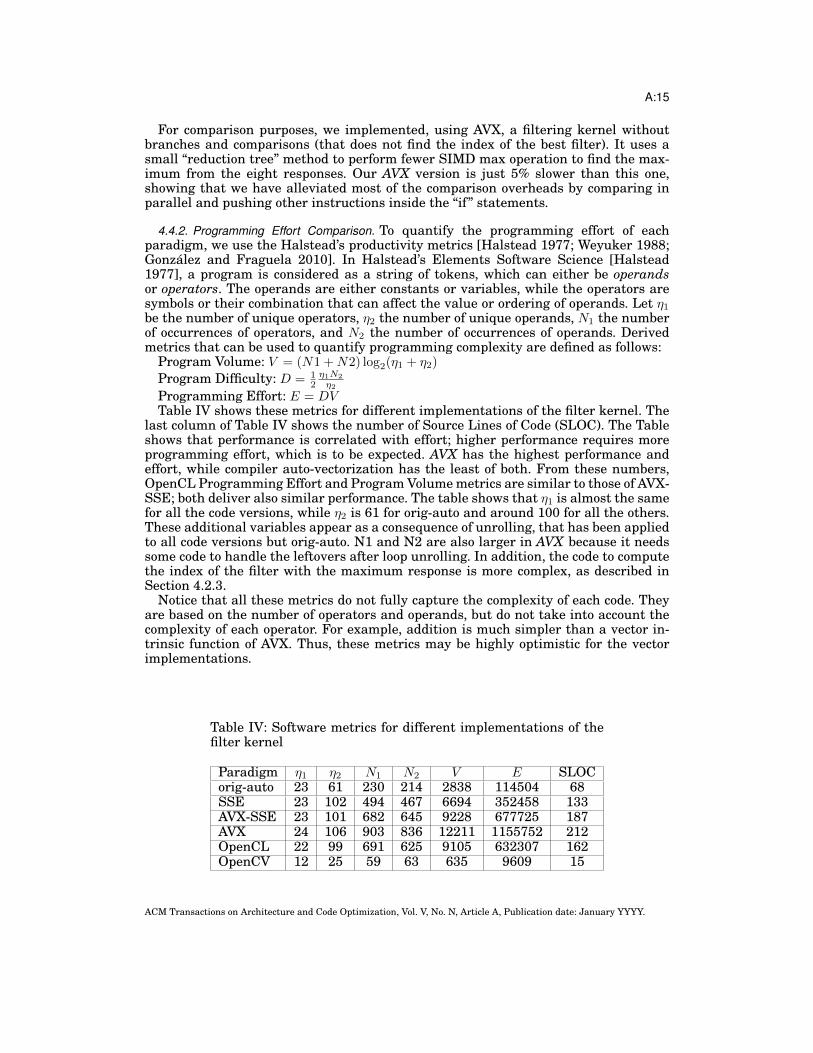
Programming Effort: E = DVTable IV shows these metrics for different implementations of the filter kernel. The
last column of Table IV shows the number of Source Lines of Code (SLOC). The Tableshows that performance is correlated with effort; higher performance requires moreprogramming effort, which is to be expected. AVX has the highest performance andeffort, while compiler auto-vectorization has the least of both. From these numbers,OpenCL Programming Effort and Program Volume metrics are similar to those of AVX-SSE; both deliver also similar performance. The table shows that η1 is almost the samefor all the code versions, while η2 is 61 for orig-auto and around 100 for all the others.These additional variables appear as a consequence of unrolling, that has been appliedto all code versions but orig-auto. N1 and N2 are also larger in AVX because it needssome code to handle the leftovers after loop unrolling. In addition, the code to computethe index of the filter with the maximum response is more complex, as described inSection 4.2.3.
Notice that all these metrics do not fully capture the complexity of each code. Theyare based on the number of operators and operands, but do not take into account thecomplexity of each operator. For example, addition is much simpler than a vector in-trinsic function of AVX. Thus, these metrics may be highly optimistic for the vectorimplementations.
Table IV: Software metrics for different implementations of thefilter kernel
Paradigm η1 η2 N1 N2 V E SLOCorig-auto 23 61 230 214 2838 114504 68SSE 23 102 494 467 6694 352458 133AVX-SSE 23 101 682 645 9228 677725 187AVX 24 106 903 836 12211 1155752 212OpenCL 22 99 691 625 9105 632307 162OpenCV 12 25 59 63 635 9609 15
ACM Transactions on Architecture and Code Optimization, Vol. V, No. N, Article A, Publication date: January YYYY.
A:16
Overall, OpenCL provides a good balance in programming effort and performance.It is much faster than the auto-vectorized versions and it is close to the low level in-trinsics versions. It is 1.8 times slower than the AVX code with “ninja optimizations”but the effort is significantly less (1.8 times less Halstead Effort). Therefore, program-ming in OpenCL is effective for the CPU as well as the GPU, and bringing the GPUon the die did not impose significant programming effort (since the same code runs onthe CPU as well). Thus, OpenCL has the advantage that a single programming modelcan be used to run in both CPU and GPU. It is possible that the code versions thatrun the fastest will be different among platforms, but the programming effort does notincrease significantly, because the different versions need to be tried in both platformsin the optimization and tuning process anyways.
Note that we do not claim OpenCL is performance portable across platforms in gen-eral. We believe that given the data parallel nature of vision algorithms, in many cases,the same baseline algorithm can be written for CPU and GPU in OpenCL. However,tuning transformations need to be evaluated separately for each device. For this study,our target of the OpenCL tuning was the GPU, but the experimental results show thatthe transformations also worked for the CPU, resulting in the same kernel codes.
4.5. Possible Hardware and Software ImprovementsVision and video analytics (and their filtering kernels) are important applications forheterogeneous on-chip architectures. Thus, we list a set of possible improvements tothe hardware and system software that vendors might consider for this class of appli-cations.
The first one is related to the algorithms that the compiler can recognize and vector-ize automatically. We observed that neither the Intel compiler nor the OpenCL com-piler can generate efficient vector code for the max reduction (and finding the indexcorresponding to max) used in the filter kernel. When we examined the assembly code,we found out that the OpenCL compiler generates permutations and comparisons sim-ilar to our AVX+SSE version. However, the compiler should be able to automaticallygenerate more efficient code [Ren et al. 2006; Maleki et al. 2011], following a similarapproach to the one in the AVX code evaluated in Figure 3.
The second one deals with a common operation in this type of kernels. We haveobserved that multiply and add operations are used together extensively. Thus, Fused-Multiply-Add can improve the performance significantly. The “FMA” vector extensionaddresses this point, which is available in some new processors (such as the ones usingIntel Haswell micro-architecture).
Our transformation optimizes filter kernels significantly but they could become evenfaster with more hardware support. Finding the maximum and corresponding indexin a vector is a reduction across the elements of a single SIMD vector, or a horizontalmax operation (in Intel’s terminology). In current SSE and AVX standards, there area few horizontal operations, such as an addition that just reduces two adjacent ele-ments. This could be further extended to perform a full reduction, which will improvemultimedia applications in general [Corbal et al. ; Talla et al. 2003; Bik et al. 2006]. Infact, to estimate how much improvement we can achieve with a reduction instruction,we replaced the instructions to find the maximum response in our AVX kernel withjust a horizontal add instruction. This improved the performance by more than 34%.Thus, more targeted hardware support can lead to significant improvements in futuremachines.
5. APPLICATION PERFORMANCE AND ENERGYThis section evaluates and analyzes the execution time and energy consumption ofthe kernels described in Section 2.1 and optimized in OpenCL in Section 3. We also
ACM Transactions on Architecture and Code Optimization, Vol. V, No. N, Article A, Publication date: January YYYY.
A:17
0
10
20
30
40
50
filter histogram classifier full-app
Exe
cutio
n tim
e (m
s)
CPU
45%
2%
49%
45%
42%
1%
9%
15%
GPU
*
(a) Execution time
0
5
10
15
20
filter-C filter-G hist-C hist-G class-C class-G full-C full-G idle
Pow
er (W
)
Package CPU GPU
(b) Power consumption
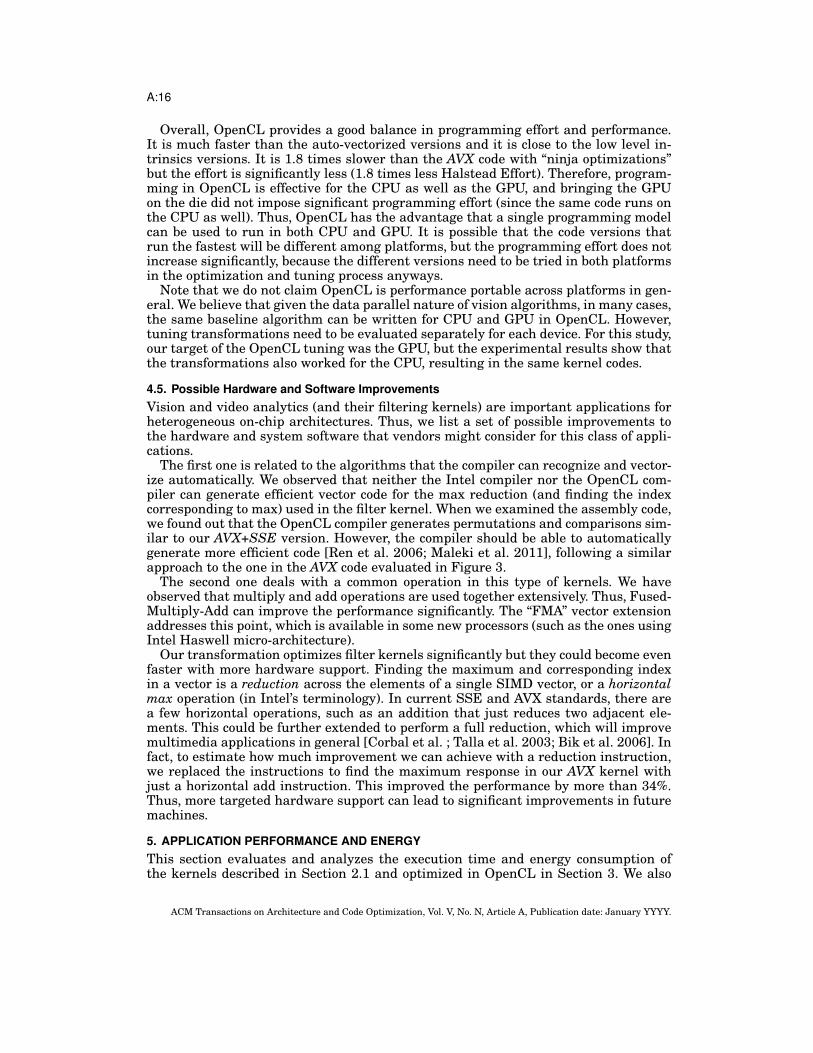
Fig. 4: Execution time and power consumption of kernels (on Ul-trabook); *- percentage of peak performance.
evaluate and analyze different mappings for our application on CPU and GPU forbetter performance and energy efficiency.
Figure 4(a) shows the execution time of each kernel on the CPU and GPU. full-appshows the results for all the three kernels running on either the CPU or the GPU.The GPU is about 3 times faster for the filter kernel and 2.3 times faster for the his-togram one. However, it is more than 1.3 times slower for the classifier kernel. Notethat classifier performs less floating point operations per data element (see relatedwork for analysis of data-parallel kernels on CPU and GPU [Lee et al. 2010]). For thefull application, the GPU is slightly faster (less than 8%) than the CPU.
Figure 4(b) shows the power consumption of the processor for each individual kerneland for the full application running on either the CPU or the GPU. Each setting islabeled after the running code and the architecture it is using. For instance, “class-G” means that classifier kernel is running on the GPU. Each setting has three powerconsumption bars. We also show power numbers in idle state. The red (left) bar is thepower consumption of the whole processor chip (CPU, GPU, memory controller, etc.),while the green (middle) bar is just the CPU’s consumption and the blue (right) one isjust the GPU’s. Note that we report the average power consumption over a period ofexecution (see Section 2.6).
We mostly consider the power consumption of the whole package (the red bar), as itcorresponds to the cost one would pay. However, the power breakdown can give insightsabout some important aspects of the system. For instance, when the code is runningjust on the GPU, the CPU is still consuming considerable power. The reason is that theCPU and the ring interconnect are in the same voltage and frequency domain [Rotemet al. 2012] and the interconnect cannot be idled, since the GPU needs to connect tothe last level cache (LLC). Addressing this issue may lead to significant savings inpower consumption when the application is only using the GPU. The reason is that,for instance, the CPU domain consumes 3W (with probably a notable part contributedby the cores) from the 11.5W total package power when the classifier is running on theGPU. On the other side, it consumes only 0.7W in idle state.
As shown in Figure 4(b), the GPU consumes more power than the CPU in all cases(e.g. comparing left bars of filter-G and filter-C) except classifier, which is not unex-pected since GPU has higher peak performance as well (See Table I). However, GPU’spower consumption varies depending on the workload. For instance, classifier con-sumes around 11.6W, while the filter consumes about 18.2W (around 36% difference).This is because the filter keeps the GPU almost fully occupied while the classifier does
ACM Transactions on Architecture and Code Optimization, Vol. V, No. N, Article A, Publication date: January YYYY.
A:18
0
100
200
300
400
500
600
700
filter-C filter-G hist-C hist-G class-C class-G full-C full-G
Ene
rgy
(mJ)
Package CPU GPU
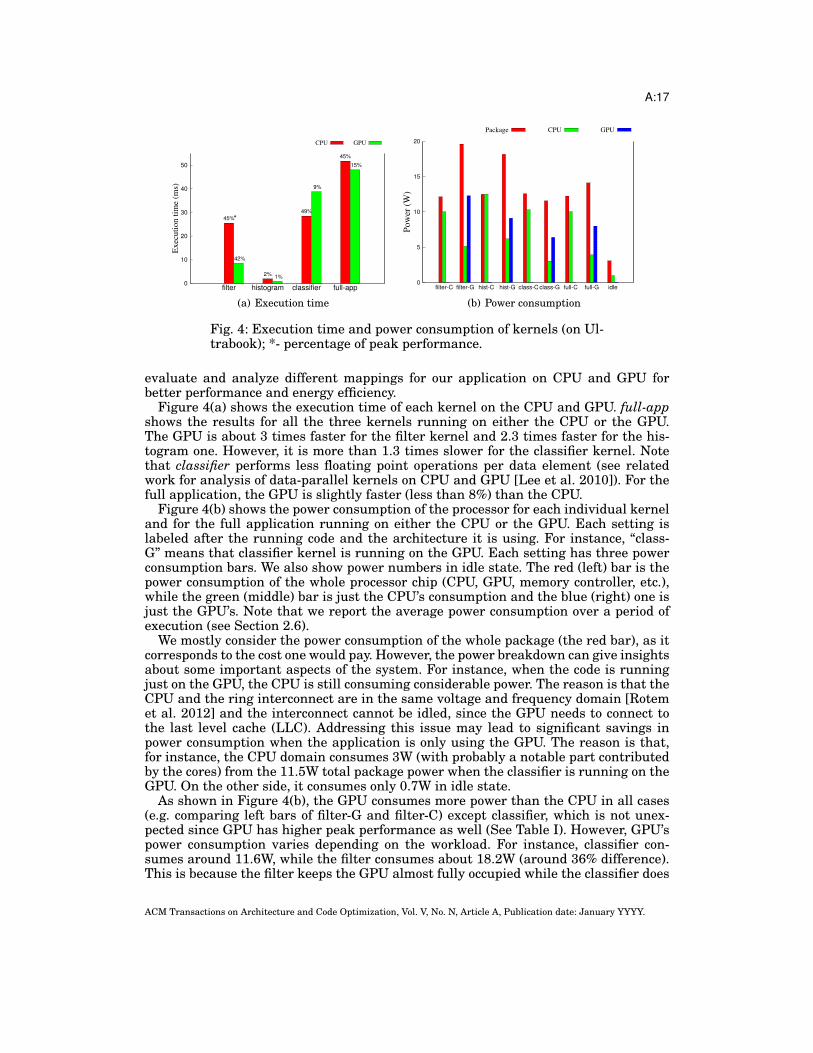
Fig. 5: Energy consumption (on Ultrabook)
not have full utilization. On the other hand, the CPU’s consumption has less than 0.5Wvariation across the board, even with its complex architecture and power managementschemes. The reason is that all the kernels can keep it occupied, partly because of itsadapting architecture and partly because it is not very powerful.
So far, we have seen that the GPU is faster but it consumes more power. Since onefactor is in favor of energy but the other is against it, we need to look at the energymetric. Figure 5 compares the energy consumption of the different kernels and fullapplication on the CPU and the GPU. For the full application, the package consumesslightly more energy when running on the GPU (less than 7%), while it varies acrossdifferent kernels. If we look at the package consumption, the GPU consumes 36% lessenergy for histogram kernel and 46% less for the filter kernel. However, it consumes20% more energy than the CPU for the classifier kernel. This, as pointed by others,contradicts the general belief that the GPU architecture is more energy efficient forevery highly parallel kernel [Lee et al. 2010]. The net energy is in favor of the CPU,since the classifier kernel is time consuming on the GPU.
In a nutshell, running the three kernels in ViVid on the integrated GPU of the IvyBridge Ultrabook is faster but consumes more power and energy. On our Desktop sys-tem, with the same input size, the GPU is about 5 times slower and 3 times less energyefficient than the CPU for full-app, because it is small (so not very powerful in com-putation) but keeps the resources of the system busy. Thus, the balance of the systemneeds to be considered for portable devices that run vision applications. Comparingacross platforms (but same processor type), the CPU of the desktop machine is about2.5 times faster than the Ultrabook one for the full-app, but 19% less energy efficient.
5.1. Mapping StrategiesAfter understanding the different trade-offs between GPU and CPU for each kernel,the natural question is how to utilize the heterogeneous system for an application toachieve better performance and energy efficiency. Other than just running the codeonly on the CPU or the GPU, one could also try to map different kernels to the devicewhere they run more efficiently. Figures 6(a), 6(b), and 6(c) show the execution time,
ACM Transactions on Architecture and Code Optimization, Vol. V, No. N, Article A, Publication date: January YYYY.
A:19
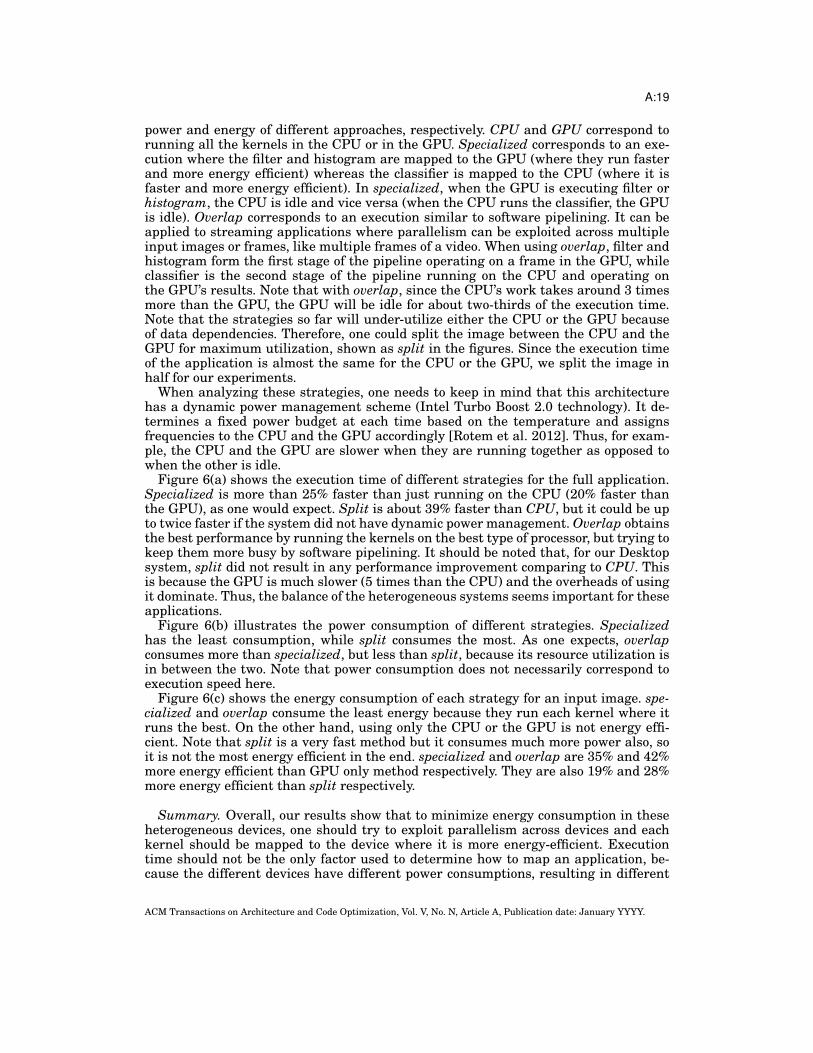
power and energy of different approaches, respectively. CPU and GPU correspond torunning all the kernels in the CPU or in the GPU. Specialized corresponds to an exe-cution where the filter and histogram are mapped to the GPU (where they run fasterand more energy efficient) whereas the classifier is mapped to the CPU (where it isfaster and more energy efficient). In specialized, when the GPU is executing filter orhistogram, the CPU is idle and vice versa (when the CPU runs the classifier, the GPUis idle). Overlap corresponds to an execution similar to software pipelining. It can beapplied to streaming applications where parallelism can be exploited across multipleinput images or frames, like multiple frames of a video. When using overlap, filter andhistogram form the first stage of the pipeline operating on a frame in the GPU, whileclassifier is the second stage of the pipeline running on the CPU and operating onthe GPU’s results. Note that with overlap, since the CPU’s work takes around 3 timesmore than the GPU, the GPU will be idle for about two-thirds of the execution time.Note that the strategies so far will under-utilize either the CPU or the GPU becauseof data dependencies. Therefore, one could split the image between the CPU and theGPU for maximum utilization, shown as split in the figures. Since the execution timeof the application is almost the same for the CPU or the GPU, we split the image inhalf for our experiments.
When analyzing these strategies, one needs to keep in mind that this architecturehas a dynamic power management scheme (Intel Turbo Boost 2.0 technology). It de-termines a fixed power budget at each time based on the temperature and assignsfrequencies to the CPU and the GPU accordingly [Rotem et al. 2012]. Thus, for exam-ple, the CPU and the GPU are slower when they are running together as opposed towhen the other is idle.
Figure 6(a) shows the execution time of different strategies for the full application.Specialized is more than 25% faster than just running on the CPU (20% faster thanthe GPU), as one would expect. Split is about 39% faster than CPU, but it could be upto twice faster if the system did not have dynamic power management. Overlap obtainsthe best performance by running the kernels on the best type of processor, but trying tokeep them more busy by software pipelining. It should be noted that, for our Desktopsystem, split did not result in any performance improvement comparing to CPU. Thisis because the GPU is much slower (5 times than the CPU) and the overheads of usingit dominate. Thus, the balance of the heterogeneous systems seems important for theseapplications.
Figure 6(b) illustrates the power consumption of different strategies. Specializedhas the least consumption, while split consumes the most. As one expects, overlapconsumes more than specialized, but less than split, because its resource utilization isin between the two. Note that power consumption does not necessarily correspond toexecution speed here.
Figure 6(c) shows the energy consumption of each strategy for an input image. spe-cialized and overlap consume the least energy because they run each kernel where itruns the best. On the other hand, using only the CPU or the GPU is not energy effi-cient. Note that split is a very fast method but it consumes much more power also, soit is not the most energy efficient in the end. specialized and overlap are 35% and 42%more energy efficient than GPU only method respectively. They are also 19% and 28%more energy efficient than split respectively.
Summary. Overall, our results show that to minimize energy consumption in theseheterogeneous devices, one should try to exploit parallelism across devices and eachkernel should be mapped to the device where it is more energy-efficient. Executiontime should not be the only factor used to determine how to map an application, be-cause the different devices have different power consumptions, resulting in different
ACM Transactions on Architecture and Code Optimization, Vol. V, No. N, Article A, Publication date: January YYYY.

A:20
0
10
20
30
40
50
CPU GPU specialized split overlap
Exe
cutio
n tim
e (m
s)
11%
12%
14%
17%
22%
*
(a) Execution time
0
5
10
15
20
CPU GPU specialized split overlap
Pow
er (W
)
(b) Power consumption
0
100
200
300
400
500
600
700
CPU GPU specialized split overlap
Ene
rgy
(J)
(c) Energy consumption
Fig. 6: Running full application on CPU or GPU or utilizing bothusing different approaches; *- percentage of peak performance.
overall energy (e.g. specialized is slower than split, but more energy-efficient). Thus,our overlap approach where parallelism is achieved through software pipelining seemsthe best strategy for these type of on-chip heterogeneous architectures. However, a cou-ple of points need to be considered when choosing this strategy. First, it is desirable tohave pipeline stages with similar execution times, as the execution time of this schemeis determined by the execution time of the longest kernel. Note that our application’sstages do not have similar execution times but this strategy is still the best. Second,this approach requires to have more on-the-fly data. In our case, since the pipeline onlyhas two stages we have two frames on-the-fly (as opposed to one). In addition, sincekernels execute in different devices, the frames need to move from device to device (incontrast with the split mechanism, where the data always stay in the same device).Since most of the vision applications (including ours) are very compute-intensive, datamovement usually is amortized easily by the numerous computations required perdata element.
Our performance is superior or similar to recent works using much more capablediscrete GPUs [Prisacariu and Reid 2009; Beleznai et al. 2011; Zhang and Nevatia2008]. However, notice that real time vision applications need to run at a certain num-ber of frames per second. For instance, we can run at around 40 frames per second(fps) with overlap and 31 fps with split, while 10 fps might be enough for many objectdetection purposes. Applications requiring real-time object detection (33 fps) can usethe OpenCL code on this architecture. The extra available computation power can beused for more analysis or for other applications (e.g. if vision is only the interface for
ACM Transactions on Architecture and Code Optimization, Vol. V, No. N, Article A, Publication date: January YYYY.
A:21
some other purpose). Note that when maximum performance is required (e.g. neededfps cannot be reached), one might need to trade energy efficiency for performance (e.g.specialized versus split, when overlap cannot be used).
One might need more compute-power for future applications. Our experiments showthat scaling the number of GPU’s CUs is effective. As noted in Subsection 2.5, theUltrabook’s GPU has 16 CUs, while the Desktop’s GPU has 6 CUs, with similar ar-chitecture and frequencies. For all the kernels (as well as the full application), we seemore than twice speedup on the Ultrabook one, which supports the scalability of thearchitecture for these applications.
5.2. Saving Energy with DVFSWe saw that we can reach a detection rate that is more than enough for many ap-plications. Thus, one might consider Dynamic Voltage Frequency Scaling (DVFS) forsaving energy. However, Ivy Bridge processor’s DVFS does not seem to be effective forthese compute-intensive codes. We applied DVFS to our application and we could onlysave at most 5% of the energy, while sacrificing 9% performance. The reason is thatit makes the runtime so much longer (for compute-intensive codes) that it offsets thepower savings. Thus, running the application for a while and then idling the processorseems to be the best solution for saving energy. In this case, savings will depend onsleep and wakeup latencies of the processor in the specific usage.
However, we expect DVFS support to improve significantly in future devices, asvendors consider it in earlier steps of the processor design. For instance, when NearThreshold Voltage (NTV) processors become available, DVFS will save much more en-ergy [Dreslinski et al. 2010]. This will be very important for energy efficiency of manyvision applications similar to ours.
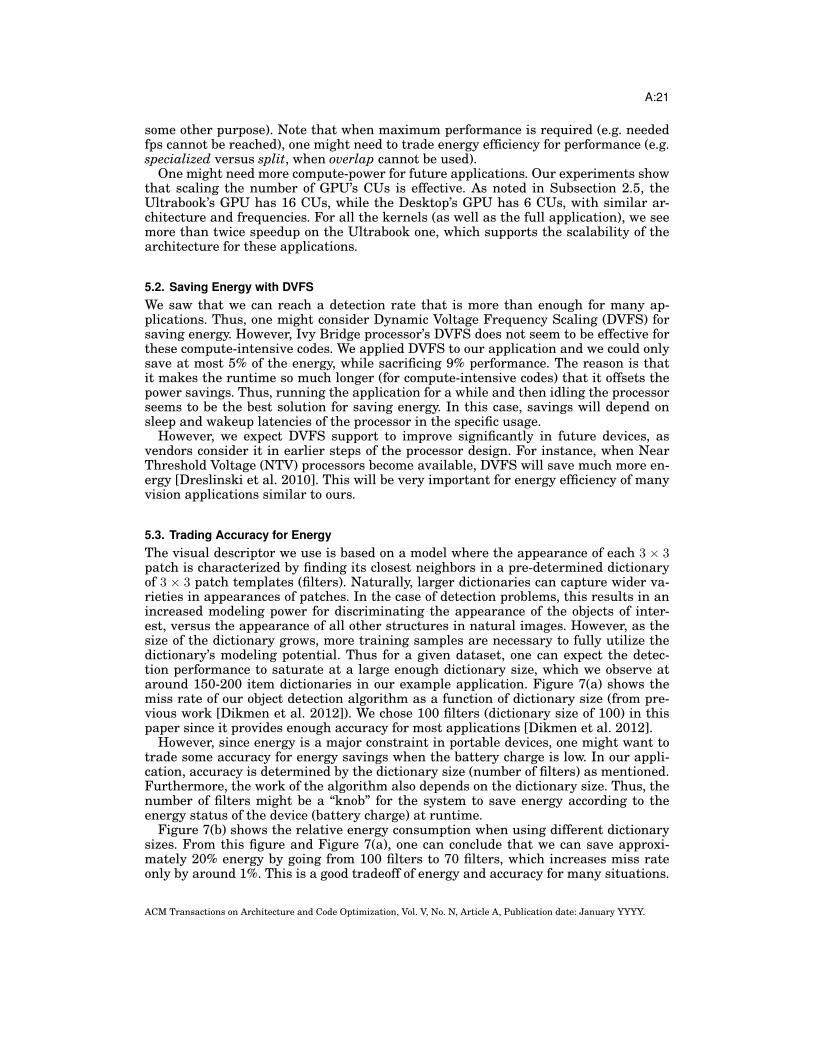
5.3. Trading Accuracy for EnergyThe visual descriptor we use is based on a model where the appearance of each 3 × 3patch is characterized by finding its closest neighbors in a pre-determined dictionaryof 3 × 3 patch templates (filters). Naturally, larger dictionaries can capture wider va-rieties in appearances of patches. In the case of detection problems, this results in anincreased modeling power for discriminating the appearance of the objects of inter-est, versus the appearance of all other structures in natural images. However, as thesize of the dictionary grows, more training samples are necessary to fully utilize thedictionary’s modeling potential. Thus for a given dataset, one can expect the detec-tion performance to saturate at a large enough dictionary size, which we observe ataround 150-200 item dictionaries in our example application. Figure 7(a) shows themiss rate of our object detection algorithm as a function of dictionary size (from pre-vious work [Dikmen et al. 2012]). We chose 100 filters (dictionary size of 100) in thispaper since it provides enough accuracy for most applications [Dikmen et al. 2012].
However, since energy is a major constraint in portable devices, one might want totrade some accuracy for energy savings when the battery charge is low. In our appli-cation, accuracy is determined by the dictionary size (number of filters) as mentioned.Furthermore, the work of the algorithm also depends on the dictionary size. Thus, thenumber of filters might be a “knob” for the system to save energy according to theenergy status of the device (battery charge) at runtime.
Figure 7(b) shows the relative energy consumption when using different dictionarysizes. From this figure and Figure 7(a), one can conclude that we can save approxi-mately 20% energy by going from 100 filters to 70 filters, which increases miss rateonly by around 1%. This is a good tradeoff of energy and accuracy for many situations.
ACM Transactions on Architecture and Code Optimization, Vol. V, No. N, Article A, Publication date: January YYYY.
A:22
0
5
10
15
20
25
30
10 20 50 100 200 300
Mis
s ra
te (%
)
Dictionary size (number of filters)
(a) Object detection miss rate
0
20
40
60
80
100
50 100 150 200 250 300
Ene
rgy
cons
umpt
ion
rela
tive
to m
ax (%
)
Dictionary size (number of filters)
(b) Relative energy consumption
Fig. 7: Accuracy vs. energy consumption
In a nutshell, we have considered four different techniques for better energy effi-ciency: 1) item Program optimization, 2) Heterogeneity, 3) DVFS, and 4) Decreasingaccuracy.
6. RELATED WORKPrevious works have shown that the use of heterogeneous architectures can improveperformance and decrease energy consumption [Kumar et al. 2005]. In addition, map-ping algorithms have been studied for heterogeneous systems [Luk et al. 2009; Liuet al. 2012; Jimenez et al. 2009; Ma et al. 2012]. Other forms of heterogeneity, such asoff-loading virtual machine services (e.g. garbage collection) to smaller cores [Cao et al.2012], has also been studied. However, the focus is mostly on mapping across differentapplications. In addition, integrated GPUs have not been considered.
A few programming paradigms such as OmpSs [Planas et al. 2013] or starPU [Au-gonnet et al. 2011] provide a unified programming paradigm for the CPU and the GPUand automatically perform load balancing and move the data as needed between thedifferent nodes and GPUs. We restricted ourselves to OpenCL, since it is the only onesupported by the integrated GPU in the Ivy Bridge machines. In addition, these worksfocus on programmability and performance, but not energy efficiency. Also, they focuson large systems, rather than on-chip heterogeneous systems. Moreover, they do not fo-cus on pipeline applications. Furthermore, as we have shown, automatic vectorizationdoes not achieve high performance in our case.
The new architectures with on-chip GPUs are becoming increasingly more popularin industry. These platforms include Intel’s Ivy Bridge [Damaraju et al. 2012], AMDAPU [Foley et al. 2012], and NVIDIA Tegra 250 [NVIDIA 2011]. Evaluation studiesalso show their advantages in performance and energy efficiency [Doerksen et al. 2012;Rattanatranurak et al. 2012; Spafford et al. 2012; Daga et al. 2011].
With regards to computer vision, it is known that GPU is very effective [Allusse et al.2008; Babenko and Shah 2008; Fung and Mann 2008; Prisacariu and Reid 2009; Mistryet al. 2011], because of the data parallel nature of most vision computations. However,as shown, integrated GPU’s have different trade-offs and a GPU-only solution is notefficient here [Lee et al. 2010]. Our code has very high performance comparatively, andwe gain much better or similar fps detection rate compared to recent works on objectdetection, which use much more capable discrete GPUs [Beleznai et al. 2011; Zhangand Nevatia 2008]. For example, 41 fps had been reported using a desktop machinewith an Nvidia GTX 260 GPU card [Beleznai et al. 2011], while we achieve 40 fps on a
ACM Transactions on Architecture and Code Optimization, Vol. V, No. N, Article A, Publication date: January YYYY.
A:23
portable device with an integrated on-chip GPU (although comparison is complicated,since the algorithms and machines are different).
Furthermore, trading accuracy for energy or performance has been considered,but in different contexts [Sharrab and Sarhan 2012; Bergman 2010]. For example,Bergman [Bergman 2010] shows how to limit the processing times for rendering graph-ics by an OpenGL API library. This method sacrifices frame rate or image quality forless energy consumption. In addition, Sharrab and Sarhan [Sharrab and Sarhan 2012]adapt the video rate for computer vision applications considering both accuracy andpower consumption. To gain insight about the accuracy of object detection algorithms,we encourage the reader to go through surveys on similar topics [Zhang and Zhang2010; Kong et al. 2005; Dollar et al. 2012].
7. CONCLUSIONSDriven by user demand, the computer industry is focused on battery operated portabledevices, which are energy constrained. In addition, better user experience requires nat-ural interfaces using vision and video analytics applications. However, energy efficientexecution of these compute-intensive workloads is challenging.
We showed that heterogeneous on-chip architectures can be very effective, using avisual object detection application. We optimized each kernel for CPU and integratedGPU of the Ivy Bridge architecture using different techniques. For example, we vec-torized the filter kernel using a data layout transformation.
Furthermore, we showed that a unified programming paradigm such as OpenCLprovides a good balance between performance and programmer productivity. This isbecause the same code runs efficiently on both the CPU and the GPU.
In addition to productivity and performance, energy efficiency is a main concern. Bycomprehensive evaluation, we showed that it is best to map each kernel where it runsthe best. Thus, existing methods, which only use the GPU or try to gain maximumutilization of both the CPU and the GPU naively, are inefficient (even for highly par-allel vision workloads). In a nutshell, running each kernel on the best processor type,and using software pipelining is both faster and more energy efficient. This is becausethese heterogeneous on-chip architectures have a fixed chip power budget, which isallocated by a dynamic power management scheme to each processor. If parallelismthrough software pipelining is not possible, splitting the input among CPU and GPUmight be faster, but specializing each processor for suitable tasks can be more energyefficient.
8. ACKNOWLEDGMENTSThis material is based upon work supported by the National Science Foundation underAward CNS 1319657, and by the Illinois-Intel Parallelism Center at the University ofIllinois at Urbana-Champaign. The Center is sponsored by the Intel Corporation. Wewould like to thank Robert H. Kuhn from Intel and Antonio J. Dios from University ofMalaga (Spain) for their support in the beginning of this project.
REFERENCES2011. Avoiding AVX-SSE Transition Penalties. http://software.intel.com/en-us/articles/
intel-avx-state-transitions-migrating-sse-code-to-avx. (2011).2013a. Intel SK for OpenCL Applications 2013. http://software.intel.com/en-us/vcsource/tools/opencl-sdk.
(2013).2013b. OpenCL Optimization Guide. http://software.intel.com/sites/products/documentation/ioclsdk/2013/
OG/index.htm. (2013).
ACM Transactions on Architecture and Code Optimization, Vol. V, No. N, Article A, Publication date: January YYYY.
A:24
Yannick Allusse, Patrick Horain, Ankit Agarwal, and Cindula Saipriyadarshan. 2008. GpuCV: A GPU-Accelerated Framework for Image Processing and Computer Vision. In Advances in Visual Computing.Lecture Notes in Computer Science, Vol. 5359. Springer Berlin Heidelberg, 430–439.
C. Augonnet, S. Thibault, R. Namyst, and P. Wacrenier. 2011. StarPU: a unified platform for task schedulingon heterogeneous multicore architectures. Concurr. Comput. : Pract. Exper. 23, 2 (Feb. 2011), 187–198.
P. Babenko and M. Shah. 2008. MinGPU: A minimum GPU library for computer vision. Journal of Real-TimeImage Processing 3, 4 (2008), 255–268.
Csaba Beleznai, D. Schreiber, and M. Rauter. 2011. Pedestrian detection using GPU-accelerated multiplecue computation. In Computer Vision and Pattern Recognition Workshops (CVPRW). 58–65.
Johan Bergman. 2010. Energy Efficient Graphics: Making the Rendring Process Power Aware. Ph.D. Disser-tation. Uppsala University.
Aart J. C. Bik, Xinmin Tian, and Milind B. Girkar. 2006. Multimedia vectorization of floating-point MIN/-MAX reductions. Concurrency and Computation: Practice and Experience 18, 9 (2006), 997–1007.
G. Bradski. 2000. The OpenCV Library. Dr. Dobb’s Journal of Software Tools (2000).Christopher JC Burges. 1998. A tutorial on support vector machines for pattern recognition. Data mining
and knowledge discovery 2, 2 (1998), 121–167.Ting Cao, Stephen M Blackburn, Tiejun Gao, and Kathryn S McKinley. 2012. The yin and yang of power
and performance for asymmetric hardware and managed software. In Proc. of ISCA.J. Corbal, R. Espasa, and M. Valero. On the efficiency of reductions in µ-SIMD media extensions. In Proc. of
PACT. 83–94.M. Daga, A.M. Aji, and W.-C. Feng. 2011. On the efficacy of a fused CPU+GPU processor (or APU) for parallel
computing. Proc. of SAAHPC (2011), 141–149.S. Damaraju, V. George, S. Jahagirdar, T. Khondker, R. Milstrey, S. Sarkar, S. Siers, I. Stolero, and A.
Subbiah. 2012. A 22nm IA multi-CPU and GPU system-on-chip. IEEE International Solid-State CircuitsConference 55 (2012), 56–57.
Howard David, Eugene Gorbatov, Ulf R. Hanebutte, Rahul Khanna, and Christian Le. 2010. RAPL: MemoryPower Estimation and Capping. In Proc. of ISPLED.
Mert Dikmen, Derek Hoiem, and Thomas S Huang. 2012. A data driven method for feature transformation.In Computer Vision and Pattern Recognition (CVPR). IEEE, 3314–3321.
Mert Dikmen, Huazhong Ning, Dennis J Lin, Liangliang Cao, Vuong Le, Shen-Fu Tsai, Kai-Hsiang Lin,Zhen Li, Jianchao Yang, Thomas S Huang, and others. 2008. Surveillance event detection. In TrecVIDVideo Evaluation Workshop.
M. Doerksen, P. Thulasiraman, and R.K. Thulasiram. 2012. Optimizing option pricing algorithms and pro-filing power consumption on VLIW APU architecture. Proc of ISPA (2012), 71–78.
P. Dollar, C. Wojek, B. Schiele, and P. Perona. 2012. Pedestrian Detection: An Evaluation of the State of theArt. Pattern Analysis and Machine Intelligence, IEEE Transactions on 34, 4 (2012), 743–761.
R.G. Dreslinski, M. Wieckowski, D Blaauw, D Sylvester, and T. Mudge. 2010. Near-Threshold Computing:Reclaiming Moore’s Law Through Energy Efficient Integrated Circuits. Proc. IEEE 98, 2 (2010), 253–266.
P. F. Felzenszwalb, R. B. Girshick, D. McAllester, and D. Ramanan. 2010. Object Detection with Discrimina-tively Trained Part Based Models. IEEE Transactions on Pattern Analysis and Machine Intelligence 32,9 (2010), 1627–1645.
D. Foley, P. Bansal, D. Cherepacha, R. Wasmuth, A. Gunasekar, S. Gutta, and A. Naini. 2012. A low-powerintegrated x86-64 and graphics processor for mobile computing devices. IEEE Journal of Solid-StateCircuits 47, 1 (2012), 220–231.
J. Fung and S. Mann. 2008. Using graphics devices in reverse: GPU-based Image Processing and ComputerVision. IEEE International Conference on Multimedia and Expo, ICME 2008 (2008), 9–12.
Carlos H Gonzalez and Basilio B Fraguela. 2010. A generic algorithm template for divide-and-conquer inmulticore systems. In High Performance Computing and Communications (HPCC). IEEE, 79–88.
Maurice H Halstead. 1977. Elements of Software Science (Operating and programming systems series). El-sevier Science Inc.
Vıctor J. Jimenez, Lluıs Vilanova, Isaac Gelado, Marisa Gil, Grigori Fursin, and Nacho Navarro. 2009.Predictive Runtime Code Scheduling for Heterogeneous Architectures. In Proc. of HiPEAC.
Michael Jones and Paul Viola. 2003. Fast multi-view face detection. Mitsubishi Electric Research Lab TR-20003-96 3 (2003).
ACM Transactions on Architecture and Code Optimization, Vol. V, No. N, Article A, Publication date: January YYYY.
A:25
Seong G Kong, Jingu Heo, Besma R Abidi, Joonki Paik, and Mongi A Abidi. 2005. Recent advances in visualand infrared face recognition a review. Computer Vision and Image Understanding 97, 1 (2005), 103–135.
Rakesh Kumar, Dean M. Tullsen, Norman P. Jouppi, and Parthasarathy Ranganathan. 2005. HeterogeneousChip Multiprocessors. Computer 38, 11 (Nov. 2005).
Victor W. Lee, Changkyu Kim, Jatin Chhugani, Michael Deisher, Daehyun Kim, Anthony D. Nguyen, Na-dathur Satish, Mikhail Smelyanskiy, Srinivas Chennupaty, Per Hammarlund, Ronak Singhal, andPradeep Dubey. 2010. Debunking the 100X GPU vs. CPU myth: an evaluation of throughput computingon CPU and GPU. In Proc. of ISCA. 451–460.
E. Lindholm, J. Nickolls, S. Oberman, and J. Montrym. March-April 2008. NVIDIA Tesla: A Unified Graphicsand Computing Architecture. Micro, IEEE 28, 2 (March-April 2008), 39–55.
Cong Liu, Jian Li, Wei Huang, Juan Rubio, Evan Speight, and Xiaozhu Lin. 2012. Power-efficient time-sensitive mapping in heterogeneous systems. In Proc. of PACT.
Chi-Keung Luk, Sunpyo Hong, and Hyesoon Kim. 2009. Qilin: exploiting parallelism on heterogeneous mul-tiprocessors with adaptive mapping. In Proc. of MICRO.
Ka Ma, Xue Li, Wei Chen, Chi Zhang, and Xiaorui Wang. 2012. GreenGPU: A Holistic Approach to EnergyEfficiency in GPU-CPU Heterogeneous Architectures. In Proc. of ICPP.
Tianyang Ma and Longin Jan Latecki. 2011. From partial shape matching through local deformation torobust global shape similarity for object detection. In Computer Vision and Pattern Recognition (CVPR).IEEE, 1441–1448.
Subhransu Maji and Jitendra Malik. 2009. Object detection using a max-margin hough transform. In Com-puter Vision and Pattern Recognition. IEEE, 1038–1045.
Saeed Maleki, Yaoqing Gao, Maria J. Garzaran, Tommy Wong, and David A. Padua. 2011. An Evaluation ofVectorizing Compilers. In Proc. of PACT. 372–382.
Perhaad Mistry, Chris Gregg, Norman Rubin, David Kaeli, and Kim Hazelwood. 2011. Analyzing programflow within a many-kernel OpenCL application. In Proc. of the Fourth Workshop on General PurposeProcessing on Graphics Processing Units (GPGPU-4).
Trevor Mudge. 2001. Power: A First-Class Architectural Design Constraint. Computer 34, 4 (April 2001),52–58.
NVIDIA. 2011. Bringing High-End Graphics to Handheld Devices. (2011). http://www.nvidia.comJ. Planas, Rosa M. Badia, E. Ayguade, and J. Labarta. 2013. Self-Adaptive OmpSs Tasks in Heterogeneous
Environments. In Proc. of IPDPS.Victor Prisacariu and Ian Reid. 2009. fastHOG-a real-time GPU implementation of HOG. University of
Oxford Technical Report 2310, 09 (2009).A. Rattanatranurak, S. Kittitornkun, and S. Tongsima. 2012. Optimizing and multithreading SNPHAP on
a multi-core APU with OpenCL. In Proc of JCSSE (2012), 174–179.James Reinders. 2007. Intel threading building blocks (first ed.).Gang Ren, Peng Wu, and David Padua. 2006. Optimizing data permutations for SIMD devices. In Proc. of
PLDI. 118–131.E. Rotem, A. Naveh, D. Rajwan, A. Ananthakrishnan, and E. Weissmann. March-April 2012. Power-
Management Architecture of the Intel Microarchitecture Code-Named Sandy Bridge. Micro, IEEE 32, 2(March-April 2012), 20–27.
Y.O. Sharrab and N.J. Sarhan. 2012. Accuracy and Power Consumption Tradeoffs in Video Rate Adaptationfor Computer Vision Applications. In Proc of Multimedia and Expo (ICME). 410–415.
K.L. Spafford, J.S. Meredith, S. Lee, D. Li, P.C. Roth, and J.S. Vetter. 2012. The tradeoffs of fused memoryhierarchies in heterogeneous computing architectures. Proc of CF (2012), 103–112.
D. Talla, L.K. John, and D. Burger. Aug. 2003. Bottlenecks in multimedia processing with SIMD style exten-sions and architectural enhancements. Computers, IEEE Transactions on 52, 8 (Aug. 2003), 1015–1031.
Peter Thoman, Klaus Kofler, Heiko Studt, John Thomson, and Thomas Fahringer. 2011. Automatic OpenCLdevice characterization: guiding optimized kernel design. In Euro-Par 2011. 438–452.
Elaine J. Weyuker. 1988. Evaluating software complexity measures. Software Engineering, IEEE Transac-tions on 14, 9 (1988), 1357–1365.
Ming Yang, Shuiwang Ji, Wei Xu, Jinjun Wang, Fengjun Lv, Kai Yu, Yihong Gong, Mert Dikmen, Dennis JLin, and Thomas S Huang. 2009. Detecting Human Actions in Surveillance Videos. In TrecVID VideoEvaluation Workshop.
Cha Zhang and Zhengyou Zhang. 2010. A survey of recent advances in face detection. Technical Report MSR-TR-2010-66.
ACM Transactions on Architecture and Code Optimization, Vol. V, No. N, Article A, Publication date: January YYYY.

A:26
Li Zhang and R. Nevatia. 2008. Efficient scan-window based object detection using GPGPU. In ComputerVision and Pattern Recognition Workshops. CVPRW ’08. 1–7.
Ying Zhang, Yue Hu, Bin Li, and Lu Peng. July 2011. Performance and Power Analysis of ATI GPU: AStatistical Approach. In Networking, Architecture and Storage (NAS). 149–158.
ACM Transactions on Architecture and Code Optimization, Vol. V, No. N, Article A, Publication date: January YYYY.


![A MultiPath Network for Object Detection arXiv:1604 ... · 2015 detection and segmentation challenges. 1 Introduction Object classification [19,28,30] and object detection [10,27,29]](https://img.pdfslide.net/doc/110x75/6015fcbf097afe09266a899d/a-multipath-network-for-object-detection-arxiv1604-2015-detection-and-segmentation.jpg)