Embed Size (px)
Citation preview
A fair start For everY childWhy we must act now to tackle child poverty in the UK
Save the Children works in more than 120 countries. We save children’s lives. We fight for their rights. We help them fulfil their potential.
Published bySave the Children 1 St John’s LaneLondon EC1M 4ARUK+44 (0)20 7012 6400savethechildren.org.uk
First published 2014
© The Save the Children Fund 2014
The Save the Children Fund is a charity registered in England and Wales (213890) and Scotland (SC039570). Registered Company No. 178159
This publication is copyright, but may be reproduced by any method without fee or prior permission for teaching purposes, but not for resale. For copying in any other circumstances, prior written permission must be obtained from the publisher, and a fee may be payable.
Cover photo: Annemarie with her son Oliver, age two (Photo: Greg Funnell/ Save the Children)
Copy-edited by Ravi Wickremasinghe
Typeset by Grasshopper Design CompanyPrinted by Page Bros Ltd
This report was written by Priya Kothari, Graham Whitham and Thomas Quinn of Save the Children.
AcknowledgementsOur thanks to the teachers of Lark Hill Community Primary School and River View Primary School in Salford and Moorland Primary School, Cardiff, who organised for us to come into their schools, and thanks also to their pupils who shared their opinions and ideas with us.
COntEnts
Executive summary iv
Introduction 1
1 The impact of poverty on children’s lives 3
2 The three main drivers of child poverty 10
3 What next? The threat of growing child poverty 20
4 Policy options: mapping the response 27
5 Save the Children’s call for a fair start for every child 31
Appendices 33
Endnotes 39
iv
From our founding in the aftermath of the First World War, Save the Children has worked to address child poverty in the UK, recognising that, just as elsewhere in the world, poverty harms children, damaging both their childhoods here and now and their future life chances.
We are increasingly concerned that, in the UK, life for children in poorer families is getting worse. This isn’t a result of any one policy or any individual decision; nor has it simply happened since the recession. A set of key drivers underlies child poverty in the UK, which has meant that, after a decline in child poverty more than a decade ago, child poverty rates since 2004 have plateaued. Now, following the recession and during the recovery, they are set to rise dramatically.
Through our programme work across the UK, we see the scale of child poverty, with substantial need for our early-intervention grant programme, Eat, Sleep, Learn, Play! Our work has revealed how much families across the country are struggling.
This report is born out of this concern. It examines the impact of poverty on the lives of children in the UK and the underlying drivers that cause it. We also look at what the future might hold, with new modelling demonstrating that the risk of more children entering poverty could be even greater than we currently fear.
Unless we address the threat of rising child poverty now, we risk a whole generation of children from poor families being left behind. If Britain’s economy recovers but huge numbers of our children fall into poverty, we have to question our values as a nation. We also risk future prosperity for all since, as this report demonstrates, poverty holds children back in their education and future careers.
POVERTy HARMS CHILDREN
Some people argue that child poverty doesn’t exist in the UK, that the statistics that point to 3.5 million children living in poverty in the UK are a consequence of a faulty definition of child poverty rather than a true reflection of children’s circumstances. That simply isn’t the case. While child poverty in the UK isn’t comparable to the types of poverty we see in the developing world, neither is it a statistical creation: it has real-world impact.
As this report shows, children in poverty have lower standards of living that have an impact on their lives. For example, well over a third of children in the poorest households are living in a home in poor repair, with the situation only slightly better for children a rung up the income ladder. In both cases, almost a fifth are living in cold homes. With damp houses more common, children are at greater risk of long-term respiratory problems, such as asthma. Other health problems, such as diabetes and obesity, are more common among poor children.
Quality of life is also lower. Parental stress and sacrifice weigh on households and children. Our polling shows that over a third of parents on low and modest incomes fear that their worries over bills and paying for essentials are having an impact on their children. Research also finds that poor children are nearly three times more likely to suffer mental health problems than those in high-income families.
Lastly, all too easily, poverty becomes a life sentence, as cognitive development and educational achievement suffer. There is a direct relationship between household income, and school-readiness and vocabulary at five. The visibility of poverty at primary school, missing school trips because of cost, and poor appearance can lead to bullying. Only a third of the poorest children in England go on to
ExECUtIVE sUmmARY
v
ExEc
ut
ivE su
mm
ary
achieve five good GcsEs including English and maths. Our polling shows that while 60% of well-off parents of young children expect them to go to university after school, only around one-third of parents on low and modest incomes expect their children to do the same.
Poverty is an even bigger problem for younger children. the chances of going without are higher for younger children, who are more likely to be in poverty because their parents stop work temporarily to care for them. they are more likely to be affected by low household income as they spend more time in the home compared with school-aged children; poverty has a greater impact on young children because of the importance of the early years on lifetime development.
incrEasinG challEnGEs fOr familiEs
a triple whammy of years of flat wage growth, recent pressure on social security spending and a rising cost of living including a ‘poverty premium’ – that is, the higher cost poor families often have to pay for goods and services – are making life tougher for families and children.
Perhaps the starkest reality is that, over the past ten years, work has ceased to become a sufficient solution to poverty for families with children. While unemployment has fallen among low-income families, the number of poor children living in working households has actually risen by 12 percentage points. two-thirds of poor children now live in working households.
meanwhile, cuts in social security and services following the recession have hit worst-off households hardest in terms of the proportion of income lost. families with children have been harder hit than those without. Our findings show that families with a child under five have, on average, lost 30% more of their disposable income than those with no children.
at the same time, costs that impact on children have dramatically increased. childcare costs have risen by 77% over the last ten years. Over the same period, the price of food rose by 19 percentage points
more than the general price level. the rising cost of essentials has hit families on the lowest incomes hardest as they spend more of their money on basics than the richest families.
and our new modelling of the ‘poverty premium’ shows that the additional cost of services and goods for poorer families has risen to £1,639 a year – around 8% of income for families around the poverty line. Polling of 4,000 parents finds that more families on low and modest incomes have seen their income going down rather than increasing over the past five years; it’s only among wealthier families that more have seen a rise.
this analysis demonstrates clearly that child poverty in the uK is rooted in the labour market and markets that provide services to families, as well as in social security policies or a single economic cycle.
thE futurE lOOKs blEaK
as the economy recovers, the situation for poor children is set to get worse, not better. the institute for fiscal studies predicts a one-third rise in child poverty by 2020 – the target set for its eradication – despite the growing economy. if the relationship between poverty and the effects on childhood holds as it does now, this could mean more than 150,000 more children living in a cold home, almost 90,000 more not getting enough fruit and vegetables, and another 23,000 young people a year in England not achieving good GcsEs.
however, our new research shows how child poverty could rise yet further. if wages follow the Office for budget responsibility forecast and government departments make three-quarters of their spending cut targets, with the welfare cap having to absorb the remaining quarter – a conservative estimate resulting in fewer cuts to welfare than proposed by the chancellor in early 2014 – this could lead by 2020 to 325,000 more children in poverty than the institute for fiscal studies has predicted, which would be an increase of 1.4 million on the latest child poverty figures.1 by 2020, child poverty would be around the highest ever recorded in the uK, and the highest for a generation. the face of poverty in the uK will be that of a child, usually within a working family.
The choice poliTicians now face
Despite these trends, politicians of all the main parties continue to commit to eradicating child poverty by 2020. in our view these commitments are no longer credible.
politicians have a choice. either they should recommit to the 2020 targets and outline the necessarily radical strategy for how they will be achieved. or they should admit the targets won’t be met and introduce an ambitious interim plan, outlining what can be achieved by 2020, while keeping the longer term plan of eradication with an achievable but ambitious target date. To reiterate the rhetorical commitment while having no credible strategy of achieving it is disingenuous and prevents a real conversation about what political parties will do to help children being left behind.
whatever politicians decide, greater action and ambition is needed from all parties to improve the circumstances for children in the UK. we do not believe any party is showing a sufficient strategic response to the scale and seriousness of the problem we outline below. in addition, the political debate in this parliament has focused on the condition of those with middle incomes. we call for a renewed focus on the spread of poverty in our society.
our priority is for all children to have a fair start by 11. from our experience, early intervention is key. in a time when there is little resource available, we have to focus on the first stages of a child’s life. That’s why we’re focusing our recommendations on the early years. we’re calling for:
1. every family to have access to high-quality and affordable childcare
2. a minimum income guarantee for families of children under five years old
3. a national mission for all children to be reading well by 11.
These measures will not eradicate poverty for all children, but if introduced would play a major role in improving life experiences for children in poorer families and ensuring poverty does not continue across generations. This is the very least we can do as a country for our youngest children by 2020.
But if we don’t take these steps, we will have recovered our economic position, but only at grave cost to the childhoods and ambitions of our children. another generation risks growing up in a world where poverty, like crime, is punishable, and where for too many, the future only really holds promise if you are born in the right circumstances. in short, the cost of our prosperity will be our collective conscience and our national future. This is not a call for a political debate. This is a call for a renewed national focus on the lives and futures of our children.
a f
air
sTa
rT f
or
ev
ery
ch
ilD
vi
1
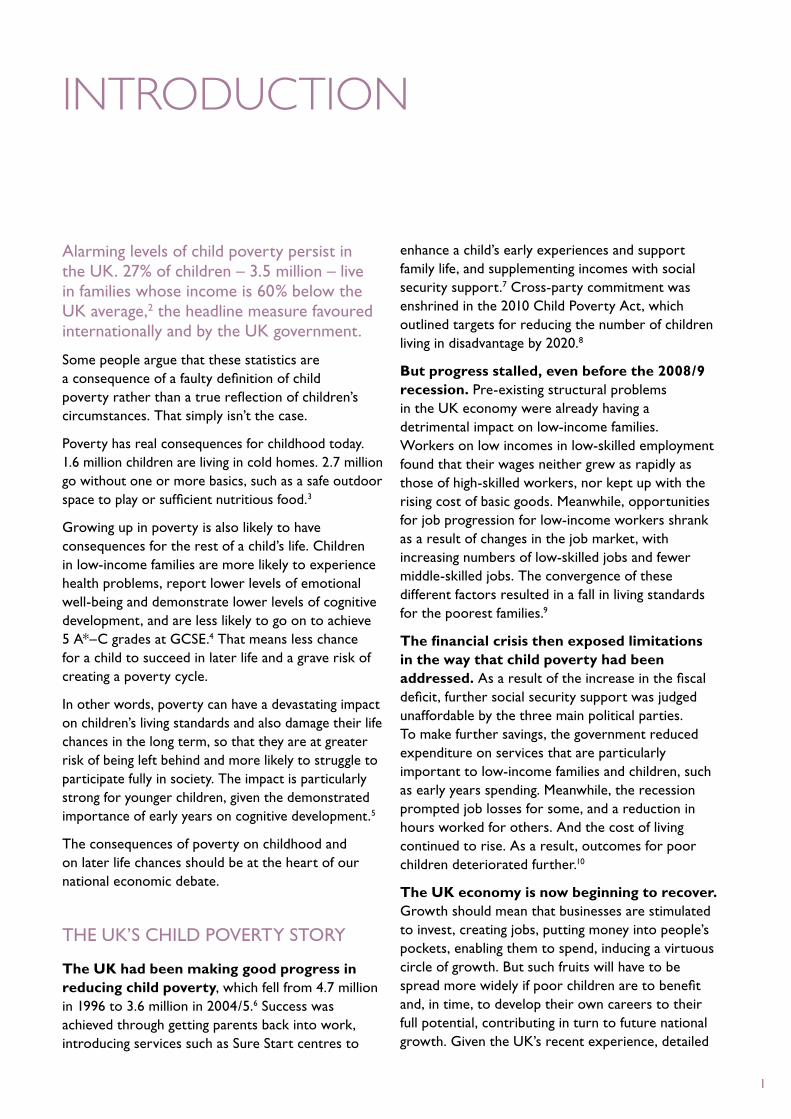
Alarming levels of child poverty persist in the UK. 27% of children – 3.5 million – live in families whose income is 60% below the UK average,2 the headline measure favoured internationally and by the UK government.
Some people argue that these statistics are a consequence of a faulty definition of child poverty rather than a true reflection of children’s circumstances. That simply isn’t the case.
Poverty has real consequences for childhood today. 1.6 million children are living in cold homes. 2.7 million go without one or more basics, such as a safe outdoor space to play or sufficient nutritious food.3
Growing up in poverty is also likely to have consequences for the rest of a child’s life. Children in low-income families are more likely to experience health problems, report lower levels of emotional well-being and demonstrate lower levels of cognitive development, and are less likely to go on to achieve 5 A*–C grades at GCSE.4 That means less chance for a child to succeed in later life and a grave risk of creating a poverty cycle.
In other words, poverty can have a devastating impact on children’s living standards and also damage their life chances in the long term, so that they are at greater risk of being left behind and more likely to struggle to participate fully in society. The impact is particularly strong for younger children, given the demonstrated importance of early years on cognitive development.5
The consequences of poverty on childhood and on later life chances should be at the heart of our national economic debate.
THE UK’S CHILD POVERTy STORy
The UK had been making good progress in reducing child poverty, which fell from 4.7 million in 1996 to 3.6 million in 2004/5.6 Success was achieved through getting parents back into work, introducing services such as Sure Start centres to
enhance a child’s early experiences and support family life, and supplementing incomes with social security support.7 Cross-party commitment was enshrined in the 2010 Child Poverty Act, which outlined targets for reducing the number of children living in disadvantage by 2020.8
But progress stalled, even before the 2008/9 recession. Pre-existing structural problems in the UK economy were already having a detrimental impact on low-income families. Workers on low incomes in low-skilled employment found that their wages neither grew as rapidly as those of high-skilled workers, nor kept up with the rising cost of basic goods. Meanwhile, opportunities for job progression for low-income workers shrank as a result of changes in the job market, with increasing numbers of low-skilled jobs and fewer middle-skilled jobs. The convergence of these different factors resulted in a fall in living standards for the poorest families.9
The financial crisis then exposed limitations in the way that child poverty had been addressed. As a result of the increase in the fiscal deficit, further social security support was judged unaffordable by the three main political parties. To make further savings, the government reduced expenditure on services that are particularly important to low-income families and children, such as early years spending. Meanwhile, the recession prompted job losses for some, and a reduction in hours worked for others. And the cost of living continued to rise. As a result, outcomes for poor children deteriorated further.10
The UK economy is now beginning to recover. Growth should mean that businesses are stimulated to invest, creating jobs, putting money into people’s pockets, enabling them to spend, inducing a virtuous circle of growth. But such fruits will have to be spread more widely if poor children are to benefit and, in time, to develop their own careers to their full potential, contributing in turn to future national growth. Given the UK’s recent experience, detailed
IntRODUCtIOn
A F
AIR
STA
RT F
OR
EV
ERy
CH
ILD
2
in Chapter 2, where the drivers of child poverty have increased even in times of economic growth, it cannot be assumed that recovery alone will provide a solution.
OVERVIEW OF THIS REPORT
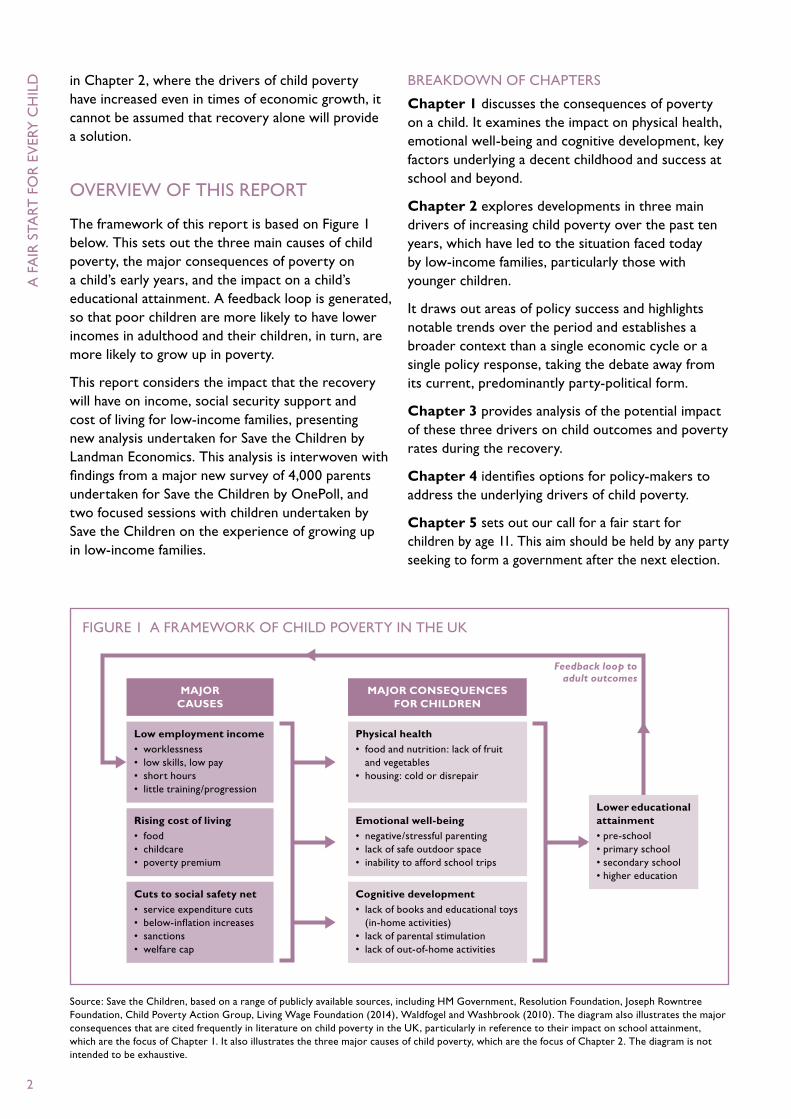
The framework of this report is based on Figure 1 below. This sets out the three main causes of child poverty, the major consequences of poverty on a child’s early years, and the impact on a child’s educational attainment. A feedback loop is generated, so that poor children are more likely to have lower incomes in adulthood and their children, in turn, are more likely to grow up in poverty.
This report considers the impact that the recovery will have on income, social security support and cost of living for low-income families, presenting new analysis undertaken for Save the Children by Landman Economics. This analysis is interwoven with findings from a major new survey of 4,000 parents undertaken for Save the Children by OnePoll, and two focused sessions with children undertaken by Save the Children on the experience of growing up in low-income families.
BREAKDOWN OF CHAPTERS
Chapter 1 discusses the consequences of poverty on a child. It examines the impact on physical health, emotional well-being and cognitive development, key factors underlying a decent childhood and success at school and beyond.
Chapter 2 explores developments in three main drivers of increasing child poverty over the past ten years, which have led to the situation faced today by low-income families, particularly those with younger children.
It draws out areas of policy success and highlights notable trends over the period and establishes a broader context than a single economic cycle or a single policy response, taking the debate away from its current, predominantly party-political form.
Chapter 3 provides analysis of the potential impact of these three drivers on child outcomes and poverty rates during the recovery.
Chapter 4 identifies options for policy-makers to address the underlying drivers of child poverty.
Chapter 5 sets out our call for a fair start for children by age 11. This aim should be held by any party seeking to form a government after the next election.
Source: Save the Children, based on a range of publicly available sources, including HM Government, Resolution Foundation, Joseph Rowntree Foundation, Child Poverty Action Group, Living Wage Foundation (2014), Waldfogel and Washbrook (2010). The diagram also illustrates the major consequences that are cited frequently in literature on child poverty in the UK, particularly in reference to their impact on school attainment, which are the focus of Chapter 1. It also illustrates the three major causes of child poverty, which are the focus of Chapter 2. The diagram is not intended to be exhaustive.
FIGURE 1 A FRAMEWORK OF CHILD POVERTy IN THE UK
Cognitive development• lackofbooksandeducationaltoys
(in-home activities)• lackofparentalstimulation• lackofout-of-homeactivities
Emotional well-being• negative/stressfulparenting• lackofsafeoutdoorspace• inabilitytoaffordschooltrips
Physical health • foodandnutrition:lackoffruit
and vegetables• housing:coldordisrepair
MAJOR CONSEQUENCES FOR CHILDREN
Cuts to social safety net• serviceexpenditurecuts• below-inflationincreases• sanctions• welfarecap
Rising cost of living• food• childcare• povertypremium
Low employment income• worklessness• lowskills,lowpay• shorthours• littletraining/progression
MAJOR CAUSES
Lower educational attainment•pre-school•primaryschool•secondaryschool•highereducation
Feedback loop to adult outcomes
3
CHAPTER SUMMARy
So much of the child poverty debate, on all sides, is about statistics and income that the experiences of children growing up in poverty are often obscured. This chapter uses research and testimony to illustrate what it means to be poor as a child, presenting the differences that exist today between children in low-income families and those who are not.
The conclusion is clear. Poverty can ruin children’s childhood and deny them a fair chance in the rest of life.
As this chapter shows, the gap in outcomes of poor and non-poor children:• remainswideintermsoftheirstandardofliving–
particularly in the quality of homes (eg, how well they are heated and the state of repair), having a safe outdoor space to play and parental sacrifice
• remainswideintheirqualityoflife–forexample,in terms of time spent with parents, levels of stress and levels of obesity
• hasnarrowedineducationalattainment,thoughthere is substantial room for further progress. In the recommendations, Save the Children argues for a sustained national campaign to close the gap.
This chapter also emphasises that these differences between children who are poor and those who are not matter more for younger children, because of the importance of early years on lifetime development. In addition, gaps that are already visible between children at the age of five are harder to close as they get older.
OVERVIEW
Low-income families are less likely to be able to afford the basic material goods and services that ensure a decent start in life for their children, and are more likely to go without. Two-thirds of children in the poorest quintile were classified as materially deprived in 2013 and nearly one-third in the second quintile.11 The chances of going without are higher
for younger children, who are more likely to be in poverty because their parents stop work temporarily to care for them.12 This chapter categorises things that children lack by physical health, emotional well-being, and cognitive development. All three have an impact on educational attainment (see Figure 1, page 2).13
Poor children’s physical health is threatened by, for example:• inadequatefoodandnutrition,suchasalackof
fresh fruit and vegetables in their diet• housingproblems–forexample,ahomethatis
cold or in disrepair.
Their emotional well-being is more likely to be at risk from, for example:• negativebehaviourfromparentsunderstress• lackofsafeoutdoorspacetoplay• inabilitytoaffordschooltrips.
And their cognitive development is more likely to suffer as a result of, for example:• lackofbooksandeducationaltoys• lackofparentalstimulation.
Progress was made in narrowing outcomes between poor children and those from better-off families over the past decade. This was particularly true for educational attainment. However, the labour market trends outlined in Chapter 2, exacerbated by the recession and protracted downturn, have since reversed many of these gains.
PHySICAL HEALTH
FOOD AND NUTRITION
Poor children are slightly more likely to be born underweight; their mothers, living on a low income, are less likely to have been able to afford to eat sufficient amounts of nutritious food during pregnancy.14 young children in poorer families are less likely to eat fresh fruit and vegetables on a daily basis and to get the nutrients they need to develop;15 on a limited budget, it is often cheaper to purchase
1 tHE ImPACt OF POVERtY On CHILDREn’s LIVEs
A F
AIR
STA
RT F
OR
EV
ERy
CH
ILD
4
ready-prepared meals.16 One-quarter of low-income parents and a similar proportion of modest-income parents acknowledge that they buy the cheapest food possible, compared with 14% of high-income parents.17 As one parent in our research said, “It’s much cheaper for me to give my kids fish fingers. It’s much cheaper for me to go to Iceland and get £30 worth of pizzas and chicken nuggets. It’s not good for you, it’s not good for the kids.” 18 For other parents, lack of cash to buy a fridge-freezer or lack of space to store one means it is not possible for some low-income parents to cook food in bulk to store.19
All of these factors mean poor children are more likely to suffer from short and long-term nutrition-related illnesses, such as diabetes and obesity,20 which damage their early childhood development.21 22% of children in the bottom quintile are obese, compared to only 10% in the top quintile.22
HOUSING
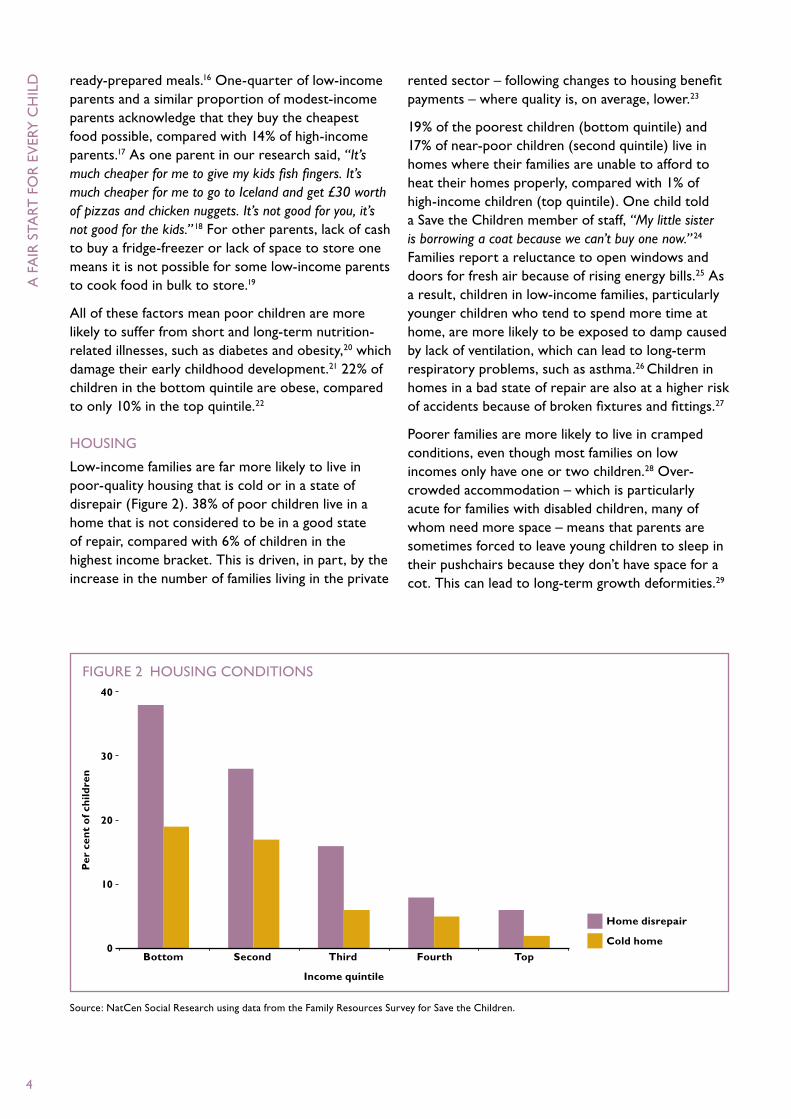
Low-income families are far more likely to live in poor-quality housing that is cold or in a state of disrepair (Figure 2). 38% of poor children live in a home that is not considered to be in a good state of repair, compared with 6% of children in the highest income bracket. This is driven, in part, by the increase in the number of families living in the private
rented sector – following changes to housing benefit payments – where quality is, on average, lower.23
19% of the poorest children (bottom quintile) and 17% of near-poor children (second quintile) live in homes where their families are unable to afford to heat their homes properly, compared with 1% of high-income children (top quintile). One child told a Save the Children member of staff, “My little sister is borrowing a coat because we can’t buy one now.” 24 Families report a reluctance to open windows and doors for fresh air because of rising energy bills.25 As a result, children in low-income families, particularly younger children who tend to spend more time at home, are more likely to be exposed to damp caused by lack of ventilation, which can lead to long-term respiratory problems, such as asthma.26 Children in homes in a bad state of repair are also at a higher risk of accidents because of broken fixtures and fittings.27
Poorer families are more likely to live in cramped conditions, even though most families on low incomes only have one or two children.28 Over-crowded accommodation – which is particularly acute for families with disabled children, many of whom need more space – means that parents are sometimes forced to leave young children to sleep in their pushchairs because they don’t have space for a cot. This can lead to long-term growth deformities.29
FIGURE 2 HOUSING CONDITIONS
Source: NatCen Social Research using data from the Family Resources Survey for Save the Children.
Income quintile
Bottom Second Third Fourth Top
40
30
20
10
0
Per
cen
t o
f ch
ildre
n
Home disrepair
Cold home
1 TH
E IMPA
CT
OF PO
VERT
y O
N C
HILD
REN
’S LIVES
5
EMOTIONAL WELL-BEING
The stress that parents living on a low income are under – which can be exacerbated by getting into debt in trying to keep up with bills – can affect the way that they behave with their children. Parents who are under a lot of stress are more likely to become more authoritative with their children and less responsive to their needs.30
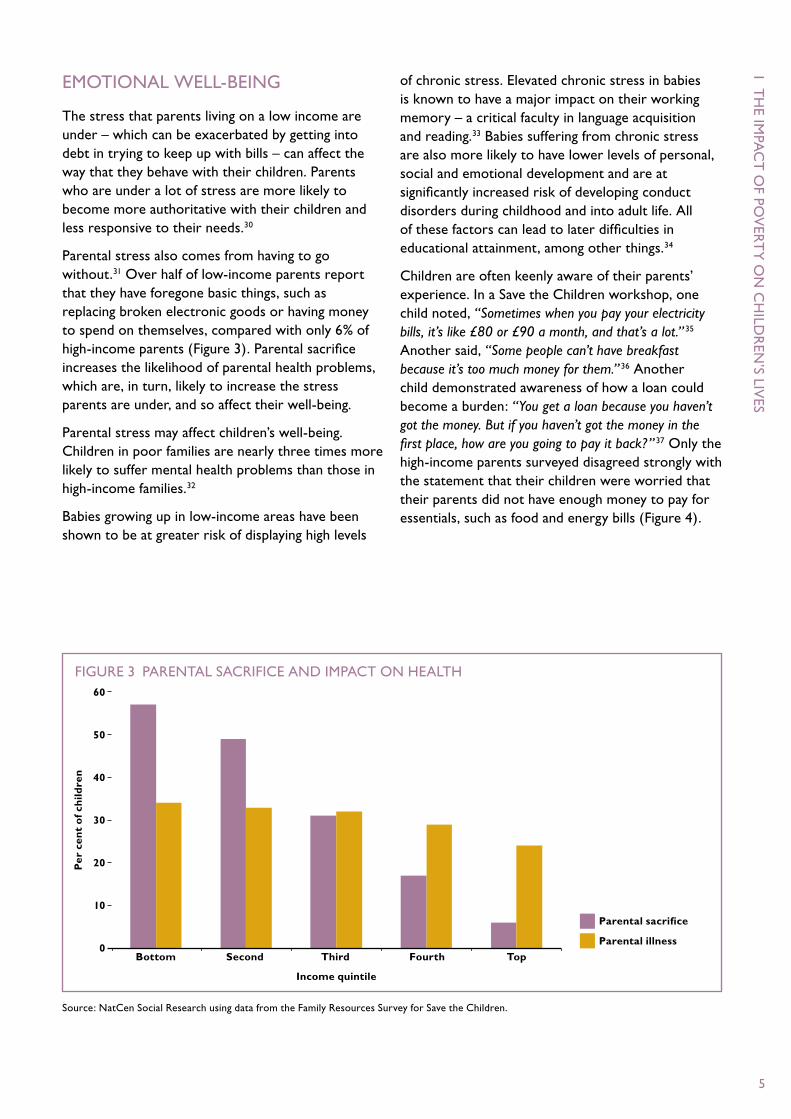
Parental stress also comes from having to go without.31 Over half of low-income parents report that they have foregone basic things, such as replacing broken electronic goods or having money to spend on themselves, compared with only 6% of high-income parents (Figure 3). Parental sacrifice increases the likelihood of parental health problems, which are, in turn, likely to increase the stress parents are under, and so affect their well-being.
Parental stress may affect children’s well-being. Children in poor families are nearly three times more likely to suffer mental health problems than those in high-income families.32
Babies growing up in low-income areas have been shown to be at greater risk of displaying high levels
of chronic stress. Elevated chronic stress in babies is known to have a major impact on their working memory – a critical faculty in language acquisition and reading.33 Babies suffering from chronic stress are also more likely to have lower levels of personal, social and emotional development and are at significantly increased risk of developing conduct disorders during childhood and into adult life. All of these factors can lead to later difficulties in educational attainment, among other things.34
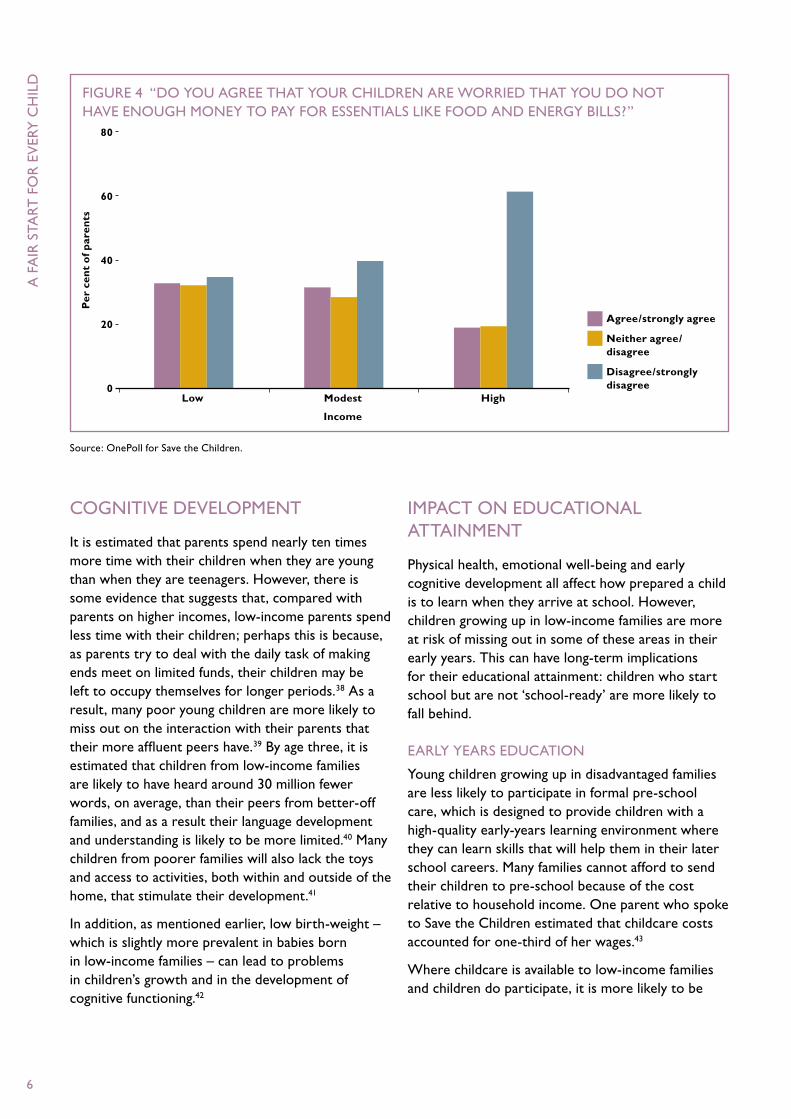
Children are often keenly aware of their parents’ experience. In a Save the Children workshop, one child noted, “Sometimes when you pay your electricity bills, it’s like £80 or £90 a month, and that’s a lot.” 35 Another said, “Some people can’t have breakfast because it’s too much money for them.” 36 Another child demonstrated awareness of how a loan could become a burden: “You get a loan because you haven’t got the money. But if you haven’t got the money in the first place, how are you going to pay it back?” 37 Only the high-income parents surveyed disagreed strongly with the statement that their children were worried that their parents did not have enough money to pay for essentials, such as food and energy bills (Figure 4).
FIGURE 3 PARENTAL SACRIFICE AND IMPACT ON HEALTH
Source: NatCen Social Research using data from the Family Resources Survey for Save the Children.
Income quintile
Bottom Second Third Fourth Top
60
50
40
30
20
10
0
Per
cen
t o
f ch
ildre
n
Parental sacrifice
Parental illness
A F
AIR
STA
RT F
OR
EV
ERy
CH
ILD
6
COGNITIVE DEVELOPMENT
It is estimated that parents spend nearly ten times more time with their children when they are young than when they are teenagers. However, there is some evidence that suggests that, compared with parents on higher incomes, low-income parents spend less time with their children; perhaps this is because, as parents try to deal with the daily task of making ends meet on limited funds, their children may be left to occupy themselves for longer periods.38 As a result, many poor young children are more likely to miss out on the interaction with their parents that their more affluent peers have.39 By age three, it is estimated that children from low-income families are likely to have heard around 30 million fewer words, on average, than their peers from better-off families, and as a result their language development and understanding is likely to be more limited.40 Many children from poorer families will also lack the toys and access to activities, both within and outside of the home, that stimulate their development.41
In addition, as mentioned earlier, low birth-weight – which is slightly more prevalent in babies born in low-income families – can lead to problems in children’s growth and in the development of cognitive functioning.42
IMPACT ON EDUCATIONAL ATTAINMENT
Physical health, emotional well-being and early cognitive development all affect how prepared a child is to learn when they arrive at school. However, children growing up in low-income families are more at risk of missing out in some of these areas in their early years. This can have long-term implications for their educational attainment: children who start school but are not ‘school-ready’ are more likely to fall behind.
EARLy yEARS EDUCATION
young children growing up in disadvantaged families are less likely to participate in formal pre-school care, which is designed to provide children with a high-quality early-years learning environment where they can learn skills that will help them in their later school careers. Many families cannot afford to send their children to pre-school because of the cost relative to household income. One parent who spoke to Save the Children estimated that childcare costs accounted for one-third of her wages.43
Where childcare is available to low-income families and children do participate, it is more likely to be
FIGURE 4 “DO yOU AGREE THAT yOUR CHILDREN ARE WORRIED THAT yOU DO NOT HAVE ENOUGH MONEy TO PAy FOR ESSENTIALS LIKE FOOD AND ENERGy BILLS?”
Source: OnePoll for Save the Children.
Income
Low Modest High
80
60
40
20
0
Per
cen
t o
f p
aren
ts
Agree/strongly agree
Neither agree/disagree
Disagree/strongly disagree
1 TH
E IMPA
CT
OF PO
VERT
y O
N C
HILD
REN
’S LIVES
7
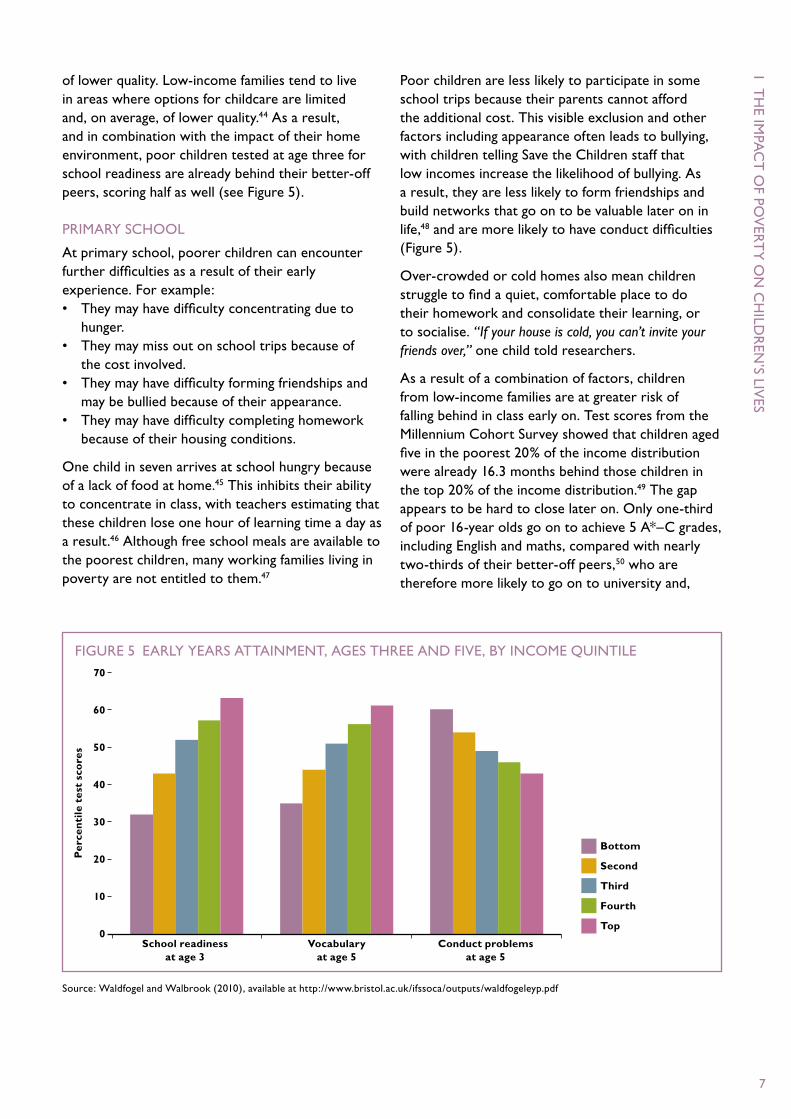
of lower quality. Low-income families tend to live in areas where options for childcare are limited and, on average, of lower quality.44 As a result, and in combination with the impact of their home environment, poor children tested at age three for school readiness are already behind their better-off peers, scoring half as well (see Figure 5).
PRIMARy SCHOOL
At primary school, poorer children can encounter further difficulties as a result of their early experience. For example:• Theymayhavedifficultyconcentratingdueto
hunger.• Theymaymissoutonschooltripsbecauseof
the cost involved.• Theymayhavedifficultyformingfriendshipsand
may be bullied because of their appearance. • Theymayhavedifficultycompletinghomework
because of their housing conditions.
One child in seven arrives at school hungry because of a lack of food at home.45 This inhibits their ability to concentrate in class, with teachers estimating that these children lose one hour of learning time a day as a result.46 Although free school meals are available to the poorest children, many working families living in poverty are not entitled to them.47
Poor children are less likely to participate in some school trips because their parents cannot afford the additional cost. This visible exclusion and other factors including appearance often leads to bullying, with children telling Save the Children staff that low incomes increase the likelihood of bullying. As a result, they are less likely to form friendships and build networks that go on to be valuable later on in life,48 and are more likely to have conduct difficulties (Figure 5).
Over-crowded or cold homes also mean children struggle to find a quiet, comfortable place to do their homework and consolidate their learning, or to socialise. “If your house is cold, you can’t invite your friends over,” one child told researchers.
As a result of a combination of factors, children from low-income families are at greater risk of falling behind in class early on. Test scores from the Millennium Cohort Survey showed that children aged five in the poorest 20% of the income distribution were already 16.3 months behind those children in the top 20% of the income distribution.49 The gap appears to be hard to close later on. Only one-third of poor 16-year olds go on to achieve 5 A*–C grades, including English and maths, compared with nearly two-thirds of their better-off peers,50 who are therefore more likely to go on to university and,
FIGURE 5 EARLy yEARS ATTAINMENT, AGES THREE AND FIVE, By INCOME QUINTILE
Source: Waldfogel and Walbrook (2010), available at http://www.bristol.ac.uk/ifssoca/outputs/waldfogeleyp.pdf
School readiness Vocabulary Conduct problems at age 3 at age 5 at age 5
70
60
50
40
30
20
10
0
Per
cen
tile
tes
t sc
ore
s
Bottom
Second
Third
Fourth
Top

A F
AIR
STA
RT F
OR
EV
ERy
CH
ILD
8
after that, to better-paid jobs. By the time a child is seven, nearly 80% of the difference in GCSE results between rich and poor children has already been determined.51
Some parts of the country have been more successful than others at delivering improvements in education outcomes for the poorest children. London, in particular, has made huge progress. In 2007, inner London was the second lowest performing region in England at GCSE level. In 2012, it was the second highest. Similar improvements have been seen in Birmingham and Sunderland.52
But work needs to continue to improve outcomes for poorer children. Although the gap between poor and non-poor children has closed when considering all GCSE passes at Grades A* to C, it remains wide when grades for English and maths are taken into consideration. English and maths are core skills for future employment. In addition, there are many children growing up in disadvantaged homes who are not eligible for free school meals, who also have poor outcomes at secondary school.53
IMPACT ON LIFETIME OUTCOMES
Some children from low-income families who have faced early difficulties at school go on to overcome these and obtain decent grades at GCSE. But they
are still half as likely than their better-off peers to go on to higher education.54 Our survey found that far fewer low- and modest-income parents expect their children to go on to university than high-income parents (Figure 6). And generally, at 17, poor young people are less likely than others their age to be enrolled in formal education, employment or training.
Children from low-income families may be more likely to be debt adverse and concerned about building up large debts as a result of taking out student loans, and are less likely to receive support towards living costs from their parents.
Equally, poor young people are unable to draw on parental support for a down-payment on a house, for example, or other major purchase, forcing them into work to try and start to build up savings of their own. The low-wage, low-progression nature of many jobs – often in the retail, leisure and social care sectors – makes building up savings even more difficult and can result in a feedback loop where children growing up in poverty are more likely to earn low wages themselves (Figure 1, page 2).
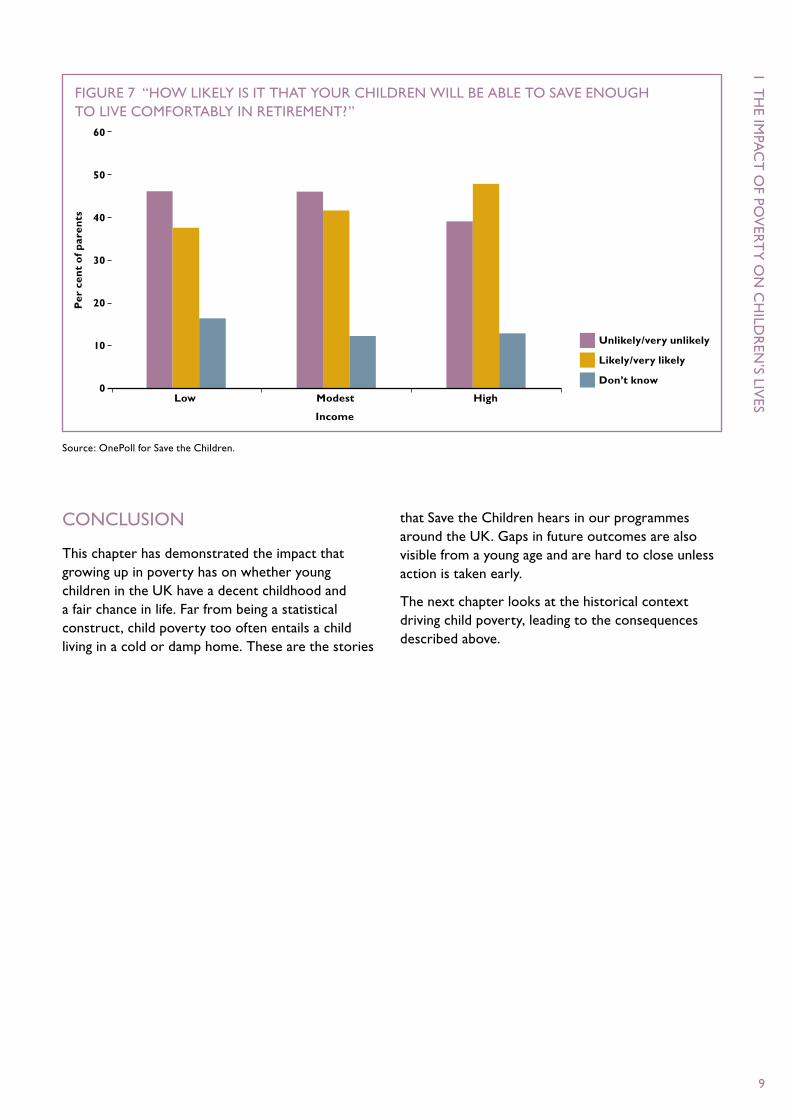
As a result, these young people are less likely to build up savings for retirement. This perhaps explains why low-income and modest-income parents are slightly less confident about their children’s ability to save for retirement than high-income parents (Figure 7).
FIGURE 6 “WHAT DO yOU ExPECT yOUR CHILD TO DO WHEN THEy FINISH SCHOOL?”
Source: OnePoll for Save the Children.
Income
Low Modest High
80
60
40
20
0
Per
cen
t o
f p
aren
ts
University
College
Job
Apprenticeship
Other
1 TH
E IMPA
CT
OF PO
VERT
y O
N C
HILD
REN
’S LIVES
9
CONCLUSION
This chapter has demonstrated the impact that growing up in poverty has on whether young children in the UK have a decent childhood and a fair chance in life. Far from being a statistical construct, child poverty too often entails a child living in a cold or damp home. These are the stories
that Save the Children hears in our programmes around the UK. Gaps in future outcomes are also visible from a young age and are hard to close unless action is taken early.
The next chapter looks at the historical context driving child poverty, leading to the consequences described above.
FIGURE 7 “HOW LIKELy IS IT THAT yOUR CHILDREN WILL BE ABLE TO SAVE ENOUGH TO LIVE COMFORTABLy IN RETIREMENT?”
Source: OnePoll for Save the Children.
Income
Low Modest High
60
50
40
30
20
10
0
Per
cen
t o
f p
aren
ts
Unlikely/very unlikely
Likely/very likely
Don’t know
10
SUMMARy
This chapter looks back over a decade – before the term of the current government began and before the recession – to establish three long-term drivers that put children into poverty: the evolution in wages, government expenditure on social security and services, and the cost of living for low-income families (Figure 1).55 Three key points emerge from this analysis:
• Work no longer offers a complete solution to poverty. While employment increased prior to the recession of 2008, real wages were broadly unchanged. The proportion of all children in poverty living in working households rose from 43% in 1996 to 54% in 2008. Wage growth for families with younger children was slightly worse than for those with older children.
• The social safety net no longer acts as a sufficient backstop for poor families. The social security system had helped compensate for low pay: the number of children in poverty would have been higher if it were not for tax credits. However, the cost of tax credits came to exceed all projections. Now, none of the main political parties are advocating an expansion of state spending.
Recent expenditure cuts to social security and services have hit the poorest hardest, amounting to 8–9% of income for the poorest decile. Cuts were larger for families with older children, but the impact on younger children could still be more substantial, given the importance of children’s early years in later development.
• It costs more to be poor. The cost of basic goods rose faster than the cost of luxury goods. For example, food prices rose by 19 percentage points more than the general price level. As a result, living costs for low-income families rose faster than for high-income families. It was particularly costly to raise a young child due to
the costs of essentials, such as clothing which is quickly grown out of, and the high cost of childcare. In addition, low-income families faced a ‘poverty premium’ (see page 17).
OVERVIEW
Between 1997 and 2004 there were some successes in getting parents back to work, and improving access to social security and services that enhanced childhood experiences. But by 2004 – so, before the recession and before the change of government – progress had begun to slow and, in some cases, was in reverse.
This deterioration suggests that the challenges posed by child poverty were more deep-rooted than was expected when the original commitment to end child poverty was made in 1999. Our analysis in this chapter shows that it was largely driven by poor job and wage progression for low-income families.
TRENDS IN EMPLOyMENT
RATES OF EMPLOyMENT
Between 2003 and 2007, unemployment rates among low-income families continued to fall as more parents successfully joined or re-joined the labour market. But during the recession in 2008/9, these falls began to reverse, as employers responded to falling demand by cutting back on staff or hours worked.56
In the recovery since 2010, average unemployment rates have fallen at a faster rate than expected57 and employment rates have risen. However, there is cause for concern here. The rise in the employment rate has, in part, been driven by an increase in self-employed people,58 but this type of income tends to be less secure for low-income families than for high-income families.59 In addition, there has been an increase in the use of zero-hour contracts, which offer lower job security and less regular income.
2 tHE tHREE mAIn DRIVERs OF CHILD POVERtY
2 TH
E TH
REE M
AIN
DR
IVER
S OF C
HILD
POV
ERTy
11
NUMBER OF LOW-SKILLED JOBS
Following the recession of 2008/9, the increase in employment has been driven by an expansion of low-skilled, low-pay work and high-skilled, high-pay work, with few middle-skilled jobs created,60 exacerbating the so-called hour-glass trend in the labour market observed prior to the crisis. Although low-income parents were joining the labour market following the recession, they were typically employed in low-skilled sectors, such as retail, catering and care. These jobs did not provide on-the-job training and development that would enable them to progress in the labour market.61 In addition, the number of middle-ranking jobs fell. As a result, most parents found themselves stuck in low-paid jobs, with only 18% of low-paid workers securing higher-paid jobs on a permanent basis in the period between 2002 and 2012.62, 63
WAGE GROWTH
The structure of the UK labour market offers few opportunities for low-income families to sustainably increase earned income and lift themselves and their children out of poverty. This is reflected in wage trends over the past decade, where increases were small relative to growth in the economy,64 and in the increase in demand by part-time workers for full-time work to compensate for low wages.65
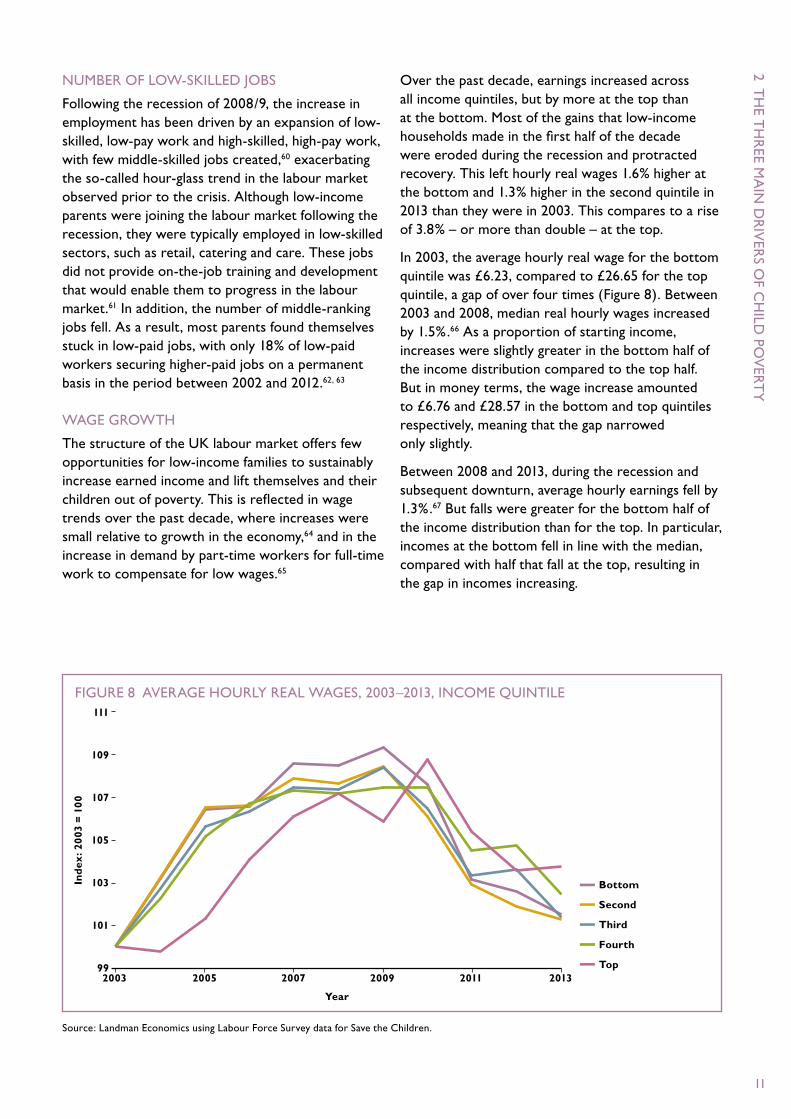
Over the past decade, earnings increased across all income quintiles, but by more at the top than at the bottom. Most of the gains that low-income households made in the first half of the decade were eroded during the recession and protracted recovery. This left hourly real wages 1.6% higher at the bottom and 1.3% higher in the second quintile in 2013 than they were in 2003. This compares to a rise of 3.8% – or more than double – at the top.
In 2003, the average hourly real wage for the bottom quintile was £6.23, compared to £26.65 for the top quintile, a gap of over four times (Figure 8). Between 2003 and 2008, median real hourly wages increased by 1.5%.66 As a proportion of starting income, increases were slightly greater in the bottom half of the income distribution compared to the top half. But in money terms, the wage increase amounted to £6.76 and £28.57 in the bottom and top quintiles respectively, meaning that the gap narrowed only slightly.
Between 2008 and 2013, during the recession and subsequent downturn, average hourly earnings fell by 1.3%.67 But falls were greater for the bottom half of the income distribution than for the top. In particular, incomes at the bottom fell in line with the median, compared with half that fall at the top, resulting in the gap in incomes increasing.
FIGURE 8 AVERAGE HOURLy REAL WAGES, 2003–2013, INCOME QUINTILE
Source: Landman Economics using Labour Force Survey data for Save the Children.
Year
2003 2005 2007 2009 2011 2013
111
109
107
105
103
101
99
Ind
ex: 2
003
= 1
00
Bottom
Second
Third
Fourth
Top
A F
AIR
STA
RT F
OR
EV
ERy
CH
ILD
12
IN-WORK POVERTy
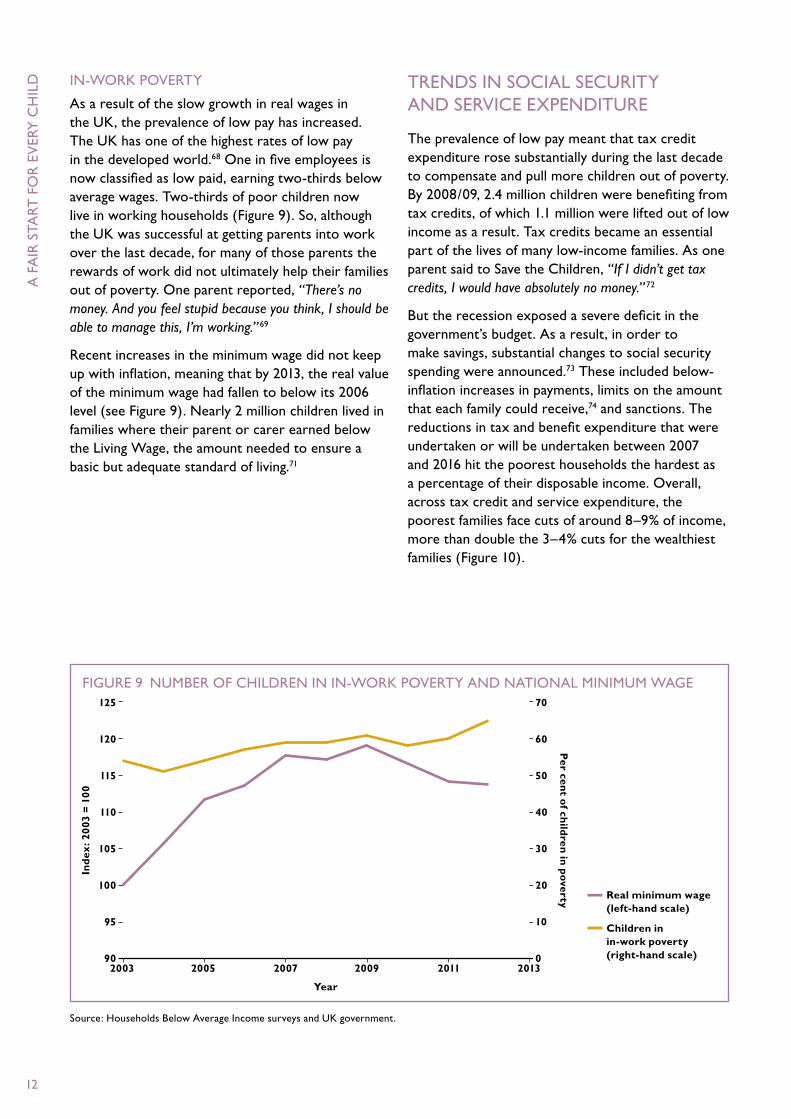
As a result of the slow growth in real wages in the UK, the prevalence of low pay has increased. The UK has one of the highest rates of low pay in the developed world.68 One in five employees is now classified as low paid, earning two-thirds below average wages. Two-thirds of poor children now live in working households (Figure 9). So, although the UK was successful at getting parents into work over the last decade, for many of those parents the rewards of work did not ultimately help their families out of poverty. One parent reported, “There’s no money. And you feel stupid because you think, I should be able to manage this, I’m working.” 69
Recent increases in the minimum wage did not keep up with inflation, meaning that by 2013, the real value of the minimum wage had fallen to below its 2006 level (see Figure 9). Nearly 2 million children lived in families where their parent or carer earned below the Living Wage, the amount needed to ensure a basic but adequate standard of living.71
TRENDS IN SOCIAL SECURITy AND SERVICE ExPENDITURE
The prevalence of low pay meant that tax credit expenditure rose substantially during the last decade to compensate and pull more children out of poverty. By 2008/09, 2.4 million children were benefiting from tax credits, of which 1.1 million were lifted out of low income as a result. Tax credits became an essential part of the lives of many low-income families. As one parent said to Save the Children, “If I didn’t get tax credits, I would have absolutely no money.” 72
But the recession exposed a severe deficit in the government’s budget. As a result, in order to make savings, substantial changes to social security spending were announced.73 These included below-inflation increases in payments, limits on the amount that each family could receive,74 and sanctions. The reductions in tax and benefit expenditure that were undertaken or will be undertaken between 2007 and 2016 hit the poorest households the hardest as a percentage of their disposable income. Overall, across tax credit and service expenditure, the poorest families face cuts of around 8–9% of income, more than double the 3–4% cuts for the wealthiest families (Figure 10).
FIGURE 9 NUMBER OF CHILDREN IN IN-WORK POVERTy AND NATIONAL MINIMUM WAGE
Source: Households Below Average Income surveys and UK government.
Year
2003 2005 2007 2009 2011 2013
125
120
115
110
105
100
95
90
70
60
50
40
30
20
10
0
Ind
ex: 2
003
= 1
00
Real minimum wage (left-hand scale)
Children in in-work poverty (right-hand scale)
Per cen
t of ch
ildren
in p
overty
2 TH
E TH
REE M
AIN
DR
IVER
S OF C
HILD
POV
ERTy
13
LORI’S STORy70
Lori lives with her partner, Rodney, and children, Christopher (six) and Reece (two). She is studying accounts at her local college. Rodney works at a local Italian restaurant and does not have set hours. She has struggled to make ends meet because of a combination of low income and the rising cost of living.
EMPLOyMENT
“It’s hard to say how many hours [my husband] gets a week on average. This week he’s only had 12 hours, a few weeks ago he had 50 or 60 hours – it just depends on how busy it is. you can’t plan your week, you don’t know how much you’re going to be able to afford. I’d like him to have guaranteed hours.
“There aren’t many jobs out there. My friend went for a job at JJB Sports but there were 150 people going for that one job.”
COST OF LIVING
Food
“you’re told you need your five-a-day, but you can’t necessarily do that because you don’t have the funds to buy it. you feel like you’re giving your kids rubbish because it’s cheaper to buy.
“My older son loves his fruit. He complains when there are no blueberries or strawberries. Christopher will say to me, ‘Mum these crisps are fried, not baked.’ The schools are teaching them about healthy food but you can’t always give it at home.”
“When I first got a house [in 2008], we were both paid monthly, so at the end of the month, we’d do a monthly shop and each week we’d pick up milk and bread. That monthly shop was £280. But now it’s about that a fortnight – if I can afford it.”
HEATING
“Gas just seems to disappear before your eyes. Sometimes I find I’m spending £25 a week just on gas alone, but you can’t do without the heat because you have the wee ones. you’ve got to choose between putting new clothes on their back or putting the heating on.”
SCHOOL TRIPS
“We do manage but it’s quite difficult. you’re looking at £12.50 for one school trip. I think the school could do more to raise funds for it. Then you need spending money as well and then it’s usually around Christmas time, which makes it even worse. So you’re paying for school trips, you’re paying for Christmas… It’s quite a drain on your income.”
PHySICAL HEALTH
“The drawers were actually black with damp but the housing [department] don’t do anything about it. They say, ‘you need to open your windows.’ But my windows are constantly open. you can sink your finger into the wall. So we rang the housing [department] and they just sent someone round to paint it, and he said ‘This won’t fix it, it’ll just cover it up.’ What good’s that?
“So we had to move into the living room and Reece’s crib ended up all mouldy, so I replaced it with a cot, and then that got all mouldy. It was never ending. I feel that this is partly to blame for Reece’s health problems.”
DEBT
“I got a pram [from a catalogue] and one day a screw fell off. I had only had the pram three months so I sent it back and that was £400 that went back onto my account. So that took me back to [owing] £100 but they wouldn’t let me spend on it to get another pram. They wouldn’t let me order anything so I refused to pay anything until it was sorted. But then they started charging me £24 a month on top of that – £12 for sending a letter and £12 missed payment. I ended up with £300-odd debt and I couldn’t afford that but there’s nothing I can do. I can’t pay more than I’ve got but they don’t understand that. Why add more on when I just can’t pay it back? It’s terrible. It drives you round the bend.”
a f
air
sta
rt f
or
ev
ery
ch
ild
14
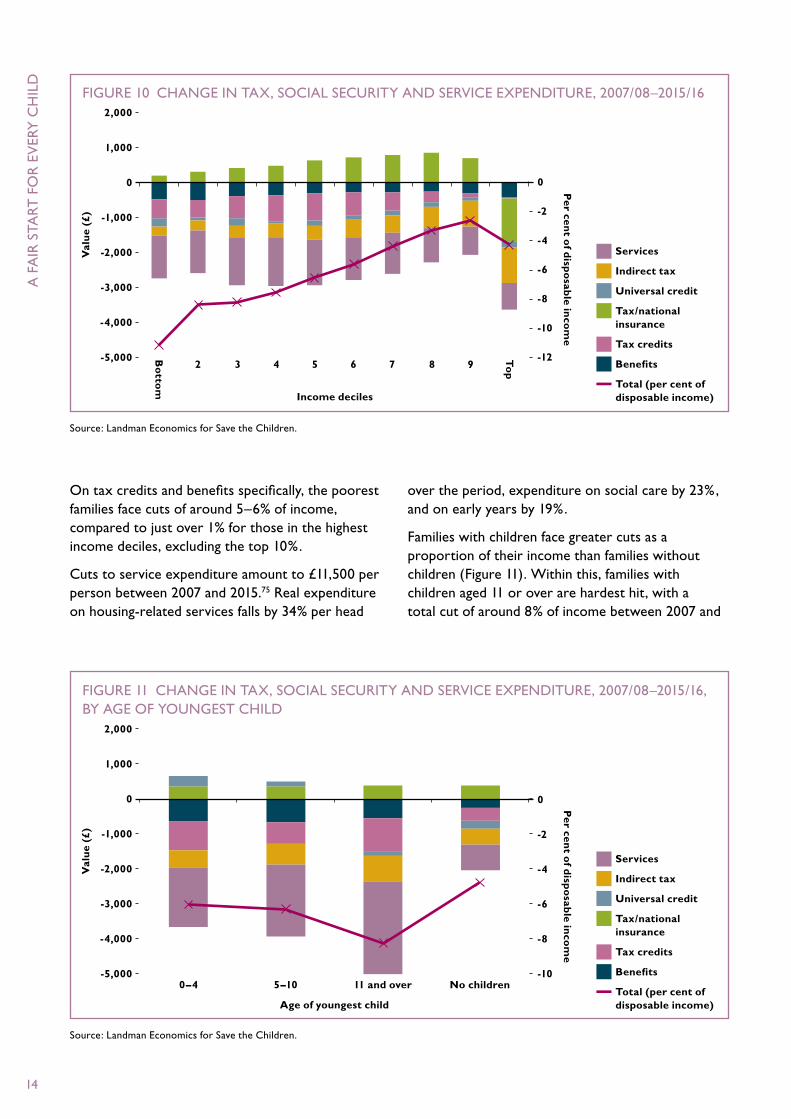
on tax credits and benefits specifically, the poorest families face cuts of around 5–6% of income, compared to just over 1% for those in the highest income deciles, excluding the top 10%.
cuts to service expenditure amount to £11,500 per person between 2007 and 2015.75 real expenditure on housing-related services falls by 34% per head
over the period, expenditure on social care by 23%, and on early years by 19%.
families with children face greater cuts as a proportion of their income than families without children (figure 11). Within this, families with children aged 11 or over are hardest hit, with a total cut of around 8% of income between 2007 and
figure 10 change in tax, social security and service expenditure, 2007/08–2015/16
source: landman economics for save the children.
Income deciles
2 3 4 5 6 7 8 9
2,000
1,000
0
-1,000
-2,000
-3,000
-4,000
-5,000
0
-2
-4
-6
-8
-10
-12
Val
ue
(£)
Per cen
t of d
ispo
sable in
com
e
Bo
ttom
To
p
figure 11 change in tax, social security and service expenditure, 2007/08–2015/16, by age of youngest child
source: landman economics for save the children.
Age of youngest child
0–4 5–10 11 and over No children
2,000
1,000
0
-1,000
-2,000
-3,000
-4,000
-5,000
0
-2
-4
-6
-8
-10
Val
ue
(£)
Per cen
t of d
ispo
sable in
com
e
Services
Indirect tax
Universal credit
Tax/national insurance
Tax credits
Benefits
Total (per cent of disposable income)
Services
Indirect tax
Universal credit
Tax/national insurance
Tax credits
Benefits
Total (per cent of disposable income)
2 TH
E TH
REE M
AIN
DR
IVER
S OF C
HILD
POV
ERTy
15
2016, whereas families where the youngest child is 0–4 years face slightly smaller cuts of 6% of income. At first sight, this may appear to be evidence for the relative protection of very young children from the severity of cuts. However, the importance of early years development, the high costs of raising younger children (discussed below), and the role of income in ensuring a good start for children may mean that, although the size of the cuts families with young children face is smaller, their impact on younger children could be greater. Furthermore, these negative consequences are likely to be compounded as the child gets older, given the sizeable cuts faced by secondary school-aged children.
TRENDS IN THE COST OF LIVING
ExPENDITURE SHARES OF LOW-INCOME FAMILIES
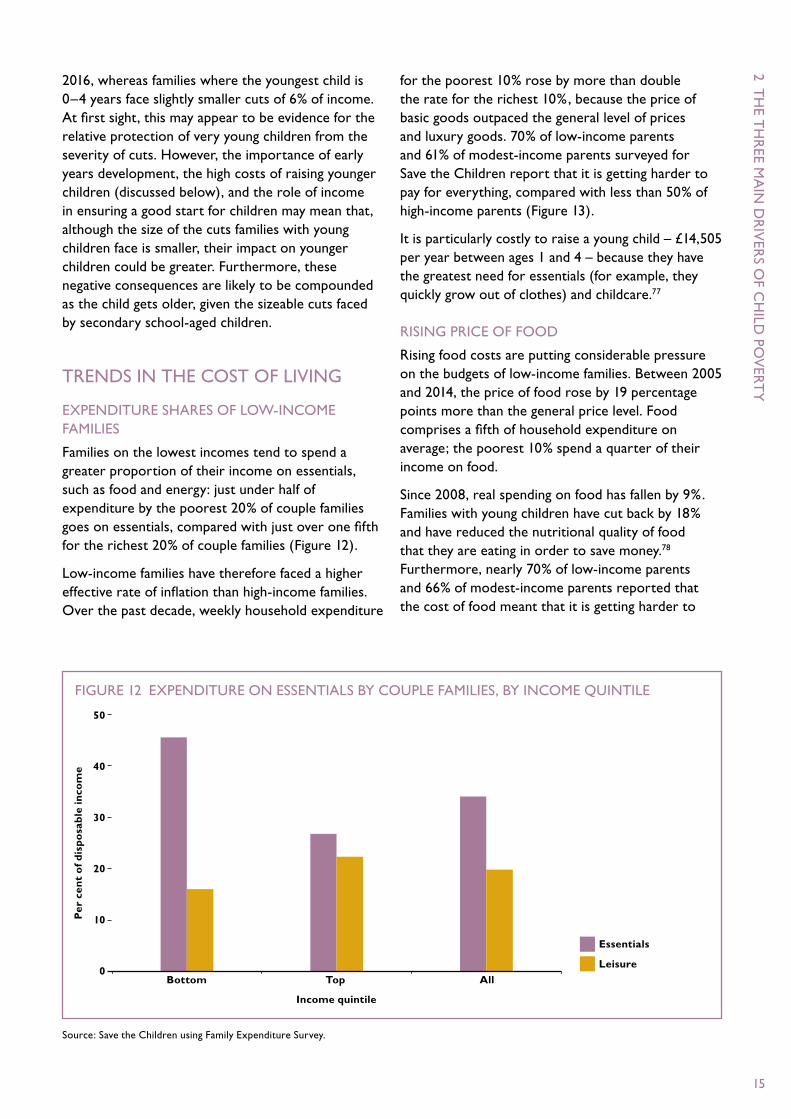
Families on the lowest incomes tend to spend a greater proportion of their income on essentials, such as food and energy: just under half of expenditure by the poorest 20% of couple families goes on essentials, compared with just over one fifth for the richest 20% of couple families (Figure 12).
Low-income families have therefore faced a higher effective rate of inflation than high-income families. Over the past decade, weekly household expenditure
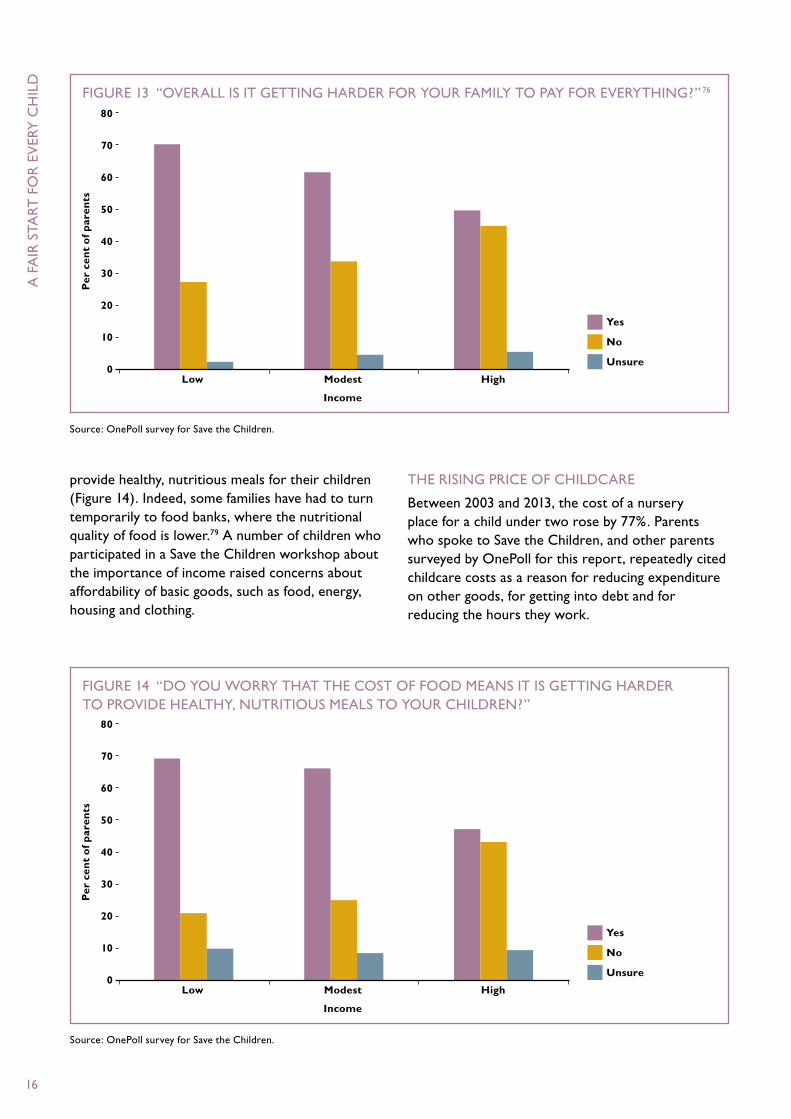
for the poorest 10% rose by more than double the rate for the richest 10%, because the price of basic goods outpaced the general level of prices and luxury goods. 70% of low-income parents and 61% of modest-income parents surveyed for Save the Children report that it is getting harder to pay for everything, compared with less than 50% of high-income parents (Figure 13).
It is particularly costly to raise a young child – £14,505 per year between ages 1 and 4 – because they have the greatest need for essentials (for example, they quickly grow out of clothes) and childcare.77
RISING PRICE OF FOOD
Rising food costs are putting considerable pressure on the budgets of low-income families. Between 2005 and 2014, the price of food rose by 19 percentage points more than the general price level. Food comprises a fifth of household expenditure on average; the poorest 10% spend a quarter of their income on food.
Since 2008, real spending on food has fallen by 9%. Families with young children have cut back by 18% and have reduced the nutritional quality of food that they are eating in order to save money.78 Furthermore, nearly 70% of low-income parents and 66% of modest-income parents reported that the cost of food meant that it is getting harder to
FIGURE 12 ExPENDITURE ON ESSENTIALS By COUPLE FAMILIES, By INCOME QUINTILE
Source: Save the Children using Family Expenditure Survey.
Income quintile
Bottom Top All
50
40
30
20
10
0
Per
cen
t o
f d
isp
osa
ble
inco
me
Essentials
Leisure
A F
AIR
STA
RT F
OR
EV
ERy
CH
ILD
16
provide healthy, nutritious meals for their children (Figure 14). Indeed, some families have had to turn temporarily to food banks, where the nutritional quality of food is lower.79 A number of children who participated in a Save the Children workshop about the importance of income raised concerns about affordability of basic goods, such as food, energy, housing and clothing.
THE RISING PRICE OF CHILDCARE
Between 2003 and 2013, the cost of a nursery place for a child under two rose by 77%. Parents who spoke to Save the Children, and other parents surveyed by OnePoll for this report, repeatedly cited childcare costs as a reason for reducing expenditure on other goods, for getting into debt and for reducing the hours they work.
FIGURE 13 “OVERALL IS IT GETTING HARDER FOR yOUR FAMILy TO PAy FOR EVERyTHING?”76
Source: OnePoll survey for Save the Children.
Income
Low Modest High
80
70
60
50
40
30
20
10
0
Per
cen
t o
f p
aren
ts
Yes
No
Unsure
FIGURE 14 “DO yOU WORRy THAT THE COST OF FOOD MEANS IT IS GETTING HARDER TO PROVIDE HEALTHy, NUTRITIOUS MEALS TO yOUR CHILDREN?”
Source: OnePoll survey for Save the Children.
Income
Low Modest High
80
70
60
50
40
30
20
10
0
Per
cen
t o
f p
aren
ts
Yes
No
Unsure
2 TH
E TH
REE M
AIN
DR
IVER
S OF C
HILD
POV
ERTy
17
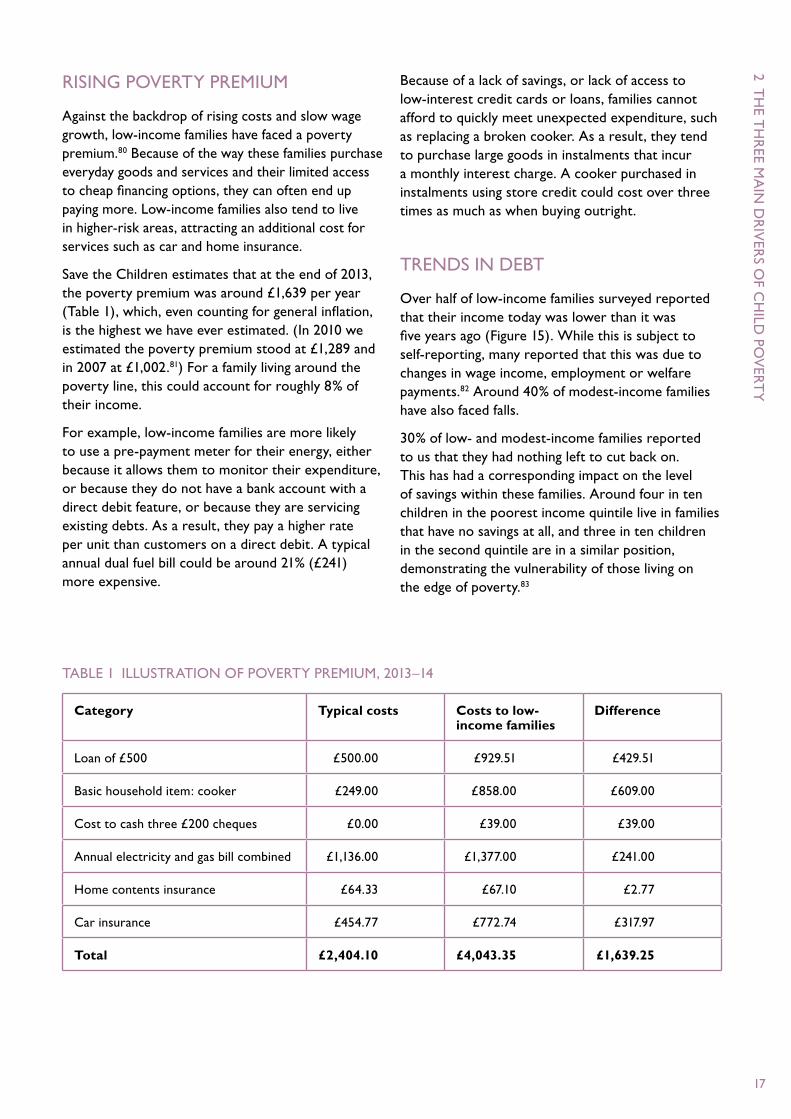
RISING POVERTy PREMIUM
Against the backdrop of rising costs and slow wage growth, low-income families have faced a poverty premium.80 Because of the way these families purchase everyday goods and services and their limited access to cheap financing options, they can often end up paying more. Low-income families also tend to live in higher-risk areas, attracting an additional cost for services such as car and home insurance.
Save the Children estimates that at the end of 2013, the poverty premium was around £1,639 per year (Table 1), which, even counting for general inflation, is the highest we have ever estimated. (In 2010 we estimated the poverty premium stood at £1,289 and in 2007 at £1,002.81) For a family living around the poverty line, this could account for roughly 8% of their income.
For example, low-income families are more likely to use a pre-payment meter for their energy, either because it allows them to monitor their expenditure, or because they do not have a bank account with a direct debit feature, or because they are servicing existing debts. As a result, they pay a higher rate per unit than customers on a direct debit. A typical annual dual fuel bill could be around 21% (£241) more expensive.
Because of a lack of savings, or lack of access to low-interest credit cards or loans, families cannot afford to quickly meet unexpected expenditure, such as replacing a broken cooker. As a result, they tend to purchase large goods in instalments that incur a monthly interest charge. A cooker purchased in instalments using store credit could cost over three times as much as when buying outright.
TRENDS IN DEBT
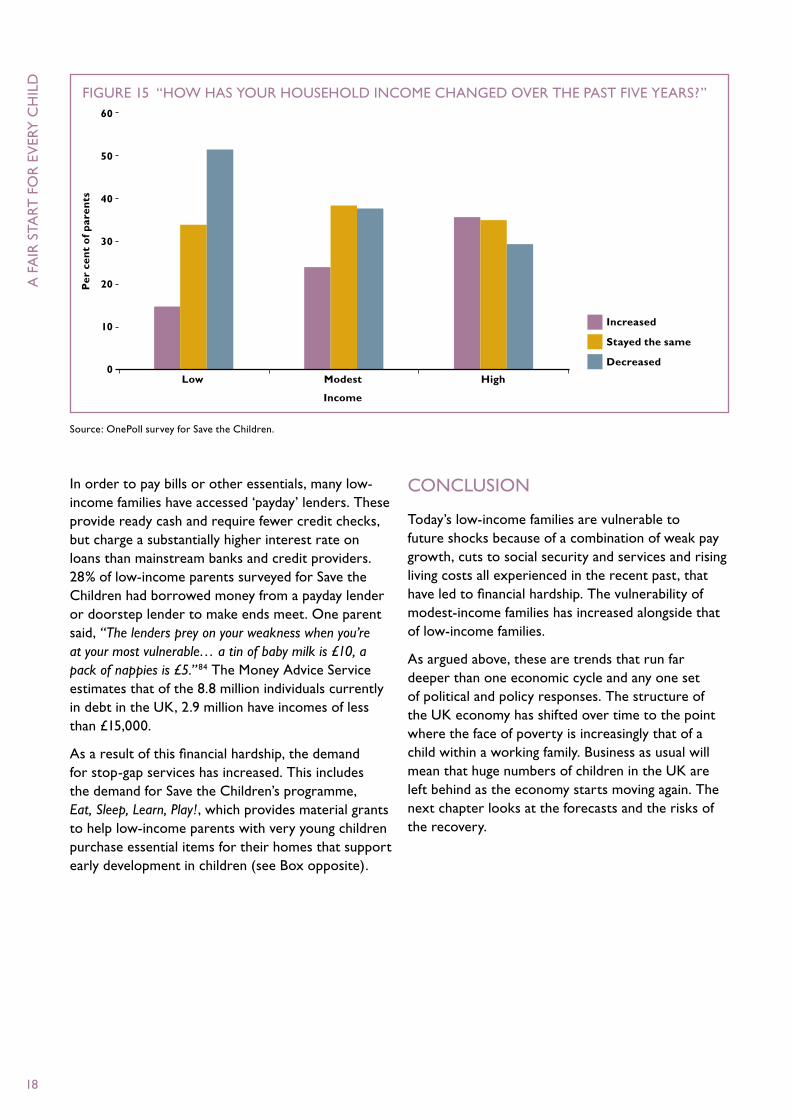
Over half of low-income families surveyed reported that their income today was lower than it was five years ago (Figure 15). While this is subject to self-reporting, many reported that this was due to changes in wage income, employment or welfare payments.82 Around 40% of modest-income families have also faced falls.
30% of low- and modest-income families reported to us that they had nothing left to cut back on. This has had a corresponding impact on the level of savings within these families. Around four in ten children in the poorest income quintile live in families that have no savings at all, and three in ten children in the second quintile are in a similar position, demonstrating the vulnerability of those living on the edge of poverty.83
TABLE 1 ILLUSTRATION OF POVERTy PREMIUM, 2013–14
Category Typical costs Costs to low-income families
Difference
Loan of £500 £500.00 £929.51 £429.51
Basic household item: cooker £249.00 £858.00 £609.00
Cost to cash three £200 cheques £0.00 £39.00 £39.00
Annual electricity and gas bill combined £1,136.00 £1,377.00 £241.00
Home contents insurance £64.33 £67.10 £2.77
Car insurance £454.77 £772.74 £317.97
Total £2,404.10 £4,043.35 £1,639.25
A F
AIR
STA
RT F
OR
EV
ERy
CH
ILD
18
In order to pay bills or other essentials, many low-income families have accessed ‘payday’ lenders. These provide ready cash and require fewer credit checks, but charge a substantially higher interest rate on loans than mainstream banks and credit providers. 28% of low-income parents surveyed for Save the Children had borrowed money from a payday lender or doorstep lender to make ends meet. One parent said, “The lenders prey on your weakness when you’re at your most vulnerable… a tin of baby milk is £10, a pack of nappies is £5.” 84 The Money Advice Service estimates that of the 8.8 million individuals currently in debt in the UK, 2.9 million have incomes of less than £15,000.
As a result of this financial hardship, the demand for stop-gap services has increased. This includes the demand for Save the Children’s programme, Eat, Sleep, Learn, Play!, which provides material grants to help low-income parents with very young children purchase essential items for their homes that support early development in children (see Box opposite).
CONCLUSION
Today’s low-income families are vulnerable to future shocks because of a combination of weak pay growth, cuts to social security and services and rising living costs all experienced in the recent past, that have led to financial hardship. The vulnerability of modest-income families has increased alongside that of low-income families.
As argued above, these are trends that run far deeper than one economic cycle and any one set of political and policy responses. The structure of the UK economy has shifted over time to the point where the face of poverty is increasingly that of a child within a working family. Business as usual will mean that huge numbers of children in the UK are left behind as the economy starts moving again. The next chapter looks at the forecasts and the risks of the recovery.
FIGURE 15 “HOW HAS yOUR HOUSEHOLD INCOME CHANGED OVER THE PAST FIVE yEARS?”
Source: OnePoll survey for Save the Children.
Income
Low Modest High
60
50
40
30
20
10
0
Per
cen
t o
f p
aren
ts
Increased
Stayed the same
Decreased
2 TH
E TH
REE M
AIN
DR
IVER
S OF C
HILD
POV
ERTy
19
EAT, SLEEP, LEARN, PLAy!
Since 2011, Save the Children has run an early-intervention grant programme called Eat, Sleep, Learn, Play! (ESLP!), which provides material goods to low-income parents with very young children to improve a child’s home environment and early development. It operates in areas of the UK with the highest levels of deprivation. More than 12,000 grants have been awarded.
ESLP! provides household items to the following types of families:• familieswithachildunder36monthsold,
or where the mother is 28 or more weeks pregnant at the time of applying
• familieswhereoneormoreofthechild’sparents or carers meets the low-income threshold
• familieswhosehomeislackingessentialitems.
Partners of the programme have reported substantial need for the service (with 63%
reporting a very high level of need and 31% reporting a high level of need) as a result of falling incomes, changes in social security payments and rising living costs (see main text). Many families who are unable to afford basic items outright find themselves getting into debt – for example, as a result of accessing high-interest store credit.
Evidence from the programme suggests that, following the receipt of grants, families experience a reduction in stress, an improvement in their financial situation, and an improvement in basic child outcomes, such as better sleep and more stimulation. All of these programme outcomes can be important in the quality of a child’s early years and their subsequent success (see Chapter 1).
Given the expected further deterioration in the standard of living for low-income families (see Chapter 3), it is likely that demand for this programme will increase further.
20
CHAPTER SUMMARy
As a result of low real-wage growth and announced social security cuts, the Institute for Fiscal Studies expects relative child poverty to rise to 28% in 2014 and to 32% by 2020.85
This chapter examines the impact of these child poverty projections on child outcomes. It then uses new research undertaken for Save the Children by Landman Economics that extrapolates the structural drivers of child poverty discussed in the previous chapter – and which have caused negative outcomes for children over the past decade, whether the economy has been in growth or recession. This analysis reveals that the risks to children in the coming years are higher than have previously been predicted. It is plausible that, despite the anticipated increase in economic growth, low-income families could be materially worse-off by 2020, for the following reasons. • The cost of basic goods, such as food, energy and
childcare, could rise faster than average prices, leading to a deterioration in living standards.– The minimum income standard – the amount
required to ensure a basic but adequate standard of living – could increase by around 13 percentage points relative to inflation.
• Itislikelythatlowpaywillpersistasaproblemfor many families. – If overall wage growth is slower than
anticipated, and the cost of living is higher than anticipated, 2.4 million children – including 1.4 million children under 11 and 0.7 million children under five – could be living in families earning below the living wage by 2020.
• Ifgovernmentdepartmentsareunabletofindrequired savings to meet fiscal consolidation targets, the burden could fall on social security expenditure. Low-income families would be likely to face further cuts as a result.– A combination of slower-than-anticipated
wage growth and higher-than-anticipated social security cuts would lead to an increase in child poverty rates.
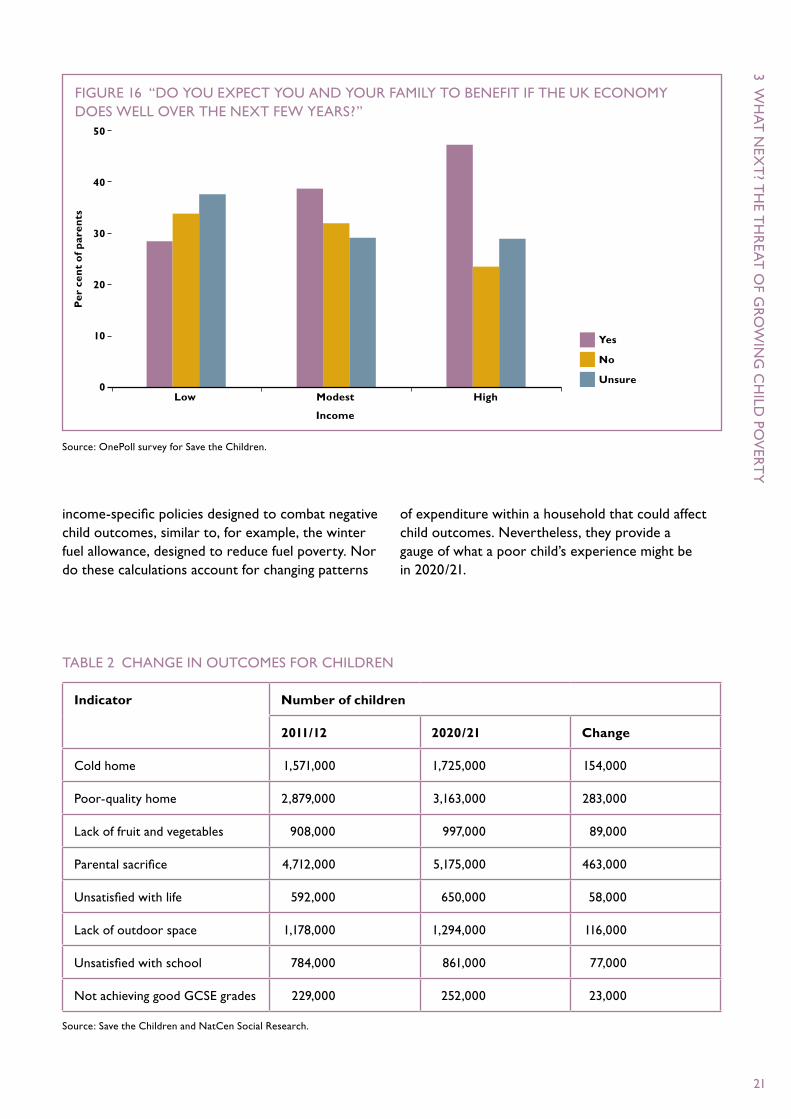
The survey of parents carried out on behalf of Save the Children by OnePoll found that low- and modest-income parents are not optimistic about the benefits that the economic recovery will bring to their families (Figure 16). In addition, children who participated in a Save the Children workshop raised their concerns about affordability of basic goods, such as food, housing, clothes and energy.
RISKS TO CHILD OUTCOMES ON THE INSTITUTE FOR FISCAL STUDIES PROJECTIONS
The Institute for Fiscal Studies expects child poverty to increase between now and 2020. Assuming that the relationship between child poverty and child outcomes remains unchanged, it is possible to infer how many children might experience negative outcomes as a result of this increase in the child poverty rate. This analysis is naturally speculative.
The calculations use data on existing child outcomes collected by NatCen Social Research, on behalf of Save the Children (see Chapter 1). They take the relationship between child poverty and child outcomes in 2012 as given, and apply that relationship to the forecasts for child poverty in 2020 to infer possible changes.
Table 2 illustrates the possible increase in the number of children experiencing negative consequences by 2020. A rise in child poverty rates could mean:• 154,000morechildrenlivinginacoldhome• 463,000morechildrenwhoseparentsmakemajor
sacrifices to care for them• 77,000morechildrenwhoareunhappyatschool• 23,000 more children not achieving 5 A*–C grades
including English and maths.
These calculations are intended to be illustrative. They assume that the relationship between child poverty rates and child outcomes remains constant, and do not take into consideration any potential new
3 WHAt nExt? tHE tHREAt OF GROWInG CHILD POVERtY
3 WH
AT
NEx
T? T
HE T
HR
EAT
OF G
RO
WIN
G C
HILD
POV
ERTy
21
income-specific policies designed to combat negative child outcomes, similar to, for example, the winter fuel allowance, designed to reduce fuel poverty. Nor do these calculations account for changing patterns
of expenditure within a household that could affect child outcomes. Nevertheless, they provide a gauge of what a poor child’s experience might be in 2020/21.
FIGURE 16 “DO yOU ExPECT yOU AND yOUR FAMILy TO BENEFIT IF THE UK ECONOMy DOES WELL OVER THE NExT FEW yEARS?”
Source: OnePoll survey for Save the Children.
Income
Low Modest High
50
40
30
20
10
0
Per
cen
t o
f p
aren
ts
Yes
No
Unsure
TABLE 2 CHANGE IN OUTCOMES FOR CHILDREN
Indicator Number of children
2011/12 2020/21 Change
Cold home 1,571,000 1,725,000 154,000
Poor-quality home 2,879,000 3,163,000 283,000
Lack of fruit and vegetables 908,000 997,000 89,000
Parental sacrifice 4,712,000 5,175,000 463,000
Unsatisfied with life 592,000 650,000 58,000
Lack of outdoor space 1,178,000 1,294,000 116,000
Unsatisfied with school 784,000 861,000 77,000
Not achieving good GCSE grades 229,000 252,000 23,000
Source: Save the Children and NatCen Social Research.
A F
AIR
STA
RT F
OR
EV
ERy
CH
ILD
22
FURTHER RISKS TO CHILDREN FROM GROWTH OF THE DRIVERS OF POVERTy
Chapter 2 outlined three factors that impacted on the likelihood of children living in poverty – wages, social security and cost of living. Low-income families would be better-off in the economic recovery if:• theirwageincomeincreased,eitherfromhigher
pay or the ability to work longer hours• theydidnotfacefurthersocialsecuritycuts• thecostofbasicgoodsrosebylessthanthevalue
of household income.
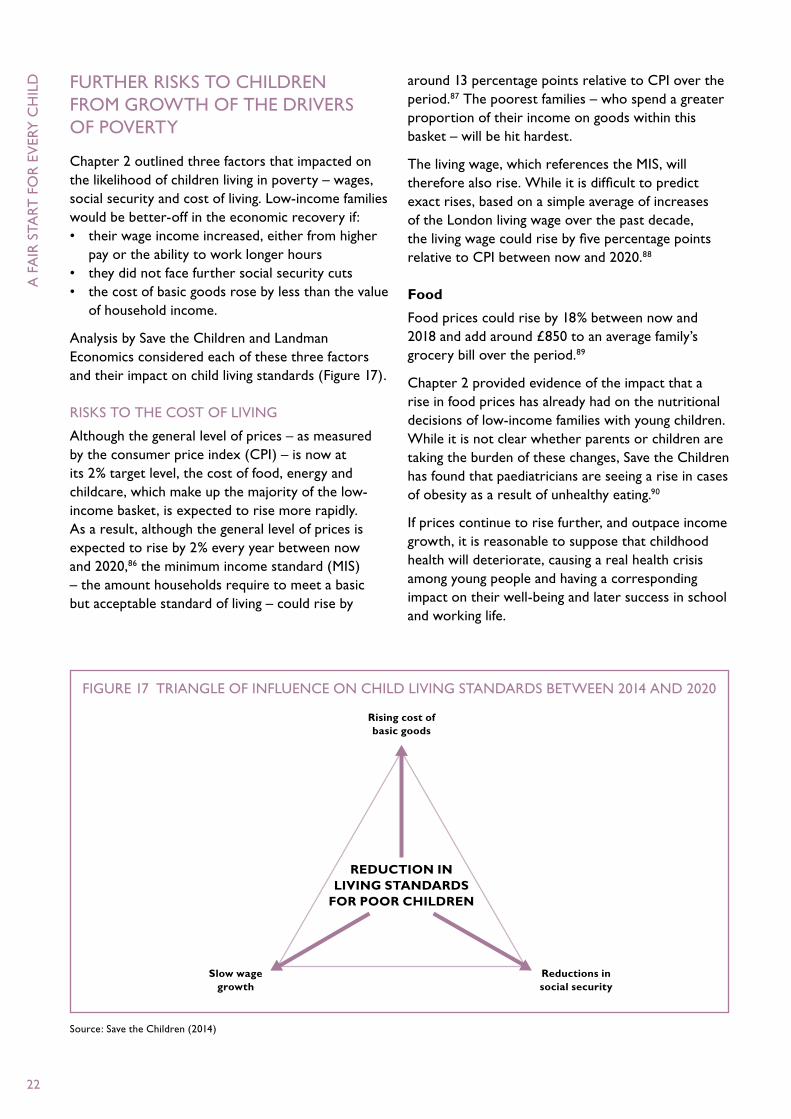
Analysis by Save the Children and Landman Economics considered each of these three factors and their impact on child living standards (Figure 17).
RISKS TO THE COST OF LIVING
Although the general level of prices – as measured by the consumer price index (CPI) – is now at its 2% target level, the cost of food, energy and childcare, which make up the majority of the low-income basket, is expected to rise more rapidly. As a result, although the general level of prices is expected to rise by 2% every year between now and 2020,86 the minimum income standard (MIS) – the amount households require to meet a basic but acceptable standard of living – could rise by
around 13 percentage points relative to CPI over the period.87 The poorest families – who spend a greater proportion of their income on goods within this basket – will be hit hardest.
The living wage, which references the MIS, will therefore also rise. While it is difficult to predict exact rises, based on a simple average of increases of the London living wage over the past decade, the living wage could rise by five percentage points relative to CPI between now and 2020.88
Food
Food prices could rise by 18% between now and 2018 and add around £850 to an average family’s grocery bill over the period.89
Chapter 2 provided evidence of the impact that a rise in food prices has already had on the nutritional decisions of low-income families with young children. While it is not clear whether parents or children are taking the burden of these changes, Save the Children has found that paediatricians are seeing a rise in cases of obesity as a result of unhealthy eating.90
If prices continue to rise further, and outpace income growth, it is reasonable to suppose that childhood health will deteriorate, causing a real health crisis among young people and having a corresponding impact on their well-being and later success in school and working life.
FIGURE 17 TRIANGLE OF INFLUENCE ON CHILD LIVING STANDARDS BETWEEN 2014 AND 2020
Source: Save the Children (2014)
Reductions in social security
Slow wage growth
Rising cost of basic goods
REDUCTION IN LIVING STANDARDS
FOR POOR CHILDREN
3 WH
AT
NEx
T? T
HE T
HR
EAT
OF G
RO
WIN
G C
HILD
POV
ERTy
23
Childcare
Without substantial reform to the childcare market, the cost of pre-school childcare is expected to rise rapidly in the years ahead, and will continue to act as a barrier to entry into work for low-income families with young children. A low-income family could be paying 62% more in childcare costs in 2015–16 compared with 2006–07.91 Recent announcements by the coalition government to provide 85% of childcare costs to recipients of universal credit are welcome.
RISKS TO EMPLOyMENT
Employment rates
As discussed in Chapter 2, although unemployment remains an obstacle for some poor families, the majority of children in poverty now live in working households. Work in itself is no longer the solution to poverty. In addition, the number of children living in families earning below the living wage is rising.
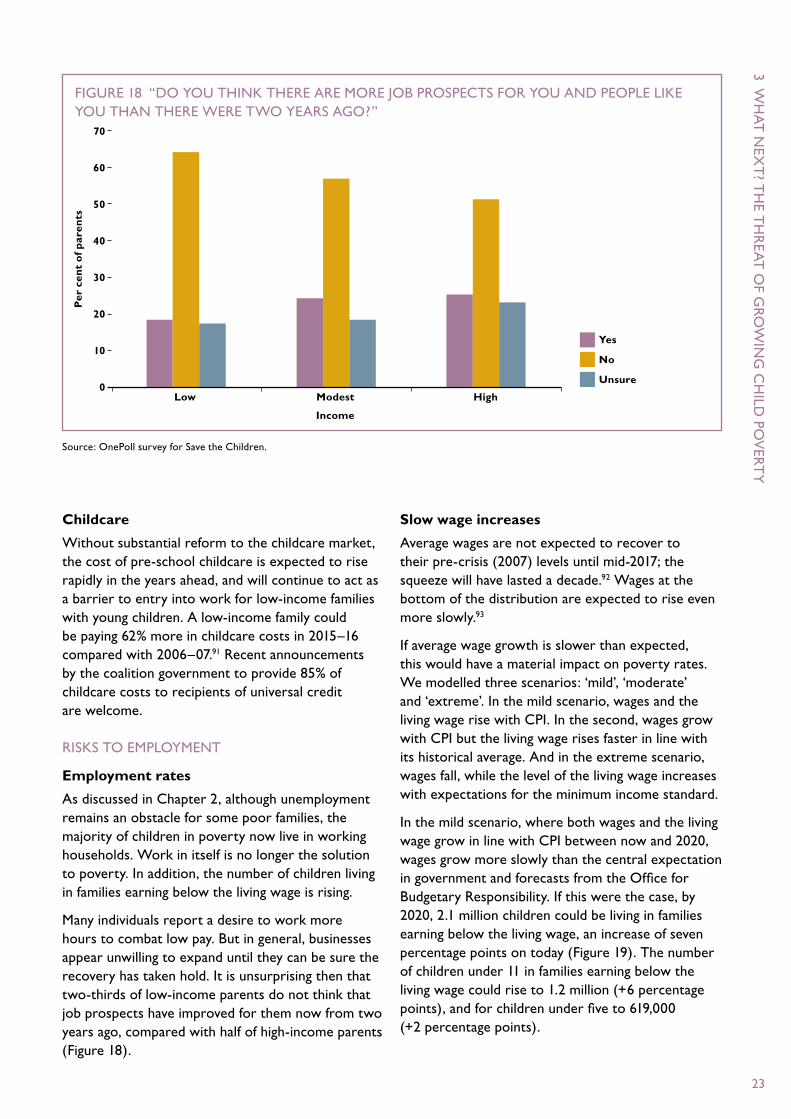
Many individuals report a desire to work more hours to combat low pay. But in general, businesses appear unwilling to expand until they can be sure the recovery has taken hold. It is unsurprising then that two-thirds of low-income parents do not think that job prospects have improved for them now from two years ago, compared with half of high-income parents (Figure 18).
Slow wage increases
Average wages are not expected to recover to their pre-crisis (2007) levels until mid-2017; the squeeze will have lasted a decade.92 Wages at the bottom of the distribution are expected to rise even more slowly.93
If average wage growth is slower than expected, this would have a material impact on poverty rates. We modelled three scenarios: ‘mild’, ‘moderate’ and ‘extreme’. In the mild scenario, wages and the living wage rise with CPI. In the second, wages grow with CPI but the living wage rises faster in line with its historical average. And in the extreme scenario, wages fall, while the level of the living wage increases with expectations for the minimum income standard.
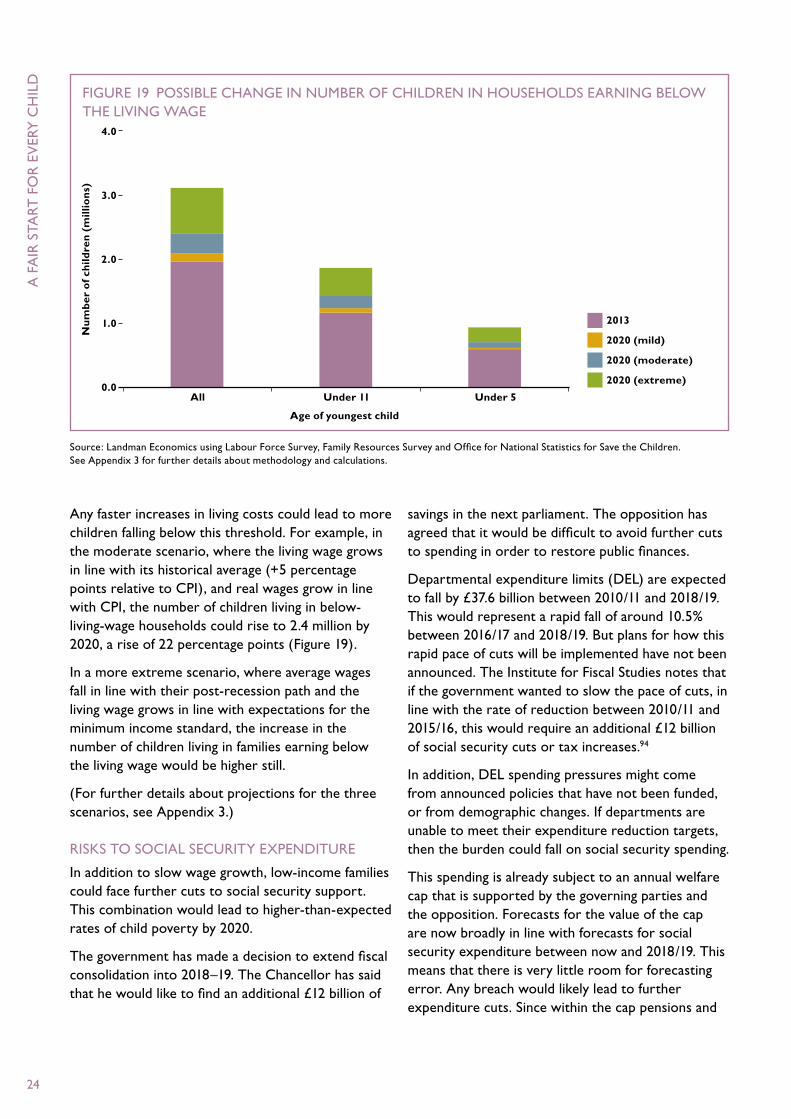
In the mild scenario, where both wages and the living wage grow in line with CPI between now and 2020, wages grow more slowly than the central expectation in government and forecasts from the Office for Budgetary Responsibility. If this were the case, by 2020, 2.1 million children could be living in families earning below the living wage, an increase of seven percentage points on today (Figure 19). The number of children under 11 in families earning below the living wage could rise to 1.2 million (+6 percentage points), and for children under five to 619,000 (+2 percentage points).
FIGURE 18 “DO yOU THINK THERE ARE MORE JOB PROSPECTS FOR yOU AND PEOPLE LIKE yOU THAN THERE WERE TWO yEARS AGO?”
Source: OnePoll survey for Save the Children.
Income
Low Modest High
70
60
50
40
30
20
10
0
Per
cen
t o
f p
aren
ts
Yes
No
Unsure
A F
AIR
STA
RT F
OR
EV
ERy
CH
ILD
24
Any faster increases in living costs could lead to more children falling below this threshold. For example, in the moderate scenario, where the living wage grows in line with its historical average (+5 percentage points relative to CPI), and real wages grow in line with CPI, the number of children living in below-living-wage households could rise to 2.4 million by 2020, a rise of 22 percentage points (Figure 19).
In a more extreme scenario, where average wages fall in line with their post-recession path and the living wage grows in line with expectations for the minimum income standard, the increase in the number of children living in families earning below the living wage would be higher still.
(For further details about projections for the three scenarios, see Appendix 3.)
RISKS TO SOCIAL SECURITy ExPENDITURE
In addition to slow wage growth, low-income families could face further cuts to social security support. This combination would lead to higher-than-expected rates of child poverty by 2020.
The government has made a decision to extend fiscal consolidation into 2018–19. The Chancellor has said that he would like to find an additional £12 billion of
savings in the next parliament. The opposition has agreed that it would be difficult to avoid further cuts to spending in order to restore public finances.
Departmental expenditure limits (DEL) are expected to fall by £37.6 billion between 2010/11 and 2018/19. This would represent a rapid fall of around 10.5% between 2016/17 and 2018/19. But plans for how this rapid pace of cuts will be implemented have not been announced. The Institute for Fiscal Studies notes that if the government wanted to slow the pace of cuts, in line with the rate of reduction between 2010/11 and 2015/16, this would require an additional £12 billion of social security cuts or tax increases.94
In addition, DEL spending pressures might come from announced policies that have not been funded, or from demographic changes. If departments are unable to meet their expenditure reduction targets, then the burden could fall on social security spending.
This spending is already subject to an annual welfare cap that is supported by the governing parties and the opposition. Forecasts for the value of the cap are now broadly in line with forecasts for social security expenditure between now and 2018/19. This means that there is very little room for forecasting error. Any breach would likely lead to further expenditure cuts. Since within the cap pensions and
FIGURE 19 POSSIBLE CHANGE IN NUMBER OF CHILDREN IN HOUSEHOLDS EARNING BELOW THE LIVING WAGE
Source: Landman Economics using Labour Force Survey, Family Resources Survey and Office for National Statistics for Save the Children. See Appendix 3 for further details about methodology and calculations.
Age of youngest child
All Under 11 Under 5
4.0
3.0
2.0
1.0
0.0
Nu
mb
er o
f ch
ildre
n (
mill
ion
s)
2013
2020 (mild)
2020 (moderate)
2020 (extreme)
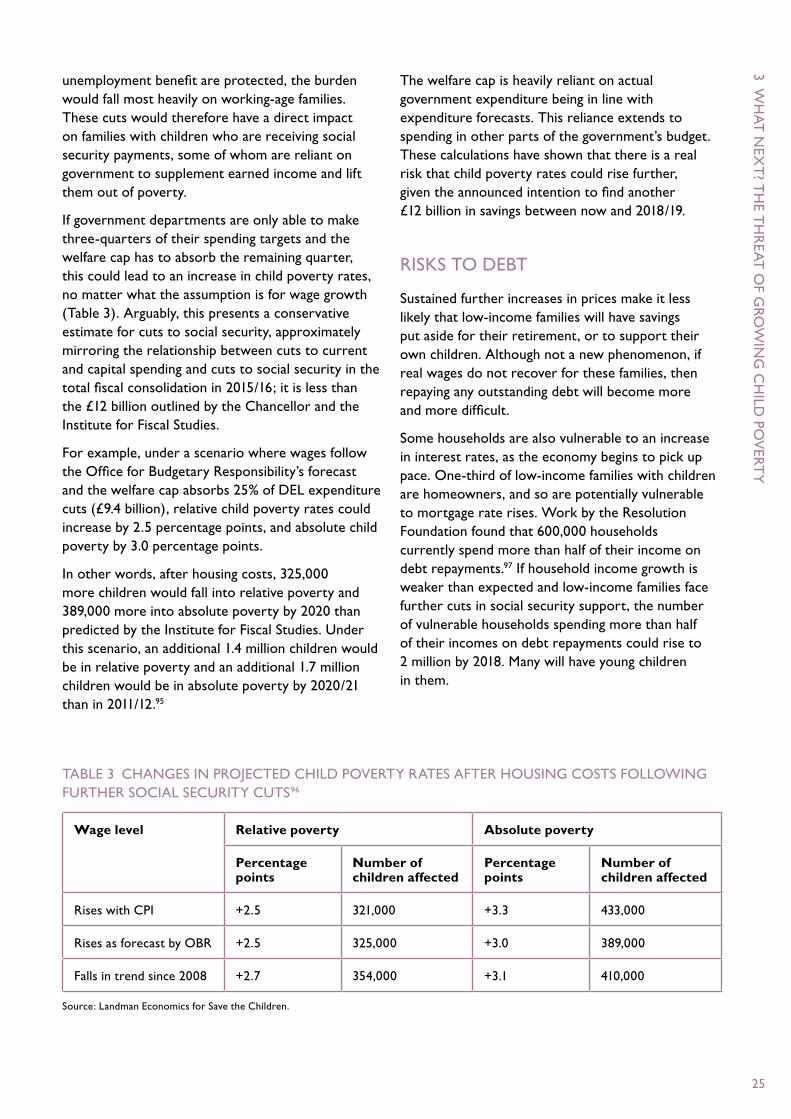
3 WH
AT
NEx
T? T
HE T
HR
EAT
OF G
RO
WIN
G C
HILD
POV
ERTy
25
unemployment benefit are protected, the burden would fall most heavily on working-age families. These cuts would therefore have a direct impact on families with children who are receiving social security payments, some of whom are reliant on government to supplement earned income and lift them out of poverty.
If government departments are only able to make three-quarters of their spending targets and the welfare cap has to absorb the remaining quarter, this could lead to an increase in child poverty rates, no matter what the assumption is for wage growth (Table 3). Arguably, this presents a conservative estimate for cuts to social security, approximately mirroring the relationship between cuts to current and capital spending and cuts to social security in the total fiscal consolidation in 2015/16; it is less than the £12 billion outlined by the Chancellor and the Institute for Fiscal Studies.
For example, under a scenario where wages follow the Office for Budgetary Responsibility’s forecast and the welfare cap absorbs 25% of DEL expenditure cuts (£9.4 billion), relative child poverty rates could increase by 2.5 percentage points, and absolute child poverty by 3.0 percentage points.
In other words, after housing costs, 325,000 more children would fall into relative poverty and 389,000 more into absolute poverty by 2020 than predicted by the Institute for Fiscal Studies. Under this scenario, an additional 1.4 million children would be in relative poverty and an additional 1.7 million children would be in absolute poverty by 2020/21 than in 2011/12.95
The welfare cap is heavily reliant on actual government expenditure being in line with expenditure forecasts. This reliance extends to spending in other parts of the government’s budget. These calculations have shown that there is a real risk that child poverty rates could rise further, given the announced intention to find another £12 billion in savings between now and 2018/19.
RISKS TO DEBT
Sustained further increases in prices make it less likely that low-income families will have savings put aside for their retirement, or to support their own children. Although not a new phenomenon, if real wages do not recover for these families, then repaying any outstanding debt will become more and more difficult.
Some households are also vulnerable to an increase in interest rates, as the economy begins to pick up pace. One-third of low-income families with children are homeowners, and so are potentially vulnerable to mortgage rate rises. Work by the Resolution Foundation found that 600,000 households currently spend more than half of their income on debt repayments.97 If household income growth is weaker than expected and low-income families face further cuts in social security support, the number of vulnerable households spending more than half of their incomes on debt repayments could rise to 2 million by 2018. Many will have young children in them.
TABLE 3 CHANGES IN PROJECTED CHILD POVERTy RATES AFTER HOUSING COSTS FOLLOWING FURTHER SOCIAL SECURITy CUTS96
Wage level Relative poverty Absolute poverty
Percentage points
Number of children affected
Percentage points
Number of children affected
Rises with CPI +2.5 321,000 +3.3 433,000
Rises as forecast by OBR +2.5 325,000 +3.0 389,000
Falls in trend since 2008 +2.7 354,000 +3.1 410,000
Source: Landman Economics for Save the Children.
A F
AIR
STA
RT F
OR
EV
ERy
CH
ILD
26
A combination of these factors make it likely that more families will have to turn to emergency programmes to act as temporary stop gaps (see Box on Save the Children’s grant programme, Eat, Sleep, Learn, Play!, page 19, and Box on Lori’s story, page 13, for evidence of pressure on finances and higher debt levels).
INTERGENERATIONAL POVERTy
There is a long-term risk to the nation if it stands by and lets an ever-growing number of children slide into poverty. The consequences of rising poverty in terms of a deterioration in the educational attainment of children could have a profound and material impact on the health of the economy.
In particular, skills have an impact on the shape and productivity of the economy as a whole. As Chapter 2 outlined, the UK has a small set of very highly-skilled workers and a long tail of low-skilled workers, with a declining share in between. This trend is not new. As the share of low-skilled workers increases, their bargaining power decreases. Similarly, as the share of high-skilled workers remains scarce, firms continue to increase wages so as to attract and retain high-skilled labour. As a result, the gap between the earnings of high-skilled and low-skilled workers widens further.98
But if the UK had, in recent decades, taken action to close the achievement gap at age 11, this would have led to a more skilled workforce, with higher bargaining power, the ability to contribute to more balanced economic growth and a reduction in inequality. In particular, GDP in 2020 could have
been around £30 billion or 1.8 percentage points higher.99 Improving a child’s life chances could have a significant impact on the health of the economy and ensure a balanced and stable recovery. But deterioration in child outcomes today could lead to a weaker-than-expected recovery tomorrow, as these children grow up without the necessary skills to contribute to UK productivity.
CONCLUSION
Weaker-than-anticipated wage growth, further cuts to social security expenditure and higher-than-expected rises in the cost of living could lead to more children living in poverty by 2020 than currently forecast. Even accepting the government’s central expectation for wages, costs and social security, child poverty is still expected to rise. If wages follow the Office for Budget Responsibility forecast and government departments make three-quarters of their spending cut targets, with the welfare cap having to absorb the remaining quarter, this could lead by 2020 to 325,000 more children in poverty than the Institute for Fiscal Studies has already predicted. This would see an overall increase of 1.4 million children in poverty from the latest figures.100
By 2020 the child poverty rate would be among the highest ever recorded in the UK, and the highest for a generation. This will lead to a material deterioration in the quality of childhoods and life chances of poor children.
The next chapter proposes possible policy actions to combat these negative effects on children.
27
BACKGROUND
Our analysis shows that the combined effects of a challenging labour market over a long period, more recent government spending cuts and sustained rising living costs have hit low-income families with children hard. Our survey of parents suggests that, in spite of the UK beginning to experience an economic recovery, low-income families and some middle-income families are continuing to be placed under great strain. Our new analysis shows that this triple whammy of flat wage growth, pressure on social security spending and the rising cost of living are likely to continue to exert pressure on the budgets of low-income households for years to come.
There is then a real danger that, as the economy recovers, children will be left behind. The consequences will be continuing falls in the quality of childhood for children living in low-income households, and increasing inequalities between those children and their better-off peers in experiences and eventual outcomes. This report shows just how different childhood is for children in the poorest households compared with other children. It’s against this backdrop that UK child poverty rates between now and 2020 are expected to soar.
This chapter sets out the areas any potential government needs to explore for a strategy to tackle the drivers behind child poverty. As all parties have ruled out a growth in social security spending for working-age families, the political debate has moved towards tackling the underlying causes of poverty. The options below cover the broad range of these causes. We also call on politicians to have the courage to speak honestly about where they stand on the 2020 target to end child poverty, set out in the Child Poverty Act 2010 and signed with cross-party support just four years ago, but now very unlikely to be honoured.
OPTIONS FOR POLICy-MAKERS TO ADDRESS THE UNDERLyING DRIVERS OF CHILD POVERTy
If cash transfers are not to be the only weapon in fighting child poverty, it is critical that policy-makers address the underlying drivers of poverty, in order to eradicate it in the long term.
However, tackling the drivers of poverty demands a strategic approach and sustained work over several parliaments. No party can credibly claim to have a viable strategy for how to achieve this.
We set out here a number of options for policy makers for tackling child poverty.
MAKING WORK PAy AND LABOUR MARKET INTERVENTIONS
The living wage
Employers across the private, public and third sectors have adopted the living wage. Set at a rate considerably higher than the minimum wage, the living wage reflects the income needed to meet the basic cost of living. Many employers have found that adopting the living wage has been good for productivity and staff retention. The government benefits through reductions in the benefits and tax credits bill. Widespread adoption of the living wage by employers would help ease concerns set out in this report about the ongoing prevalence of low pay.
We believe policy-makers should: • activelypromotetake-upofthelivingwage
among employers.
The minimum wage
The failure over a number of years to uprate the national minimum wage in line with inflation has weakened it as a tool for tackling child poverty. It is to be welcomed that it will rise by 3% – higher than inflation – in 2014. Further above-inflation increases in the minimum wage are required to make up for its lost value.
4 POLICY OPtIOns: mAPPInG tHE REsPOnsE
A F
AIR
STA
RT F
OR
EV
ERy
CH
ILD
28
We believe policy-makers should:• increasethenationalminimumwageatarate
higher than inflation each year so that it reaches a level that reflects the earnings required to achieve a basic standard of living as soon as possible.
Universal credit
Over the coming years, universal credit will replace a range of working-age benefits and tax credits. Steps could be taken that result in universal credit having a strong impact on parental employment rates, particularly among second earners, and so reduce child poverty.
We believe policy-makers should:• reducetheplannedtaperrateunderuniversal
credit from 65% to 55%. This would put more money into the pockets of low-earners and ensure that all claimants have greater incentives to work under universal credit compared with the current system.
• introduceasecondearnersdisregardsothatsecond earners in couples can keep more of their earnings when they move into work. This would improve the position of second earners, predominantly women, in the labour market and could sit as part of the wider maternal employment strategy discussed below.
Labour market interventions
Those countries that do best on child poverty tend to have higher employment rates among women and single parents, and a much smaller gap between maternal and female employment rates.101 In the UK, the single parent employment rate still falls well short of the employment rate for mothers in couples and, in turn, the employment rate for mothers in couples falls short of that for fathers in couples.102 High childcare costs can make the labour market particularly challenging for parents of children under five.
If we are to create an environment in which employment offers a genuine route out of poverty for all families, we need to see major structural changes to the UK labour market. These structural changes need to result in a labour market that offers more in terms of job security, family-friendly working conditions, in-work progression and pay.
We believe policy-makers should:• developastrategyforimprovingtheposition
parents face in the labour market, with a particular focus on single parents and second earners in couples.
FAMILy INCOME
Family benefits
Early in the 2010 Parliament, a number of cuts to payments specifically targeted at families with young children were made. Cuts to the health in pregnancy grants (worth £190 to expectant mothers, saving government £150 million), Sure Start maternity grants (saving government £75 million), Child Trust Fund payments and the cancelling of the planned ‘toddler tax credit’ (worth £545 to families with very young children, saving the government £295 million) reduced the extent to which the social security system recognises the extra costs faced by families with pre-school-age children.
All the major political parties have acknowledged the importance of children’s development during the early years. We have discussed in this report how low income can have particularly harsh effects on young children, especially if parents are unable to provide them with a warm home and a decent diet. Ensuring a decent income for all families with young children is the least we should expect from the social security system.
We believe policy-makers should:• investinlow-incomefamilieswithyoungchildren
through the introduction of new social security payments targeted specifically at that group.
Protection from further cuts
All major parties have agreed to a cap on welfare spending. The cap is a blunt tool. While reducing social security spending should not be seen as an end in itself, a more effective means of keeping down spending would also benefit recipients of support if it addressed the causes of high social security spending. In particular, a major investment in social housing could help reduce the housing benefit bill, as outlined below. Above-inflation increases in the national minimum wage and widespread adoption of the living wage, as discussed above, would help drive down the bill for tax credits.
We call on all political parties to:• setoutclearlyhowtheyintendtoimplementthe
welfare cap in a way that doesn’t hurt children living in poverty.
4 POLIC
y O
PTIO
NS: M
APPIN
G T
HE R
ESPON
SE
29
EASING THE PRESSURE ON FAMILy BUDGETS AND ADDRESSING THE POVERTy PREMIUM
Poverty premium
There are a number of measures that can be taken in the short term to ease the pressure on low-income households’ budgets. Our report finds that high and rising costs in areas of essential spending have exerted downward pressure on the budgets of low- and modest-income families. Families in poverty are also at risk of a poverty premium, paying more for everyday goods and services, which reduces their disposable income even further. New analysis by Save the Children set out in this report finds that families can face a poverty premium of up to £1,639 a year. A number of steps are outlined below for policy-makers to address the cost of living and reduce the poverty premium, helping free up money among low-income families.
Housing
The housing benefit bill has risen steadily over recent decades – reaching around £24 billion in 2013/14. Since the financial crash of 2008, the number of in-work housing benefit claimants has risen considerably, putting even greater pressure on resources. A 2013 report by the National Housing Federation found a 104% increase in in-work housing benefit claimants since 2009, and warned that the cost of renting would take up an increasing share of people’s disposable income over the coming years.
We believe policy-makers should: • boostthesupplyofsocialhousingsothat
the housing benefit bill is brought down in a sustainable way, while providing high-quality and stable affordable housing for families.
Food poverty
We’ve seen how the cost of food is presenting a particular challenge to low-income families, with parents skipping meals and worried about providing a good and nutritional diet to their children. Food hand-outs through, for example, food banks are a sticking plaster and don’t represent a sustainable solution.
We believe political parties need to:• setoutaclearstrategyforaddressingfood
poverty which deals with the causes, not just the consequences.
Energy costs
As with food costs, energy costs account for a greater proportion of low-income households’ spending. In addition, many low-income families find that they end up spending more because they pay for their energy bills through prepayment meters. The consequences for children of living in a cold home can be severe, in terms of both their physical health and their development.
The warm homes discount scheme provides a payment of £135 towards the energy bills of low-income households. Recent research suggests that 1.9 million children living in poverty aren’t benefiting from this scheme – with different energy providers operating different eligibility criteria for households with children.103
We believe policy-makers and energy companies should:• ensurethatallcustomers,regardlessofpayment
method, can access the most cost-effective tariffs and deals.
We believe policy-makers should:• providethewarmhomediscounttoallfamilies
with children living in poverty.
Access to cash/credit
Credit unions can offer an affordable alternative to high-interest loans, but their use in the UK has been limited. However, there are promising signs that the credit union sector has grown considerably over the last ten years.104 Recent reforms – which mean that credit unions can offer services to a wider client base – and the Credit Union Expansion Project aim to support the growth of the sector. The sector needs to continue to expand sustainably.
Local welfare assistance schemes
From April 2013 the community care grants and crisis loans elements of the Social Fund were devolved to local authorities in England, and devolved governments in Wales and Scotland. There has been considerable concern about these reforms because local authorities are not required to run replacement schemes, and because funding from central government for the replacement schemes was cut.
Community care grants were payments made to support people to live independently. Crisis loans were available to people on low incomes facing a short-term financial crisis. As Save the Children
A F
AIR
STA
RT F
OR
EV
ERy
CH
ILD
30
knows from our own emergency grants programme, the right help at the right time can make a huge difference to families living on the edge.
A recent announcement that central government funding for local welfare assistance schemes would cease from April 2015 is likely to put further limitations on the amount of support available. There is a real risk that support schemes will wither away in many areas. It is highly likely that, no longer able to access such support, parents on low incomes will be forced to turn to high-interest lenders, both legal and illegal.
To ensure the existence of adequate welfare assistance schemes in all areas, we are calling for:• continuationofcentralgovernmentfundingfor
local welfare assistance schemes.• arequirementoflocalauthoritiestoprovide
welfare assistance schemes. These schemes should include the provision of low-interest cash loans.
Tax policy
Future budgets should recognise that low-income households have been hit hardest by spending cuts and have missed out on one of the largest areas of government spending, namely increases in the personal tax allowance (the point at which people start paying income tax on their earnings). Despite fiscal consolidation, government has spent a considerable amount of money on this policy. It does nothing to benefit the very poorest households, who already fall below the personal tax allowance, and the benefits are spread relatively thinly over a large number of households. The total cost to government of increases to the personal tax allowance between 2011 and 2015 is estimated to be between £12 billion and £13 billion per annum. This money would have a much greater impact on poverty if spent on the measures set out in this chapter.
THE CHOICE THAT POLITICIANS FACE
The 2020 child poverty targets will not be met if we continue on the current course, or any realistic alternative – a fact that has been widely acknowledged by analysts and commentators. Despite this, political parties continue to state their commitment to the child poverty targets. This position is not credible and not sustainable. A vacuum has been created. Politicians are not being held to account for children in poverty.
While there have been some positive measures aimed at supporting families living in poverty, the cumulative impact of recent policies that have been introduced – and of policies that are due to be introduced in the coming years – has been and will be to increase child poverty considerably between now and 2020. Too much focus has been placed on supporting those on middle-incomes rather than the poorest families.
The child poverty strategy unveiled by the government earlier this year does not go nearly far enough towards meeting its stated aims, while the opposition has not introduced an alternative plan to tackle child poverty to back up their focus on living standards.
Politicians have a choice to make.
Either they should re-commit to the 2020 child poverty targets and come forward urgently with a credible and necessarily radical strategy for how they will achieve this, complete with sufficient fiscal and policy commitments. Many of these could be drawn from those listed above.
Or, if it is their belief that regrettably the 2020 targets cannot be met, politicians should be open with the public and admit this. They must instead introduce the most ambitious, achievable interim aims to tackle child poverty by 2020, with a corresponding plan.
The status quo is not acceptable. The situation and risk grows worse for children in poverty in the UK, but the political discussion and policy response remains stuck in time. Fixing this is a responsibility for all political leaders.
In the following chapter we set out our call for a fair start for every child.
31
If we are not to end child poverty by 2020, then politicians need to decide what can be done by then and where their focus will be. This report has highlighted the particular cost of child poverty on younger children. Our priority is for all children to have a fair start by 11. To achieve a fair start we are calling for the following:
1 Every family to have access to high-quality and affordable childcare
2 A minimum income guarantee for the families of children under five
3 A national mission for all children to be reading well by 11
1 EVERy FAMILy TO HAVE ACCESS TO HIGH-QUALITy AND AFFORDABLE CHILDCARE
Childcare represents a major barrier to employment for parents looking to move into work. Many parents find that the cost of paying for childcare means that they are little better off in work. Parents of pre-school children face the greatest challenge of balancing work and childcare commitments.
There have been some recent positive announcements about the level of support towards childcare costs that will be made available under universal credit and many parents are able to take advantage of free hours of childcare when their children are of pre-school age. However, childcare costs are likely to remain a major issue and, as we have set out in this report, will continue to increase
over coming years. These high costs will prevent many low-income parents, particularly mothers, from participating in the labour market.
It is also vital to improve the quality of childcare and early years provision. The quality of provision has a demonstrable impact on early development, including in speech and language, which has a significant impact on children’s early learning, including their ability to learn to read. Children from the poorest families are less likely to attend high-quality settings, making improving quality across the board a vital component for improving the life chances of poor children.
Policy-makers should work towards minimising the impact of childcare costs on household budgets for low-income families, while ensuring that childcare is available, affordable and of high quality in all areas.
2 A MINIMUM INCOME GUARANTEE FOR THE FAMILIES OF CHILDREN UNDER FIVE
Poverty affects children under five in particular; both in terms of immediate impact and future life chances, and this group are at greatest risk of poverty. All political parties have agreed that as a nation we can and must afford to ensure our older generations have sufficient income to lead a decent standard of life. Given the particularly detrimental impact of poverty on very young children, we call on the political parties to prioritise support for this group, in the same way that pensioners have largely been protected from austerity measures. We believe that as a nation we can and must ensure our youngest generation is similarly protected.
5 sAVE tHE CHILDREn’s CALL FOR A FAIR stARt FOR EVERY CHILD

A F
AIR
STA
RT F
OR
EV
ERy
CH
ILD
32
We call on the government to introduce a minimum income guarantee, to ensure every family with children under five has sufficient resources to support their healthy development and a good start to their childhood ahead of the primary school years. The targets set out in the Child Poverty Act remain the most universally agreed framework for eradicating child poverty. We propose that at the very least the 2020 targets are met for children under five.
The mix of how this is achieved, through labour market interventions, social security or investment in services, is for our political leaders. We propose the introduction of:
• investmentinfamilybenefits,childcareandhousing
• labourmarketinterventionsthatsupportparentsinto decent, secure, family friendly and well-paid jobs
• protectionofunder-fivesfromfurthercutstospending on social security and services. This should include a guarantee, should the welfare cap be reached, that ensures children under five are not affected.
3 A NATIONAL MISSION FOR ALL CHILDREN TO BE READING WELL AND WITH ENJOyMENT By 11
The UK remains one of the most unfair countries in the developed world – the lottery of birth still determines millions of children’s chances in life. Through no fault of their own, poor children are far more likely to fall behind in reading, a critical skill in their education.
Reading well and with enjoyment is a basic need for any child to get on in life: when children read well, it opens up opportunities for them to fulfil their potential. When they fall behind this closes doors and reduces opportunities. It’s a huge challenge. But as a country we have a big opportunity: by bringing together a national mission – including government, schools, businesses, civil society and the media we can be the generation that ends the scandal of children reaching the age of 11 not reading well.
Our three-part call for a fair start for all children will not eradicate child poverty alone. But if introduced, it would play a major role in improving life experiences for children in poorer families and ensuring poverty does not continue across generations. Having once promised so much, a fair start up to the age of 11 is the least we, as a nation, owe our children by 2020.
33
APPEnDIx 1: sAVE tHE CHILDREn WORKsHOPs WItH YOUnG PEOPLE
In late March, Save the Children held two sessions with pupils in years 5 and 6 (ages 9–11 years). The sessions gave pupils the opportunity to say what difficulties they thought a child in a low-income family would face across a range of aspects of their life.
They were also given the chance to offer changes to make life better for children in families on a low income. The quotes used in the main text have been taken directly from these discussions but anonymised to protect the identity of the children involved.
APPEnDIx 2: sAVE tHE CHILDREn sURVEY OF PAREnts
Between February and March 2014, a survey of 4,000 low, modest and high-income parents with children aged 16 and under was undertaken on behalf of Save the Children by OnePoll. Survey participants were from all UK regions. Low-income parents had an annual salary of £16,999 or less. Modest-income parents had an annual income of £17,000 to £29,999. High-income parents had an annual income of £30,000 or more.
Parents were asked about:• therecentpast–forexample,howtheircostof
living had changed in the past year
• currentconditions–forexample,whethertheyhad any scope left to cut back on spending, given the rising cost of living and stagnant real wages;
• theirexpectationsfortheirownfutureandthefuture of their children – for example, whether they thought their families would benefit from the economic recovery.
In addition, they were given the opportunity to talk more generally about their experiences. Some of these experiences and opinions have been reproduced in the main report.
APPEnDICEs
A F
AIR
STA
RT F
OR
EV
ERy
CH
ILD
34
APPEnDIx 3: PROjECtIOns FOR WAGEs, COst OF LIVInG AnD sOCIAL sECURItY ExPEnDItURE
Analysis about future trends for wages, social security expenditure and living costs was undertaken by Landman Economics for Save the Children.
DATA
Hourly wages in the Family Resources Survey (FRS) are subject to measurement error, particularly for individuals in the lowest income quintile. However, the FRS provides good-quality information on the number of children living in different income quintiles.
Therefore, data on nominal hourly wages and the number of employees earnings below the living wage over the past ten years were collected from the Labour Force Survey. The proportion of employees earning below the living wage was then applied to the relevant income distributions in the FRS to calculate the number of children living in families earning below the living wage in 2013.
WAGES
To simulate the path of wages over the next seven years to 2020, three scenarios were considered.
The first was that wages grow in line with forecasts for the consumer price index (CPI). In other words, that real wage growth is flat over the period. The Office for Budget Responsibility (OBR) expects CPI to be 1.9% in 2014 and then to be at the 2.0% target between 2015 and 2018.105 The calculations assume that the target continues to be met between 2018 and 2020.
The second was that wages grow by 7.7% relative to CPI. This matches the OBR’s forecast to 2018 and assumes that wages continue to grow at their 2018 rate into 2020.
The third scenario was that wages fall by 6.1% relative to CPI, in line with falls observed between 2008 and 2013.
The first scenario allows firms to increase nominal wages, while keeping real labour costs constant. This would help with increasing recruitment, retention and productivity, while managing costs in the recovery. However, given the time period that the forecast spans, and historical experience in a recovery, this assumption is conservative.
The second scenario is less conservative, and assumes that as the economy recovers, pay picks up. This would be in line with historical experience. But given the trend for wages in low-paid jobs, applying this path to wages of low-income families seems optimistic.
The third scenario is the most pessimistic and assumes that the recovery is not accompanied by a rise in real wages, indeed that there is a sustained further fall. This would be out of line with historical experience but provides a benchmark for a severe scenario where employees, particularly from low-income families, see little benefit from the recovery.
THE LIVING WAGE
Three scenarios for the path of the living wage were considered.
The first was that the living wage grows in line with CPI. The second was that the living wage grows by 5 percentage points relative to CPI. The third is that the living wage grows by 13 percentage points relative to CPI.
The first scenario is the most conservative and assumes that the CPI reflects the cost of living fully. However, the premise of the living wage is to more accurately match the rising cost of living to earned income. Therefore, it has consistently been higher than CPI since its inception in 2003.
Therefore, the second scenario is that future increases in the living wage match the average increase seen between 2003 and 2013. Data are only available for the London living wage over this
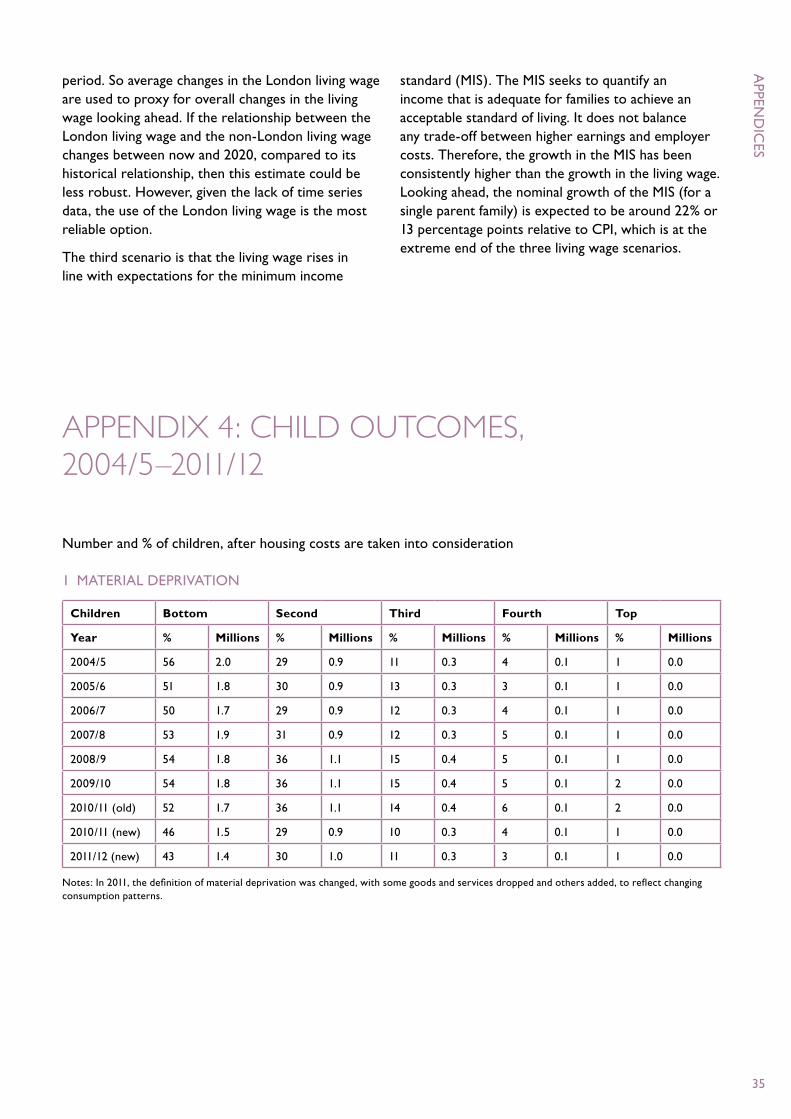
APPEN
DIC
ES
35
period. So average changes in the London living wage are used to proxy for overall changes in the living wage looking ahead. If the relationship between the London living wage and the non-London living wage changes between now and 2020, compared to its historical relationship, then this estimate could be less robust. However, given the lack of time series data, the use of the London living wage is the most reliable option.
The third scenario is that the living wage rises in line with expectations for the minimum income
standard (MIS). The MIS seeks to quantify an income that is adequate for families to achieve an acceptable standard of living. It does not balance any trade-off between higher earnings and employer costs. Therefore, the growth in the MIS has been consistently higher than the growth in the living wage. Looking ahead, the nominal growth of the MIS (for a single parent family) is expected to be around 22% or 13 percentage points relative to CPI, which is at the extreme end of the three living wage scenarios.
APPEnDIx 4: CHILD OUtCOmEs, 2004/5–2011/12
Number and % of children, after housing costs are taken into consideration
1 MATERIAL DEPRIVATION
Children Bottom Second Third Fourth Top
Year % Millions % Millions % Millions % Millions % Millions
2004/5 56 2.0 29 0.9 11 0.3 4 0.1 1 0.0
2005/6 51 1.8 30 0.9 13 0.3 3 0.1 1 0.0
2006/7 50 1.7 29 0.9 12 0.3 4 0.1 1 0.0
2007/8 53 1.9 31 0.9 12 0.3 5 0.1 1 0.0
2008/9 54 1.8 36 1.1 15 0.4 5 0.1 1 0.0
2009/10 54 1.8 36 1.1 15 0.4 5 0.1 2 0.0
2010/11 (old) 52 1.7 36 1.1 14 0.4 6 0.1 2 0.0
2010/11 (new) 46 1.5 29 0.9 10 0.3 4 0.1 1 0.0
2011/12 (new) 43 1.4 30 1.0 11 0.3 3 0.1 1 0.0
Notes: In 2011, the definition of material deprivation was changed, with some goods and services dropped and others added, to reflect changing consumption patterns.
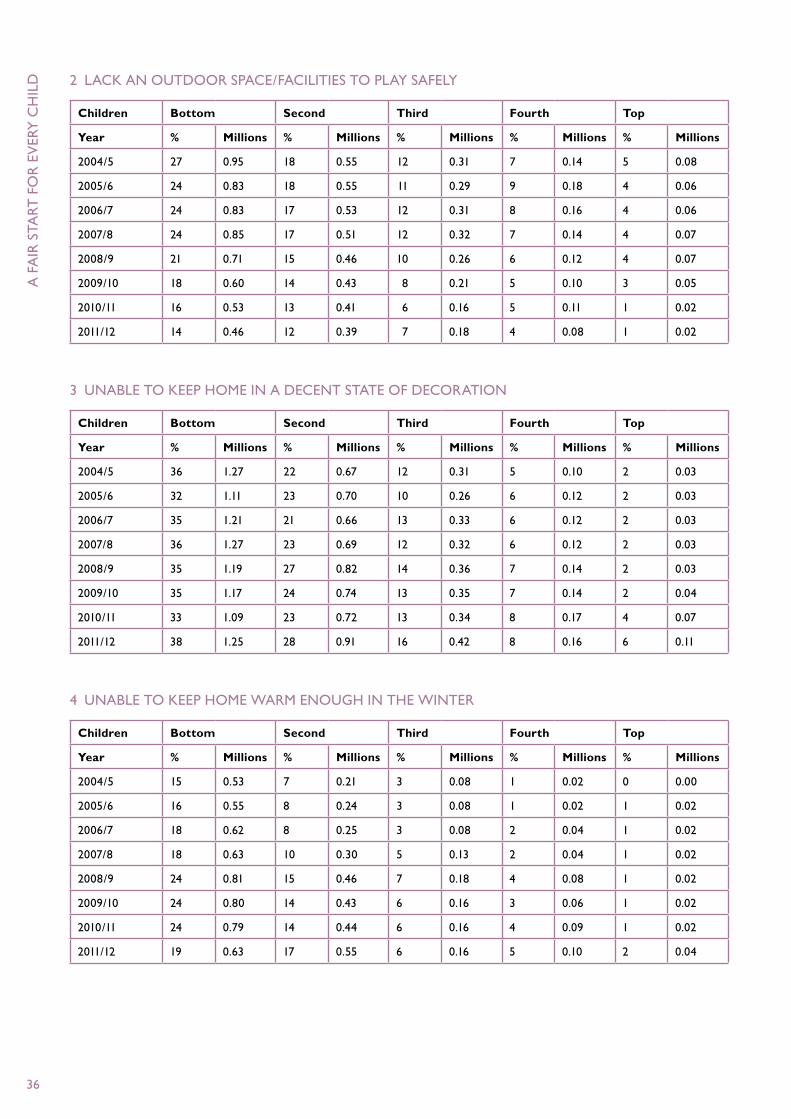
A F
AIR
STA
RT F
OR
EV
ERy
CH
ILD
36
2 LACK AN OUTDOOR SPACE/FACILITIES TO PLAy SAFELy
Children Bottom Second Third Fourth Top
Year % Millions % Millions % Millions % Millions % Millions
2004/5 27 0.95 18 0.55 12 0.31 7 0.14 5 0.08
2005/6 24 0.83 18 0.55 11 0.29 9 0.18 4 0.06
2006/7 24 0.83 17 0.53 12 0.31 8 0.16 4 0.06
2007/8 24 0.85 17 0.51 12 0.32 7 0.14 4 0.07
2008/9 21 0.71 15 0.46 10 0.26 6 0.12 4 0.07
2009/10 18 0.60 14 0.43 8 0.21 5 0.10 3 0.05
2010/11 16 0.53 13 0.41 6 0.16 5 0.11 1 0.02
2011/12 14 0.46 12 0.39 7 0.18 4 0.08 1 0.02
3 UNABLE TO KEEP HOME IN A DECENT STATE OF DECORATION
Children Bottom Second Third Fourth Top
Year % Millions % Millions % Millions % Millions % Millions
2004/5 36 1.27 22 0.67 12 0.31 5 0.10 2 0.03
2005/6 32 1.11 23 0.70 10 0.26 6 0.12 2 0.03
2006/7 35 1.21 21 0.66 13 0.33 6 0.12 2 0.03
2007/8 36 1.27 23 0.69 12 0.32 6 0.12 2 0.03
2008/9 35 1.19 27 0.82 14 0.36 7 0.14 2 0.03
2009/10 35 1.17 24 0.74 13 0.35 7 0.14 2 0.04
2010/11 33 1.09 23 0.72 13 0.34 8 0.17 4 0.07
2011/12 38 1.25 28 0.91 16 0.42 8 0.16 6 0.11
4 UNABLE TO KEEP HOME WARM ENOUGH IN THE WINTER
Children Bottom Second Third Fourth Top
Year % Millions % Millions % Millions % Millions % Millions
2004/5 15 0.53 7 0.21 3 0.08 1 0.02 0 0.00
2005/6 16 0.55 8 0.24 3 0.08 1 0.02 1 0.02
2006/7 18 0.62 8 0.25 3 0.08 2 0.04 1 0.02
2007/8 18 0.63 10 0.30 5 0.13 2 0.04 1 0.02
2008/9 24 0.81 15 0.46 7 0.18 4 0.08 1 0.02
2009/10 24 0.80 14 0.43 6 0.16 3 0.06 1 0.02
2010/11 24 0.79 14 0.44 6 0.16 4 0.09 1 0.02
2011/12 19 0.63 17 0.55 6 0.16 5 0.10 2 0.04
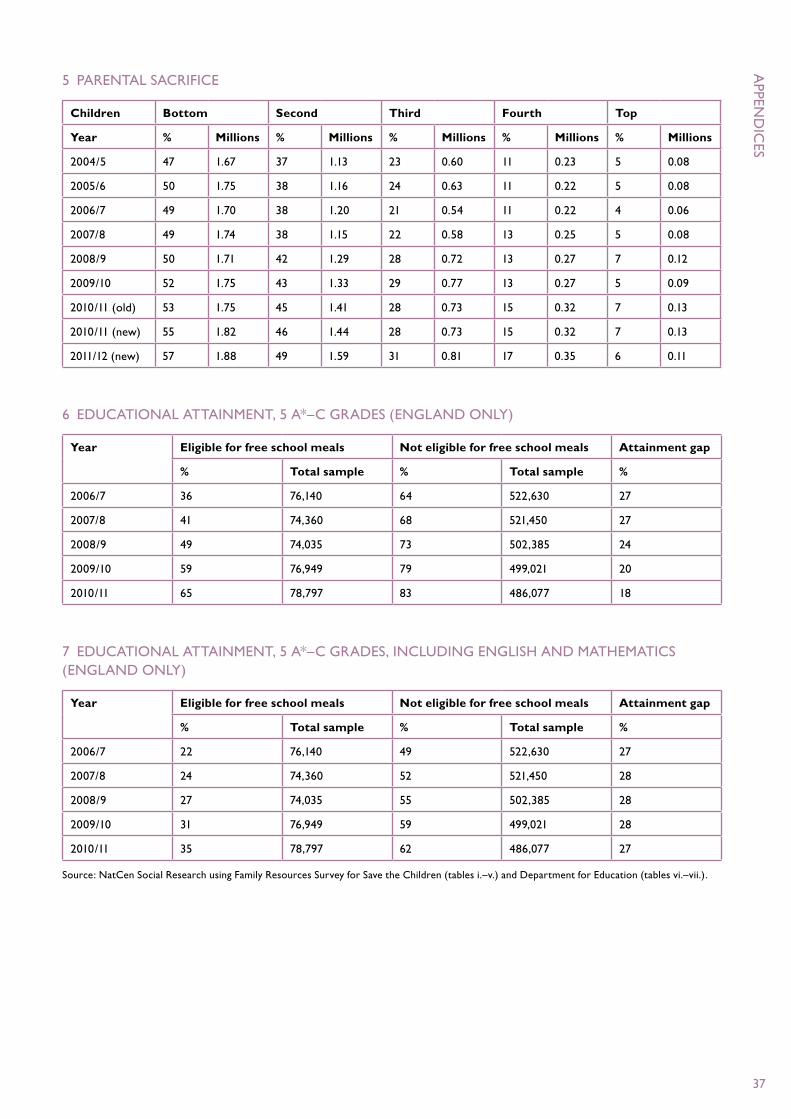
APPEN
DIC
ES
37
5 PARENTAL SACRIFICE
Children Bottom Second Third Fourth Top
Year % Millions % Millions % Millions % Millions % Millions
2004/5 47 1.67 37 1.13 23 0.60 11 0.23 5 0.08
2005/6 50 1.75 38 1.16 24 0.63 11 0.22 5 0.08
2006/7 49 1.70 38 1.20 21 0.54 11 0.22 4 0.06
2007/8 49 1.74 38 1.15 22 0.58 13 0.25 5 0.08
2008/9 50 1.71 42 1.29 28 0.72 13 0.27 7 0.12
2009/10 52 1.75 43 1.33 29 0.77 13 0.27 5 0.09
2010/11 (old) 53 1.75 45 1.41 28 0.73 15 0.32 7 0.13
2010/11 (new) 55 1.82 46 1.44 28 0.73 15 0.32 7 0.13
2011/12 (new) 57 1.88 49 1.59 31 0.81 17 0.35 6 0.11
6 EDUCATIONAL ATTAINMENT, 5 A*–C GRADES (ENGLAND ONLy)
Year Eligible for free school meals Not eligible for free school meals Attainment gap
% Total sample % Total sample %
2006/7 36 76,140 64 522,630 27
2007/8 41 74,360 68 521,450 27
2008/9 49 74,035 73 502,385 24
2009/10 59 76,949 79 499,021 20
2010/11 65 78,797 83 486,077 18
7 EDUCATIONAL ATTAINMENT, 5 A*–C GRADES, INCLUDING ENGLISH AND MATHEMATICS (ENGLAND ONLy)
Year Eligible for free school meals Not eligible for free school meals Attainment gap
% Total sample % Total sample %
2006/7 22 76,140 49 522,630 27
2007/8 24 74,360 52 521,450 28
2008/9 27 74,035 55 502,385 28
2009/10 31 76,949 59 499,021 28
2010/11 35 78,797 62 486,077 27
Source: NatCen Social Research using Family Resources Survey for Save the Children (tables i.–v.) and Department for Education (tables vi.–vii.).
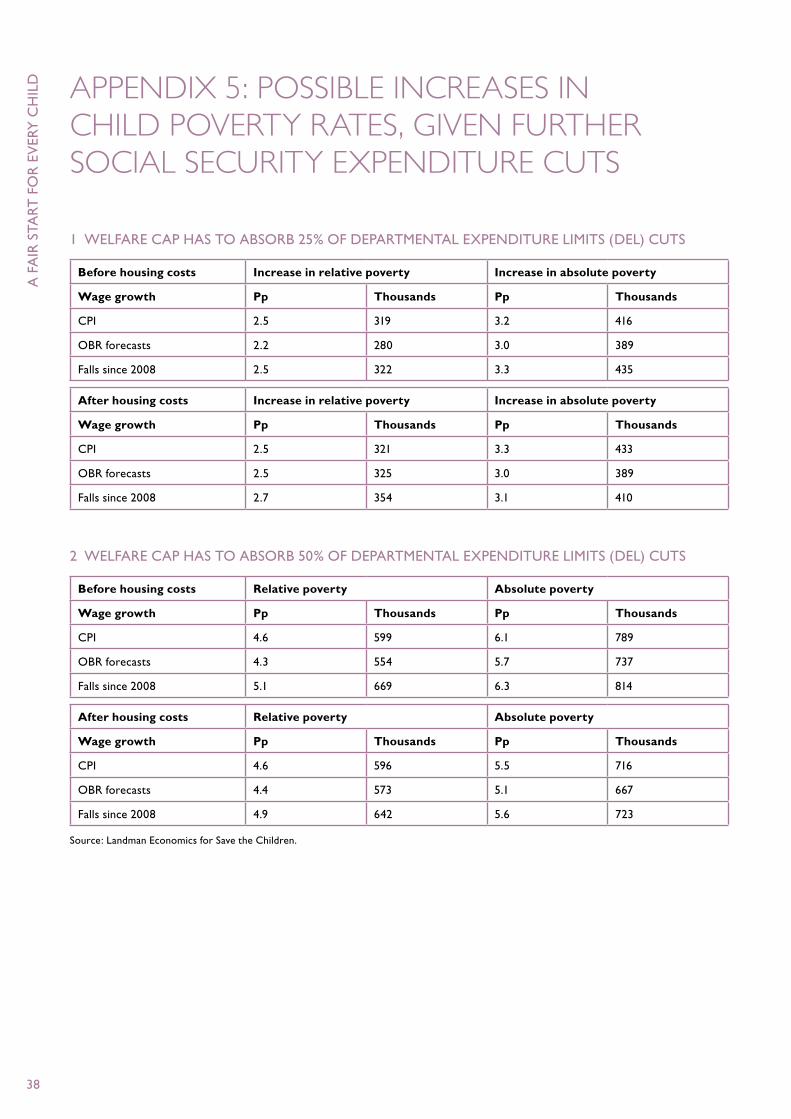
A F
AIR
STA
RT F
OR
EV
ERy
CH
ILD
38
APPEnDIx 5: POssIbLE InCREAsEs In CHILD POVERtY RAtEs, GIVEn FURtHER sOCIAL sECURItY ExPEnDItURE CUts
1 WELFARE CAP HAS TO ABSORB 25% OF DEPARTMENTAL ExPENDITURE LIMITS (DEL) CUTS
Before housing costs Increase in relative poverty Increase in absolute poverty
Wage growth Pp Thousands Pp Thousands
CPI 2.5 319 3.2 416
OBR forecasts 2.2 280 3.0 389
Falls since 2008 2.5 322 3.3 435
After housing costs Increase in relative poverty Increase in absolute poverty
Wage growth Pp Thousands Pp Thousands
CPI 2.5 321 3.3 433
OBR forecasts 2.5 325 3.0 389
Falls since 2008 2.7 354 3.1 410
2 WELFARE CAP HAS TO ABSORB 50% OF DEPARTMENTAL ExPENDITURE LIMITS (DEL) CUTS
Before housing costs Relative poverty Absolute poverty
Wage growth Pp Thousands Pp Thousands
CPI 4.6 599 6.1 789
OBR forecasts 4.3 554 5.7 737
Falls since 2008 5.1 669 6.3 814
After housing costs Relative poverty Absolute poverty
Wage growth Pp Thousands Pp Thousands
CPI 4.6 596 5.5 716
OBR forecasts 4.4 573 5.1 667
Falls since 2008 4.9 642 5.6 723
Source: Landman Economics for Save the Children.
39
ExECUTIVE SUMMARy1 Using the most recently available figures from: Department for Work and Pensions, Households below average income – 1994/95 to 2011/12 June 2013 as a baseline
INTRODUCTION2 After housing costs have been paid. Department for Work and Pensions, Households below average income – 1994/95 to 2011/12 June 2013
3 NatCen Social Research using data from the Family Resources Survey for Save the Children
4 Compares children eligible for free school meals to those that are not. The income threshold for free-school-meal eligibility differs from the income threshold for measuring child poverty.
5 See, for example, F Field (2010) The Foundation Years: preventing poor children becoming poor adults, The report of the Independent Review on Poverty and Life Chances, London: Cabinet Office.
6 After housing costs have been paid; see Department for Work and Pensions, Households below average income – 1994/95 to 2011/12 June 2013.
7 See, for example, J Waldfogel (2008) Welfare Reforms and Child Well-being in the US and UK, Working paper, Institute for Labour Market Policy Evaluation
8 HM Government (2010) Child Poverty Act 2010, available at http://www.legislation.gov.uk/ukpga/2010/9/contents
9 Resolution Foundation (2012) Gaining from Growth: The final report of the Commission on Living Standards
10 Although child poverty rates fell between 2011 and 2012, this was due to a fall in average incomes. As child poverty is measured relative to average incomes, the gap between children living in low-income families and the average narrowed, even though there was no actual improvement in their living standards.
1 THE IMPACT OF POVERTy ON CHILDREN’S LIVES11 NatCen Social Research using Family Resources Survey.
12 The latest Family Resources Survey data showed that 28% of children in the lowest income quintile were aged 0–4 compared with 23% aged 11–15.
13 See, for example, the UK government’s annual Family Resources Survey (available at https://www.gov.uk/government/collections/family-resources-survey--2). In practice, some of these items fall into multiple categories: for example, inadequate food and nutrition can have an impact on both physical health and brain development, which matters for cognitive development. But for simplicity, each item only appears once.
14 In 2012, data from the Office for National Statistics showed that 7.5% of babies born into families with manual occupations, taken as a proxy for lower-income families, were of a low birth-weight compared with 5.5% of families with non-manual occupations. 15 44% of poor children had either zero, one or two pieces of fresh fruit and vegetables a day,
compared with 39% of the richest children (NatCen Social Research using Understanding Society). OnePoll survey results showed that 20% of low-income parents said that their children went without fresh fruit and vegetables every day compared with just under 8% of high-income parents.
16 Save the Children, unpublished, (Angela G case study)
17 Onepoll on behalf of Save the Children
18 Save the Children, unpublished, (Angela case study)
19 Save the Children, unpublished case study from Eat, Sleep, Learn, Play! programme
20 In 2011, 22% of children in the bottom income quintile were classified as obese compared with 10% of children in the top quintile (NatCen Social Research using Health Survey England data for Save the Children).
21 M Marmot et al (2010) Fair Society, Healthy Lives, Strategic Review of Health Inequalities in England post-2010
22 NatCen Social Research using Health Survey for England data for Save the Children
23 See, for example, Shelter (2013) Growing Up Renting: A childhood spent in private rented homes.
24 Save the Children workshop with young people
25 From conversations conducted with parents as part of Save the Children’s campaign work on energy costs
26 Shelter (2006) Chance of a Lifetime: The impact of bad housing on children’s lives
27 44% of children in the poorest quintile had parents who would like to but cannot afford to replace broken electrical goods and 55% had parents who would like to but cannot afford to replace worn out furniture (UK government Family Resources Survey).
28 24% of children in the bottom quintile were only children and 22% of children were one of two (UK government Family Resources Survey).
29 Shelter (2005) Generation Squalor: Shelter’s national investigation into the housing crisis
30 K Cooper and K Stewart (2013) Does Money Affect Child Outcomes? Joseph Rowntree Foundation
31 Save the Children (2012) Chid Poverty in 2012: It shouldn’t happen here
32 H Meltzer, R Gatward, R Goodman, T Ford (2000) The Mental Health of Children and Adolescents in Great Britain, Office for National Statistics
33 G W Evans,J Brooks-Gunn and P K Klebanov (2011). ‘Stressing out the poor: chronic physiological stress and the income–achievement gap’, Pathways: A magazine on poverty, inequality, and social policy, winter 2011, 16–21
34 M Marmot (2012) ‘The health effects of poverty’ in Ending Child Poverty by 2020: Progress made and lessons learned, Child Poverty Action Group
35 Save the Children workshop with young people
36 Save the Children workshop with young people
37 Save the Children workshop with young people
38 Bureau of Labor Statistics, American Time Use Survey
EnDnOtEs
A F
AIR
STA
RT F
OR
EV
ERy
CH
ILD
40
39 Though one of the benefits of parents, particularly single parents, going back to work in recent years has been that they spent the extra money earned on activities and educational toys for their children (Waldfogel (2007) – see endnote 6).
40 B Hart and T R Risley (2004) ‘The early catastrophe’, Education Review, 77(1),100–118
41 See, for example, J Waldfogel and E Washbrook, ‘Early years policy’, Child Development Research, vol. 2011, Article ID 343016, 2011.
42 See, for example, Marmot, 2010 (see note 21).
43 Save the Children case studies (Joanne), unpublished
44 See, for example, L Gambaro, K Stewart and J Waldfogel (2013) Equal access to high quality early education and care? Evidence from England and lessons from other countries, Centre for Analysis of Social Exclusion, CASEbrief 32.
45 Kellogg’s (2013) A Lost Education: The reality of hunger in the classroom
46 Kellogg’s (2013) A Lost Education: The reality of hunger in the classroom
47 The Children’s Society (2013) Fair and Square: Free school meals for all children in poverty
48 HM Treasury (2008) Ending Child Poverty: Everybody’s business
49 Waldfogel and Washbrook (2010) Low income and Early Cognitive Development in the UK, The Sutton Trust
50 Department for Education, GCSE and equivalent attainment by pupil characteristics in England: 2010 to 2011, National and local authority tables: SFR03/2012, Table 5: Achievements at GCSE and equivalent for pupils at the end of Key Stage 4 by free school meal eligibility and Local Authority, available at: https://www.gov.uk/government/publications/gcse-and-equivalent-attainment-by-pupil-characteristics-in-england-2010-to-2011, accessed 12 April 2014
51 Save the Children (2013) Too Young to Fail: Giving all children a fair start in life
52 Save the Children (2013) Too Young to Fail: Giving all children a fair start in life
53 Social Mobility and Child Poverty Commission (2013) State of the Nation: Social mobility and child poverty in Great Britain
54 Data released by the Department for Business Innovation and Skills
2 THE THREE MAIN DRIVERS OF CHILD POVERTy55 Low income refers to those living on or below the relative poverty line. Given data availability, when child outcomes are discussed, they refer to children in the bottom 20% of the income distribution, which is a level slightly below the relative poverty line.
56 As proxied by unemployment rates in low-paid sectors
57 In the three months to December 2013, the annual unemployment rate was 7.2%, down from a peak of 8.4% over the same period in 2011 (Office for National Statistics).
58 Office for National Statistics
59 Department for Work and Pensions, Households below average income – 1994/95 to 2011/12, June 2013 (available at https://www.gov.uk/government/collections/households-below-average-income-hbai--2), Table 2.3ts, which shows that families in the bottom income quintile where one or more individuals are self-employed earn relatively less than low-income families where one or more individuals are in full-time work. The reverse is true for families in the top income quintile.
60 J Plunkett, A Hurrell and M Whittaker (2014) The State of Living Standards, Resolution Foundation and P Sissons (2011) The Hourglass and the Escalator: Labour market change and mobility, Work Foundation (2014)
61 S McIntosh (2013) Hollowing Out and the Future of the Labour Market, Department for Business, Innovation and Skills, Research Paper number 134
62 A Hurrell (2013) Starting Out or Getting Stuck, Resolution Foundation
63 In addition, there is a growing mis-match between qualifications and skills required, as individuals take up jobs below their skill level in order to secure employment. One estimate suggested that 20% of households in poverty contained someone with a degree qualification or above (M Barnes and C Lord (2013) Poverty, Economic Status and Skills: What are the links? Joseph Rowntree Foundation).
64 For example, average real wages grew by 13% between 1999 and 2013, compared to a rise in economic growth of four times this rate (Living Wage Commission (2014) Working for Poverty: The scale of the problem of low pay and working poverty in the UK).
65 Based on Office for National Statistics Labour Market Statistics
66 1.5% for families with children
67 -0.7% for families with children
68 Organisation for Economic Cooperation and Development, Labour Market Statistics
69 From a Save the Children case study (Laura), unpublished
70 This is a summary of a case study collected by Save the Children as part of a childcare campaign in July 2013.
71 Save the Children (2013) Improving Work Incentives Under Universal Credit
72 From a Save the Children case study (Karen), unpublished
73 This section makes the assumption that all announced cuts will be implemented.
74 The benefit cap does not currently apply in Northern Ireland.
75 Landman Economics for Save the Children
76 See Appendix 2 for annual income values for low, modest and high-income families.
77 LV= (2014) The Cost of a Child: From cradle to college
78 R Griffith, M O’Connell and K Smith (2013) Food expenditure and nutritional quality over the great recession, Institute for Fiscal Studies, Briefing Note BN 143
79 The Trussell Trust reported that in 2012–13, a total of 346,992 people visited food banks in the UK, of which 126,889 (or approximately one-third) were children (http://www.trusselltrust.org/foodbank-projects).
80 For a detailed discussion of methodology, see Save the Children (2010) The UK Poverty Rip-Off: The Poverty Premium 2010 and Save the Children (2007) The Poverty Premium: How poor households pay more for essential goods and services.
81 Whitham G (2014) The Price of Being Poor: The poverty premium in 2014, Save the Children
82 24% reported that this was due to a pay cut or pay freeze, 11% because they had lost their jobs, and 35% because of welfare cuts or freezes.
83 Department for Work and Pensions, Households below average income – 1994/95 to 2011/12, June 2013
84 Save the Children case study (Angela G), unpublished
3 WHAT NExT? THE THREAT OF GROWING CHILD POVERTy85 Institute for Fiscal Studies (2014) Child and Working-age Poverty in Northern Ireland over the Next Decade: An update
86 See HM Treasury, Budget 2014, Table D.1, page 106.
87 This approximation is based on adjusting the nominal forecasts for the minimum income standard for inflation. See Padley and Hirsch (2014), Households below a minimum income standard: 2008/09 to 2011/12, Figure 4.
88 The Living Wage rose by an average of 5% relative to CPI between 2003 and 2013.
END
NO
TES
41
89 Conlumino for Webloyalty (2013). Sourced from the Webloyalty website in April 2014.
90 From conversations held between Save the Children staff and health professionals in 2013 and 2014.
91 Social Market Foundation (2011) The Parent Trap: Illustrating the growing cost of childcare
92 Office for Budget Responsibility
93 J Plunkett, A Hurrell and M Whittaker (2014) The State of Living Standards, Resolution Foundation
94 Institute for Fiscal Studies (2014) Child and Working-age Poverty in Northern Ireland over the Next Decade: An update
95 Using the latest 2011/12 figures for households below average income as a baseline
96 See Appendix 5 for results tables for all scenarios.
97 Resolution Foundation (2013) Closer to the Edge?: Debt repayments in 2018 under different household income and borrowing cost scenarios
98 D Grusky and K Weeden (2011) ‘Is market failure behind the takeoff in inequality?’, in D Grusky and S Szelényi (eds) The Inequality Reader: Contemporary and foundational readings in race, class, and gender, 2nd edition, Westview Press.
99 See Save the Children (2013) Too Young to Fail: Giving all children a fair start in life for complete discussion of methodology and results.
100 Using the 2011/12 figures for households below average income as a baseline
4 POLICy OPTIONS: MAPPING THE RESPONSE101 Based on OECD data
102 Save the Children analysis based on data sourced from the Department for Work and Pensions: http://www.ons.gov.uk/ons/publications/re-reference-tables.html?edition=tcm%3A77-269948
103 The Children’s Society (2014) Behind Cold Doors: The chilling reality for children in poverty
104 See Bank of England, Prudential Regulation Authority, credit unions statistics, at: http://www.bankofengland.co.uk/pra/Pages/regulatorydata/creditunionsstatistics.aspx
APPENDICES105 Office for Budget Responsibility (2014) Economic and Fiscal Outlook
As the UK economy recovers, the situation for poor children is set to get worse, not better.
Child poverty has already been predicted to rise by one third by 2020. Now, new research presented here, shows how child poverty could rise still further.
A Fair Start for Every Child looks at:• howpovertyisaffectingthelivesofchildrenintheUK
today – their physical health, emotional well-being, cognitive development and educational achievement
• thedevelopmentovertenyearsofthethreemaindriversof child poverty – flat wage growth, recent pressure on social security spending and the rising cost of living
• forecastsforthesethreepovertydriversandthelikelyimpact on children’s lives and child poverty rates up to 2020 – the year the main political parties are committed to end child poverty.
This report looks at the choice politicians now face. Either they recommit to eradicating poverty by 2020 and put forward a radical strategy to achieve it, or they introduce an ambitious interim plan, with an achievable but ambitious date for poverty eradication.
Our immediate priority is for all children to have a fair start by the age of 11. Based on the findings of this report, we’re calling for three key steps: high-quality, affordable childcare for all; a minimum income guarantee for families of children under five; and a national mission for all children to be reading well by 11.
savethechildren.org.uk
co
ver
pho
to: h
ildr
enC
OV
ER Ph
OT
O: G
REG
FUN
NEll/sA
VE T
hE C
hild
REN
A fair start For everY childWhy we must act now to tackle child poverty in the UK