Embed Size (px)
Citation preview
A Fast-Evolving, Luminous Transient Discovered by
K2/Kepler
A. Rest,1 P. M. Garnavich,2 D. Khatami,3,4 D. Kasen,3,4 B. E. Tucker,5,6 E. J. Shaya,7 R. P. Olling,7
R. Mushotzky,7 A. Zenteno,8 S. Margheim,9 G. Strampelli,1 D. James,10 R. C. Smith,8 F. Forster,11
V. A. Villar12
1Space Telescope Science Institute, 3700 San Martin Drive, Baltimore, MD 21218, USA.
2Department of Physics, University of Notre Dame, 225 Nieuwland Science Hall, Notre Dame,
IN, 46556-5670, USA.
3Department of Astronomy, University of California, Berkeley, CA 94720-3411, USA.
4Lawrence Berkeley National Laboratory, 1 Cyclotron Road, Berkeley, California 94720, USA.
5The Research School of Astronomy and Astrophysics, Mount Stromlo Observatory, Australian
National University, via Cotter Road, Canberra, ACT 2611, Australia.
6The ARC Centre of Excellence for All-Sky Astrophysics (CAASTRO)
7Astronomy Department, University of Maryland, College Park, MD 20742-2421, USA.
8Cerro Tololo Inter-American Observatory, Casilla 603, La Serena, Chile.
9Gemini Observatory, La Serena, Chile.
10Department of Astronomy, University of Washington, Box 351580, Seattle, WA 98195, USA.
11Center for Mathematical Modeling, University of Chile, Santiago, Chile.
12Harvard-Smithsonian Center for Astrophysics, 60 Garden Street, Cambridge, MA 02138, USA.
For decades optical time-domain searches have been tuned to find ordinary supernovae,
1
which rise and fall in brightness over a period of weeks. Recently, supernova searches have
improved their cadences and a handful of fast-evolving luminous transients (FELTs) have
been identified1–5. FELTs have peak luminosities comparable to Type Ia supernovae, but rise
to maximum in < 10 days and fade from view in <month. Here we present the most extreme
example of this class thus far, KSN2015K, with a rise time of only 2.2 days and a time above
half-maximum (t1/2) of only 6.8 days. We show that, unlike Type Ia supernovae, the light
curve of KSN2015K was not powered by the decay of radioactive elements. We furthermore
argue that it is unlikely that it was powered by continuing energy deposition from a central
remnant (a magnetar or black hole). Using numerical radiation hydrodynamical models, we
show that the light curve of KSN2015K is well fit by a model where the supernova runs into
external material presumably expelled in a presupernova mass loss episode. The rapid rise
of KSN2015K therefore probes the venting of photons when a hypersonic shock wave breaks
out of a dense extended medium.
We identified KSN2015K as an unusual transient in the K2 Campaign 6 data from the ex-
tended Kepler mission 6. While we have several ground-based optical programs to find supernovae
during a K2 Campaign, KSN2015K was identified in February 2016 after the Campaign 6 data
was publicly released. Re-analysis of images taken by DECam and Skymapper clearly show the
transient, but it was not flagged because it only appeared on one epoch. We therefore could not
obtain a spectrum of the transient itself. The host has a redshift of 0.090 implying a luminosity
distance of 410 Mpc (assuming a flat cosmology with H0 = 70 km s�1 Mpc�1).
2
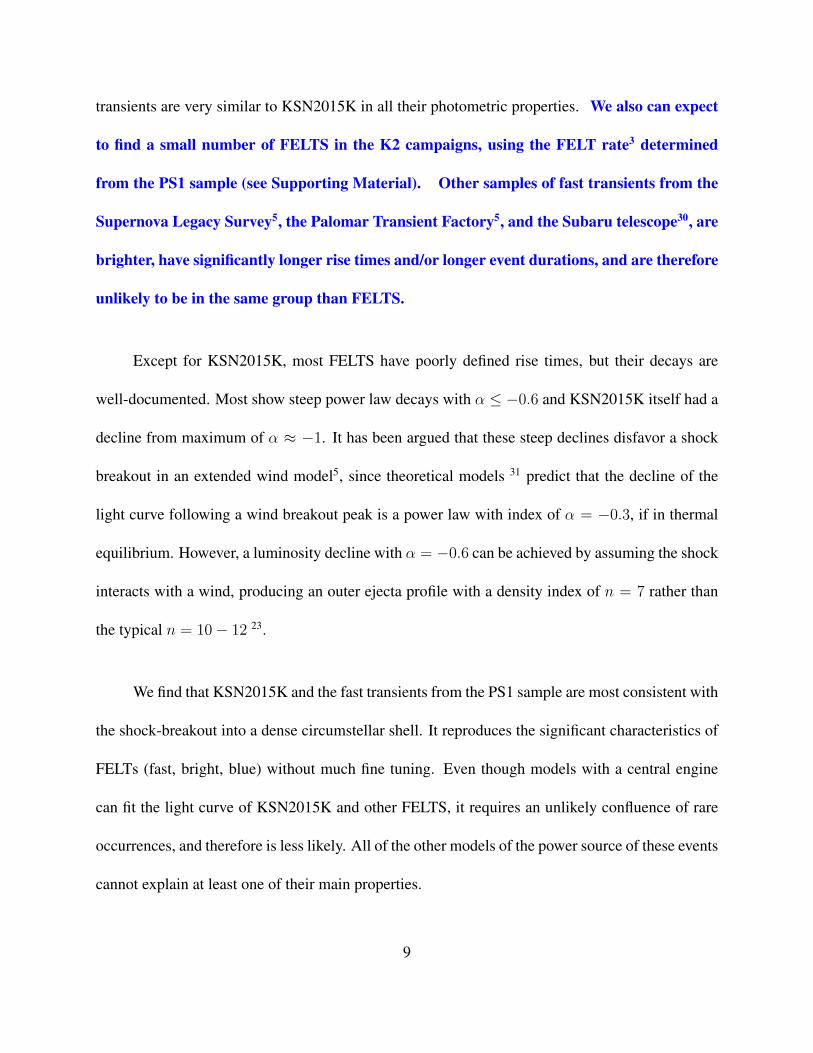
The K2 light curve of KSN2015K seems to have four phases (see Figure 1 and 2). The rise
is well fit by a quadratic function starting 1.6 days before maximum. Before that, the light rises
like t2 and suggest the explosion occurred 2.2± 0.1 days before peak brightness. After maximum,
KSN2015K shows a decline followed by a plateau and finally a power-law decay. Additional,
ground-based photometry from DECam and SkyMapper show the color to be quite blue (see sup-
plemental material). At peak, KSN2015K’s color is r� i = �0.15±0.05, and ⇠ 8 days after peak
its color remains quite blue at g � r = �0.17± 0.20 even after fading to half its peak brightness.
The host galaxy is a star-forming spiral galaxy and the transient is seen projected on a spiral
arm (see Figure 1 and the supplemental material). If the transient is associated with the arm, the
environment suggests a relatively short time between birth and the transient outburst, but both
thermonuclear and core-collapse supernovae are found in young, star-forming populations.
The progenitors of FELTs and the energy source that powers the light curve have been de-
bated. Members of the class could originate from more than one type of progenitor. The high-
cadence time-sampling of KSN2015K allows us to make strong constraints on the origin of this
particular event.
If FELT light curves are powered by an internal energy source, such as the decay of ra-
dioactive isotopes or a central engine, then the light curve rise time is set by the photon diffusion
timescale through the remnant, tdi↵ / (M/v)1/2 where M is the remnant mass, v the expansion
velocity, and the opacity. The rise time of KSN2015k was ⇠ 8 times shorter than that of Type Ia
supernovas (which have mass ⇡ 1M�), implying an ejected mass of only a few times ⇠ 10�2 M�.
3
Differences in the velocity and opacity of the ejecta are unlikely to change this estimate by more
than a factor of several. This mass constraint, however, does not apply to mechanisms that directly
deposit thermal energy near the ejecta surface, such as the blast wave from the explosion or shocks
from circumstellar interaction.
There are several explosive scenarios that may lead to the ejection of such a small (10�4 �
10�1 M�) radioactive mass, such as the thermonuclear explosion of a shell of accreted helium on
the surface of a white dwarf (a so-called “.1a” event7), the accretion induced collapse of a white
dwarf to a neutron star8, 9, and the merger of two neutron stars10, 11 (or a neutron star and a black
hole). The core collapse of massive stars (initial masses & 8 M�) could also produce little ejecta
if significant mass loss occurred prior to collapse via binary interactions 12, or if the explosion is
weak and most of the star remains bound (”fallback supernova” models, e.g., 13.
While radioactive models can reproduce the timescales observed for the KSN2015K light
curve, they fail to reproduce its peak brightness 7, 9, 14–16 on rather general physical grounds. The
peak luminosity of a radioactive supernova is approximately (to within a factor of ⇠ 2) given by
the instantaneous rate of heating by decay.
The heating rate for radioactive isotopes with half-lives in excess of a few days (such as
56Ni at ⇠ 3 ⇥ 1010 ergs s�1 g�1) requires a radioactive mass of ⇠ 0.1 M� to power the peak of
KSN2015K. This conflicts with the ⇠ 10�2 M� limit on the total ejecta mass inferred from the
light curve risetime. This tension cannot be resolved by arguing for an anomalously low opacity
in KSN2015K, since the luminosity and hence thermal state are similar to that of ordinary SN.
4

Figure 4 quantifies the allowed range of radioactive powered light curves and shows that such a
source can be ruled out for KSN2015K.
An alternative possible power source for supernova light curves is energy deposition from a
central engine, such as a rotating magnetized neutron star17, 18 (a magnetar) or an accreting black
hole19. Such compact objects may be formed in the core collapse of a rotating massive star, and
have been suggested to power the most luminous supernovae. The ejecta mass constraints above
apply to central engine heating, but the peak luminosity can be substantially greater than is possible
with radioactivity. However, explaining KSN2015K with a central engine implies unphysical or
fine-tuned parameters. A magnetar with rotational energy Em and spindown time tm produces a
peak light curve luminosity of approximately20 L ⇠ Em tm/t2di↵ . For magnetic spindown the
quantity Em tm depends only on the magnetic field Em tm / B�2 and is independent on the spin
period. The peak brightness of KSN2015K (L ⇡ 1043 ergs s�1 and tdi↵ ⇡ 2 days) then implies an
extreme dipole field of order 1016 Gauss, or ten times that of typical strong magnetars.
For a a black hole model, the small ejecta mass of KSN2015K would require a nearly failed
supernova where all but . 1% of the star remained bound to the black hole. The power from
fallback accretion can be estimated21 as P = ✏Mfb/tfb (t/tfb)�5/3, where Mfb is the fallback mass,
tfb the fallback time, and ✏ the accretion efficiency. For Mfb ⇡ M� and adopting a relatively short
fallback time tfb ⇠ 1 hour (characteristic of compact stripped star with R ⇠ R�) the accretion
power will far exceed the luminosity of KSN2015K at t = 2 days unless the efficiency is ✏ ⇠ 10�5,
which is much less than the characteristic value ✏ ⇠ 0.1. To reconcile the difference would require
5
fine tuning the fallback dynamics and/or accretion disk formation such that only a tiny fraction of
the infalling material was tapped to power the light curve.
Long gamma-ray bursts (GRB) result from the core-collapse of very massive stars22 that
drive collimated relativistic jets. When a jet is viewed off axis, no gamma-rays are seen, but the
shocked circumstellar gas may be visible as an “orphan afterglow”. The light curve of KSN2015K
is a good match to orphan afterglow models (see the Supporting Material). However, GRBs are
very rare compared to SNe, so the chance of having found a GRB afterglow during the K2 mission
is exceedingly small.
A final class of models for KSN2015K suggests that the transient is powered by energy
deposited by a hydrodynamical shock, either the shock of the supernova explosion itself or one
occurring post-explosion due to the interaction of the stellar ejecta with the circumstellar medium
(CSM) 23–27. An explosion shock carries energy to the outer layers of the star and eventually
vents in a shock breakout event at a radius R where the optical depth ⌧ is low enough that the
radiative diffusion timescale, td ⇡ ⌧ R/c, becomes comparable to the dynamical time, R/vs,
where vs is the shock velocity. This occurs at an optical depth ⌧ ⇡ c/vs ⇡ 30 for a shock velocity
vs = 104 km s�1.
To explain the rapid rise of KSN2015K as a shock breakout event requires that the diffusion
time from the shock td ⇡ 30 R/c be of order 2 days, which implies R ⇡ 2 ⇥ 1014 cm. This
is larger than typical radii of red supergiant supernova progenitor stars28. The effective radii of
red supergiants could be increased just prior to explosion by envelope inflation or enhanced mass
6
loss through winds. However, if the progenitor had been a supergiant with a wind, the explosion
would have resulted in a long lasting light curve similar to a Type IIP at later times29 (i.e., L ⇡
1042 ergs s�1 at t ⇡ 50 days), which is inconsistent with the rapid dimming of KSN2015K. We
therefore conclude that the progenitor was more compact (e.g., stripped envelope star) with radius
⇡ 1011 cm, that interacted with a dense and extended CSM at radius of several times 1014 cm.
Shock breakout thus occurs in the extended CSM shell23.
Assuming constant density, the CSM mass required to produce ⌧ ⇡ c/v is M ⇡ 4⇡ R2 c vs ⇡
10�2 M� for = 0.34 cm2 g�1. This CSM must have been lost within a time tcsm ⇡ R/vcsm before
explosion, where vcsm is the CSM velocity. For vcsm = 10 km s�1 (typical of a red-giant wind) we
have tcsm ⇡ 6 years and an effective mass loss rate of M ⇡ 2⇥10�3 M� yr�1. For the more likely
case of a stripped envelope progenitor, the characteristic escape velocity is vcsm = 1000 km s�1
which implies a mass loss episode with M ⇡ 2⇥ 10�1 M� yr�1 occurring tcsm ⇡ 20 days before
the explosion. Such mass loss rates are much greater than typical winds from massive stars, but
could be produced in episodic mass loss outbursts.
To test whether the shock breakout in CSM can explain the light curve of KSN2015K, we ran
numerical radiation-hydrodynamical simulations of a supernova running into a circumstellar shell
(see SI). Figure 1 shows that for a model with CSM masses and radii roughly in the range estimated
above, the venting of the post-shock energy at breakout can explain KSN2015K’s very rapid rise to
a luminous peak. The post maximum luminosity is due to the diffusion of shock deposited energy
from deeper layers. At later times (t & 10 days) the decline of the KSN2015k light curve becomes
7
shallower and it is possible that radioactive 56Ni decay contributes to the luminosity. As the shape
and brightness of the model light curves are sensitive to the CSM and ejecta parameters (Figure 1
of the SI) the full coverage high sampling of the KSN2015K light curve provides strong constraints
on the conditions of shock breakout in a dense circumstellar medium.
Fast transients are difficult to discover and follow-up, and sufficient numbers have been dis-
covered only in recent years due to surveys with improved cadence and depth like Pan-STARRS1
(PS1) and Palomar Transient Factory (PTF). One of the earliest fast-transients identified was
SN2002bj, which was initially postulated to be a “.1a” 1 event, but its high luminosity makes
this unlikely. The spectrum of SN2002bj was similar to a SNIa except for a prominent helium
line suggesting that it might be a stripped core-collapse event with a helium envelope. The very
bright SN2015U rose in less than 10 days and its time above half maximum was t1/2 = 12 days. It
showed narrow helium features 4, implying that interaction with a hydrogen-poor CSM does occur
in rapidly evolving events. Similarly, SN2010X had a rise of less than 10 days and t1/2 = 15
days, but was four times fainter than SN2002bj 2. The rapid evolution and lower luminosity means
SN2010X could be powered by radioactive decay of thermonuclear products. Figure 3 compares
the light curve of KSN2015K with SN2002bj and SN2015U.
The largest sample of fast transients3, discovered in the PS1 survey, has rise time upper-
limits of 3 to 5 days and peak luminosities similar to KSN2015K (see Figure 4 for a comparison of
rise times and absolute magnitudes). These PS1 transients also show very blue colors with typical
g � r = �0.2 mag near maximum light and only a slow reddening afterwards. Thus, the PS1
8
transients are very similar to KSN2015K in all their photometric properties. We also can expect
to find a small number of FELTS in the K2 campaigns, using the FELT rate3 determined
from the PS1 sample (see Supporting Material). Other samples of fast transients from the
Supernova Legacy Survey5, the Palomar Transient Factory5, and the Subaru telescope30, are
brighter, have significantly longer rise times and/or longer event durations, and are therefore
unlikely to be in the same group than FELTS.
Except for KSN2015K, most FELTS have poorly defined rise times, but their decays are
well-documented. Most show steep power law decays with ↵ �0.6 and KSN2015K itself had a
decline from maximum of ↵ ⇡ �1. It has been argued that these steep declines disfavor a shock
breakout in an extended wind model5, since theoretical models 31 predict that the decline of the
light curve following a wind breakout peak is a power law with index of ↵ = �0.3, if in thermal
equilibrium. However, a luminosity decline with ↵ = �0.6 can be achieved by assuming the shock
interacts with a wind, producing an outer ejecta profile with a density index of n = 7 rather than
the typical n = 10� 12 23.
We find that KSN2015K and the fast transients from the PS1 sample are most consistent with
the shock-breakout into a dense circumstellar shell. It reproduces the significant characteristics of
FELTs (fast, bright, blue) without much fine tuning. Even though models with a central engine
can fit the light curve of KSN2015K and other FELTS, it requires an unlikely confluence of rare
occurrences, and therefore is less likely. All of the other models of the power source of these events
cannot explain at least one of their main properties.
9
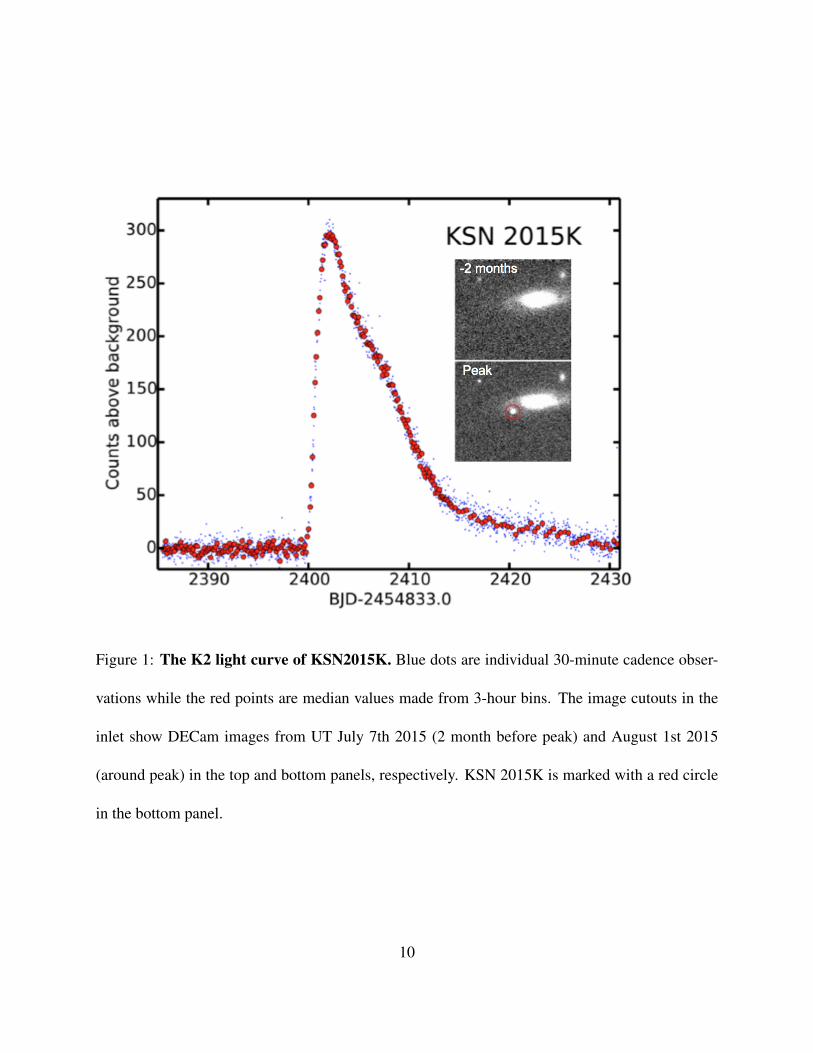
Figure 1: The K2 light curve of KSN2015K. Blue dots are individual 30-minute cadence obser-
vations while the red points are median values made from 3-hour bins. The image cutouts in the
inlet show DECam images from UT July 7th 2015 (2 month before peak) and August 1st 2015
(around peak) in the top and bottom panels, respectively. KSN 2015K is marked with a red circle
in the bottom panel.
10
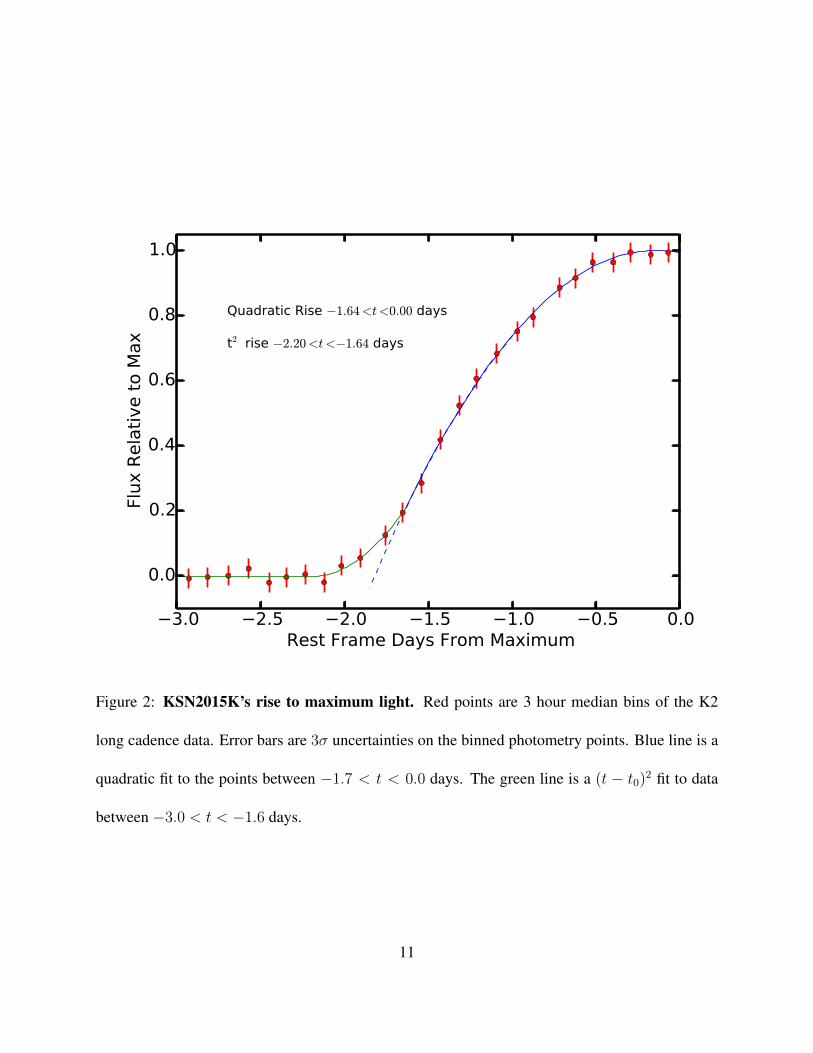
Figure 2: KSN2015K’s rise to maximum light. Red points are 3 hour median bins of the K2
long cadence data. Error bars are 3� uncertainties on the binned photometry points. Blue line is a
quadratic fit to the points between �1.7 < t < 0.0 days. The green line is a (t � t0)2 fit to data
between �3.0 < t < �1.6 days.
11
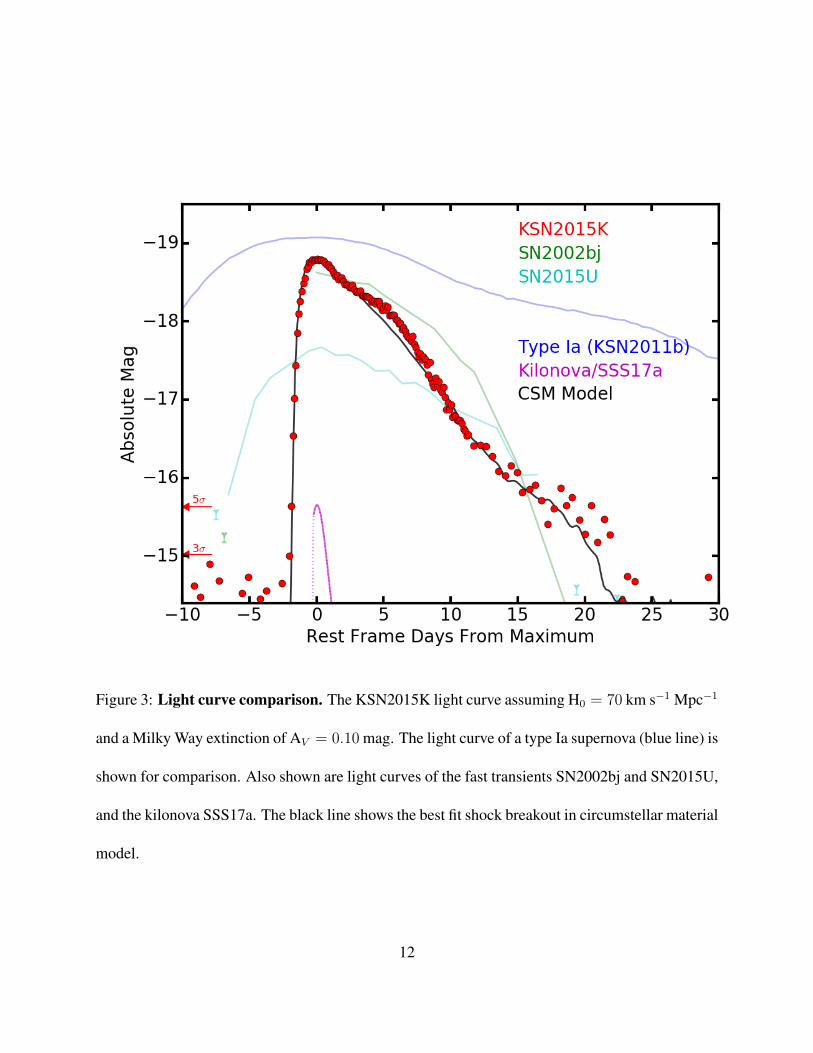
Figure 3: Light curve comparison. The KSN2015K light curve assuming H0 = 70 km s�1 Mpc�1
and a Milky Way extinction of AV = 0.10 mag. The light curve of a type Ia supernova (blue line) is
shown for comparison. Also shown are light curves of the fast transients SN2002bj and SN2015U,
and the kilonova SSS17a. The black line shows the best fit shock breakout in circumstellar material
model.
12
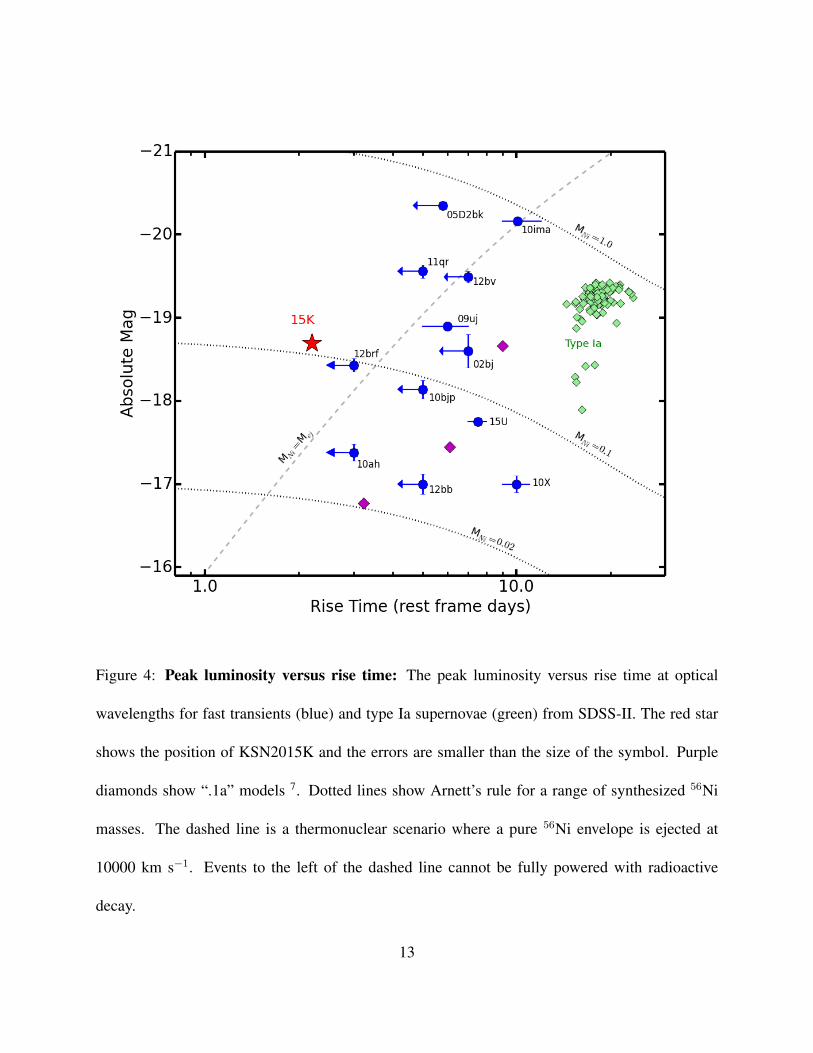
Figure 4: Peak luminosity versus rise time: The peak luminosity versus rise time at optical
wavelengths for fast transients (blue) and type Ia supernovae (green) from SDSS-II. The red star
shows the position of KSN2015K and the errors are smaller than the size of the symbol. Purple
diamonds show “.1a” models 7. Dotted lines show Arnett’s rule for a range of synthesized 56Ni
masses. The dashed line is a thermonuclear scenario where a pure 56Ni envelope is ejected at
10000 km s�1. Events to the left of the dashed line cannot be fully powered with radioactive
decay.
13
1. Poznanski, D. et al. An Unusually Fast-Evolving Supernova. Science 327, 58 (2010).
0911.2699.
2. Kasliwal, M. M. et al. Rapidly Decaying Supernova 2010X: A Candidate “.Ia” Explosion.
ApJ 723, L98–L102 (2010). 1009.0960.
3. Drout, M. R. et al. Rapidly Evolving and Luminous Transients from Pan-STARRS1. ApJ 794,
23 (2014). 1405.3668.
4. Shivvers, I. et al. SN 2015U: a rapidly evolving and luminous Type Ibn supernova. MNRAS
461, 3057–3074 (2016). 1603.04866.
5. Arcavi, I. et al. Rapidly Rising Transients in the Supernova Superluminous Supernova Gap.
ApJ 819, 35 (2016). 1511.00704.
6. Howell, S. B. et al. The K2 Mission: Characterization and Early Results. PASP 126, 398
(2014). 1402.5163.
7. Shen, K. J., Kasen, D., Weinberg, N. N., Bildsten, L. & Scannapieco, E. Thermonuclear .Ia
Supernovae from Helium Shell Detonations: Explosion Models and Observables. ApJ 715,
767–774 (2010). 1002.2258.
8. Dessart, L. et al. Multidimensional Simulations of the Accretion-induced Collapse of White
Dwarfs to Neutron Stars. ApJ 644, 1063–1084 (2006). astro-ph/0601603.
9. Darbha, S. et al. Nickel-rich outflows produced by the accretion-induced collapse of white
dwarfs: light curves and spectra. MNRAS 409, 846–854 (2010). 1005.1081.
14
10. Metzger, B. D. Kilonovae. Living Reviews in Relativity 20, 3 (2017). 1610.09381.
11. Abbott, B. P. et al. Multi-messenger Observations of a Binary Neutron Star Merger. ApJ 848,
L12 (2017). 1710.05833.
12. Tauris, T. M., Langer, N. & Podsiadlowski, P. Ultra-stripped supernovae: progenitors and fate.
MNRAS 451, 2123–2144 (2015). 1505.00270.
13. Moriya, T. et al. Fallback Supernovae: A Possible Origin of Peculiar Supernovae with Ex-
tremely Low Explosion Energies. ApJ 719, 1445–1453 (2010). 1006.5336.
14. Kasen, D., Fernandez, R. & Metzger, B. D. Kilonova light curves from the disc wind outflows
of compact object mergers. MNRAS 450, 1777–1786 (2015). 1411.3726.
15. Moriya, T. J. et al. Light-curve and spectral properties of ultrastripped core-collapse super-
novae leading to binary neutron stars. MNRAS 466, 2085–2098 (2017). 1612.02882.
16. Piro, A. L. & Thompson, T. A. The Signature of Single-degenerate Accretion-induced Col-
lapse. ApJ 794, 28 (2014). 1406.4128.
17. Maeda, K. et al. The Unique Type Ib Supernova 2005bf at Nebular Phases: A Possible Birth
Event of a Strongly Magnetized Neutron Star. ApJ 666, 1069–1082 (2007). 0705.2713.
18. Kasen, D. & Bildsten, L. Supernova Light Curves Powered by Young Magnetars. ApJ 717,
245–249 (2010). 0911.0680.
19. Dexter, J. & Kasen, D. Supernova Light Curves Powered by Fallback Accretion. ApJ 772, 30
(2013). 1210.7240.
15
20. Kasen, D. & Bildsten, L. Supernova Light Curves Powered by Young Magnetars. ApJ 717,
245–249 (2010). 0911.0680.
21. Chevalier, R. A. Neutron star accretion in a supernova. ApJ 346, 847–859 (1989).
22. Stanek, K. Z. et al. Spectroscopic Discovery of the Supernova 2003dh Associated with GRB
030329. ApJ 591, L17–L20 (2003). astro-ph/0304173.
23. Chevalier, R. A. & Irwin, C. M. Shock Breakout in Dense Mass Loss: Luminous Supernovae.
ApJ 729, L6 (2011). 1101.1111.
24. Balberg, S. & Loeb, A. Supernova shock breakout through a wind. MNRAS 414, 1715–1720
(2011). 1101.1489.
25. Ofek, E. O. et al. Supernova PTF 09UJ: A Possible Shock Breakout from a Dense Circum-
stellar Wind. ApJ 724, 1396–1401 (2010). 1009.5378.
26. Ginzburg, S. & Balberg, S. Light Curves from Supernova Shock Breakout through an Ex-
tended Wind. ApJ 780, 18 (2014). 1308.6434.
27. Kleiser, I. K. W. & Kasen, D. Rapidly fading supernovae from massive star explosions. MN-
RAS 438, 318–328 (2014). 1309.4088.
28. Dessart, L., Hillier, D. J., Waldman, R. & Livne, E. Type II-Plateau supernova radia-
tion: dependences on progenitor and explosion properties. MNRAS 433, 1745–1763 (2013).
1305.3386.
16
29. Moriya, T. J., Yoon, S.-C., Grafener, G. & Blinnikov, S. I. Immediate dense circumstellar
environment of supernova progenitors caused by wind acceleration: its effect on supernova
light curves. MNRAS 469, L108–L112 (2017). 1703.03084.
30. Tanaka, M. et al. Rapidly Rising Transients from the Subaru Hyper Suprime-Cam Transient
Survey. ApJ 819, 5 (2016). 1601.03261.
31. Svirski, G., Nakar, E. & Sari, R. Optical to X-Ray Supernova Light Curves Following Shock
Breakout through a Thick Wind. ApJ 759, 108 (2012). 1202.3437.
Acknowledgements This work is partially supported by NASA K2 cycle 4 Grant NNH15ZDA001N and
cycle 5 Grant NNX17AI64G. We acknowledge support from the Australian Research Council Centre of
Excellence for All-sky Astrophysics (CAASTRO), through project number CE110001020.
Competing Interests The authors declare that they have no competing financial interests.
Correspondence Correspondence and requests for materials should be addressed to A. Rest (email: [email protected]).
Author Contributions AR, PMG, BT, and DK contributed to the scientific analysis. DK compared the
data to theoretical models. EJS, RPO, and RM reduced the K2 light curve data. AZ, GS, DJ, and RCS took
and reduced the DECam data. SM and BT obtained and reduced the spectra. FF and VAV contributed the
light curve fitting. All authors contributed to the scientific text.
17