Embed Size (px)
Citation preview
ElGamacy and Van Meervelt J Cheminform (2015) 7:42 DOI 10.1186/s13321-015-0091-5
RESEARCH ARTICLE
A fast topological analysis algorithm for large-scale similarity evaluations of ligands and binding pocketsMohammad ElGamacy1,2 and Luc Van Meervelt2*
Abstract
Motivation: With the rapid increase of the structural data of biomolecular complexes, novel structural analysis methods have to be devised with high-throughput capacity to handle immense data input and to construct massive networks at the minimal computational cost. Moreover, novel methods should be capable of handling a broad range of molecular structural sizes and chemical natures, cognisant of the conformational and electrostatic bases of molecu-lar recognition, and sufficiently accurate to enable contextually relevant biological inferences.
Results: A novel molecular topology comparison method was developed and tested. The method was tested for both ligand and binding pocket similarity analyses and a PDB-wide ligand topological similarity map was computed.
Conclusion: The unprecedentedly wide scope of ligand definition and large-scale topological similarity mapping can provide very robust tools, of performance unmatched by the present alignment-based methods. The method remarkably shows potential for application for scaffold hopping purposes. It also opens new frontiers in the areas of ligand-mediated protein connectivity, ligand-based molecular phylogeny, target fishing, and off-target predictions.
Keywords: Topology comparisons, Ligand-based design, Binding pocket mapping, Virtual high-throughput screening
© 2015 ElGamacy and Van Meervelt. This article is distributed under the terms of the Creative Commons Attribution 4.0 Interna-tional License (http://creativecommons.org/licenses/by/4.0/), which permits unrestricted use, distribution, and reproduction in any medium, provided you give appropriate credit to the original author(s) and the source, provide a link to the Creative Com-mons license, and indicate if changes were made. The Creative Commons Public Domain Dedication waiver (http://creativecom-mons.org/publicdomain/zero/1.0/) applies to the data made available in this article, unless otherwise stated.
BackgroundLarge scale analysis of biomolecular networks has proven to be of great utility in offering genuine insights into molecular interactions and construction of systematic inferences. For instance, this has been demonstrated in protein–protein interactions [1], disease underlying protein networks [2], protein binding pocket analysis [3], shared side-effects networks for drug target iden-tification [4], protein–ligand phylogenetic analysis [5], cross-binding ligand networks [6], and even in network pharmacology [7]. Such analyses are normally based on a wealth of different types of data (e.g. sequence, struc-tural, biochemical assays, chemical, etc.) or combinations thereof, and can provide highly refined, knowledge-based descriptions and models.
The rate of deposition of biomacromolecular struc-tures in the Protein Data Bank (PDB) has been proven to exhibit an exponential growth [8, 9]. This was accom-panied by a trending increase in average resolution and macromolecular complexes sizes. Consequently, there is a need for the design of computational tools and analysis methods capable of efficiently processing such volumes of structural data. This could ultimately enable the con-struction of large scale networks based on the whole rep-ertoire of tertiary and quaternary structures.
The aim of this study was to introduce a new method capable of conducting large scale topology analyses of molecular structures that is specially suited for handling large and complicated topologies while being insensi-tive to minor conformational changes. As the molecular topology is defined here as the 3D structure and its asso-ciated electrostatic landscape, a method capable of effec-tively including the topology information should have a wide variety of applications. Herein, we investigate two
Open Access
*Correspondence: [email protected] 2 Biomolecular Architecture, Chemistry Department, KU Leuven, Celestijnenlaan 200F, box 2404, 3001 Leuven (Heverlee), BelgiumFull list of author information is available at the end of the article
Page 2 of 14ElGamacy and Van Meervelt J Cheminform (2015) 7:42
particular applications to demonstrate such diverse appli-cability: ligand-based and binding pocket-based topol-ogy analyses. The aim was the development of a highly efficient fingerprinting method given the scale of the problem per se (given the expanse of data at the set defi-nitions) and the structurally diverse nature of the envis-aged purposes. Thus, a novel means of high-throughput topological analysis was devised and the algorithmic details of which are outlined below.
Molecular recognition events are at the core of almost every biological process, and are meant to remain an active area of research in both basic and applied realms. Therefore, the ability of reading through and topologi-cally analysing the huge arrays of structural data avail-able comes of a great significance for mapping ligands or their binding cavities into large networks. These include, for example, the elucidation of protein–protein relations in terms of ligand or cavity topological similarity via quantitative measures and the prediction of unreported potential ligand-target interactions by detecting poten-tially cross-binding ligands. Also, extension of the latter for predicting off-target (polypharmacology and toxic-ity) interactions of a query ligand, or extension towards ligand-based drug design by inspecting topology similar-ity between a native ligand as query against a library are possible applications, or even ligand-based target fishing, using instead a single query ligand against the array of native ligands.
Conceptually, this can be done directly by comparing the ligand–ligand structural relations, or alternatively, through comparing the receptor–receptor structural relations in light of the information encoded in the cor-responding binding pockets topologies.
Although the applications are not limited to the above mentioned, in this report, the aim was to emphasise the strength of such large scale analysis method and to demonstrate the capacity to provide a PDB-wide map of topological similarity at very low computational expenses as well as the robustness of the exact implementation in binding pocket classification.
ResultsPDB data preparationAs the PDB coordinates files were split into their con-stituting molecules using OpenBabel, applying the cri-teria described in the “Methods” section, the number of structures obtained was 164,939 without removing any redundancy (as redundancy could be optionally removed downstream the computations upon results parsing), where self-matches indicate similarity between repeated PDB molecules with slightly different conformations. These molecules were the ones subject to the topological analysis.
Case studiesMultiple cases were investigated for a critical assessment of the algorithm’s strengths and liabilities. This was done by running searches (against all of the ligands retrieved from the database) and analysing the top results for a number of diverse target-bound structures of different chemical natures, where the query structure and search space topologies were only obtained from the target-bound conformations in the PDB structure.
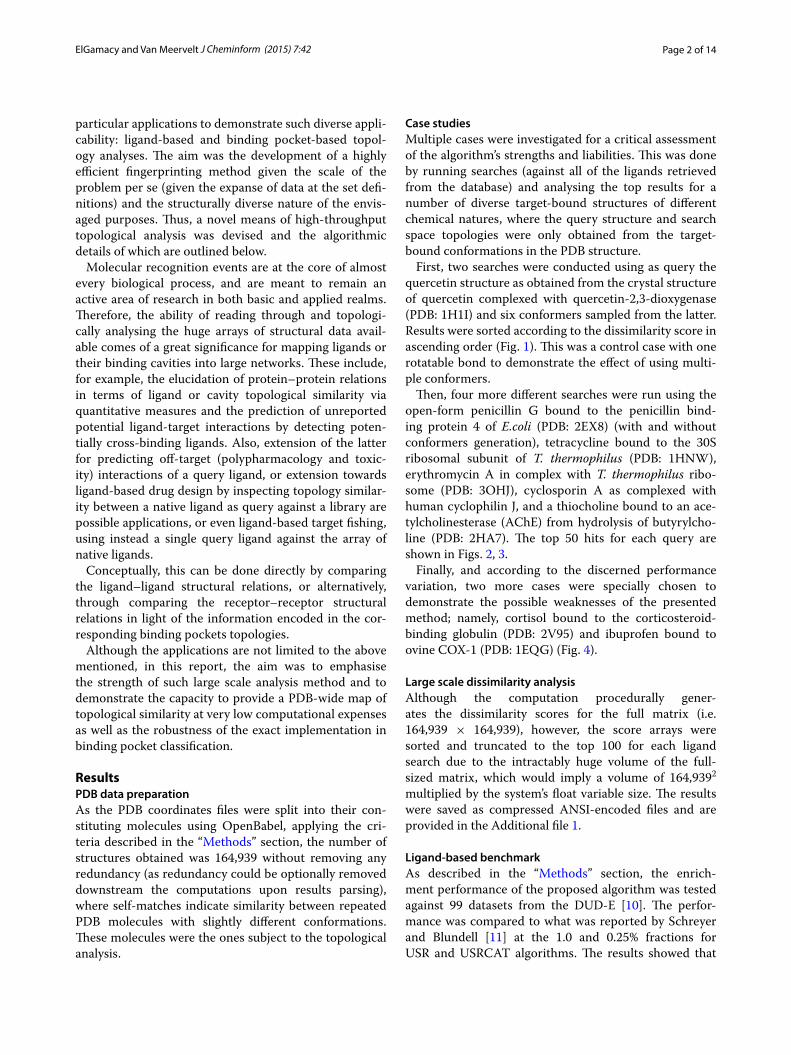
First, two searches were conducted using as query the quercetin structure as obtained from the crystal structure of quercetin complexed with quercetin-2,3-dioxygenase (PDB: 1H1I) and six conformers sampled from the latter. Results were sorted according to the dissimilarity score in ascending order (Fig. 1). This was a control case with one rotatable bond to demonstrate the effect of using multi-ple conformers.
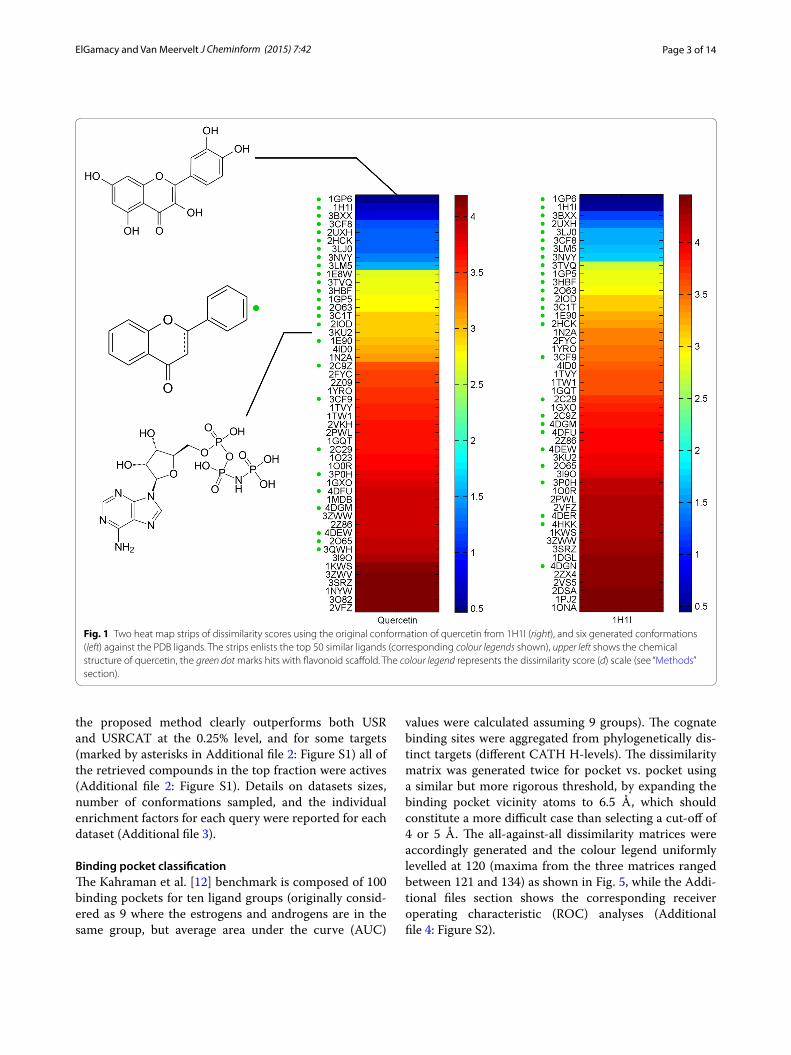
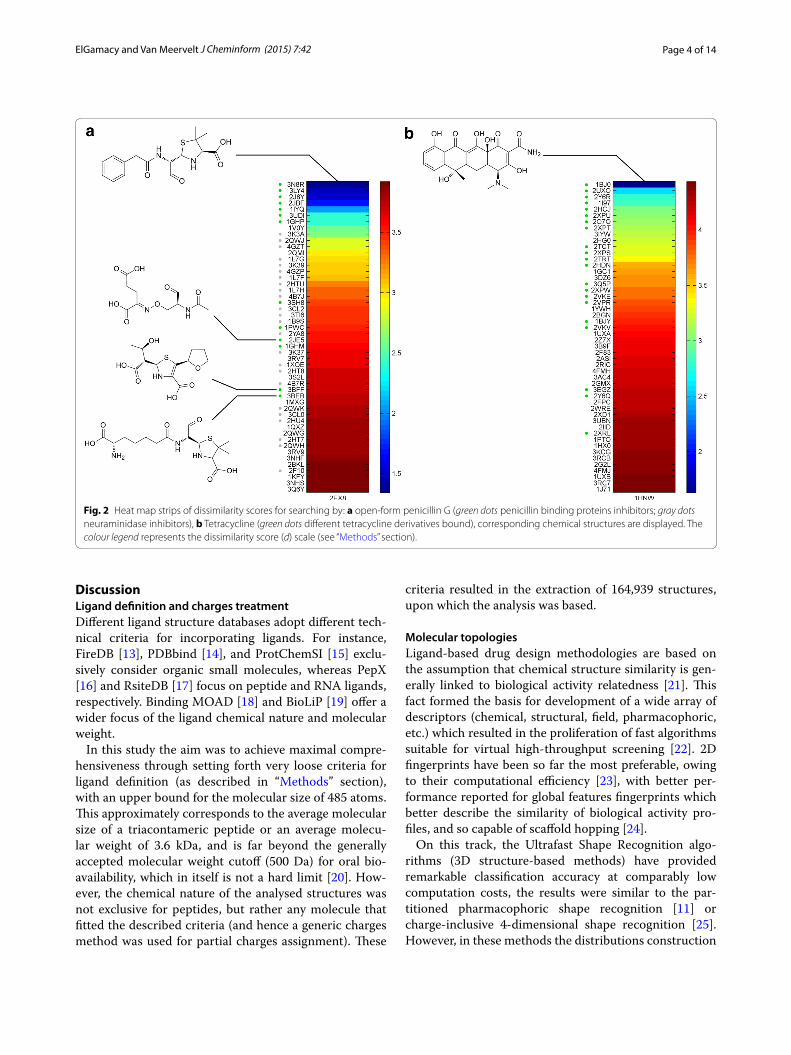
Then, four more different searches were run using the open-form penicillin G bound to the penicillin bind-ing protein 4 of E.coli (PDB: 2EX8) (with and without conformers generation), tetracycline bound to the 30S ribosomal subunit of T. thermophilus (PDB: 1HNW), erythromycin A in complex with T. thermophilus ribo-some (PDB: 3OHJ), cyclosporin A as complexed with human cyclophilin J, and a thiocholine bound to an ace-tylcholinesterase (AChE) from hydrolysis of butyrylcho-line (PDB: 2HA7). The top 50 hits for each query are shown in Figs. 2, 3.
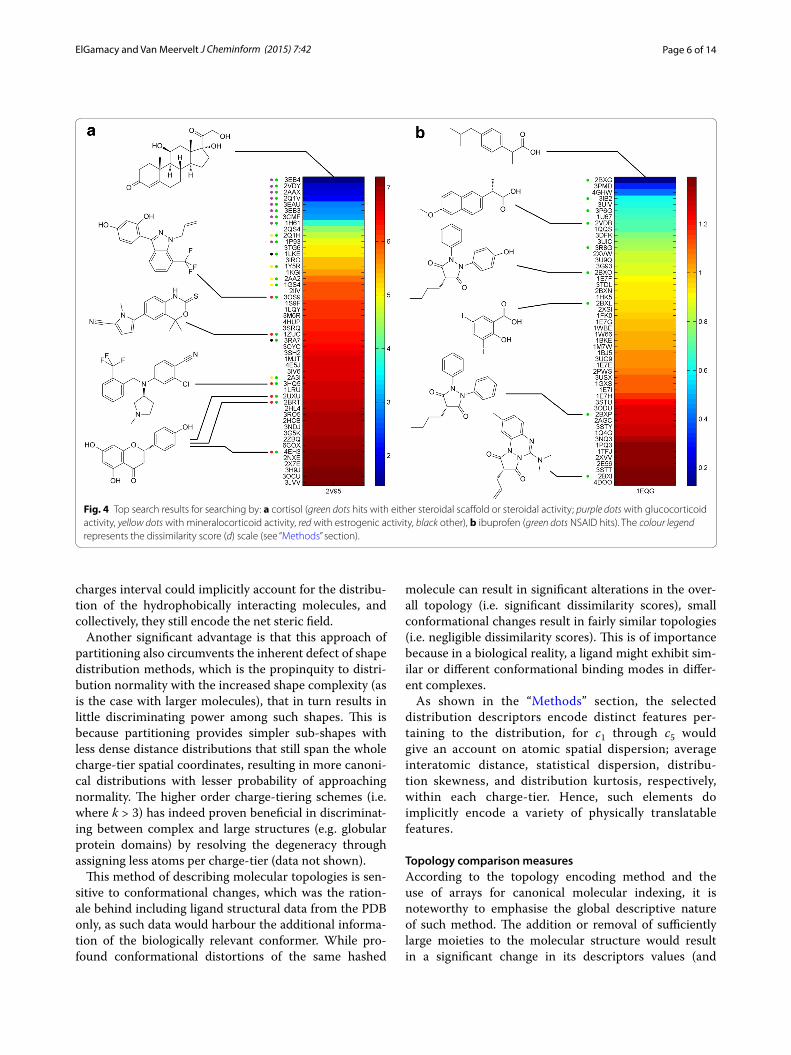
Finally, and according to the discerned performance variation, two more cases were specially chosen to demonstrate the possible weaknesses of the presented method; namely, cortisol bound to the corticosteroid-binding globulin (PDB: 2V95) and ibuprofen bound to ovine COX-1 (PDB: 1EQG) (Fig. 4).
Large scale dissimilarity analysisAlthough the computation procedurally gener-ates the dissimilarity scores for the full matrix (i.e. 164,939 × 164,939), however, the score arrays were sorted and truncated to the top 100 for each ligand search due to the intractably huge volume of the full-sized matrix, which would imply a volume of 164,9392 multiplied by the system’s float variable size. The results were saved as compressed ANSI-encoded files and are provided in the Additional file 1.
Ligand‑based benchmarkAs described in the “Methods” section, the enrich-ment performance of the proposed algorithm was tested against 99 datasets from the DUD-E [10]. The perfor-mance was compared to what was reported by Schreyer and Blundell [11] at the 1.0 and 0.25% fractions for USR and USRCAT algorithms. The results showed that
Page 3 of 14ElGamacy and Van Meervelt J Cheminform (2015) 7:42
the proposed method clearly outperforms both USR and USRCAT at the 0.25% level, and for some targets (marked by asterisks in Additional file 2: Figure S1) all of the retrieved compounds in the top fraction were actives (Additional file 2: Figure S1). Details on datasets sizes, number of conformations sampled, and the individual enrichment factors for each query were reported for each dataset (Additional file 3).
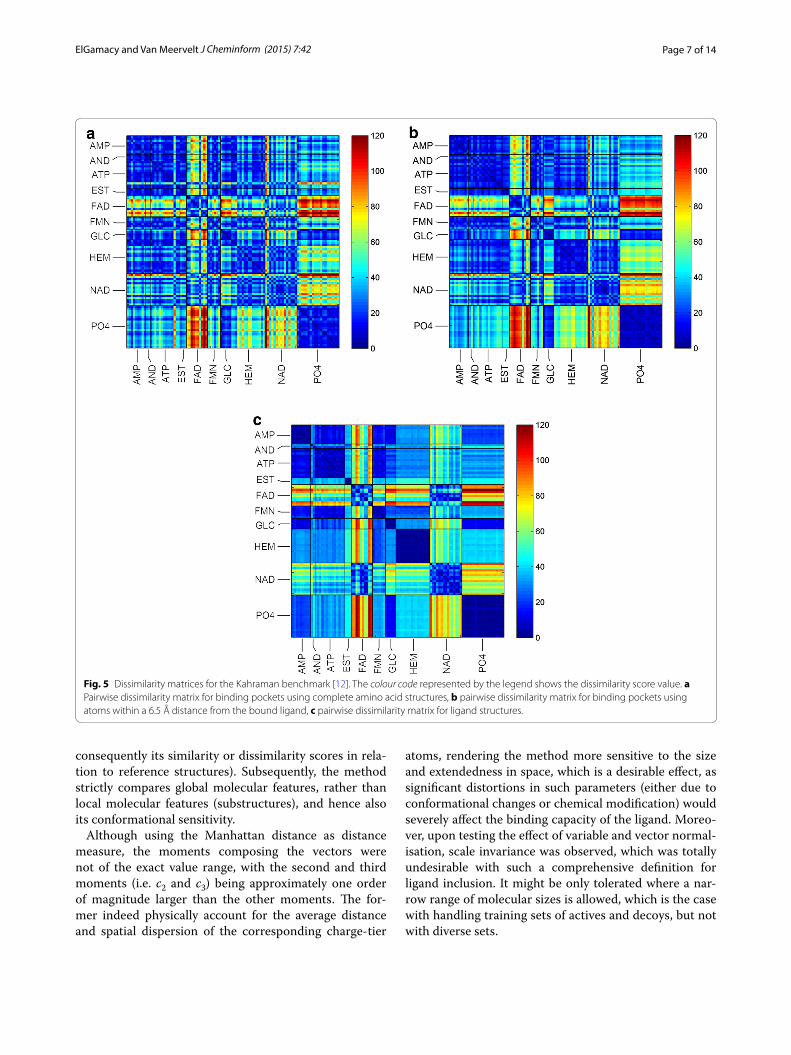
Binding pocket classificationThe Kahraman et al. [12] benchmark is composed of 100 binding pockets for ten ligand groups (originally consid-ered as 9 where the estrogens and androgens are in the same group, but average area under the curve (AUC)
values were calculated assuming 9 groups). The cognate binding sites were aggregated from phylogenetically dis-tinct targets (different CATH H-levels). The dissimilarity matrix was generated twice for pocket vs. pocket using a similar but more rigorous threshold, by expanding the binding pocket vicinity atoms to 6.5 Å, which should constitute a more difficult case than selecting a cut-off of 4 or 5 Å. The all-against-all dissimilarity matrices were accordingly generated and the colour legend uniformly levelled at 120 (maxima from the three matrices ranged between 121 and 134) as shown in Fig. 5, while the Addi-tional files section shows the corresponding receiver operating characteristic (ROC) analyses (Additional file 4: Figure S2).
Fig. 1 Two heat map strips of dissimilarity scores using the original conformation of quercetin from 1H1I (right), and six generated conformations (left) against the PDB ligands. The strips enlists the top 50 similar ligands (corresponding colour legends shown), upper left shows the chemical structure of quercetin, the green dot marks hits with flavonoid scaffold. The colour legend represents the dissimilarity score (d) scale (see “Methods” section).
Page 4 of 14ElGamacy and Van Meervelt J Cheminform (2015) 7:42
DiscussionLigand definition and charges treatmentDifferent ligand structure databases adopt different tech-nical criteria for incorporating ligands. For instance, FireDB [13], PDBbind [14], and ProtChemSI [15] exclu-sively consider organic small molecules, whereas PepX [16] and RsiteDB [17] focus on peptide and RNA ligands, respectively. Binding MOAD [18] and BioLiP [19] offer a wider focus of the ligand chemical nature and molecular weight.
In this study the aim was to achieve maximal compre-hensiveness through setting forth very loose criteria for ligand definition (as described in “Methods” section), with an upper bound for the molecular size of 485 atoms. This approximately corresponds to the average molecular size of a triacontameric peptide or an average molecu-lar weight of 3.6 kDa, and is far beyond the generally accepted molecular weight cutoff (500 Da) for oral bio-availability, which in itself is not a hard limit [20]. How-ever, the chemical nature of the analysed structures was not exclusive for peptides, but rather any molecule that fitted the described criteria (and hence a generic charges method was used for partial charges assignment). These
criteria resulted in the extraction of 164,939 structures, upon which the analysis was based.
Molecular topologiesLigand-based drug design methodologies are based on the assumption that chemical structure similarity is gen-erally linked to biological activity relatedness [21]. This fact formed the basis for development of a wide array of descriptors (chemical, structural, field, pharmacophoric, etc.) which resulted in the proliferation of fast algorithms suitable for virtual high-throughput screening [22]. 2D fingerprints have been so far the most preferable, owing to their computational efficiency [23], with better per-formance reported for global features fingerprints which better describe the similarity of biological activity pro-files, and so capable of scaffold hopping [24].
On this track, the Ultrafast Shape Recognition algo-rithms (3D structure-based methods) have provided remarkable classification accuracy at comparably low computation costs, the results were similar to the par-titioned pharmacophoric shape recognition [11] or charge-inclusive 4-dimensional shape recognition [25]. However, in these methods the distributions construction
Fig. 2 Heat map strips of dissimilarity scores for searching by: a open-form penicillin G (green dots penicillin binding proteins inhibitors; gray dots neuraminidase inhibitors), b Tetracycline (green dots different tetracycline derivatives bound), corresponding chemical structures are displayed. The colour legend represents the dissimilarity score (d) scale (see “Methods” section).
Page 5 of 14ElGamacy and Van Meervelt J Cheminform (2015) 7:42
essentially relies on centroid definitions as discussed in the original publications [25, 26], the mapping of which is highly sensitive to small conformational changes, espe-cially, with large-sized molecules (e.g. side-chain flexibil-ity in a folded peptide). Slight changes in conformations could result in a significantly different centroid mapping, and consequently totally different shape distributions and potential inaccuracy in molecular similarity calcula-tion. Additionally, in the latter method, which treats the atomic partial charge as a fourth dimension in describ-ing the atom position vector, charge scaling must be made, and the way adopted for that was purely a matter of trial-and-error to obtain the best enrichment factors. As a consequence the optimal value of the scaling factor relies on the validation set being used, which might not be an appropriate means if the data set optimal scaling factor happens to be different from the benchmarking set. Lastly, vector normalisation in those methods would contribute to scale invariance as described below, which makes the method unsuitable for handling datasets con-taining broad size variance.
The proposed algorithm was sought to avoid such drawbacks by detouring centroid definitions and
constructing distributions of all possible pairwise inter-atomic distances, instead of centroid-atom distances. Averting the inclusion of the scaled partial charges as a fourth dimension was done by partitioning atom groups into separate charge-tiers. This approach effectively decreases the computation cost of the distribution sam-pling from roughly O(n2) to O
(
n2
k
)
, where n is the num-ber of atoms, and k is the number of charge-tiers.
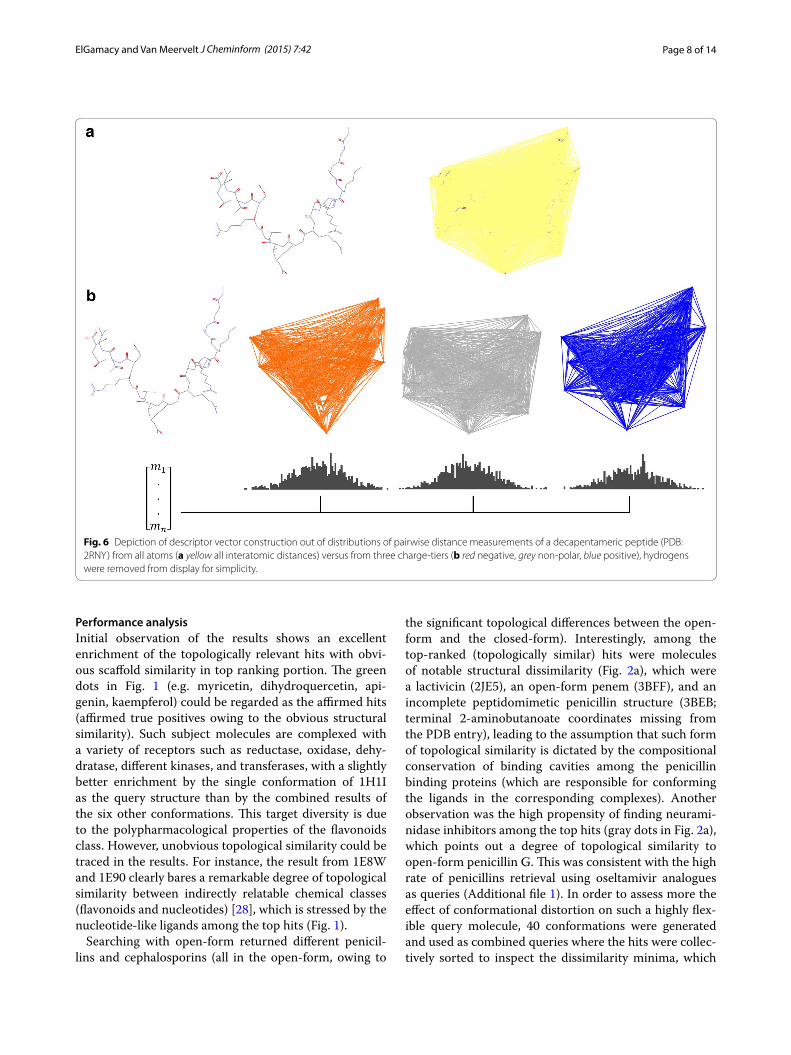
Since this method is a variant of shape distribution algorithms [27], it has advantages of translational and rotational invariance, and hence very fast topological matching after initial descriptor vectors have been com-puted. As an illustration, a graphical depiction of the distance measurements was made for a folded conforma-tion of an acetylated truncated (decapentameric) histone peptide (PDB: 2RNY), with global (Fig. 6a) and parti-tioned (Fig. 6b) distance measurements. As the global distribution sampling would harbour information perti-nent only to the overall molecular steric field, it cannot describe any electrostatic details. Therefore, partitioning the atoms into separate charge groups can be described as a form of coarse-grained encoding of the electrostatic field, whereas the charge-tier comprising the non-polar
Fig. 3 Heat map strips of dissimilarity scores for searching by: a erythromycin A (green dots different protein synthesis inhibitor macrolides), b cyclosporin A (green dots different immunosuppressant cyclosporin derivatives). The colour legend represents the dissimilarity score (d) scale (see “Methods” section).
Page 6 of 14ElGamacy and Van Meervelt J Cheminform (2015) 7:42
charges interval could implicitly account for the distribu-tion of the hydrophobically interacting molecules, and collectively, they still encode the net steric field.
Another significant advantage is that this approach of partitioning also circumvents the inherent defect of shape distribution methods, which is the propinquity to distri-bution normality with the increased shape complexity (as is the case with larger molecules), that in turn results in little discriminating power among such shapes. This is because partitioning provides simpler sub-shapes with less dense distance distributions that still span the whole charge-tier spatial coordinates, resulting in more canoni-cal distributions with lesser probability of approaching normality. The higher order charge-tiering schemes (i.e. where k > 3) has indeed proven beneficial in discriminat-ing between complex and large structures (e.g. globular protein domains) by resolving the degeneracy through assigning less atoms per charge-tier (data not shown).
This method of describing molecular topologies is sen-sitive to conformational changes, which was the ration-ale behind including ligand structural data from the PDB only, as such data would harbour the additional informa-tion of the biologically relevant conformer. While pro-found conformational distortions of the same hashed
molecule can result in significant alterations in the over-all topology (i.e. significant dissimilarity scores), small conformational changes result in fairly similar topologies (i.e. negligible dissimilarity scores). This is of importance because in a biological reality, a ligand might exhibit sim-ilar or different conformational binding modes in differ-ent complexes.
As shown in the “Methods” section, the selected distribution descriptors encode distinct features per-taining to the distribution, for c1 through c5 would give an account on atomic spatial dispersion; average interatomic distance, statistical dispersion, distribu-tion skewness, and distribution kurtosis, respectively, within each charge-tier. Hence, such elements do implicitly encode a variety of physically translatable features.
Topology comparison measuresAccording to the topology encoding method and the use of arrays for canonical molecular indexing, it is noteworthy to emphasise the global descriptive nature of such method. The addition or removal of sufficiently large moieties to the molecular structure would result in a significant change in its descriptors values (and
Fig. 4 Top search results for searching by: a cortisol (green dots hits with either steroidal scaffold or steroidal activity; purple dots with glucocorticoid activity, yellow dots with mineralocorticoid activity, red with estrogenic activity, black other), b ibuprofen (green dots NSAID hits). The colour legend represents the dissimilarity score (d) scale (see “Methods” section).
Page 7 of 14ElGamacy and Van Meervelt J Cheminform (2015) 7:42
consequently its similarity or dissimilarity scores in rela-tion to reference structures). Subsequently, the method strictly compares global molecular features, rather than local molecular features (substructures), and hence also its conformational sensitivity.
Although using the Manhattan distance as distance measure, the moments composing the vectors were not of the exact value range, with the second and third moments (i.e. c2 and c3) being approximately one order of magnitude larger than the other moments. The for-mer indeed physically account for the average distance and spatial dispersion of the corresponding charge-tier
atoms, rendering the method more sensitive to the size and extendedness in space, which is a desirable effect, as significant distortions in such parameters (either due to conformational changes or chemical modification) would severely affect the binding capacity of the ligand. Moreo-ver, upon testing the effect of variable and vector normal-isation, scale invariance was observed, which was totally undesirable with such a comprehensive definition for ligand inclusion. It might be only tolerated where a nar-row range of molecular sizes is allowed, which is the case with handling training sets of actives and decoys, but not with diverse sets.
Fig. 5 Dissimilarity matrices for the Kahraman benchmark [12]. The colour code represented by the legend shows the dissimilarity score value. a Pairwise dissimilarity matrix for binding pockets using complete amino acid structures, b pairwise dissimilarity matrix for binding pockets using atoms within a 6.5 Å distance from the bound ligand, c pairwise dissimilarity matrix for ligand structures.
Page 8 of 14ElGamacy and Van Meervelt J Cheminform (2015) 7:42
Performance analysisInitial observation of the results shows an excellent enrichment of the topologically relevant hits with obvi-ous scaffold similarity in top ranking portion. The green dots in Fig. 1 (e.g. myricetin, dihydroquercetin, api-genin, kaempferol) could be regarded as the affirmed hits (affirmed true positives owing to the obvious structural similarity). Such subject molecules are complexed with a variety of receptors such as reductase, oxidase, dehy-dratase, different kinases, and transferases, with a slightly better enrichment by the single conformation of 1H1I as the query structure than by the combined results of the six other conformations. This target diversity is due to the polypharmacological properties of the flavonoids class. However, unobvious topological similarity could be traced in the results. For instance, the result from 1E8W and 1E90 clearly bares a remarkable degree of topological similarity between indirectly relatable chemical classes (flavonoids and nucleotides) [28], which is stressed by the nucleotide-like ligands among the top hits (Fig. 1).
Searching with open-form returned different penicil-lins and cephalosporins (all in the open-form, owing to
the significant topological differences between the open-form and the closed-form). Interestingly, among the top-ranked (topologically similar) hits were molecules of notable structural dissimilarity (Fig. 2a), which were a lactivicin (2JE5), an open-form penem (3BFF), and an incomplete peptidomimetic penicillin structure (3BEB; terminal 2-aminobutanoate coordinates missing from the PDB entry), leading to the assumption that such form of topological similarity is dictated by the compositional conservation of binding cavities among the penicillin binding proteins (which are responsible for conforming the ligands in the corresponding complexes). Another observation was the high propensity of finding neurami-nidase inhibitors among the top hits (gray dots in Fig. 2a), which points out a degree of topological similarity to open-form penicillin G. This was consistent with the high rate of penicillins retrieval using oseltamivir analogues as queries (Additional file 1). In order to assess more the effect of conformational distortion on such a highly flex-ible query molecule, 40 conformations were generated and used as combined queries where the hits were collec-tively sorted to inspect the dissimilarity minima, which
Fig. 6 Depiction of descriptor vector construction out of distributions of pairwise distance measurements of a decapentameric peptide (PDB: 2RNY) from all atoms (a yellow all interatomic distances) versus from three charge-tiers (b red negative, grey non-polar, blue positive), hydrogens were removed from display for simplicity.
Page 9 of 14ElGamacy and Van Meervelt J Cheminform (2015) 7:42
as expected resulted in a much lower hit-rate among the top 50 which is expected due to the 40× expansion of the search results.
A very good enrichment was also observed for tetracy-cline (Fig. 2b) and the results comprised different tetracy-cline derivatives bound to different proteins (tetracycline repressors, Tetx monooxygenases, multidrug binding protein, elongation factor Tu, ribosomal subunit and a tetracycline aptamer). Another polyketide, the macro-cyclic lactam-based antibiotic, erythromycin A (Fig. 3a) was used as a search query. The latter retrieved different but related macrolides bound to different targets. The retrieved ligands contained erythromythin derivatives as well as other macrolides (clarythromycin, oleandomycin, telithromycin and azithromycin). The hits were bound to different targets including ribosomal subunits, macrolide biosensor proteins, macrolide glycosyltransferases, mul-tidrug exporter protein and cytochrome P450.
In order to demonstrate the effect of the query struc-ture size, a relatively large molecule was used as query. The cyclic non-ribosomal peptide cyclosporin A (a potent immunosuppressant), which is approximately 1.2 kDa, was chosen. The query conformation was of the cyclophillin J bound state. Results (Fig. 3b) show superior enrichment performance compared to other small molecule examples, comprising different modified cyclosporins.
As an additional case where the binding pocket is nar-row and the ligand is small, searching with the structure of an AChE-bound thiocholine query structure was per-formed. The retrieved top hits were enriched with cho-line derivatives (or mimetics) bound in a very similar (extended) conformation to a variety of specific targets from distant proteins; including acetylcholinesterases, acetylcholine binding proteins, choline transporters, a choline acetyltransferase and a choline kinase (Additional file 5: Figure S3). This may point to the role of specific binding in rigidifying the ligand pose in related bind-ing pockets (in this case, the prevailing feature was the cation-π contact with anchoring hydrogen bond by the hydroxyl/thiol functional group).
As a general observation, score trends appear to be conforming to the enrichment performance, which could be deduced from the number of affirmed hits in the top scoring fractions, as a very high concentration of affirmed hits were found roughly around and below a dis-similarity score value of 4. It was also noticed that sub-structure overlapping hits become more evident with the trendy increase in dissimilarity scores, however, if such sub-structures are of small size proportion, then major topological differences exist with the consequence of an abrupt increase in the dissimilarity score.
In view of the test-cases results, some main factors were noticed to influence the enrichment. Firstly, the molecular size of the query structure, as this would entail more distinct topological features (as long as the distri-butions are not excessively dense per charge partitioning scheme) which was clearly illustrated by the cyclosporine example. At large molecular sizes the distribution shapes become less sensitive to the relatively small sized chemi-cal modifications, or proportionally subtle conforma-tional changes as compared to major fold alterations. This should be considered inline with the expectation that better enrichment at a particular molecular size is achieved when the query structure atoms are best dis-persed between the different charge-tiers; the situation where the intramolecular atomic charge diversity is great-est. Secondly, the relative abundance of the topological classes in the PDB can directly affect the respective num-ber of true positive hits in the top ranking fraction when searching for under-represented topologies. Noteworthy, with the advancement of structural data deposition rates, this should be subdued with time. Thirdly, in case of covalent inhibitors, which do not abide by a well-defined pharmacophore, these are expected to be distantly scored from non-covalently interacting ligands. Finally, in some ligand classes the biological response or target specificity can vary significantly upon very slight chemical modifica-tions, and subsequently, minor topological modifications. Therefore specific analysis methods need to be addi-tionally considered when studying such classes with the described method.
In order to demonstrate this, two special cases are shown. Corticosteroids can provide an example of rigid ligands that can exhibit a very wide range of biologi-cal activities upon minor chemical modification of its nucleus. This implies that minor topological changes can significantly alter the receptor specificity. In fact this was evidently observed upon the analysis of the top hits when using cortisol as the query structure (Fig. 4a). The results comprise corticosteroids of diverse biological effects and not just glucocorticoids (i.e. mineralocorticoids, estro-genic compounds, as well as other steroidal topologies), and interestingly, various non-steroidal structures with steroidal activity (modulating different steroidal recep-tors) were also entrained in the top hits, which further stresses the capacity of the method to identify structur-ally unrelated topological similarity between different ligands. The other case was ibuprofen, which is a rela-tively small molecule, and effectively underlines the low accuracy that can originate from sub-structural similarity and the poor level of topological discrimination at such small molecular sizes. This is due to interference from other small molecules with relatively close distribution
Page 10 of 14ElGamacy and Van Meervelt J Cheminform (2015) 7:42
averages and or their narrow variances. This is evident from the very low dissimilarity scores reported and the relatively poor enrichment performance (Fig. 4b). How-ever, ligands of the same pharmacology with unrelated structures are still among the top hits.
Ligand‑based virtual screening benchmarkTo demonstrate the fitness of the proposed method for applications for the purpose of ligand-based vir-tual screening, the enrichment performance was tested against datasets from the DUD-E [10]. The targets spanned a diverse group of ninety-nine receptors and enzymes of strong pharmacological relevance. The enrichment results were compared to those of the USR [26] and the USRCAT method [11]. Analysing the enrich-ment performance at a top scoring fraction of 1.0% shows a clearly superior enrichment compared to the USR (higher enrichment factors for 83 out of 99 datasets), which was not the case for USRCAT (higher enrich-ment factors for 42 out of 99 datasets), albeit that some targets (e.g. FPPS, SAHH or PUR2) witnessed a great boost in enrichment. More interestingly, was the per-formance boost for various targets at the 0.25% fraction and the superior enrichment in comparison to both, the USR (higher enrichment factors for 81 out of 99 datasets) and USRCAT (higher enrichment factors for 66 out of 99 datasets). Noteworthy, is the number of cases at the 0.25% fraction where the average enrichment factors were incalculable (using the equation described in the “Methods” section), as some actives as queries retrieved no negative hits in this fraction of top hits (Additional file 2: Figure S1; Additional file 3). This boost in enrich-ment may be attributed to the aforementioned algo-rithmic design differences which build on the previous methods weaknesses. This also bares the method’s com-petence as a practical choice for ligand-based drug design applications, especially, with its demonstrated chemo-type-insensitivity, and thus, its capacity for scaffold-hop-ping design.
Binding pocket classification benchmarkThe demand for protein sequence- and secondary struc-ture-independent methods for mapping binding pockets has risen recently for the purposes of binding site clas-sification, functional relationships predictions, and pre-diction of pharmacological intersections [29, 30]. To this end, pharmacophore multiplets-based fingerprints have been reported for representing both binding pockets and ligands [31, 32], but which are expected to behave simi-larly to other pharmacophore-based methods.
It is arguably safe to assume that the binding cleft on a receptor harbours sufficient information to encode the shape complementarity between the ligand and the
receptor, and thus, ligand–ligand structural similarity should imply pocket–pocket similarity, and vice versa. However, Kahraman et al. [12] concluded that perfect shape complementarity is not necessarily observed in natural complexes, and that the binding pockets even exhibit, on average, a threefold larger cleft volume than the bound ligands. Therefore, they tried to readjust their spherical harmonic shape signature by normalising their shape coefficients to eliminate size-based interference, and conversely by using zeroth order coefficients to elimi-nate shape-based interference. These tests were applied to their three models; the Conserved Cleft (fingerprinting restricted to conserved cleft regions shapes), Interact Cleft (fingerprinting restricted to protein atoms interacting with the ligand), and Ligand Cleft (fingerprinting restricted to ligand atoms). Their best cleft vs. cleft performance resulted in AUC values of 0.53 (Conserved Cleft model) and 0.77 (Interact Cleft model). Our models for cleft defi-nition were defined to be more rigorous; in our first model we used all of the cleft residues atoms (including backbone atoms) (Fig. 5a; Additional file 4: Figure S2A), in the sec-ond model we used a uniform atom inclusion distance from the ligand of 6.5 Å (which is around 2.6 Å further than HBPLUS interaction distance cut-off) (Fig. 5b; Addi-tional file 4: Figure S2B). Interestingly, our average AUC values are much better, with values of 0.76 and 0.85 for the first and second models, respectively. The results were still better compared to more recent reports of the PSIM method [33] and the Top-3 method [34] which yielded average ROC AUC values of 0.79 and 0.82, respectively.
The superiority of the represented—albeit still a global geometrical fingerprint—to the above discussed spherical harmonic signature could be attributed to the electrostatic (and implicitly the hydrophobic) informa-tion encoded in it. Notably, the average AUC values are almost similar between the two methods when compar-ing ligands (0.94 for the method presented here, and 0.92 for the spherical harmonics fingerprint). This per-formance similarity for ligands can be attributed to the much simpler topologies in comparison to their binding pockets and the very small size of the benchmarking set, which renders it an easier classification task for a shape-only signature. It can also be observed that in general more rigid molecules tend to be better classified as noted above (Additional file 4: Figure S2C; e.g. FMN vs. FAD, AMP vs. ATP and NAD vs. FAD).
Considering the ligand–ligand similarity as the ground truth (Fig. 5c), we demonstrate the presence of a reminis-cent similarity footprint at the pocket–pocket side. The dissimilarity matrices (Fig. 5) bare this proposition and show that the pattern becomes clearer as atoms closer to the interior of the cleft are exclusively fingerprinted (Fig. 5b). This pocket–pocket similarity is that of the
Page 11 of 14ElGamacy and Van Meervelt J Cheminform (2015) 7:42
ligand’s complementary topology, which is supposed to provide the above-random relationships between inter-nal pocket topologies regardless of their amino acid sequence composition.
ConclusionA novel molecular topology comparison method that is based on a combined shape distribution and charge bin-ning scheme was described. The method presented bared the advantages of: generality as to the input chemical structures, capability of handling a wide range of struc-tural sizes, demonstrable utility in scaffold hopping design (which is a merit of ligand-based design), suit-ability for high-throughput searches (due to the very low CPU-footprint of the calculations involved) and superior performance in mapping of binding cavities.
Although no attempts of tuning the performance of the method for the sake of maximal generality, the descrip-tor vectors are very easily amenable to machine learning implementation, which is expected to greatly enhance the discrimination power of the method (albeit at the cost of generality and the requirement of a training set). This generality was evidently useful in obviating a clear rela-tion between the pairwise pocket dissimilarity patterns and the corresponding pairwise ligand patterns, which were generated by the exact same implementation. More-over, the method was able to capture topological relation-ships between pharmacologically similar but chemically dissimilar ligand classes. These features combined, may allow the use of the described method for a large-scale study of ligand and binding-site promiscuity determi-nants, and potentially, the prediction of ligand selectivity in prospective scenarios based on topological similarity profiles.
As an outlook from the findings above, we foresee the development of an ultra-fast implementation of a 3D local topological mapping (as opposed to the global mapping described) and surface-restricted sampling, for the purpose of capturing sub-structural relations and acquiring only the surface-laden information (which is the most pertinent to the molecular recognition events), respectively.
MethodsPDB data treatment and structure preparationA snapshot of all of the Protein Data Bank entries (the 1st of January-2013 release) was obtained from the relevant ftp server (ftp://snapshots.wwpdb.org/) which amounted to 87,090 PDB coordinates files.
The coordinates were then processed by removing all records pertaining to molecules comprised of less than 10 atoms (including solvent atoms and monoatomic ions), and for the sake of charge treatment generality,
organometallic complexes were stripped of their metal-lic cores. For multi-model PDB files, the first model was extracted as the representative of the corresponding entry coordinates. The upper cut-off for the ligand num-ber of atoms was defined as 485 atoms regardless of its chemical nature.
Because of the heterogeneous chemical nature of the processed molecules, the atomic partial charges were computed using a general charges method; hydrogens were added to the structures at a pH of 7.4 and Gasteiger charges were assigned using Open Babel [35]. The gener-ation of conformations in some test-cases was carried out using Confab [36]. The conformation sampling procedure used an RMSD cutoff of 0.65 Å, energy cutoff of 35 kcal/mol, and a maximum of of 5,000 sampled conformers while keeping the input conformer.
Topological computations and fingerprintingThe Python programming language [37], and the NumPy and SciPy packages [38] were used to implement the algorithm of molecular topology fingerprinting, which consisted of the following main steps: (1) partitioning the molecular coordinates into different charge-tiers, i.e. each of the latter contains a substructure of atoms belonging to its partial charge interval; (2) pairwise shape distribution matrices are computed within each charge-tier; (3) a vector was constructed for each molecule, the components of which are descriptors of the respective shape distributions.
In the first step, after inspecting the full propensity distribution of atomic charges of all the ligand atoms, tripartite partitioning was performed among three charge-tiers. The intervals net charge bounds were selected as: greater than +0.1, smaller than or equal +0.1 and greater than or equal −0.1, and smaller than −0.1. These intervals lead to a reasonably symmetrical popula-tion of the charge-tiers (to avoid charge bias).
The fifteen elements composing a descriptor vector; five distribution descriptors of each of the three distribu-tions (of each charge-tier), were calculated as follows:
c1 =
∑ni=1
∑nj=1 xij
n3
c2 = xij
c3 =1
n2
n∑
i=1
n∑
j=1
(xij − xij)2
c4 =
1
n2
∑ni=1
∑nj=1(xij − xij)
3
(m3)3/2
Page 12 of 14ElGamacy and Van Meervelt J Cheminform (2015) 7:42
where xij is the atomic pairwise distance between the ith and the jth atoms in the distances matrix (skipping the diagonal points; where i = j), c2 is the sample mean, c3 is the sample variance, c4 is the distribution skewness, while c5 is the distribution Fisher kurtosis. Zero- or one-atom-tiers had their corresponding moments elements valued to zero. Although the contribution of some elements to the inter-vector distances is much greater than others (which is also influenced by general structural features of the dataset), all the described elements were kept for their potential utility in combination with weighting fac-tors (e.g. in a machine learning context).
Dissimilarity quantificationSince the distribution descriptors information was loaded into a vector form, various vector distance meas-ures could provide a quantitative estimate. Although the moments’ values were not of the same unit, neither vector nor variable normalisation was adopted (due to reasons in the discussion section), and for comparing descriptor vectors the Manhattan distance was used as follows:
where d is the dissimilarity score between the vectors v1 and v2, which was intended in order to give equal weights to all of the moments composing a vector. This gave bet-ter performance than the Euclidian distance, but also provides a linear response upon vector element reweight-ing (e.g. in machine learning applications). Alternatively, clustering approaches could be used, which can be opti-mised to give better results, albeit on the expense of the computation cost.
A testing implementation of the described method was made available (Additional file 6).
Test casesSeven different examples were selected for assessing the capacity of the method of detecting ligand-based rela-tionships and to demonstrate optimal search influencing factors. In order to explore diverse chemical examples of high pharmacological importance, three of which were small molecules, two were chosen to be of peptide nature, while the remaining two were particularly chosen to demonstrate the conditional inferential weaknesses of the method. The examples were: quercetin, open-form penicillin G, tetracycline, erythromycin A, cyclosporine A, cortisol, and ibuprofen.
c5 =
1
n2
∑ni=1
∑nj=1(xij − xij)
4
(m3)2− 3
d(v1, v2) =
n∑
i=1
|v1i − v2i|
Ligand‑based virtual screening benchmarkThe directory of useful decoys-enhanced (DUD-E) [10] was used for benchmarking sets. The dataset was com-prised of ninety-nine targets of different natures, for which enrichment results were already reported for the USR and USRCAT algorithms [11].
A more rigorous conformational sampling scheme was used for both actives and decoys, with an RMSD cutoff of 1.1 Å, an energy cutoff of 50 kcal/mol, and a maxi-mum of 10,000 sampled conformers while keeping the input conformer. The lowest energy conformer of each active was identified through the obenergy application from the OpenBabel suite [35]. The search conditions enrichment factor calculation procedure were chosen to reproduce those described for the previous benchmark-ing [11]; through conducting the searches using the low-est energy conformer of each active, while excluding the query active from the results, followed by the calcula-tion of the averaged enrichment factor for all actives. No charge assignment was performed since charges were already reassigned by the Confab software. The individ-ual enrichment factor was calculated using the previously described equation:
where ai,x% is the number of actives retrieved in the top x% fraction of the search results using the ith active as query, di,x% is the number of decoys retrieved in the same fraction, while A and D are, respectively, the total numbers of unique actives and decoys in the dataset of a single target. The averaged enrichment factors for each target were calculated at x% fractions of 1.0 and 0.25%.
Binding pocket classification benchmarkThe exact same procedure for data pre-processing, hash-ing and dissimilarity measurement was followed. The structures were handled using the same partial charges treatment and the same charge-tier scheme for the case-testing above. The ROC analyses were conducted as described in the reference study [12]. Three dissimilar-ity matrices were generated, pocket vs. pocket using all binding site atoms (of every amino acid within a 5 Å dis-tance from the ligand), pocket vs. pocket using binding site atoms only within 6.5 Å of the ligand, and inversely, ligand vs. ligand using the ligand atoms only.
Construction of a reduced dissimilarity matrixPython scripts were written for preparing and staging a batch job on the Hydra supercomputing facility with the aim of generating a reduced pairwise dissimilarity matrix (for all of the ligands included in the analysis) with the dimensions of 100 × 164,939, i.e. computing the top 100
EFi,x% =ai,x%/di,x%
A/D
Page 13 of 14ElGamacy and Van Meervelt J Cheminform (2015) 7:42
hits resulting from a PDB-wide search using each ligand as query.
Authors’ contributionsME designed and realized the study, and wrote the paper. LVM supervised the study, and wrote the paper. Both authors read and approved the final manuscript.
Author details1 Present Address: Department of Protein Evolution, Max Planck Institute for Developmental Biology, 72076 Tübingen, Germany. 2 Biomolecular Archi-tecture, Chemistry Department, KU Leuven, Celestijnenlaan 200F, box 2404, 3001 Leuven (Heverlee), Belgium.
AcknowledgementsThe authors would like to express their sincere gratitude to Marc De Maeyer, to Hossam Elgabarty and also to Raed Shalaby, for their invaluable remarks and useful discussions.
The computations were performed on the Computing Centre HPC cluster “Hydra”, co-funded by Université libre de Bruxelles and Vrije Universiteit Brussel.
Compliance with ethical guidelines
Competing interestsThe authors declare that they have no competing interests.
Received: 2 April 2015 Accepted: 22 July 2015
Additional files
Additional file 1: Results large scale dissimilarity analysis. Top 100 dissimilarity scores for each ligand search saved as split-compressed ANSI-encoded file. File available at https://github.com/ElGamacy/PDB-ligands.
Additional file 2: Figure S1. Enrichment factors for 99 DUD-E datasets as resulted from the presented method (TopMap) and reported from the USR and USRCAT methods [11]. The left and right panes show the average enrichment factors for each target at top scoring fractions of 1.0% and 0.25%, respectively. Asterisks indicate that one or more actives retrieved no decoys in the top scoring fraction by TopMap (rendering the described enrichment factor calculation inapplicable).
Additional file 3: A tar archive containing the details of the enrichment results, including the individual query (uniquely retrieved actives and decoys at the 1% and 0.25% top fractions), averaged enrichment factors for all of the sets, number of unique ligands and decoys and the number of generated conformers.
Additional file 4: Figure S2. Receiver operating characteristic (ROC) plots showing classification true positive rates vs. false positive rates and the corresponding area under the curve (AUC) values for Fingerprinting: A. using all binding pocket residues atoms, B. using binding pocket resi-dues atoms within 6.5 Å from the ligand, and C. using ligand structures.
Additional file 5: Figure S3. Top search results for searching by: Thiocholine bound to AChE (green dots: hits with choline or choline-mimicking scaffold; blue dots: bound to AChE proteins, red dots: bound to acetylcholine-binding proteins, yellow dots: bound to acetylcholine transporters, black: other). The colour legend represents the dissimilarity score scale.
Additional file 6: Linux and Windows builds of a testing implementa-tion are provided along with walk-through test-usage instructions on an exemplary fingerprinting and dissimilarity calculation. The builds and instructions are available on https://github.com/ElGamacy/TopMap-SD.
References 1. Gerstein M, Lan N, Jansen R (2002) Proteomics. Integrating interactomes.
Science 295(5553):284–287 2. Ideker T, Sharan R (2008) Protein networks in disease. Genome Res
18(4):644–652 3. Kalliokoski T, Olsson TS, Vulpetti A (2013) Subpocket analysis method for
fragment-based drug discovery. J Chem Inf Model 53(1):131–141 4. Campillos M, Kuhn M, Gavin A-C, Jensen LJ, Bork P (2008) Drug target
identification using side-effect similarity. Science 321(5886):263–266 5. Lapeine M, Herbert KG, Hill E, Goodey NM (2013) Mobile interaction and
query optimization in a protein-ligand data analysis system. In: Proceed-ings of the 2013 ACM SIGMOD International Conference on Management of Data. ACM, New York, pp 1291–1292 (2465344)
6. Kalinina OV, Wichmann O, Apic G, Russell RB (2011) Combinations of protein-chemical complex structures reveal new targets for established drugs. PLoS Comput Biol 7(5):e1002043
7. Hopkins AL (2008) Network pharmacology: the next paradigm in drug discovery. Nat Chem Biol 4(11):682–690
8. Levitt M (2007) Growth of novel protein structural data. Proc Natl Acad Sci USA 104(9):3183–3188
9. Abad-Zapatero C (2012) Notes of a protein crystallographer: on the high-resolution structure of the PDB growth rate. Acta Crystallogr D Biol Crystallogr 68(Pt 5):613–617
10. Mysinger MM, Carchia M, Irwin JJ, Shoichet BK (2012) Directory of useful decoys, enhanced (DUD-E): better ligands and decoys for better bench-marking. J Med Chem 55(14):6582–6594
11. Schreyer AM, Blundell T (2012) USRCAT: real-time ultrafast shape recogni-tion with pharmacophoric constraints. J Cheminform 4(1):27
12. Kahraman A, Morris RJ, Laskowski RA, Thornton JM (2007) Shape variation in protein binding pockets and their ligands. J Mol Biol 368(1):283–301
13. Lopez G, Valencia A, Tress M (2007) FireDB–a database of functionally important residues from proteins of known structure. Nucleic Acids Res 35((Database issue)):D219–D223
14. Wang R, Fang X, Lu Y, Wang S (2004) The PDBbind Database: collection of binding affinities for protein–ligand complexes with known three-dimen-sional structures. J Med Chem 47(12):2977–2980
15. Kalinina OV, Wichmann O, Apic G, Russell RB (2012) ProtChemSI: a network of protein-chemical structural interactions. Nucleic Acids Res 40((Database issue)):D549–D553
16. Vanhee P, Reumers J, Stricher F, Baeten L, Serrano L, Schymkowitz J et al (2010) PepX: a structural database of non-redundant protein-peptide complexes. Nucleic Acids Res 38((Database issue)):D545–D551
17. Shulman-Peleg A, Nussinov R, Wolfson HJ (2009) RsiteDB: a database of protein binding pockets that interact with RNA nucleotide bases. Nucleic Acids Res 37(suppl 1):D369–D373
18. Benson ML, Smith RD, Khazanov NA, Dimcheff B, Beaver J, Dresslar P et al (2008) Binding MOAD, a high-quality protein-ligand database. Nucleic Acids Res 36((Database issue)):D674–D678
19. Yang J, Roy A, Zhang Y (2013) BioLiP: a semi-manually curated database for biologically relevant ligand-protein interactions. Nucleic Acids Res 41((Database issue)):D1096–D1103
20. Veber DF, Johnson SR, Cheng H-Y, Smith BR, Ward KW, Kopple KD (2002) Molecular properties that influence the oral bioavailability of drug candi-dates. J Med Chem 45(12):2615–2623
21. Bender A, Glen RC (2004) Molecular similarity: a key technique in molecu-lar informatics. Org Biomol Chem 2(22):3204–3218
22. Eckert H, Bajorath J (2007) Molecular similarity analysis in virtual screen-ing: foundations, limitations and novel approaches. Drug Discov Today 12(5–6):225–233
23. Alvarsson J, Eklund M, Engkvist O, Spjuth O, Carlsson L, Wikberg JES et al (2014) Ligand-based target prediction with signature fingerprints. J Chem Inf Model 54(10):2647–2653
24. Steffen A, Kogej T, Tyrchan C, Engkvist O (2009) Comparison of molecular fingerprint methods on the basis of biological profile data. J Chem Inf Model 49(2):338–347
25. Armstrong MS, Morris GM, Finn PW, Sharma R, Moretti L, Cooper RI et al (2010) ElectroShape: fast molecular similarity calculations incorpo-rating shape, chirality and electrostatics. J Comput Aided Mol Des 24(9):789–801
Page 14 of 14ElGamacy and Van Meervelt J Cheminform (2015) 7:42
26. Ballester PJ, Richards WG (2007) Ultrafast shape recognition for similarity search in molecular databases, vol 463
27. Osada R, Funkhouser T, Chazelle B, Dobkin D (2002) Shape distributions. ACM Trans Graph 21(4):807–832
28. Walker EH, Pacold ME, Perisic O, Stephens L, Hawkins PT, Wymann MP et al (2000) Structural determinants of phosphoinositide 3-Kinase Inhibi-tion by Wortmannin, LY294002, Quercetin, Myricetin, and Staurosporine. Mol Cell 6(4):909–919
29. Konc J, Janežič D (2014) Binding site comparison for function prediction and pharmaceutical discovery. Curr Opin Struct Biol 25:34–39
30. Kuhn D, Weskamp N, Schmitt S, Hüllermeier E, Klebe G (2006) From the similarity analysis of protein cavities to the functional classification of protein families using cavbase. J Mol Biol 359(4):1023–1044
31. Wood DJ, Vlieg Jd, Wagener M, Ritschel T (2012) Pharmacophore finger-print-based approach to binding site subpocket similarity and its applica-tion to bioisostere replacement. J Chem Inf Model 52(8):2031–2043
32. Baroni M, Cruciani G, Sciabola S, Perruccio F, Mason JS (2007) A common reference framework for analyzing/comparing proteins and ligands. Fin-gerprints for ligands and proteins (flap): theory and application. J Chem Inf Model 47(2):279–294
33. Spitzer R, Cleves AE, Jain AN (2011) Surface-based protein binding pocket similarity. Proteins 79(9):2746–2763
34. Sael L, Kihara D (2010) Binding ligand prediction for proteins using partial matching of local surface patches. Int J Mol Sci 11(12):5009–5026
35. O’Boyle NM, Banck M, James CA, Morley C, Vandermeersch T, Hutchison GR (2011) Open Babel: an open chemical toolbox. J Cheminform 3:33
36. O’Boyle NM, Vandermeersch T, Flynn CJ, Maguire AR, Hutchison GR (2011) Confab—systematic generation of diverse low-energy conformers. J Cheminform 3:8
37. Rossum GV, Drake FL (2001) Python reference manual. PythonLabs, Virginia 38. Oliphant TE (2007) Python for scientific computing. Comput Sci Eng
9(3):10–20
Open access provides opportunities to our colleagues in other parts of the globe, by allowing
anyone to view the content free of charge.
Publish with ChemistryCentral and everyscientist can read your work free of charge
W. Jeffery Hurst, The Hershey Company.
available free of charge to the entire scientific communitypeer reviewed and published immediately upon acceptancecited in PubMed and archived on PubMed Centralyours you keep the copyright
Submit your manuscript here:http://www.chemistrycentral.com/manuscript/


![A Low Complexity Topological Sorting Algorithm for ...ijmlc.org/papers/411-LC039.pdf · An alternative algorithm for topological sorting is based on . Depth-First Search (DFS) [2]](https://img.pdfslide.net/doc/110x75/5f6053638bcd982d795c5e9c/a-low-complexity-topological-sorting-algorithm-for-ijmlcorgpapers411-lc039pdf.jpg)

![A FAST ALGORITHM FOR CONSTRUCTING TOPOLOGICAL …intlpress.com/site/pub/files/_fulltext/journals/hha/2012/0014/0001/H… · as MAPPER [25, 30] does. The clustering structure in the](https://img.pdfslide.net/doc/110x75/5f79b02ac3a31435df050197/a-fast-algorithm-for-constructing-topological-as-mapper-25-30-does-the-clustering.jpg)