Embed Size (px)
Citation preview

a * Fermi National Accelerator Laboratory
FERMILAB-Pub-92/73-A December, 1992
COLD DARK MATTER I: THE FORMATION OF DARK HALOS
James M. Gelbt and Edmund Bertschinger
Department of Physics, Massachusetts Institute of Technology,
Cambridge, MA 02139
+Present address: NASA/FermiIab Astrophysics Center,
Fermi National Accelerator Laboratory, P.O. Box 500, Batavia, IL 60510
ABSTRACT
We use numerical simulations of criticdly-closed cold dark matter (CDM) models to study the &ctr of numerical resolution on observable quantities. We study simulations with up to 256’ particles using the particle-mesh (PM) method and with up to 144’ particles using the adaptive particle-particle-particle-mesh (PsM) method. Comparisons of galaxy halo distributions are made among the various simulations. We also compare distributions with observations and we explore methods for identifying halos, induding a new algorithm that 6nds all partides within closed contours of the smoothed density field surrounding a peak. The simulated halos show more substructure than predicted by the Press-Schechtu theory. We are able to rule out all lI = 1 CDM models for linear amplitude us ,?, 0.5 because the simulations produce too many massive halos compared with the observations. The simulations also produce too many low mass halos. The distribution of haIos characterized by their circular velocities for the PsM simulations is in reasonable agreement with the observations for 150 km s-l ,S, Vcirs 2 350 km s-’
Submitted to Astrophysical Jorimal
e-mail: geIbQastrol.fnal.gov & [email protected]
0 OpWsted by Unl~.rslll~s R.s.arch A,soclatlon Inc. under contrsct with Ihe Unitd States lbpsrtm~nt of Enorgy

2 Gelb & Bertschinger
1. INTRODUCTION
This paper ir part of a two part series testing the cold dart matter (CDM) model of galsry formation suum- ing a critically-cloud universe, D = 1. These papers foeon on the formation and clustering of hala in co#m* logically significant volumes of ‘pace (cub- of length ‘z 50 Mpc on a side) with mfficient mao resolution
and length raolution (force softening and box sire) to reolve thouse.& of individual halos. The goal il not to study large ncale atmcture ( ?, 200 Mpc; e.g. Pslk 1990). Rather, the goal L to study spatial and veloc- ity statistica oo acala w 1 - 10 Mpc using candidate galaxy halol identified in the nonlinear, evolvzd density field. A principal goal of both papen is to determine if there es&a .a linear normaliration of the initial fluctu- ation power spa&rum (a free parameter in the theory) that latiafia observational constraints on galaxy massea, cluntering, and velocities, and galaxy cluster multiplicity functions.
The principle god of ihti paper ia to undcntand the propertiea of dark h&s that form in coamologically aig- n&ant mlurnes of apace in the CDM model. Specili- ally, we want to undentaod the sensitivity of halo for- mation and halo propertia to numerical rewlution. We identify which propcrtia of halo formation (e.g. dir- tributioru of halo mans and circular velocity) are par- ticularly Knritive to such purameten .ss box ais, force resolution, mam resolution, and methods for identifying halos.
Other worken have studied the formation of dark haloa in the CDM accrario in volumes of space much greater than (100 Mpc)’ by ruing approximate meth- ods for identifying galaxies IM individual particles (e.g. Davis et al. 1985). Still othen have studied volumea of apace much mallcr than (100 M~c)~ with relatively high mdll and force resolution (e.g. Freak et al. 1986). Small volume8 of apace do not contain long wavelengtha io the initial condition which mop alkt halo forma- tion (&x&d in tbii paper) and wbicb do alTed clluter- ing (Gelb k Bertxhinger 1992, here&a Paper II). The larger volumea of npace hulated with relatively high numerical remlution presented in this paper also yield better &athtiu &cc more haloa fomi than in smaller voluma.
Fmm our efforta, based on over one thousand IBM 3090 supercomputer-houm applied to more than a dosen large simulations, we gain insight into dynamic range by ayntematically isolating various effects. We demonstrate which halo properties, if any, converge with increeaing rcaolution up to practical limita using present-day LU- percomputen. These dynamic range rtudiea are impor- teat for future worken who need to choose a particular set of kmlation pammeters for a particular problem in galaxy form&xi.
By comparing the distribution of halo III- with estimata from observed galaxies, we show that the sim- ulatioru produce too many msruive haloa. In Paper II, focusing on the spatial and velocity atatbtiu of the ha- los, we conrider the powibility that the overly mauive h&x repruent clurtem of galaxiu (Evrard, Summers, k David 1992; Kats k White 19S3). Becaw our gim- ulationa do not include glu dynamical dissipation, it is possible that the dark matter haloa we identify have clustering properties different from the luminous galas- im that would form if we properly rim&&d all of the phyaiu of galaxy formation. To minimiss the uncer- tainty caved by our lack of diiipative physics, we try to employ tab that should not depend strongly on the relation between dark haloa and luminous galtie% For the same r-n, io Paper II we explore ~veral different prescriptiona for galaxy formation and we diiun co+ mological N-body aimulatiolu employing gsl dynamiu (e.g. Cen k Ostriker 1992; Katq HemquLt, k Wein- berg 1992).
The N-body aimulationn follow the nonlinear gravi- tational clustering (in an expanding universe) of par- ticles repraenting colliiionlaa clouds of dark matter. The &malationr utilise between 64’ (262144) and 256’ (16777216) pa&la in a universe with G = 1 and If0 = 50 kma-’ hfpc-‘. All diitanca are giveri ia unita Mpc rather than h-‘Mpc. Mat of the aimula- tionr are computed io cuba of length 51.2 Mpc eo a ride (box nisa are comoviog). Aa we lhow io Paper II, thll volume t too small to accurately mesrure galaxy clustering, although it alloar ooe to resolve thousanda of individual haloa with hundreds to thowanda of parti- cla per typical Milky Way-lined halo. (We do, however, compute a few nimolations in boxea of order 100 Mpc oo a Bide in order to study galsry chutering and small-scale peculiar velocities in Paper II.)
Our &nulationa employ both the particlemah (PM) method (Hocknay k E&wood 1962) and the adaptive particlaprticlrparticle-mah (P%f) method (Couch- man lQQ1). For a review of N-body methob in co mology see Bertachinger (1991). Bertacbiiger k Gelb (1991) provide an overview of the numerical aspects of thii work. Gelb (1992) provida many &&&al detailn and in the baain of these papers.
In the remainder of thir introduction we diucvu briefly three key iames relevant for cosmological rim- ulatiolu of galaxy halo formation: force resolution, halo identifxation, and the normalization of the power spec- trum. In s 2 we UM the cumulative maw fraction of hda to study the eHecta of numerical raolution on halo for- mation, and we compare the limulatioru with the PI* Schnhter (1974) theory. In 5 3 we explore circular ve- locity profilea and introduce observational data. In 5 4 we compare the number of haloa, chare.ctcriscd by their circular velocities, with observations. Separate sub-

Cold Dark Matter I 3
Table I Simulationa
CDWNJA/d Grid n&, o,*fc NW- Ecd HRS IC# Notable Features
CDM1~128”.51.2.280~ 2513~ 4.4 0.017 500 2.4 25 1 CDM2~126J;51.2[280j 25@ 4.4 0.017 500 2.6 22 2
CDM3(1283,51.2,280) 256’ 4.4 0.017 500 2.6 22 3 CDM4(128J,51.2,280) 25@ 4.4 0.018 500 2.3 22 4
CDM5(1283,51.2,280) 25@ 4.4 0.015 500 2.5 22 5 CDM6(25@,51.2,190) 3843 0.55 0.014 800 14.0 180 1 High Mann Resolution
CDM7(64J,51.2,280) 256” 35.2 0.024 500 1.1 19 1 Poor Masa Resolution
CDM8(64’,51.2,580) 12B3 35.2 0.024 200 2.2 1 1 Poor Force k Poor Mua Resolution CDM9(128J,51.2,280) 25@ 4.4 0.024 500 2.1 22 1 Initial conditiona from 64’
CDM11(1283,102.4,560) 25Li3 35.2 0.021 500 1.2 22 2 Poor Force Red.; Z ~102.4 Mpc
CDM12(643,51.2,52) 25@ 35.2 0.024 2000 17.0 100 1 c = 40 kpc; o = 0.5; Poor Mau Ra.
CDMlS(144J,100,85) 4205 23.0 0.014 1200 5.1 770 6 f = 65 kpc; Z =lOO Mpc; TSC; BBKS
.Number of particles, comoving box sire (Mpc), and comoving softening scale (kpc): R$,F/(C&) = l/2. bParticle maq unita of 10’ MB. EStarting expansion factor with a = 1 when o, = 1. dEnergy conservation, IAC/A(oU)l/lO-‘, i.e. change in energy con&ant relative to gravitational energy.
aectiona arc included for high mass haloa and for low masl h&e. Conclusiona and a rumme.ry are given in 55.
1.1. Porte Re#olution
An important ingredient in N-body simulationa is force resolution. We cbarecterise the force softening in the aimulatioru (with particle - -) by the comov- ing pair separation r = RI,2 such that raF,/(On&) = l/2, i.e. where the radial component of the force be- tween two particlea is half itr Newtonian value. For the PM simulations R,,a FJ 1.4 grid cella (Gelb 1992 chapter 2). For P9M ainxdationr with a Plummu force law characterised by a loftening c, i.e. with P, = GIT&+/(+~ + e2)ala, RI/a za 1.305~. The ahape of the PM softening L slightly different i-mm a Plummer law, but in cub caw the appropriate force law (invene square or Plummcr) ia matched accurately (to better than 2% rma) for r > 2Rlp. There ia additionally a small transverse component of the force due to PM grid anisotropica. Force errors are minimieed using P. suitable Green’s function; see Bcrtachinger (1991), Gclb (1992), and Hoctney k E&wood (1982).
For economy of notation and ease of reference we refer to the simulationa a~ follows: CDM~(N,L,R,I~). Fol- lowing Gelb (1992), we number the simulationa from n = 1 to 16. The numben in parenthesa indicate the
following simulation parameters: 1) N partida, 2) a comoving box of length Z Mpc on a side, and 3) a cw movingforce softening length of RI/~ kpc. For example, CDM1(12BJ,51.2,280) UBU 12B5 particles, .a (51.2 M~c)~ box, and (L comoving force softening length of 280 kpc. The two PaM simulationa dincussed in these papen use RI/2 = 52 kpc comoving (c = 40 kpc) and RI/a = 85 kpc comoving (c = 65 kpc). The other aimulationa are low force rewlution PM simulations with iZ1,~ > 190 kpc comoving.
We summarize the simulation parametera in Table 1. The entria are the following: simulationnumber, particle- mesh grid, particle IIIIYU, starting exPar&n factor, number of timcstcp to 08 = 1, energy conservation rel- ative to change in gravitational potential energy (see Gelb 1992 chapter 2), computer houm co~umed, initial conditiona identifier. Simulations with the ame initial conditions identifier ue equivalent setm of random num- hen, i.e. they are generated from the same set of ran- dom numbern scaled to the appropriate power spectrum (me Gelh 1992 chapter 3).
We we a time-centered leapfrog scheme (Hackney k E&wood 1982) to advance the particles. All of the simulationsare integrated using equal steps in expansion factor a, except CDM12, which ue.es equal steps in au with a = 0.5, as highlighted, for example, in the notable reatura column.
AU of the simulationa use cloud-in-cell (CIC, see

4 Gdb & Batdinga
Hackney k titwood 1982) interpolation and a Bolts- man (1989) CDM transfer function with 5% baryona, ex- cept CDMl6, which usu triuigular-shaped-cloud (TX, m Hackney k Fastwood 1982) interpolation and a Bardnn et al. (1986, hereafter BBKS) transfer func- tion.
In order to avoid interference between the initial in- terparticle lattice aad the particle-mesh grid (see Gelh 1992 chapter 2), we begin CDMG with extra #OR forces (i.e. we let the particle shape to be a linear aphere den- aity profile with mdiua q = 5 grid cella, nee Gelb 1992 Appendix I; then we net q = 3.5 grid cella after the initial lattice dippears.) For CDMl6, with 1443 particlea, we use a 28B5 grid (we use a 4203 grid after a = 0.7).
High force resolution in a coomologically significant box ( ;t 50 Mpc) in computationdly challenging but can lead to aignhicantly different results compared with low resolution nimulationn. One of our principle go& is to atudy the propertim and clurtering of resolved h&a, so we are forced to compromise maas and force resolution by using up to 100 Mpc boxes. Other authors interested in the detailed properties of halol, and not clustering, have concentrated their dtorts on very small box aisa. For example, Warren et al. (1991) used a tree code to aimulste the formation of halw with very high particle number (1097921 particles) and very high force ruolu- tion (PI-er softening of 5 kpc proper) in a rpherc of rediur 5 Mpc. In another work, Dubinrki and Carlberg (1991) studied CDM halo properties using a tree code with 32s particla in a sphere of radius 2.3 Mpc. The initial conditiona were generated in a 8 Mpc box. The authon ued an approximate treatment of tidal fielda and a Pl-er softening of 1.4 kpc. In the prwent pa- per the goal ia to undentand properties of haloa evolved in larger boxa hut with mass and force resolution dg- nilicantly better than earlier efforts in boxa exceediig - 50 Mpc (e.g. D&via et al. 1985; White et al. 1987; Carlberg k COU&IIS~ 1989; Melott 1990; Park 1990).
1.2. Halo Identification
The standard method for identifying halos from the evolved particle poaitiom ia to identify all particlea within a given linking distance of each other (the frien& of-frienda or FOF algorithm). We developed an alterns- tive, novel procedure that identifin local density mu- ima in the smoothed, evolved denrity field: DENMAX (gee Be~ger k Gelb 1991; Gelh 1992 chapter 4). We fint compute a static density field 6p/p by inter- polating the particlea onto a grid. We then move the particles according to the equation
(1.1)
ruing aficticiow time variable T with 6p/p held con&at
throughout the calculation. Thii equation describes a viacou fluid subject to a force proportional to the den- aity gradient, in the limit of large damping. Every par- ticle movea toward a density maximum where it coma to rat. All particles lying within closed density contour aurfaoea around a peak are pushed toward that peak. After the particles are sufficiently concentrated at den- sity peakl, the particln are scooped up and their label. are recorded. A halo is composed of these particlea with their original poaitiona restored. The results of DEN- MAX depend on the degree of smoothing used to defined the density field 6p/p. We use triliiear (cloud-in-cell) in- terpolation with a given grid (e.g., 512’ or smaller for acnsitivity testa) to define the deruity field.
After identifying halos, we remove the unbound par- ticles, treating each halo in isolation. We compute the potential for each particle i, 44, due to all Nh memben of (L halo:
h = 2 4(rij); rij = I?j - r’i/ . 0.2) i-1 (I,*)
The potential ia computed once and ia fixed throughout the calculation. (For the P3M aimulatiolu we limply use the potential 9(r) = -Gm/(r’ +c’)~“. For the PM aimulationa we generate b(r) by integrating a force table generated by Monte Carlo umpling the PM force between pain of particla.) We then iteratively remove unbound particles an follows. We compute the energy Ei = (l/2)miY~-v;,.Ja+#i for each particle i, where V;= ir the mean velocity of the bound p&l&s at any given atage. We then remove all particlea with Ei > 0. The procedure is repeated, each time recomputing V;,, until no more particles are removed. In all of the DENMAX analyses we remove the unbound psrticlw. We have also identified halos using the FOF algorithm titkont the removal of unbound particlea.
1.3. Normalization of the Spectrum
Mod of the ainulationa are ae.lysed assuming three normalisationa of the initial, linear CDM power apec- trum (a free parameter in the theory). We define the normaliration factor oa using a tophat sphere of rdiua Bh-’ Mpc:
cm
u; E J dJk&,(k)W&(kR) ; R = 8h-’ Mpc (1.3) 0 with the tophat filter defined as
f+‘m(kR) = & (sin kR - LB COI kR) (1.4)
for comoving wavenumber k. The linear power spectrum of density ductuationa la
h.(k) = hmo~~aP(k, 4.) . (1.5)

Cold Dark Matter I 5
The CMF givn the fraction of man contained in hr- lo, more msuivc than M. Although the number and mlyuca of large halo8 can fluctuate significantly from simulation to simulation, their contribution to the CMF gets averaged in the aurn of equation (2.1). The smallest mm taken is typically 5 or more particlea. The CMF hlu the advantage of summarizing in a nondimensional way all information about the ma.a function of halos. However, it haa the disadvantage that halo mssln are not easy to compare with observation. Alao, because h&m do not have sharp outer boundaria, the total mau of a given halo ia often not a well-defined quantity. We addrem these problema later by applying a radial cut-off in order to compare with observations. Here the motives are purely theoretical in order to under&and the effecta of finite resolution.
The first isaue we study using the CMF is the dif- ference between halos identified uring DENMAX venue FOF. Fig. 1 shows the cumulative maan fraction veraua rnasa for halos found in CDM1(1283,51.2,2gO) analyred with DENMAX and FOF(I = 0.1) and FOF(I = 0.2), where I ir the linking parameter in unik of the mean in- krparticle apacing. The DENMAX m- include only the bound particles, while the FOF m- include all of the identified particles. The DENMAX CMFs lie be- tween the FOF CMFn for I= 0.1 and I = 0.2. A smaller FOF linking parameter leada to smaller halos, but alw to a wmller fraction of particlea in halos. The reason for thii ia that FOF includes only particles such that the local over-density exceeds - 21+. DENMAX, however, gathers all particla around a peak, even those at lower density. FOF with I = 0.1 diilvcs low-deraity h&a. If I h increased, then FOF merge halos together, incrcar- ing the maximum maws, even when the halor have dii tinct substructure (ee Gelb lQQ2 chapter 4, and Fig. 18 below). bENMAX avoida tbia problem: basically, any density concentration visible graphically will be found by DENMAX. (Indeed, graphical tats were fiat used to establish and teat the algorithm.) Nok that more than hdfof the particlu are associated with romc DENMAX halo, even at early times. This is the natural outcome of gravitational instability in a model with small-wale structure. Contrary to some expectations, moat of the cold dark matter in not smoothly dltribukd.
Although the differences in the CMF obtained using DENMAX and FOF are large, total halo U-L- are not measured in practice. It remains to be seen whether or not observable differences between DENMAX and FOF hdon arc large, and whether the resultn depend on the DENMAX grid or on 1. DENMAX haa a limi- tation stemming from the arbitrary choice of a density grid (512’ for molt of the analysis) or equivalently a smoothing rcaie for defining the deluity field. (Sim- ilarly, FOF haa ik own arbitrary parameter, I.) We explore these isnun later. For now, our prejudice in to
To define the CDM power spectrum we use the primordial scale-invariant npcctrum modulated by the transfer function computed by BBKS or by Boltsman (1989) with 5% baryon fraction. The difference be tween the two in very small except at high wavenumben. We normaliie the initial ape&rum according to equa- tion (1.3) with expansion factor a z 1 when 08 = 1. We then scale the fluctuationa to some early time e+ using linear theory, i.e. P(k,q) = ozP(k,a = 1).
We generally apply linear theory until the largest (bp/p( oa the initial particle grid la unity. For the 1443 particle simulation CDMl6, however, linear theory ia applied until the largest J-dimensional displacement is 1 mean interparticle spacing, i.e. L/NLls for box sise L and N particles. The Zel’dovich (1970) approximstioa ia used to get particle poeitiona and velocitia at the end of the linear regime. The syatcm is then evolved using the N-body code, with particle poaitioru and ve- locitiea recorded at various expansion facton a = ~8. (By definition, aa 0: a.) In moat ce~s we atudy the mod& at (18 = 0.5, 0.7, and 1.0. In the literature, for example, CQ = 0.4 in known aa the b = 2.5 biarcd CDM model becue. of the aaumption that galaxy dcnnity fluctuationa arc 2.5 times the m(y~ density fluctuatiom. According to the linear binning paradigm, b = l/u,. We do not adopt the linear biasing paradigm because we prefer to identify halus in the nonlinear, evolved mau diitribution. Note that according to our prescription, the variance of hdo numbers in gh-’ Mpc spheres docl not necessarily equal 08.
2. DYNAMIC RANGE: CUMULATIVE MASS FRACTIONS
In this a&ion we diacuas distributiona of halos uing the cumulative mau G&ion (CMF).
2.1. The CMF
The CMF is defined by:
CMF(M) = $ (2.1)
where N in the total number of particles in the simul~ tion, M ia the msrr (number of particles) of a halo, and n(M) in the number of haloa containing dd particles. By definition, CMF(0) = 1, CMF(oo) = 0, and CMF(M) is a dccrcaaing function of hf. Note that the particle mass for N particlea in a cube of comoving size L is
mpu,(N, L) =
4.44X10⁹&f@ (T) (s1.;Mpc)3 (2.2)

6 Gdb & Bertschinger
favor DENMAX beeauK it doa not suffer from the ob viaus defects of FOF, the diilving of low-density haloa and the merging of halw in high-density regions. We in- clude FOF analynia only for corn&n with DENMAX beauK amay authora we FOF fc.a. White et al. 1967: Carlberg, Couchman, k Thorn& 1990; Brain&d k Vil- lumsen 19921.
The lomr’panel in Fig. 1 shown the effect of the re- moval of unbound particles. The unbinding proccu nya- tematically reduces the mlu~ of the halos over the full range of manna, although the effects are large& for small m-. We find that the DENMAX rcsulte without the removal of unbound particles are in better agreement with I = 0.2 FOF. However, the agreement ia not exact; we ahow later that FOF occasionally links together vi- sually distinct halos Moreover, unbound particles arc temporary memben of the halos and therefore should not be included.
Ia there e. tignificant simulation-t~imulation v&s- tion in the CMF? Io Fig. 2 we abow cumulative maw fractiona for five &nulatiom. They are all 1285 particle PM aimulationa (with RI/~ = 280 kpc comoving) corn- puted in 51.2 Mpc born using different initial random numben. There ia very little scatter at the low maw end and there ia conriderable scatter at the high mass end. The fluctuationa at the high maa end are due to #mall number atatktiu in these amall volumes. We conclude that the CMF i not lcruitive to aimulation- tc-simulationfluctustioru except for rare massive halca.
The nut important iaaue ia the effect of varying msu resolution and force resolution. In Fig. 3 we attempt to determine thae eRecta by comparing four &nlatioIu in 51.2 Mpc boxa which w initial conditiona taken Gem an equnwJent act of initial random numbers. (The -c valun are ued for the initial Fourier transform of the detity fluctuation field for all wavenumbcn up to the Nyquist frequency for each cube. Thun, the initial con- ditioru for N = 12E3 are identical to those for N = 643 except that extra high-frequency power in present with the larger number of partida.) Maa and force reaolu- tion variationa cause several dtects that we ayatcmati- ally leparatc out aa we proceed.
The N = 64’, RI/, = 560 kpc comoving PM simul.s tion faiL to match up with the other sitiulstionn - thii in not auprising coruidering that the force loftening ia no poor, larger than the sise of many halor. The two very different simulstiona (the P3M simulation with 134~ particla and RI/~ = 52 kpc comoving versus the PM simulation with 126’ particla and Rlll = 280 kpc co- moving) surpriaiigly yield very aim&r CMF8, but the harder forca in the P3M simulation actually give rise to halon with higher circular velocities, an important ef- fect that ia dtcuved in S 4. (We ahow aa we proceed that the &dltity of the CMF for these two minulatio~ occur becarue increased mau resolution and increased
force resolution both increase the CMF.) The 256’ par- ticle simulation lies above the others due to the increw in mean resolution and the presence of more small-lcaic power in the initial conditions.
L.L DENMAX Rcrolulion and Boz Size
We need to undentand what happena if we vary the DENMAX grid when analyring the lame simulation. In Fig. 4 we ahow the mults of eeveral DENMAX analylea of the P’M simulation CDM12(643,51.2,52) at o,= 0.5. We see that the DENMAX grid significantly in5uenc.s the CMF. Tht variation is analogous to the variation of the CMF with linking length 1 for the FOF algo- rithm (cf. Fig. 1). We demonstrate later, however, that the circular velocitic. of the haloa are 1ec.a seluitive to the DENMAX grid- thii in because circular velocities involve uing a cut-off diitance from the local density maximum. One effect arising from different DENMAX gridr L the inclusion of distant particla into the h&a. We demon&ate later that the DENMAX grid influenca the break-up of massive haloa when the grida are coarser than the force resolution of the simulation itself. Bc- ULUM of the density grid aennitivity of DENMAX, par- ticularly for the total number of bound p&i&, we must compare the CMF from diRerent simulation. UC ing the same effective DENMAX resolution.
Are there significant differenca in the CMF corn- puted in bora larger than 51.2 Mpc? In Fig. 5 we show the CMF for two simulstiom computed in larger boxa (102.4 Mpc and 100 Mpc). Since we alao w a 5123 DENMAX grid for these simulation, the DEN- MAX resolution ia only roughly half the resolution of the 51.2 Mpc simulationa analyred with a 5123 DEN- MAX grid. The difference is aigniticant (cf. KundiC 1991). In order to separate out the et&& due to larger wavc~ in the initial conditiona for the 100 Mpc boxes, compared with 51.2 Mpc boxa, we compare CDM16(1443,100,65) analysd with a 5123 DENMAX grid with CDM12(643,51.2,52) anadyad with a 2563 DENMAX grid. (Thii ia done at 08 = 0.5 only.) The two simulations, CDMl6 and CDMIZ, have compare- ble force raolution (R,ll = 85 kpc comoving and 52 kpc comoving respectively) and comparable mm ra- olution (+.,, = 2.3 x 10” iIf@ and 3.5 x 10” M, rapectively). The nearly perfect agreement between CDMl6 (100 Mpc box) analyred with 5123 DENMAX and CDM12 (51.2 Mpc box) aralyrcd with 2563 DEN- MAX, and the fact that the two simulations have corn- parable force and masr resolution, indicates that longer waves in the initial condition. do not significantly affect halo formation. (However, some of the longer wavw have not gone nonlinear yet at -8 = 0.5.) Thin in en- couraging because it means we can lue the simulatiolu in 51.2 Mpc boxa to under&and halo properties. We will d&over in Paper II, however, that the velocity dii

Cold Dark Matter I 7
penion of pain of halor in significantly influenced by the different box ~ira.
To quantify the sensitivity of the CMF to DEN- MAX resolution, we measure the mass where the CMF equala ZOW, denoted ae Ida,,. We choose 20% becalue larger valua am not well apauned by the variolu sim- ulatiom and smaller valua are more seluitivc to the simulation-tcGmulation variationa of the massive be 10s. We compute, for CDM12(643,51.2,52) at (18 = 0.5, the logarithmic elope A lag h&/A log D where D is the DENMAX grid apacing. In Fig. 4, comparing a 5125 DENMAX with a 1~56~ DENMAX analysis, we estimate A log,,, &, = 12.65 - 13.33 = -0.66 and A logI D = log,,(1/2) no Alog.&/AlogD 5 2.27. Increasing D decreasea the DENMAX resolution, thereby increasing the CMF. Tbii ia because a coarser DENMAX grid tenda to pick out larger mawa, i.e. it cannot resolve aubntructurc. Comparing a 25e3 DENMAX grid with a 12E3 DENMAX grid we find A log &o/A IogD ?J 1.13. Comparing a 12S3 DENMAX grid with a 643 DENMAX grid we find AlogM&AlogD J 0.57. We therefore see evidence for increasing amounts of aubstructurc on smeller scales. Qualitatively similar behavior occuun with the FOF algorithm (cf. Fig. l), where the link- ing parameter playa the role of the resolution scale. We demonstrate later that if we impose P, radial cut on the DENMAX halos, M we do when we atudy circular ve- locitim, the results are not aa sensitive to resolution.
L.S. Smdl-rcale WLWMI
Fig. 6 is important for undentanding the effect of varying the number of particles-particularly for sepa- rating out the fact that increasing the particle number not only increaaea the myll resolution, but it also proba amaIler fiuctuations in the initial power spectrum be- cane of the higher Nyquist wavenumber cut-off. In a discrete system with N particlea, the highest wavcnum- ber represented, is (2r/L)(N”‘/2) in each dimension. We show the rem&a of a 5123 DENMAX analy~ir from three RI,1 = 280 kpc comoving PM &mdatioru in 51.2 Mpc boxa which we equivalent initial conditiona. Tbe results art shorn at thm epocba for 12E3 and 6rls parti- cles We also mu a simulation (CDMB) using 128’ par- ticles, but the initial conditions are generated by inter- polating the 64’ particle case to 12@ particles. There fore, thin simulation har the *ame ma.91 resolution aa the non-interpolated 12a3 particle simulation (CDMl) but does not have the small-scale waves present in the non-interpolated simulation.
Apart from the obvious increase in the CMF due to an increase in masn raolution (explored in greater dt- tail below), we ace in Fig. 6 the effect of the small-clcale wavea in the initial conditions - the non-interpolated 12B3 particle simulation bsl e. higher value of the CMF at amail msu relative to the interpolated 12@ particle
caw but not by much. Little, Weinberg, k Park (1991) atudicd the effect of the removal of high frequency wavy in w&-free models. Using B PM simulation with 126~ particles and P(6) 0: f-‘, they found that the nonlin- ear power spectrum in a simulation with initial power above kL/(Zr) = 32 vet to stro compared very well with the nonlinear power spectrum in a aimulaticn with ini- tial power above LL/(2r) = 64 set to rem. Only amall differencea appeared on small exe&s, but further reduc- tionn in the initial cut-off frequency did produce large effects.
8.4. Separation of Effecia
We now separate out the effects of mana and force resolution bearing in mind that 1) we need to compare aimulationa in boxes of different rises with the lame et- fective DENMAX resolution; 2) the differences in the CMF arising from the inciGon of extra high and low fre- quency wwe.s in the initial condition, arc small; and 3) the simulation-to-simulation (i.e. different initial ran- dom numbers) differencea in the CMF arc amall below about 10” MB. To separate out effects of resolution m re-examine Figs. 3 through 6.
We fint demonstrate that higher maw resolution in- ce.ssa the CMF. If ne examine Fig. 6 are ee that the CMF ia higher for the N = 12E3 particle simulation than for the N = 64’ particle climulation wing the same force taolution (RI/~ = 280 kpc comoving in a 51.2 Mpc bax). Comparing 128’ and 64’ particle aimulatiom, we find A log &o/A log- in -0.56. Tbe minm sign re- tlecta the fact that if the particle - incrcaaa, then the masa resolution o[ l/mput deeresacs, and therefore Mao (or equivalently the CMF) decressa. Tbe higher maon resolution aimulationa lead to a higher value of the CMF independent of force resolution. We &o we tbii in Fig. 3 by comparing the 256a particle simulation (Rya = 190 kpc comoving in a 51.2 Mpc box) with the 128 particle simulation (RI/s = 280 kpc comoving in a 51.2 Mpc box). The difference between R1ll = 190 kpc comoving and RI/~ = 280 comoving ia ahown later to have L nontrivial effect on the CMF.
For the 256’ particle simulation we find log,,, I&, rx 13.05 and for the 12@ particle simulation WC find log,, Mao !=a 12.74. Therefore, we find A log &,/A log- FT -0.34. The &Tut on the CMF (logarithmic slope) b smaller going from 2563 to 128’ particles (-0.34) com- pared with going from 128’ to 64’ particles (-0.56), but it ia not obviwa if and when the tcaults will converge.
The fact that increased maw resolution continua to increase the CMF in the above compariscma warranta further investigation. Is tbii result atill true when we impose a diitance cut from the dcmity peak? We re- analyst the three PM nimulatiom (64’, 128’, and 2563 particles) st US = 0.5 imposing * distance cut of 300

8 Gelb & Bertschinger
kpc comoving from the density peak. The resulta are shown in the top panel of Fig. 7. In all three casea we do not remove the unbound particlea from halos with raw m- (no cut in radius and no unbinding) exceed- ing 1.1 x 10’3Mo (location of vertical line; the tmnrition maar) to be consistent with the analy~ia of the 256’ par- ticle aim&&ion. (In all the analyst of the 25e3 particle aimulstion CDMB we do not remove the unbound parti- clea from the mauive halos, M 2 1.1 x 10’3ii4~, because it in computationaIly prohibitive.) However, the unbind- ing of the massive halos han s amall effect cm the CMF below the tramition mass. To see tbii, we rhoa in the middle panel of Fig. 7 at 01 = 0.5 the CMF from the 64’ particle simulation and from the 126’ particle sim- ulation with and without the unbinding of the massive haloa. The effect L negligible just below the transition maw, and there L (L slight increw in the CMF above the traruition man.
By examiniq the top panel of Fig. 7 we tind, for the 12@ particle aim&&on venue the 64’ particle rimula- tion, that Alog&/Alog- IJ -0.23. This ia lena than -0.56, the result when we do not inpole a cut of 300 kpc comoving from the density peak. The CMF itself changes considerably when we impose a dltancc cut from the den&y peak. However, we may adopt the parition that particlea at such great distancea from the center of the halo should not be associated with es- timated measurements of the masn of observed gb b&s. The observed maan of individual galaxy h&m at great &tanca, aa opposed to dynamical propertia inferred by the motioru of ha and gas at small di tanca, h highly uncertain. By comparing the 256’ par- ticle simulation with the 12@ particle simulation we find A log d&o/A log- fl -0.22. Again thi L leu than -0.34, the fault when we do not impose a cut of 300 kpc comoving from the density peak.
Provided that we apply a cut in radius from the den- sity peak, aa we do when we characterire the halos by their circular velocities in the next sectiona, we see that the CMF ia lcrr lenritive to variationa in mau resolution than when we do not impow a cut. We still do not see a convergence of the CMF wltb increasing maw renolution in Fig. 7ab. However, the 643 particle simulation and the 12g3 particle simulation both uaa R+ = 280 kPc co- moving. The 2563 particle simulation usea Rlll = 190 kpc comoving. So nut we correct for the difference in force resolution, but first we demon&ate that higher force raolution slso increases the CMF.
In order to see the effect of force rewlution we com- pare simulationa with similar maas resolution. In Fig. 5 we compare CDM12(643,51.2,52) analyred with e 25e3 DENMAX grid and CDMll(1263,102.4,560) andysed with a 512” DENMAX grid. The masl resolution and the DENMAX grid rewlution are equivalent since the CDMll box hu eight times the volume of the CDMl2
box. We see that the higher force resolution simula- tion yields a higher value of the CMF. We find that &o x 13.33 for the high rmolution rimulation and 13.06 for the low resolution aimulstion. If we charac- terire the force resolution by RI,,, then we find that A log&/Alog RiI1 in -0.24. Tbii number should be treated with caution since we are comparing timulationa with Rip = 52 kpc comoving venue Rl,1 = 560 kpc comoving-this ir a wide range and DENMAX bebava unreliably in very low resolution simulations. We do not hex two PJM CDM simulations with comparable ma rwolution but with dgnificantly different Plummer aoftcniogs.
The increase in the CMF for higher force resolution simulationnia verified by comparing CDMl2 (643,51.2,52) with CDMB (643,51.2,560) in Fig. 3, but again the force resolution in CDMB in extremely poor.
Aa a final comparison of force resolution effects, we compareCDM12(641,51.2,52)withCDM7(643,51.2,260) both andyred with a 5123 DENMAX grid. We find AhMao/AlogRl/a = -0.56. The range of force dteningm in this comparism in still large but at least RI/~ = 260 kpc comoving is more reasonable than 560 kpc comoving. In subsequent sections we compare the halor cbaracterised by their circular velocitia and par- ticular attention ia paid to force raolution comparing raulta for PM versus P3M ~imulstioru. So we return to force resolution then.
Aa a final tat of the convergence of the CMF with increasing masl resolution, we tint UK the above force raolution analysis to atimste the effect on the CMF from a Rip = 260 kpc concaving PM simulation versus a RI/~ = 190 kpc comoving PM simulation. To do soa we compare the 643 particle, RI/~ = 52 kpc comaving P3M aimuktionwitb the 6qJ particle, RI,> = 260 kpc comov- ing PM simulation (both computed in 51.2 Mpc boxes and analyzed with a 512’ DENMAX grid) imposing a 300 kpc comoving cut from the density peak of the halos. The logarithmic alope ia A log &o/A log Rllo - 0.74. If we multiply -0.74 by A log,, Rt/l = -0.18, i.e. the dif- ference between the softening of the RI/~ = 190 kpc co- moving PM simulation and the RI/~ = 260 kpc comov- ing PM Emulation, we get A loglo ii& = 0.13. There- fore, we can atimhte that the 25e5 particle R1iz = 190 kpe comoving PM simulstion (with a 300 kpc comoving diitance cut) would have log,,?&, Ed 11.91 - 0.13 = 11.78 if it were computed using a RI/~ = 280 kpc CCT moving PM simulation.
Now if we compare the x-scaled (to RI/~ = 260 kpc comoving) 25e3 particle result with the RI,~ = 260 kpc comoving 126” particle PM simulation, all with a 300 kpc comoving diitance cut, we get A log b&/A log m, SJ -0.11 compared with the old value of -0.22. Tbii L encouraging because tbii logarithmic #lope, -0.11, i still better than the logarithmic rlopc -0.23 com-
Cold Dark Matter I 9
linear density, averaged over a scale bf, exceeda 6,: puted earlier by comparing a 128’ particle simulation with a S43 particle simulation. Graphically (u depicted in Fig. i’c) thin corrapoada to moving the CMF for the 25@ particle uimulation in the top panel of Fig. 6 0.13 unita to the left.
We now me that the agreement between the 128’ par- ticle ceae and the 25@ particle case ia much better (Fig. 7~). There ia still a alight increase in the CMF on small masn cc&a. However, this is consistent with the fact that the 258’ particle simulation hsa more amall scale power in the initial condition6 compared with the 12@ particlea simulation. Tbii effect wan demonstrated ear- lier.
Using simulations aralyrsed with the luune effective DENMAX wsolution, we found the following: 1) Higher mea resolution leada to larger valuea of the CMF inde- pendent of force rolution. The effect ia amallcr when we impose a diitanee cut from the dcnaity peak of the halos. The difference between the 4.4 x 10sMo and the 3.5 x lO”M~ simulation (using a distance cut of 300 kpc comoving from the density peaks of the ha- los.) is small, AlogM&Alogn+., zx -0.23. The dif- ference between the 5.5 x 10*M~ simulation and the 4.4 x lO’& rimulation (using a 300 kpc comoving cut and correcting for the difference in force softening) is AlogMao/Alogmp, FJ -0.11. The difference haa de- creaed in the very high mau resolution simulation in- dicating that convergence of the CMF with masl xea- olution ir plausible. 2) Higher force resolution leada to larger v&en of the CMF independent of maar rcs- oh&ion. We -inc the effects on the formation of halos arising from different force resolution P3M simu- lations in subsequent sections. 3) Longer waves in the initial condition (100 Mpc box versus a 51.2 Mpc box) do not significantly affect the CMF. 4) Smaller waves in the initial conditions (643 particle initial conditions interpolated to 1283 particle veraun true 1283 particle initial conditions) do not significantly affect the CMF, aside from a small effect on small mau Idea. 5) Larger DENMAX grids better resolve sub,tructurc; tbia low- ers the CMF. The resulta an-sensitive to the different DENMAX grids M it is important to compare CMF, u+ ing the same effective DENMAX resolution. However, we show later that the reulta are lea sensitive when we compute circular velocities which are what we use to compare the simulated halos with the observations.
2.5. P#rr-Schcchfer Theory
As a find application of the CMF, we compare the simulation8 with the predictiolu of the Press-Scbechter theory (Prem k Schechter 1974). The Prea-Schecbtet formdim estimatea the fraction of mayl in bound halos with m- > M to be the fraction of the mass whose
P(M) = erfc [ 21,1;;(M)j t (2.3)
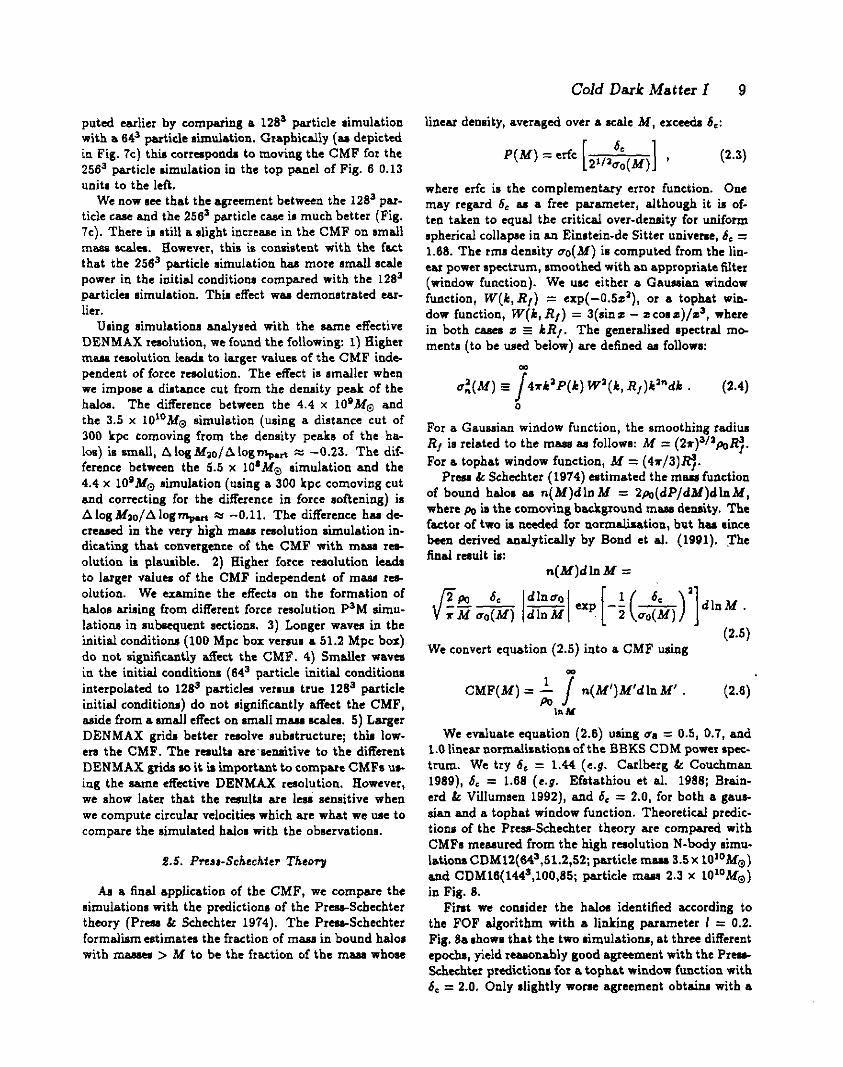
where erfc is the complementary error function. One may regard 6, Y a free parameter, although it in of- ten taken to equal the critical over-density for uniform spherical collapse in an Eimtein-de Sitter universe, 6. = l.BE. The rrm dcnaity oo(M) is computed from the lin- ear power spectrum, smoothed with an appropriate filter (window function). We we either a Gaue.sian window function, W(h,R,) = exp(-O&l), or a tophat win- dow function, W(L, RI) = 3(sin z - z co, z)/z3, where in both caaea z G LR,. The general&d spectral mo- mento (to be used below) are defined as follow:
m
o:(M) E /
4&P(k) W’(k, R,)k’“dk (2.4) 0
For a Gaussian window function, the smoothing radius R, ia related to the maru, aa followa: M = (2*)‘lapoRj. For a topbat window function, M = (4r/3#.
Prem & Schechter (1974) estimated the maa function of bound halo8 aa n(M)dlaM = 2fi(dP/dM)dlnM, where po in the comoving background mau density. The factor of two ia needed for normalisation, but baa since been derived analytically by Bond et al. (1991). The final result is:
n(M)dln M =
&--& IsI exp [-&-&)‘]dlnM
(2.5) \- I
We convert equation (2.5) into a CMF using
CMF(M) = ; 7 n(M’)M’dlnM’
1r.M
(2.6) .
We evaluate equation (2.8) wing ma = 0.5, 0.7, and 1.0 linear nonnalisationr of the BBKS CDM powa #pee- trum. We try 6, = 1.44 (e.g. Carlberg k Couchman 1989), 6, = 1.68 (e.g. Efstathiou et al. 1988; Brain- crd k Villumsen 1992), and 6, = 2.0, for both a gaw aian and a tophat window function. Theoretical predic- tions of the Pruu-Schechter theory are compared with CMFa mesrured from the high resolution N-body nimu- l&ions CDM12(@k3,51.2,52; particle mass 3.5x LO1obf~) and CDM16(144S,100,85; particle mam 2.3 x lo”‘&) in Fig. 8.
First we coluider the haloa identified according to the FOF algorithm with a linking parameter I = 0.2. Fig. Baahow that the two aimulatiolu, at three different epochs, yield reasonably good agreement with the Pzcg Schecbter predictiona for e. tophat window function with 6. = 2.0. Only #lightly worse agreement obtaina with a

10 Gelb & Bertschinger
gauuian window function with 6. = 1.66. Note that the rimulated meas distributiona are broader than pm- dieted. The high maa taila of the distributions actually match very well the Press-Scbechter predictiona for a tophat window function with 6, = 1.66, but there are fewer low mau haloa than predicted. Evidently this ia because they are subsumed into more mauive halos, at leant with the FOF recipe, with greater efficiency than implied by the analytical model. Although the agree- ment with the PrsSchechter theory is not perfect, the erron do not grow with epoch; the analytical theory appears to give the correct scaling of masses aa the clurc tering strength increwa. Our result here differs from that of Brainerd k Villumaen (1992), who found the departures growing aa clustering progresses.
Fig. gb shown nimi1e.r resulta for a FOF linking length I = 0.1. Now 6e must be increased (from 1.66 to 2.0 for the gauuian window function) to account for the smaller manna of the h&x defined st a higher over- density. However, the agreement at small marses is sig- nificantly worsened.
Fig. gc @howa CMFs for CDM12(64’,51.2,52) com- puted using DENMAX, compared with Press-Schechter theory for a gaussian window function with 6, = 2.0. The top set of data points (filled circla and solid curves) are for raw DENMAX m-, with no removal of un- hound particlea (which would dccreare the CMF by about 10%) and with no radial cut. The bottom let (dslhed curvea and croaea) have excluded unbound par- ticla and thw beyond a comoving radius of 200 kpc from the peak. There are aevcral important things to notice. First, at early epochs, the raw DENMAX CMF agreea well with the Preaa-Schechter theory. At high massa the DENMAX distributiona are similar to thone obtained ruing FOF with 2 = 0.1 while at low masses they match the 2 = 0.2 case better. DENMAX break8 up the more meaive clumps found with I = 0.2 while preserving the subclumps aa individual haloa.
Second, e.a clustering increases, the CMF grows lea rapidly than the Prea&chechter prediction. Tbii effect appeara to be due to the ability of DENMAX to find 8uhtructure in balw merged by FOF. Thun, although we diiee with Brainerd k Villumaen (1992) about the resulta from FOF, we agree that the actual halo maw distribution grown lea rapidly than predicted by Prew- Schecbter theory. The agreement could be improved if 6, were to grow with epoch. In fact, at very early epocha (when there are fewer than 100 particlea per group) the fit to the rimulationr is good with a gausaiza window and 6, = 1.68.
The third point to note from Fig. gc is that the radial truncation of the haloa makea a big difference in the m-. Thus, the haloa me very extended, a point that we will demon&rate more clearly later.
In nunmary, halo maa functiona depend on how the
halos are defined. Earlier workers (e.g., Efstathiou et al. 196B; Carlberg k Couchman 1989) found good agree- ment between the Prese.-Schcchtcr theory and simulk tionB. However, the simulations were analyred with a low resolution group finder, FOF (1=0.2), and the haloa contained relatively few particlea. Our results agree with this work, but nhow further that the Preu- Schecbter theory does not match well the CMF when higher resolution in used to identify haloa made of thou- ne.nda of particles. The disagreement is in the sense that the simulated halos arc lua massive than predicted. This occurs not because large haloa have failed to col- iapsc. Rather, merging doea not immediately erase the substructure in large halos, contrary to the assumptiona made in the Press-Scbecbter theory.
3. DISTRIBUTIONS OF HALOS: BACKGROUND
3.1. The Schcchter Luminoriiy Function
We need to define physically motivated catalogs of hr 105 in order to understand further the effects of dynamic range on halo formation slid in order to compare the &nulation8 with the observations. Total bound mu, u in the previous section, ia only one way to cbaracterise the halcu. We can also ask how much maw in contained within a specified radius. Thii ia equivalent to speci- fying I& = (GM/R)“‘. Empirically, I& ia found to be nearly independent of R and to correlate well with optical luminosity. We will use these correlations- the Tully-Fisher (1977) relationship for spiral galaxies and the Faber-Jackson (1976) relationship for elliptical galaxies- to astdgn a luminosity to each halo.
Observations of spiral galaria are measured in terma of their circular velocity and observations of elliptical galaxies are measured in terms of their average central radial velocity dispersion. (Technically, the elliptical at- aerationa are luminmity weighted measurementa of r(~r dial velocities along the line-of-sight.)
We redise that we cannot adequately relate internal velocity diaperaions of dark matter to velocity diaper- sions of centrally concentrated atsm. Nevertheless, we define the quantities 01 and 0, (0, is closer to what the observers measure) from the simulated galaxy halos sa follows:
o:(R) = && - v;m? ,
u;(R) = $$j(.; - i&x). $1’ , (3.1)
where N, represents the number of bound particles within a diatance R from the local density maximum

Cold Dark Matter I 11
where ~?(Vti=) ia the number of haloa found in the simulation with circular velocitia in the range V& f AI&/Z with A&,. = 25 km B-‘. The factor (51.2Mp~/L)~ is used to scale all of the results to CD- moving volumea (51.2 Mpc)’ for comparison.
We compute the corresponding mean number of gal- axics from the observations M follows, assuming C is related to Ma= and MB* = f(V.i.,) for aome function f given below:
*w
(51.2 Mpc)3 a(z) do J a> Mg:! = fPcirc + A&$)
and ?< in the unit vector from the local density maxi- mum to particle i. We do not attempt to diitinguisb the simulated haloa m apirala or cllipticals; rather, we characterize all of the simulated halos in terms of their circular velocities.
Because the velocity dispersion tensor is radially an- isotropic we find that 01 is typically - 20% lower than 0.. We study both quantities, using various cut-off radii (typically a few hundred kpc comoving), when compar- ing the velocity dispersion8 of massive simulatad haloa (perhap awciated with elliptical gala&a) with obser- vationa of the velocity dinpcmiona of centrally concen- trated &a. In order to tnt if either r1 or o, is a useful statistic, and because the stars are in orbits with smaller apapses than the dark matter, we use a crude, linear scaling law (derived from observations of MS?) aa diacosaed in greater detail in f 4.4.
For n = 1 and h = l/2, the circular velocity, for an assumed spherical halo, aa a function of total particle number in the simulation, N, and the comoving box size in Mpc, t, t:
V,is(R) = 7.97kma-‘x
&qq’(51~~Mpc)3’a(~)1’a I
(3.21 \-.-I
where N,(R) is the total number of bound particlea within a comoving distance R from the smoothed den- sity maximum found by DENMAX. The present epoch is o = m s va. In m-t of the figurea, we asname that o = 00 and we consider different polaible normalisationa by varying 08 = 00. In one case below (Fig, la), we fir aa and look at the evolution of haloa for difkcnt II. In all caees, we take R to be a comoving raditu (i.e., a proper radiun at o = oo) and we use the proper radilu &z/o0 in the denominator. To get circular velocities memurcd at a fixed comoving radius, we net a = ao.
In order to compute the observed distribution of gal- axim a a function of V,&, i.e. N(V.i,)AV& we aa- 8ume a Schecbter (1976) lum@oaity function with the form
Q(L)dt = o’e~p(-~/f.)(C/~.)=d(~/L.) , (3.3)
where *(L)df. ia the density of gala&a in the luminos- ity range C to C + dC. We convert equation (3.3) into count8 of haloa in a (51.2 M~c)~ comoving volume aa a standard reference for all of the simulationa in bins of V& using a relationship for C = L(V&). We also USC blue magnitude and selected values of +,’ and C& (both assuming h = l/2), and a value of a.
We define the distribution of halos, or number of halos binned by V.i%, a
N(vcin)AV& = ( 51’2y)3 Z(Ki~)AV& , (3.4)
@; = f&c - AK&)
Q(+fB,]) = wZae.%p(-a) ;
o 3 lp;z-‘Drv~.~ = c C’ (3.5)
We use the central valuea of parametera found by Efa- tathiou, Ellii, k Petcmon (1966): a’ = (1.56 f 0.34) x 10-~?l’ Mpc-3 , hf;, = -19.66 f 0.10 - 2.51ogio/b-a, and 01 = -1.07 f 0.05.
For the function f(V.i~) for apiral g&xi- we oae the blue Tully-Fiaher relation from Pierce k Tully (1966):
4.86 lOg,o(2Vei,)-2.27+5 lOg,o(50/65)+0.569. (3.6)
The term 51og,(50/65) ia ued to convert from a Hub ble co&ant of 65 kms-’ Mpc-’ to 50 km 0-l Mpc-‘. The term 0.569 ia used to correct for random incliiations following Tully k Fouque (1965).
For the function f(V,& for elliptical galaxies we use the Faber-Jaclwn relation from our iit (unpubliihed) to elliptical data of Faber et al. (1989). avuming a Hubble constant of 50 kms-l Mpc-‘:
jtilipti~(&) 3 E/i,, = -6.6364lOg,o(Ol) - 5.884 ,
(3.7) where we relate (rl to Vcix luing:
The factor F, diacusaed in the next section, is estimated from the 6imulatiom. This ue of ~1, however, ia an

12 Gelb & Bertschinger
ovenimplification (mostly affecting high <ix) for rea- sona disaued earlier. Again, we re-examine the high mam halor in detail in S 4.4, where we use Q, nY, and a linear scaling law derived from M87.
The find ingredient L to u~ume that 70% of the gal- axies are spirala and 30% are elliptic& Tbii it also the slsumption umd by fienk et al. (1968). In other words, we add together the results for npiraln using equa- tion (3.6) to relate circular velocitia to absolute mag- nitudcs and weighting equation (3.5) by 0.7 with the raulti for elliptic& using equstion (3.7) to relate cir- cular velocitia to absolute magnituda and weighting equation (3.5) by 0.3. Dreuler (1980), however, found a higher concentration of ellipticah in rich cluatera com- pared with lower density regiona. Postman k Gellcr (1984) found for the CfA survey that 1) the relative numbers of g&.&a are 65% spirals, 23% SO’s, and 12% elliptic& and 2) there is a dramatic incresle in the rcl- ative number of api& in the field compared with dense regiona. That percentages can alter the estimates at the high mau end.
3.8. 01 vc+#w V&
The factor F in equation (3.6) is measured empir- ically from the simulation CDM16(1443,100,85) using DENMAX halos amdyaed with a 512’ grid. White et al. (1987) used F = 1 (in our notation) but the lame autbon ued F = 1.1 in Frenk et al. (1988).
Because the Plummcr softening in CDMIB in c = 65 kpc comoving (or Rlll = 85 kpc) we cannot directly de- termine cl(R) or V&R) at the diatancea where optical observation9 of real gal&a are made. OpticaI obser- vatiolu of central velocity &Persians of large elliptical gal&a am made on w&a of a few kpc to m 6 kpc (nee fianr, II&worth, k Heckman 1989). Optical obser- vatiolu of circular velocities of large spiral gaiaxia are made out to w 10 kpc. Rubin et al. (1985) studied 16 large spiral g&.x& where they could measure vclocitiea out to large radii. The average maximum distance for which they made mwuremcnt~ was 16.4 kpc and the maximumdistance for the 16 galasia wm 51.2 kpc. We cotider the limitationa ariaiig from our measurementa at large r&iii u we proceed.
What ia a value of R for computing ~1 when the re- suits c.re independent of R? In Fig. 9 (top panel) we abow 0, evaluated using R = 100 kpc comoving venu R = 200 kpc comoving. The slight increase in 01 for R = 200 kpc comoving versus R = 100 kpc comoving (top panel) indicatea that contributions from particles at large separationa are still important for the most ma+ sive halos. We find thii trend to be larger when compar- ing rwuits from B = 50 kpc comoving vernn B = 100 kpc comoving, indicating that R = 100 kpc comoving ia too small. We find this trend to be amell when campar- ing raulta from R = 200 kpc comoving versus R = 300
kpc comoving, indicating that R = 200 kpc comoving is adequate. We find similar results at oa = 0.7 and 0, = 1.0.
What is a value of R for computing V.i, where the mults are independent of R? In Fig. 9 we &a abow computation8 for Kit, using R = 100 kpc comoving, 200 kpc comoving, and 300 kpc comoving. The results indicate that R = 200 kpc comoving ia acceptable (bot- tom panel) while R = 100 kpc comoving again ia too small (middle panel).
What L an empirical value of F in equation (3.6)? In Fig. 10 we abow V&/ol venu V.i.. (all computed with R = 200 kpc comoving) at (ra = 0.5, 0.7, and s=l.O for haloo from CDM16(1445,100,65). The solid linen indicate F = 1 (i.e. V&u, = fi) and the dotted lines indicate F = 1.1 (i.e. V.;,/u, = a/1.1). There is lea scatter for high v&a of V.h veraa low valuea of Vcim. The f&or F affect8 the convenion of V&c to 01 for elliptic&.. Elliptic& dominate at the high mass end where, at o(~ = 0.5, F = 1.1 worh nlightly better than F = 1. However, when we ahow the observed number of haloa in $ 4 we use both F = 1 and F = l.l-the latter yields fewer bright haloa since it effectively raises #I for * given V& implying a brighter elliptical galaxy (or equivalently, F = 1.1 dtectively auigm a anaIler stellar velocity diapersion for a given 01).
In summary, we compute the number of baloa scaled to (51.2 Mpc)’ comoving volumes assuming a Schecbter luminosity function (a’ = 1.56 x 10-‘hs Mpc-’ and bf& = -19.68 - 2.5 log,, h-l with h = l/2 and a = -1.07 ). We spume 70% of the gahxiea are spirals with L Tully-Fiber relation given by equation (3.6) and 30% of the galaria are elliptic& with a Faber-Jo&non relation given by equation (3.7). We convert elliptical muraurements in termn of cv$ to Vk wing equation (3.8) for both F = 1 and F = 1.1. For the most muive haloa F = 1 ia adequate except at 01 = 0.5 where F = 1.1 is Bligbtly better.
3.3. Circular Vclociiy Profiler
We now examine circular velocity profiles and l- dimensional velocity dispersion profiles from CDMl2 (643,51.2,52) in Fig. 11. We extract rcveral facts from tbae plots. First, the circular velocities are very flat for nearly all the hala, except for a few maarive ones, for R L 150 kpc comoving. We e&o see that the circular velocities are flat for many of the midsiie halos down to about 80 kpc comoving (twice the Plummer softening length). We conclude that 150 kpc comoving is a good place to characterize the circular velocities for tbia sim- ulation at all epochs. We are making * significant error only for a handful of the moat massive b&a. The rising circular velocities for the most massive bala are not an artifact of aonening (see 5 4.4).

Cold Dark Matter I 13
We aha atudy CDMl (RI/~= 280 kpc comoving) and CDMl6 (RI,% = 85 kpc comoving) and we find that R = 300 kpc comoving ia suitable for CDMl and R = 200 kpc comoving is suitable for CDMlB. In moat c-, we UK R = 150 kpc comoving for the RI/~ = 52 kpc comoving simulation; R = 200 kpc comxing for the Rlj2 = 85 kpc comoving simulation; and R = 300 kpc comoving for the R1j2 = 280 kpc comoving simulation. These dua me chosen where V.ir. ia flat for nearly all of the halo&
We compare our circular velocity profiicl to Gmula- tioru by othen with much higher force resolution. The n = 1 CDM nimulstiona of Dubiluki k Carlberg (1991) used 33000 particla in a 2.3 Mpc radius sphere. The typical particle mau is 1.2 x lOa& and the Plummer softening is 1.4 kpc. In their figure 4 they ahow several circular velocity profila with halos that have maximum circular velocitia of about 290 km.-‘. These haloa have Eat circular velocitia between about 10 kpc and 60 kpc (there is a very slight decrease over thin range). The circular velocities rise on a M& a few timea the Plummer softening length (YI we also find in our simula. tiona.
The simulations of Warren et al. (1991) used roughly a million particles in a 5 Mpc radiun sphere and e Plum- mer softening of 5 kpc. For circular velocity profila that have maximum circular velociticl of about 150 kms-’ they found that the profila are rining out to a diitance of about 30 kpc-again, leveral Plummer lengtha. They also found that their profila are falling typically beyond a diitance of about 40 kpc. In our P3M aimulationr we do not find falling circular velocity profilea until a dis tance of about 100 kpc. One reason for thin dirrepancy is that Warren et al. did not not use a CDM power ape&urn-rather, they used P(b) TX k on large talcs with a sharp transition, at 1.5 Mpc, to P(k) 01 k-l on small scales. The behavior of circular velocities ia II func- tion of the effective index in the initial power spectrum (Boffrm k Shaham 1985).
We amme that if we had used force softening below the typical -10 kpc observed axle, as in the simulations of Dubinski k Carlberg (1991) and Warren et al. (1991), that our circular velocity profiles might remain flat down to these scales. Therefore, we do not expect to make a significant error by estimating V& ruing R 2 150 kpc comoving. We cannot use circular velocities to char- acter& the most massive halos because observational data for maMive halos arc based on velocity diipenions, not circular velocities. We explore the propertier of 0, below.
There ia cause for concern when using nimulationa with force aohening fax beyond a few kpc-the acale be- yond which moat spiral gala&a arc observed to have eat rotation CUIVQ. Are we able to adequately rc- solve individual halos? We comment on neveral iuua
related to this quwtion. 1) Using - (l/+‘)‘/‘, and Q’ = 1.95 x 1O-3 Mpc-‘, we find the mean spacing be- tween bright galaxies in - 8 Mpc. This is much greater than ouz fiducial radius - 200 kpc. Observationa ahow flat rotation curvea “aa far M the eye can see” for moat spiral gala&a (Rubin et al. 1985). It is therefore pra sible that real galaxies have flat rotation curver beyond 200 kpc. 2) The mean galaxy spacing in much smaller in rich clustera. It is possible that some of our maaive halo* are mcrgen where diiipativc effects might allow many gala&n to survive in a single halo (White k Rm 1978; Ksts k White 1993). In Paper II we break up these system6 u&g various methods in an attempt to estimate the effecta on clustering. In tbii paper, how- ever, we conaider the massive halos at face value and we examine the implicationa for CDM in S 4. 3) We com- pare resulta from the c = 40 kpc comoving simulation with raulta from the c = 65 kpc comoving simulation and we ask if the distributions of halos are significantly different.
Last, we ahow q(R) for the c = 40 kpc comoving simulation CDM12(64’,51.2,52) in Fig. 12. (These are the aamc halo@ shown in Fig. 11.) The lint thing we notice ia that the profiles are very tlat down to about 40 kpc comoving, the Plummer softening scale. (On nnaller x&a we are limited by both force and ml~l raolution.) Also, the profila for the moat man&e halos are fiat down to typically 100 kpc comoving. In 5.4.4 we use v, computed at large radii (Gnila~ to 01) to compare simulated halon with the obaervationr.
4. DISTRIBUTIONS OF SIMULATED HALOS
/. 1. oveticw
We now study the diitributions of simulated halor 1u a function of %irr. The results of the computatiopc of N(V&)AV,i, scaled to (51.2 M~c)~ comoving voluma are presented in Figs 13 through 16. We include ob- servationai estimates using both F = 1 and F = 1.1 to relate n1 to V.i= for comparison.
We focus our efforts on the following three simula- tions: CDMl(12g3,51.2,280), CDM12(643,51.2,52), and CDM16(1443,100,85). CDMl offem good mass r-o- lution (m, = 4.4 x 10’ MO), CDMl2 offem good force resolution (Plummer softening of 40 kpc comov- ing), and CDMl6 offers fairly good rnasa and force re+ olution (mput = 2.3 x 10 lo Ma; Plummer softening of 65 kpc comoving) yet is computed in a 100 Mpc box. Again, we demonstrated in 5 2 that the CMF L not very seruitive to the box size but we demonstrate in Pa- per II that clustering atatiatiu require borea larger than 51.2 Mpc on a aide.

14 GeJb & Bertschinger
Our goal in the following section, ia to attempt to corntrain the amplitude of the primeval density tluc- tuationa of the n = 1 CDM model from halo circulsr velocity diitributiona. We devote separate 8ubKCtiona for both high mana and low mau halos, which require special treatment for determining reliable simulated and observed dirtributiom.
1.8. Circular Velocity Dirtributionr of Simulated H&r
We measure N(V.i,)AV.i, from the simulations. We ask the quatiom: 1) Over which range of circular ve- locitia do the reaulta agree with the obaervatioru? 2) Over which range of circular velocities do the resulta dii agree with the observations? 3) Do the resulta depend on numerical raolution and techniquea for identifying h&h?
III Fig. 13 WLZ lhow hT(Vcits)AV& at 08 = 0.5, 0.7 and 1.0 for an analysis of CDM1(1263,51.2,280) using 5123 DENMAX and FOF(l=O.l) and FOF(L0.2). We szc from Fig. 13 that the number of haloa agrees with the observations very well from about 150kma-’ to 350kmc’ for DENMAX and FOF(L0.2). The re- sub for FOF(I=O.l) do not fare M well. These state- ments are true for all three epocha; however, the excem number of maaaive halos gets wone with incresring 08. DENMAX in a compromise between FOF(k0.2) which sometime merge haloa and FOF(IzO.1) which faila to produce some h&a. These resulta are encouraging for atudia that une FOF(lz0.2) nch aa Frcnk et al. (1986); however, FOF(lz0.2) occasionally linka together via”- ally distinct halos.
We now study the effecta of force resolution, choice of DENMAX grid, and choice of R (used to compute V.3,) 011 N(J’circ)AKim WC show N(Vcirs)AV& at 01 = 0.5 for CDM12(64’,51.2,52) in Fig. 14. The first tbiig we notice is that the agreement with the number of sim- ulated halol with the observationa from 150kmn-’ to 35Okm~’ ia even better than it in for the low force rw olution PM aimulstion discussed above, particularly for Vh w 200 kms-‘. We also see that the results are not very sensitive to the choice of R except for the few very massive hdw. Thin in not surprising since molt of the circular velocity profile are eat beyond 150 kpc comov- ing except for the moot massive halos-cf. Fig. 11.
It in encouraging that the results are not very semi- tive to the choice of DENMAX grid except for the most massive hdcn and for the 643 grid. This ia not true for the halo ~MSCI described by the CMF in $2-we show later that this is because the different DENMAX grids significantly &ct peripheral particle beyond the di, tance R used to compute the circular velocities. It in not surprising that the very coarse 645 grid faila to match up to the tier grida.
We conclude tbia diiuasion by testing the sensitiv-
ity of the agreement of the number of timulated haloa with the observations for the different P3M simulations (Fig. 15) and then by studying the evolution of the num- ber of the simulated halor (Fig. 16).
In Fig. 15 we rhow N(V,i,.)AV.i, for CDMl2 (643,51.2,52; t = 40 kpc comoving) (top panel) and for CDMl6 (1443,100,6S; c = 65 kpc comoving) (bottom panel), both andyred with e. 5123 DENMAX grid. We extract several facts from Fig. 15. First, the trend of in- creasing number of halos with increasing force resolution L verified comparing the simulation8 with c = 40 kpc co- moving (top panel) and c = 65 kpc comoving (bottom panel), but the difference are small. We found in 5 2 that the CMF wca higher for higher msu resolution rimulations and for higher force resolution aimulationa independently; but here force resolution must he domi- nating becaw the c = 40 kpc comoving Gmuletion hzu slightly lower mans resolution than the f = 65 kpc c* moving simulation, yet &ill produce slightly more haloa at a given V.h. We alao found in f 2 that the differences in the CMF versus maw resolution were much smaller when we imposed a radius cut on the masses. Tbii is equivalent to computing circular velocities.
In Fig. 16 we show V.,.. for CDM16(144J,100,g5) U- ing a fued physical radius. We lit the epocha iu red- rhifts, z = l/a - 1, because here we tie studying the evolution of the balm for a fixed normalization. We au- nune that the present epoch, L = 0, ia a, = ~8 = 1. We keep the physical radiun cut con&eat at 100 kpc by using a 100ao/o kpc comoving r&&s cut in aqua- tion (3.2). The vertical axis io scaled to e, (51.2 Mpc)’ comovlng box, however.
We ace in the panels of Fig. 16 that N(V.i,)AVerc (using a fixed proper radius) evolves strongly with red- shift. At z = 9.9 haloa are still forming. The ma- jor era when galaxies begin to take on the observed diitribution ir around I = 3.7 to 2.2. Further evo- lution indicates that the haloa are merging, i.e. the curvea are decreasing. At intermediate circular veloci- ties (V,, = 200 km I-~) the number of halos decreases by a factor of 3.7 from the maximum at z w 3.7 to z = 0. For smaller halos (Vh = lSOkm1ml-‘) the effect ia higher, a factor of 4.7 from the maximum at z 5 3.7 to L = 0. From L = 0.4 to L = 0 the factor in rougly con- stant at - 1.5 over wide range of V.i=. The most massive haloB grow at the expense of the smaller ones. For ha los with total bound masnea exceeding 2.3 x 10’3Mo in CDM16(1443,100,65) (i.e. 1000 particles), we find 245 halos at z = 1, 292 at z = 0.4, and 285 at z = 0. There- fore, the number of massive haloa, unlike the lower maa hala, go** little for z < 1.
The mergers implied by Fig. 16 are interesting in themselves, and they arc important for Paper II where merging forma massive systems which have a profound effect on galaxy clustering and velocity at&&s. Frenk

Cold Dark Matter I 15
et al. (1988) &a found merging in their simulation8 with decreasing redshift. There exists some observe- tional evidence for merging. Excem counts of faint gal- axies (Tyson 1988) compared with present galaxy popu- lations suggest the pouibility of merging (Guiderdoni k Rocca-Volmerange 1990; Coaie, Songaila, k Hu 1991). The merger hypothesir ia not without controversy, how- ever, for other pauibilitiw and complicationa, high- lighted by various authors, include 1) luminosities may evolve more rapidly for faint gde.xiea than for bright gal- axia (e.g. Broadhunt, Ellis, k She&a 1988); 2) the ge- ometry of the univeme may be different from Einatein-de Sitter (e.g. Fukugita et al. 1990); or 3) the faint g&.x- iea may rcprment a separate population (e.g. Efstatbiou et al. 1991).
Conic, Songaila, k Eu (1991) argue that the faint galaxy exceu ia a factor w 4 - 5 from z 5 0.25 to I = 0 wuming no lumiaoaity evolution for these modeat red- ahifta. Although CDMl6 predict0 only a factor of h 1.5 from z = 0.4 to s = 0, we cannot accurately address galaxy merging with our dark simulations for the fol- lowing recaom: 1) we underertimoie merging by always associating one galaxy per halo and 2) we overeatimste merging by always assuming that when halos merge their waociated gdaxica merge. Complications aide, since the reduction Le w 1.5 over a wide range in Vsirc, we may naively annme that only m (1 -l/1.5) x 0.7 = 23% of the #pi& (buuming a 70% spiral fraction) have not experienced a major merger since z - 0.4. This in problematic since Toth k Ostriket (1992) argue that high merger rata in the 1-t 5 Gyr (~~0.37 for fI = 1, If,, = 50 kma-’ Mpc-‘) can heat dint galaxies beyond observed levels. Furthermore, if we were to identify a0 = ge = 0.5 ru the present day, Fig. 16 would still apply if the V& values were all multiplied by 2-l/‘. This would move the ~8 = 0.5 curve (z = 1.0 in the figure) into agreement with the Schecbter function, aa it should from Fig. 15. From this we conclude that in the CDM model merging should continue into the future at a rate a~ prodigious aa the recent past further violating the Toth k Oltriker (1992) limits. For a more detailed examination of merging In CDM models, me Kauffmaun k White (1992).
4.S. hfa~aivc E&r: Computational Iaawr
Since the number of haloa from CDM16(144J,100,85) agrees with the &nerved number of halos in the range 150kms-’ 2 Vc;.. $350kms-’ we now focus on the discrepanciu outside those ranges. In this section we explore circular velocities at various radii and we inveb tigate the sensitivity of the formationof massive halos to dynamic range and to methods for identifying the halos. In S 4.4 we compare the number of simulated halos with high or to the number of obwrved bright ellipticala, fol- lowed by a diacuaaion of low maa halw in f 4.5. The
purpose of thti a&ion ia to reveal which computationd effecta, and why, affect the maruive haloa.
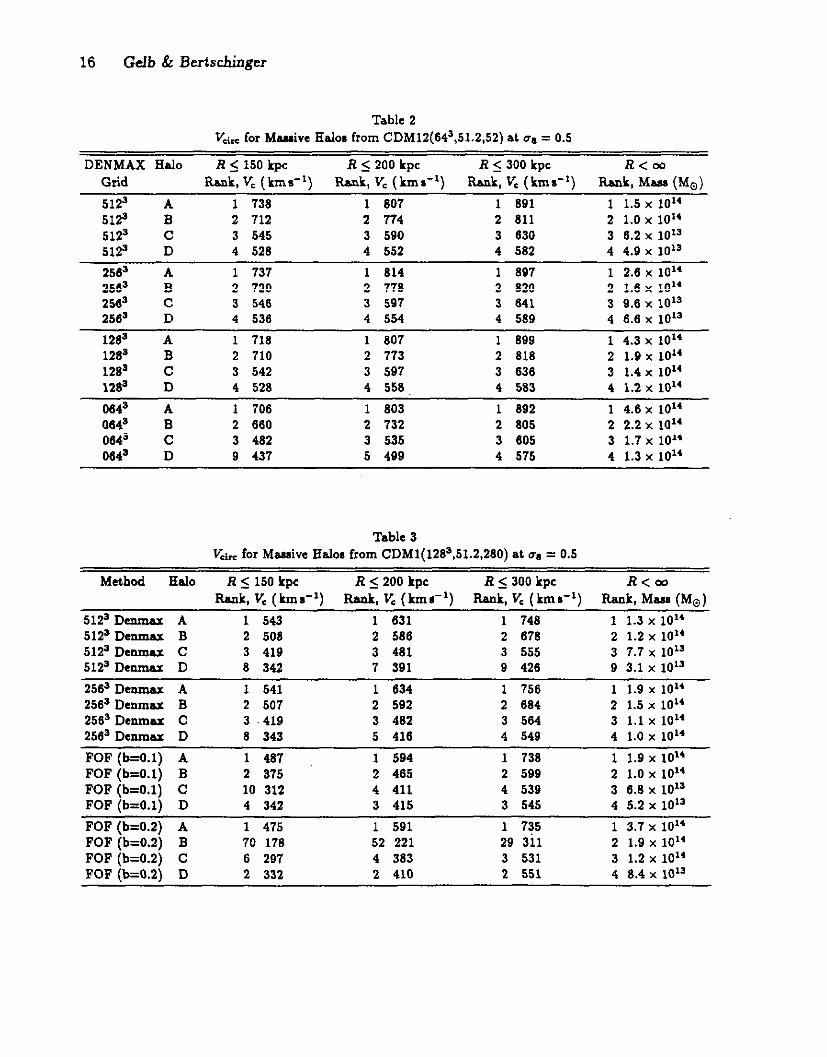
We present the four most msasive haloa at 08 = 0.5 from CDM12(643,51.2,52) in Table 2 and from CDMl (12@,51.2,280) in Table 3. The hala are labeled A, B, C, and D. These two simulationa UH equivalent initial conditiona. Corrnponding haloa are identified. In the tables we list the circular velocitia in kms-’ using R = 150 kpc comoving, 200 kpc comoving, and 300 kpc cw moving. We alaa lint the bound m- (R < m) in mlar III-. In Table 2 the results are tabulated for a ~2~, 2563, 12E3, and 643 DENMAX grid, all at 08 = 0.5. In each column we also list a local rank. The number fi means the halo is the ntL largest halo in the catalog ur ing the method for halo identification mentioned in the lint column. Note that the circular velocity profiles for these massive halos are atill rising far beyond the soft- ening acale. Here we are &created in their profilea at large radii. We use o, and V.;.. extrapolated to more reasonable radii in the next section.
We use Table 2 to study the effect of the choice of R and the DENMAX grid on the massive halos. The first important feature brought out is that Vck incrtua with increasing radii. These massive haloa have ex- tended halos with rising circular velocitia at these scaIa (cf. Fig. 11). The next trend we observe is that the cir- cular velocities, unlike the CMF without a rcdiur cut, are not very sensitive to the choice of DENMAX grid. However, the slight diierencea are explained below.
In Fig. 17 the bound particles from halo B found in CDM12(643,51.2,52) are ahown using the w+rioun DEN- MAX grids. We we that the coarser DENMAX grida (5 256’) merge the massive halo with an additional small halo (located at z za 200 kpc comoving, y m -200 kpc comoving). The ma.w of thin “appendage” ia mmll and ia fai enough away from the core (about 300 kpc comoving) so that it contributes little to the &c&r ve- locity defined within 300 kpc comoving. Nevertheless, it reveals substructure present in the higher force res+ lution simulation.
The lower resolution DENMAX grids &o lead to the inclusion of more peripheral (distant) particles. This in not neriou since tbii doa not involve a lot of maw and ooly involves particlea well beyond 300 kpc comoving from the halo core. When the DENMAX grid ia finer than the interparticle 8eparation in the periphery, the denaity gradients are not present to move the particlea into the halo. Thia fact partially explain why the CMF (in 5 2), based on total bound masses, is more aenaitive than Vcis to variations of the DENMAX grid.
We now consider the effects of force resolution. In Fig. 18 we show the same halo B but from the low force resolution PM simulation CDM1(12EJ,51.2,280)- we show every eighth particle for comparison with the 643 particle P3M simulation. The force resolution ia too
16 Gdb & Bertschinger
Table 2 Vets for Mwive Haloa from CDM12(643,51.2,52) at 08 = 0.5
DENMAX Balo R < 150 kpc R 5 200 kpc Rs 300 kpc R<m Grid Rank. V. (kms-‘1 Rank, v. (kms-‘1 Rank. K (kmc’) Rank, Mssl (Mnl
5123 A 1 738 1 807 1 891 1 1.5 x 10” 5123 B 2 712 2 774 2 811 2 1.0 x 10” 5123 C 3 545 3 590 3 630 3 6.2 x lOI 5129 D 4 528 4 552 4 582 4 4.9 x 10’3
256’ A 1 737 1 814 1 897 1 2.6 x 10” 2563 B 2 720 2 778 2 820 2 1.6 x 10” 2563 c 3 540 3 597 3 641 3 9.6 x 10¹³ 256’ D 4 536 4 554 4 589 4 6.6 x 10’3
128a A 1 718 1 807 1 899 1 4.3 x 10” 126’ B 2 710 2 773 2 818 2 1.9 x 10” 12.95 C 3 542 3 597 3 636 3 1.4 x 10” 12E? D 4 528 4 558, 4 583 4 1.2 x 10”
0643 A 1 706 1 803 1 892 1 4.6 x 10” 064a B 2 660 2 732 2 805 2 2.2 x 10” 064’ C 3 482 3 535 3 605 3 1.7 x 10” 064’ D 9 437 5 499 4 575 4 1.3 x 10”
Table 3 V.i.. for Mslsive Halos from CDM1(12E3,51.2,280) at Q = 0.5
Method Hal0 R < 150 kpc R<200 kpc RI 300 kpc R<m Rank, V, (kmc’) Rank, V, (kmr-‘) Rank, K (kmc’) Rank, Maa (Ma)
5123 Denmax A 1 543 1 631 1 748 1 1.3 x 10” 512s Denmax B 2 508 2 586 2 678 2 1.2 x 10” 5125 Denmu C 3 419 3 481 3 555 3 7.7 x 10’3 5123 D- D 8 342 7 391 9 426 9 3.1 x 10’3
2563 Denmax A 1 541 1 634 1 756 1 1.9 x 10” 2565 Denmsr B 2 507 2 592 2 684 2 1.5 x 10” 2563 Denmax C 3 -419 3 482 3 564 3 1.1 x 10” 25e5 Denmar D 8 343 5 416 4 549 4 1.0 x 101’
FOF (bz0.1) A 1 487 1 594 1 738 1 1.9 x 10’4 FOF jb=O.lj B 2 375 2 465 2 599 2 1.0 x 10” FOF (ts0.1) C 10 312 4 411 4 539 3 6.8 x 10’3 FOF fb=O.l) D 4 342 3 415 3 545 4 5.2 x 10”
\ I
FOF (b=0.2) A 1 475 1 591 1 735 1 3.7 x 101’ FOF jb=0.2j B 70 178 52 221 29 3il 2 1.9 x 10” FOF (b=0.2) C 6 297 4 383 3 531 3 1.2 x 101’ FOF (b=O.21 D 2 332 2 410 2 551 4 8.4 x 10”

Cold Dark Matter I 17
low to produce the ‘appendage” that we see in the P3M simulation- therefore, these ia no significant difference between the 51p grid DENMAX and the 25@ grid DENMAX results. We conclude that high force rcsolu- tion reveala more substructure than low force resolution and that high resolution DENMAX grids are required to reveal thii aubatructure.
We we in the lower right panel of Fig. 18 a major failing of FOF(lz0.2). Thii is a particularly patholog- ical example. Of coume we could naturally prune tbii halo into separate halos. It is not practical, however, to examine visually and prune manually the thousanda of halos produced in each simulation.
The CDMl PM haloa A through D, corresponding to the halos studied in the CDM12 PJM simulation, are tabulated in Table 3. The results are shown for two DENMAX grida and two FOF linking parameters, all at 08 = OS. From Table 3 we conclude: 1) The 5123 DEN- MAX retultr compare well with the 256’ DENMAX re- suits. 2) The FOF analysca fail to agree with the DEN- MAX eaalyla. The diierence between FOF(I=O.l) and FOF(Iz0.2) is not too great since these massive PM ha- loo do not have I) lot of rubstructure. The exception ia Halo B in the FOF(IzO.2) a..naly& Thii is the patho- logical halo shorn in the lower right panel of Fig. 18. Three visually diitinct halos are merged together and the center-of-maw is such that the ‘helo” ia highly non- spherical leading to unreliable circular velocities.
We also find, from Table 3, that the P3M h&x arc more compact than the PM halos. If we compare V& defined at 150 kpc comoving in Table 2 for P’M CDMl2 with Vci,s defined at 300 kpc comovingin Table 3 for PM CDMl, we find comparable valuea of V&. By the time we go out to 300 kpc comoving in the PM simulation we pick up enough particles to give the same circular veloc- ity ea the P’M simulation using 150 kpc comoving. This is because we choo~ values of R to be the radius where most of the circular vclocitia are flat. These radii are directly related to the force resolution. However, things do not always work out thin nicely for the massive ha- loll that have tiing circular velocity profiles, as we can see by comparing halo D in Table 2 for P3M CDM12 using 150 kpc comoving and halo D in Table 3 for PM CDMl using 300 kpc comoving. The differences in cir- cular velocitia are @Scant enough to shift some of the meaive halos into adjacent 25 kms-’ bins.
We now summarise some effects arising from the corn- putational techniques that influence the number of ma.+ sive halos in the N(&,)AKir. hiitogramr. 1) The re- suits are sensitive to the choice of R used to compute the circular velocities-thi is obvious since the circular velocity profiln are not flat for the massive haloa. 2) We have ahown that higher resolution DENMAX grids reveal more sub&ucture in some of the massive haloa found in the higher force rwalution simulations. How-
ever, from the imagea it sppean that no obvious rub structure is prcacnt in many of the massive halos. 3) Lower rcaolution DENMAX grids include more periph- eral particles in the halos than higher resolution DEN- MAX grid*. This arbitrary choice of DENMAX grid don not affect most computationa of circular vcloci- tics. It does, however, affect the computationa of total bound maaaes; this explain8 why the CMF ia more aen- sitive to the limitations of the current venion of DEN- MAX than ia the case for the circular velocitia. 4) FOF(I=0.2) occasionally links together visually diitinct halos. FOF(I=O.l) and FOF(I=0.2) produce similar re- sultr for many of the massive haloa but they often fail to match up with DENMAX results which, visually, appear to do B good job in many casea. 5) The P3M simulationa produce halos that are more compact than the PM sim- ulotiona. However, if a larger value of R is chosen for the PM simulations, then the PM circular velocities agree with the P”M circular velocities in most cases.
4.4. hforrivc &Ior: Simulaiioru YCWU Obrcwdionr
The distribution of aimulatcd halos with circular ve- locitiea in the range 150 km 6-l 2 Vci.. ,S 350 km 8-l ia in rciuonable agreement with observation (Fig. 15). However, there are too many haloo with circular veloci- ties exceeding 350 km.-‘. A simulation with increased force resolution can reveal more substructure in manaive halos (e.g. Carlberg 1992), and a continuum-lit DEN- MAX algorithm would be helpful for analyring such aim- ulations. We take the approach, in this paper, that thcae massive dark matter halos represent single, large galax- ies. The possibility that they may represent clurten in studied in detail in Paper II.
We use fairly complete cataloga of observed bright ellipticala to estimate their number dcnaity. It is not ac- curate enough to estimate the brightest, relatively few elliptical g&.xiec simply from a Schecbter luminosity function and a Faber-Jackson relationship. The prob. lem is exacerbated by the large amount of scatter rc- lating ~1 to VS+ for the simulated maraive halos. In this subection we instead use o- to characterize the simulated massive halos and we compare them with the number of observed ellipticala using complete elliptical surveys. We UIK these compariaanr k, corutrain the nor- me&ration of the t-l = 1 CDM power spectrum using the fact that M the simulationa evolve merging cresta more massive halos.
We begin by noting that there are observed galaxy haloa that have large measured circular velocitia be- yond .- 100 kpc. The giant elliptical galaxy M87 haa been studied by many worken using the X-ray emit- ting gar to trace the gravitational potential well (e.g. Fabricant k Gorenatein 1983; White k Sarasin 1988; Thai 1992). Thai (1992) modeled the X-ray e&ion

18 Gdb & Bertschinger
from M87 using a multi-phase gas mumed to be in hy- drostatic equilibrium. Thai found the best fit gas tem- perature and masn density profile consistent with both X-ray continuum and line emission data. Hi raults arc corultcnt with the velocity dispersiona of Sargent et al. (1978) and Mould et al. (1990) on small sce.la. (Note that the mean, radial velocity dispersion, o,, of atarn in M87 from 1 kpc to 4.5 kpc is roughly con- stant at only 278 f 11 kmr-‘, yet can be aa high aa 350 kms-’ well within 1 kpc-cf. Sargent et al.) The in- ferred mau within 300 kpc annming a Hubble comtant of 50 Irma-l Mpc-‘, is approximately 2.5 x 10L3Mm with a corresponding circular velocity of 592 kma-‘. Curiously, 1.1 x 592 km ~-‘/a = 376 kms-’ (se equa- tion (3.8)) which is close to the 350kme-’ meslum- ment (within 1 kpc) from Sargent et al (1978). How- ever. since it ir not clear which small-scale star meanne- menta ahould be related to large-scale dark matter me(L- aurcments, we adopt an empirical scaling law which ro- lates Faber et al. (1989) central velocity measurements (used aa a complete catalog of nearby cllipticals) to Tti (1992) circular velocity measurements on large scaler..
In Fig. 19 we nhow circular velocity profiles for halos B and C (m Tabla 2 and 3) from the aimulationa at o, = 0.5 and for M87 (Tsai 1992). We choose halo C becslue it has a circular velocity comparable to M87 at large r&iii. (Halo B bar a higher circular velocity than M87.) The profiles from PM CDMl rise slowly which in expected ainee the force softening ia 280 kpc comoving. The prolila from P3M CDM12 rise more quickly than PM CDMl because of higher force resolution. Ignoring the fact that many of. the simulated haloa are atill ridng beyond 150 kpc comoving, the conjecture that at lecut some of the very massive simulated haloa are similar to objects like M87 is seen to be plausible.
We offer e. pouible explanation why the simulated ro- tation curves are still rising beyond the softening Kale for P’M CDM12 while MB7 hm a very 0at rotation curve. During the dissipational formation of M87, dark matter can be pulled into the central region by buy- onic infall (e.g. Blumenthal et&. 1986). If we examine V&(t) in figure 3 from Blumenthal et al. (though from a system with mdmum circular velocity * 200 km 6-l) we estimate that the ratio of the distticea where V& turns over is ,-. 80 kpc/lO kpc = 8. For the P3M CDM12 halo C profile shown in Fig. 19, this effect could possibly “pull” the turnover in the dark matter rotation curve from m 200 kpc to w 25 kpc, consistent with the turnover in the M87 profile shown in Fig. 19.
We examine the largest halos found in the Gmulations and we compare them to one of the most mc.nGve and luminous gal&a known-the central CD galaxy in the clustu A2029 (Dreasler 1979; Uson, Boughn, & Kuhn 1991). The mm profile of thin galaxy bar been ati- mated with a 3-component model by Dressier (1979): 1)
B ‘normal” elliptical galaxy, 2) an extended halo of lumi- nous material out to 100 kpc, and 3) a dark cluster-filling component. Drcssler atimsted the mass within 100 kpc (forH,,=50kmn-1Mpc-‘)tobe~3.9x10’JJrfoand within 1 Mpc to be w 8.3 x 10” da,. The evidence that the material within 100 kpc is part of the central CD galaxy is strong, but there is some controvcray about the mass out to 1 Mpc. Uson, Boughn, k Kuhn have argued that the material out to 1 Mpc and beyond is indeed part of the central CD galaxy. They measure dif- fune light out to several Mpc. They found that it has an elliptical profile with the name axia ratio and orientation e.a the central CD galaxy, and that this is different from the distribution of the cluster galaxies aa a whole.
To compare with the above meanrementr, we com- pute the mana within 100 kpc comoving and 1 Mpc comoving from the simulated halos. Using CDMl2 (843,51.2,52) we find the halo with the largest rna~ within 100 kpc comoving and the halo with the largest mass within 1 Mpc comoving. The results within 100 kpc comoving (more than twice the Plummer soften- ing) are 9.0 x IO”& at 01 = 0.5, 1.7 x 10¹³hfo at 01 = 0.7, and 2.9 x 10’3Mo at o1 = 1.0. None of these arc greater than Dreulcr’a estimate for the central CD galaxy in A2029, 3.9 x 10’JM~. Within 1 Mpc comov- ing we find 1.3 x 10”Mo at ~8 = 0.5, 1.9 x lo”&& at o, = 0.7, and 1.9 x, 10”Mo at 08 = 1.0. Again, these are all tmaller than Dnuler’s estimate, 8.3 x 10”Mo. Thus, me cannot rule out CDM by arguing that it pro- duces halos with absolutely too much mesa. We also cannot rule out CDM merely by the fact that our aim- ulation faila to make at leant me halo aa massive BII the central CD galaxy in A2029-we sample only a 51.2 Mpc box while A2029 ia at a distance of 470 Mpc.
We examine other simulationa in an attempt to find halos aa massive as the central CD galaxy in A2029. We examine CDM6(2563,51.2,1S0) at Ii= 1 Mpc co. moving at ca = 1.0. The moot massive halo at ‘this rcdiru hru a maw of 3.7 x lOl’M@. ALO, we examine CDM16(1443,100,85) at ~8 = 1.0 with no cut in radius, and the molt massive halo haa a mass of 8.9 x 10”. This in a larger box with larger waves in the initial con- ditions and a different set of initial random numbers. The model still fails to produce a halo LYI massive M w 8.3 x 10”Mo. Thus far the fl = 1 CDM model may ba nafe.
Although WC cannot reject CDM based on the moat massive halo in the simulations, maybe we can reject it based on the large number of slightly lea mzaive he.- loa that are formed. Becaute the moat massive galaxies are elliptic&, we compare the number of simulated he.- 10s with large radial velocity diaper&n n, (Becond of equations (3.1)) with the number of elliptic& having large lineof-eight central velocity dispersion. For the observations we use the samples of nearby bright ellip

Cold Dark Matter I 19
tical gala&a from Faber et al. (1989) and from the Dresller (1991) aupergalactic plane redshift mrvey. We count the number of elliptic& in these ramplea with log,,n, 2 2.5 (20 elliptical). We then impose a dis- tame cut of 6000 km a-l (baed on corrected distancea from column 12 of table 3 from Faber et al. 1989). Thii leaven 14 elliptic&. The sample are fairly complete. For the range in apparent magnitudes of our lint of el- liptic&, the completenew fraction ranges from 100% for BT .Z. 11.6 down to 20% for elliptical, in the routhern aampic with & w 13. If we fold in the completenar fractiona (figure 2 from Faber et al. 1989) the number of 14 elliptic& with log,oo, > 2.5 within a diitance of 6000 km I-’ might be aa high z.a w 23.
We allo atimate the number of observed ellipticala from the above nanplea with 4, 2 350kms-1. Tti allows us to study very high valuea of n,, for which the completeneu fractions are much higher. Within 6000kms-’ there are only three known g&.xiea with op 2 350kms-‘: SPS 1120 (u, = 382kms-‘; & = 12.68), NGC 507 (0, = 366kmn-‘; & = 11.63) and NGC 4486 (M87; o, = 361kmC’; ET = 9.52). The completencu fraction (hwd on a) for SPS 1120 iB w 30% and the completenan fraction for the other two objects L 100%. Tbia tightly constraina the num- her of observed elliptic& with LT. 1 350 kma-’ within 6OOOkmc’ to 5.
To demon&rate the inaccurscio at the high mam end auociated with methoda presented in 5 3, we compare the above complete eatimatea with the u~le of the Faber- Jackson relationship (equation (3.7)) using 01 (tint of equations (3.1)) and the Schechtcr function dacribed in 5 3. Again, we. weight the Schecbter function by 30%; i.e. we only estimate the elliptical contributions. We find in e. spherical volume of radiru 120 Mpc comoving: 39 object0 with 01 2 316kmr-’ and 11 objecta with ~1 > 350 kmms-‘. These numben sre about r, factor of 2 luger than the atimata given above, suggesting that our auumed Faber-Jackson relation underatimatu the luminosity and/or that elliptic& make up lnu than 30% of bright galaxies. (We combine elliptic& and leoticu- lam in getting the population fraction of 30%, but lentic- ulam arc underrepresented among the most maarive gal- axics.) In my case, theac reault# sugg&s that we have overestimated the observed N(V&) in Figs. 13 through 16 for Kim 1. 500 km a-‘, making the diigreement with the simulatioru even none.
To make a better comparison of the simulationa with obaervationa, we e&mate the number of simulated h&o from four Gmulations with U? >- 316 km 8-l and o. 2 350 km 8-l. The results are ahown in Table 4 for aimul~ tions with a variety of force resolution and mm resolu- tion. All numbem are scaled to a (51.2 M~c)~ comoving volume. The observationa are shown aa OBS. I (without completencsr frsctioru folded in) and aa OBS. II (with
completenew fractionr folded in). All rimulationr use a 51.2 Mpc box except for CDMl6 which usa a 100 Mpc box. The initial conditions for CDMB, CDMl, and CDMl2 are all generated from the same set of 2563 ran- dom numbers. The initial conditiona for CDM2-5 and CDM16 are all generated from different neta of random numbers. We also show averagea, with lo fluctuations, computed from CDMl-5.
We e&mate the velocity dispersiona from the Gnu- lated halo8 in two wayr: o. and Z which we describe he- low. We compute the radial velocity diipersion, second of equations (3.1), within a radius lilted in the footnota of Table 4. We count the number of h&x with o- ex- ceeding 316 kma-’ and 350kmr-‘. We also try using 01 (not shown), lint of equations (3.1), and the resulta are similar to the resultr using oI (the differenca arise from the fact that ~1 is typically * 20% lower than o, aa mentioned earlier).
The high velocity diaperaiona of the dark matter may not correspond to the velocity dispersiona of the opti- cal galaria expected to be embedded well within the cut-off radii ured here. Aa (L crude e&mate of the central velocity diipernion of a galaxy expected to be embedded in the aim&ted halo, we w the follow- ing: 2 I 361 kmn-’ x V,,(R)/600 kmc’. We chose thii because the central velocity dirpenion of hi87 L 361 ima-’ from Faber et al. (1989) and the atimsted circular velocity profile for MB7 (from Tti 1992;.see Fig. 19) is about 600 kma-’ for R .?. 100 kpc. Admit tedly thii is a crude estimate, but it is a,Gmplc attempt to UK a mingle, welbmeaaured object to e.cale the aim- ulated data, and it nervea as a conservative check for our compariaonr with observbtions. (Note, in thin case equation (3.8) work fairly well for F = 1.1. However, it may not work well for all objects.)
In Table 4 we compare the results from the sin&a- tions with the observations. The meat important con- cl&on L that all casea for ~8 L 0.4 yield far more hdol than the observed numbers. The epoch 08 = 0.3 in not ruled out since it is difficult to make conclusions based on nero or one halo. The results at cr,~ = 0.4 indicate that there are too many halos with o, 2 316kmB-‘. The problem is lau severe (yet not an order of magni- tude diierent from G) using 2, but the obaervationa tell u that evera a single halo with o, > 350 km s-l in a 51.2 Mpc box ia too high by at leart a factor of 10.
White et al. (1987), at as = 0.4 using the name normaliastion of the CDM power spectrum an we do, found a single halo with a circular velocity uceediig 800 kma-’ in a 50 Mpc box from three #imulstions, corresponding to 0.36 h&a for a single 51.2 Mpc sim- ulation. Our CDM12 simulation bar nearly identical force and maru resolution. Our largest heJo in CDMl2 at 08 = 0.4 he.a a circular velocity of 567 km 8-I defined at 100 kpc comoving. We cannot safely rule out

20 Gdb & Bertschinger
Table 4 Number of Mae&e El&x Scaled to 51.2 Mpc Box
SAMPLF 08 o,b > 316kma-’ Z ‘I’ 1316 kms-’ 0, 2 350 kms-’ Z >_ 350 kmms-’
OBS. Id 0.26 (14) 0.056 (3) OBS. II* 0.43 L23) 0.093 151
CDMl2 0.3 1 0 1 0
CDM12 0.4 6 1 4 1
CDMB 0.5 12 5 9 3 CDMl2 0.5 12 2 7 2 CDMl 0.5 5 4 4 2
(CDMI - 5)’ 0.5 5.8f1.5 4.0&1.2 3.4Lto.9 1.6i0.6 CDM16 0.5 11.0 3.0 6.7 1.7
CDMB 0.7 20 11 13 6 CDMlZ 0.7 20 7 13 3 CDMl 0.7 7 6 4 5
(CDMl - 5) 0.7 10.4Lt3.4 6.Oi2.0 6.4rt1.8 4.6fl.l CDM16 0.7 16.6 10.5 12.0 5.9
CDM6 1.0 39 26 33 19 CDMl2 1.0 26 19 23 15 CDMl 1.0 16 15 11 11
(CDMl - 5) 1.0 13.6zt2.3 15.Ok2.1 11.2i2.2 11.2ZtO.E CDMl6 1.0 20.7 17.7 16.0 13.2
Y!omoving radial cutoff, R, used to compute dhpenions: 300 kpc for CDMB, 100 kpc for CDM12, 300 kpc for CDMI-5, and 150 kpc for CDM16. %adial l-dimensional velocity diaper&n, e,, wcond of equations (3.1). cEstimate of cr, from V.i-: Z E 361 kms-’ x V.i,(R)/600kma-1. dObscrvationaI estimate u&hat completenew fractions. Numben in parentheaa are for 6000 kms-’ sphere. *Observational ntimate un’ihcompletenau fractiona. Numben in parentheses are for 6000 Irma-’ sphere. ‘Average from five simulations with la enon.
u8 = 0.4 particularly since result8 uing Z only reveal one very mauive halo. The problem becoma rapidly worse for larger 08; 08 .?, 0.7 predicts more than 20 timea too many galaria with o, > 350 km 8-l. Thii ia a #were problem for Cl = 1 CDM &nce~atimatcl of o8 bawd on ciutering typically require 08 .?, 0.4 (Davis et al. 1965; Park 1990; Couchman k Carlberg 199?).
We now compare the different simulations with each other. We m the general trend, in Table 4, that both an incruw in maas resolution and an increase in force reac- lution increase the production of massive haloa. For the simulations u&g equivalent initial conditions (CDMB, CDM12, and CDMl) we examine corresponding massive b&s. The higher force resolution simulationa produce more compact haloa than the lower force resolution sim- ulationa; the cut-off radius is chosen to compensate for thin fact for reasona dincussed earlier. In ~0me caws, however, the cutoff mdiw does not compcnnate for the compactnew of the high force rcwlution halos. We alaa
find that the high force resolution halos have higher cen- tral velocity dispersions.
An increase in mass resolution also increasea the pr& duction of massive halos. The effect is strongest at or = 1.0 where the numbem from the 256J particle sim- ulation are far higher than the other simulations com- pared with earlier epochs. We observe that the results from the 100 Mpc bar simulation CD&f16 with good mlur and force resolution are in rewnsblc agreement with the other simulations except at 01 = 1. We alno observe that the 126’ particle, RI/a = 260 kpc comoving PM simulations produce the smallest number of massive h&a--these simulationa rank low in the combination of force and mam resolution and R = 300 kpc comoving in too close to R+ = 260 kpc comoving.
We conclude that the fl = 1 CDM model is in e rious trouble. The aimulationa produce far too many ma&w halos and an increase in force and muu reso- lution only make matten none. We are able to rule

Cold Dark Matter I 21
70 kms-’ using the P3M &n&tions. Halos from thC PM simulation CDM1(1283,51.2,280)
with 5 particle8 and a cut-off radius of 300 kpc comov- ing have a circular velocity of 18 km s-It and haloa from the PM simulation CDM6(256’,51.2,190) with 25 par- ticlea and a cut-off radius of 300 kpc comoving have a circular velocity of 14 kmg-‘. However, these PM aimu- lationr have poor force ruolution. We ahow that higher force resolution increasea the number of low mau ha- loa. Therefore it ia mirleading to compare the number of low macu halor with the observation8 using the PM simulstions.
Another problem rtems from the fact that we need to use large cut-off radii to characterize the circular veloci- ties in the PM simulations. In order for a galaxy to on- dergo “complete collape” in (L spherical, G = 1 model, it har to have an over-demity exceeding 6, = 6p/p * 170 (Gun & Gott 1972; BBKS). A rimple calculation shows that this placer a lower limit on the circular velocity for a given cut-off radivl R. The circular velocity within R for LL density p ia simply
out all normalisations of the primeval density fluctus- tiona with oa 2 0.5. Using complete cataloga of nearby bright elliptic&, we have conutrained the CDM model more convincingly than by using the luminosity function at the bright end (cf. Fig. 15 and henk et al. 1988). The case against oI = 0.4 ig not LU strong aa the case againat 01 2 0.5. We found, at the very leant, a single halo with an estimated central velocity dip&on er- ceeding 350 kma-’ in (L single 51.2 Mpc box simulation. The observatiorm predict that we should only find one such object in no fewer than 11 simulations.
We know that the simulationa ruffer from the over- merging of massive h&a. Gas dynamical diuipation could reduce the merging of galaxies. The result might be to prevent the formation of ercesaively massive gal- axies, although we consider this unlikely because dir& pation should only increase the central concentration of maw in the molt mauive halos, thereby incrcaaing fur- ther the central velocity diiperaiom. Alm, if the moat msruive halw actually should represent clustem of gal- axis, then these cluaten mrut still have the correct mul- tiplicity function (distribution of richnan). We consider thin latter iuue in detail in Psper II.
4.5. Low Mlws Edor
we now e xamine the low maaa halos. We found ear- lier that the PJM rimulations produce too many he.. 108 with Vh 2 150kma-’ (see Fig. 15). Frenk et al. (1988) argue that the number of halo8 in in reeaon- able agreement with the observations down to about 60kma-’ using 32000 Particle P3M nimulationa in 14 Mpc boxes. However, they warned the ruder that aimulatiolu in larger volumea predict too many haloa (White et al. 1987). The particle mm in the Frenk et al. simulatiolu is 5.8 x 1O’M~ and the force resolu- tion in c = 14 kpc. We have two P3M aimulationa with lower mau and force resolution that are computed in a 51.2 Mpc box and a 100 Mpc box giving us better statintiu: CDM12(643,51.2,52; m, = 3.5 x lO’o&,; c = 40 kpc comoving) and CDMl~(144J,100,85; - = 2.3 x 101’Mg; c = 65 kpc comoving). Using these rim- ulstiona, we explore the &ectn of resolution and we rc examine the okcrvational data at the low mau end in order to explore the apparent excaa number of low mau hala corn+ with the observstiom.
The smallest galaxies for which there are reliable mau estimates have Vd, down to about 50 kms-’ (gee Ke rmendy 1991 and referencea therein). Haloa from the 40 kpc comoving Plummer simulation CDMl2 with (L cut-off radius of 100 kpc comoving (roughly twice the Plummer timing) and 5 particlea have a circular ve- locity of 87kms-‘. Halos from the 65 kpc comoving Plummcr simulation CDMl6 with a cut-off radiur of 150 kpc comoving and 5 particlea have a circular velocity of 70 km I-‘. Therefore, we can only mtudy halru down to
V&(R) = ( G$..Rlp)l’a . (4.1)
If we demand that the over-density exceed 6, = p/pchc - 1, where pcrit is the density for an n = 1 universe given by 3H$/(8*G), we get the minimum allowed circular velocity:
(4.2)
For 6, = 200 (close to the critical value, chosen to yield a simple formula), Ho = 50kms-’ Mpc-‘, and a co- moving cut-off radius R measured in kpc, we arrive at the aimple formula for the minimum allowed circular ve- locity in kmr-‘:
km.-‘. (4.3)
Eq. (4.3) putm a severe limit, V& 3.150 km a-l, on the PM simulationa that require R = 300 kpc comoving. For the P3M aimulationa that require R = 100 kpc comoving and 150 kpc comoving, the restrictiona are 50kma-* and 75 km 6-l respectively.
Before exploring the aimulatiom, we need to examine the observational parametcn used for the Tully-Fisher relationship and the Schechter luminosity function (lee 0 3) for faint galaxies. Since we have already shown that the simulationa appear to produce too many balm at the low maan end, we conservatively choose parameters that produce the largest number of low mau halo6 al- lowed within the uncertaintia of the obnervationa. (We find that there are atill too many haloa predicted by the

22 Gelb & Bertschiuger
CDM model so we are not forcing the observation8 to agree with the model-we are simply estimating how eigaificant is the discrepancy.) In the following diczub aioa we cc-scale all relevant numbcn to a Hubble con- stant Ho = 50 kmmr-’ Mpc-‘.
Fimt we conaider the Tully-Fisher relationship in equation (3.6). Pierce k Tully (1988) reported that the Matter in tbii relationship ir ztO.25 magnitudes. In their fita (figure 9 from their paper), they found that the f&tat galaxy studied, b& CJ -16 + 5 log,,(50/85) a -17.2, ia slightly brighter than predicted by their bat fit. Alternatively, if one mea~urra the circular veloc- ity of tbii faint galaxy, the Pierce & Tully relationship would predict that the galaxy ia fainter than it actu- ally i. Since the luminosity function ia an increasing function of decreasing luminosity, one would overeati- mate the number of faint galaxies. We take an extreme point of view. We will use equation (3.6) aa is with on added value of 0.5 magnitudes-this ia twice the rc- ported scatter quoted by Pierce k Tully and it resultr in an increw in the estimate for the number of observed h&a as a function of V&.
Next, we consider the luminolity function. The ec timata of Efatathiou, Ellis, k Peterson (1988) for the parameters of the luminosity function are estimated to hold down to about MBI’ = -16 + 5log,,(50/1.00) a -17.5. The luminosity function has been studied by previolu worken down to comparably faint magnitudes (m Felten 1977 for a review). Thii faint limit is ramps- cable to the faint limit of the Tully-Filer relationship. Therefore, we use the parametera of the Scbecbter lumi- naity function given in $ 3 but we use the reported erron to yield the maximum number of faint galax- ies. We aaeume that 100% of the faint g&a are api- de. We-w Q’ = (1.56 + 0.34) Y lo-‘h3 Mpc-’ and &f& = (-19.68-O.lO)-2.5log,, haa with h = l/2 and we UP3 a = -1.07 - 0.05.
These changes in the Tully-Fiiher relationship and the Scbechter luminosity function increase the estimated number of faint hdoa with 50 kmtml-l< V& < 75 kms-1 from 373 to 582 g&xi= in e. (51.2 M~c)~ comoving vol- ume. When we lhow the number of observed low maw halo+ we use both the parametera given in 5 3 aad the extremely atretched pbrbmetcn given in this &e&m.
In Figs. 20 and 21 we sbm the low mau end, 5Okma-’ -< Vh < 200 Irma-l, from the nimuletions. We still use 25 km~-~ wide bina but we r&in the data from50 kmC’ to 75 kma-‘, 75 kma-‘to 100 kms-‘, etc. The obaervationa using the parameters described in 5 3 with P = 1 are ahown aa solid squares. The ‘maxi- mum” number of faint halos allowed by the observations minus the default valuea is used for the zt error bars (the asymmetry in becauae we UIC logaritbmrr on the vertical axea; note these are not 1~ error bars).
The figurea liit the varioru &ml&on parameten and
the choicea of R. The simulations are ahown down to circular velocities such that the binn arc complete given the rnw resolution limit. These restrictions exceed thr reatrictiona bared on the over-density argument, equa- tion (4.3), for the P’M simulationa. The PM aim”- lationa are restricted by the over-density argument to Vcirc ?, 150 kms-‘. The PM simulations produce fewer low mam halon than the P’M simulations. This must not be t&en to mean better agreement; irutead it is an example of how poor force resolution can give mislead- ing results.
The raulta for the c = 40 kpc comoving Plum- mcr simulation, CDM12, and the c = 65 kpc comov- ing Plummer simulation, CDM16, are in reasonable agreement with each other above 100 kmr-‘. CDMl6 haa alightly more power on small scales, AN,~~~,~ = 2*lkri,puist = 2 x (100 Mpc/144), than does CDM12, XN,+~ = 2 x (51.2 Mpc/64). We learned from the CMF Itudiea (5 2.3) that small-scale wave affect the low mau end.
In Fig. 21 we show resulta from CDMl2 for R = 100 kpc comoving and 150 kpc comoving at 0, = 0.3, 0.4, 0.5, 0.7, and 1.0. We gee that the rwultn are not very sensitive to R. In all awes, there are still too many haloa particularly below 125 km 0-l and definitely below 100 kmms-‘. We rce that the number of low maan haloa, unlike the high mass h&a, decreasea with increasing upanaion factor (both effecta are due to merging).
We now compare a few numben at 08 = 0.4 and ma = 1.0 from CDMl2 (with R = 150 kpc comov- ing) for the rangea 75 Irma-’ 5 V.i.. < 100 kma-’ and 100 km.-’ 5 Vci.. < 125 km s-l. The numbers in these bina from the simulation are 1087 and 495 respectively for 08 = 0.4 and 724 ad 333 rapectively for na = 1.0. Using the observational paremeten from 5 3 we find 240 and 168 respectively. Using the extreme observational parameters discussed in this section boats the numbers to 360 and 247 respectively. Therefore, the exccsa num- ber of halos below V.ir. w 125 km 6-l ia significant. The simulationa produce facton - 2 - 3 too many faint ha- loa. An 8 final check, we use the parametera dacribcd in this s&ion but we try cx = -1.25 which boosta the number for 75 kma-’ 5 Vci.. < 100 kma-’ to 553-- rtill short of the 724 to 1087 found in the simulation.
We conclude that the fl = 1 CDM model producea too many low masl halos compared with the obaerva- tiolu for Vd% 5 125 Irma-‘. We have compared the numben from a 40 kpc comoving Plummer simulstion with the largest estimates allowed by the observations and the discrepancy is still large (about a factor of 2). Increased force resolution and increased small-scale power in the initial conditiona make the digreement wane. Although there disparities are large, Dekel k Silk (1986) argued that supernovae in dwarf galaxies can cause significant gas lo=, and therefore dim the gal-

Cold Dark Matter I 23
implied in the Pre8&chechter theory. 2. Simulsted halos generally have mac.a distributiona
characterized by flat rotation curvea extending from about two softening radii to 500 kpc comoving or more. The most mauivc balon have shallower den&y profila, multing in riling rotation curves. The independence of circular velocity with radiu for moat haloa allow, u to compare simulated haloa at radii of 150-200 kpc cornov- ing (in the PM dmulstiona) with real spirala et 10 kpc comoving or less.
3. The distribution of circular velocitin of simulated haloa was compared with observations. We noted above the good agrement for 150 kma-’ .$ Vci, ,$, 350km~-’ for any of the three normaliistiona 01 = 0.5, 0.7, and 1.0. In the analy8ia, for ihti range in circular velocifiu, we found the following: (a) The agreement with the ob- servationn is bat for the P’M simulationa and in not very sensitive to tiulatiolu with a Plummer softening of 40 kpc comoving venue 65 kpc comoving. (b) The reauh from DENMAX agree better with FOF(I=0.2) than with FOF(IzO.1). (c) The diitribution of circu- lar velocities, unlike the CMF, ir not ve+ aengitive to the DENMAX grid, but higher resolution grida are rc- quired to pick out nubstructure in the P’M aimulstiorm (d) The number of haloa characterized by their circu- lar velocities (using a ii&, physical radius) indicates, if 08 = 1 ir the present epoch, that the galaxy maw function t&a on ita present shape by z m 3.7. Betwean thh epoch and I = 0, merging reduca the number of hala by about a factor of 3.7. Merging is predicted to continue into the future.
4. We conclude from the atudia of mauive halo. that the 57 = 1 CDM model im in trouble if these sy~ tema represent individual galaxy halos. We are able to rule out normalizationa of the primeval denrity fluctua- tions with 08 3. 0.4 based on the number of mauive ha- Ion if the halos represent individual galaxies, although the lower limit for o8 ia uncertain. We compared’the aimulationa not only with the observed luminosity func- tion, but also with complete arnplcl of bright nearby elliptic&. These observations constrain the model to 08 Is 0.5. We cannot rule out CDM based on the most mauive halo-we do not find any halos at any epochs with m- exceeding the inferred maea of the central CD galaxy in A2029. If the massive haloo represent unre- wived clrukn, with the central galaxy having a smaller central velocity dispersion than the surrounding halo, we may relax these constraints. We consider thin porai- hility further in Paper II.
5. We conclude from the low maan studia that the S-l = 1 CDM model produces too many low maan haloa (by radon w 2 - 3) compared with the obaervatioru for Kim a < 125 km*-‘. The number of faint halon decreases with increwing QS because of merging. Nevertheless, the excw i significant even at 08 = 1 using extreme
aria with amall Vk. Perhap the Tully-Fisher relation breaka down at such unall V& (though there ia little in- dication of this in the data of Pierce k Tully 1968). For these reeaona, though, we consider the excemivt number of low mau halor in the CDM model to be leu seriou than the excessive number of high mana haloa.
5. CONCLUSIONS
A promising result for the CDM model in that the die tribution of hdol an e. function of circular velocity agrees rather well with the observations for circular velocities in the range 150 km I-’ to 350 km 6-l. The agreement is better over thin range for the P’M simulations ver- soa the lower force resolution PM aimulationa and the agreement in not very nenritive to a Plummer wftening of 40 kpc comoving veraus 85 kpc comoving over thii range. However, we found aerioun problerm outBide of this range and the problerne are made worm by increas ing the force resolution and the mza resolution. Al- though CDMlB in not the higheat resolution simulation, it is computed in a 100 Mpc box; we will discover in Pa- per II thst 51.2 Mpc boxa are too amall to accurately study clustering. On the other hand, the propertia of individual halos are not very sensitive to the differences between a 51.2 Mpc box and a 100 Mpc box-thii for- tunate fact allowed u1 to w many of the 51.2 Mpc box simulationa to explore effecta ariaiig from varying msu and force rwolution and from different metho& for identifying haloa.
We now mmmarire the chief conclusion. found in the preceding aeetionr.
1. We studied the cumulative meas fraction CMF (M), the fraction of all the maso in haloa more ms, aive than M. We found the following: (a) We need to compare the CMF from 8imulationa analyzed with the same effective DENMAX resolution-lower resolu- tion gxidr include more peripheral particles, increuing the total maua of the haloa; (h) The simulation-to- simulation scatter ia mx.ll except for the mat msuive halos; (c) Higher mzua resolution and higher force r- l&ion en& incrw the CMF independently. The effect of increaed III(YI resolution on the CMF .rn reduced if we impose a dirtace cut from the deluity peaks of the he- los, and compa&xu of simulationa with 64s, 12ga, and 256’ particlea indicate that the convergence of the CMF with such a cut is plausible. (d) Small-scale waves in the initial conditiona have a very #mall effect on the CMF except for the amalleat haloB; (e) Long wava (with wave- length exceeding 51.2 Mpc comoving) in the initial con- ditions do not &ect the CMF for amplitude 08 5 0.5; and (f) The PracSchechter theory with 6. = 1.68 pre- diets too many mauive h&a and a more rapid growth of the CMF than found in the simulations. Sub&rue- ture within halol ia apparently not craned au rapidly aa

24 Gdb & Bertschiuger
auumption~ about the observational uncertainties. We do not find reasonable agreement down to -- 60 kma-’ M reported hy Frenk et al. (1966). Caa lou in dwarf gala&a (Dekel k silk 1966), however, might dim II sig- nitkant number of dwarf galaria, making this problem leu critical for CDM than the high III* problem.
ACKNOWLEDGEMENTS
This raearch was conducted using the Cornell Na- tional Supercomputer Facility, a resource of the Center for Theory and Simulation in Science and Engin-ring at Cornell University, which receives major funding from the National Science Foundation and IBM Corporation, with additional aupport from New York State and mern- ben of its Corporate Research Institute. We appreciate the IBM 3090 programming assistance of CNSF consul- tant Paul S&wars. We thank John Thai for providing hi atimskd mbu profile for ME7 in advance of publi- cation. We thank Paul Schechter for useful suggeationa. Thii work wu aupported by NSF grant ASTBO-01762 and in part by the DOE and NASA at Fermilab through grant NAGW-2361.

REFERENCES;
Bardeen, J. M., Bond, I. R., K&r, N., k Ssalay, A. S. 1986, ApJ, 300, 15 (BBKS)
Bertachinger, E. 1991, After the First Thra Minutes, cd. S. Holt, V. Triible, k C. Bennett (New York: American Institute of Physics), 297
Bertscbinger, E. k Gelb, J. M. 1991, Computera in Physics, 5, 164
Blumenthal, G. R., Faber, S. M., Flares, FL., & Primack J. Il. 1986, ApJ, 301, 27
Bond, I. R., Cole, S., Ehtathiou, G. k Kaiwr, N. 1991, ApJ, 379, 440
Btainerd, T. G. k Villurrueo, J. V. 1992, ApJ, 394,409 Broadhunt, T. J., Ellis, R. S., & Shanks, T. 1988,
MNRAS, 235, 827 Carlberg, R. G. 1992, preprint Carlberg, R. G. k Couchman, 8. M. P. 1989, ApJ,
340,47 Carlberg, R. G., Couchmen. H. M. P., k Thomas, P.
1990, Apl, 352, L29 Cen, R. Y. k Ostriker, J. P. 1992, ApJ, 393, 22 Couchman, 8. M. P. 1991, ApJ, 368, L23 Couchman, H. M. P. k Carlberg, R. G. 1992, ApJ, 389,
453 Conic, L. L., Song&+ A., k Hu, E. M. 1991, Nature,
354,460 D&n, M., Efstathiou, G., Frenk, C. S., k White,
S. D. M. 1985, Apl, 292, 371 Dekel, A. k Silk, J. 1986, ApJ, 303, 39 Drealer, A. 1979, ApJ, 231,659 Dresller, A. 1980, ApJ, 236, 351 Dreaaler, A. 1991, ApJS, 75, 241 Dubinrki, J. k Carlberg, R. G. 1991, ApJ, 378, 496 Efstathiou, G., ElIin, R. S., k Peterson, B. A. 1988,
MNRAS, 232, 431 EfUtathiou, G., Frenk, C. S., White, S. D. M., k Davis,
M. 1988, MNRAS, 194, 503 Efstatbiou, G., Bernstein, G., Katr, N., k Guhathakurta,
P. 1991, ApJ, L47 Evrard, A. E., S-en, F. J., k Davis, M. 1992,
preprint Faber, S. M. k Jackson, R E. 1976, ApJ, 204, ~668 Faber, S. M., Wegner, G., Bumtein, D.; Davies, R. L.,
Drawler, A., Lynden-Bell, D., k Terlevich, R. J. 1989, ApJS, 69, 763
Fabricant, D. k Gorerutein, P. 1983, ApJ, 267, 535 Felten, J. E., 1977, AJ, 82, 861 Franx, M., Illingwortb, G., k Beckman, T. 1989, ApJ,
344,613 Frenk, S. F, White, S. D. M., Davis, M., & Efstatbiou,
G. 1988, ApJ, 327, 507 Fukogita, M., Takahara, F., Yamashits, K., k Yoshii,
Y. 1990, ApJ, 361, Ll Gelb, J. M. 1992, M.I.T. Ph.D. thmia Gelb, J. hf. k Bertschinger, E. 1992, preprint (Paper II)
Cold Dark Matter Z 25
Guiderdoni, B. k Rocc~Volmerange, B. 1990, AA, 227, 362
Gun, 1. E. k Gott., J. R. 1972, ApJ, 176, 1 Hackney, R. W. k Emtwood, I. W. 1982, Computer
Simulation Using Particlea (New York: McGraw- Hill)
Hoffman, Y. k Shaham, J. 1985, ApJ, 297,16 Holtrman, J. A. 1989, ApJS, 71, 1 Kats, N., Heroquint, L., k Weinberg, D. H. 1992, ApJ,
399, LlO9 Katr, N. k White, S. D. M. 1993, ApJ, 000, 000 Kauffmann, G. k White, S. D. M. 1992, preprint Kormendy, J. 1990, Evolution of the Univeme of
G&x&s, (Astronomical Society of the Pa&c: California), 33
KundiC, T. 1991, M.I.T. S.B. thaia Little, B., Weinberg, D. H., k Park, C. 1991, MNRAS,
253, 295 Melott, A. L. 1990, Phya. Rep., 193, 1 Mould, J. R., Oke, J. B., De Zeeuw, P. T. k Nemec,
J. M. 1990, AJ, 99;1823 Park, C. 1990, MNRAS, 242, 59 Pierce, M. J. k Tully, B. 1988, ApJ, 330, 579 Postman, M. k Geller, M. J. 1984, ApJ, 281,95 Pras, W. H. k Scbechter, P. 1974, ApJ, 187; 425 Rubii, V. C., Bunt&, D., Ford, W. K., k Thonnard,
N. 1985, ApJ, 289,81 Sargent, W. L. W., Young, P. J., Bokaenberg, A.,
Shortridge, K., Lyndn, C. R., k Hartwick, F. D. A. 1978, ApJ, 221,731
Scbechter, P. L. 1976, ApJ, 203, 297 Toth, G. k Ostriker, J. P. 1992, ApJ, 389, 5 Taai, J. C. 1992, M.I.T. Ph.D. theain ‘Folly, R. B. k Fisher, J. R. 1977, AA, 54,661 Tully, R. B. k Fouque, P. 1985, ApJS, 58, 67 Tyron, J:A. 1988, AJ, 96, 1 bon, J. M., Boughn, S. P., k Kuhn J. R., ApT, 369,46 Warren, M. S., Zurek, W. H., Quinn, P. J., k S&non,
J. K. 1991, After.the First Three Minutes, cd. S. Holt, V. Trimblc, k C. Bennett (New York: American Institute of Physics), 216
White, S. D. M., Davis, M., Efatathiou, G., dc Freak, C. S. 1987, Nature, 330, 451
White, S. D. M. & Rees, M. 1978, MNRAS, 183,341 White, S. D. M. k &resin, C. L. 1988, ApJ, 335, 688 Zel’dovich, Ya. B. 1970, AA, 5, 84
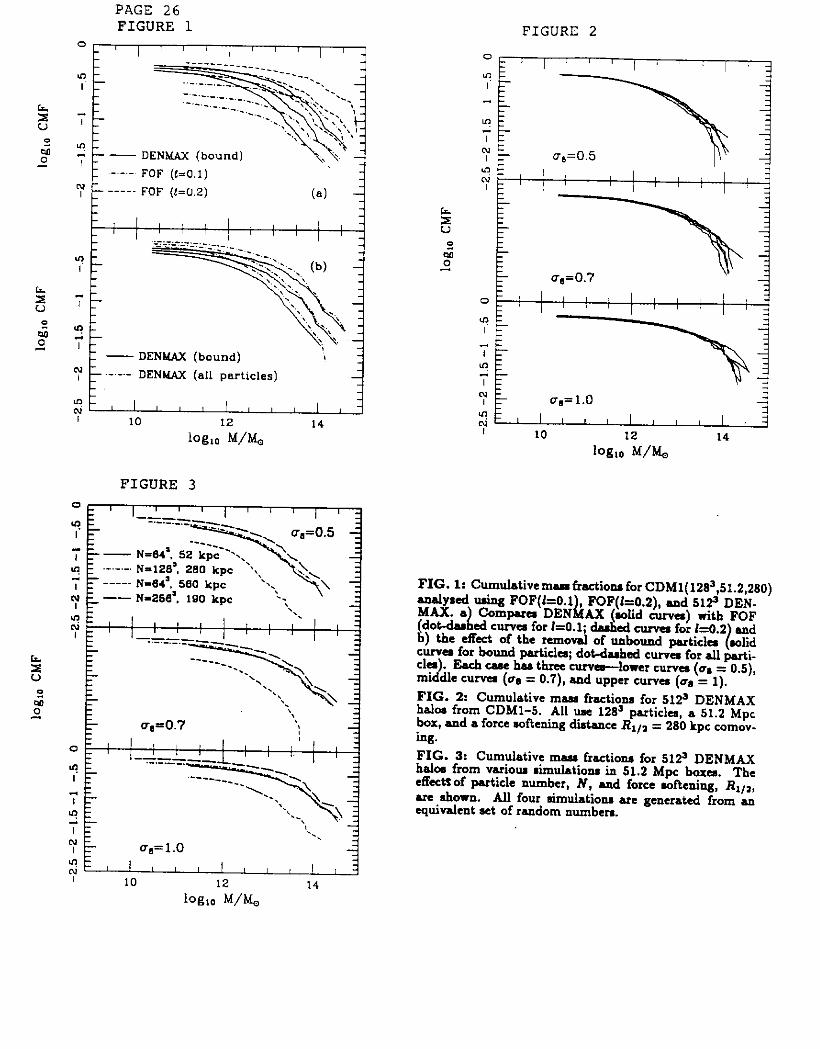
PAGE 26 FIGURE 1
- DENMAX (bound)
.-.-.- DENMAX (all particles)
FIGURE 3
I ------ j -~.-~~.-*~ ‘1
u,3=0.7 \\ ------
; L I .i.-.-j-.*
-1
L ------ I .-.-‘W1
--\ LT,=l.O I, I I I,, , I , I, I I I,, , I ,
10 10 12 12 14 14
FIGURE 2
0 0 I 1 / I I
In
-Y ”
i il-J+yi,i
-i
Y u,=o.5
; 2 _1
8
D ;
g>j
; lay
LTm= 1.0 I I I I I I,, I
I I 10 10 12 12 14 14
FIG. 1: Cumulative man fractiona for CDM1(1285,5X.2,280) andyred using FOF(kO.1 MAX. a
b i!i
FOF(kO.2), and SW DEN-
(dot&a Canpua DEN AX (acdid c-) with FOF
cd curva for kO.1; da&d curvea for b) the &ct of the removal of unbound particla CLUVQ for bound particles; dot-dashed cunw for all parti- cly). EachuK~thmcurva--lonerc-(u,=o.5), mr dle curva (co = O.?‘), and upper curves (oa = 1). FIG. 2: Cumulative masl fraction for 512’ DENMAX halos from CDMl-5. All uac 126 particles, a 51.2 Mpc box, and a force softening distance Rlll = 280 kpc comov- ing. FIG. 3: Cumulative mau fractiom for 512’ DENMAX hala from vr+u. eimulatiolu in 51.2 Mpc borea. The effectSof pa&de number, N, and force a&ening, R1,a, are shown. All four nimulationn arc generated from an equivalent set of random numben.

PAGE 27
FIGURE 4
iit.~
, 10 12 14
h&a M/MO FIGURE 6
FIGURE 5 0
7
-i ro -i “: y
a.=0.7
Q
”
7 yl -i
“: o,=l.O “7 c-4 I > I I 11 11 1) I 10 12 14
FIG. 4: Cumulative mua fractiona at ~8 = 0.5 for DENMAX haloa tram CDM12(643,51.2,52) using a 5123 grid (solid curve), and lower resolution DENMAX grids: 256’ grid (short-dashed curve); 12a3 grid (long-dashed curve); and 643 grid (dot-darbcd curve).
FIG. 5: Cumulative m&u fractiona for 5123 DENMAX bdol from two simulationa in bigger boxes: CDMll(1283,102.4,5( solid curvea) and CDM16(1443,100,85; abort-d-bed curvm). Al=, top panel (us = 0.5) for 25@ DENMAX haloa from CDM12(64’,51.2,52; long-dashed curve).
FIG. 6: Cumulative - fxactiom for 512’ DENMAX haloa from three R,,I = 280 kpc comoving PM simulations in 51.2 Mpc boxes. All three hmulations ue equivalent initial conditions. The dashed cuvo are for 128’ particlebut the initial diiplacements were interpolated from the 64’ particle case (dot-dashed c-).

PAGE 28
FIGURE 8
0 I I I 3 I I 1; I I I
Y --‘.~~~.~~~.--
7 -‘---% -\ (.)
----. N-258’: 180 *pc ‘\ 1 Y ‘i
Y
7 ~~l~r.-\~~i
\\\\I
.---.-. N-1za’: 280 kpc I \\
- N- 64’: 280 E I ‘\ I (
----______ --.+. (b)
2 .-.-.- N-128’: 280 kpc
. . ~ -.\\
0 / *;) I 4.
‘.>. 0 I I I I I I ,I , 1 ;
I ’ Lo
I
Y .-.-.-. N-128’: 280 kpc
- N- 64’; 260 E I I (p, ,{
10 12 log,. M/b& [300 kpc cut]
14
” 7 - PS(top hat. 6,=2)
. CDMlG(FOF 1=0.2)
“: . CDMlZ(FOF 1=0.2)
.-.- PS(gauss.. 6,=2)
l CDMlG(FOF i=O.l)
’ CDMlZ(FOF L=O~l)
” -T - PS(gauss.. &=2)
.CDM12(512’ DENMAX)
Y ” CDM12(512’ DENMAX) bound. &..,=200 kpc
FIG. 7: Cumulative mass fractions for 51p DENMAX halos at ~8 = 0.5 from three PM simulations usin equivalent initial conditions. We include only particles within 300 kpc comoving from the density peak. 7 a Comparea three tiulatioru indicated by particle number N and force softening RI/~. The halos ahoK raw
exceeding the transition mea (1.1 x 10’3M~; vertical bar) have not Results with and without the removal of unbound particlea above
the transition mu: c) Tbe same curvea from Fig. 7a except the 2563 particle, R,ll = 190 kpc comoving aimulstion has been &cd to R1jz = 280 kpc cornwing.
FIG. 8: Cumulative masl fractiona from CDM12(643,51.2,52 and CDM16(144J,100,85) and the Prac 08 = 0.5,0.7, and 1 with the CM d
curvw are PS being larger with incrca&g 4,. a) Dotkd
window function and 6. = 2. Solid circla are CMFs of raw muws for CDM16 cr- are CMFs of raw manna for CDM12 and FOF(I = 0.2
auuian window function with 6. = 2 and the simulations are CM k b) Same ae a)
I of raw m- c) PS is for a gaussian window function with 6, = 2. Solid circles arc CMFs
from CDM12 computed with raw masses using a 512’ grid DENMAX analysis. Crosses are CMFs aho from CDM12 and also computed using a 5123 grid DENMAX analysis-however, only bound particlea within 200 kpc cornwing of the DENMAX peak are used to compute the CMFs.

PAGE 29
FIGURE 9
-- ‘m 500 E ~’ .., -r 400 I: ~:~ G .:,,<: *” 300 ,~,>’ ‘. “0 1 N 200 c
I,;/ !
A ?“” .“” -
100 200 300 400 500 600 a.(100 km) [km 5 '1
100 200 300 400 5oo.,soo V--f100 kpc) [km f ]
FIGURE 10
G h 2 2
1.5
1 ioo 200 300 400~,500 600
"*
100 200 300 400 500 BOO
3 V, [km s-'1
1 ~~~~‘~~~~“~L~’ 100 200 300 400.,500 800
VA. [km s I
FIG. 9: ~1 and V& z (GM/R) ‘Ia from CDM15(1443,100,g5) at ne = 0.7. Each point repreaentr one halo. We show vzuiou comoving cuta. a) ~~(200 kpc) versus ~~(100 kpc). b) V.;,(ZOO kpc) versus V&100 kpc). c) I’.&300 kpc) versus V,;.,(ZOO kpc). FIG. 10: V,,jo, venu~l V.i, (all computed using R = 200 kpc comovinn) from CDM16f1443.100.g51. Solid liia are for %,/ul = &,‘or F = i in equsti& (3.8), F = 1.1 in equation (3.8).
and&shed l&are for l&J,,‘= &j/l.;, dr

PAGE 30
FIGURE 11
;
g
s
R bwl
FIGURZ 12
i
:: 3
:: a 8 c
8 N
R hcl
FIG. 11: Ciicularvelocity profiler for f~12~ DENMAX halafromCDMl2 For each halo we computed V& at 150 kpc comoving: VI,. We then sort ei
643,51.2,52; c = 40 kpc cc-moving). the haloa from large to small V
We ahow the top ten halos and then every twentieth halo thereafter, all the way down to VI,, = 150 km.‘-“!: (This procedure ia done independently at each epoch.) FIG. 12: Cumulative velocity dispersion profiles cl(R) for the same halos shown in Fig. 11.
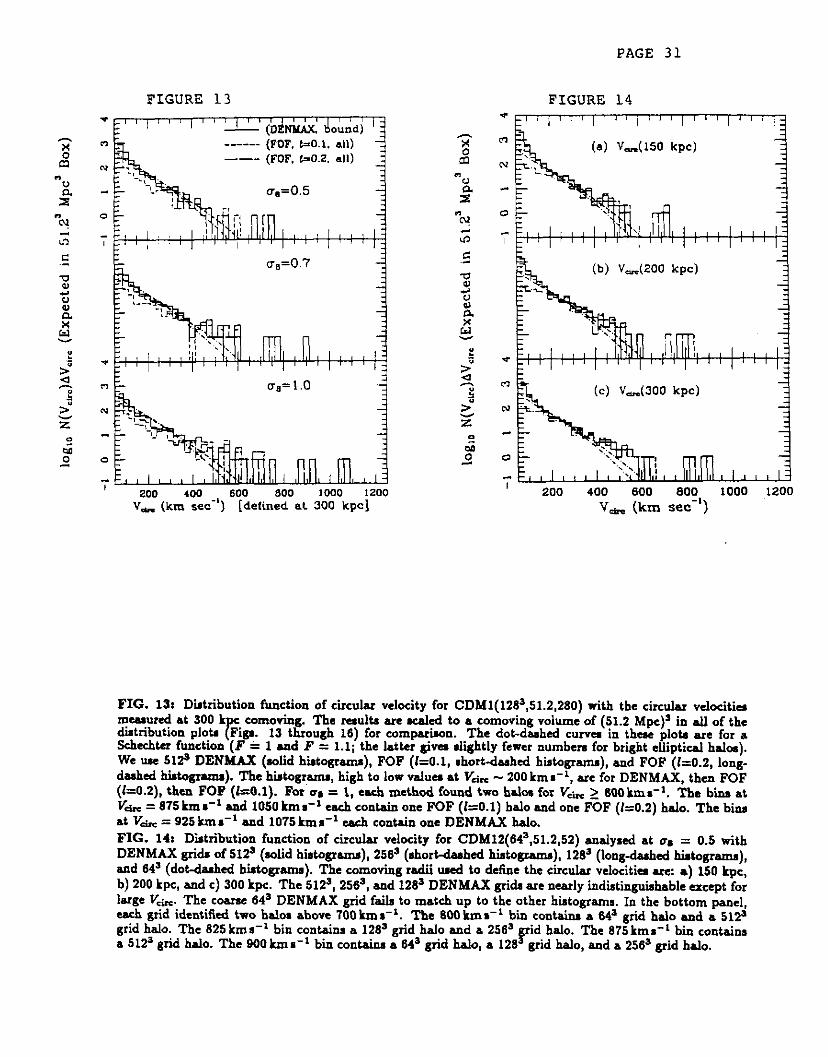
T mo nv E” “-4 zi .c z z i e 1
2” -2 >” SI :!
if
FIGURE 13 T
0 --- (FOF. bO.2. all)
N
N
0
-i 200 400 600 600 1000 ,200 V, (km sece’) [delined at 300 kpc]
-2 s -0 2 a ;; .E
PAGE 31
FIGURE 14 d // ,,, ,I/ /,, I,, ,,/
(a) Ve.m.(lSO kpc)
(b) V-(200 kpc)
Cc) V,(300 kpc)
I 200 400 600 a00 1000 1200 V, (km SC-‘)
FIG. 13: Diitribution function of circular velocity for CDMl(126s,51.2,280) with the circukr velocitia measured at 300 k
F cornwing. The redk are w&d to a cornwing volume of (51.2 Mpc)’ in all of the
distribution plota Rgs. 13 through 16) for comparison. The dot-dashed curvea in thae plota are for a Schechter function (F & 1 and F = 1.1; the htkr giva #lightly fewer numben for bright elliptical halos). We use 5lp DENMAX (solid histograms), FOF (I=O.l, short-dashed histograms), and FOF (1~0.2, long- dashed histograma). The histograms, high to low values at Vk - 200 kms-‘, arc for DENMAX, than FOF (1=0.2), then FOP (I---0.1). For Q, = 1, each method found two halos for y.k 1 BOOkmu’. The bii at Vb = g75km1-’ and 105Okms-’ each conkin one FOF (IzO.1) halo and one FOF (1~0.2) halo. The bins atv&= 925kmK’ and 1075kma-’ each contain one DENMAX halo. FIG. 14: Distribution function of circular velocity for CDMl2(64’,51.2,52) analysed at 0, = 0.5 with DENMAX grids of 5125 (slid hiatograma), 2563 (short-da&cd histogram), 12@ (long-dashed hltograma), and 64’ (dot-dashed bltograrm). The comoving radii wed to define the circular velocities UC: 1) 150 kpc, h) 200 kpc, and c) 300 kpc. The 51Z5, 256’, and 1213~ DENMAX grida are nearly indiitinguiahahle except for large I’&. The coarse 64’ DENMAX grid fails to match up to the other hiitograms. In the bottom panel, each grid identified two haloa above 700 km s-l. The 600 km s-l bii containa a 6qa grid halo and a 512$ grid halo. The 625 km 8-l bin containa a 12E3 grid halo and a 256’
5; rid halo. The 675 kma-l bii containa
a f~l2~ grid halo. The 900 km 8-l bii containa a 64’ grid h&o, a 128 grid halo, and a 256’ grid h&.

PAGE 32 FIGURE 15
! :: 4 o
5 N z 2 - r z 0
‘” T I: I 200 400 “*” 2m 3p P
1000 1200
FIGURE 17
~““““““‘r”ll”“““‘l
FIGURE 16 Y mo v- “Y //‘I II /‘I( jl/( I’2 2
- z=9.9 ___-..-. z=3,7 ---. 2=2.2 -z=1.0 ~-.----z=o,4 ----- z=o,o
FIGURE 18 I r,
FIG. 15s Distribution function of circular velocity for 512’ DENMAX hala from a) CDM12(64s,Sl.2,52) comoving dice to compute Vh for CDMl2 and a
The multi are shorn at 08 = 0.5 (-lid hiatogramr), hiitograms); they overlap except for high Vdx where
FIG. 16: Same M Fig. lSb, except that we use a fixed physical radius of 100 kpc to compute circular velocitia of halos in a (51.2Mp~)~ comoving volume. The epocha are liited in terms of the redshift L = l/o- 1 where we take 00 = OS = 1 to he the present day. Thii plot depicta evolution. FIG. 17: The bound particles of Halo B (see Table 2) from CDM12(643,51.2,,52) at 08 = 0.5 are shown aa found hy the various DENMAX aoalysea. The imagcs are shown m o - y proJectiona in unit. of comoving kpc. The 5123 DENMAX anal 2 R 200 kpc and y a -200 kpc r
IL ir able to resolve the small halo present in the other par& (located at
FIG. 16: The bound partida of Halo B (we Table 3) from CDMl(12B3,51.2,260) at ok = 0.5 found by the 2563 and 512’ DENMAX analyKI and by the FOF(l=O.l) and FOF(L0.2) anslynes. (For FOF we do not yemove the rnbound pa&la. part& simulatmn ahown in Fii. 1
We show every eighth particle to facilitate a comparison with the 64’ 7. There ia not much difference in the two DENMAX analyses (apart
from the peripheral particles) because the PM forces are computed on a 256’ grid. The FOF(I=0.2) analyaia reveals a dramatic ahortcommg of FOF-namely the linkiig together of #everal dynamically distinct halos.

PAGE 33
0 FIGURE 19 ~.,,,,,~,,,I~,,,,,,,,,,,,,
0 IIJIlIIIIIIIIIIJIIIIIIII 0 100 200 300 400
R [kpcl 500
FIGURE 20
*L I I I I I
e I I I I I
m- u,=l.O _______ --- __._-._
N g +y+q+fl --- ___
I I I I I 50 75 100 125 1-y 175 200
V,I, (km set )
FIGURE 21
-2 d $ I I I I I
-” s” m-
(a) R.,=lOO kpc
“@a
z N- .E
3 fTT7 7 ~yzzi
z
1 jf !K!
z o- - I I I I I
g 50 75 'K (E15sec~50
175 20
FIG. 19: The circular velocity profila at c* = 0.5 for haloa B and C (halo B haa. luger V& than halo C) from CDMl(nolid curvea: 12g’,51.2,280; we Table 3) at from CDMlZ(dotkd cm: 1?4’,51.2.52; see Rble 2). We show the pro& for Mg7 M compukd by Tui (199: baaed on analysb of X-ray eminioo (sbor+duhcd curve FIG. 20: Diitributiona of limulakd low man bala from four simdatiom with various comoving cutn R CDMl(12g5,51.2,280, R = 300 kpc; dot-long-dashed hir tograma), CDM6(2583,51.2,190, R = 300 kpc; ahort dashed histogram.), CDM18(144’,100,85, R = 150 kpc; long-dmhed hiitograma), and CDM12(64’,51.2,52, R = 100 kpc; dot~hotiuhcd hiatogruru). We atima the obwrved numbera win 3 (solid aquarea) with pbu 7
parameters pracntcd in S minu error ban (theee are
“extreme” ayntematie errors, not lu error ban). FIG. 21: Diitributioru of &ndated low mau h&a fro CDM12(e43,51.2,52). (The obwwd numben are solid aquus with error bats, sea Pi. 20.) The resulta are shmm for a R =I00 kpc comoving and b) R =150 kpc
. 4 he resulta are ahom at 0, = 0.3 (dotted ii~::i%.), 0.4 (nhort-dashal hiitogams) 0.5 (long- dashed hitograms 0.7 (dot-rhort-da&cd hirtogna,),
-4’ and 1.0 (dot-long ahed hiitegmma).