Embed Size (px)
Citation preview

A Field Guide to Value Chain Studies
for BPTP and BBP2TP Staff
How to develop and use value chain studies for market focused research
June 2009

A Field Guide to Value Chain Studies for BPTP and BBP2TP Staff
2
Contents
Chapter 1 3 Introduction
How to use this guide Getting started
What is a value chain? Why study the value chain? What we can learn from value chain studies?
Chapter 2 First steps: where to begin? Questions to keep in mind The value chain study checklist Next steps: an inventory of market
participants The Proposal Outline Chapter 3 Mapping the chain Thinking about market structure Examples of value chain maps Mapping actors Mapping value Mapping relative costs of processing Mapping information and knowledge
transfer Chapter 4 Interviews and research questions Example questions Chapter 5 Case studies: The World Bank in Kenya Unilever in Indonesia: Kecap Bango Technoserve: bananas, coffee and
cashews Free-Range Chickens in Cambodia Vegetables and Rice in Indonesia Chapter 6 Resource toolkit for next steps User Guidelines

A Field Guide to Value Chain Studies for BPTP and BBP2TP Staff
3
Introduction
This field guide to value chain studies is intended specifically for BPTP and BBP2TP staff. It aims to support a „learning by doing‟ approach for Indonesia‟s province-based Research and Development staff who wish to identify, target and implement high-quality projects with a strong focus on adapting to market opportunities. This initial version of the field guide is shaped by recommendations and experiences from the 5-7 June 2009 Workshop in Mataram attended by 25 BPTP staff. The Workshop revealed an enthusiastic staff with wide-ranging backgrounds and varying levels of experience in doing value chain studies. The field guide is therefore designed for researchers from varying backgrounds with little or no value chain experience. It is a „wiki‟ project that will continue to evolve and improve over time with use and feedback. This draft is prepared by Randy Stringer with assistance from Boga Kuntoro, Luthfi Fatah and Lauren Drewery. The work is funded and supported by the Australian Centre for International Agricultural Research (ACIAR), Smallholder Agribusiness Development Initiative (SADI).
How to use this guide
The guide begins with the basics of value chains, introducing concepts, principles and definitions, and then moves on to the steps involved in conducting a value chain study. Case study examples illustrate why different researchers use value chain studies, how they do their studies and what they learn. For those more experienced researchers already familiar with the value chain basics, a Resource Toolkit section at the end of this guide provides several comprehensive handbooks, toolkits and manuals. These resources present detailed procedures, guiding principles and practical tools for improving your skills in the art and practice of value chain analysis.
Getting started To make effective use this value chain field guide, you need to do the following:
Find a supervisor open to market-oriented study approaches.
Keep asking yourself: if producers make it, who will buy it?
Seek collaborative, value-adding opportunities with businesses along the chain.
Continually remind yourself that it‟s all about what the consumer wants.

A Field Guide to Value Chain Studies for BPTP and BBP2TP Staff
4
What is a value chain? To begin, let‟s keep it simple. Think about a supply chain as all the production, processing, packaging, transporting, marketing and selling activities needed to get a product to the consumer. For our purposes, supply chain thinking is about how to get the product from the producer to the consumer as inexpensively as possible. So we focus on how to reduce production costs, prevent post harvest losses, or avoid wasteful activities. When thinking about how to improve supply chains, we mostly think about ways to reduce costs along the chain. Making the supply chain more efficient is one way to beat your competition and to make more money. On the other hand, value chain thinking is about how to make more money by increasing the value of what you make. It is okay if production costs or processing costs or packaging costs go up – as long as the consumer is willing to pay for it. Adding value is all about making more profit. Using a value chain approach, we are always asking “what does the consumer want?” If the consumer wants GAP-certified kangkung, production costs go up, but so does the price for kangkung. If the consumer wants pesticide-free shallots, yields may drop but the higher prices mean more profit.
The values in value chains are defined in terms of what customers need or want. The values flow from the customer upstream through to the start of the chain.
Why study the value chain?
BPTP staff want to help small producers earn more income and find steady sources of income. An important way to do this is to help producers „increase the value of what they produce and sell’. A value chain study provides useful market-oriented information and insights for business opportunities that are often overlooked by other types of studies. The research team discovers these opportunities as it goes through the process of collecting information about how the chain works, how the chain is evolving over time, and what is causing the chain to evolve.
How about GAP certified kangkung? GLOBALGAP is a private sector body that sets voluntary standards for the certification of agricultural products around the globe. The aim is to establish ONE standard for Good Agricultural Practice (G.A.P.) with different product applications capable of fitting to the whole of global agriculture. The GLOBALGAP certificate covers the process of the certified product from farm inputs like feed or seedlings and all the farming activities until the product leaves the farm. From www.globalgap.org

A Field Guide to Value Chain Studies for BPTP and BBP2TP Staff
5
The value chain study is a diagnostic or investigative tool for the research team to identify new market opportunities and potential higher income projects for BPTP‟s clients: small producers. This approach differs from traditional technical assistance and extension activities that focus on helping farmers increase production. It is often different, too, from helping farmers improve their crop quality or switch varieties or even introduce a new crop. A value chain approach involves studying the entire chain to identify new opportunities for producers, including new employment opportunities. For example, we cannot assume that just because small farmers produce a better quality chilli, consumers will pay more for it. First, we need to find out what kinds of chillies consumers want. What size? What color? What variety? What time of year? We don‟t recommend producing pesticide-free chillies, or to GAP-certify the chillies, or to grade and sort the chillies, until we are certain that the buyers along the entire value chain are willing to pay for those activities, product attributes or new crops. What we can learn from value chain studies
As a diagnostic tool, value chain study can help the BTPT staff:
Understand why value chains are changing.
For example, incomes and urbanization may lead to a rapidly expanding modern food retail sector, like supermarkets.
Understand how supply chains are changing.
For example, supermarkets may want to work with specialized wholesalers and not with traditional wholesale markets.
Identify who leads and governs the value chain.
For example, coffee roasters may want fairtrade certified producers.
Better target policy and technical support.
For example, buyers may want new varieties, but producers can’t find enough certified seeds due to trade barriers.
Identify information gaps. For example, consumers may want a different type or size of potato, but that information is not flowing back through the chain to the producers.
Improve small farmer participation.
Specialized wholesalers may be looking for more suppliers, but don’t understand how to work with large numbers of small producers.

A Field Guide to Value Chain Studies for BPTP and BBP2TP Staff
6

A Field Guide to Value Chain Studies for BPTP and BBP2TP Staff
7
Chapter 2 First steps: where to begin?
A useful way to begin your value chain study is to write a one or two page proposal outlining what you want to study and why. Our experiences suggest that it is always a good idea to work as a team of three or four researchers. And it is highly valuable when one person on the team knows the commodity (as we see later, this establishes credibility with Key Informant interviews).
First up, the team should discuss the purpose of the study, being as specific as
possible. Examples of specific study aims include:
To determine market opportunities for smallholders to produce and sell new crops or different varieties which they have never grown before;
To learn if there are value-adding opportunities for a crop which the farmers have been growing for years;
To discover how and why food processors are expanding in the region;
To understand how modern food retailers are changing the way value chains work;
To find out what the requirements are for selling to expanding modern chains (special variety, size, certification, color).
The overall purpose of almost all the value chain studies by BPTP staff is to improve small producers‟ income – more farm profit and more employment. Defining a specific aim also helps the team determine the best entry point for the study. While a value chain study by definition takes into account the entire chain and all of the buyers and sellers along it, the team must decide which segment (or businesses) to investigate first. In most cases by defining the study‟s specific aim, the best entry point becomes obvious.. Some possible points of entry for a study could be, for example:
a key processor looking to expand its operations;
a farmer group thinking about organic production;
a local firm or small informal home processor (potato chips or sambal, for instance);
traders and collectors supplying specialized wholesale markets;
a certification program like fairtrade, organic or GLOBALGAP;
a local nursery.
Questions to keep in mind: Who are the buyers and consumers? What do they want to pay for? How much are they willing to pay? How can producers take advantage of new opportunities? What can the BBTP study team do to help?
A Field Guide to Value Chain Studies for BPTP and BBP2TP Staff
8
Defining the study‟s specific aims helps us to identify the point of entry along the chain and to focus on some key activities in the chain. In general, a more precisely defined study objective leads to a more useful analysis. Think about these examples: Perhaps a groundnut processor like BMT has moved into the region and is looking for additional growers to supply its expanding operations. Maybe a new fresh vegetable wholesaler specializing in supplying supermarkets needs more garlic, beans and tomatoes. Perhaps a feed mill is considering GAP-certified maize. Or shallot producers are buying imported seeds, allowing an important value-adding opportunity for some producers to specialize in producing and selling shallots for seeds.

A Field Guide to Value Chain Studies for BPTP and BBP2TP Staff
9
The value chain study checklist
Here is a useful checklist from Daniel Roduner‟s 2007 report for the Swiss Agency for Development and Cooperation on how donors can improve value chain development.
Source Roduner 2007.
Next steps: an inventory of market participants
Now that you have defined the specific purpose of your value chain study, it‟s time to make a list of market participants and businesses along the chain. Common types of market participants include:
Farmers – producers of agricultural commodities
Traders and collectors – purchase products from farmers and sell them to wholesalers
Brokers – connect buyers and sellers for commission but don‟t take ownership
Wholesalers – large, small and medium scale, sell to other traders, wet markets, even to supermarkets in some cases
Processor – buy from traders or collectors or brokers and transform the products by sorting, cleaning, grading, chopping, packaging, etc.
Retailers, wet markets, warungs – sell to consumers

A Field Guide to Value Chain Studies for BPTP and BBP2TP Staff
10
While making the inventory, discuss and make notes about each chain participant, asking the research team about the characteristics of each business, including:
Scale of operation (large, medium or small)?
Location (urban or rural)?
Is it traditional or modern?
Is the business informal or formal (are they registered, licensed, or certified)?
What is the nature of their value-added activities: transport, storage, packaging, sorting, processing?
What is the degree of coordination and integration and information sharing with other businesses or stages?
The Value Chain Study Proposal After discussing, identifying and refining the main focus of your study with your colleagues and then seeking commitment and interest from some of the businesses along the value chain, write up a brief study proposal. The proposal only needs to be 3 or 4 pages long, but it‟s important to include the basic information presented above. Here is an example outline: Section I Aims and objectives of this value chain study Secrtion II Why this study is important and who will benefit (key criteria for
selecting this chains) Section III The study plan
what this value chain study includes sources of information time required what will be produced (a report, a workshop, etc.) types of analysis (interviews, surveys)
Section IV the budget, staff time and financial resources

A Field Guide to Value Chain Studies for BPTP and BBP2TP Staff
11
A Field Guide to Value Chain Studies for BPTP and BBP2TP Staff
12
Chapter 3 Mapping the chain It is very helpful to make a picture, or map, of the value chain to see clearly who is adding value and where. In its simplest form, the map shows all the actors in the chain and the flow of the commodity or product between them, from the provision of agricultural inputs to sale of the final product to consumers. Members of the team may have to visit and interview the relevant businesses along the chain: farms, food or feed processing premises, traders, collectors, wholesalers, shops, food retailers, wet markets and restaurants. Depending on accessibility and relevance, the team may also visit providers of inputs and storage along different points on the chain. Again, let‟s keep it simple. A general map that gives everyone a basic overview of the chain can kick-start discussion much sooner and more effectively than a more detailed and complex map. As your information gathering progresses and additional questions arise, you can add more layers to your map, providing richer detail. For example:
The specific activities and processes (ie, what each actor actually does);
The flows of information and knowledge (eg, does information flow up the chain from the retailer and do different segments of the chain share their market knowledge);
The volume of product bought, transformed and sold and at each link;
The relative monetary value of the product at each link;
The number of people employed at each link;
The types of relationships and linkages between the businesses (eg, short term or long term, strong or weak); and
The different support services that feed into the chain. A more comprehensive map might also illustrate the „business environment‟ – infrastructure, policies, institutions and processes – that shape the market system. You may also find it useful to make a geographical map (or use an existing map of the region) to show the location of each actor and the physical trail of the product. The handbooks and manuals listed in the Resource Toolkit section at the end of this guide provide meticulous instructions on how to draw up very complex maps. Thinking about market structure
Among the key variables you need for your map are some basic details and an understanding about market structure. By market structure we mean information like: (i) the number of participants; (ii) the total volume of trade; and

A Field Guide to Value Chain Studies for BPTP and BBP2TP Staff
13
(iii) the level of concentration among participants (ie, do just a handful of businesses or traders or farmers or collectors or food processors account for almost all the production).
A key market structure question to try and answer is: what changes are taking place along or around the chain? Examples of changes to be looking for are new government regulations or new actors (eg wholesaler, processor) entering the chain or emerging Interest in new varieties or organic or differentiated products from collectors or traders. Importance of identifying specific issues: the ‘hooks’ The preliminary map helps the team identify specific issues to be studied. In their report, ‘Mapping the market: participatory market chain development in practice,’ M. Albu and A. Griffith argue that the more specific and tangible the issues are, the more likely they will attract the attention of busy actors in the chain and draw them into the process.
‘It goes without saying that few entrepreneurs, least of all buyers, are attracted by the idea of attending a ‘development project’ meeting – even if it goes with a free lunch. They may suspect the facilitator’s motives e.g. fearing pressure to give their suppliers a better price. … Wary players are more likely to attend if they can see a future commercial benefit. Ideally the ‘offer’ should be achievable and directly relate to specific market-chain issues. Vague and overly ambitious offers such as ‘finding new markets’ are less likely to keep actors engaged’
(Albu and Griffith 2005).
Preliminary mapping of the Kenyan aloe chain in a 2005 study demonstrates how two specific issues were chosen to attract actors‟ interest. The aloe chain begins with thousands of harvesters who extract raw sap from wild plants. They supply a handful of itinerant processors who reduce the sap into a concentrated form called aloe bitters. The bitters are sold to traders in market towns, who in turn supply agents in Mombassa. The bitters are then exported at well below world market prices to South Africa, where it is re-exported to Europe, the Middle East and South Asia. The mapping revealed that:
1. international treaty rules (ie, a ban against trade in wild aloe in Kenya under the Convention on International Trade in Endangered Species of Wild Fauna and Flora, or CITES, because of over-exploitation) and a presidential ban against exports had pushed the aloe trade „underground‟ for many years;
2. harvesters were scattered, disorganised and had misconceptions about
the value and destination of their products, leading to conflicts with actors down the chain;
3. corruption throughout the chain added costs and created power distortions
among the actors;
A Field Guide to Value Chain Studies for BPTP and BBP2TP Staff
14
4. the supply of wild aloe was being depleted in many areas due to
unsustainable harvesting techniques (which also precluded CITES permission); and
5. the lack of quality control in harvesting created problems down the chain.
This mapping exercise attracted the willing participation of producers, harvesters and processors because of the prospect of obtaining CITES certification for Kenyan aloe exports, enabling direct sales to final buyers at world market prices ($10/kg instead of $2/kg paid by South African middlemen); and the benefits to everyone of quality improvements and sustainable practices at critical stages of harvesting and processing. Examples of different maps
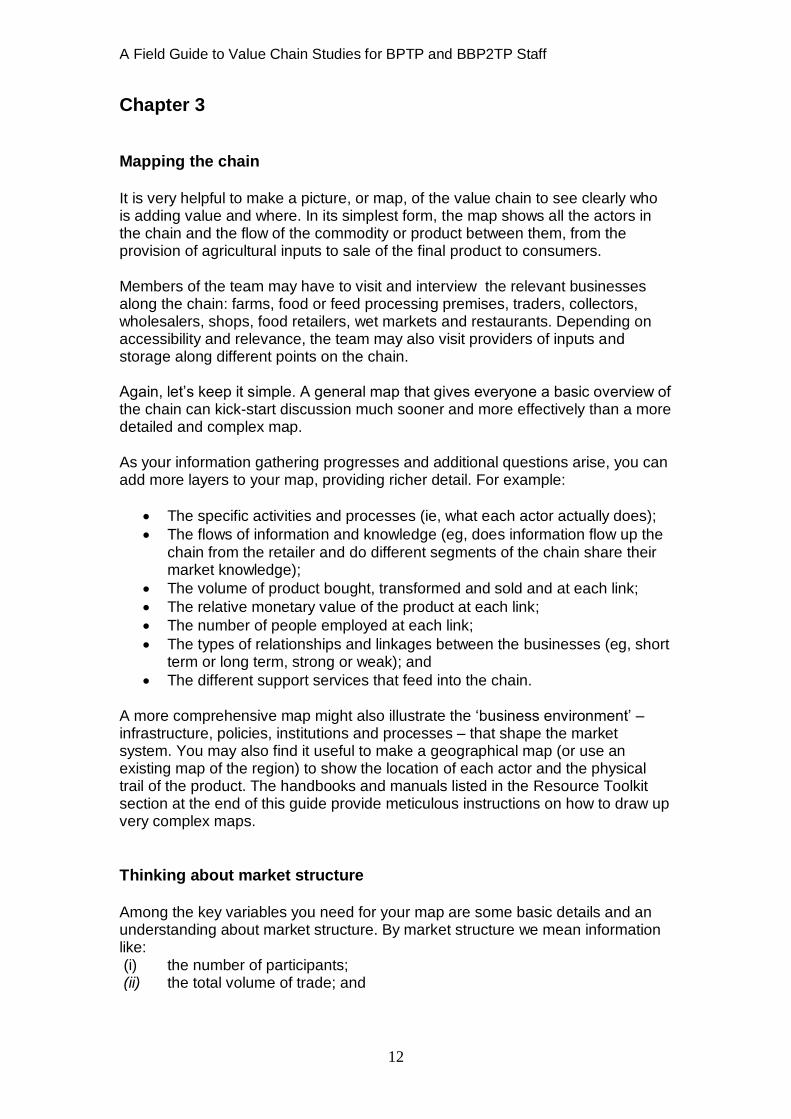
The following examples suggest different ways to map your chain, including mapping the businesses along the chain, mapping how the product changes value, mapping the relative costs of transforming it and mapping the way information flows through the chain. But first, for a bit of fun, here is a figure by Brown et al illustrating the differences between how we explain the chain and how it really looks!
A Field Guide to Value Chain Studies for BPTP and BBP2TP Staff
15
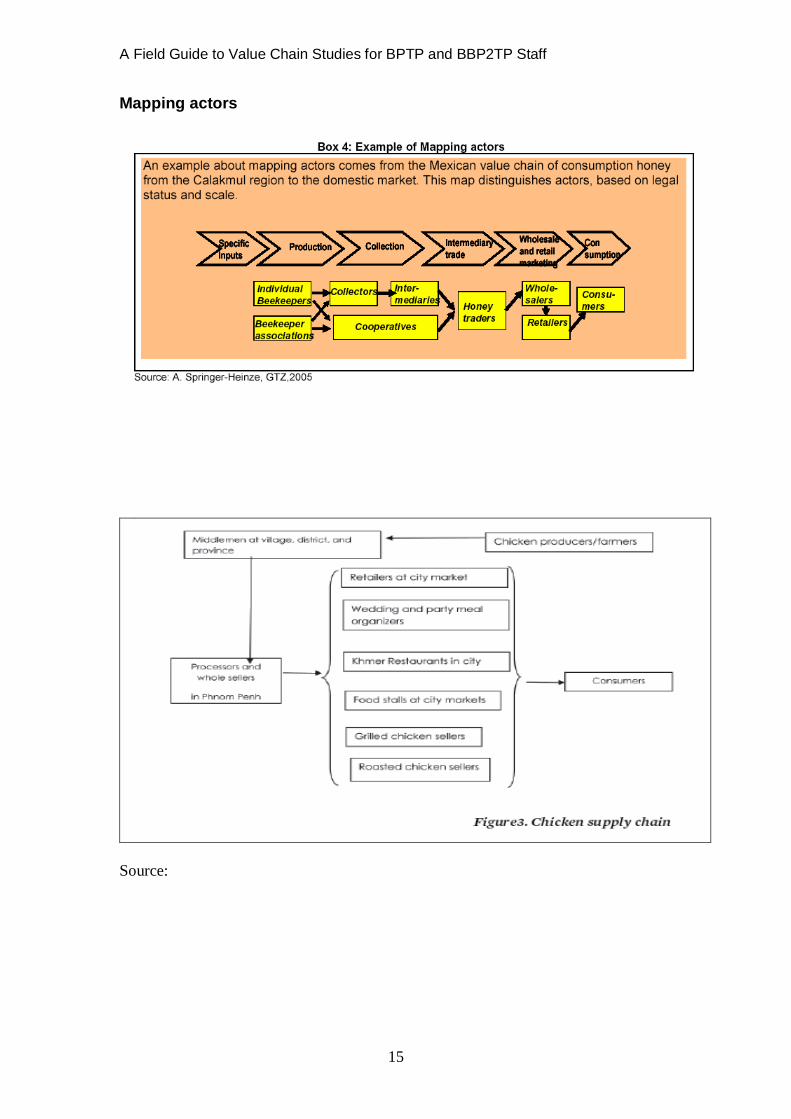
Mapping actors
Source:
A Field Guide to Value Chain Studies for BPTP and BBP2TP Staff
16
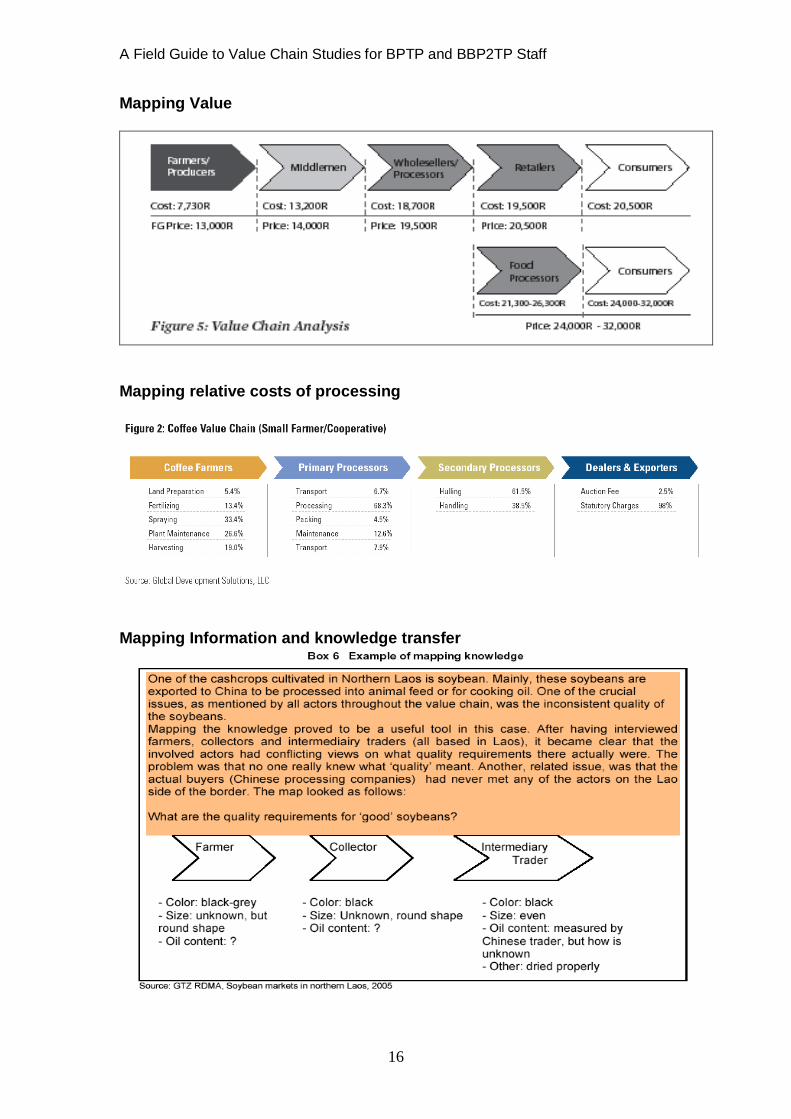
Mapping Value
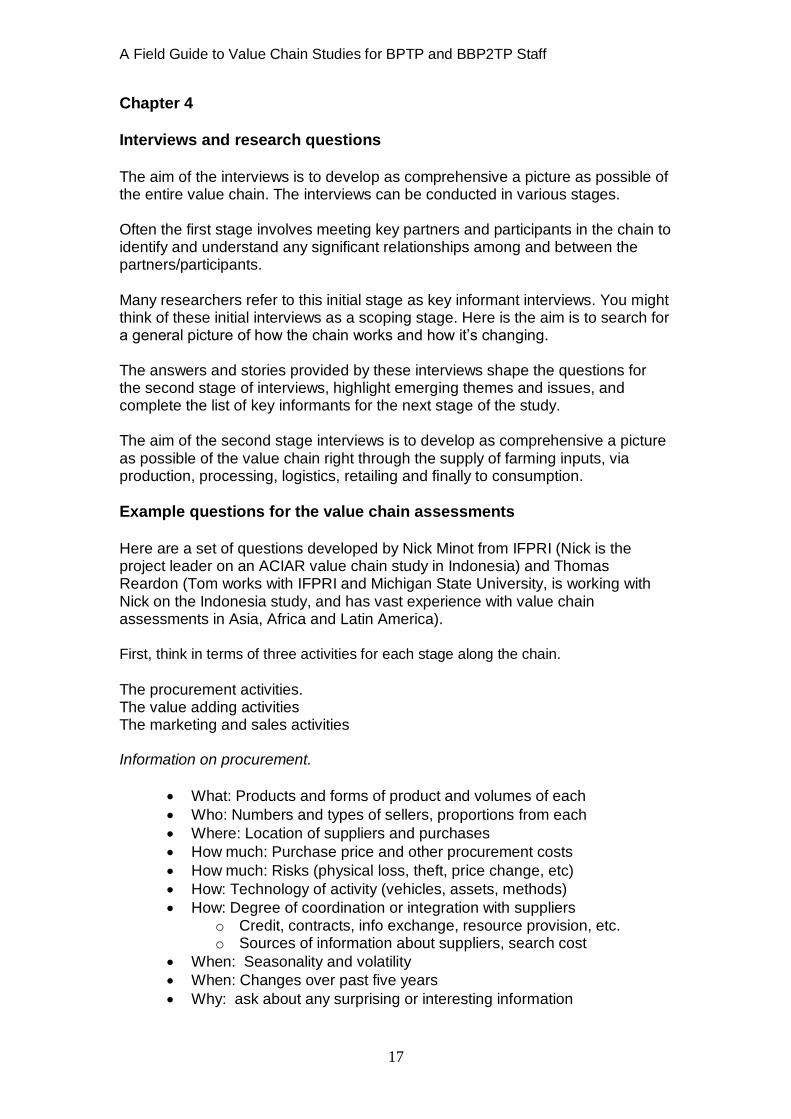
Mapping relative costs of processing
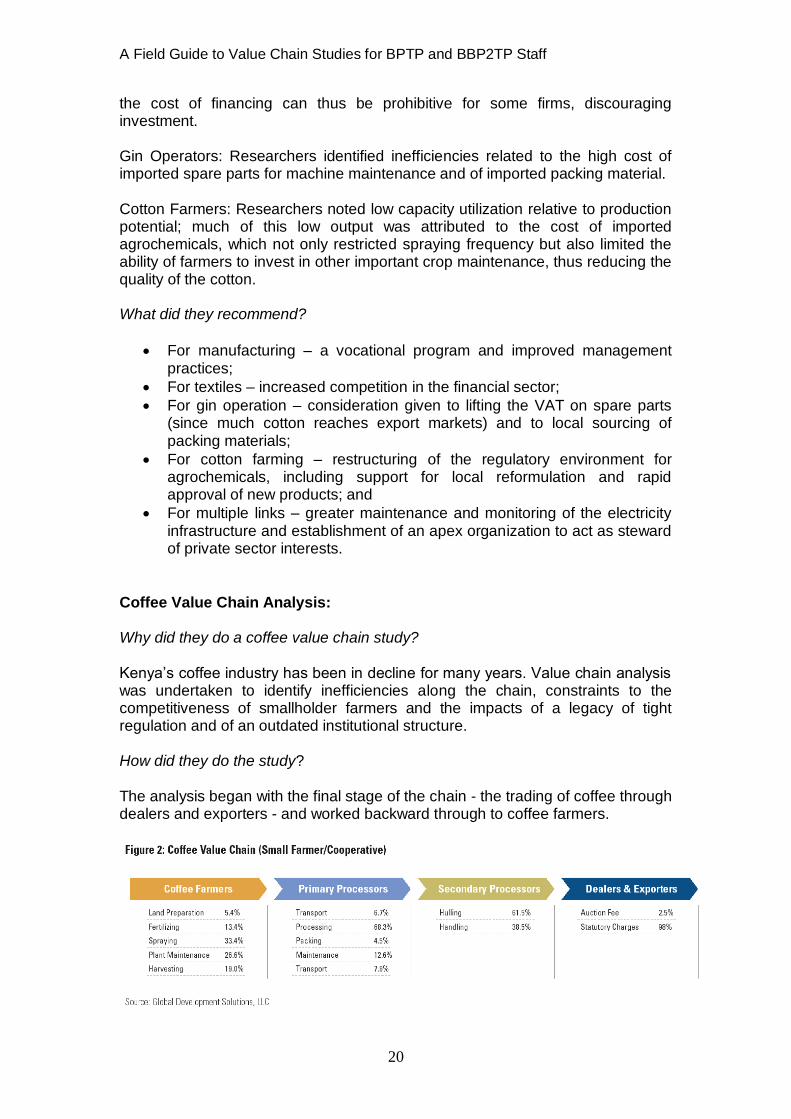
Mapping Information and knowledge transfer
A Field Guide to Value Chain Studies for BPTP and BBP2TP Staff
17
Chapter 4
Interviews and research questions The aim of the interviews is to develop as comprehensive a picture as possible of the entire value chain. The interviews can be conducted in various stages. Often the first stage involves meeting key partners and participants in the chain to identify and understand any significant relationships among and between the partners/participants. Many researchers refer to this initial stage as key informant interviews. You might think of these initial interviews as a scoping stage. Here is the aim is to search for a general picture of how the chain works and how it‟s changing. The answers and stories provided by these interviews shape the questions for the second stage of interviews, highlight emerging themes and issues, and complete the list of key informants for the next stage of the study. The aim of the second stage interviews is to develop as comprehensive a picture as possible of the value chain right through the supply of farming inputs, via production, processing, logistics, retailing and finally to consumption. Example questions for the value chain assessments Here are a set of questions developed by Nick Minot from IFPRI (Nick is the project leader on an ACIAR value chain study in Indonesia) and Thomas Reardon (Tom works with IFPRI and Michigan State University, is working with Nick on the Indonesia study, and has vast experience with value chain assessments in Asia, Africa and Latin America). First, think in terms of three activities for each stage along the chain.
The procurement activities. The value adding activities The marketing and sales activities
Information on procurement.
What: Products and forms of product and volumes of each
Who: Numbers and types of sellers, proportions from each
Where: Location of suppliers and purchases
How much: Purchase price and other procurement costs
How much: Risks (physical loss, theft, price change, etc)
How: Technology of activity (vehicles, assets, methods)
How: Degree of coordination or integration with suppliers o Credit, contracts, info exchange, resource provision, etc. o Sources of information about suppliers, search cost
When: Seasonality and volatility
When: Changes over past five years
Why: ask about any surprising or interesting information

A Field Guide to Value Chain Studies for BPTP and BBP2TP Staff
18
Information on value-added activities
What: Types of value added activities and volumes of each o Transportation, storage, sorting, packaging, cleaning,
processing
How much: Composition of costs for each activity
How much: Risks (physical loss, theft, price change, etc)
Where: Location of activities
How: Technology of activity (assets, machinery, storage facilities, methods)
When: Seasonality and volatility
When: Changes over past five years
Why: ask about any surprising or interesting information
Information on sales/marketing
What: Products and forms of product and volumes of each
Who: Numbers and types of buyers, proportion to each
Where: Location of buyers and sales transaction
How much: Sale price and costs of marketing activities
How much: Risks (physical loss, theft, price change, etc)
Where: Location of activity
How: Technology of activity (vehicles, assets, methods)
How: Degree of coordination or integration with buyers o Credit, contracts, info exchange, resource provision, etc. o Source of information about buyers, search cost
When: Seasonality and volatility
When: Changes over past five years
Why: ask about any surprising or interesting information Overall questions
How do government policies, programs, and regulations affect company
What support from government would be useful?

A Field Guide to Value Chain Studies for BPTP and BBP2TP Staff
19
Chapter 5
Case study examples The World Bank value chain studies in Kenya
Here are short summaries of value chain studies on cotton, coffee and pyrethrum in Kenya. These studies form part of a larger World Bank project to identify key constraints to private sector-led growth and employment. The analysis disaggregated costs up and down the chain and was aimed at identifying key market- and policy-based impediments to competitiveness. Cotton Value Chain Analysis: Why did they do a cotton value chain study?
“It is critical that the Kenyan garment industry seek improvements in productivity and reductions in costs to ensure its survival in an increasingly competitive environment.” Focus on the key barriers to growth. What reforms are needed to improve the industry‟s competitive position? How did they do it? The study began with the export of finished garments, which is the deliverable to markets, and worked backward through to cotton farmers.
What did they learn? Garment Manufacturers (export): The high cost and low quality of electricity were major issues; companies were forced to maintain parallel power supplies and often had to repair equipment damaged by outages. Another issue was the high reject rate, which suggested improvements in labour productivity, management and cotton quality. Textiles Producers: The cost and quality of electricity were again cited as degrading competitiveness. A separate issue was the high cost of financing related to combing, which resulted from local banks viewing textiles as high risk;
A Field Guide to Value Chain Studies for BPTP and BBP2TP Staff
20
the cost of financing can thus be prohibitive for some firms, discouraging investment. Gin Operators: Researchers identified inefficiencies related to the high cost of imported spare parts for machine maintenance and of imported packing material. Cotton Farmers: Researchers noted low capacity utilization relative to production potential; much of this low output was attributed to the cost of imported agrochemicals, which not only restricted spraying frequency but also limited the ability of farmers to invest in other important crop maintenance, thus reducing the quality of the cotton. What did they recommend?
For manufacturing – a vocational program and improved management practices;
For textiles – increased competition in the financial sector;
For gin operation – consideration given to lifting the VAT on spare parts (since much cotton reaches export markets) and to local sourcing of packing materials;
For cotton farming – restructuring of the regulatory environment for agrochemicals, including support for local reformulation and rapid approval of new products; and
For multiple links – greater maintenance and monitoring of the electricity infrastructure and establishment of an apex organization to act as steward of private sector interests.
Coffee Value Chain Analysis: Why did they do a coffee value chain study? Kenya‟s coffee industry has been in decline for many years. Value chain analysis was undertaken to identify inefficiencies along the chain, constraints to the competitiveness of smallholder farmers and the impacts of a legacy of tight regulation and of an outdated institutional structure. How did they do the study? The analysis began with the final stage of the chain - the trading of coffee through dealers and exporters - and worked backward through to coffee farmers.
A Field Guide to Value Chain Studies for BPTP and BBP2TP Staff
21
What did they learn? Dealers and Exporters: The researchers found that “little information flows back to the farmers, leading to misunderstanding of the dealer role, as well as little opportunity for farmers to improve or differentiate their product based on market signals.” In addition, “current law prohibits direct purchase from farmers, thus adding middlemen who many not be necessary” and embedding inefficiency into the chain. Secondary Processors: The main issue was “the separation of farmers from information regarding their crop grade and classification”, which again “limits the abilities of farmers to make improvements and has created a degree of mistrust”. Primary Processor: The researchers noted that smallholders were required under the Coffee Act to process their coffee through a cooperative. The major constraints of this system were low labour productivity and quality, high electricity pricing and high maintenance costs due to outdated equipment. In addition, the system formed an additional separation of farmers from the market, embedding inefficiencies that degraded their competitiveness. Coffee Farmers: Issues included: low yields, due partly to inadequate use of fertilizers and sprays, which are imported and relatively expensive; and low labour productivity and quality, due to lack of adequate technical and vocational education. In addition, several cross-chain issues including: excessive licensing; and the long payment cycle between harvest and payment to the farmer by the cooperative, which forces farmers to intercrop their coffee with subsistence crops and pay excessive interest on loans to finance planting. What did they recommend? Liberalization in order to move beyond a highly regulated past and take advantage of a more open market. Specifically:
farmers must have access to real time market information and the option to sell direct to consumers;
marketing agents must provide information to farmers about the relationship between bean quality, liquor quality and price;
discontinue the requirement that exporting farmers must use an auction; and
the government should review all licenses with the goal of abolishing many.
Pyrethrum Value Chain Analysis
Why did the do the pyrethrum value chain study? Pyrethrum, a flower grown for its insecticide properties, is Kenya‟s most profitable cash crop. Like coffee, it has experienced significant decline and is subject to

A Field Guide to Value Chain Studies for BPTP and BBP2TP Staff
22
inefficient institutional structures. The Pyrethrum Board of Kenya (PBK) has a monopoly within Kenya on the sale of plant material, as well as a monopsony on the purchasing of pyrethrum from Kenyan farmers. The aim of the analysis is to better understand the value chain “so as to root out inefficiencies”. How did they do the study?
The analysis focused on the role of the PBK in the chain and its effects on two links: farming of pyrethrum and production of pyrethrum-based products. What did they learn? Inefficiencies within the PBK are linked to several problems for farmers:
Farmers have difficulty obtaining seedlings and therefore split plants, which degrades their quality;
The pyrethrum content of harvested flowers declines due to oxidization while awaiting PBK inspection, further eroding quality and profit margins for farmers;
Administration costs dominate input costs (33.7%) but have no clear benefit to farmers; most of these are related to a society/union commission and a tax.
Labour is the primary cost in plant maintenance, indicating low levels of herbicide use. (“farmers have the least support in financing quality inputs when it most matters”).
For manufacturers:
Distortions in PBK pricing mean that Kenya-produced pyrethrum grist is higher priced than that produced in Tanzania.
Conclusions/recommendations: The prohibition against manufacturers working with or purchasing directly from farmers has a detrimental impact on rural farmers and the future survival of the industry. Liberalization, in which the role of the PBK is reduced to a purely regulatory function, would be beneficial. A Case Study of Unilever in Indonesia The case aims to explore links between international business and poverty reduction in Indonesia
Why this study?
In 2002 Unilever Indonesia (UI) and Oxfam partnered to explore to what extent and how the wealth generated by a multinational company in a developing country translates into real benefits for people living in poverty. One product, Kecap Bango sweet soy sauce, was selected for an in-depth case study. UI needed to find a steady, consistent supply of high-quality black

A Field Guide to Value Chain Studies for BPTP and BBP2TP Staff
23
soybeans in order to meet rapidly growing national demand for Kecap Bango and to compete with increasing demand for black soybeans throughout Java. The research explored whether the product provides a reasonable share of benefits to its suppliers, especially the poor farmers producing the raw materials. What did they do?
UI developed a pilot program to create an alternative supply chain, in which they sourced black soybeans directly from a small group of producers rather than traders. UI offered the producers a guaranteed price for their product as well as credit and technical assistance provided in partnership with Gajah Mada University in Yogyakarta. UI also helped develop mechanical threshing and improved storage systems to retain product quality and reduce post-harvest losses. UI‟s goals were to improve overall quality, stimulate production, ensure sufficient supplies and, if possible, reduce costs. What were the results? Of the 1,000 MT of black soybeans purchased by UI in 2002, the alternative value chain accounted for about 100 MT or 10%. The number of farmers selling through the program expanded rapidly to more than 1,000 participating farmers by early 2004. Direct purchases gave farmers a 10–15 per cent higher price than that on offer from traditional traders. In good harvest years the producers also got a better return on investment and labour than from other crops they grew. Black soybean production did not appear to reduce the farmers‟ production of rice, their main food crop, since two rice crops continued to be grown alongside the black soybeans. The study found that there were some problems with the project. The yields for most farmers have been less than those achieved by the university demonstration plots. And there have been some crop failures: for example, about 20 per cent of a 2003 crop was rejected for poor quality. UI asked the farmers to re-sort the soybeans for quality and the rejects were sold at lower prices to the local market; it also extended the deadline for loan repayments, without interest, to the following harvest. Depending on one‟s perspective, the system of contract farming can be seen as either increasing farmers‟ reliance upon a single buyer, or providing them with a secure market. But contracts for black soybeans lock in prices at the time of planting rather than at the time of harvest, when prices usually are more depressed. The most important problems are that the farmers bear a major financial risk within the new arrangement, and the fact that UI‟s strength as a large company limits farmers‟ negotiating power.

A Field Guide to Value Chain Studies for BPTP and BBP2TP Staff
24
Oxfam is concerned that UI‟s pilot work on soybeans might undermine traditional credit and market relationships on which farmers depend for other crops. While contract farming systems can be seen as exploitative at many levels, they also provide farmers with capital needed for non-farm expenses. The new credit system provided through UI is cheaper, more efficient, and interest-free to farmers, but it can be used only for expenses related to producing black soybeans. Oxfam considers that farmers risk becoming over-dependent upon UI for the sale of the crop, and that they would be hurt by any decline in demand. In addition, some producers and traders in the old supply chain lose out by exclusion from the new supply chain. From UI‟s point of view, direct purchasing of black soybeans has higher overall transaction costs and it is far more complicated and in some ways riskier than buying directly from traders. Some of this cost can be seen as an up-front investment which can be amortized by increasing purchases from a larger group of producers. However, it would not be simple to extend the alternative trading system for black soybeans, or to apply the model to other crop-supply chains. Moreover, the success of farmers selling this „niche‟ product cannot be easily replicated if there is not a „business case‟ for it. Still the project is very useful in understanding how value-adding potential and hence power of poor producers can be enhanced. Technoserve case studies
Technoserve carried out a series of case studies to understand how to better adapt industry approaches to specific value chain analysis using three comparative commodities. Bananas in Kenya
Why did they do this study?
Problem: “The banana value chain was long, involving several middlemen, thus distancing the farmer from the value received further down the chain.” What did they learn? Most farmers tend to be small scale (less than one hectare); have limited knowledge of market information; negotiations based on size and type; limited ability to wait (perishable product). Long value chains were limiting the margins of the smallhold farmers (in one example the farmers retained 10-20% of the retail price).

A Field Guide to Value Chain Studies for BPTP and BBP2TP Staff
25
What did they recommend?
Condense the value chain to increase its efficiency and minimize players; this requires farmers to act collectively to take on additional roles such as grading, bulking and transporting the bananas and then connecting directly to urban wholesalers. The benefits:
farmers have reliable markets and become credit worthy;
brokers create formalized banana trading businesses due to increased capacity and are able to service more sophisticated markets;
wholesalers may access retail markets; and
retailers have reliable access to quality, market-differentiated products. Coffee in Tanzania
Why did they do this study? Problem: “The coffee chain was compact, resulting in a low-quality commodity product, which was then sold through the auction for lower prices.” Also low productivity and no opportunities for market access by small farmers.
What did they learn?
Ninety percent of Tanzania‟s Arabica crop produced by 400,000 small-scale growers on plots of one hectare; “backyard” processing techniques result in low quality; most sell their crop to traders and cooperatives; lack of quality incentives and extension services result in low farm productivity. Farmers receive less of green coffee selling price than competitors in other countries. Traders and cooperatives do not provide incentives. And wholesalers lack direct marketing opportunities.

A Field Guide to Value Chain Studies for BPTP and BBP2TP Staff
26
What did they recommend?
Establish a business-focused consumer cooperative to provide services to smallholder farmer business groups and provide quality based incentives. Establish central sites for more efficient pulping – leading to increase in quality and pricing up to 70%. Farmers retain product and contract milling themselves. Central pulping enables farmer groups to sell via direct exports, resulting in double prior price for farmer. Cashew (Mozambique) Why did they do this study? One million smallholders earn about $35 gross income pa. National production is declining. Cashew nut quality is poor. Much of the raw product is exported before any value addition.

A Field Guide to Value Chain Studies for BPTP and BBP2TP Staff
27
What did they learn?
Export: 98% of raw nut exported to India for processing, retail within India and export of kernels to USA and Europe. Demand has outpaced supply each year, but now under threat from higher-quality competition in SE Asia and W Africa, planting in India to reduce reliance on imports and traceability regulations in developed country markets. Traders/middlemen: handle marketing and aggregating; no payment for quality; poor post harvest handling results in income losses. Producers: Low income p.a. No investment, little support from private or public sector. Cashew quality is relatively poor. What did they recommended?
Develop more processing in Mozambique -- 35% of cashews now processed in country, 15 factories and 4,000 jobs created in rural/semi-rural areas. Processors pay farmers more for quality (eg 15% premium in 2005/06). Training to improve post-harvest handling. Local market for smallholder farms. Processors have formed their own brand of Mozambican cashew. Kernel exports have earned US$ 7.1 (kernels have around 50% higher value than raw nuts). The Free-Range Chicken Value Chain study in Cambodia
Why did they do this study?
To discover if is possible to link small producers of free-range chicken to local markets.

A Field Guide to Value Chain Studies for BPTP and BBP2TP Staff
28
What did they learn?
The farmers have limited market information, interaction with wholesalers/traders and knowledge of quality standard requirements. In addition, unethical practices among some traders and wholesalers are undermining farmers‟ profits. What did they recommend?
The Cambodian Centre for Study and Development in Agriculture (CEDAC) is urged to already continue its support for cooperative activities among farmers and to provide technical support. Future plans: several farmers markets to sell agricultural products, including natural agricultural products such as free range chicken; a establish a community slaughter house. Two Indonesia value chain studies: Vegetables and Rice As part of their research work to identify constraints to collaboration between the private sector and smallholder farmers, Dr. Kuntoro Boga Andri and his BPTP East Java Teams conducted value chain studies of several commodities in Indonesia. Here are summaries of their studies of vegetable and rice production. Vegetable Contract Farming Why did they do this study?
A Field Guide to Value Chain Studies for BPTP and BBP2TP Staff
29
Most vegetable farmers in East Java are smallholders who produce on an
individual basis. Marketing has been a major problem because these farmers
have moved from subsistence farming to commercial contracting. Handling,
grading and sorting of their products is generally of a poor standard.
How did they do it?
Primary data was collected using survey methods. Data from the surveys allowed
discussion of the whole farm sector and enabled comparison of traditional and
contract systems in order to identify the economic advantages for smallholders.
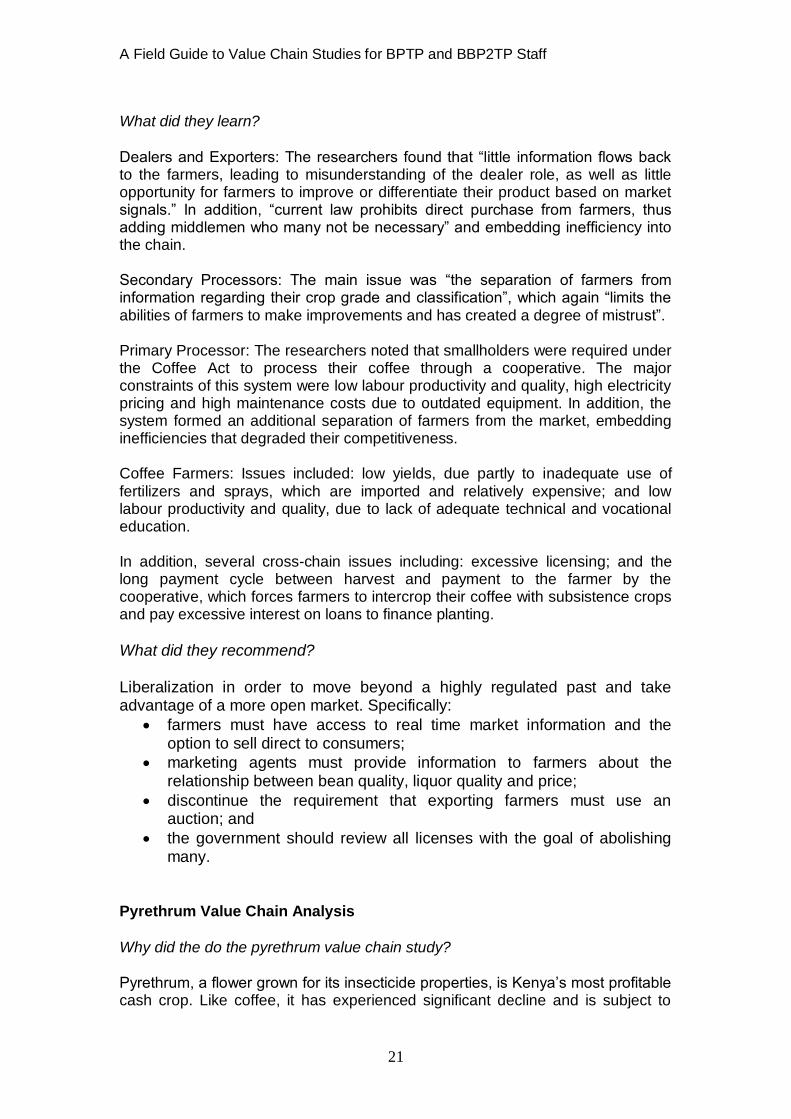
Figure: Marketing channels for vegetables in the studied area
]
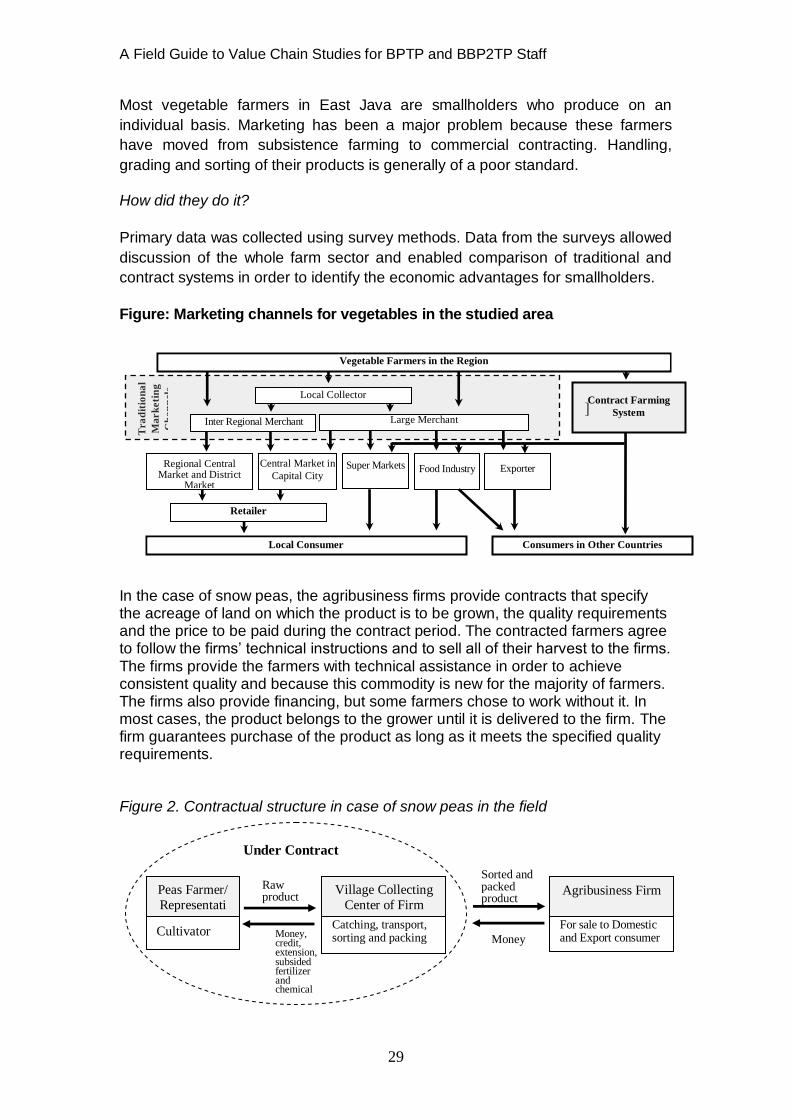
In the case of snow peas, the agribusiness firms provide contracts that specify the acreage of land on which the product is to be grown, the quality requirements and the price to be paid during the contract period. The contracted farmers agree to follow the firms‟ technical instructions and to sell all of their harvest to the firms. The firms provide the farmers with technical assistance in order to achieve consistent quality and because this commodity is new for the majority of farmers. The firms also provide financing, but some farmers chose to work without it. In most cases, the product belongs to the grower until it is delivered to the firm. The firm guarantees purchase of the product as long as it meets the specified quality requirements. Figure 2. Contractual structure in case of snow peas in the field
Tra
dit
ion
al
Ma
rk
eti
ng
Ch
an
nels
Local Collector
Inter Regional Merchant
Large Merchant
Vegetable Farmers in the Region
Contract Farming
System
Retailer
Consumers in Other Countries
Regional Central Market and District
Market
Local Consumer
Central Market in
Capital City Super Markets
Food Industry
Exporter
Peas Farmer/
Representati
ve
Village Collecting
Center of Firm Agribusiness Firm
Money, credit, extension, subsided fertilizer and chemical
Under Contract
Catching, transport, sorting and packing
For sale to Domestic and Export consumer
Cultivator
Raw product
Sorted and packed product
Money

A Field Guide to Value Chain Studies for BPTP and BBP2TP Staff
30
In the case of bunching onions, the agribusiness firms provide contracted
farmers with gratis seedlings as well as subsidized pesticides and fertilizers and
sometimes credit. The firms give technical assistance and precise instructions
about pesticide use, watering, transplanting, harvesting, etc in order to ensure a
certain quality of product. Growers contribute land, water, electricity, labor, fuel,
machinery and equipment maintenance. They receive payments at the agreed
price two weeks after product delivery.
Figure 3. Case of contract farming of bunching onion
What did they learn? The study showed that for these two commodities the contract farming system
has the potential to improve production capacity and generate greater net-returns to farmers (see Figure 4). In addition, contractor farmers can benefit from the technical guidance, managerial assistance, material subsidies and
credit, which are important to maintain and improve farming operations. The contract farming system alone cannot solve all the problems related to
the developing agriculture sector but it will work as long as both agribusiness firms and farmers cooperate in a mutually beneficial way.
Figure 4. Improvement in average production and net-returns
Bunching Onion
Farmers Farmer’s Group Agribusiness Firm
Collecting and
transport Grower Processing and
Selling
Delivery
product
Money, extension, gratis seedling, subsided fertilizer and chemical
Raw
product
Money, material and credit
Snow Peas Production and Net Income
0
5
10
15
20
25
0 5 10 15 20 25
Net Income (Rp. millions)
Pro
du
cti
on
(T
on
na
ge
)
Non Contract
Contract Farmers
Bunching Onion Production and Net Income
0
10
20
30
40
50
60
0 5 10 15 20 25 30 35
Net Income (Rp. millions)
Pro
du
cti
on
(T
on
nag
e)
Non Contract
Contract Farmers
Net-returns (Rp. millions) Net-returns (Rp. millions)
A Field Guide to Value Chain Studies for BPTP and BBP2TP Staff
31
What did they recommend?
Organization of contracted farmers into economic groups such as agricultural cooperatives which can coordinate farmers and mediate
while making agreements with agribusiness firms.
The involvement of cooperatives offers a number of other benefits,
such as economies of scale, protection of smallholders from exploitation, greater bargaining power and enhancements in overall marketing efficiency.
Rice Production Why did they do this study? Rice is consumed by nearly 95% of Indonesia’s population and rice production
provides work to more than 18 million household. Therefore, rice farming plays an
important role in the country’s economic and political stability.
Until 1998, BULOG played the dominant role in rice marketing in Indonesia. In 1998,
the government moved towards a rice liberalization policy, opened the domestic rice
market to the international market and eliminated BULOG’s monopoly, although it
maintained some essential functions.
It is necessary to examine how BULOG can complement the role of the private sector
in the procurement and distribution of rice in the country. The objectives of this study
are: 1) to assess the current state of rice procurement and distribution by BULOG; and
2) to identify the impact of the policies on consumers and farmers.
How did they do it?
The researchers collected information about rice procurement in four selected
BULOG regional offices, as well as official data and information from BULOG
informants (BULOG data). This was followed by field surveys of other institutions to
find primary data directly taken from farmers, cooperatives and traders in order to
identify actual marketing channels, commodity accessibility and their views on rice
farming and marketing.
What did they find out?
In Indonesia there are both rice surplus and rice deficit areas, which also vary
seasonally. Besides free market channels handled by traders and the private sector,
BULOG reallocates rice by shipping it from the main harvest areas to deficit areas to
maintain buffer stock and then releases it onto the local market when necessary. The
study noted that BULOG in South Sulawesi and East Java regions were holding about
25% of all national production in 2005; they reallocated the surplus to areas such as
Riau and other regions in Kalimantan or Nusa Tenggara. A smaller rice deficit in Bali,

A Field Guide to Value Chain Studies for BPTP and BBP2TP Staff
32
BULOG Regional Division
BULOG’s Warehouse
Village/Farmer
Cooperative
Miller non Cooperative
Unshuck paddy
/Rice supply
Indonesian Rice
Farmers
Contract Marketing
Market
Commercial Bank
(Bukopin and BRI) Commercial credit
85%
13.3%
P/R P/R
BULOG Task Unit /
Satgas (When Coop or
miller channel does not
work)
0.9%
0.8%
on the other hand, was fulfilled by inter-regional traders from Java and Sulawesi,
therefore BULOG did not require rice reallocation.
This study found that in order to fulfill the stock requirements, BULOG procured rice
within each region by contracting through a village cooperative, farmers cooperative
or rice miller. Players who are interested in participating in the procurement take part
in a bidding processs and qualified players become BULOG paddy/rice contractors
(suppliers).
Table . BULOG contract marketing circumstance at 2006
BULOG Division
(Region)
Total
Contractor
Total Contract Quantity
(rice, Ton)
Share by contractor organization (%)
Cooperative Miller Non
Cooperatives
BULOG
Task Unit
East Java 934 604,100 5 90 5
South Sulawesi 362 166,850 9 81 9 Bali 26 16,255 0 12 88
Riau 5 650 0 20 80 Other regions 2,729 2,100,000 5 83 12
Total Indonesia 4,056 2,100,000 6 89 5
Marketing of rice in this case is a partnership between BULOG as a buyer and the
cooperative or miller as a collector to procure rice from producers or farmers, and to
set a price and outlet for a commodity before harvest. This system is quite different
with the model of the 1970s to the mid1990s, when Village Cooperative Units (KUD)
were mobilized and BULOG’s rice was produced by farmers who were given
incentives such as subsidised fertilizers and chemicals as well as credit from a
government bank. Village cooperatives were BULOG’s main partner for rice
procurement until 1999, when the private sector became the core partner through the
contract marketing system.

A Field Guide to Value Chain Studies for BPTP and BBP2TP Staff
33
0
2
4
6
8
1991 1993 1995 1997 1999 2001 2003 2005Year
Mill
ions
ton
Amount rice procured domestically Amount rice imported
Rice distributed by BULOG
Figure . Partnership system during rice procurement and distribution
The government maintains public rice stocks from 2 to 3 million metric tons annually
in normal conditions as national food security and a buffer against possible disruption
in world market trade. With just over 1,610 unit grain warehouses and more than 4
million ton of rice storage capacity, the government has the largest network of food
storage facilities in the country.
Figure. BULOG’s rice procured and distributed annually
Between 2000 and 2005, RASKIN distributed more than 10.4 million
ton of subsidized rice, or an annual average of 1.7 million ton, through the BULOG network. This implies that about 60-70 million poor people in Indonesia have actually directly benefited from the program.
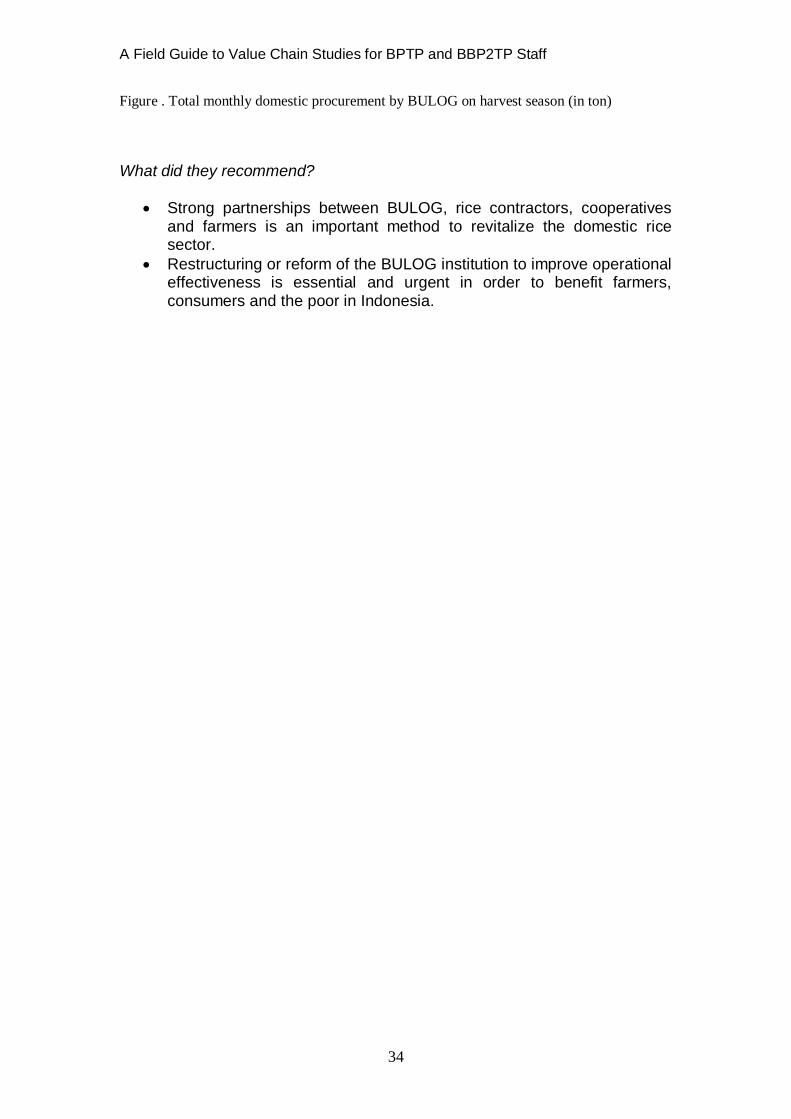
The government‟s rice policy attempts to reconcile the often-conflicting goals of consumers, who must have access to ample supplies of rice at an affordable price, and farmers, who must be protected from serious price nosedives and enjoy adequate production incentives. During the main harvest season in Indonesia from May to June, BULOG purchased harvested rice to build rice stocks and protect farmers from the declining rice prices; then, when rice production was low, BULOG sold the rice stock to the market to protect consumers from high rice prices.
0
200,000
400,000
600,000
800,000
Jan Feb March April May June July August Sept Oct Nov Dec
2000
2001
2002
2003
2004
2005
2006
Months
A Field Guide to Value Chain Studies for BPTP and BBP2TP Staff
34
Figure . Total monthly domestic procurement by BULOG on harvest season (in ton)
What did they recommend?
Strong partnerships between BULOG, rice contractors, cooperatives and farmers is an important method to revitalize the domestic rice sector.
Restructuring or reform of the BULOG institution to improve operational effectiveness is essential and urgent in order to benefit farmers, consumers and the poor in Indonesia.

A Field Guide to Value Chain Studies for BPTP and BBP2TP Staff
35
Chapter 5
Resource Toolkit
User guides for value chain assessments.
Donor Interventions in Value Chain Development, 2007. Daniel Roduner, Swiss Center for Agricultural Extension and Rural Development (AGRIDEA) Swiss Agency for Development and Cooperation (www.sdc-valuechains.ch)
The M4P Operational Guide, 2008. UK Department for International Development (DFID) and the Swiss Agency for Development and Cooperation (SDC). Value Chain Analysis for Policy-Makers and Practitioners Hubert Schmitz 2005. ILO Institute of Development Studies University of Sussex. http://www.ilo.org/dyn/empent/docs/F204969253/VCA_book_final.pdf A Handbook for Value Chain Research. 2001. Prepared for the IDRC by the School of Development Studies, University of KwaZulu-Natal, Kaplinsky, R., and Morris, M. http://sds.ukzn.ac.za/files/handbook_valuechainresearch.pdf Agri-food Value Chain Diagnostic Analysis,2008. A. Fearne, R. Collins, R. Clark, B. Dent, L. Bonney, M. Parket and J. Mendham. Participatory Market Chain Approach (PMCA): User Guide, Edited by Thomas Bernet, Graham Thiele and Thomas Zschocke.