Embed Size (px)
Citation preview
Amela HUBIC
A FinAnciAl SociAl Accounting MAtrix (SAM) For luxeMbourg
cAhier d’étudeSworking pAper
n° 72
FEBRUARY 2012
2, boulevard RoyalL-2983 Luxembourg
Tél. : +352 4774-1Fax: +352 4774 4910
www.bcl.lu • [email protected]
2
A Financial Social Accounting Matrix (SAM)
for Luxembourg1
Amela HUBIC2
February 2012
Abstract
A Social Accounting Matrix (SAM) is a comprehensive, economy-wide data framework of real
accounts, typically representing the economy of a nation but also providing the link between the
economy and the rest of the world in terms of trade flows. However, in order to have a complete
picture of the transactions taking place in an economy, real accounts are not sufficient and need to
be complemented with financial accounts. This paper describes the construction of the first
financial SAM for Luxembourg for the year 2007 by integrating both financial institutions and
financial instruments into the real SAM. This powerful tool has two principal objectives: first, to
organize the information that would allow an analysis of the structure of the economy of
Luxembourg and second, to provide the benchmark data set for the creation of a financial
computable general equilibrium (CGE) model.
Keywords: financial social accounting matrix, computable general equilibrium models, financial
accounts, portfolio choice, financial institutional sectors
JEL Classification: D30, C68, D57, G11, G20, D53
1 The author is grateful to Ali Bayar and Béatrice Thiry for their valuable support and advice. The author also
thanks Muriel Bouchet, Roland Nockels, Masudi Opese, Marc Origer, John Haas, Robert Michaux and Mike Bissener for their help.
The views expressed in this paper are personal views of the author and do not necessarily reflect those of the Banque centrale du Luxembourg or the Eurosystem.
2 Banque centrale du Luxembourg, Economics and Research Department, 2 Boulevard Royal, L-2983
Luxembourg; e-mail: [email protected].

3
Résumé non-technique
Ce Cahier d‟Etudes présente la première matrice financière de comptabilité sociale relative à
l‟économie luxembourgeoise pour l‟année 2007, dernière année pour laquelle les nombreuses
données requises sont disponibles. Ce choix permet également de minimiser l‟ampleur des
révisons statistiques. Il est important de préciser à ce stade qu‟il s‟agit d‟un cahier d‟Etude qui est
essentiellement statistique et technique, décrivant la construction d‟une base de données qui sera
utilisée dans un modèle financier d‟équilibre général. Ce modèle fera l‟objet d‟une publication
ultérieure de la BCL.
En premier lieu, la construction de la partie réelle de la matrice de comptabilité sociale est
présentée en détails ainsi que son cadre théorique. Ensuite, l‟ensemble des comptes financiers
(stocks et flux financiers) y sont intégrées et leur cadre théorique est également présenté. Les
comptes financiers détaillés complets (stocks et flux) intégrés à la matrice incorporent des
transactions financières ayant lieu entre les secteurs institutionnels de l‟économie
luxembourgeoise d‟une part et les transactions entre ces derniers et le reste du monde d‟autre part.
La matrice financière de comptabilité sociale donne une image beaucoup plus complète et réaliste
de l‟économie luxembourgeoise. La relation structurelle entre les principaux comptes sectoriels
(sociétés financières, sociétés non-financières, gouvernement, ménages et le reste du monde)
intégrés à la matrice permet d‟analyser en détail la structure de l‟économie luxembourgeoise.
La matrice financière de comptabilité sociale répond à deux objectifs principaux: intégrer d‟une
manière cohérente l‟information sur la structure économique et sociale du pays et fournir un
ensemble de données de référence pour la création d‟un modèle financier d‟équilibre général.
L‟analyse des comptes financiers de l‟économie luxembourgeoise montre que la richesse
financière nette (soit les actifs financiers moins les passifs financiers) de tous les secteurs
institutionnels du pays a augmenté en 2007, à l‟exception de celle du secteur institutionnel
„sociétés non-financières‟, pour lequel les passifs ont été plus élevés que les actifs. Cette
amélioration nette s‟explique principalement par la réévaluation des valeurs des stocks en 2007,
suite aux résultats positifs enregistrés sur les marchés financiers. Par ailleurs, l‟année 2007 a été
la dernière année caractérisée par une évolution favorable des indicateurs économiques avant la
crise économique et financière de 2008.
En 2007, les investissements financiers (flux d‟actifs) de l‟ensemble des secteurs institutionnels
ont atteint un montant de 514 927 millions d‟euros, tandis que l‟économie luxembourgeoise a
généré des flux d‟engagement s‟élevant à 511 854 million d‟euros. Au total, le pays a enregistré
un surplus de 3 073 millions d‟euros ou 8,2 pourcent du PIB qui a servi à financer le déficit du
reste du monde. Les sociétés financières luxembourgeoises (SEC95 S12) ont acquis plus de 80
pourcent des actifs financiers de l‟économie et ont enregistré une proportion similaire du côté du
passif. En outre, le montant de l‟acquisition des actifs financiers étant légèrement plus important
que celui du passif, il en a résulté un solde positif s‟élevant à 2 674 millions d‟euros pour ce
secteur. Ainsi, les sociétés financières constituent le plus important contributeur au solde positif
total des comptes financiers de l‟économie luxembourgeoise. Quant au gouvernement, le solde
4
financier positif qu‟il a enregistré est le deuxième plus significatif parmi les secteurs, avec 1 373
millions d‟euros en 2007. Ce montant représente environ 45 pourcent du montant total que
l‟économie luxembourgeoise a prêté au reste du monde. Finalement, les ménages luxembourgeois
ont enregistré un surplus, également d‟environ 5 pourcent du montant total prêté au reste du
monde par le Luxembourg.
5
Table of Contents
1 Introduction ........................................................................................................................... 7
2 What is social accounting matrix (SAM)? ........................................................................... 9
2.1 Real SAM ............................................................................................................ 13 2.2 Financial SAM .................................................................................................... 17
3 Building a financial SAM for Luxembourg ...................................................................... 23
3.1 Real accounts in the SAM ................................................................................... 24 3.1.1 Commodity accounts ...................................................................................... 25 3.1.2 Production activities accounts ........................................................................ 37 3.1.3 Factors of production accounts ....................................................................... 38 3.1.4 Non-financial corporations sector account ..................................................... 38 3.1.5 Financial corporations sector account ............................................................ 40 3.1.6 Government sector account ............................................................................ 41 3.1.7 Households sector account ............................................................................. 46 3.1.8 External account ............................................................................................. 47 3.1.9 Taxes and subsidies accounts ......................................................................... 49 3.1.10 Transactions costs accounts ............................................................................ 50 3.1.11 Savings-investment account and changes in stocks account .......................... 51
3.2 Financial accounts in the SAM ........................................................................... 52 3.2.1 Capital account ............................................................................................... 53 3.2.2 Financial instruments: assets and liabilities.................................................... 58
3.2.2.1 Monetary gold and special drawing rights (SDRs) ...................................... 58 3.2.2.2 Currency and deposits .................................................................................. 59 3.2.2.3 Securities other than shares .......................................................................... 59 3.2.2.4 Loans ............................................................................................................ 60 3.2.2.5 Shares and other equity ................................................................................ 60 3.2.2.6 Insurance technical reserves ......................................................................... 61 3.2.2.7 Other accounts receivable/payable ............................................................... 62
3.2.3 Capital account and financial account by institutional sector ........................ 62 3.2.4 Interest payments ............................................................................................ 68 3.2.5 Complete financial accounts of Luxembourg economy for 2007 .................. 69
4 Conclusions .......................................................................................................................... 75
Bibliography ...................................................................................................................... 76
Appendix A: Disaggregation of the commodities and production sectors in the financial
SAM of Luxembourg (following ESA95 accounting principles) .............. 82 Appendix B: Current account distributive transactions: whom-to-whom matrices ..... 84 Appendix C: Disaggregated SAM with financial accounts for Luxembourg (2007) ..... 90
6
Table of tables
Table 1: Double-Entry Bookkeeping principle and consistency of the accounts of a SAM ......... 11 Table 2: Basic framework of a Social Accounting Matrix with real accounts .............................. 15 Table 3: Main building blocks of financial SAM .......................................................................... 19 Table 4: Basic framework of a Social Accounting Matrix with real and financial accounts ........ 20 Table 5: Financial instruments ...................................................................................................... 21 Table 6: Simplified balance sheet account at 31/12/T for a given sector ...................................... 22 Table 7: Aggregated SAM with real accounts for Luxembourg (2007) in outline........................ 26 Table 8: Seventeen commodities / production activities distinguished in the SAM ..................... 27 Table 9: Disaggregated SAM with real accounts for Luxembourg (2007) in outline ................... 29 Table 10: Structure of total gross value added at basic prices, 2000-2007 ................................... 38 Table 11: Households‟ consumption, 2007 ................................................................................... 47 Table 12: EU transactions in Luxembourg contributing to general government revenue and
expenditure .................................................................................................................... 49 Table 13: 16 flow/stock accounts assigned to the 16 financial assets and liabilities..................... 53 Table 14: Disaggregation of financial corporations account (ESA95 S12)................................... 54 Table 15: Aggregated SAM with real and financial accounts for Luxembourg (2007) in outline 56 Table 16: Saving rate by institutional sector (in millions of euros if not stated otherwise) .......... 57 Table 17: Gross savings and physical investments by institutional sector .................................... 58 Table 18: Capital and financial accounts of total domestic economy and ROW .......................... 63 Table 19: Capital and financial accounts of non-financial corporations ....................................... 64 Table 20: Capital and financial accounts of financial corporations .............................................. 65 Table 21: Capital and financial accounts of government .............................................................. 66 Table 22: Capital and financial accounts of households ............................................................... 67 Table 23: Capital and financial accounts of ROW ........................................................................ 67 Table 24: Interest payments payable ............................................................................................. 68 Table 25: Interest payments receivable ......................................................................................... 68 Table 26: Stocks, flows and revaluation of financial assets in Luxembourg, 2007 ...................... 70 Table 27: Stocks, flows and revaluation of financial liabilities in Luxembourg, 2007 ................. 72 Table 28: Net financial worth (Assets minus Liabilities) .............................................................. 74
Table of figures
Figure 1: The circular flow diagram of transactions between various economic agents ............... 13

7
1 Introduction
The use of social accounting matrices (SAMs) to record the main transactions that took place in a
national economy during a specific period (e.g. one year) can be traced as far back as Quesnay
(1694-1774) in 1758 with his Tableau économique. In the twentieth century, social accounting
was heavily influenced both by the work on national income accounts by Kuznets (1937) and that
on input-output matrices by Leontief (1941). The development of SAMs such as they are used
today began with the work by Meade and Stone (1941) by developing the first logically complete
set of double entry national income accounts. Subsequent work by Stone (1947) resulted in the
conventions for social accounting embodied in the United Nations‟ System of National Accounts
(United Nations, 1953 and 1968), which is currently used throughout the world.
However, the widespread use of SAM started in the 1980s as a result of efforts to integrate the
“social” with the “economic” dimension in policy analysis. The SAM provides a framework that
integrates detailed data on production, income and expenditure, thereby allowing a systematic
recording of economic transactions for the study of growth and its distribution in a particular
country (Mohora, 2006). Further, a SAM also enables inter alia the identification of structural
relationships between the economic agents. In the SAM the economic agents are usually
classified according to the main institutional sectors3: non-financial corporations sector, financial
corporations sector, households sector, government sector and the rest of the world (external)
sector. The performance of each institutional sector is analysed in terms of, e.g. its contribution to
net value added, expenditure, disposable income and net saving. In addition, the current external
balance of the economy can be derived within the SAM. More important, the SAM represents a
consistent framework, which gives a “snapshot” of the economy. It provides a clear picture of the
structure of the economy at a particular point in time as well as the core data for a general
equilibrium model.
Economic and social systems, subject to an increasing complexity and interdependence, require
policy analysts to have high quality and reliable observations in order to properly explain,
conceptualise, understand and make meaningful the underlying dynamics of the scientific
material. Otherwise, unreliable and biased data can result in seriously distorted (if not altogether
wrong) policy recommendations. The SAM is the framework that challenges (most of) these
constraints.
In order to have a complete picture of transactions taking place in an economy, real accounts are
not sufficient and need to be complemented with financial accounts.
Financial accounts form an important tool for analysing financial flows taking place between
well-defined institutional sectors within the economy (non-financial corporations, financial
corporations, government and households), between institutional sectors and the rest of the world,
3 ESA95 classification of main institutional sectors has been used for this disaggregation.
8
and for assessing financial interrelationships within the economy and vis-à-vis the rest of the
world at a particular point in time. Because of their link to capital and use of income accounts,
financial accounts are an important instrument to monitor the transmission process of monetary
policy. The completeness of financial accounts enables the analysis of monetary aggregates as
well as the analysis of longer-term financial investments and sources of finance. Consequently,
the financial accounts provide a way of examining the financial effects of economic policy and
assistance for decisions regarding future policy. The accounts can be used to investigate factors
influencing the transactions in different types of financial instruments (i.e. changes in interest
rates). For financial institutions, these accounts show the large amounts of funds which are
channelled through them as financial intermediaries. The scale of this makes it important to be
aware of changes in their sources of funds and in the use of those funds. The transactions of the
financial institutions reflect the liquidity, current and capital expenditure of other sectors, and the
financing of the government sector net cash requirement (EC and Eurostat, 2002).
Further, the financial balance sheets (another tool of financial accounts), show the financial
wealth of each sector of the economy at a particular point in time. The changes from previous
balance sheets illustrate both the change in the valuation of different instruments as stock markets
move and as currency exchange rates change, but also the changing portfolios resulting from the
financial transactions of the sectors. This allows measuring “wealth effects” through the change
in assets‟ market prices. Regarding the structure of financial markets, the balance sheets can be
used to measure: the share of different financial instruments for different sectors, the share of
different sectors for different financial instruments, the degree of marketability of financial
instruments and the degree of financial intermediation (EC and Eurostat, 2002).
This paper describes the construction of a financial SAM for Luxembourg for the year 2007 by
integrating both real and financial accounts. This SAM is used to analyse the structure of the
economy of Luxembourg and to provide the benchmark data set for a financial computable
general equilibrium (CGE) model. Even if the construction of the financial CGE model and the
financial SAM can be presented separately, in line with the normal practice in CGE modelling,
they are very often built simultaneously. By doing so, the financial CGE model can be
constructed while taking into account both the data limitations and the specific characteristics of
the economy.
The SAM presented in this paper is the first financial SAM built for the Luxembourg economy.
The real SAM has been constructed by the national statistical office (Adam et al., 2010) for the
year 2004. However, it should be emphasised at this stage that the present financial SAM for
Luxembourg for 2007 has been built from scratch and independently of the 2004 real SAM, as it
incorporates different sectoral disaggregation (putting more emphasis on financial sectors) as well
as detailed current and capital account transactions between institutional sectors. Introducing
financial accounts in a SAM is inevitable when analysing the Luxembourg economy, as the
financial sector represented around 30 percent of the gross value added during the last decade.
9
The reference year 2007 for a financial SAM has been chosen for three main reasons. First, it is
the most recent year for which the required data (relatively complete national accounts) were
available with little needs for revision. Second, it represents the most recent year without any
major external or internal shock to the economy. Third, given the macroeconomic instability
(economic and financial crisis) observed in the three most recent years - 2008, 2009 and 2010 -
the data for this period are not suitable for the calibration of the model. Choosing 2007 as the
reference year allows us to analyse adequately the impact of the financial crisis on the
Luxembourg economy compared to the pre-crisis environment.
For the construction of the financial SAM, October 2011 EDP (Excess Deficit Procedure)
notification has been used for real accounts and July 2011 quarterly publication for financial
accounts. This practice allowed having harmonised real and financial accounts. Unfortunately,
October 2011 publication of financial accounts could not be used in this paper as the Statistical
National Office (Statec) did not harmonise the real and financial accounts. Discrepancies between
both remain significant and could not be justified as statistical discrepancies.
The remaining part of this paper is organised as follows. First, some theoretical aspects regarding
the real and the financial accounts of the SAM are presented and their conceptual framework is
discussed (section 2). Section 3 presents the construction of the financial SAM for Luxembourg
for 2007, which serves as a benchmark data set for a financial CGE model. Some characteristics
of Luxembourg‟s economy are also discussed within a separate presentation of the real and
financial accounts in order to facilitate an analysis and a presentation of accounts. Finally, some
concluding remarks are presented in section 4.
2 What is social accounting matrix (SAM)?
A social accounting matrix (SAM) is a matrix presentation of the ESA95 accounts which
elaborates the linkages between supply and use tables and the sector accounts. SAMs typically
focus on the role of people in the economy, which may be reflected by inter alia extra
breakdowns of the household sector and a disaggregated representation of labour markets
(Eurostat and European Commission, 1996). They are foreseen and described in the European
and International methodologies of national accounts [see ESA95, §8.100 and following (Eurostat
and European Commission, 1996); SNA93, §20.3 and following (United Nations, 1993); and
SNA08, §28.71 and following (United Nations, 2008)].4
4 The SAM structure presented in this paper is slightly different from the reference structure indicated in
the above mentioned references, and this in order to have the desired disaggregation for the financial
general equilibrium model that this data base is built for. The following statement from SNA08 (United
Nations, 2008, p.37) shows that this is perfectly in line with a common practice “A social accounting
matrix (SAM) is a presentation of the SNA in matrix terms that permits the incorporation of extra details of
special interest. To date, builders of SAMs have exploited the flexibility to highlight special interests and
concerns ... The power of a SAM, ... comes from choosing the appropriate type of disaggregation to study
the topic of interest. In addition to a flexible application, SAMs may incorporate more extensive
adjustments, which are of a satellite accounting nature, in order to serve specific analytical purposes.”

10
A SAM usually encompasses a somewhat less detailed supply and use table or input-output (IO)
table. A clear distinction must be drawn between the IO table and the SAM. The essence of the
IO table is the way industries are interrelated through transactions, while the SAM also presents
the transaction and the transfers between the different types of economic agents such as firms,
government, households and the rest of the world (Pyatt, 1999). In other words, a SAM is a
comprehensive, economy-wide-data framework, typically representing the economy of a nation
and also providing the link between the economy and the rest of the world in terms of trade flows.
A SAM has two principal objectives. The first is concerned with the organisation of information,
usually information about the economic and social structure of a country in a particular year,
though it could just as well be about the region of a country, a city, or any other unit one might be
interested in. The unit of time is arbitrary but is usually a year. It is recognised as a sound
descriptive and synoptic framework of an economy (Pyatt and Round, 1985). Furthermore, the
structure and disaggregation of the SAM depends on the national socio-economic structure,
modelling needs, and availability of data and resources.
Once the data in a particular country for a particular year have been organised in the form of a
SAM, it presents a static image which can reveal much about the country‟s economic structure.
Even so, the image is only a “snapshot”. In order to analyse how the economy works and to
predict the effects of policy interventions, more is needed than just a static image. A model of the
economy has to be created. This is the second objective of a SAM: to provide the statistical basis
for the creation of a plausible model.
Historically, the design of a statistical information system such as SAM has evolved from the
combination of two ideas: the matrix presentation of national income accounts, reflecting the
Keynesian model of the markets for goods and services, and the input-output model of the
structural interdependence of production in the economy. The Keynesian model divides economic
activity into three categories: production; income and expenditure; and accumulation.
A SAM is presented as a square matrix designed to provide a record of details of market
transactions between different economic agents, using a single entry-form of booking. It can be
represented as (Pyatt, 1988):
[ ]ijT t (1)
where i is the number of row and j the number of the column. By convention, resources are
shown in the rows and expenditures are shown in the columns. According to this convention, ijt is
the value of all receipts of i from j during the accounting period. Correspondingly, jit measures
payments to j by i .
11
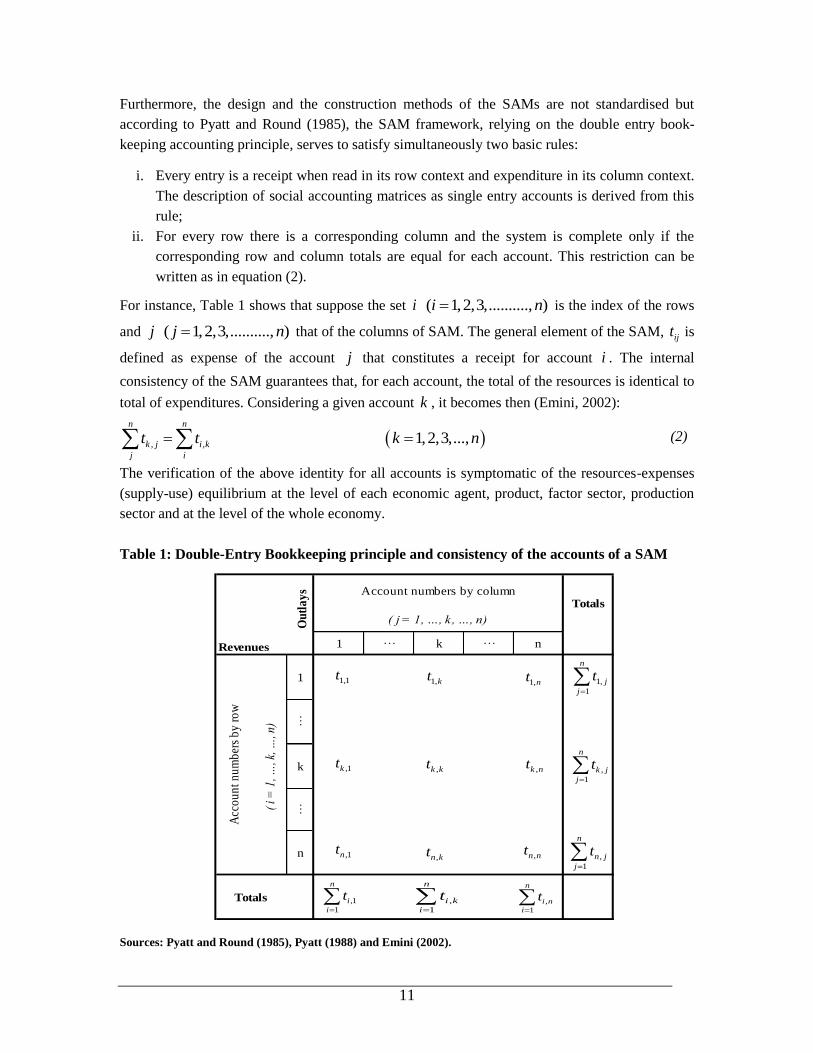
Furthermore, the design and the construction methods of the SAMs are not standardised but
according to Pyatt and Round (1985), the SAM framework, relying on the double entry book-
keeping accounting principle, serves to satisfy simultaneously two basic rules:
i. Every entry is a receipt when read in its row context and expenditure in its column context.
The description of social accounting matrices as single entry accounts is derived from this
rule;
ii. For every row there is a corresponding column and the system is complete only if the
corresponding row and column totals are equal for each account. This restriction can be
written as in equation (2).
For instance, Table 1 shows that suppose the set i ( 1,2,3,.........., )i n is the index of the rows
and j ( 1,2,3,.........., )j n that of the columns of SAM. The general element of the SAM, ijt is
defined as expense of the account j that constitutes a receipt for account i . The internal
consistency of the SAM guarantees that, for each account, the total of the resources is identical to
total of expenditures. Considering a given account k , it becomes then (Emini, 2002):
, ,
n n
k j i k
j i
t t 1,2,3,...,k n (2)
The verification of the above identity for all accounts is symptomatic of the resources-expenses
(supply-use) equilibrium at the level of each economic agent, product, factor sector, production
sector and at the level of the whole economy.
Table 1: Double-Entry Bookkeeping principle and consistency of the accounts of a SAM
1 … k … n
1
…
k
…
n
Totals
Ou
tla
ys
Acc
ou
nt
nu
mb
ers
by
ro
w
( i
= 1
, …, k
, …, n
)
Totals
Revenues
Account numbers by column
( j = 1, …, k, …, n)
1,
1
n
j
j
t
,
1
n
k j
j
t
,
1
n
n j
j
t
,1
1
n
i
i
t
,
1
n
i k
i
t
,
1
n
i n
i
t
1,1t1,kt
1,nt
,1kt ,k kt ,k nt
,1nt ,n kt ,n nt
Sources: Pyatt and Round (1985), Pyatt (1988) and Emini (2002).

12
The three different ways of compiling GDP –production, expenditure and income approaches –
can be used in the SAM. In other words, SAM has to satisfy all three approaches to be in
equilibrium and fully correct.
The information needed to build a SAM comes from a variety of sources, such as national
accounts, household surveys, government budgets, banking statistics and the balance of
payments. Placing these data within a SAM framework almost always (especially in developing
countries) reveals inconsistencies between the incomes and expenditures of each account. A
number of statistical estimation techniques exist to balance SAM accounts or reconcile incomes
and expenditures. Cross entropy (Robinson et al, 1998, 2000a and 2000b) or RAS approaches
(Bacharach, 1970; Günlük-Şenesen and Bates, 1988; and Gilchrist and St Louis, 1999) are the
most widely used methods.
A SAM can be distinguished either by size, macro (aggregated) or micro (disaggregated), or by
the nature of accounts, real or financial. In section 3, the construction of macro and micro SAMs
(with real and financial accounts) for Luxembourg is presented in detail.
13
2.1 Real SAM
Accounts involved in a SAM may be real and/or financial. Real accounts are used to depict the
circularity of real flows of the economy capturing all transfers and real transactions between
sectors and institutions. Six major types of accounts headings are distinguished in a real SAM: (i)
production activities, (ii) commodities, (iii) factors of production, (iv) current account of
domestic institutions, (v) capital account of institutions (savings-investment) and (vi) external
sector. Depending on analytical requirements, availability of disaggregated data, challenging
problem raised in the analysis or analytical requirements, some additional accounts can be
introduced and each account can be disaggregated or aggregated.
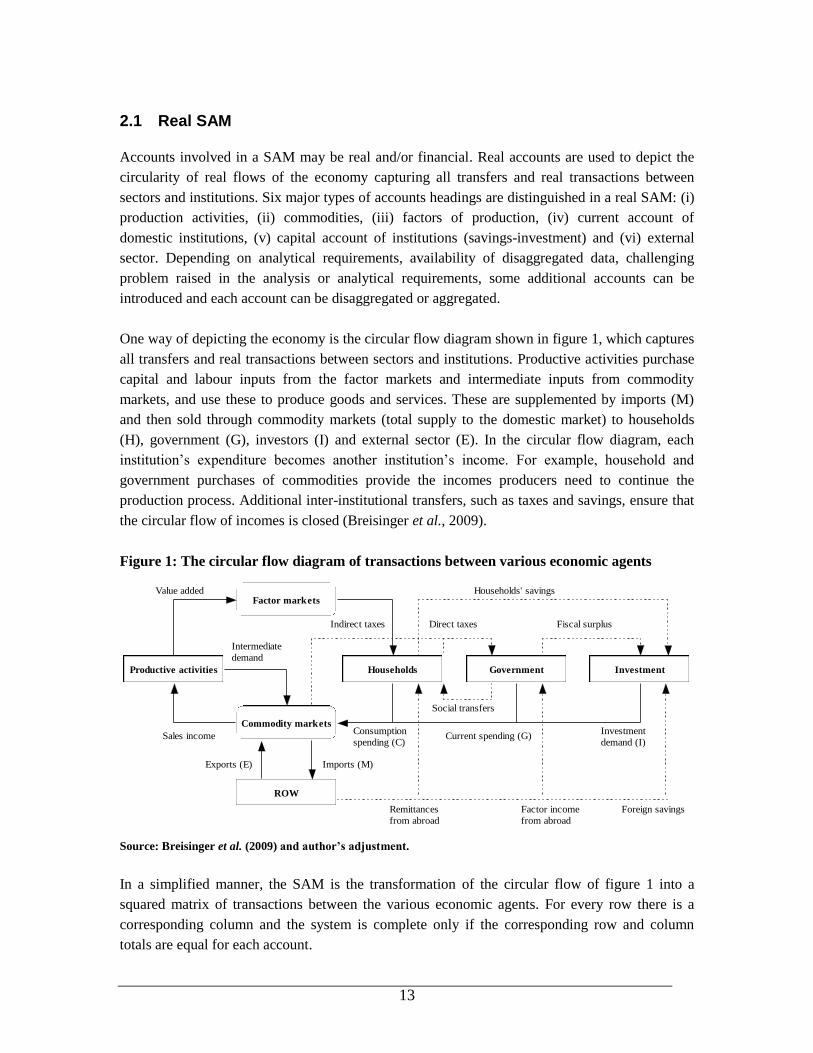
One way of depicting the economy is the circular flow diagram shown in figure 1, which captures
all transfers and real transactions between sectors and institutions. Productive activities purchase
capital and labour inputs from the factor markets and intermediate inputs from commodity
markets, and use these to produce goods and services. These are supplemented by imports (M)
and then sold through commodity markets (total supply to the domestic market) to households
(H), government (G), investors (I) and external sector (E). In the circular flow diagram, each
institution‟s expenditure becomes another institution‟s income. For example, household and
government purchases of commodities provide the incomes producers need to continue the
production process. Additional inter-institutional transfers, such as taxes and savings, ensure that
the circular flow of incomes is closed (Breisinger et al., 2009).
Figure 1: The circular flow diagram of transactions between various economic agents
Productive activities
ROW
Households Government Investment
Factor markets
Commodity markets
Households' savings
Remittances
from abroad
Factor income
from abroad
Foreign savings
Fiscal surplusDirect taxesIndirect taxes
Intermediate
demand
Sales income
Exports (E) Imports (M)
Consumption
spending (C)
Social transfers
Current spending (G)Investment
demand (I)
Value added
Source: Breisinger et al. (2009) and author’s adjustment.
In a simplified manner, the SAM is the transformation of the circular flow of figure 1 into a
squared matrix of transactions between the various economic agents. For every row there is a
corresponding column and the system is complete only if the corresponding row and column
totals are equal for each account.
14
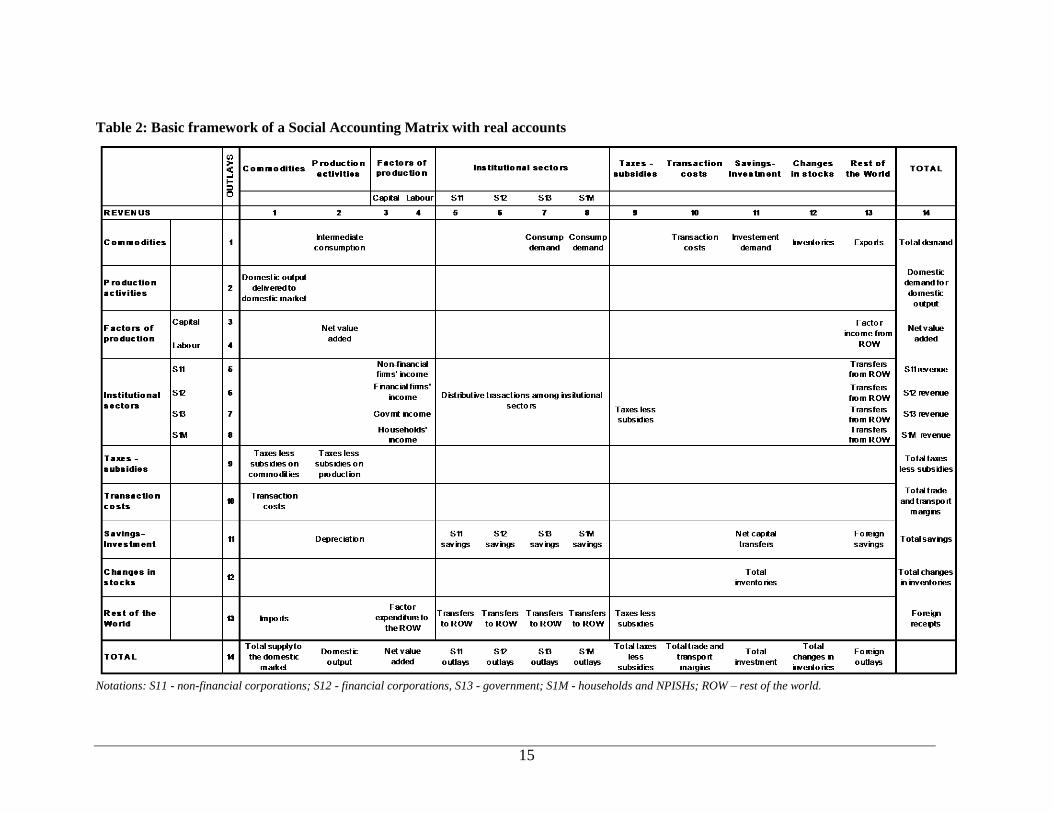
A conceptual SAM is presented in Table 2. The two first rows and columns: commodities and
production activities represent an aggregate supply and use tables specifically linked with other
national accounts.
The first column (Table 2) reflects total supply of commodities to the domestic market. Total
supply is given by a part of domestic output delivered to the domestic market valued at basic
prices, cell (2,1), and imports from the external sector, cell (13,1). Taxes less subsidies on
commodities are registered in cell (9,1), and transaction costs in cell (10,1). The first row shows
total demand for commodities at purchaser‟s prices, used for intermediate consumption in the
production process, cell (1,2), for final consumption, by the government, cell (1,7), by the
households, cell (1,8), for transaction costs, cell (1,10), demand for investment commodities, cell
(1,11), inventories (1,12), and exports (1,13). Purchaser‟s prices compared to the basic prices
include taxes (excluding deductible taxes) less subsidies and transport margins paid by
consumers. To keep total demand for commodities (the row total) equal to total supply of
commodities to the domestic market (the column total), the balance of taxes and subsidies and the
transaction costs by product have to be recorded in the column of first account (Eurostat and
European Commission, 1996).
The second column records the intermediate consumption used in the production process, net
value added at factor costs generated by use of capital, cell (3,2), and labour, cell (4,2), taxes less
subsidies on production paid to a tax collection account, cell (9,2), and consumption of fixed
capital (depreciation), cell (11,2). The value added at factor costs is not a concept in the ESA95,
but can be derived by subtracting taxes (on capital and labour) less subsidies on production from
the value added at basic prices (Eurostat and European Commission, 1996). The column gives
domestic output at basic prices, cell (14,2) which is row-wise supplied to the domestic market,
cell (2,1).
The total of the third and the fourth rows gives net value added at factor costs, which reflects the
value newly created in the production process by the use of capital and labour (factors of
production), cells (3-4,2), and the factor income from the ROW, cells (3-4,13). The remuneration
of capital and labour of non-financial corporations, financial corporations, government and
households is reflected in the third and fourth columns, cells (5-8,3-4). Factor expenditure to the
ROW is given in cells (13,3-4), and it reflects the remuneration of capital and labour that is
provided to the non-residents in the economy.
Each group of economic agents - represented through institutional accounts following ESA95
principals - has its own row, booking the revenues, and its own column, booking the expenditures
during the accounting period. The institutional accounts are disaggregated as follow: non-
financial corporations, financial corporations, government and households (that include NPISHs).
15
Table 2: Basic framework of a Social Accounting Matrix with real accounts
Notations: S11 - non-financial corporations; S12 - financial corporations, S13 - government; S1M - households and NPISHs; ROW – rest of the world.
16
The fifth and sixth rows show the income received by the non-financial and financial corporations
sectors, respectively, for providing capital in the production process, cells (5-6,3), as well as
transfers received from the institutional sectors, cells (5-6,5-8). These transfers include: property
income, current taxes on income and wealth (except corporate taxes), social contributions and
benefits (except social contributions), other current transfers, and finally, adjustment for the
change in net equity of households in pension funds reserves5. Corporate taxes, representing taxes
on capital, and social contributions, representing taxes on labour, or in other words taxes on
production, are included in the tax collection account. The non-financial and financial
corporations sectors use their income, respectively, to make transfers to the institutional sectors,
cells (5-8,5-6), and to the external sector, and to save, cells (11,5-6).
Further, the government sector receives tax revenues from the income of capital factor of
production, cell (7,3), transfers from other institutional sectors (including taxes on income and
wealth mostly paid by households), cells (7,5-8) and from the tax collection account, cell (7,9).
The latter consists of taxes on commodities and on production. It uses those revenues to consume,
to make transfers to other institutional sectors, cells (5-8,7) and to the ROW, cell (13,7) and to
save, cell (11,7). The ninth row books most of the tax revenues, mostly taxes on commodities and
on production. The use of a separate account for taxes and subsidies appears to be useful when
analysing the effects of alternative fiscal scenarios. The households sector account records on the
row the income from the capital and labour provided to the production sectors, cells (8,3-4), and
transfers from the institutional sectors, cells (8,5-8), and the rest of the world, cell (8,13). Further,
the households use their total income for final consumption, for transfers to institutional sectors
(including the payment of taxes on income and wealth to government), cell (8,5-8), and for
saving, cell (11,8).
The savings-investment account presents, in row eleven, the consumption of fixed capital, the
savings of non-financial corporations, financial corporations, government, households and the
external sector, as well as net receivable capital transfers, cell (11,11). In the column, demand for
investment goods is provided at purchaser‟s prices. The changes in stocks account gives the
demand for inventories at purchaser‟s prices in cell (1,12), and is further balanced through
savings-investment account, cell (12,11).
Finally, the external account shows the domestic economy‟s imports, factor payments to the
ROW, transfers of institutional sectors to the ROW, as well as taxes and subsidies provided by
the production sectors (transfer to the EU budget) in row twelve, which represents an income for
the foreign sector, and exports supply to the ROW, factor income, transfers from institutional
sectors, and the foreign savings in the column. Foreign savings, when interpreted from the
standpoint of the domestic economy, reflect the surplus/deficit of current account.
5 In the remaining part of this section the transfers from or to the institutional sectors always refer to these
taxes.

17
2.2 Financial SAM
The SAM can be classified as real SAM and financial SAM, where the former records only the
transactions of the real activities of the economic institutions and the latter not only records the
real transactions but also the transactions taking place in the financial markets. Therefore, in the
financial SAM, non-financial and financial corporations, government, households and agents
from the ROW engage in transactions related to the real-side of the economy but they also own
assets and incur liabilities. In this section, these additional rubrics of accounts - financial accounts
- to be associated with the real accounts are presented, and this so as to obtain a complete set of
accounts that represent financial SAM. Financial accounts described in this section follow ESA95
classification and accounting rules.
In general, financial accounts are an integral part of the system of national accounts. The primary
function of the system of national accounts is to schematically dissect the complex workings of
the economy and its basic components and thereby to facilitate the task of economic analysis. The
financial flows account supplements this picture by adding those transactions which occur in the
financial sphere (Deutsche Bundesbank, 2010). The consistent, homogenous and comprehensive
set of financial accounts provides a useful overview of the main financial flows in the economy,
as well the main risks and interdependencies between sector and financial instruments (Bê Duc
and Le Breton, 2009).
The financial account deals with the financial transactions (in financial assets and liabilities)
taking place between institutional units (non-financial corporations, financial corporations,
government and households), and between them and the rest of the world (Eurostat and European
Commission, 1996). It shows on its left side acquisitions less disposals of financial assets, while
its right side shows the incurrence of liabilities less their repayment6. In other words, the financial
account shows how the surplus or deficit on the capital account is financed by transactions in
financial assets and liabilities. Thus, the balance of the financial account (net acquisition of
financial assets less net incurrence of liabilities) is equal in value to net lending/net borrowing,
the balancing item of the capital account (European Commission and Eurostat, 2002). The
financial transactions are summarised and recorded systematically in the financial account. The
financial account also indicates how net borrowing sectors obtain resources by incurring
liabilities or reducing assets, and how net lending sectors allocate their surpluses by acquiring
assets or reducing liabilities. The account also shows the contributions to these transactions of the
various types of financial assets, and the role of financial intermediaries (European Commission
and Eurostat, 2002). Finally, its purpose is also to provide figures on the net worth – i.e. assets
minus liabilities – of institutional sectors (Lequiller and Blades, 2006).
6 Each financial asset (owned by the creditor) has a counterpart liability (issued by the debtor), with the
exception of monetary gold and special drawing rights (ESA95 F1).
18
Furthermore, the financial account is the final account, in the full sequence of accounts that
records the transactions. Thus, the financial account does not have a balancing item that is carried
forward to another account. In the system, by definition, the balancing item of the financial
account is identical with the balancing item of the capital account. In practice, a divergence will
usually be found between them because they are calculated on the basis of different statistical
data. This divergence is known as a “statistical discrepancy” and its existence explain why the
ESA95 B9 account of the non-financial accounts is sometimes coded “B9A” and that of the
financial accounts “B9B” (or called “net financial transactions”) so as to differentiate them. For
example, in the European Union, only the government sector does not have a statistical
discrepancy between B9A and B9B accounts, thanks to the quality and consistency of the
information available for the accounts of this particular sector7
The adjunction of financial assets and liabilities in a SAM with the real accounts requires two
additional accounts: the capital accounts belonging to economic agents on the one hand, and
financial assets (or liabilities) accounts themselves, on the other hand (Emini, 2002).
1. The capital accounts
In a financial SAM, it is consequential that each agent has two types of accounts: a current
account as in real SAM, and a capital account. Admittedly, in the real SAM, there is already an
accumulation account that behaves as a capital account. However, this account is usually unique
for all the economic agents represented in the SAM. Although it distinctly records, in row, the
savings of each agent, in column on the contrary it gives only the total investment of the aforesaid
agents and thus does not account for the participation of each one of these agents in the Gross
Fixed Capital Formation (GFCF). In addition, this capital account records only the flows of
physical capital and the resources received by the agents. The creation of a distinct capital
account for each agent then allows keeping details of the agent‟s different resources, as well as
the various assets (physical and/or financial) the latter holds as counterparts of those resources or
liabilities. Moreover, it is not customary to distinguish non-financial corporations from financial
corporations in a real SAM. In order to portray the financial features and mechanisms, it is
henceforth paramount to insure that this distinction is drown when it comes to SAM with
financial accounts, so that each of the non-financial and financial firms as well has its pair made
of “current account” and “capital account”.
2. The financial assets and liabilities accounts
The financial assets and liabilities accounts keep details on the nature and the structure of
financial resources and uses of economic agents. The categories of financial assets introduced
into a SAM depend on the problems studied, on the availability of data as well as on the financial
practice of the modelled economy. The latter can range from fiduciary currencies to foreign
engagements, passing through bank deposits, capital shares, public bonds, bank credits,
commercial bank reserves, advances of the central bank to the Treasury, central bank refinancing,
etc. These assets can be recorded in a SAM in terms of stocks and (or only) in terms of flows. If
7 The governments are closely monitored by the European Commission and Eurostat during the EDP
procedure that takes place twice a year (in April and October).
19
the stocks are introduced into the SAM, in addition to the flow accounts, two other accounts are
to be created for each category of assets: an account for the opening-book-inventories and another
for the ending-book-inventories.
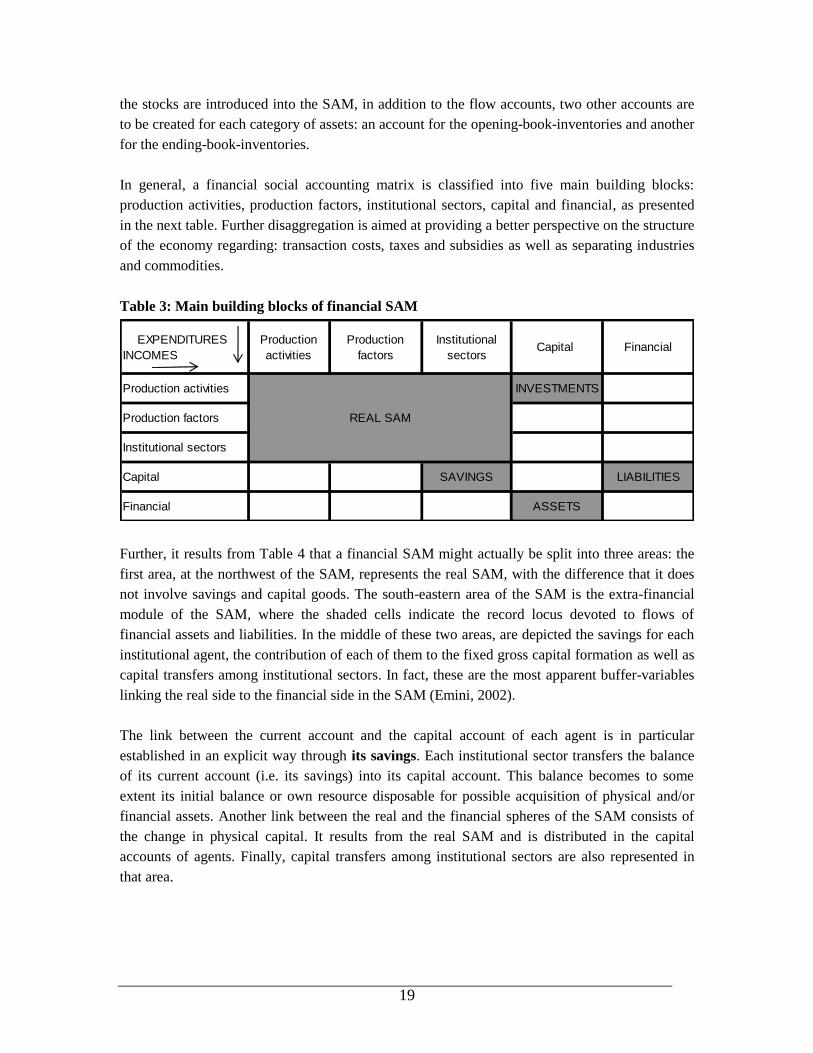
In general, a financial social accounting matrix is classified into five main building blocks:
production activities, production factors, institutional sectors, capital and financial, as presented
in the next table. Further disaggregation is aimed at providing a better perspective on the structure
of the economy regarding: transaction costs, taxes and subsidies as well as separating industries
and commodities.
Table 3: Main building blocks of financial SAM
EXPENDITURES
INCOMES
Production
activities
Production
factors
Institutional
sectorsCapital Financial
Production activities INVESTMENTS
Production factors
Institutional sectors
Capital SAVINGS LIABILITIES
Financial ASSETS
REAL SAM
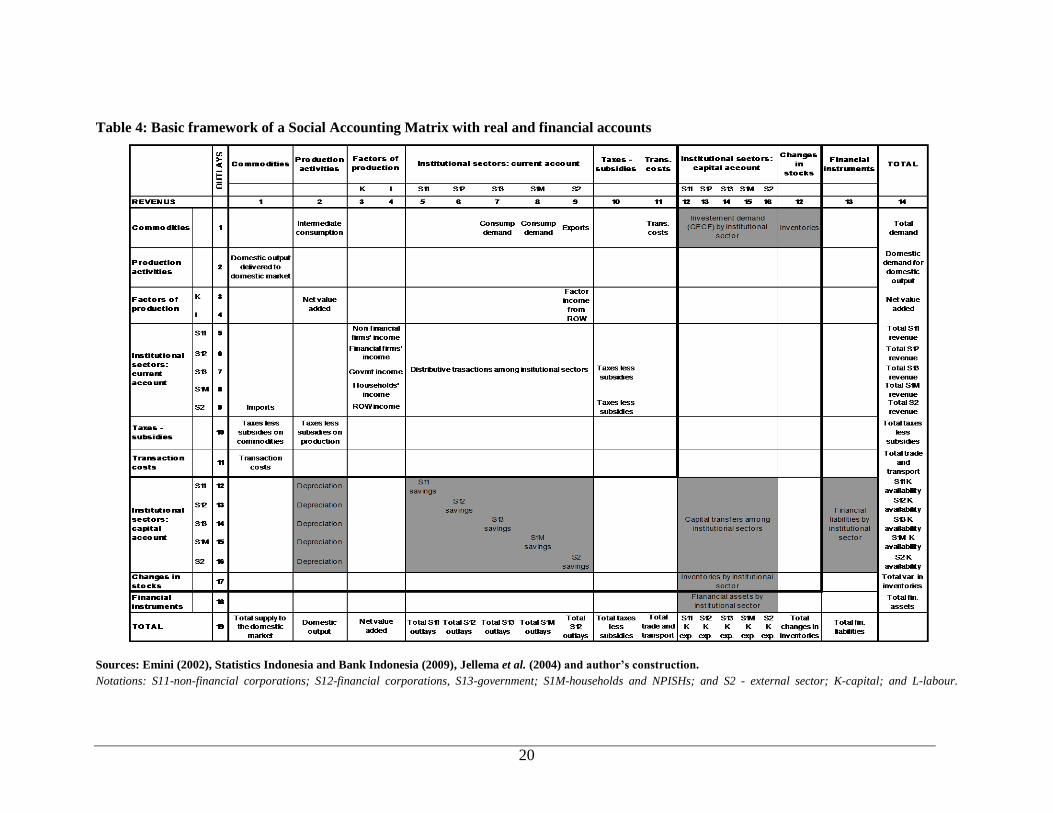
Further, it results from Table 4 that a financial SAM might actually be split into three areas: the
first area, at the northwest of the SAM, represents the real SAM, with the difference that it does
not involve savings and capital goods. The south-eastern area of the SAM is the extra-financial
module of the SAM, where the shaded cells indicate the record locus devoted to flows of
financial assets and liabilities. In the middle of these two areas, are depicted the savings for each
institutional agent, the contribution of each of them to the fixed gross capital formation as well as
capital transfers among institutional sectors. In fact, these are the most apparent buffer-variables
linking the real side to the financial side in the SAM (Emini, 2002).
The link between the current account and the capital account of each agent is in particular
established in an explicit way through its savings. Each institutional sector transfers the balance
of its current account (i.e. its savings) into its capital account. This balance becomes to some
extent its initial balance or own resource disposable for possible acquisition of physical and/or
financial assets. Another link between the real and the financial spheres of the SAM consists of
the change in physical capital. It results from the real SAM and is distributed in the capital
accounts of agents. Finally, capital transfers among institutional sectors are also represented in
that area.
20
Table 4: Basic framework of a Social Accounting Matrix with real and financial accounts
Sources: Emini (2002), Statistics Indonesia and Bank Indonesia (2009), Jellema et al. (2004) and author’s construction.
Notations: S11-non-financial corporations; S12-financial corporations, S13-government; S1M-households and NPISHs; and S2 - external sector; K-capital; and L-labour.

21
As indicated above, in order to take into account the financial variables and mechanisms of the
financial CGE model, two rubrics of accounts are associated to the real SAM. The first rubric
involves at least six capital accounts at a rate of one capital account per institutional agent and
changes in stocks account. The second rubric consists of a certain number of flow accounts that
are assigned to the same number of financial categories of assets/liabilities implicated in the
economy.
Table 5 indicates the general financial assets/liabilities (instruments) used in the European Union
member countries (following ESA95 principles). These have been ordered according to their
degree of “liquidity”8.
Table 5: Financial instruments
(Net acquisition of financial assets/net incurrence of liabilities)
∆ Assets ∆ Liabilities
F1. Monetary gold and SDRs F1. Monetary gold and SDRs
F2. Currency and deposits F2. Currency and deposits
F3. Securities other than shares F3. Securities other than shares
F4. Loans F4. Loans
F5. Shares and other equity
(including investment funds)
F5. Shares and other equity
(including investment funds)
F6. Insurance technical reserves
F7. Other accounts receivable F7. Other accounts payble
B9B. Net lending/net borrowing Source: Lequiller and Blades (2006).
The complete financial accounts indicate the financial flows, revaluation (and the accounts
showing other changes in assets) and financial balance sheet accounts (indicating the stocks) for
all the institutional sectors (non-financial corporations, financial corporations, government,
households and the ROW agents). Taken together, these accounts show for each institutional
sector the details of the financial counterpart of its net lending/net borrowing and the composition
of its financial net worth.
As it might be expected, these accounts are particularly detailed for the financial corporations,
which play a critical role in the management of the financial relations and constitute the prime
statistical course for the financial accounts. Further, all the changes in the price of assets are
recorded in a “revaluation account”. As on the asset side the cash holdings (or on the liability side
the loans) are not subject to revaluation, no revaluations are required for these.
The institutional sectors group together the institutional units (defined as entities – such as
individual households or firms – that are characterised by their decision-making autonomy) with
other units that display a similar type of economic behaviour. According to ESA95 principles,
seven main institutional sectors are defined in the national accounts: non-financial corporations;
8A financial term measuring the rapidity and facility with which an asset can be transformed into cash or
another generally accepted means of payment: a bank account is highly liquid, but a share is less liquid
because it first has to be sold, requiring payment of a commission).
22
monetary financial institutions; insurance corporations and pension funds; other financial
intermediaries (including in particular investment funds); general government9; households; and
non profit institutions serving households. These main sectors can be further split into sub-
sectors. In addition, the financial relations between domestic sectors and the rest of the world are
reported in the rest of the world account.
The net worth of the various agents, in particular households, is not made up solely of financial
assets and liabilities but also includes non-financial assets. For the household sector, non-
financial assets include dwellings and in some countries assets in the form of housing are greater
than households‟ financial assets. The value of the non-financial assets (also called “capital
stock”) is usually estimated by the perpetual inventory method (PIM). The PIM method is based
on data for past flows of gross fixed capital formation in volume and applies the simple principle
that today‟s stock is equal to what was previously invested minus what has since been used up.
Then, the balance sheet accounts - defined as a synthesis of the tables of financial and non-
financial stocks for the various institutional sectors – allow a visualisation in a single table of all
the assets and liabilities of each sector and hence the measurement the total wealth of
macroeconomic agents at a given time. The estimates are made at market prices and hence
provide the best measure of this wealth at this date. The estimation of this wealth is nevertheless
limited to the items that the national accountants consider as eligible to be considered as assets or
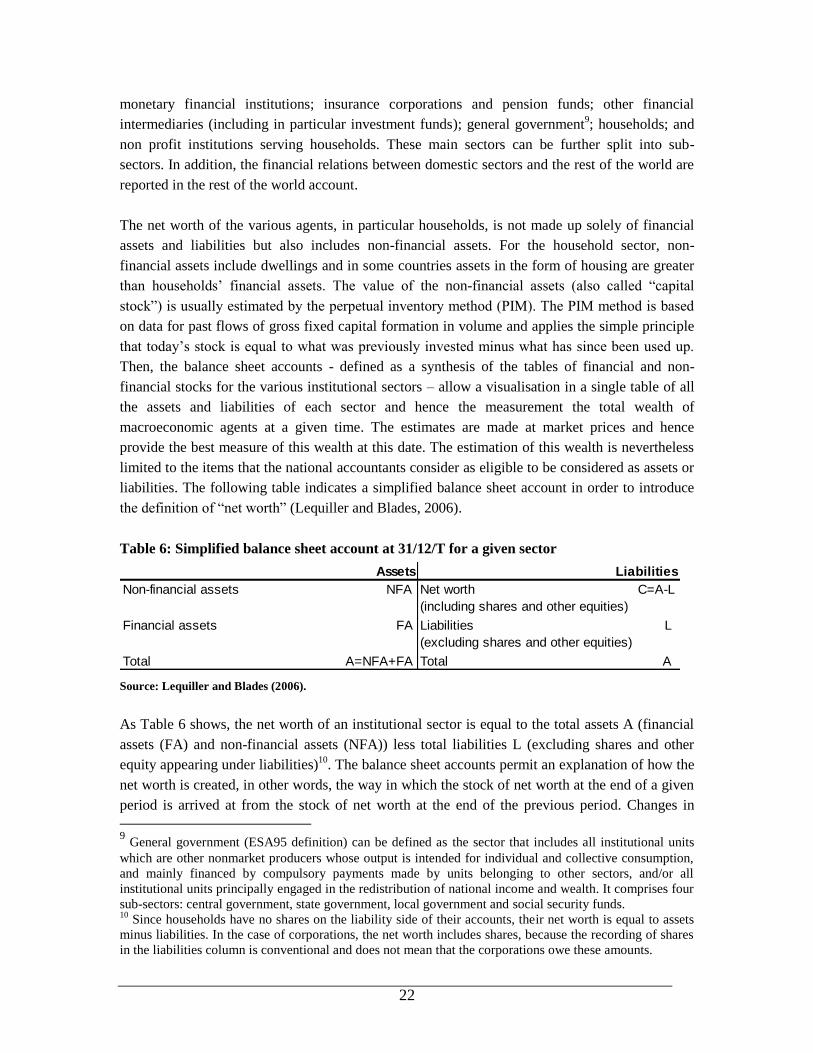
liabilities. The following table indicates a simplified balance sheet account in order to introduce
the definition of “net worth” (Lequiller and Blades, 2006).
Table 6: Simplified balance sheet account at 31/12/T for a given sector
Assets Liabilities
Non-financial assets NFA Net worth C=A-L
(including shares and other equities)
Financial assets FA Liabilities L
(excluding shares and other equities)
Total A=NFA+FA Total A
Source: Lequiller and Blades (2006).
As Table 6 shows, the net worth of an institutional sector is equal to the total assets A (financial
assets (FA) and non-financial assets (NFA)) less total liabilities L (excluding shares and other
equity appearing under liabilities)10
. The balance sheet accounts permit an explanation of how the
net worth is created, in other words, the way in which the stock of net worth at the end of a given
period is arrived at from the stock of net worth at the end of the previous period. Changes in
9 General government (ESA95 definition) can be defined as the sector that includes all institutional units
which are other nonmarket producers whose output is intended for individual and collective consumption,
and mainly financed by compulsory payments made by units belonging to other sectors, and/or all
institutional units principally engaged in the redistribution of national income and wealth. It comprises four
sub-sectors: central government, state government, local government and social security funds. 10
Since households have no shares on the liability side of their accounts, their net worth is equal to assets
minus liabilities. In the case of corporations, the net worth includes shares, because the recording of shares
in the liabilities column is conventional and does not mean that the corporations owe these amounts.
23
stocks can be due to several factors: consumption of fixed capital, actual changes in non-financial
and financial assets, revaluations and other changes in volume. Considered together, these
changes lead to the table on balance sheet accounts.
3 Building a financial SAM for Luxembourg
As already mentioned in the introduction of this paper, this is the first financial SAM built for
Luxembourg. The national statistical office (Adam et al., 2010) has built a SAM with real
accounts for the year 2004. Usually, given the amount of work needed to build a new SAM from
scratch, SAMs are typically derived by updating old ones on the basis of non-survey techniques
and fragmentary new data. Therefore, it should be emphasised at this stage that the present SAM
for Luxembourg for the year 2007 has been built from scratch and independently of the 2004
real11
SAM as it incorporates different sector disaggregation (putting more emphasis on financial
sectors) as well as detailed current and capital account transactions between institutional sectors
that have been published for the first time in April 2011 (Statec, 2011b).
The financial SAM developed in this paper serves two purposes. First, it helps in understanding
the structure of the economy of Luxembourg and its main characteristics. Second, it provides a
comprehensive database for the financial CGE model. Most of the parameters used in such model
are directly derived from the financial SAM, while some other parameters such as elasticities of
substitution are drawn from the literature.
Several sources of data for building the financial SAM for Luxembourg have been used. The
major sources for real accounts are the national accounts (Statec, 2011d), the non-financial
institutional accounts for distributive transactions among institutional sectors12
and the use and
supply tables for 2007 (Statec, 2010b). It should also be mentioned at this stage that a significant
amount of very detailed unpublished data has been directly transmitted to the author by Statec, as
these data are not part of official programme of publications of the latter institution (i.e. the
disaggregated data by commodity and by production activity or detailed data regarding
distributive transactions among institutional sectors: whom-to-whom). Other sources of data have
been the Ministry of Finance, Administration of direct taxation (Administration des contributions
directes) and Administration of indirect taxation (Administration de l‟enregistrement et des
domaines). For financial accounts, the principal source has been the financial accounts data
elaborated together by the Central Bank of Luxembourg (“Banque centrale du Luxembourg”) and
the national statistical office (Statec, 2011b and 2011c).
11
Documentation about the SAM with real accounts for the year 2004 built by Statec is very limited (see
Adam et al., 2010). 12
The full sequence of non-financial institutional accounts has been published by the national statistical
office for the first time only in April 2011. Luxembourg was the only European Union Member State not
compiling these accounts.
24
As previously mentioned, the design and the construction methods of the SAMs are not
standardised. However, a SAM should satisfy two conditions: the matrix must be square and the
row total and column total for each account must be equal. Due to the use of the same sources of
data and very small statistical discrepancies, the financial SAM for Luxembourg was balanced
without needing to use any balancing method in order to fulfil the requirement that the row total
and column total for each account should be equal. The fully balanced SAM with real accounts
(macro and micro) and fully balanced SAM with financial accounts (macro and micro) are
provided in Tables 7, 9, 15 and Appendix C.
The financial SAM for Luxembourg is denominated in millions of euros. In the presentation of
the SAM with real accounts and the SAM with financial accounts, the cells are zero either when
the values of transaction happen to be zero or when the transactions corresponding to the cells are
not defined.
In order to better understand the building process of a financial SAM for Luxembourg, real and
financial accounts are presented separately. First, the real accounts are presented and analysed
followed by the financial accounts. Furthermore, each account (real or financial) is identified
following ESA95 classifications. The latter are indicated between brackets after each account.
3.1 Real accounts in the SAM
The SAM with real accounts for Luxembourg follows the structure of the SAM basic framework
presented in Table 2. It incorporates the same thirteen main accounts: commodities, production
activities, factors of production (capital and labour), four institutional sectors (non-financial
corporations, financial corporations, government and households), taxes less subsidies,
transaction costs, savings-investment, changes in stocks and the external sector. The distinction
between the commodities and the production activities allows differentiating between the supply
from the domestic sources and from imports and allows disaggregating the supply of goods and
services by product and by type of supplier (Eurostat and European Commission, 1996 and 2008).
Thus, it enables, in principle, a set-up in which production activities can be shown to produce
several types of commodities. The detailed classification of commodities and production
activities (following ESA95 nomenclature) used in the financial SAM for Luxembourg and their
corresponding codes13
are given in Appendix A. Financial activities have been further
disaggregated as the financial account accounted for around 30 percent of value added of
Luxembourg economy in the last decade.
The government activities have been split into a main government account and taxes - subsidies
account. Each of these accounts is discussed in the following sub-sections.
13
In Appendix A, the codes corresponding to the classification by sector are denoted by sec followed by
the number of the sector. Both commodities and production sectors follow the same classification and use
the same codes.
25
In order to build the disaggregated SAM - by keeping a high degree of consistency with the
official macro economic data, which are usually regarded with higher confidence than micro
economic data - it is important to start by developing an aggregate (macro) SAM. Basically, each
cell in the macro SAM gives the sum of sub-matrices in the disaggregated SAM. This procedure
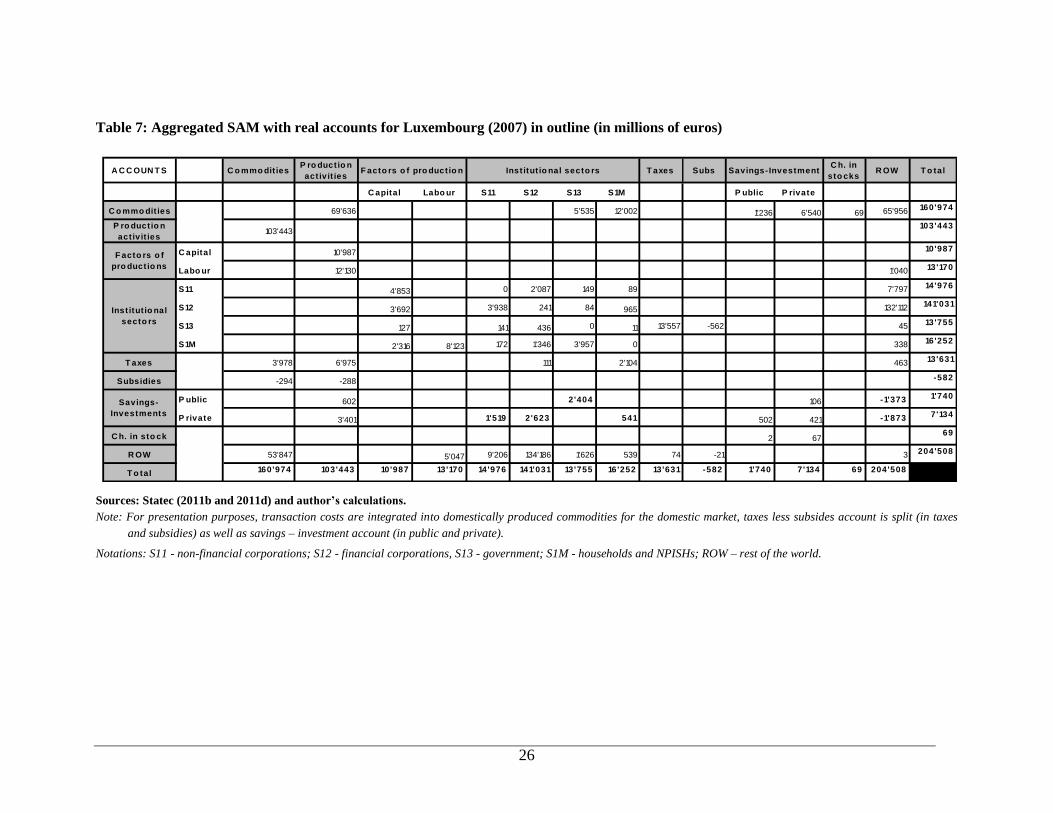
guarantees that the disaggregated SAM matches perfectly the aggregate SAM. Table 7 presents
this aggregate SAM with real accounts, which provides a macroeconomic picture of the economy.
Further, the discussion of each real account is based on the disaggregated SAM, presented in
Table 9, as the latter contains all the necessary details for policy simulations.
The thirteen main accounts will be presented first by column (supply side) and then by row
(demand side) in order to facilitate reading and understanding of the SAM.
3.1.1 Commodity accounts
The commodity account explains the trade flows at the market level. It describes the supply of
commodities from the output (goods and services) of activities (producers) and the rest of the
world (imports including tariffs on imported goods), on the one hand, and sales of these
commodities to activities (as intermediate input) and to the final demand (households,
government, investment, and the rest of the world) on the other hand. In other words, the purpose
of commodities accounts is to show how the available commodities are used (Eurostat and
European Commission, 1996).
Seventeen different types of commodities are distinguished in the SAM, following ESA95
disaggregation. The exact correspondence between the classification of the commodities in the
SAM for Luxembourg and ESA95 Nace rev1 is given in Appendix A. However, in order to
facilitate the reading of the next sections, Table 8 presents the disaggregation of these seventeen
commodities and production activities distinguished in the SAM.
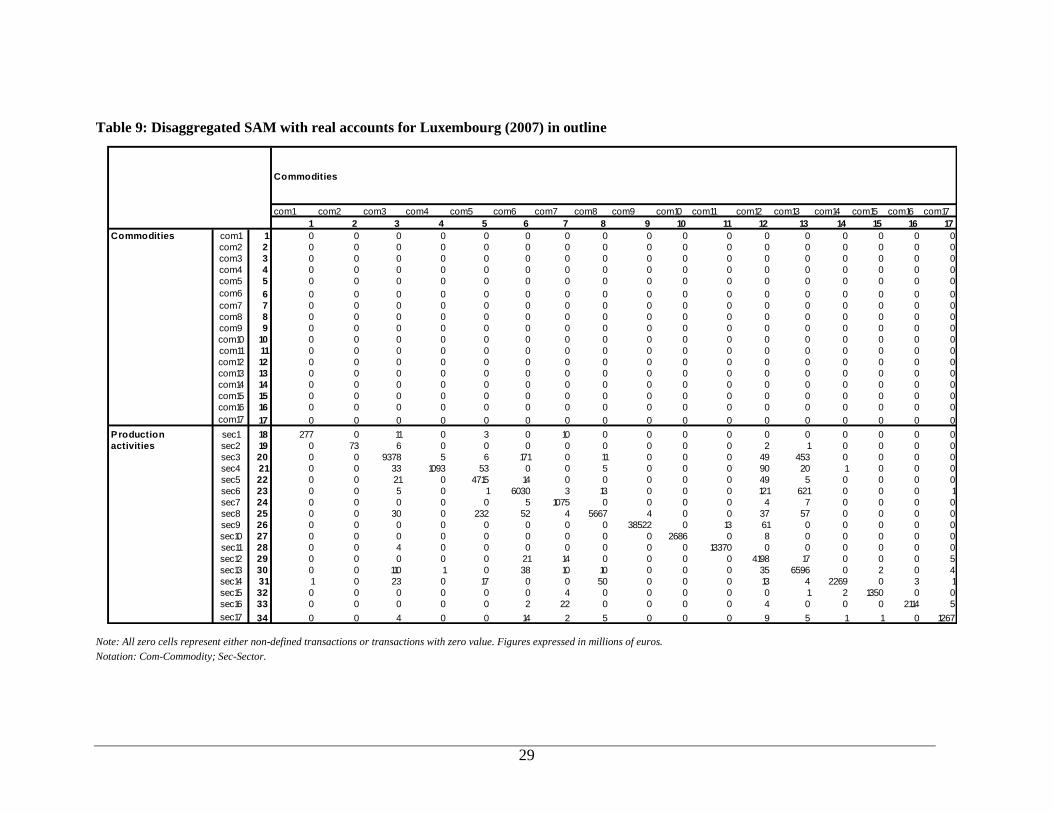
In table 9, on the supply side (in the columns), the commodities are delivered to the domestic
market either by the domestic activities/production (ESA95 P1), cells (18-34,1-17), or by the rest
of the world through imports (ESA95 P7), cells (65,1-17). The total supply of goods and services
to the domestic market (ESA95 P1+D21-D31+P7) is recorded in the cells (66,1-17).
26
Table 7: Aggregated SAM with real accounts for Luxembourg (2007) in outline (in millions of euros)
A C C OUN T S C o mmo dit iesP ro ductio n
act ivit iesT axes Subs
C h. in
sto cksR OW T o tal
C apital Labo ur S11 S12 S13 S1M P ublic P rivate
C o mmo dit ies 69'636 5'535 12'002 1'236 6'540 69 65'956 160'974
P ro ductio n
act ivit ies103'443
103'443
C apital 10'987 10'987
Labo ur 12'130 1'040 13'170
S11 4'853 0 2'087 149 89 7'797 14'976
S12 3'692 3'938 241 84 965 132'112 141'031
S13 127 141 436 0 11 13'557 -562 45 13'755
S1M 2'316 8'123 172 1'346 3'957 0 338 16'252
T axes 3'978 6'975 111 2'104 463 13'631
Subsidies -294 -288 -582
P ublic 602 2'404 106 -1'373 1'740
P rivate 3'401 1'519 2'623 541 502 421 -1'873 7'134
C h. in sto ck 2 6769
R OW 53'847 5'047 9'206 134'186 1'626 539 74 -21 3 204'508
T o tal 160'974 103'443 10'987 13'170 14'976 141'031 13'755 16'252 13'631 -582 1'740 7'134 69 204'508
Savings- Investment
Savings-
Investments
F acto rs o f pro ductio n Inst itut io nal secto rs
Inst itut io nal
secto rs
F acto rs o f
pro ductio ns
Sources: Statec (2011b and 2011d) and author’s calculations.
Note: For presentation purposes, transaction costs are integrated into domestically produced commodities for the domestic market, taxes less subsides account is split (in taxes
and subsidies) as well as savings – investment account (in public and private).
Notations: S11 - non-financial corporations; S12 - financial corporations, S13 - government; S1M - households and NPISHs; ROW – rest of the world.

27
Table 8: Seventeen commodities / production activities distinguished in the SAM
1 Agriculture, hunting and forestry; fishing
2 Mining and quarrying
3 Manufacturing
4 Electricity, gas and water supply
5 Construction
6 Wholesale and retail trade, repair of motor vehicles, motorcycles and personal and household goods
7 Hotels and restaurants
8 Transport, storage and communication
9 Financial intermediation services
10 Insurance
11 Services auxiliary to financial intermediation and insurance
12 Real estate activities; renting
13 Business activities
14 Public administration and defence; compulsory social security
15 Education
16 Health and social work
17 Other community, social and personal service activities; private households with employed persons
Taxes less subsidies by commodity (ESA95 D21-D31), cells (41-45,1-17), and trade and
transport margins by commodity, cells (54-61,1-17), are registered in the columns to balance the
corresponding commodities accounts, as domestic output and imports are valued at basic prices,
while the uses (in the rows) are valued at purchaser‟s prices14
(Kafaï, 2009). Other taxes and
subsidies accounts, cells (46-53), include taxes on capital and labour, tariffs, taxes on income,
taxes on interest revenue paid by residents and non-residents and taxes less subsidies on
production. These taxes are presented separately in this account for modelling purposes. The
transactions costs and indirect costs on commodities are discussed later on, in sections 3.1.9 and
3.1.10.
The services sector supply the highest share of commodities to the domestic market with 84.4
percent, followed by industrial commodities with 10.4 percent, construction goods with 4.9
percent, and agricultural goods with 0.3 percent. Nevertheless, the high share of the services in
the economy - with financial (including insurance) services and related activities representing
around 65 percent of that share - underlines the country‟s high services profile. Further, the very
low share of agricultural products indicates that the Luxembourg economy has turned the page on
agricultural production. Most of agricultural goods consumed in the last decade were imported.
On the demand side (in the rows), intermediate consumption (ESA95 P2) is mapped according to
the commodity and activity types, indicating clearly the specific consumption of each production
activity, cells (1-17,18-34). Households‟ final consumption at purchaser‟s prices (ESA95 P3),
cells (1-17,40), includes both consumption by the households sector and by the non-profit
14
The data by commodity is not publicly available (as it is not a part of official programme of publications
of national statistical office (Statec)) and has been transmitted directly to the author by Statec on personal
request.
28
institutions serving households (NPISHs) following the ESA95 disaggregation. Furthermore,
according to ESA95 accounting principles, final consumption includes the goods and services
produced as outputs of unincorporated enterprises owned by households that are retained for their
own consumption. It is also worth mentioning that the final households‟ consumption as
presented in SAM includes the consumption of nationals abroad and excludes the consumption of
non-residents in Luxembourg. So, it represents the final national consumption of households and
NPISHs. Services represent the highest share of households‟ consumption with 52.6 percent,
followed by industrial commodities (including energy) with 44.3 percent, agricultural
commodities with 2.5 percent and finally construction goods with 0.6 percent.
The largest share of final government consumption (ESA95 P3) consists of services (96.8
percent). It includes the value of the commodities (services) produced by the government itself
and purchases of products by the government from the market producers. It implies that the
government just pays the commodities provided to the household by the seller (Eurostat and
European Commission, 1996). The services produced by the government itself consist mostly of
public services which are produced by the public administration, education, and health and social
work sectors in the SAM (sec14, sec15 and sec16). The “education” and “health and social work”
sectors represent much larger shares of services produced by the government compared to most of
the euro area countries thereby reflecting a significant involvement of government in social
affairs.
The investment commodities (ESA95 P51+P53) are registered in cells (1-17,62-63) and the
changes in inventories (ESA95 P52) in cells (1-17,64). Investment commodities represent the
acquisitions less disposals of fixed assets by the domestic producers. They are recorded by type of
commodity and should not be interpreted as investment carried out in a particular production
activity. The investment-savings account has been split into public, cells (1-17,62), and private,
cells (1-17,63), investment commodities. Luxembourg public demand for investment goods
consists mostly of construction (90 percent), and manufacturing (9 percent). The composition of
the private demand for investment goods is quite different: the construction sector accounts for 50
percent, manufacturing for 37.4 percent and renting and business activities for 12 percent. The
very small remaining part represents the acquisitions of other commodities.
Exports (ESA95 P6), cells (1-17, 65) are discussed in section 3.1.8 together with the external
sector account.
Finally, for each type of commodity, the total demand (row total), both domestically demanded
and exported (ESA95 P2+P3+P5+P6), is equal to the total supply (column total), both
domestically produced and imported (ESA95 P1+D21-D31+P7).
29
Table 9: Disaggregated SAM with real accounts for Luxembourg (2007) in outline
Commodities
com1 com2 com3 com4 com5 com6 com7 com8 com9 com10 com11 com12 com13 com14 com15 com16 com17
1 2 3 4 5 6 7 8 9 10 11 12 13 14 15 16 17
Commodities com1 1 0 0 0 0 0 0 0 0 0 0 0 0 0 0 0 0 0
com2 2 0 0 0 0 0 0 0 0 0 0 0 0 0 0 0 0 0
com3 3 0 0 0 0 0 0 0 0 0 0 0 0 0 0 0 0 0
com4 4 0 0 0 0 0 0 0 0 0 0 0 0 0 0 0 0 0
com5 5 0 0 0 0 0 0 0 0 0 0 0 0 0 0 0 0 0
com6 6 0 0 0 0 0 0 0 0 0 0 0 0 0 0 0 0 0
com7 7 0 0 0 0 0 0 0 0 0 0 0 0 0 0 0 0 0
com8 8 0 0 0 0 0 0 0 0 0 0 0 0 0 0 0 0 0
com9 9 0 0 0 0 0 0 0 0 0 0 0 0 0 0 0 0 0
com10 10 0 0 0 0 0 0 0 0 0 0 0 0 0 0 0 0 0
com11 11 0 0 0 0 0 0 0 0 0 0 0 0 0 0 0 0 0
com12 12 0 0 0 0 0 0 0 0 0 0 0 0 0 0 0 0 0
com13 13 0 0 0 0 0 0 0 0 0 0 0 0 0 0 0 0 0
com14 14 0 0 0 0 0 0 0 0 0 0 0 0 0 0 0 0 0
com15 15 0 0 0 0 0 0 0 0 0 0 0 0 0 0 0 0 0
com16 16 0 0 0 0 0 0 0 0 0 0 0 0 0 0 0 0 0
com17 17 0 0 0 0 0 0 0 0 0 0 0 0 0 0 0 0 0
sec1 18 277 0 11 0 3 0 10 0 0 0 0 0 0 0 0 0 0
sec2 19 0 73 6 0 0 0 0 0 0 0 0 2 1 0 0 0 0
sec3 20 0 0 9378 5 6 171 0 11 0 0 0 49 453 0 0 0 0
sec4 21 0 0 33 1093 53 0 0 5 0 0 0 90 20 1 0 0 0
sec5 22 0 0 21 0 4715 14 0 0 0 0 0 49 5 0 0 0 0
sec6 23 0 0 5 0 1 6030 3 13 0 0 0 121 621 0 0 0 1
sec7 24 0 0 0 0 0 5 1075 0 0 0 0 4 7 0 0 0 0
sec8 25 0 0 30 0 232 52 4 5667 4 0 0 37 57 0 0 0 0
sec9 26 0 0 0 0 0 0 0 0 38522 0 13 61 0 0 0 0 0
sec10 27 0 0 0 0 0 0 0 0 0 2686 0 8 0 0 0 0 0
sec11 28 0 0 4 0 0 0 0 0 0 0 13370 0 0 0 0 0 0
sec12 29 0 0 0 0 0 21 14 0 0 0 0 4198 17 0 0 0 5
sec13 30 0 0 110 1 0 38 10 10 0 0 0 35 6596 0 2 0 4
sec14 31 1 0 23 0 17 0 0 50 0 0 0 13 4 2269 0 3 1
sec15 32 0 0 0 0 0 0 4 0 0 0 0 0 1 2 1350 0 0
sec16 33 0 0 0 0 0 2 22 0 0 0 0 4 0 0 0 2114 5
sec17 34 0 0 4 0 0 14 2 5 0 0 0 9 5 1 1 0 1267
Production
activities
Note: All zero cells represent either non-defined transactions or transactions with zero value. Figures expressed in millions of euros.
Notation: Com-Commodity; Sec-Sector.

30
Table 9: Disaggregated SAM with real accounts for Luxembourg (2007) in outline (continued)
Commoditie s
com1 com2 com3 com4 com5 com6 com7 com8 com9 com10 com11 com12 com13 com14 com15 com16 com17
1 2 3 4 5 6 7 8 9 10 11 12 13 14 15 16 17
Fa c tors of K 3 5 0 0 0 0 0 0 0 0 0 0 0 0 0 0 0 0 0
produc tion L 3 6 0 0 0 0 0 0 0 0 0 0 0 0 0 0 0 0 0
S11 3 7 0 0 0 0 0 0 0 0 0 0 0 0 0 0 0 0 0
S12 3 8 0 0 0 0 0 0 0 0 0 0 0 0 0 0 0 0 0
S13 3 9 0 0 0 0 0 0 0 0 0 0 0 0 0 0 0 0 0
S1M 4 0 0 0 0 0 0 0 0 0 0 0 0 0 0 0 0 0 0
VAT on IC 4 1 2 0 127 11 53 3 2 19 5 16 4 22 451 0 1 1 3
VAT on final cons. 4 2 14 0 611 18 10 18 27 68 9 16 0 16 19 0 2 3 54
VAT on GCF 4 3 0 0 11 0 236 0 0 0 0 0 0 0 154 0 0 0 0
VAT on exports 4 4 0 0 199 0 0 157 0 49 147 0 0 0 83 0 0 0 0
Sub. on products 4 5 - 2 0 0 - 3 0 0 - 1 - 269 0 0 0 0 0 0 0 - 4 - 16
Taxes on capital 4 6 0 0 0 0 0 0 0 0 0 0 0 0 0 0 0 0 0
Taxes on labour 4 7 0 0 0 0 0 0 0 0 0 0 0 0 0 0 0 0 0
Tariffs 4 8 0 0 1336 0 0 0 0 0 0 0 0 0 0 0 0 0 0
Taxes on income 4 9 0 0 0 0 0 0 0 0 0 0 0 0 0 0 0 0 0
Taxes on int. rev. paid by res. 5 0 0 0 0 0 0 0 0 0 0 0 0 0 0 0 0 0 0
Taxes on int. rev. paid by non- res. 5 1 0 0 0 0 0 0 0 0 0 0 0 0 0 0 0 0 0
Taxes on production 5 2 0 0 0 0 0 0 0 0 0 0 0 0 0 0 0 0 0
Sub. on production 5 3 0 0 0 0 0 0 0 0 0 0 0 0 0 0 0 0 0
TradeM on IC 5 4 22 4 507 0 0 0 0 0 0 0 0 0 0 0 0 0 0
TradeM on HC 5 5 133 1 1911 0 0 0 0 0 0 0 0 0 0 0 0 0 0
TradeM on GCF 5 6 1 0 205 0 0 0 0 0 0 0 0 0 0 0 0 0 0
TradeM on exports 5 7 10 1 748 0 0 0 0 0 0 0 0 0 0 0 0 0 0
TransM on IC 5 8 2 2 24 0 0 0 0 0 0 0 0 0 0 0 0 0 0
TransM on HC 5 9 0 0 12 0 0 0 0 0 0 0 0 0 0 0 0 0 0
TranM on GCF 6 0 0 0 5 0 0 0 0 0 0 0 0 0 0 0 0 0 0
TransM on exports 6 1 1 1 33 0 0 0 0 0 0 0 0 0 0 0 0 0 0
Sa v - Inv Public 6 2 0 0 0 0 0 0 0 0 0 0 0 0 0 0 0 0 0
Private 6 3 0 0 0 0 0 0 0 0 0 0 0 0 0 0 0 0 0
Ch. in stoc ks 6 4 0 0 0 0 0 0 0 0 0 0 0 0 0 0 0 0 0
ROW 6 5 446 417 16621 249 1 145 358 1856 11099 382 14978 179 6660 0 108 74 272
Tota l 6 6 9 0 7 4 9 8 3 19 7 6 13 7 3 5 3 2 7 6 6 7 1 15 3 1 7 4 8 5 4 9 7 8 7 3 10 0 2 8 3 6 6 4 8 9 7 15 15 2 2 2 7 2 14 6 4 2 19 2 15 9 6
Institutiona l
se c tors
Note: All zero cells represent either non-defined transactions or transactions with zero value. Figures expressed in millions of euros.
Notations: VAT on IC – Value added tax on intermediate consumption; VAT on final cons. – Value added tax on final consumption; VAT on GCF – value added tax on gross capital formation; TradeM.
on IC – Trade margins on intermediate consumption; TradeM. on HC – Trade margins on household consumption; TradeM. on exports – Trade margins on exports; TransM on IC – Transport
margins on intermediate consumption; TransM. on HC – Transport margins on household consumption; TransM. on GCF – Transport margins on gross capital formation; TransM. on exports –
Transport margins on exports; Sav – Savings; Inv – Investments; S11 - non-financial corporations; S12 - financial corporations, S13 - government; S1M - households and NPIS; ROW – Rest of the
world.
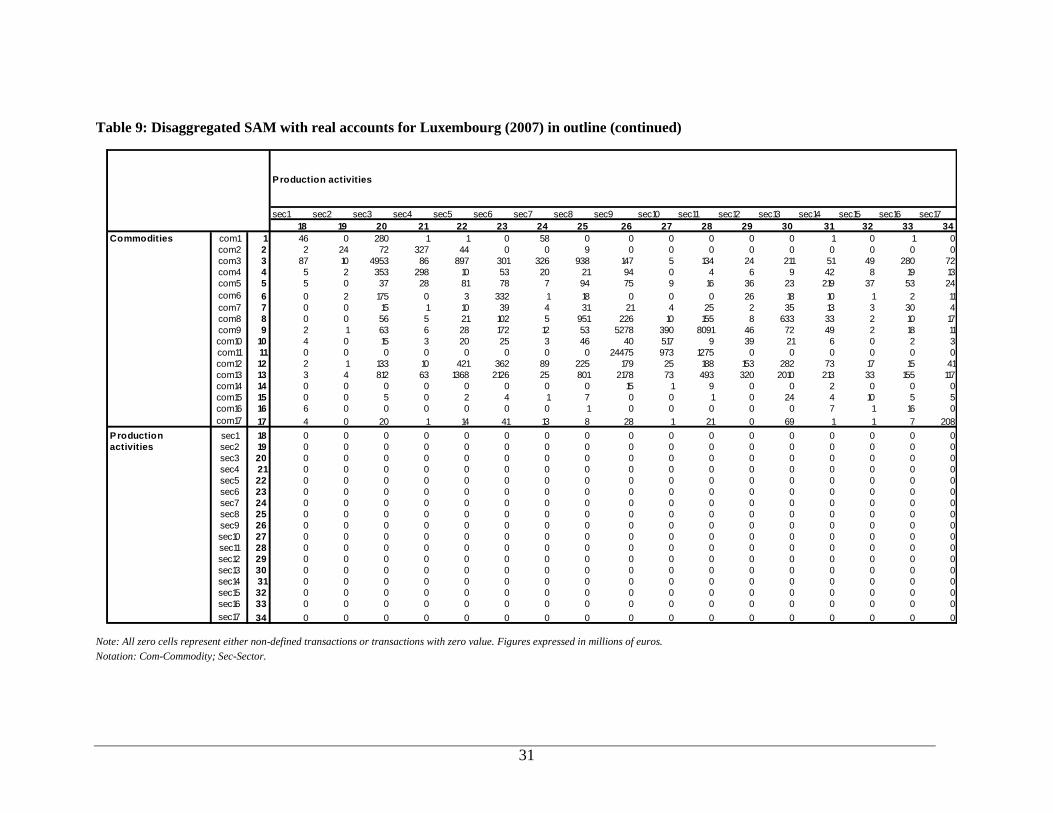
31
Table 9: Disaggregated SAM with real accounts for Luxembourg (2007) in outline (continued)
Production activities
sec1 sec2 sec3 sec4 sec5 sec6 sec7 sec8 sec9 sec10 sec11 sec12 sec13 sec14 sec15 sec16 sec17
18 19 20 21 22 23 24 25 26 27 28 29 30 31 32 33 34
Commodities com1 1 46 0 280 1 1 0 58 0 0 0 0 0 0 1 0 1 0
com2 2 2 24 72 327 44 0 0 9 0 0 0 0 0 0 0 0 0
com3 3 87 10 4953 86 897 301 326 938 147 5 134 24 211 51 49 280 72
com4 4 5 2 353 298 10 53 20 21 94 0 4 6 9 42 8 19 13
com5 5 5 0 37 28 81 78 7 94 75 9 16 36 23 219 37 53 24
com6 6 0 2 175 0 3 332 1 18 0 0 0 26 18 10 1 2 11
com7 7 0 0 15 1 10 39 4 31 21 4 25 2 35 13 3 30 4
com8 8 0 0 56 5 21 102 5 951 226 10 155 8 633 33 2 10 17
com9 9 2 1 63 6 28 172 12 53 5278 390 8091 46 72 49 2 18 11
com10 10 4 0 15 3 20 25 3 46 40 517 9 39 21 6 0 2 3
com11 11 0 0 0 0 0 0 0 0 24475 973 1275 0 0 0 0 0 0
com12 12 2 1 133 10 421 362 89 225 179 25 188 153 282 73 17 15 41
com13 13 3 4 812 63 1368 2126 25 801 2178 73 493 320 2010 213 33 155 117
com14 14 0 0 0 0 0 0 0 0 15 1 9 0 0 2 0 0 0
com15 15 0 0 5 0 2 4 1 7 0 0 1 0 24 4 10 5 5
com16 16 6 0 0 0 0 0 0 1 0 0 0 0 0 7 1 16 0
com17 17 4 0 20 1 14 41 13 8 28 1 21 0 69 1 1 7 208
sec1 18 0 0 0 0 0 0 0 0 0 0 0 0 0 0 0 0 0
sec2 19 0 0 0 0 0 0 0 0 0 0 0 0 0 0 0 0 0
sec3 20 0 0 0 0 0 0 0 0 0 0 0 0 0 0 0 0 0
sec4 21 0 0 0 0 0 0 0 0 0 0 0 0 0 0 0 0 0
sec5 22 0 0 0 0 0 0 0 0 0 0 0 0 0 0 0 0 0
sec6 23 0 0 0 0 0 0 0 0 0 0 0 0 0 0 0 0 0
sec7 24 0 0 0 0 0 0 0 0 0 0 0 0 0 0 0 0 0
sec8 25 0 0 0 0 0 0 0 0 0 0 0 0 0 0 0 0 0
sec9 26 0 0 0 0 0 0 0 0 0 0 0 0 0 0 0 0 0
sec10 27 0 0 0 0 0 0 0 0 0 0 0 0 0 0 0 0 0
sec11 28 0 0 0 0 0 0 0 0 0 0 0 0 0 0 0 0 0
sec12 29 0 0 0 0 0 0 0 0 0 0 0 0 0 0 0 0 0
sec13 30 0 0 0 0 0 0 0 0 0 0 0 0 0 0 0 0 0
sec14 31 0 0 0 0 0 0 0 0 0 0 0 0 0 0 0 0 0
sec15 32 0 0 0 0 0 0 0 0 0 0 0 0 0 0 0 0 0
sec16 33 0 0 0 0 0 0 0 0 0 0 0 0 0 0 0 0 0
sec17 34 0 0 0 0 0 0 0 0 0 0 0 0 0 0 0 0 0
Production
activities
Note: All zero cells represent either non-defined transactions or transactions with zero value. Figures expressed in millions of euros.
Notation: Com-Commodity; Sec-Sector.
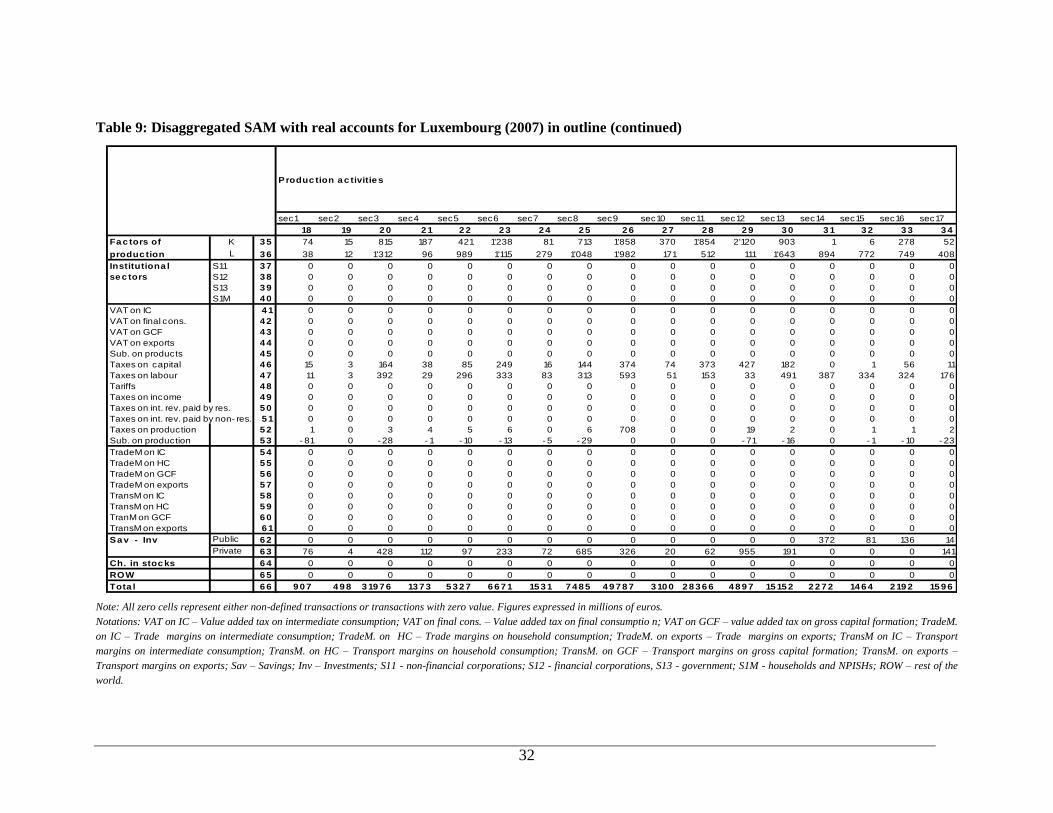
32
Table 9: Disaggregated SAM with real accounts for Luxembourg (2007) in outline (continued)
Produc tion a c tivitie s
sec1 sec2 sec3 sec4 sec5 sec6 sec7 sec8 sec9 sec10 sec11 sec12 sec13 sec14 sec15 sec16 sec17
18 19 2 0 2 1 2 2 2 3 2 4 2 5 2 6 2 7 2 8 2 9 3 0 3 1 3 2 3 3 3 4
Fa c tors of K 3 5 74 15 815 187 421 1'238 81 713 1'858 370 1'854 2'120 903 1 6 278 52
produc tion L 3 6 38 12 1'312 96 989 1'115 279 1'048 1'982 171 512 111 1'643 894 772 749 408
S11 3 7 0 0 0 0 0 0 0 0 0 0 0 0 0 0 0 0 0
S12 3 8 0 0 0 0 0 0 0 0 0 0 0 0 0 0 0 0 0
S13 3 9 0 0 0 0 0 0 0 0 0 0 0 0 0 0 0 0 0
S1M 4 0 0 0 0 0 0 0 0 0 0 0 0 0 0 0 0 0 0
VAT on IC 4 1 0 0 0 0 0 0 0 0 0 0 0 0 0 0 0 0 0
VAT on final cons. 4 2 0 0 0 0 0 0 0 0 0 0 0 0 0 0 0 0 0
VAT on GCF 4 3 0 0 0 0 0 0 0 0 0 0 0 0 0 0 0 0 0
VAT on exports 4 4 0 0 0 0 0 0 0 0 0 0 0 0 0 0 0 0 0
Sub. on products 4 5 0 0 0 0 0 0 0 0 0 0 0 0 0 0 0 0 0
Taxes on capital 4 6 15 3 164 38 85 249 16 144 374 74 373 427 182 0 1 56 11
Taxes on labour 4 7 11 3 392 29 296 333 83 313 593 51 153 33 491 387 334 324 176
Tariffs 4 8 0 0 0 0 0 0 0 0 0 0 0 0 0 0 0 0 0
Taxes on income 4 9 0 0 0 0 0 0 0 0 0 0 0 0 0 0 0 0 0
Taxes on int. rev. paid by res. 5 0 0 0 0 0 0 0 0 0 0 0 0 0 0 0 0 0 0
Taxes on int. rev. paid by non- res. 5 1 0 0 0 0 0 0 0 0 0 0 0 0 0 0 0 0 0
Taxes on production 5 2 1 0 3 4 5 6 0 6 708 0 0 19 2 0 1 1 2
Sub. on production 5 3 - 81 0 - 28 - 1 - 10 - 13 - 5 - 29 0 0 0 - 71 - 16 0 - 1 - 10 - 23
TradeM on IC 5 4 0 0 0 0 0 0 0 0 0 0 0 0 0 0 0 0 0
TradeM on HC 5 5 0 0 0 0 0 0 0 0 0 0 0 0 0 0 0 0 0
TradeM on GCF 5 6 0 0 0 0 0 0 0 0 0 0 0 0 0 0 0 0 0
TradeM on exports 5 7 0 0 0 0 0 0 0 0 0 0 0 0 0 0 0 0 0
TransM on IC 5 8 0 0 0 0 0 0 0 0 0 0 0 0 0 0 0 0 0
TransM on HC 5 9 0 0 0 0 0 0 0 0 0 0 0 0 0 0 0 0 0
TranM on GCF 6 0 0 0 0 0 0 0 0 0 0 0 0 0 0 0 0 0 0
TransM on exports 6 1 0 0 0 0 0 0 0 0 0 0 0 0 0 0 0 0 0
Sa v - Inv Public 6 2 0 0 0 0 0 0 0 0 0 0 0 0 0 372 81 136 14
Private 6 3 76 4 428 112 97 233 72 685 326 20 62 955 191 0 0 0 141
Ch. in stoc ks 6 4 0 0 0 0 0 0 0 0 0 0 0 0 0 0 0 0 0
ROW 6 5 0 0 0 0 0 0 0 0 0 0 0 0 0 0 0 0 0
Tota l 6 6 9 0 7 4 9 8 3 19 7 6 13 7 3 5 3 2 7 6 6 7 1 15 3 1 7 4 8 5 4 9 7 8 7 3 10 0 2 8 3 6 6 4 8 9 7 15 15 2 2 2 7 2 14 6 4 2 19 2 15 9 6
Institutiona l
se c tors
Note: All zero cells represent either non-defined transactions or transactions with zero value. Figures expressed in millions of euros.
Notations: VAT on IC – Value added tax on intermediate consumption; VAT on final cons. – Value added tax on final consumptio n; VAT on GCF – value added tax on gross capital formation; TradeM.
on IC – Trade margins on intermediate consumption; TradeM. on HC – Trade margins on household consumption; TradeM. on exports – Trade margins on exports; TransM on IC – Transport
margins on intermediate consumption; TransM. on HC – Transport margins on household consumption; TransM. on GCF – Transport margins on gross capital formation; TransM. on exports –
Transport margins on exports; Sav – Savings; Inv – Investments; S11 - non-financial corporations; S12 - financial corporations, S13 - government; S1M - households and NPISHs; ROW – rest of the
world.
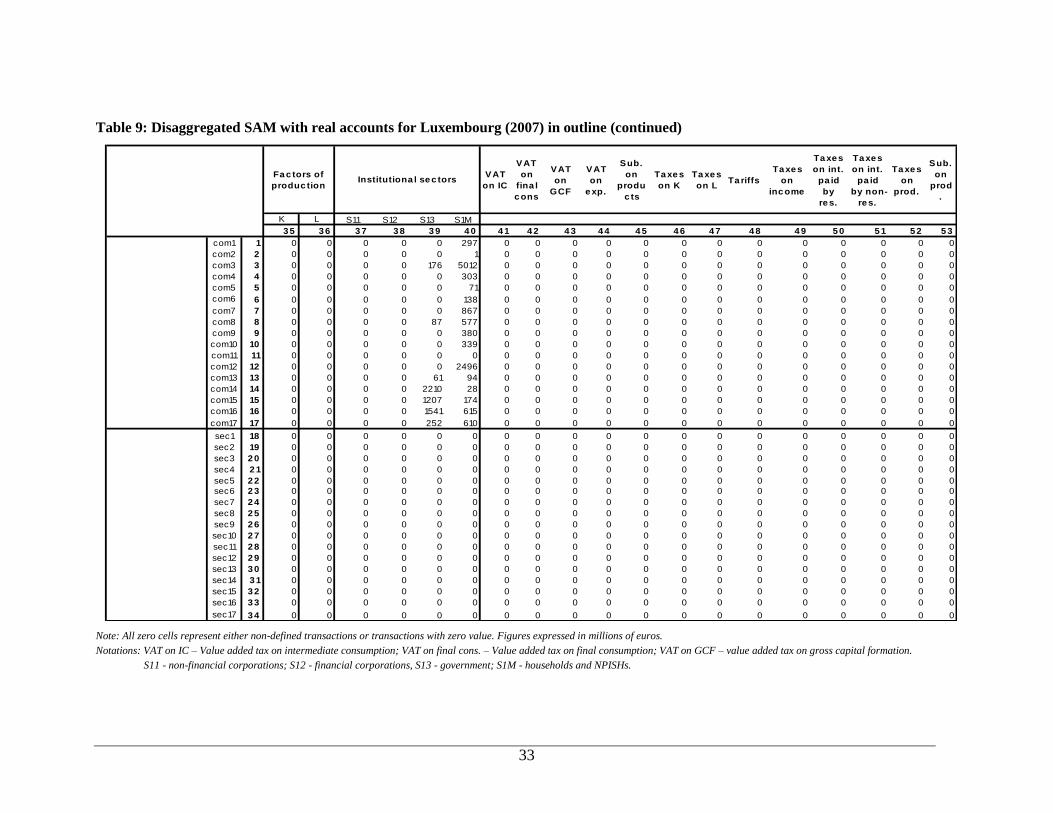
33
Table 9: Disaggregated SAM with real accounts for Luxembourg (2007) in outline (continued)
VAT
on IC
VAT
on
fina l
c ons
VAT
on
GCF
VAT
on
e xp.
Sub.
on
produ
c ts
Ta xe s
on K
Ta xe s
on LTa riffs
Ta xe s
on
inc ome
Ta xe s
on int.
pa id
by
re s.
Ta xe s
on int.
pa id
by non-
re s.
Ta xe s
on
prod.
Sub.
on
prod
.
K L S11 S12 S13 S1M
3 5 3 6 3 7 3 8 3 9 4 0 4 1 4 2 4 3 4 4 4 5 4 6 4 7 4 8 4 9 5 0 5 1 5 2 5 3
com1 1 0 0 0 0 0 297 0 0 0 0 0 0 0 0 0 0 0 0 0
com2 2 0 0 0 0 0 1 0 0 0 0 0 0 0 0 0 0 0 0 0
com3 3 0 0 0 0 176 5012 0 0 0 0 0 0 0 0 0 0 0 0 0
com4 4 0 0 0 0 0 303 0 0 0 0 0 0 0 0 0 0 0 0 0
com5 5 0 0 0 0 0 71 0 0 0 0 0 0 0 0 0 0 0 0 0
com6 6 0 0 0 0 0 138 0 0 0 0 0 0 0 0 0 0 0 0 0
com7 7 0 0 0 0 0 867 0 0 0 0 0 0 0 0 0 0 0 0 0
com8 8 0 0 0 0 87 577 0 0 0 0 0 0 0 0 0 0 0 0 0
com9 9 0 0 0 0 0 380 0 0 0 0 0 0 0 0 0 0 0 0 0
com10 10 0 0 0 0 0 339 0 0 0 0 0 0 0 0 0 0 0 0 0
com11 11 0 0 0 0 0 0 0 0 0 0 0 0 0 0 0 0 0 0 0
com12 12 0 0 0 0 0 2496 0 0 0 0 0 0 0 0 0 0 0 0 0
com13 13 0 0 0 0 61 94 0 0 0 0 0 0 0 0 0 0 0 0 0
com14 14 0 0 0 0 2210 28 0 0 0 0 0 0 0 0 0 0 0 0 0
com15 15 0 0 0 0 1207 174 0 0 0 0 0 0 0 0 0 0 0 0 0
com16 16 0 0 0 0 1541 615 0 0 0 0 0 0 0 0 0 0 0 0 0
com17 17 0 0 0 0 252 610 0 0 0 0 0 0 0 0 0 0 0 0 0
sec1 18 0 0 0 0 0 0 0 0 0 0 0 0 0 0 0 0 0 0 0
sec2 19 0 0 0 0 0 0 0 0 0 0 0 0 0 0 0 0 0 0 0
sec3 2 0 0 0 0 0 0 0 0 0 0 0 0 0 0 0 0 0 0 0 0
sec4 2 1 0 0 0 0 0 0 0 0 0 0 0 0 0 0 0 0 0 0 0
sec5 2 2 0 0 0 0 0 0 0 0 0 0 0 0 0 0 0 0 0 0 0
sec6 2 3 0 0 0 0 0 0 0 0 0 0 0 0 0 0 0 0 0 0 0
sec7 2 4 0 0 0 0 0 0 0 0 0 0 0 0 0 0 0 0 0 0 0
sec8 2 5 0 0 0 0 0 0 0 0 0 0 0 0 0 0 0 0 0 0 0
sec9 2 6 0 0 0 0 0 0 0 0 0 0 0 0 0 0 0 0 0 0 0
sec10 2 7 0 0 0 0 0 0 0 0 0 0 0 0 0 0 0 0 0 0 0
sec11 2 8 0 0 0 0 0 0 0 0 0 0 0 0 0 0 0 0 0 0 0
sec12 2 9 0 0 0 0 0 0 0 0 0 0 0 0 0 0 0 0 0 0 0
sec13 3 0 0 0 0 0 0 0 0 0 0 0 0 0 0 0 0 0 0 0 0
sec14 3 1 0 0 0 0 0 0 0 0 0 0 0 0 0 0 0 0 0 0 0
sec15 3 2 0 0 0 0 0 0 0 0 0 0 0 0 0 0 0 0 0 0 0
sec16 3 3 0 0 0 0 0 0 0 0 0 0 0 0 0 0 0 0 0 0 0
sec17 3 4 0 0 0 0 0 0 0 0 0 0 0 0 0 0 0 0 0 0 0
Fa c tors of
produc tionInstitutiona l se c tors
Note: All zero cells represent either non-defined transactions or transactions with zero value. Figures expressed in millions of euros.
Notations: VAT on IC – Value added tax on intermediate consumption; VAT on final cons. – Value added tax on final consumption; VAT on GCF – value added tax on gross capital formation.
S11 - non-financial corporations; S12 - financial corporations, S13 - government; S1M - households and NPISHs.
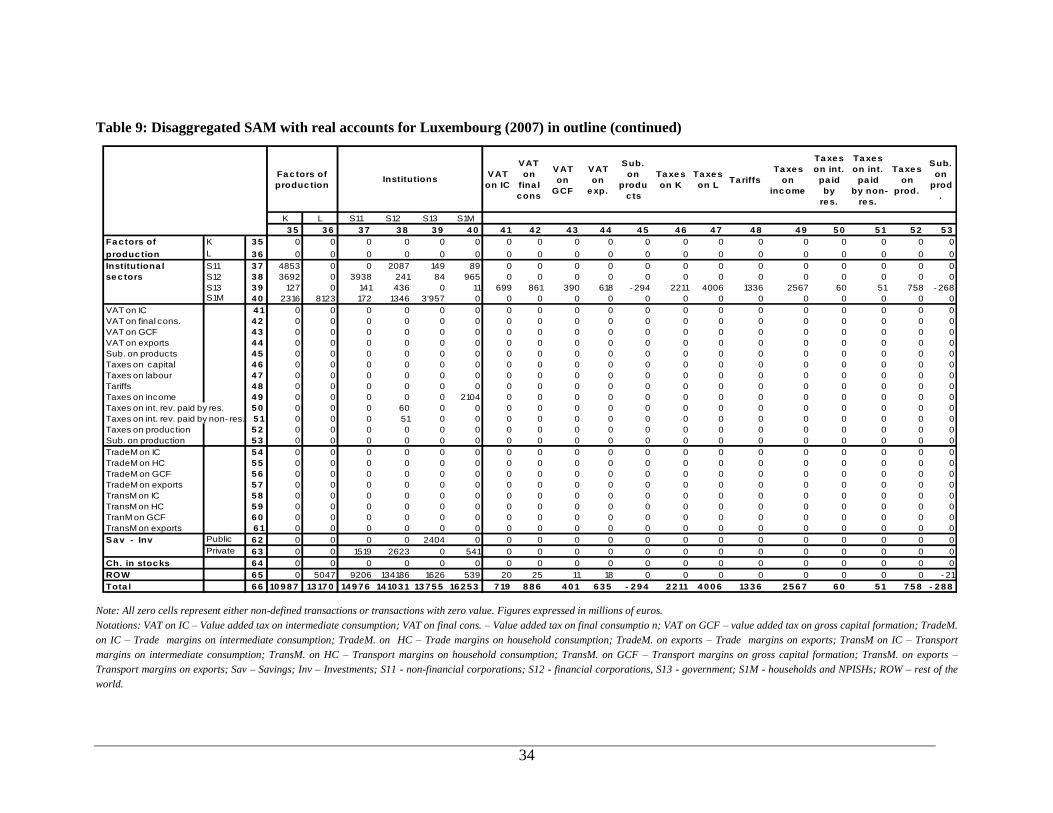
34
Table 9: Disaggregated SAM with real accounts for Luxembourg (2007) in outline (continued)
VAT
on IC
VAT
on
fina l
c ons
VAT
on
GCF
VAT
on
e xp.
Sub.
on
produ
c ts
Ta xe s
on K
Ta xe s
on LTa riffs
Ta xe s
on
inc ome
Ta xe s
on int.
pa id
by
re s.
Ta xe s
on int.
pa id
by non-
re s.
Ta xe s
on
prod.
Sub.
on
prod
.
K L S11 S12 S13 S1M
3 5 3 6 3 7 3 8 3 9 4 0 4 1 4 2 4 3 4 4 4 5 4 6 4 7 4 8 4 9 5 0 5 1 5 2 5 3
Fa c tors of K 3 5 0 0 0 0 0 0 0 0 0 0 0 0 0 0 0 0 0 0 0
produc tion L 3 6 0 0 0 0 0 0 0 0 0 0 0 0 0 0 0 0 0 0 0
S11 3 7 4853 0 0 2087 149 89 0 0 0 0 0 0 0 0 0 0 0 0 0
S12 3 8 3692 0 3938 241 84 965 0 0 0 0 0 0 0 0 0 0 0 0 0
S13 3 9 127 0 141 436 0 11 699 861 390 618 - 294 2211 4006 1336 2567 60 51 758 - 268
S1M 4 0 2316 8123 172 1346 3'957 0 0 0 0 0 0 0 0 0 0 0 0 0 0
VAT on IC 4 1 0 0 0 0 0 0 0 0 0 0 0 0 0 0 0 0 0 0 0
VAT on final cons. 4 2 0 0 0 0 0 0 0 0 0 0 0 0 0 0 0 0 0 0 0
VAT on GCF 4 3 0 0 0 0 0 0 0 0 0 0 0 0 0 0 0 0 0 0 0
VAT on exports 4 4 0 0 0 0 0 0 0 0 0 0 0 0 0 0 0 0 0 0 0
Sub. on products 4 5 0 0 0 0 0 0 0 0 0 0 0 0 0 0 0 0 0 0 0
Taxes on capital 4 6 0 0 0 0 0 0 0 0 0 0 0 0 0 0 0 0 0 0 0
Taxes on labour 4 7 0 0 0 0 0 0 0 0 0 0 0 0 0 0 0 0 0 0 0
Tariffs 4 8 0 0 0 0 0 0 0 0 0 0 0 0 0 0 0 0 0 0 0
Taxes on income 4 9 0 0 0 0 0 2104 0 0 0 0 0 0 0 0 0 0 0 0 0
Taxes on int. rev. paid by res. 5 0 0 0 0 60 0 0 0 0 0 0 0 0 0 0 0 0 0 0 0
Taxes on int. rev. paid by non- res. 5 1 0 0 0 51 0 0 0 0 0 0 0 0 0 0 0 0 0 0 0
Taxes on production 5 2 0 0 0 0 0 0 0 0 0 0 0 0 0 0 0 0 0 0 0
Sub. on production 5 3 0 0 0 0 0 0 0 0 0 0 0 0 0 0 0 0 0 0 0
TradeM on IC 5 4 0 0 0 0 0 0 0 0 0 0 0 0 0 0 0 0 0 0 0
TradeM on HC 5 5 0 0 0 0 0 0 0 0 0 0 0 0 0 0 0 0 0 0 0
TradeM on GCF 5 6 0 0 0 0 0 0 0 0 0 0 0 0 0 0 0 0 0 0 0
TradeM on exports 5 7 0 0 0 0 0 0 0 0 0 0 0 0 0 0 0 0 0 0 0
TransM on IC 5 8 0 0 0 0 0 0 0 0 0 0 0 0 0 0 0 0 0 0 0
TransM on HC 5 9 0 0 0 0 0 0 0 0 0 0 0 0 0 0 0 0 0 0 0
TranM on GCF 6 0 0 0 0 0 0 0 0 0 0 0 0 0 0 0 0 0 0 0 0
TransM on exports 6 1 0 0 0 0 0 0 0 0 0 0 0 0 0 0 0 0 0 0 0
Sa v - Inv Public 6 2 0 0 0 0 2404 0 0 0 0 0 0 0 0 0 0 0 0 0 0
Private 6 3 0 0 1519 2623 0 541 0 0 0 0 0 0 0 0 0 0 0 0 0
Ch. in stoc ks 6 4 0 0 0 0 0 0 0 0 0 0 0 0 0 0 0 0 0 0 0
ROW 6 5 0 5047 9206 134186 1626 539 20 25 11 18 0 0 0 0 0 0 0 0 - 21
Tota l 6 6 10 9 8 7 13 17 0 14 9 7 6 14 10 3 1 13 7 5 5 16 2 5 3 7 19 8 8 6 4 0 1 6 3 5 - 2 9 4 2 2 11 4 0 0 6 13 3 6 2 5 6 7 6 0 5 1 7 5 8 - 2 8 8
Institutiona l
se c tors
InstitutionsFa c tors of
produc tion
Note: All zero cells represent either non-defined transactions or transactions with zero value. Figures expressed in millions of euros.
Notations: VAT on IC – Value added tax on intermediate consumption; VAT on final cons. – Value added tax on final consumptio n; VAT on GCF – value added tax on gross capital formation; TradeM.
on IC – Trade margins on intermediate consumption; TradeM. on HC – Trade margins on household consumption; TradeM. on exports – Trade margins on exports; TransM on IC – Transport
margins on intermediate consumption; TransM. on HC – Transport margins on household consumption; TransM. on GCF – Transport margins on gross capital formation; TransM. on exports –
Transport margins on exports; Sav – Savings; Inv – Investments; S11 - non-financial corporations; S12 - financial corporations, S13 - government; S1M - households and NPISHs; ROW – rest of the
world.
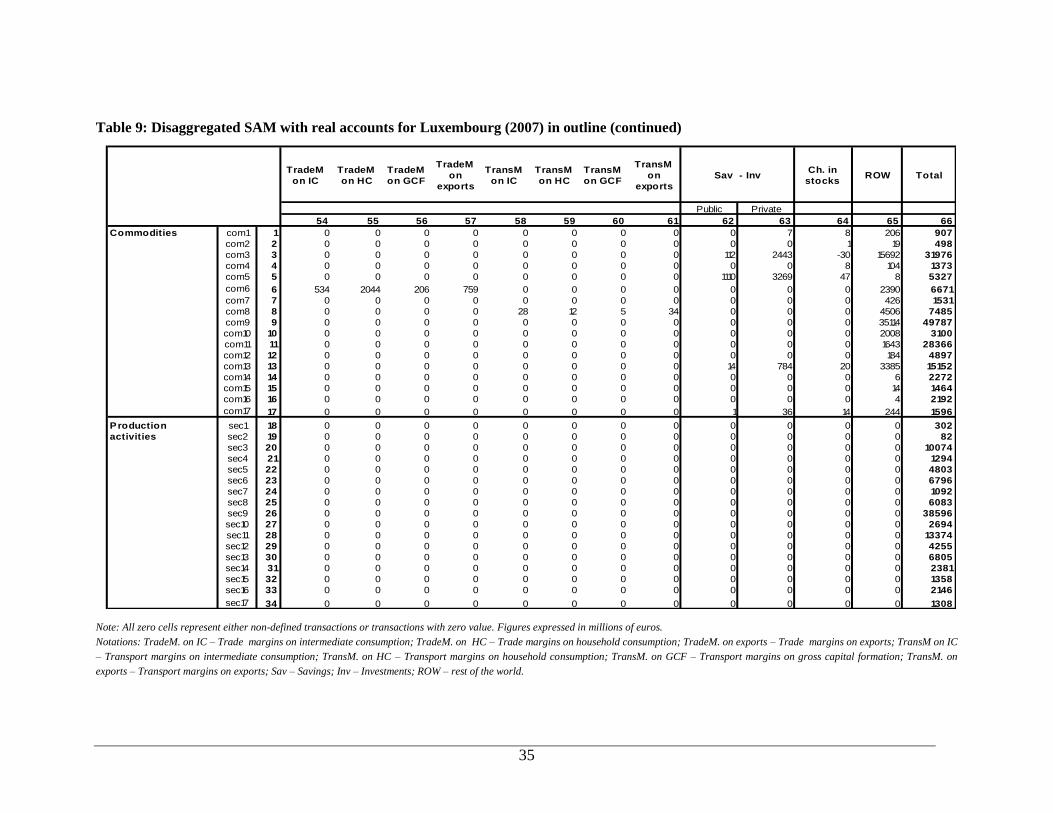
35
Table 9: Disaggregated SAM with real accounts for Luxembourg (2007) in outline (continued)
TradeM
on IC
TradeM
on HC
TradeM
on GCF
TradeM
on
exports
TransM
on IC
TransM
on HC
TransM
on GCF
TransM
on
exports
Ch. in
stocksROW Total
Public Private
54 55 56 57 58 59 60 61 62 63 64 65 66
Commodities com1 1 0 0 0 0 0 0 0 0 0 7 8 206 907
com2 2 0 0 0 0 0 0 0 0 0 0 1 19 498
com3 3 0 0 0 0 0 0 0 0 112 2443 -30 15692 31976
com4 4 0 0 0 0 0 0 0 0 0 0 8 104 1373
com5 5 0 0 0 0 0 0 0 0 1110 3269 47 8 5327
com6 6 534 2044 206 759 0 0 0 0 0 0 0 2390 6671
com7 7 0 0 0 0 0 0 0 0 0 0 0 426 1531
com8 8 0 0 0 0 28 12 5 34 0 0 0 4506 7485
com9 9 0 0 0 0 0 0 0 0 0 0 0 35114 49787
com10 10 0 0 0 0 0 0 0 0 0 0 0 2008 3100
com11 11 0 0 0 0 0 0 0 0 0 0 0 1643 28366
com12 12 0 0 0 0 0 0 0 0 0 0 0 184 4897
com13 13 0 0 0 0 0 0 0 0 14 784 20 3385 15152
com14 14 0 0 0 0 0 0 0 0 0 0 0 6 2272
com15 15 0 0 0 0 0 0 0 0 0 0 0 14 1464
com16 16 0 0 0 0 0 0 0 0 0 0 0 4 2192
com17 17 0 0 0 0 0 0 0 0 1 36 14 244 1596
sec1 18 0 0 0 0 0 0 0 0 0 0 0 0 302
sec2 19 0 0 0 0 0 0 0 0 0 0 0 0 82
sec3 20 0 0 0 0 0 0 0 0 0 0 0 0 10074
sec4 21 0 0 0 0 0 0 0 0 0 0 0 0 1294
sec5 22 0 0 0 0 0 0 0 0 0 0 0 0 4803
sec6 23 0 0 0 0 0 0 0 0 0 0 0 0 6796
sec7 24 0 0 0 0 0 0 0 0 0 0 0 0 1092
sec8 25 0 0 0 0 0 0 0 0 0 0 0 0 6083
sec9 26 0 0 0 0 0 0 0 0 0 0 0 0 38596
sec10 27 0 0 0 0 0 0 0 0 0 0 0 0 2694
sec11 28 0 0 0 0 0 0 0 0 0 0 0 0 13374
sec12 29 0 0 0 0 0 0 0 0 0 0 0 0 4255
sec13 30 0 0 0 0 0 0 0 0 0 0 0 0 6805
sec14 31 0 0 0 0 0 0 0 0 0 0 0 0 2381
sec15 32 0 0 0 0 0 0 0 0 0 0 0 0 1358
sec16 33 0 0 0 0 0 0 0 0 0 0 0 0 2146
sec17 34 0 0 0 0 0 0 0 0 0 0 0 0 1308
Production
activities
Sav - Inv
Note: All zero cells represent either non-defined transactions or transactions with zero value. Figures expressed in millions of euros.
Notations: TradeM. on IC – Trade margins on intermediate consumption; TradeM. on HC – Trade margins on household consumption; TradeM. on exports – Trade margins on exports; TransM on IC
– Transport margins on intermediate consumption; TransM. on HC – Transport margins on household consumption; TransM. on GCF – Transport margins on gross capital formation; TransM. on
exports – Transport margins on exports; Sav – Savings; Inv – Investments; ROW – rest of the world.

36
Table 9: Disaggregated SAM with real accounts for Luxembourg (2007) in outline (continued)
Tra de M
on IC
Tra de M
on HC
Tra de M
on GCF
Tra de M
on
e xports
Tra nsM
on IC
Tra nsM
on HC
Tra nsM
on GCF
Tra nsM
on
e xports
Ch. in
stoc ksROW Tota l
Public Private
5 4 5 5 5 6 5 7 5 8 5 9 6 0 6 1 6 2 6 3 6 4 6 5 6 6
Fa c tors of K 3 5 0 0 0 0 0 0 0 0 0 0 0 0 10 9 8 7
produc tion L 3 6 0 0 0 0 0 0 0 0 0 0 0 1040 13 17 0
S11 3 7 0 0 0 0 0 0 0 0 0 0 0 7797 14 9 7 6
S12 3 8 0 0 0 0 0 0 0 0 0 0 0 132112 14 10 3 1
S13 3 9 0 0 0 0 0 0 0 0 0 0 0 45 13 7 5 5
S1M 4 0 0 0 0 0 0 0 0 0 0 0 0 338 16 2 5 3
VAT on IC 4 1 0 0 0 0 0 0 0 0 0 0 0 0 7 19
VAT on final cons. 4 2 0 0 0 0 0 0 0 0 0 0 0 0 8 8 6
VAT on GCF 4 3 0 0 0 0 0 0 0 0 0 0 0 0 4 0 1
VAT on exports 4 4 0 0 0 0 0 0 0 0 0 0 0 0 6 3 5
Sub. on products 4 5 0 0 0 0 0 0 0 0 0 0 0 0 - 2 9 4
Taxes on capital 4 6 0 0 0 0 0 0 0 0 0 0 0 0 2 2 11
Taxes on labour 4 7 0 0 0 0 0 0 0 0 0 0 0 0 4 0 0 6
Tariffs 4 8 0 0 0 0 0 0 0 0 0 0 0 0 13 3 6
Taxes on income 4 9 0 0 0 0 0 0 0 0 0 0 0 463 2 5 6 7
Taxes on int. rev. paid by res. 5 0 0 0 0 0 0 0 0 0 0 0 0 0 6 0
Taxes on int. rev. paid by non- res. 5 1 0 0 0 0 0 0 0 0 0 0 0 0 5 1
Taxes on production 5 2 0 0 0 0 0 0 0 0 0 0 0 0 7 5 8
Sub. on production 5 3 0 0 0 0 0 0 0 0 0 0 0 0 - 2 8 8
TradeM on IC 5 4 0 0 0 0 0 0 0 0 0 0 0 0 5 3 4
TradeM on HC 5 5 0 0 0 0 0 0 0 0 0 0 0 0 2 0 4 4
TradeM on GCF 5 6 0 0 0 0 0 0 0 0 0 0 0 0 2 0 6
TradeM on exports 5 7 0 0 0 0 0 0 0 0 0 0 0 0 7 5 9
TransM on IC 5 8 0 0 0 0 0 0 0 0 0 0 0 0 2 8
TransM on HC 5 9 0 0 0 0 0 0 0 0 0 0 0 0 12
TranM on GCF 6 0 0 0 0 0 0 0 0 0 0 0 0 0 5
TransM on exports 6 1 0 0 0 0 0 0 0 0 0 0 0 0 3 4
Sa v - Inv Public 6 2 0 0 0 0 0 0 0 0 0 106 0 - 1373 17 4 0
Private 6 3 0 0 0 0 0 0 0 0 502 421 0 - 1873 7 13 4
Ch. in stoc ks 6 4 0 0 0 0 0 0 0 0 2 67 0 0 6 9
ROW 6 5 0 0 0 0 0 0 0 0 0 0 0 3 2 0 4 5 0 8
Tota l 6 6 5 3 4 2 0 4 4 2 0 6 7 5 9 2 8 12 5 3 4 17 4 0 7 13 4 6 9 2 0 4 5 0 8
Institutiona l
se c tors
Sa v - Inv
Note: All zero cells represent either non-defined transactions or transactions with zero value. Figures expressed in millions of euros.
Notations: VAT on IC – Value added tax on intermediate consumption; VAT on final cons. – Value added tax on final consumption; VAT on GCF – value added tax on gross capital formation; TradeM.
on IC – Trade margins on intermediate consumption; TradeM. on HC – Trade margins on household consumption; TradeM. on exports – Trade margins on exports; TransM on IC – Transport
margins on intermediate consumption; TransM. on HC – Transport margins on household consumption; TransM. on GCF – Transport margins on gross capital formation; TransM. on exports –
Transport margins on exports; Sav – Savings; Inv – Investments; S11 - non-financial corporations; S12 - financial corporations, S13 - government; S1M - households and NPISHs; ROW – rest of the
world.
37
3.1.2 Production activities accounts
The production activities accounts are disaggregated in the same way as the commodity accounts,
distinguishing seventeen activities. On the expenditure side (in the columns), the production
accounts register the intermediate consumption (ESA95 P2), cells (1-17,18-34), the net capital
and labour expenditures (ESA95 B1g-K1-D29+D39-D51B-D59-D61), cells (35-36,18-34), the
taxes on capital (ESA95 D51B+D59), cells (46,18-34), the taxes on labour/social security
contributions (ESA95 D61), cells (47,18-34), the taxes on production (ESA95 D29), cells
(52,18-34), and depreciation (ESA95 K1), cells (62-63,18-34). Subsidies on production
(ESA95 D39), cells (53,18-34), are paid by the government to the production activities and are
registered with a negative sign on the expenditure side. The domestic output delivered to the
domestic market at basic prices, the column totals, is also shown in the rows of the production
activities accounts, cells (18-34,66).
The capital and labour expenditures are valued at factor costs. A methodological adjustment is
needed for the imputed social contributions (ESA95 D612)15
. They are subtracted from the total
social contributions and distributed as a labour expense only to the four production activities of
the SAM that are related to government manners (sec14-sec17). It was disaggregated according to
the labour shares of these activities in total value added. Imputed social contributions are
discussed in more detail in sub-section 3.1.6. The highest labour costs are incurred by the services
activities with 81.7 percent of the total wage bill, the manufacturing activities with 9.8 percent
and the construction activities with 7.4 percent.
The highest capital outlays are incurred by the services activities, 86.2 percent, followed by the
manufacturing activities, 7.4 percent, and the construction activities with 3.8 percent. The
electricity and agriculture production activities represent only a small share in total capital
outlays. Total depreciation (ESA95 K1) account has been split into public, cells (62,31-34) and
private accounts, cells (63,18-30) and cells (63,34). Further, the depreciation recorded in the
public account concerns only four activities of production (sec14-sec17) related to the
government activities, namely: “Public administration and defence; compulsory social security”,
“Education”, “Health and social work” and “Other community, social and personal service
activities; private households with employed persons”. This methodological adjustment was
incorporated in order to separate the public and private savings-investment, needed for policy
simulations.
On the demand side of the production activities accounts, the highest share of the domestically
produced goods supplied to domestic markets consists of services as already discussed in the
previous section. Table 10 presents the structure of the total gross value added at basic prices for
15
Imputed social contributions (ESA95 D612) represent the counterpart to social benefits (less eventual
employees‟ social contributions) paid directly by employers to their employees or former employees and
other eligible persons (Eurostat and European Commission, 1996).
38
the period 2000-2007. It clearly shows that the financial sector on its own accounts for 28 percent
of total value added in 2007.
Table 10: Structure of total gross value added at basic prices, 2000-2007
(in millions of euros)
2000 2001 2002 2003 2004 2005 2006 2007
Total value added 19'623 20'273 21'542 23'235 24'490 27'073 30'564 33'808
Value added of f inancial sector 4'913.1 4'287.9 4'464.6 5'388.6 5'579.3 6'971.7 9'009.2 9'479.9
Value added of f inancial sector (in %) 25.0 21.2 20.7 23.2 22.8 25.8 29.5 28.0
Sources: Statec (2011d), Eurostat (2010) and author’s calculations.
Note: Activity “financial services” including financial intermediation, insurance, and financial and insurance
auxiliaries.
The domestic output delivered to the domestic market of each production activity (columns
totals) is equal to the domestic demand for domestic output (row totals).
3.1.3 Factors of production accounts
The factors of production accounts distinguish two types of production factors: capital and labour.
In the rows, the accounts describe the capital and labour outlays of the production activities, cells
(35-36,18-34), as discussed in 3.1.2. The supply of labour to the external sector (ESA95 D1) is
registered in cell (36,62). The columns of the accounts reflect the distribution of the remuneration
of factors of production among the non-financial corporations, financial corporations, households
and the government. The compensation of employees, which represents the payments for the use
of labour in the production process, is received by the household sector through wages, cell
(40,36). The compensation of labour from the external sector (ESA95 D1) is registered in cell
(65,36). This figure mainly reflects the labour offer provided by commuters from the
neighbouring countries (France, Belgium and Germany). Income from capital, cells (37-40,35),
are the net operating surpluses of the non-financial corporations, financial corporations,
government and households (ESA9 B2n/B3n). It represents the surplus accruing from the process
of production before deducting the interest charges, rents or other property incomes payable on
the assets related to production. The highest share of income from capital is received by the non-
financial corporations (44 percent) followed by financial corporations (33.6 percent).
3.1.4 Non-financial corporations sector account
The non-financial corporations sector (ESA95 S11) consists of institutional units whose
distributive and financial transactions are distinct from those of their owners and which are
market producers, whose principal activity is the production of goods and non-financial services.
This institutional sector also includes non-financial quasi-corporations defined as bodies
recognised as independent legal entities which are market producers and whose principal activity
is the production of goods and non-financial services (Eurostat and European Commission, 1996).
39
In Luxembourg, the large industrial companies such as ArcelorMittal (steel industry) or
GoodYear (tire industry) are included in this institutional account.
On the revenue side (in the row), the non-financial corporations sector receives income in the
form of operating surplus, cell (37,35), and transfers from other institutions, cells (37,38-40) as
well as from the ROW, cell (37,65). In the ESA95 framework, the transfers from other
institutions within current account are called distributive transactions. The full set of the very
detailed whom-to-whom tables, depicting these transactions, is presented in Appendix B. These
tables allow tracing of uses (transfers to the other institutional sectors) and resources (revenues
from the other institutional sectors) for each individual tax. They include property income from
the allocation of primary income (ESA95 D4), and the three main taxes from the secondary
distribution of income, namely: current taxes on income, wealth, etc. (ESA95 D5), social
contributions and benefits (ESA95 D6) and other current transfers (ESA95 D7). These are further
disaggregated in sub-taxes. Finally, adjustment for the change in net equity of the households in
the pension funds reserves (ESA95 D8) is included as well.
The highest revenue component consists of the transfers from the external sector, with more than
50 percent of the total non-financial corporation sector revenue or 21 percent of GDP. These
transfers are composed of the distributed income of corporations (ESA95 D42), the reinvested
earnings on direct foreign investment (ESA95 D43), the interest payments (ESA95 D41) and
some miscellaneous transfers. Furthermore, the distributed income of corporations accounts for a
third of the total sector‟s revenue, and the reinvested earning for 17 percent. The operating
surplus represents the second largest revenue component, with 32 percent of the total revenue.
The non-financial corporations receive the largest share of the operating surplus of the economy.
Regarding the transfers from the other institutional sectors, the most important is provided by the
financial corporations account and includes two major sources: interest payments (ESA95 D41)
and non-life insurance claims (ESA95 D72).
On the expenditure side (in the column), as for the revenue, the largest expenditure of the non-
financial corporations account are transfers to the external sector, cell (65,37), accounting for
more than 60 percent of the sector‟s total expenditure. These transfers include three principal
expenditures which are the following: the distributed income of corporations (ESA95 D42); the
reinvested earnings on direct foreign investment (ESA95 D43); the interest payments (ESA95
D41). Then, the non-financial corporations make transfers to financial corporations. These
transfers include mainly interest payments and the distributed income of corporations, accounting
together for a quarter of their total expenditures. The transfers to government and households
represent only 2 percent of non-financial corporations expenditures. The corporate taxes (ESA95
D51B+D59) paid by non-financial corporations are integrated in the cell (39,46) together with the
corporate taxes paid by other institutional sectors. These taxes are paid directly to the taxes-
subsidies account which represents a kind of “tax administration” collecting government revenue.
Non-financial corporations pay 43 percent of total corporate taxes in 2007.

40
Finally, the net savings of the non-financial corporations sector (ESA95 B8n) account for 4.1
percent of GDP and are recorded in cell (63,37).
3.1.5 Financial corporations sector account
The sector financial corporations (ESA95 S12) includes all the corporations and quasi-
corporations which are principally engaged in financial intermediation and/or in auxiliary
financial activities. According to ESA 95 definitions, financial intermediation can be defined as
the activity in which an institutional unit acquires financial assets and at the same time incurs
liabilities on its own account by engaging in financial transactions on the market. The assets and
liabilities of the financial intermediaries have different characteristics, including, notably that the
funds are transformed or repackaged with respect to maturity, scale, risk and the like in the
financial intermediation process. On the other hand, the auxiliary financial activities can be
defined as activities closely related to financial intermediation but which are not financial
intermediation themselves (Eurostat and European Commission, 1996). The financial
corporations sector consists of the monetary financial institutions (MFIs) including the central
bank (ESA95 S121+S122), other financial intermediaries (OFIs) and financial auxiliaries (ESA95
S123+S124) and finally, insurance corporations and pension funds (ICPFs) (ESA95 S125).
The financial corporations have a similar revenue structure as non-financial corporations. In the
row, the financial corporations receive income in the form of operating surplus, cell (38,35), and
transfers from other institutions, cells (38,37) and cells (38,39-40) as well as from the ROW, cell
(38,65). In addition, the financial corporations receive some net income from the operations
among the financial corporations themselves (mainly non-life insurance premiums and claims)
cell (38,38). These transfers are identified in detail in whom-to-whom tables, Appendix B.
The links to and the dependence of Luxembourg‟s financial sector on the rest of the world is very
well reflected within the financial corporations‟ transfers to/from the rest of the world. Transfers
from the external sector account for 94 percent of total financial corporations‟ revenues and the
share is very similar when analysing their transfers/expenditures to the rest of the world. The
common transfers between the financial sector and the external sector are mainly interest
payments (ESA95 D41), distributed income of corporations (ESA95 D42), reinvested earnings on
direct foreign investment (ESA95 D43). The interest payments represent about 60 percent of
transfers followed by distributed income of corporations with 37 percent.
The transfers from the non-financial corporations represent the second largest revenue component
and are principally composed of interest payments and reinvested earnings on direct foreign
investment. The revenue transfers from the households account interest payments (mostly on real
estate loans) and the net non-life insurance premiums, and those from the government are entirely
composed of interest payments. Finally, the share of the total operating surplus earned by the
financial corporations is the second largest in the economy, after the non-financial corporations,
and accounts for only 3 percent of the total financial corporations‟ revenue.
41
On the expenditure side, in the column, the financial corporations make transfers to the other
institutional sectors as well as to the rest of the world, and save. The largest expenditure of
financial corporations are transfers to the external sector, as discussed above. The financial
corporations also make transfers to the non-financial corporations, the households and the
government. These transfers are mostly composed of interest payments (ESA95 D41) and non-
life insurance claims (ESA95 D72). The corporate taxes (ESA95 D51B+D59) paid by this sector
are integrated in the cell (39,46) together with the corporate taxes paid by other institutional
sectors. Financial corporations are the largest payer of corporate taxes with around 55 percent of
collected corporate taxes in 2007. An important share is paid by the 147 commercial banks
registered in Luxembourg that year. The taxes on savings income paid by residents and non
residents, (ESA95 D51A07+D51A08), collected by the banks in behalf of government and then
transferred to it, are registered in cells (50-51,38). Finally, large transfers and low operating
surplus registered in this sector indicate that it has a pure intermediation activity.
The net savings of the financial corporations sector (ESA95 B8n) account for 7 percent of GDP
and are recorded in cell (63,38). They are calculated as the difference between financial
corporations current revenues and expenditures.
3.1.6 Government sector account
In Luxembourg, the general government sector consists of the central government (ESA95
S1311), local government (ESA95 S1313) and social security funds (ESA95 S1314). The public
corporations which are market producers are not included, in contrast to those public corporations
which are considered to be “other non-market producers”. According to the ESA95 accounting
framework, the “other non-market producers” are institutional units the major part of whose
output is provided to the market free or at prices that are not economically significant. They are
financed by the government and/or compulsory payments made by other sectors.
The government account has been disaggregated into the main government sector account and
different taxes and subsidies accounts. The disaggregation proves useful as it allows a distinction
to be made between the different types of taxes, by production activity or by commodity. As a
consequence, the government sector account receives revenue from the taxes account and makes
transfers to the subsidies account (for subsidies on commodities and on production).
On the revenue side (in the row), the government sector receives income from several taxes, cells
(39,41-44) and cells (39,46-52), operating surplus, cell (39,35), and the transfers from non-
financial corporations, cell (39,37), from financial corporations, cell (39,38), from households,
cell (39,40), and from the external sector, cell (39,65). As mentioned above, the full set of very
detailed whom-to-whom tables regarding these distributive transactions is presented in Appendix
B. Each tax is analysed through the concept whom-to-whom. The subsidies (ESA95 D31+D39)
42
are recorded on the account‟s row, but because they actually represent government expenditures
they are recorded with a negative sign, cell (39,45) and cell (39,53).16
The largest tax component consists of the social contributions (ESA95 D61) – also referred to as
taxes on labour in the SAM, cell (39,47), with 29 percent of total taxes received by the
government or 11 percent of the nominal GDP in 2007. The social contribution taxes are
composed of social contributions paid by different agents in the economy, namely: employers
(ESA95 D6111), employees (ESA95 D6112), self and non-employed persons (ESA95 D6113).
Furthermore, imputed social contributions (ESA95 D612) are also included in the total. The latter
represent the counterpart of social benefits paid directly by employers to their employees or
former employees and other eligible persons (Eurostat and European Commission, 1996). For
Luxembourg‟s specific case, according to the information directly provided by the national
statistical office (Statec), the imputed social contributions represent the pensions of the civil
servants, the free medical care of the army and the supplements to the pensions allocated to
municipal workers.17
The second largest tax component consists of the taxes on income (ESA95 D51A), cell (39,49),
with 19.6 percent of total tax revenues received by the government or 7.1 percent of the nominal
GDP in 2007. This figure represents the taxes on income paid by the total labour force in
Luxembourg (residents and non-residents). The full sequence of national accounts published for
the first time in April 2011 allows a distinction to be made between the share of this tax paid by
the residents, cell (49,40), and the one paid by the non-residents, cell (49,65). Taxes on wages are
levied according to progressive rates going up to a maximum of 38 percent in 2007.
16
The treatment of taxes in the ESA95 framework is a critical issue in the context of the EU‟s excessive
deficit procedure (Mohora, 2006). Given the implementation of the accrual principle, taxes and social
contributions are generally recorded when the transactions or activities which create the liability to pay
taxes occur. Thus, in most cases the taxes evidenced by the tax assessments but which are never paid are
treated as if they have been paid (European Commission and Eurostat, 2002).
However, Regulation (EC) No.2516/2000 (European Communities, 2000)16
provides three alternatives to
deal with this discrepancy:
- the recorded amounts are those due to be paid but they are adjusted by a coefficient reflecting
taxes never collected;
- the amounts due to be paid are entirely recorded as taxes and social contributions and the
discrepancy between the theoretical value and the actual cash receipts is recorded as a capital
transfer in favour of the defaulting taxpayers;
- the taxes and social contributions are recorded on a cash basis but they are time-adjusted to
correspond to the period when the liability occurs.
The Luxembourg national statistical office (Statec) adopted the third method of tax adjustment. This has
been confirmed to the author by the official in charge of the compilation of government accounts in the
national statistical office (Statec).
17 The imputed social contributions concern only three sectors related to public administration (according to
the disaggregation of the SAM considered in this paper), namely: „Public administration and defence;
compulsory social security‟ (sec14), „Education‟ (sec15) and „Health and social work‟ (sec16). The total
amount of these contributions has been distributed to these three sectors according to their share in total
taxes on labour.

43
The consumption taxes (ESA95 D211+D2121+D214) are disaggregated into the value-added
taxes (VAT), cells (39,41-44), including the VAT on intermediate consumption, the VAT on final
consumption, the VAT on gross capital formation and the VAT on exports. The VAT revenue
represents 19.4 percent of total taxes received by the government or 7 percent of the nominal
GDP in 2007. This share is rather low compared to most European Union countries as
Luxembourg applies the lowest (reduced and standard) VAT rates (3 percent, 6/12 percent and 15
percent) that a Member State may apply according to the EU regulation of 2006 (European
Communities, 2006).18
The taxes on capital (ESA95 D51B+D59), cell (39,46), represent another important source of
revenue for the government, accounting for about 16 percent of the total tax receipts. It mainly
includes the corporate tax (“Impôt sur le revenu des collectivités”), the local commercial tax paid
by the companies (“Impôt commercial communal”), the solidarity tax on corporate revenues
(“Impôt de solidarité sur le revenu des collectivités”) and the current taxes on capital (“Impôts
courants sur le capital”).
The import tariffs (ESA95 D212), cell (39,48), account for about 3.6 percent of nominal GDP in
2007. This figure is low as Luxembourg‟s trade regime is liberal for most products. Furthermore,
the largest share of tariff revenues is related to the excise taxes on imports of mineral oils (42
percent), of tobacco (32 percent), and the supplementary excise tax on fuel (11 percent). This
reflects the high consumption of these products by the non-residents who either come on a daily
basis to work in Luxembourg or simply cross the country (i.e. trucks). The prices of tobacco,
mineral oils and fuel are indeed lower compared to the neighbouring countries.
The taxes on savings income paid by the residents and the non residents,
(ESA95 D51A07+D51A08), and collected by the banks on behalf of the government, are
registered in cells (39,50-51). For the residents, the tax rate has been fixed through national
legislation to 10 percent (fixed rate) of savings income. For non-residents, the tax rate has been
fixed by the European council19
directive. According to the latter, if the beneficial owner is
resident in a Member State other than that in which the paying agent is established, Luxembourg
government shall levy a withholding tax at the rate of 15 percent during the first three years of the
transitional period, 20 percent for the subsequent three years and 35 percent thereafter. The
starting date of the transition period was 1 January 2005. This implies that for the reference year
of the financial SAM 2007, the tax rate on savings income has been 15 percent. The total of both
taxes (paid by the residents and the non-residents) accounts for 0.8 percent of government
revenue in 2007.
18
The standard VAT rate of 15 percent applied in Luxembourg is the lowest standard rate in force in the
European Union (European Commission, 2010). 19
Council directive 2003/48/EC of 3 June 2003 on taxation of savings income in the form of interest
payments.
44
The other taxes on production (ESA95 D29), cell (39,52), refer mainly to the subscription tax on
securities (“Taxe d‟abonnement”)20
, directly linked to undertakings for collective investment in
transferable securities - UCITS (“Organismes de Placement Collectif”)21
. This tax is highly
correlated with stock exchange movements and the revenues that it generates fluctuate
significantly from year to year. The government subsidises both consumption (ESA95 D31), cell
(39,45) and production of commodities (ESA95 D39), cell (39,53). Both subsidies account
approximately for around 0.8 percent of nominal GDP in 2007.
The operating surplus (ESA95 B2) is the government revenue from capital, cell (39,35). This
revenue represents around 0.3 percent of nominal GDP in 2007.
The current transfers from the non-financial corporations (ESA95 D41+D42) represent an
additional source of government revenue and are recorded in cell (39,37). These revenues
represent the government interest revenues as well as the dividends from government
participation in the semi-public companies (e.g. Post and Telecommunications “PTT”) but also in
some private companies (e.g. ArcelorMittal) and account for around 0.4 percent of GDP.
Financial corporations‟ other current transfers to the government are mainly the government
revenue from the interest payments (ESA95 D41), cell (39,38). However, it also includes some
revenues from distributed income of financial corporations (ESA95 D42), as well as from taxes
on non-life insurance claims (ESA95 D72). The current transfers from financial corporations
represent 3.2 percent of total government revenue or 1.2 percent of GDP in 2007. Other
households‟ transfers to government represent a small share of government revenues and consist
of payments of rents (ESA95 D45).
Finally, the government also receives transfers from the rest of the world (ESA95
D41+D74+D75), cell (39,65), which include taxes on interests as well as other transfers. These
transfers constitute an insignificant share of total government revenues (0.3 percent) and include
the transfers from the European Union.
20
The subscription tax (“Taxe d‟abonnement”) is a specific kind of registration tax established on the basis
of the negotiability of securities. It presents in different form a registration right that a sale of securities
would give right to. Its purpose is to tax the circulation (transactions) of shares. For holding companies, the
rate of annual tax is 0.02 percent on the basis of market value of assets. For UCITS (Undertaking for
Collective Investment Schemes in Transferable Securities) the annual tax rate is of 0.05 percent on the
basis of net assets calculated at the end of the year. This rate is reduced to 0.01 percent in specific cases
(i.e. money market funds). Source: www.impotsdirects.public.lu. 21
UCITS could be defined as bodies:
- of which the exclusive activity is collective investment in transferable securities;
- which in principle collect funds through public calls;
- which operate under the aegis of the risk-sharing principle;
- of which the shares are repurchased directly or indirectly, following a request by the bearers, and
where the real burden is borne by the assets of these undertakings.
Some undertakings for collective investment do not confine their investments to transferable securities.
Source: www.impotsdirects.public.lu.
45
On the expenditure side, in the column, the government‟s final consumption (ESA95 P3),
cells (1-17,39), accounts for 40 percent of total government expenditure. Its composition has
already been discussed in section 3.1.1. As the production of public services by the government
sector is represented in the public administration sector account (sec14), the government wages
and capital outlays are registered in the same account. The other government expenditures are
current transfers or distributive transactions to non-financial corporations, financial corporations,
and households, recorded in cells (37-38,39) and cell (40,39). The transfers to the non-financial
corporations include the transfers to the railway company (“CFL”) for the pension expenses
(ESA95 D75) and a small share of the government interest payments on the public debt (ESA95
D41). Almost the full amount of the government transfers to the financial corporations reflects
the government interest payments on the public debt (ESA95 D41) with net non-life insurance
premiums representing only 5 percent of that total government transfer. Luxembourg public debt
is mainly held by the residents (principally domestic banks for the account of households). The
interest payments represent 0.2 percent of GDP. Finally, the government transfers to the
households, including transfers to the NPISHs (as part of the households‟ account in the SAM),
represent the second largest government expenditure after the final consumption expenditure. It
accounts for around 30 percent of the total government current consumption or 11 percent of
GDP, and includes social benefits other than social transfers in kind (ESA95 D62) and
miscellaneous current transfers (ESA95 D75). The former represents 88 percent of this transfer.
These figures show well the redistributive role that the Luxembourg government plays in the
economy.
The government transfers to the rest of the world (ESA95 D62+D74+D75), cell (65,39) reflect
mostly the social benefits other than social transfers in kind paid to cross-border workers
(including children‟s allocations, school entrance allocations, allocations for the new-born child,
education and maternity allocations and “boni” for children), but also the current international
cooperation transfers (including transfers to the EU Budget) and miscellaneous current transfers.
The net savings of the government sector (ESA95 B8n) are recorded in cell (62,39). They
represent the balance of the consolidated budget before public capital expenditures. By further
subtracting capital expenditures, it is the conventional budget balance (ESA95 B.9) that is
calculated. The latter represents a surplus of about 3.7 percent of nominal GDP in 2007. Adding
the interest payment to the conventional budget balance it is the primary budget balance that is
obtained, amounting to 3.9 percent of nominal GDP. The interest payments on the public debt are
very low and amount only about 0.2 percent of GDP. The Luxembourg public debt was the
lowest one in the euro area in 2007 (except in Estonia) with 6.7 percent of GDP.
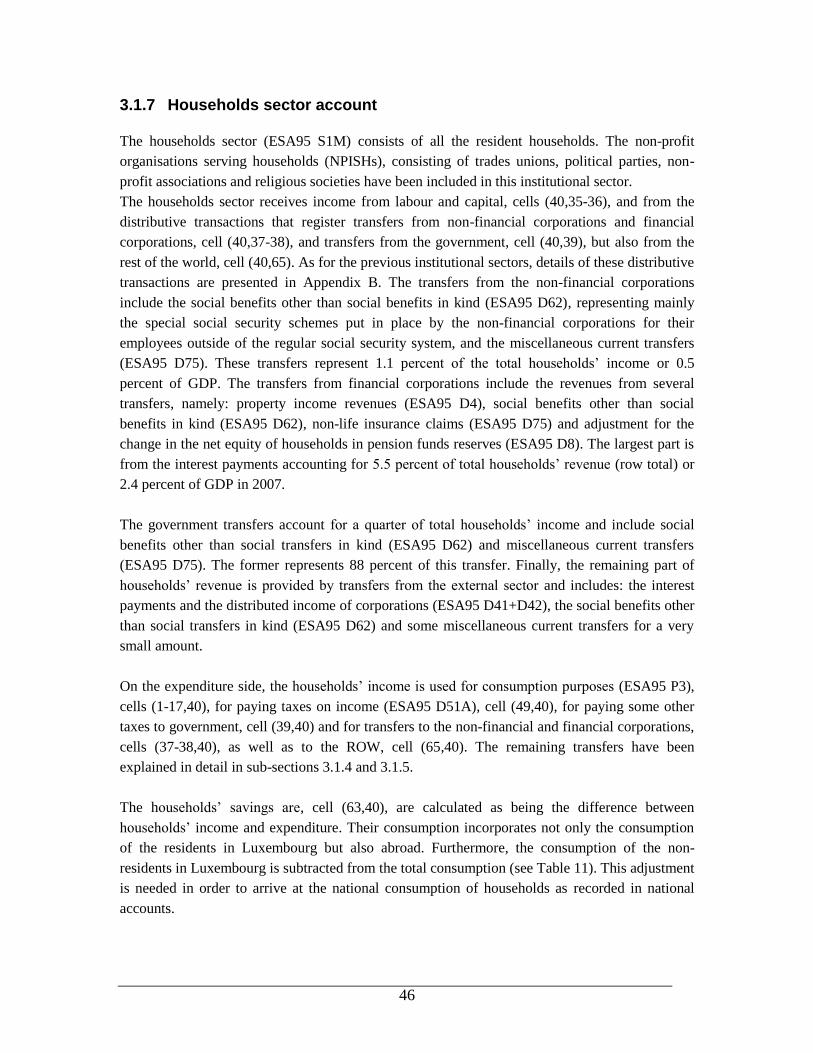
46
3.1.7 Households sector account
The households sector (ESA95 S1M) consists of all the resident households. The non-profit
organisations serving households (NPISHs), consisting of trades unions, political parties, non-
profit associations and religious societies have been included in this institutional sector.
The households sector receives income from labour and capital, cells (40,35-36), and from the
distributive transactions that register transfers from non-financial corporations and financial
corporations, cell (40,37-38), and transfers from the government, cell (40,39), but also from the
rest of the world, cell (40,65). As for the previous institutional sectors, details of these distributive
transactions are presented in Appendix B. The transfers from the non-financial corporations
include the social benefits other than social benefits in kind (ESA95 D62), representing mainly
the special social security schemes put in place by the non-financial corporations for their
employees outside of the regular social security system, and the miscellaneous current transfers
(ESA95 D75). These transfers represent 1.1 percent of the total households‟ income or 0.5
percent of GDP. The transfers from financial corporations include the revenues from several
transfers, namely: property income revenues (ESA95 D4), social benefits other than social
benefits in kind (ESA95 D62), non-life insurance claims (ESA95 D75) and adjustment for the
change in the net equity of households in pension funds reserves (ESA95 D8). The largest part is
from the interest payments accounting for 5.5 percent of total households‟ revenue (row total) or
2.4 percent of GDP in 2007.
The government transfers account for a quarter of total households‟ income and include social
benefits other than social transfers in kind (ESA95 D62) and miscellaneous current transfers
(ESA95 D75). The former represents 88 percent of this transfer. Finally, the remaining part of
households‟ revenue is provided by transfers from the external sector and includes: the interest
payments and the distributed income of corporations (ESA95 D41+D42), the social benefits other
than social transfers in kind (ESA95 D62) and some miscellaneous current transfers for a very
small amount.
On the expenditure side, the households‟ income is used for consumption purposes (ESA95 P3),
cells (1-17,40), for paying taxes on income (ESA95 D51A), cell (49,40), for paying some other
taxes to government, cell (39,40) and for transfers to the non-financial and financial corporations,
cells (37-38,40), as well as to the ROW, cell (65,40). The remaining transfers have been
explained in detail in sub-sections 3.1.4 and 3.1.5.
The households‟ savings are, cell (63,40), are calculated as being the difference between
households‟ income and expenditure. Their consumption incorporates not only the consumption
of the residents in Luxembourg but also abroad. Furthermore, the consumption of the non-
residents in Luxembourg is subtracted from the total consumption (see Table 11). This adjustment
is needed in order to arrive at the national consumption of households as recorded in national
accounts.
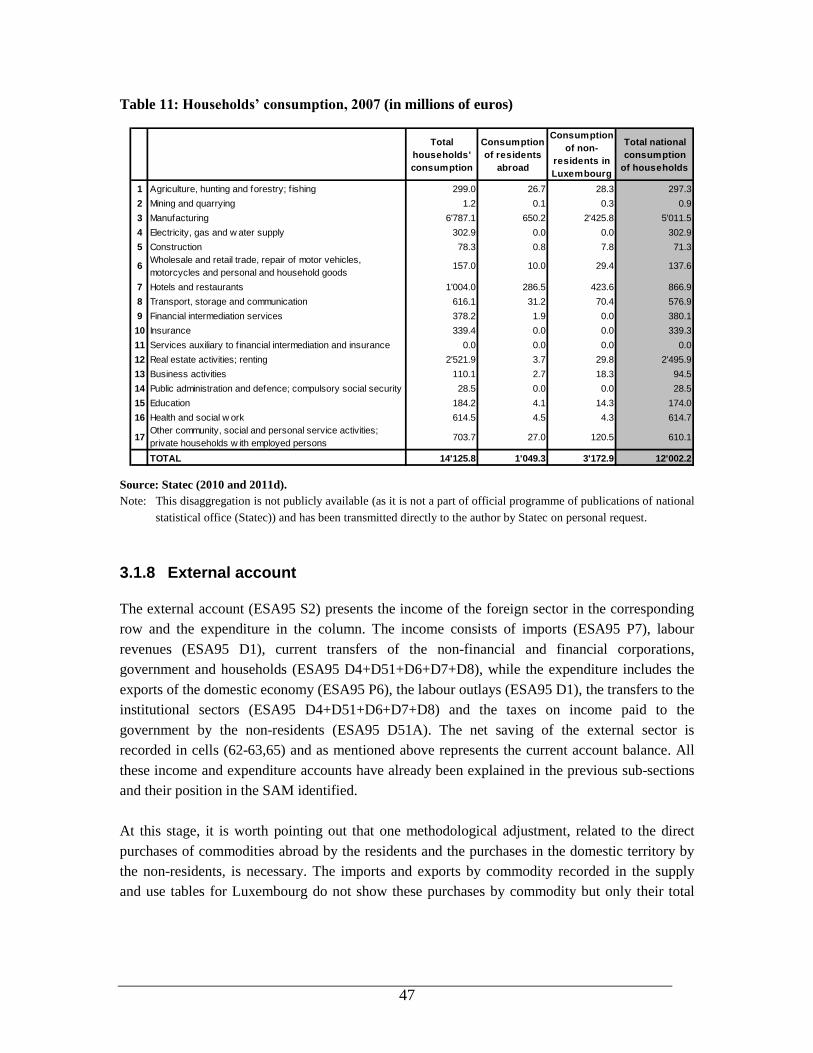
47
Table 11: Households’ consumption, 2007 (in millions of euros)
Total
households'
consumption
Consumption
of residents
abroad
Consumption
of non-
residents in
Luxembourg
Total national
consumption
of households
1 Agriculture, hunting and forestry; f ishing 299.0 26.7 28.3 297.3
2 Mining and quarrying 1.2 0.1 0.3 0.9
3 Manufacturing 6'787.1 650.2 2'425.8 5'011.5
4 Electricity, gas and w ater supply 302.9 0.0 0.0 302.9
5 Construction 78.3 0.8 7.8 71.3
6Wholesale and retail trade, repair of motor vehicles,
motorcycles and personal and household goods157.0 10.0 29.4 137.6
7 Hotels and restaurants 1'004.0 286.5 423.6 866.9
8 Transport, storage and communication 616.1 31.2 70.4 576.9
9 Financial intermediation services 378.2 1.9 0.0 380.1
10 Insurance 339.4 0.0 0.0 339.3
11 Services auxiliary to f inancial intermediation and insurance 0.0 0.0 0.0 0.0
12 Real estate activities; renting 2'521.9 3.7 29.8 2'495.9
13 Business activities 110.1 2.7 18.3 94.5
14 Public administration and defence; compulsory social security 28.5 0.0 0.0 28.5
15 Education 184.2 4.1 14.3 174.0
16 Health and social w ork 614.5 4.5 4.3 614.7
17Other community, social and personal service activities;
private households w ith employed persons703.7 27.0 120.5 610.1
TOTAL 14'125.8 1'049.3 3'172.9 12'002.2
Source: Statec (2010 and 2011d).
Note: This disaggregation is not publicly available (as it is not a part of official programme of publications of national
statistical office (Statec)) and has been transmitted directly to the author by Statec on personal request.
3.1.8 External account
The external account (ESA95 S2) presents the income of the foreign sector in the corresponding
row and the expenditure in the column. The income consists of imports (ESA95 P7), labour
revenues (ESA95 D1), current transfers of the non-financial and financial corporations,
government and households (ESA95 D4+D51+D6+D7+D8), while the expenditure includes the
exports of the domestic economy (ESA95 P6), the labour outlays (ESA95 D1), the transfers to the
institutional sectors (ESA95 D4+D51+D6+D7+D8) and the taxes on income paid to the
government by the non-residents (ESA95 D51A). The net saving of the external sector is
recorded in cells (62-63,65) and as mentioned above represents the current account balance. All
these income and expenditure accounts have already been explained in the previous sub-sections
and their position in the SAM identified.
At this stage, it is worth pointing out that one methodological adjustment, related to the direct
purchases of commodities abroad by the residents and the purchases in the domestic territory by
the non-residents, is necessary. The imports and exports by commodity recorded in the supply
and use tables for Luxembourg do not show these purchases by commodity but only their total

48
amounts22
. Thus, the direct purchases abroad by the residents were added to the imports and the
purchases in the domestic territory by the non-residents were added to the exports. Further, as
mentioned in section 3.1.7, to calculate the consumption by the national households‟, the direct
purchases abroad by the residents needed to be added to the total consumption by the national
households‟ and the purchases in the domestic territory by the non-residents to be subtracted. The
high share of purchases in the domestic territory by the non-residents with respect to the total
consumption is a reflection of the consumption of some 150 000 cross-border workers coming to
work to Luxembourg on daily basis.
The Luxembourg economy is highly oriented to service exports and this is reflected in its exports
figures. The exports of financial intermediation services represent 54 percent of the total exports
in 2007 with an additional five percent accounting for exports of business activities. These figures
clearly reflect the importance of the financial sector for the economy of Luxembourg (142
commercial banks in December 2011). The exports of manufactured commodities represent
around 24 percent of the total exports in 2007. Group Arcelor Mittal (steel industry), GoodYear
SA (production of rubber commodities), Group Guardian (glass industry), DuPont de Nemours
(production of plastic commodities) and Euro Composites SA and Tarkett GDL SA (production
of plastic commodities) contribute significantly to the exports of manufactured commodities and
to employment in these sectors.
The imports are also characterised by a high degree of concentration in the financial services and
insurance (including services auxiliary to financial intermediation), representing 48 percent of
total imports in 2007. The manufacturing commodities represent 31 percent and business
activities 13 percent of the total. These shares clearly indicate that Luxembourg imports are also
service-oriented although less than exports: financial services represent the highest share.
Furthermore, as a member of the European Union, the country has to meet well-defined financial
obligations. Table 12 shows how EU transactions in Luxembourg contribute to the general
government revenue and expenditure. The figures indicate that the government contributes
significantly more to the EU budget than what it receives, with an excess of 245 million euros
being paid to the EU budget in 2007. The amount of 208 million euros (including current
international co-operation and European Community (EC) fourth own resource), that the
government contributes is recorded in the account of government transfers to the ROW, cell
(65,39). The indirect taxes transferred to the EU budget are recorded in the cells (65,41-44) and
the subsidies on production received from the EU budget in cell (65,53) with a negative sign
representing an expense for external account. Furthermore, the EU current expenditure in
Luxembourg (except subsidies) is recorded in the account “remittances from abroad”, cell
(39,65).
22
The direct purchases abroad by the residents and the purchases in the domestic territory by the non-
residents by commodity data are not published. The latter row data has been directly communicated to the
author by Statec on personal request. The author calculated the necessary adjustment further.

49
Table 12: EU transactions in Luxembourg contributing to general government revenue and
expenditure (in millions of euros)
ESA codes Item no. 2007
Payments by Member State to EC Budget 1=2+4+5+7 282
Indirect taxes received by EC Budget D.2 2 74
of which VAT received by EC Budget D.211 3 49
Current international co-operation paid by government to EC Budget D.74 4 9
Miscellaneous current transfers paid by government to EC Budget D.75 5 199
of which EC fourth own resource 6 199
Capital transfers paid by government to EC Budget D.9 7 0
EU expenditure in Member State 8=9+10+11+12+13 37
Subsidies paid by EC Budget D.3 9 21
Current transfers paid by EC Budget to government D.74+D.75 10 5
Current transfers paid by EC Budget to non-government D.75 11 0
Capital transfers paid by EC Budget to government D.9 12 16
Capital transfers paid by EC Budget to non-government D.9 13 -4
Net receipts from EC Budget (net receiver +, net payer -) 14=8-1 -245
Sources: Statec (2011d) and author’s calculations.
3.1.9 Taxes and subsidies accounts
The taxes and subsidies accounts are disaggregated according to the type of tax or subsidy. They
include the VAT (ESA95 D211), the import tariffs (SEC95 D212), the taxes on products - except
the VAT and the import tariffs – (ESA95 D214), the taxes on capital (ESA95 D51B+D59), the
taxes on production (ESA95 D29), the taxes on labour (ESA95 D61), the subsidies on
commodities (ESA95 D31) and the subsidies on production (ESA95 D39). The VAT and taxes on
products account represent one single account in national accounts but are further disaggregated
in this SAM following ESA95 nomenclature (Statec, 2010b) in VAT on intermediate
consumption, VAT on final consumption, VAT on gross capital formation (including changes on
inventories) and VAT on exports.
In the rows, the taxes accounts (rows 41-44 and 46-52 in the SAM) show the payments of taxes
made to this account by commodities, production activities and institutional sectors. In the
columns, the revenue from these taxes is transferred to the government sector account. The
subsidies‟ accounts (rows 45 and 53 in the SAM) show in the rows the subsidies on commodities
and the direct subsidies transferred to the production activities. Thus, they are recorded with a
negative sign. In the columns, the subsidies expenditures are transferred from the government,
cell (39,45) and cell (39,53), and from the external sector, cell (65,53). These are recorded again
with a negative sign. The structure of the tax revenues as a percentage of GDP has already been
discussed in sections 3.1.1 and 3.1.2 of this paper.
The aggregated data on taxes and subsidies by commodity and by production activity for the year
2007 is published in the supply and use tables (Statec, 2010b). Furthermore, the disaggregated

50
data of taxes and subsidies by commodity and by production activity have been directly provided
to the author by Statec.
Both the direct subsidies to production activities as well as the subsidies on commodities
represent about 0.8 percent of GDP in 2007. The total amount of each subsidy appears low when
analysed as a percentage of GDP, but is significant for some specific production activities and
commodities that are still highly subsidised by the government. For example, four production
activities receive around 75 percent of the total subsidies to the production activities, namely: the
agriculture sector, the real estate activities and renting; transport, storage and communication; and
manufacturing. Finally, the situation is even more striking for the subsidies on commodities
where almost the total amount of subsidies is allocated to one single commodity “transport,
storage and communication”, reflecting the still very high participation of the government in the
public sector enterprises (e.g. National Railway Company (CFL) and Post and
Telecommunications (PTT)).
The taxes on savings income paid by the residents and the non residents (ESA95
D51A07+D51A08) are recorded in cells (50-51,38). These taxes are collected by the banks on
behalf of government. For the residents, the tax rate has been fixed through the national
legislation to 10 percent (fixed rate) of savings income. For the non-residents, the tax rate has
been fixed by the European council23
directive, to 15 percent on savings revenue in 2007. More
details regarding this specific tax are given in section 3.1.6 of this paper.
3.1.10 Transactions costs accounts
In the commodities accounts the transition from the supply of commodities valued at basic prices
to the use of commodities values at purchaser‟s prices requires reallocating the trade and transport
margins. Thus, the transactions costs accounts register the trade and transport margins associated
with the trade flows. These accounts are distinguished according to the transaction costs
associated with intermediate consumption, household consumption, gross capital formation and
exports. The aggregate figures are provided in the supply table for 2007 (Statec, 2010b) and the
disaggregated data have been directly communicated to the author by Statec.
The trade margins represent the distribution costs and are given by the difference between the
actual prices of products that are purchased for resale and the prices that the distributor has to pay
to replace the goods at the time they are sold. Transport margins include the transportation costs
paid separately by the purchaser, which are included in the purchaser‟s prices but not in the basic
prices of a manufacturer‟s output or in the trade margins of wholesale or retail traders (Eurostat
and European Commission, 1996). Thus, the trade and transport margins on intermediate
consumption, on household consumption and gross formation, reflect the distribution and
23
Council directive 2003/48/EC of 3 June 2003 on taxation of savings income in the form of interest
payments.

51
transportation costs of transferring commodities from the purchasers to the domestic consumers
and are recorded in cells (54-56,1-17) and cells (58-60,1-17). The transaction costs for imports
represent the distribution and transportation costs of transferring commodities from the border to
the domestic consumer and the transaction costs for exports show the distribution and
transportation costs of transferring the commodity from the producer to the border, and these
costs are recorded in cells (57,1-17) and in cells (61,1-17).
The total trade costs associated with the intermediate consumption, household consumption, gross
capital formation and exports are equal to the sum of the trade margins of the sector “Wholesale
and retail trade, repair of motor vehicles, motorcycles and personal and household goods
services” (sec6 in the SAM), recorded in the columns, cells (6,54-57). Similarly, the total
transportation costs on intermediate consumption, household consumption, gross capital
formation and exports equal the transport margins of the sector: “Transport, storage and
communication” (sec8 in the SAM), recorded in cells (8,58-61).
3.1.11 Savings-investment account and changes in stocks account
The savings-investment account (on the row) shows not only the consumption of fixed capital in
the production process (depreciation) but also the net savings of non-financial and financial
corporations, government, households, and external sector. The demand for investment
commodities is presented in the column. The calculation of depreciation has already been
presented in sub-section 3.1.2 of this paper. The value of depreciation has been subtracted from
savings to compute the net savings for each institutional sector.
The savings-investment account is further split into public and private sector accounts. Public
sector account registers all the government capital account transactions and books the
consumption of fixed capital in the production process (ESA95 public sector share in K1),
government savings (ESA95 B.8n) and capital transfers, receivable (ESA95 D9) including
acquisitions less disposals of non-produced non-financial assets (ESA95 K2), and government net
savings borrowed to the ROW recorded with negative sign (ESA95 B9) representing a part of
foreign savings on the row, and demand for government investment commodities
(ESA95 P51), capital transfers, payable (ESA95 D9), on the column.
The private sector account books the consumption of fixed capital of the private sector
(ESA95 private sector share in K1), capital transfers payable by government to the private sector
(ESA95 D9), net transfers among private institutional sectors (ESA 95 D9+K2) and finally, non-
financial and financial corporations, households‟ and a part of foreign savings (ESA95 B.8n) on
the row, and demand for private investment commodities (ESA95 P51) and capital transfers,
receivable by the government (ESA95 D9+K2) on the column. Foreign sector savings,
cells (62-63,65), represent the balance of the current account. In this case having a negative sign

52
indicates the surplus of the national current account of around 8.7 percent of GDP in 200724
. The
demand for investment commodities has already been discussed in section 3.1.1 of this paper.
The changes in stocks account (inventories) represent the demand for inventories on the column
and have also already been presented in section 3.1.1. The account is closed through the savings-
investment account, cells (64,62-63), on the row.
3.2 Financial accounts in the SAM
The adjunction of financial transactions in a real SAM requires two new blocs of accounts: the
capital accounts belonging to institutional sectors and the financial instruments that include the
financial assets and liabilities. This means that each institutional sector has its own current and
capital accounts.
The Luxembourg SAM with the financial accounts follows the structure of the financial SAM
basic framework presented in Table 4. The financial SAM for Luxembourg incorporates the six
capital accounts for the following sectors: non-financial corporations, central bank, other
financial corporations, government, households and the rest of the world. The second financial
bloc consists of 16 flow accounts assigned to the 16 financial assets and liabilities. For the
disaggregation of these flows the ESA95 nomenclature has been applied, where the financial
instruments can be identified as presented in Table 13.
To retain the consistency between the real accounts and the financial accounts, it is important, as
for the real accounts, to start by developing an aggregate (macro) financial SAM. Table 15
presents this aggregate SAM, including the financial accounts for Luxembourg. The full
disaggregated financial SAM is presented in Appendix C. However, the main components of the
financial accounts newly introduced in the real SAM are presented in the following sub-sections.
24
This figure is different (1.4 percent of GDP lower) from the figure published by Central Bank of
Luxembourg (BCL, 2010) within Balance of Payments (BoP) framework (compiled together with national
statistical office – Statec). According to the information directly received from Statec, this difference might
be explained by two main reasons. First, national accounts framework and BoP framework produce results
of exports and imports that differ as they use different sources of information and the cycle of production is
different. Second, methodological differences are still present (e.g. FISIM is included in services in
national accounts and rather in revenues in BoP). With new reference publications of the system of national
accounts and BoP this difference should vanish.
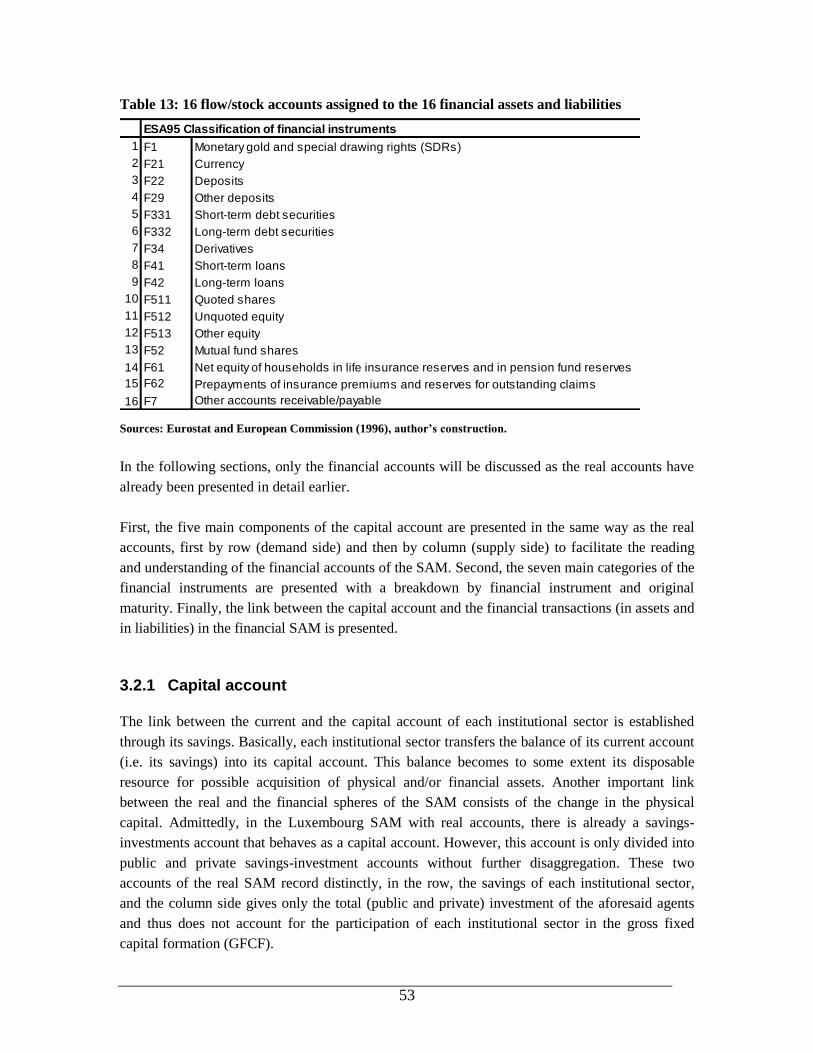
53
Table 13: 16 flow/stock accounts assigned to the 16 financial assets and liabilities
ESA95 Classification of financial instruments
1 F1 Monetary gold and special drawing rights (SDRs)
2 F21 Currency
3 F22 Deposits
4 F29 Other deposits
5 F331 Short-term debt securities
6 F332 Long-term debt securities
7 F34 Derivatives
8 F41 Short-term loans
9 F42 Long-term loans
10 F511 Quoted shares
11 F512 Unquoted equity
12 F513 Other equity
13 F52 Mutual fund shares
14 F61 Net equity of households in life insurance reserves and in pension fund reserves
15 F62 Prepayments of insurance premiums and reserves for outstanding claims
16 F7 Other accounts receivable/payable
Sources: Eurostat and European Commission (1996), author’s construction.
In the following sections, only the financial accounts will be discussed as the real accounts have
already been presented in detail earlier.
First, the five main components of the capital account are presented in the same way as the real
accounts, first by row (demand side) and then by column (supply side) to facilitate the reading
and understanding of the financial accounts of the SAM. Second, the seven main categories of the
financial instruments are presented with a breakdown by financial instrument and original
maturity. Finally, the link between the capital account and the financial transactions (in assets and
in liabilities) in the financial SAM is presented.
3.2.1 Capital account
The link between the current and the capital account of each institutional sector is established
through its savings. Basically, each institutional sector transfers the balance of its current account
(i.e. its savings) into its capital account. This balance becomes to some extent its disposable
resource for possible acquisition of physical and/or financial assets. Another important link
between the real and the financial spheres of the SAM consists of the change in the physical
capital. Admittedly, in the Luxembourg SAM with real accounts, there is already a savings-
investments account that behaves as a capital account. However, this account is only divided into
public and private savings-investment accounts without further disaggregation. These two
accounts of the real SAM record distinctly, in the row, the savings of each institutional sector,
and the column side gives only the total (public and private) investment of the aforesaid agents
and thus does not account for the participation of each institutional sector in the gross fixed
capital formation (GFCF).
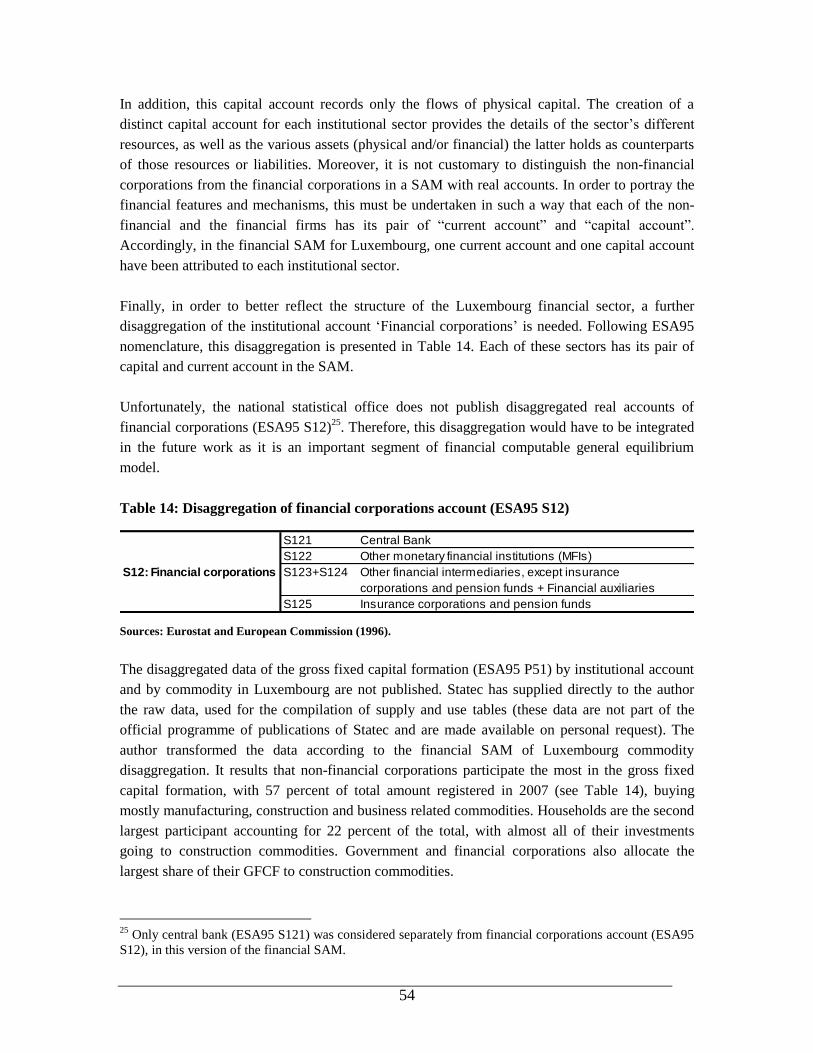
54
In addition, this capital account records only the flows of physical capital. The creation of a
distinct capital account for each institutional sector provides the details of the sector‟s different
resources, as well as the various assets (physical and/or financial) the latter holds as counterparts
of those resources or liabilities. Moreover, it is not customary to distinguish the non-financial
corporations from the financial corporations in a SAM with real accounts. In order to portray the
financial features and mechanisms, this must be undertaken in such a way that each of the non-
financial and the financial firms has its pair of “current account” and “capital account”.
Accordingly, in the financial SAM for Luxembourg, one current account and one capital account
have been attributed to each institutional sector.
Finally, in order to better reflect the structure of the Luxembourg financial sector, a further
disaggregation of the institutional account „Financial corporations‟ is needed. Following ESA95
nomenclature, this disaggregation is presented in Table 14. Each of these sectors has its pair of
capital and current account in the SAM.
Unfortunately, the national statistical office does not publish disaggregated real accounts of
financial corporations (ESA95 S12)25
. Therefore, this disaggregation would have to be integrated
in the future work as it is an important segment of financial computable general equilibrium
model.
Table 14: Disaggregation of financial corporations account (ESA95 S12)
S121 Central Bank
S122 Other monetary financial institutions (MFIs)
S123+S124 Other financial intermediaries, except insurance
corporations and pension funds + Financial auxiliaries
S125 Insurance corporations and pension funds
S12: Financial corporations
Sources: Eurostat and European Commission (1996).
The disaggregated data of the gross fixed capital formation (ESA95 P51) by institutional account
and by commodity in Luxembourg are not published. Statec has supplied directly to the author
the raw data, used for the compilation of supply and use tables (these data are not part of the
official programme of publications of Statec and are made available on personal request). The
author transformed the data according to the financial SAM of Luxembourg commodity
disaggregation. It results that non-financial corporations participate the most in the gross fixed
capital formation, with 57 percent of total amount registered in 2007 (see Table 14), buying
mostly manufacturing, construction and business related commodities. Households are the second
largest participant accounting for 22 percent of the total, with almost all of their investments
going to construction commodities. Government and financial corporations also allocate the
largest share of their GFCF to construction commodities.
25
Only central bank (ESA95 S121) was considered separately from financial corporations account (ESA95
S12), in this version of the financial SAM.
55
The consumption of fixed capital (ESA95 K1) was also disaggregated by institutional sector. As
the logical result of the respective contributions to overall GFCF formation, non-financial
corporations account for the largest share with 52 percent of the total capital depreciation,
followed by households‟ with 23 percent.
The whom-to-whom matrix can also be identified in the capital account of the institutional
sectors. This matrix incorporates transactions of capital transfers payable/receivable (ESA95 D9)
among sectors as well as the acquisitions less disposals of non-produced non-financial assets
(ESA95 K2). Shaded cells of the south-eastern area of the financial SAM in Table 15 represent
these transfers. The households are the largest beneficiary of capital transfers among institutional
sectors, followed by non-financial corporations. Both of them receive important amounts from the
government and the households also from the non-financial corporations. Moreover, the
government also distributes important capital transfers to the external sector.
The capital account also allows the identification of changes in inventories by institutional sector.
This account incorporates the changes in inventories (ESA95 P52) and the acquisitions less
disposals of valuables (ESA95 P53). The non-financial corporations generate the total amount of
increased inventories. This accumulation is reduced by the fact that disposals of valuables were
more significant than acquisitions in 2007, and this is recorded almost entirely in the account of
the financial corporations.

56
Table 15: Aggregated SAM with real and financial accounts for Luxembourg (2007) in outline (in millions of euros)
A C C OUN T S C o m P ro d T axes SubsC h. in
sto cks
F inancial
inst .T o tal
C apital Labo ur S11 S12 S13 S1M S2 S11 S12 S13 S1M S2
C o m 69'636 5'535 12'002 65'956 4'405 445 1'236 1'690 0 69160'974
P ro d 103'443 103'443
C apital 10'987 10'987
Labo ur 12'130 1'040 13'170
S11 4'853 0 2'087 149 89 7'797 14'976
S12 3'692 3'938 241 84 965 132'112141'031
S13 127 141 436 0 11 45 13'557 -562 13'755
S1M 2'316 8'123 172 1'346 3'957 0 33816'252
S2 53'847 5'047 9'206 134'186 1'626 539 3 74 -21204'508
T axes 3'978 6'975 111 2'104 463 13'631
Subsidies -294 -288 -582
S11 2'074 1'519 0 0 266 0 0 109'625 113'484
S12 403 2'623 0 0 9 0 0 508'140 511'175
S13 602 2'404 33 0 0 58 16 378 3'491
S1M 924 541 302 0 97 0 31 2'743 4'637
S2 -3'246 58 28 131 2 0 473'717 470'691
C h. in sto ck 179 -113 2 1 069
F inancial inst . 108'507 510'814 1'751 2'887 470'644 1'094'603
T o tal 160'974 103'443 10'987 13'170 14'976 141'031 13'755 16'252 204'508 13'631 -582 113'484 511'175 3'491 4'637 470'691 69 1'094'603
Inst itut io nal secto rs: capital acco unt
Inst itut io nal
secto rs:
capital
acco unt
F acto rs o f pro d. Inst itut io nal secto rs: current acco unt
Inst itut io nal
secto rs:
current
acco unt
F acto rs o f
pro ductio ns
Source: Author’s calculations.
Note: For presentation purposes, transaction costs are integrated in domestically produced commodities for the domestic market, the taxes less subsides account is split (in taxes
and subsidies).
Institutional sector S12 – financial corporations is further disaggregated into four accounts: S121 – Central bank; S122 – Other MFIs; S123+S124 – Other financial
intermediaries, except insurance corporations and pension funds + Financial auxiliaries; and S125 – Insurance corporations and pension funds. The detailed accounts are
presented in disaggregated financial SAM in Appendix C.
Notations: S11 - non-financial corporations; S12 - financial corporations, S13 - government; S1M - households and NPISHs; S2 - external sector, Com-Commodity; Sec-Sector.
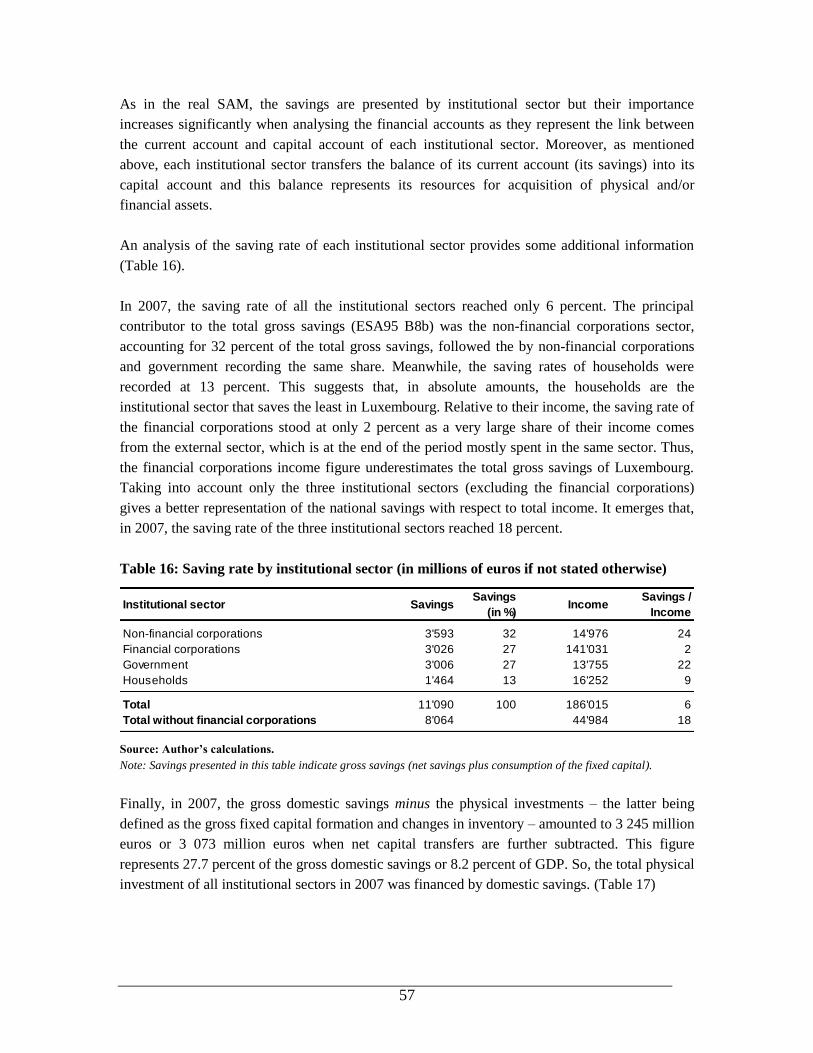
57
As in the real SAM, the savings are presented by institutional sector but their importance
increases significantly when analysing the financial accounts as they represent the link between
the current account and capital account of each institutional sector. Moreover, as mentioned
above, each institutional sector transfers the balance of its current account (its savings) into its
capital account and this balance represents its resources for acquisition of physical and/or
financial assets.
An analysis of the saving rate of each institutional sector provides some additional information
(Table 16).
In 2007, the saving rate of all the institutional sectors reached only 6 percent. The principal
contributor to the total gross savings (ESA95 B8b) was the non-financial corporations sector,
accounting for 32 percent of the total gross savings, followed the by non-financial corporations
and government recording the same share. Meanwhile, the saving rates of households were
recorded at 13 percent. This suggests that, in absolute amounts, the households are the
institutional sector that saves the least in Luxembourg. Relative to their income, the saving rate of
the financial corporations stood at only 2 percent as a very large share of their income comes
from the external sector, which is at the end of the period mostly spent in the same sector. Thus,
the financial corporations income figure underestimates the total gross savings of Luxembourg.
Taking into account only the three institutional sectors (excluding the financial corporations)
gives a better representation of the national savings with respect to total income. It emerges that,
in 2007, the saving rate of the three institutional sectors reached 18 percent.
Table 16: Saving rate by institutional sector (in millions of euros if not stated otherwise)
Institutional sector Savings Savings
(in %)Income
Savings /
Income
Non-financial corporations 3'593 32 14'976 24
Financial corporations 3'026 27 141'031 2
Government 3'006 27 13'755 22
Households 1'464 13 16'252 9
Total 11'090 100 186'015 6
Total without financial corporations 8'064 44'984 18
Source: Author’s calculations.
Note: Savings presented in this table indicate gross savings (net savings plus consumption of the fixed capital).
Finally, in 2007, the gross domestic savings minus the physical investments – the latter being
defined as the gross fixed capital formation and changes in inventory – amounted to 3 245 million
euros or 3 073 million euros when net capital transfers are further subtracted. This figure
represents 27.7 percent of the gross domestic savings or 8.2 percent of GDP. So, the total physical
investment of all institutional sectors in 2007 was financed by domestic savings. (Table 17)
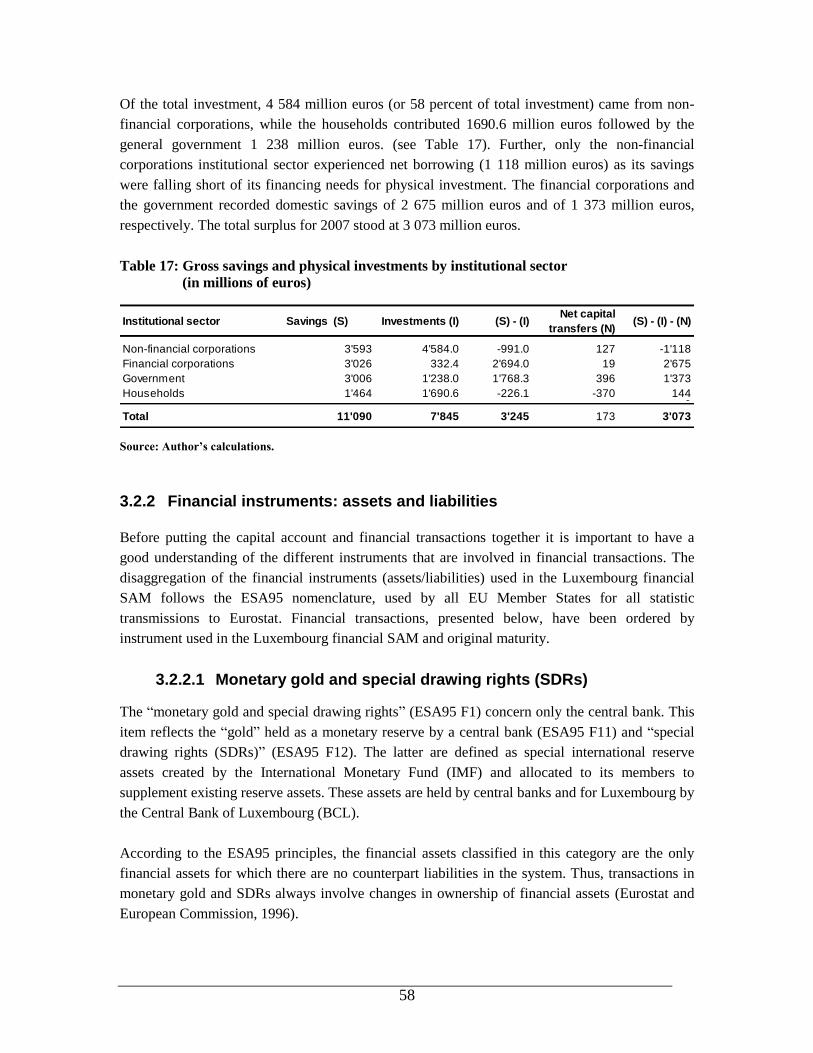
58
Of the total investment, 4 584 million euros (or 58 percent of total investment) came from non-
financial corporations, while the households contributed 1690.6 million euros followed by the
general government 1 238 million euros. (see Table 17). Further, only the non-financial
corporations institutional sector experienced net borrowing (1 118 million euros) as its savings
were falling short of its financing needs for physical investment. The financial corporations and
the government recorded domestic savings of 2 675 million euros and of 1 373 million euros,
respectively. The total surplus for 2007 stood at 3 073 million euros.
Table 17: Gross savings and physical investments by institutional sector
(in millions of euros)
Institutional sector Savings (S) Investments (I) (S) - (I)Net capital
transfers (N)(S) - (I) - (N)
Non-financial corporations 3'593 4'584.0 -991.0 127 -1'118
Financial corporations 3'026 332.4 2'694.0 19 2'675
Government 3'006 1'238.0 1'768.3 396 1'373
Households 1'464 1'690.6 -226.1 -370 1440
Total 11'090 7'845 3'245 173 3'073
Source: Author’s calculations.
3.2.2 Financial instruments: assets and liabilities
Before putting the capital account and financial transactions together it is important to have a
good understanding of the different instruments that are involved in financial transactions. The
disaggregation of the financial instruments (assets/liabilities) used in the Luxembourg financial
SAM follows the ESA95 nomenclature, used by all EU Member States for all statistic
transmissions to Eurostat. Financial transactions, presented below, have been ordered by
instrument used in the Luxembourg financial SAM and original maturity.
3.2.2.1 Monetary gold and special drawing rights (SDRs)
The “monetary gold and special drawing rights” (ESA95 F1) concern only the central bank. This
item reflects the “gold” held as a monetary reserve by a central bank (ESA95 F11) and “special
drawing rights (SDRs)” (ESA95 F12). The latter are defined as special international reserve
assets created by the International Monetary Fund (IMF) and allocated to its members to
supplement existing reserve assets. These assets are held by central banks and for Luxembourg by
the Central Bank of Luxembourg (BCL).
According to the ESA95 principles, the financial assets classified in this category are the only
financial assets for which there are no counterpart liabilities in the system. Thus, transactions in
monetary gold and SDRs always involve changes in ownership of financial assets (Eurostat and
European Commission, 1996).
59
Purchases (sales) of monetary gold are recorded in the financial accounts of the central bank as
increases (decreases) in financial assets. The counterpart entries are decreases (increases) in the
financial assets of the external sector. Further, changes in SDRs hold by a central bank can arise
mostly through SDR payments to or receipts from the IMF. They are recorded in the financial
accounts of the central bank and the external sector, respectively.
3.2.2.2 Currency and deposits
This item (ESA95 F2) includes “currency” (ESA95 F21) which is an asset for the holders and a
liability for the issuer, mainly central bank. The account consists of all the transactions in
currency, meaning notes and coins in circulation. All the domestic sectors and the external sector
may hold currency (Eurostat and European Commission, 1996). It is issued by the central bank,
the central government, the external sector and in exceptional cases other monetary financial
institutions. This item also includes the “transferable deposits” (ESA95 F22) - which includes the
current bank accounts - as well as “other deposits” (ESA95 F29). The transferable deposits
consist of all the transactions in transferable deposits, meaning the deposits which are
immediately convertible into currency or which are easily transferable (without any kind of
significant penalty). All the sectors in the domestic economy and the external sector may hold
transferable deposits. They are liabilities predominantly of monetary financial institutions and the
external sector, and sometimes of general government. On the other hand, other deposits consist
of the deposits other than transferable deposits (e.g. time deposits or savings deposits). These
deposits cannot be used to make payments at any time and they are not convertible into currency
or transferable deposits without any kind of significant restriction or penalty. All sectors in the
economy may hold other deposits. They are liabilities mostly of monetary financial institutions
and the external sector but also of general government (Eurostat and European Commission,
1996). Furthermore, this item (ESA95 F2) does not exactly correspond to the monetary
aggregates.
3.2.2.3 Securities other than shares
The “securities other than shares” item (ESA95 F3) is divided into two sub-categories: “securities
other than shares”, excluding financial derivatives (ESA95 F33); and “financial derivatives”
(ESA95 F34). The first sub-item is sub-classified by maturity into short-term and long-term and
includes, in particular, the securities issued by the public treasury to finance the public deficit but
also all other bonds, including those issued by corporations. They are defined as securities which
give the holder the unconditional right to a fixed or contractually determined variable money
income in the form of coupon payments (interest) and/or a stated fixed sum on specified date or
dates or starting from a date fixed at the time of issue. The short-term securities mostly include:
treasury bills, negotiable short-term paper issued by financial and by non-financial corporations,
securities issued under long-term underwritten note issuance facilities and bankers‟ acceptances.
The, long-term securities include a larger range of securities and the most important are: bearer
bonds, subordinated bonds, bonds with optional maturity dates, undated and perpetual bonds,

60
zero-coupon bonds, Eurobonds or index-linked security (Eurostat and European Commission,
1996).
The second sub-item, financial derivatives, represents a large item and it almost exclusively
tackles interbank refinancing. Financial derivatives might be defined as financial assets based on
or derived from a different underlying instrument. The underlying instrument is usually another
financial asset, but may also be a commodity or an index (Eurostat and European Commission,
1996). Financial derivatives are also referred to as secondary instruments but also as hedging
instruments (since risk avoidance frequently underpins their creation). They include: options,
warrants, futures, swaps and forward rate agreements.
3.2.2.4 Loans
The “loans” (ESA95 F4) item contains all the financial assets that are created when creditors lend
funds directly or through brokers to debtors. It includes consumer loans, housing loans and loans
to business. As the previous instrument (Securities other than shares), it is sub-classified by
maturity into short-term loans (below one year and repayable on demand) and long-term loans
(above one year). This breakdown has its limitations. First, loans are sometimes renegotiable.
Second, a long-term loan nearing the end of its life becomes a short-term loan. Standard long-
term loans are offered in most cases by financial corporations and often granted to households
and non-financial corporations. The item loans (short and long term) includes: balances on
current accounts, short-term repurchase agreements, loans arising from non-monetary gold swaps,
loans to finance trade credits, mortgage loans, consumer credits, revolving credits, etc. Loans may
be financial assets or liabilities of all the sectors in the economy and the ROW. However,
monetary financial institutions have normally no short-term loan liabilities in the system.
3.2.2.5 Shares and other equity (including shares issued by investment funds, such as mutual funds)
The “shares and other equity” item (ESA95 F5) includes shares in both quoted (ESA95 F511) and
unquoted (ESA95 F512) companies, as well as “other equities” (ESA95 F513). Furthermore,
“mutual funds shares” (ESA95 F52) represent another sub-item. Shares and other equity
(excluding mutual funds shares) are defined as financial assets which represent property rights on
corporations or quasi-corporations. These financial assets generally entitle the holders to a share
in the profit of the corporations or quasi-corporations and to a share in their net assets in the event
of liquidation (Eurostat and European Commission, 1996). Quoted and unquoted shares include:
capital shares, redeemed shares, dividend shares, preferred shares. And the “Other equity”
incorporates all forms of equity in corporations which are not shares, investment by government
in the capital of public enterprises, government investment in the capital of international and
supranational organisations (e.g. The European Investment Bank), etc. Furthermore, it remains
very difficult to value the unquoted companies, as it is very complicated to estimate what their
market price would be (since by definition there is no market for them). Moreover, the shares are
61
shown as liabilities of corporations in the national accounts, although these are not debt of
companies but constitute a part of their “own funds”.
The the sub-category mutual funds shares is defined as shares issued by a specific type of
financial corporation (e.g. named according to country, mutual funds, unit trusts, investment
trusts and other collective investment schemes) whose exclusive purpose is to invest the funds
collected on the money market, the capital market and/or in real estate (Eurostat and European
Commission, 1996). These shares might be quoted or unquoted. When they are unquoted, they
are usually repayable on request, at a value corresponding to their share in the own funds of the
financial corporation. These own funds are revaluated regularly on the basis of the market prices
of their various components. The shares in the investment funds are shares which are held
indirectly, often through portfolios managed by banks and financial corporations (including
property portfolios). This item becomes more important as households tend to prefer this kind of
products compared to the direct holding of shares and bonds.
3.2.2.6 Insurance technical reserves
The “insurance technical reserves” (ESA95 F6) are divided into two sub-items: “net equity of
households in life insurance reserves and in pension funds reserves” (ESA95 F61) and
“prepayments of insurance premiums and reserves for outstanding claims” (ESA95 F62).
In terms of holdings, the first sub-item represents the cumulative value of the savings invested by
the households in life insurance contracts and in capitalisation pension funds. The value of these
assets is attributed to the households in the national accounts, despite the fact that these assets in
firm accounting appear in the balance sheets of the corporations‟ managing these funds.
According to Lequiller and Blandes (2006), this attribution is a correct representation of the
economic reality, since the savings belong to the households and not to the corporations‟
managing them. Furthermore, at some stage, these amounts will be returned to the households in
the form of annuities or retirement pensions. The forthcoming version of European System of
national Accounts (ESA2010) will tackle this issue and it will also incorporate the implicit debts
of the pension plans known as “pay-as-you-go” of each institutional sector. Currently, the
institutional differences among countries regarding the pension plans (capitalisation versus pay-
as-you-go) generate very significant differences in the financial accounts, making international
comparisons difficult.
Finally, the second sub-item represents the prepayments of non-life insurance premiums and
outstanding claims on insurance companies. The reserves for outstanding claims are held by the
insurance corporations in order to cover the amounts they expect to pay out in respect of claims
that are not yet settled (e.g. they are disputed). The reserves for outstanding claims are financial
assets of the beneficiaries that may belong to any sector of the economy or to the ROW.
62
3.2.2.7 Other accounts receivable/payable
The “other accounts receivable/payable” (ESA95 F7) item also contains two sub-items: “trade
credits and advances” (ESA95 F71) and “other accounts receivable/payable, except trade credits
and advances” (ESA95 F79). It consists of all the transaction in the other accounts
receivable/payable that is financial claims which are created as a counter-part of a financial or a
non-financial transaction in cases where there is a timing difference between this transaction and
the corresponding payment (Eurostat and European Commission, 1996). The first sub-item is a
substantial account, which includes the credits related to commercial transactions26
. The second
includes all the implicit credits related to wages and salaries, taxes, social contributions,
dividends, interest, rents, etc. The national accounts record transactions following the “accrual
accounting” rules. This means that a transaction must be recorded in such a way that the accounts
reflect at any moment the value of the agents‟ entitlements and obligations27
(Lequiller and
Blades, 2006).
3.2.3 Capital account and financial account by institutional sector
The financial account deals with the financial transactions (in terms of assets and liabilities)
taking place between the institutional units (non-financial corporations, financial corporations,
government and households), and them and the external sector. It shows on its left side the
acquisitions less disposals of financial assets, while its right side shows the incurrence of
liabilities less their repayment. In other words, the financial account shows how the surplus or
deficit on the capital account is financed by transactions in financial assets and liabilities. Thus,
the balance of the financial account (net acquisition of financial assets less net incurrence of
liabilities) is equal to the net lending/net borrowing, the balancing item of the capital account.
In 2007, financial investments (assets) by the institutional sectors reached an amount of 514 927
million euros, whereas the Luxembourg‟s economy generated sources of funds amounting to
511 854 million euros. The national economy in total experienced a surplus of 3 073 million
euros or 8.2 percent of GDP used to finance the external sector recording deficit (see Table 18).
26
For example, in France, payments between firms for goods and services are frequently on a 60-days basis,
meaning that the seller delivers the product while accepting payment 60 days later (Lequiller and Blades,
2006). 27
For example, even if an employee‟s salary is paid two or three months late, the salary will be entered in
the month during which the work was carried out, because this is when an obligation to pay was generated
by the employer. Since the salary is entered but has not been paid, there is a claim by the employee on the
firm, which is recorded in ESA95 account F79. A similar entry will be made for tax due to the government
but not yet settled.
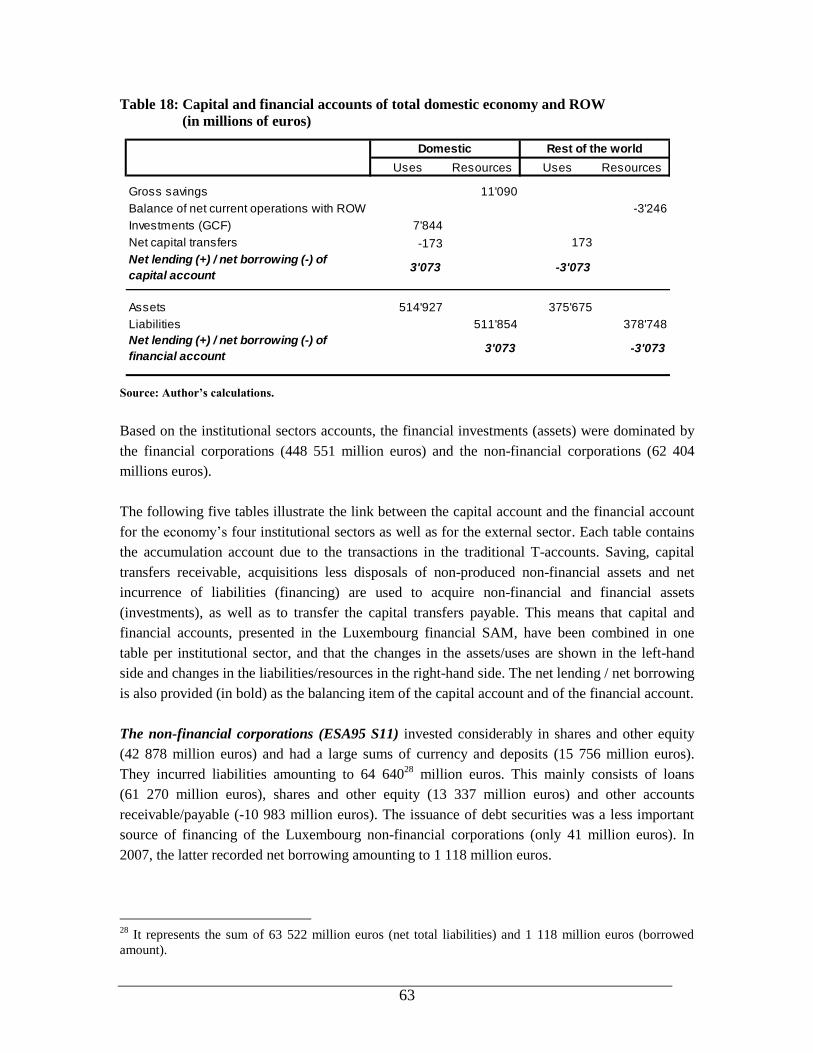
63
Table 18: Capital and financial accounts of total domestic economy and ROW
(in millions of euros)
Uses Resources Uses Resources
Gross savings 11'090
Balance of net current operations with ROW -3'246
Investments (GCF) 7'844
Net capital transfers -173 173
Net lending (+) / net borrowing (-) of
capital account3'073 -3'073
Assets 514'927 375'675
Liabilities 511'854 378'748
Net lending (+) / net borrowing (-) of
financial account3'073 -3'073
Domestic Rest of the world
Source: Author’s calculations.
Based on the institutional sectors accounts, the financial investments (assets) were dominated by
the financial corporations (448 551 million euros) and the non-financial corporations (62 404
millions euros).
The following five tables illustrate the link between the capital account and the financial account
for the economy‟s four institutional sectors as well as for the external sector. Each table contains
the accumulation account due to the transactions in the traditional T-accounts. Saving, capital
transfers receivable, acquisitions less disposals of non-produced non-financial assets and net
incurrence of liabilities (financing) are used to acquire non-financial and financial assets
(investments), as well as to transfer the capital transfers payable. This means that capital and
financial accounts, presented in the Luxembourg financial SAM, have been combined in one
table per institutional sector, and that the changes in the assets/uses are shown in the left-hand
side and changes in the liabilities/resources in the right-hand side. The net lending / net borrowing
is also provided (in bold) as the balancing item of the capital account and of the financial account.
The non-financial corporations (ESA95 S11) invested considerably in shares and other equity
(42 878 million euros) and had a large sums of currency and deposits (15 756 million euros).
They incurred liabilities amounting to 64 64028
million euros. This mainly consists of loans
(61 270 million euros), shares and other equity (13 337 million euros) and other accounts
receivable/payable (-10 983 million euros). The issuance of debt securities was a less important
source of financing of the Luxembourg non-financial corporations (only 41 million euros). In
2007, the latter recorded net borrowing amounting to 1 118 million euros.
28
It represents the sum of 63 522 million euros (net total liabilities) and 1 118 million euros (borrowed
amount).
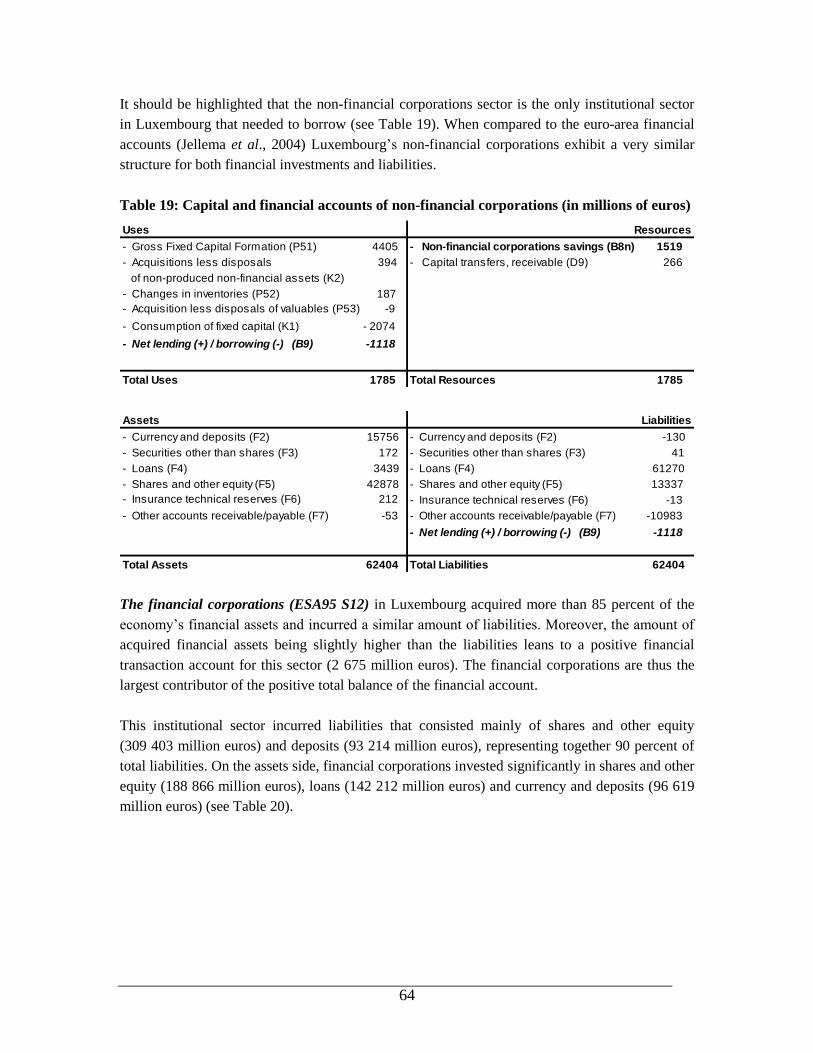
64
It should be highlighted that the non-financial corporations sector is the only institutional sector
in Luxembourg that needed to borrow (see Table 19). When compared to the euro-area financial
accounts (Jellema et al., 2004) Luxembourg‟s non-financial corporations exhibit a very similar
structure for both financial investments and liabilities.
Table 19: Capital and financial accounts of non-financial corporations (in millions of euros)
Uses Resources
- Gross Fixed Capital Formation (P51) 4405 - Non-financial corporations savings (B8n) 1519
- Acquisitions less disposals 394 - Capital transfers, receivable (D9) 266
of non-produced non-financial assets (K2)
- Changes in inventories (P52) 187
- Acquisition less disposals of valuables (P53) -9
- Consumption of fixed capital (K1) - 2074
- Net lending (+) / borrowing (-) (B9) -1118
Total Uses 1785 Total Resources 1785
Assets Liabilities
- Currency and deposits (F2) 15756 - Currency and deposits (F2) -130
- Securities other than shares (F3) 172 - Securities other than shares (F3) 41
- Loans (F4) 3439 - Loans (F4) 61270
- Shares and other equity (F5) 42878 - Shares and other equity (F5) 13337
- Insurance technical reserves (F6) 212 - Insurance technical reserves (F6) -13
- Other accounts receivable/payable (F7) -53 - Other accounts receivable/payable (F7) -10983
- Net lending (+) / borrowing (-) (B9) -1118
Total Assets 62404 Total Liabilities 62404
The financial corporations (ESA95 S12) in Luxembourg acquired more than 85 percent of the
economy‟s financial assets and incurred a similar amount of liabilities. Moreover, the amount of
acquired financial assets being slightly higher than the liabilities leans to a positive financial
transaction account for this sector (2 675 million euros). The financial corporations are thus the
largest contributor of the positive total balance of the financial account.
This institutional sector incurred liabilities that consisted mainly of shares and other equity
(309 403 million euros) and deposits (93 214 million euros), representing together 90 percent of
total liabilities. On the assets side, financial corporations invested significantly in shares and other
equity (188 866 million euros), loans (142 212 million euros) and currency and deposits (96 619
million euros) (see Table 20).
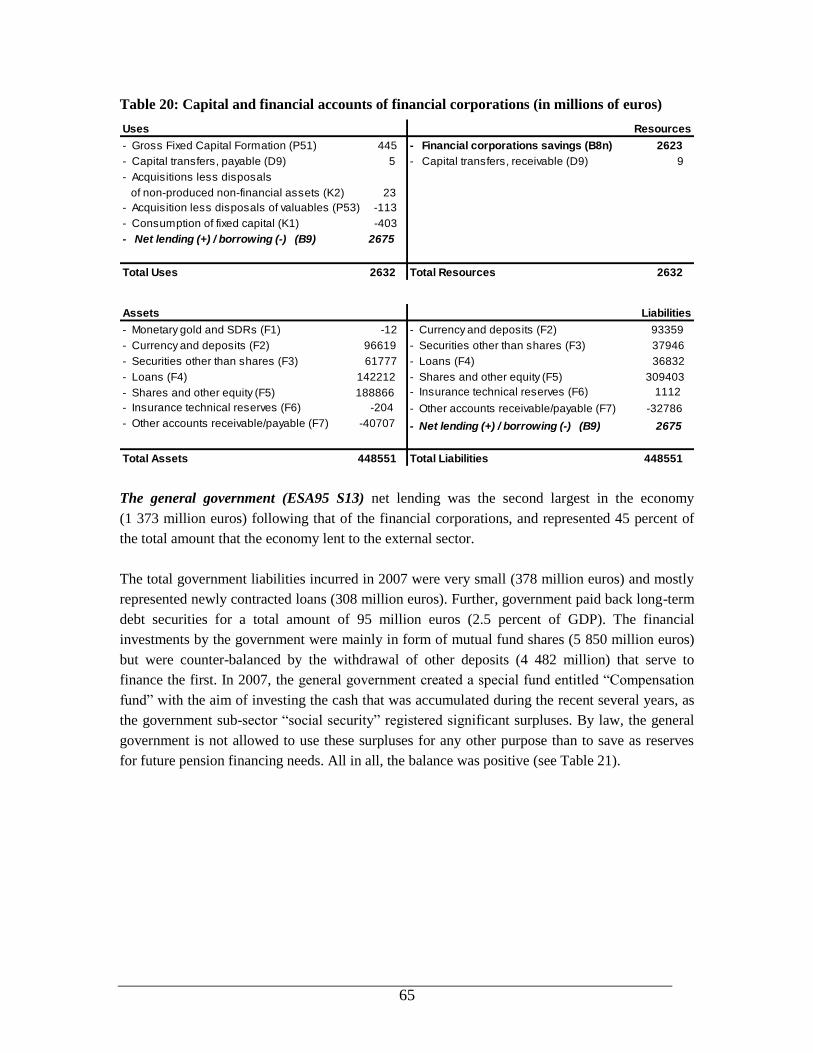
65
Table 20: Capital and financial accounts of financial corporations (in millions of euros)
Uses Resources
- Gross Fixed Capital Formation (P51) 445 - Financial corporations savings (B8n) 2623
- Capital transfers, payable (D9) 5 - Capital transfers, receivable (D9) 9
- Acquisitions less disposals
of non-produced non-financial assets (K2) 23
- Acquisition less disposals of valuables (P53) -113
- Consumption of fixed capital (K1) -403
- Net lending (+) / borrowing (-) (B9) 2675
Total Uses 2632 Total Resources 2632
Assets Liabilities
- Monetary gold and SDRs (F1) -12 - Currency and deposits (F2) 93359
- Currency and deposits (F2) 96619 - Securities other than shares (F3) 37946
- Securities other than shares (F3) 61777 - Loans (F4) 36832
- Loans (F4) 142212 - Shares and other equity (F5) 309403
- Shares and other equity (F5) 188866 - Insurance technical reserves (F6) 1112
- Insurance technical reserves (F6) -204 - Other accounts receivable/payable (F7) -32786
- Other accounts receivable/payable (F7) -40707 - Net lending (+) / borrowing (-) (B9) 2675
Total Assets 448551 Total Liabilities 448551
The general government (ESA95 S13) net lending was the second largest in the economy
(1 373 million euros) following that of the financial corporations, and represented 45 percent of
the total amount that the economy lent to the external sector.
The total government liabilities incurred in 2007 were very small (378 million euros) and mostly
represented newly contracted loans (308 million euros). Further, government paid back long-term
debt securities for a total amount of 95 million euros (2.5 percent of GDP). The financial
investments by the government were mainly in form of mutual fund shares (5 850 million euros)
but were counter-balanced by the withdrawal of other deposits (4 482 million) that serve to
finance the first. In 2007, the general government created a special fund entitled “Compensation
fund” with the aim of investing the cash that was accumulated during the recent several years, as
the government sub-sector “social security” registered significant surpluses. By law, the general
government is not allowed to use these surpluses for any other purpose than to save as reserves
for future pension financing needs. All in all, the balance was positive (see Table 21).

66
Table 21: Capital and financial accounts of government (in millions of euros)
Uses Resources
- Gross Fixed Capital Formation (P51) 1236 - Government savings (B8n) 2404
- Capital transfers, payable (D9) 501 - Capital transfers, receivable (D9) 74
- Acquisition less disposals of valuables (53) 2 - Acquisitions less disposals
- Consumption of fixed capital (K1) -602 of non-produced non-financial assets (K2) 33
- Net lending (+) / borrowing (-) (B9) 1374
Total Uses 2511 Total Resources 2511
Assets Liabilities
- Currency and deposits (F2) -4434 - Currency and deposits (F2) 19
- Securities other than shares (F3) 64 - Securities other than shares (F3) -95
- Loans (F4) 41 - Loans (F4) 308
- Shares and other equity (F5) 5850 - Other accounts receivable/payable (F7) 146
- Other accounts receivable/payable (F7) 230 - Net lending (+) / borrowing (-) (B9) 1373
Total Assets 1751 Total Liabilities 1751
The households including NPISHs (ESA95 S1M) acquired 2 221 million euros of financial
assets which mainly consisted of currency and deposits (3 531 million euros) and insurance
technical reserves (68 million euros) while the households sold securities other than shares for a
total amount of 1 415 million euros. In parallel, on the financial liabilities side, the households
and the NPISHs incurred loans for 2 076 million euros.
As a result, their net lending equalled to 144 million euros. This sector registers the smallest
lending balance among other economy‟s institutional sectors, accounting for only around 5
percent of net lending balance of the financial account. At the euro area level, the households are
actually the only institutional sector that lends as all the other needs to borrow (Jellema et al.,
2004) (see Table 22). Moreover, from the point of view of portfolio composition, Luxembourg
households display a high share of deposits in comparison to the other euro area countries. The
share of deposits amounted about 50 percent of the financial wealth during the last few years,
thus illustrating the low risk profile of Luxembourg households. In contrast, the weight of
technical insurance provisions appears to be relatively low mainly due to high pay-as-you-go
pension scheme in Luxembourg.
Finally, when translating Luxembourg‟s balance of payments into a financial account for the rest
of the world, it appears that most of the investment of the rest of the world was in share and other
equity (249 655 million euros), loans (72 606 million euros), currency and deposits
(62 679 million euros) and securities other than shares (34 356 million euros). The main financing
instruments (liabilities) were shares and other equity (164 536 million euros), loans
(117 823 million euros), currency and deposits (80 902 million euros) and securities other than
shares (57 060 million euros) while the amount of other accounts receivable/payable was reduced
by 41 369 million euros. All in all, the net borrowing from the rest of the world, and thus net
lending of Luxembourg, amounted to 3 073 million euros or 8.2 percent of GDP.
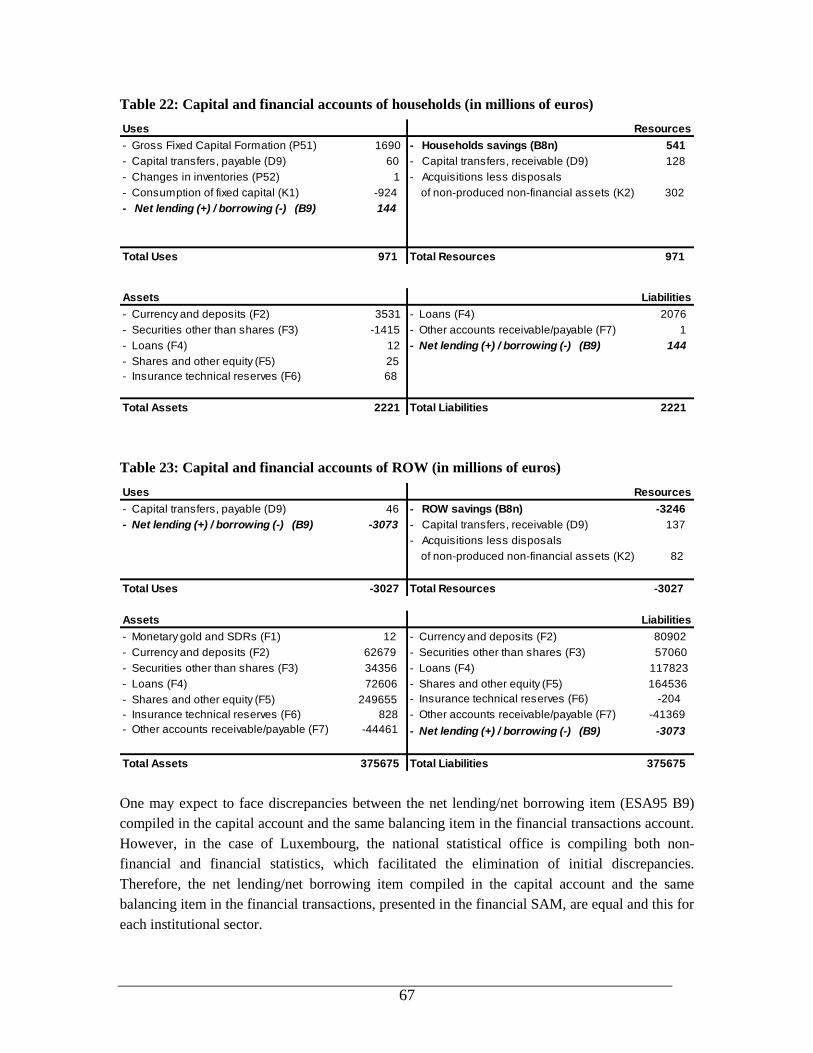
67
Table 22: Capital and financial accounts of households (in millions of euros)
Uses Resources
- Gross Fixed Capital Formation (P51) 1690 - Households savings (B8n) 541
- Capital transfers, payable (D9) 60 - Capital transfers, receivable (D9) 128
- Changes in inventories (P52) 1 - Acquisitions less disposals
- Consumption of fixed capital (K1) -924 of non-produced non-financial assets (K2) 302
- Net lending (+) / borrowing (-) (B9) 144
Total Uses 971 Total Resources 971
Assets Liabilities
- Currency and deposits (F2) 3531 - Loans (F4) 2076
- Securities other than shares (F3) -1415 - Other accounts receivable/payable (F7) 1
- Loans (F4) 12 - Net lending (+) / borrowing (-) (B9) 144
- Shares and other equity (F5) 25
- Insurance technical reserves (F6) 68
Total Assets 2221 Total Liabilities 2221
Table 23: Capital and financial accounts of ROW (in millions of euros)
Uses Resources
- Capital transfers, payable (D9) 46 - ROW savings (B8n) -3246
- Net lending (+) / borrowing (-) (B9) -3073 - Capital transfers, receivable (D9) 137
- Acquisitions less disposals
of non-produced non-financial assets (K2) 82
Total Uses -3027 Total Resources -3027
Assets Liabilities
- Monetary gold and SDRs (F1) 12 - Currency and deposits (F2) 80902
- Currency and deposits (F2) 62679 - Securities other than shares (F3) 57060
- Securities other than shares (F3) 34356 - Loans (F4) 117823
- Loans (F4) 72606 - Shares and other equity (F5) 164536
- Shares and other equity (F5) 249655 - Insurance technical reserves (F6) -204
- Insurance technical reserves (F6) 828 - Other accounts receivable/payable (F7) -41369
- Other accounts receivable/payable (F7) -44461 - Net lending (+) / borrowing (-) (B9) -3073
Total Assets 375675 Total Liabilities 375675
One may expect to face discrepancies between the net lending/net borrowing item (ESA95 B9)
compiled in the capital account and the same balancing item in the financial transactions account.
However, in the case of Luxembourg, the national statistical office is compiling both non-
financial and financial statistics, which facilitated the elimination of initial discrepancies.
Therefore, the net lending/net borrowing item compiled in the capital account and the same
balancing item in the financial transactions, presented in the financial SAM, are equal and this for
each institutional sector.
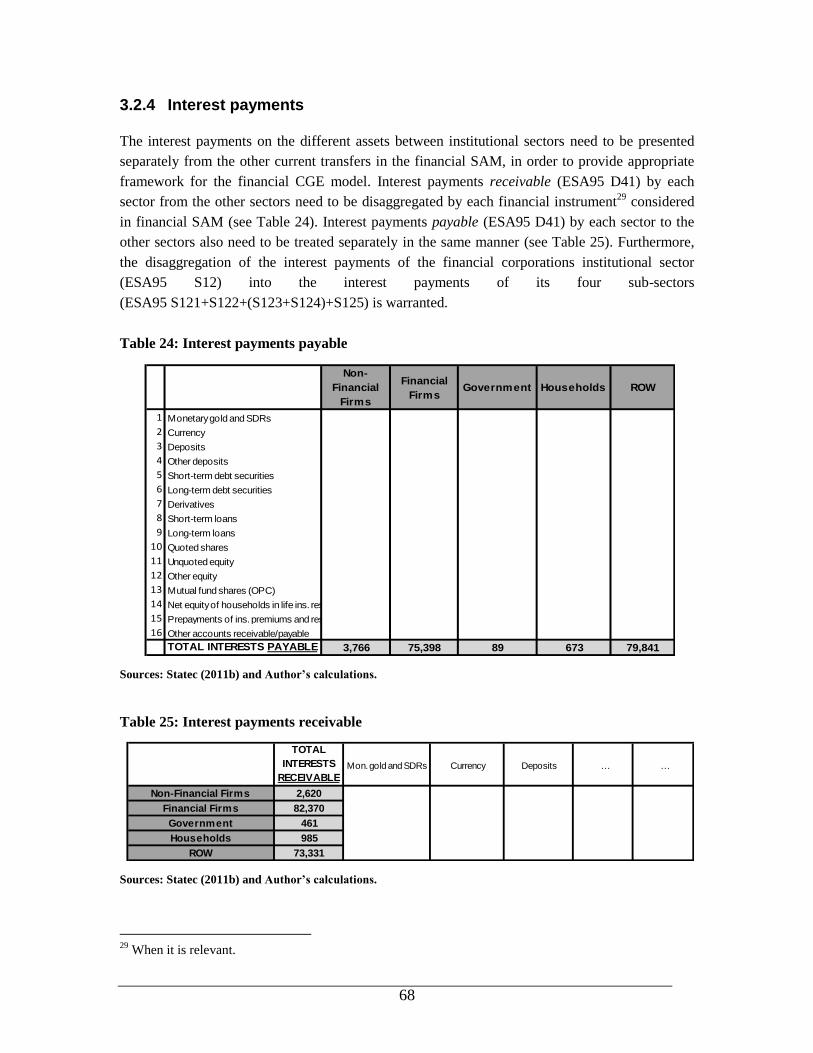
68
3.2.4 Interest payments
The interest payments on the different assets between institutional sectors need to be presented
separately from the other current transfers in the financial SAM, in order to provide appropriate
framework for the financial CGE model. Interest payments receivable (ESA95 D41) by each
sector from the other sectors need to be disaggregated by each financial instrument29
considered
in financial SAM (see Table 24). Interest payments payable (ESA95 D41) by each sector to the
other sectors also need to be treated separately in the same manner (see Table 25). Furthermore,
the disaggregation of the interest payments of the financial corporations institutional sector
(ESA95 S12) into the interest payments of its four sub-sectors
(ESA95 S121+S122+(S123+S124)+S125) is warranted.
Table 24: Interest payments payable
Non-
Financial
Firms
Financial
FirmsGovernment Households ROW
1 Monetary gold and SDRs
2 Currency
3 Deposits
4 Other deposits
5 Short-term debt securities
6 Long-term debt securities
7 Derivatives
8 Short-term loans
9 Long-term loans
10 Quoted shares
11 Unquoted equity
12 Other equity
13 Mutual fund shares (OPC)
14 Net equity of households in life ins. res. and in pension fund res.
15 Prepayments of ins. premiums and res. for outstanding claims
16 Other accounts receivable/payable
TOTAL INTERESTS PAYABLE 3,766 75,398 89 673 79,841
Sources: Statec (2011b) and Author’s calculations.
Table 25: Interest payments receivable
TOTAL
INTERESTS
RECEIVABLE
Mon. gold and SDRs Currency Deposits … …
Non-Financial Firms 2,620
Financial Firms 82,370
Government 461
Households 985
ROW 73,331
Sources: Statec (2011b) and Author’s calculations.
29
When it is relevant.

69
The interest payments between the institutional sectors30
- already presented in the real SAM -
were treated as part of transfers and at this stage would need to be subtracted from the current
transfers in the financial SAM. For example, the interest payments of financial corporations
sector to the household sector - because of the households‟ deposits in the commercial banks -
had to be subtracted from the current transfers of the financial corporations to the household
sector. This procedure needs to be applied to all the interest payments of the different institutional
sectors presented in the real SAM.
Unfortunately, it was not possible to include the disaggregation of the interest payments in this
version of financial SAM for Luxembourg as these detailed data have not been officially
published by the national statistical office (Statec) yet. According to the Statec, the quality of
these data is not robust enough for them to be used publicly.
3.2.5 Complete financial accounts of Luxembourg economy for 2007
The complete financial accounts are composed of three parts. First, there are the financial flows,
which are brought together in the table “Flows and funds”. Second, there is a special account
known as the “Revaluation account” which records all the changes in the prices of the assets.
Cash holdings (or on the liability side the loans) are not subject to revaluation. And finally, the
financial balance sheet accounts, which indicate the figures for the stock of assets and liabilities.
Considered together, these tables show for each institutional sector the details of the financial
counterpart of its net lending/net borrowing and the composition of its financial net worth31
. The
financial accounts are drown up mainly on the basis of financial corporations‟ published accounts
(i.e. central bank, banks, financial intermediaries, etc) and are particularly detailed for financial
corporations which play a key role in the management of the financial transactions and constitute
the prime statistical source for the financial accounts.
The financial accounts are usually recorded on 31 December32
each year. They are recorded in the
national accounts in current prices. In the case of transactions using payment instruments
denominated in other currencies (dollar, pound sterling, yen or any other) and transactions in
shares and bonds - whose market prices are subject to change - the actual prices at the time of sale
or purchase and the currency rate prevalent on the day transactions are applied.
In practical terms, the value of the financial holdings at the end of period T equals the initial stock
at the end of year T-1 (or at the beginning of year T) plus the flow of transactions in assets or
liabilities (financial flows) during the year plus the revaluations.
30
Whom-to-whom matrix presented in Appendix B. 31
For a given financial asset – for example, shares – the following information can be retrieved from these
accounts: the net issue flows and the purchasing sectors (financial flows, and the total value of the shares
issues in economy and the sectors holding these shares) (Lequiller and Blades, 2006). 32
There are also quarterly financial accounts where financial flows and stocks are recorded on the 31st of
each month.
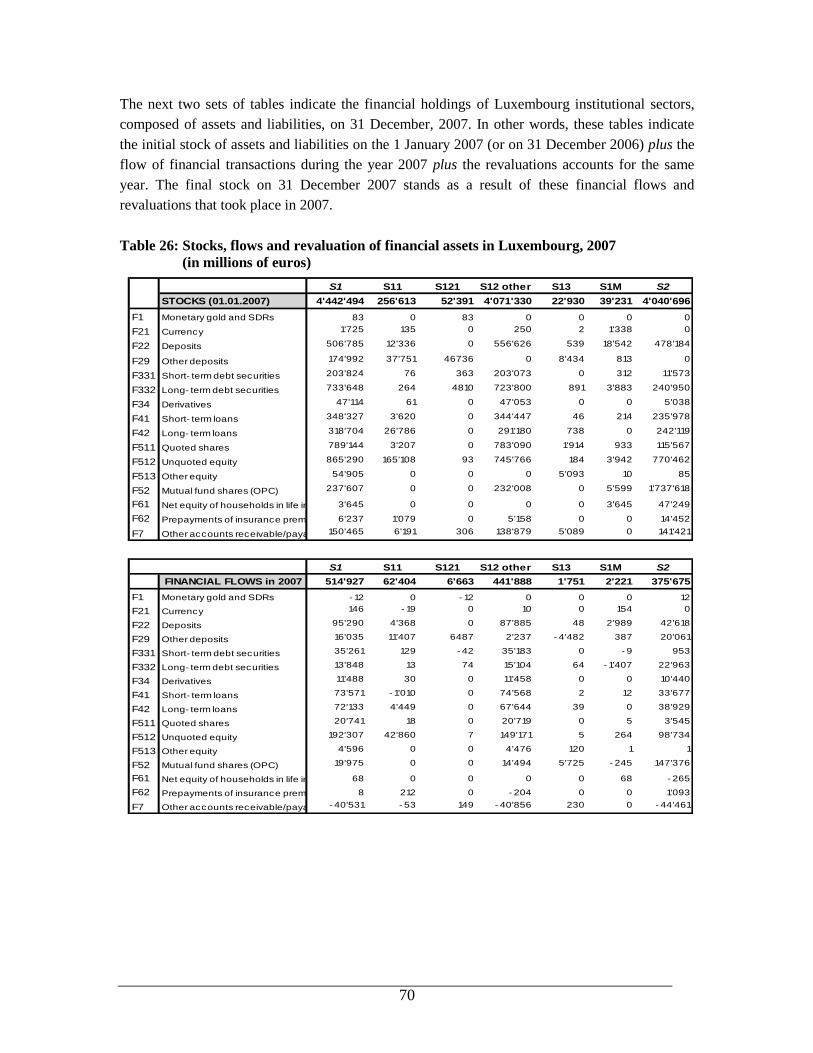
70
The next two sets of tables indicate the financial holdings of Luxembourg institutional sectors,
composed of assets and liabilities, on 31 December, 2007. In other words, these tables indicate
the initial stock of assets and liabilities on the 1 January 2007 (or on 31 December 2006) plus the
flow of financial transactions during the year 2007 plus the revaluations accounts for the same
year. The final stock on 31 December 2007 stands as a result of these financial flows and
revaluations that took place in 2007.
Table 26: Stocks, flows and revaluation of financial assets in Luxembourg, 2007
(in millions of euros)
S1 S11 S121 S12 other S13 S1M S2
STOCKS (01.01.2007) 4'442'494 256'613 52'391 4'071'330 22'930 39'231 4'040'696
F1 Monetary gold and SDRs 83 0 83 0 0 0 0
F21 Currency 1'725 135 0 250 2 1'338 0
F22 Deposits 506'785 12'336 0 556'626 539 18'542 478'184
F29 Other deposits 174'992 37'751 46736 0 8'434 813 0
F331 Short- term debt securities 203'824 76 363 203'073 0 312 11'573
F332 Long- term debt securities 733'648 264 4810 723'800 891 3'883 240'950
F34 Derivatives 47'114 61 0 47'053 0 0 5'038
F41 Short- term loans 348'327 3'620 0 344'447 46 214 235'978
F42 Long- term loans 318'704 26'786 0 291'180 738 0 242'119
F511 Quoted shares 789'144 3'207 0 783'090 1'914 933 115'567
F512 Unquoted equity 865'290 165'108 93 745'766 184 3'942 770'462
F513 Other equity 54'905 0 0 0 5'093 10 85
F52 Mutual fund shares (OPC) 237'607 0 0 232'008 0 5'599 1'737'618
F61 Net equity of households in life insurance reserves and in pension fund reserves3'645 0 0 0 0 3'645 47'249
F62 Prepayments of insurance premiums and reserves for outstanding claims6'237 1'079 0 5'158 0 0 14'452
F7 Other accounts receivable/payable 150'465 6'191 306 138'879 5'089 0 141'421
S1 S11 S121 S12 other S13 S1M S2
FINANCIAL FLOWS in 2007 514'927 62'404 6'663 441'888 1'751 2'221 375'675
F1 Monetary gold and SDRs - 12 0 - 12 0 0 0 12
F21 Currency 146 - 19 0 10 0 154 0
F22 Deposits 95'290 4'368 0 87'885 48 2'989 42'618
F29 Other deposits 16'035 11'407 6487 2'237 - 4'482 387 20'061
F331 Short- term debt securities 35'261 129 - 42 35'183 0 - 9 953
F332 Long- term debt securities 13'848 13 74 15'104 64 - 1'407 22'963
F34 Derivatives 11'488 30 0 11'458 0 0 10'440
F41 Short- term loans 73'571 - 1'010 0 74'568 2 12 33'677
F42 Long- term loans 72'133 4'449 0 67'644 39 0 38'929
F511 Quoted shares 20'741 18 0 20'719 0 5 3'545
F512 Unquoted equity 192'307 42'860 7 149'171 5 264 98'734
F513 Other equity 4'596 0 0 4'476 120 1 1
F52 Mutual fund shares (OPC) 19'975 0 0 14'494 5'725 - 245 147'376
F61 Net equity of households in life insurance reserves and in pension fund reserves68 0 0 0 0 68 - 265
F62 Prepayments of insurance premiums and reserves for outstanding claims8 212 0 - 204 0 0 1'093
F7 Other accounts receivable/payable - 40'531 - 53 149 - 40'856 230 0 - 44'461
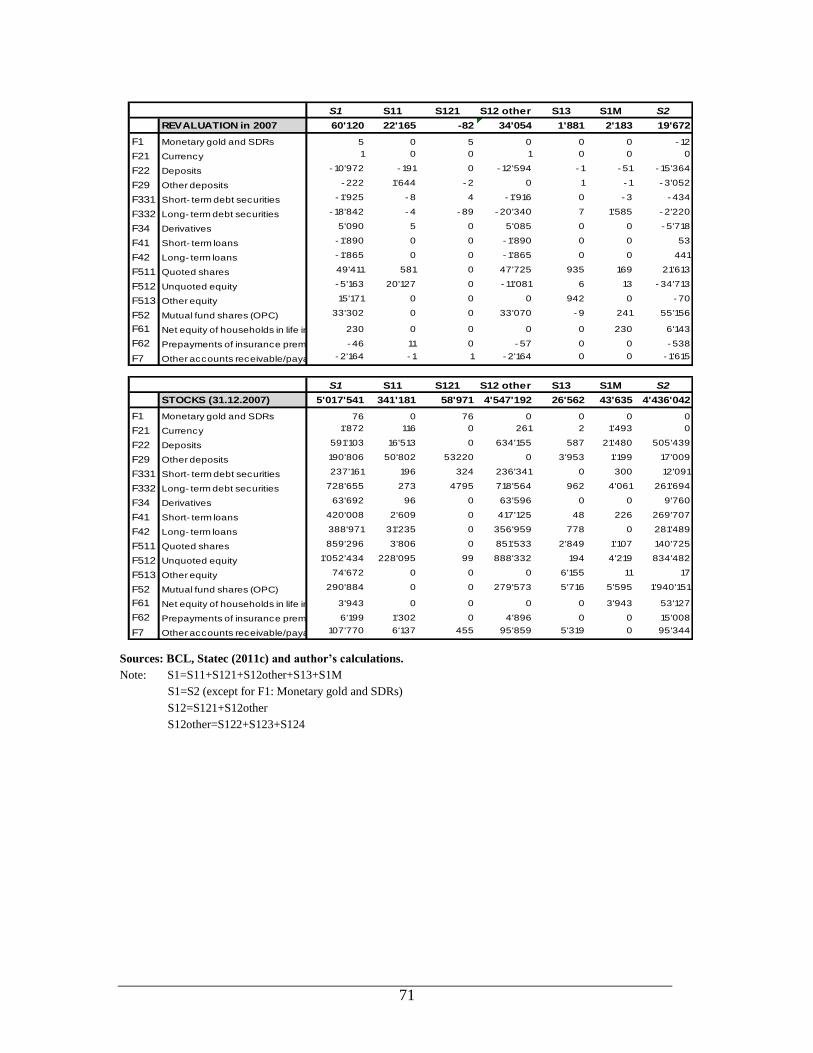
71
S1 S11 S121 S12 other S13 S1M S2
REVALUATION in 2007 60'120 22'165 -82 34'054 1'881 2'183 19'672
F1 Monetary gold and SDRs 5 0 5 0 0 0 - 12
F21 Currency 1 0 0 1 0 0 0
F22 Deposits - 10'972 - 191 0 - 12'594 - 1 - 51 - 15'364
F29 Other deposits - 222 1'644 - 2 0 1 - 1 - 3'052
F331 Short- term debt securities - 1'925 - 8 4 - 1'916 0 - 3 - 434
F332 Long- term debt securities - 18'842 - 4 - 89 - 20'340 7 1'585 - 2'220
F34 Derivatives 5'090 5 0 5'085 0 0 - 5'718
F41 Short- term loans - 1'890 0 0 - 1'890 0 0 53
F42 Long- term loans - 1'865 0 0 - 1'865 0 0 441
F511 Quoted shares 49'411 581 0 47'725 935 169 21'613
F512 Unquoted equity - 5'163 20'127 0 - 11'081 6 13 - 34'713
F513 Other equity 15'171 0 0 0 942 0 - 70
F52 Mutual fund shares (OPC) 33'302 0 0 33'070 - 9 241 55'156
F61 Net equity of households in life insurance reserves and in pension fund reserves230 0 0 0 0 230 6'143
F62 Prepayments of insurance premiums and reserves for outstanding claims- 46 11 0 - 57 0 0 - 538
F7 Other accounts receivable/payable - 2'164 - 1 1 - 2'164 0 0 - 1'615
S1 S11 S121 S12 other S13 S1M S2
STOCKS (31.12.2007) 5'017'541 341'181 58'971 4'547'192 26'562 43'635 4'436'042
F1 Monetary gold and SDRs 76 0 76 0 0 0 0
F21 Currency 1'872 116 0 261 2 1'493 0
F22 Deposits 591'103 16'513 0 634'155 587 21'480 505'439
F29 Other deposits 190'806 50'802 53220 0 3'953 1'199 17'009
F331 Short- term debt securities 237'161 196 324 236'341 0 300 12'091
F332 Long- term debt securities 728'655 273 4795 718'564 962 4'061 261'694
F34 Derivatives 63'692 96 0 63'596 0 0 9'760
F41 Short- term loans 420'008 2'609 0 417'125 48 226 269'707
F42 Long- term loans 388'971 31'235 0 356'959 778 0 281'489
F511 Quoted shares 859'296 3'806 0 851'533 2'849 1'107 140'725
F512 Unquoted equity 1'052'434 228'095 99 888'332 194 4'219 834'482
F513 Other equity 74'672 0 0 0 6'155 11 17
F52 Mutual fund shares (OPC) 290'884 0 0 279'573 5'716 5'595 1'940'151
F61 Net equity of households in life insurance reserves and in pension fund reserves3'943 0 0 0 0 3'943 53'127
F62 Prepayments of insurance premiums and reserves for outstanding claims6'199 1'302 0 4'896 0 0 15'008
F7 Other accounts receivable/payable 107'770 6'137 455 95'859 5'319 0 95'344
Sources: BCL, Statec (2011c) and author’s calculations.
Note: S1=S11+S121+S12other+S13+S1M
S1=S2 (except for F1: Monetary gold and SDRs)
S12=S121+S12other
S12other=S122+S123+S124
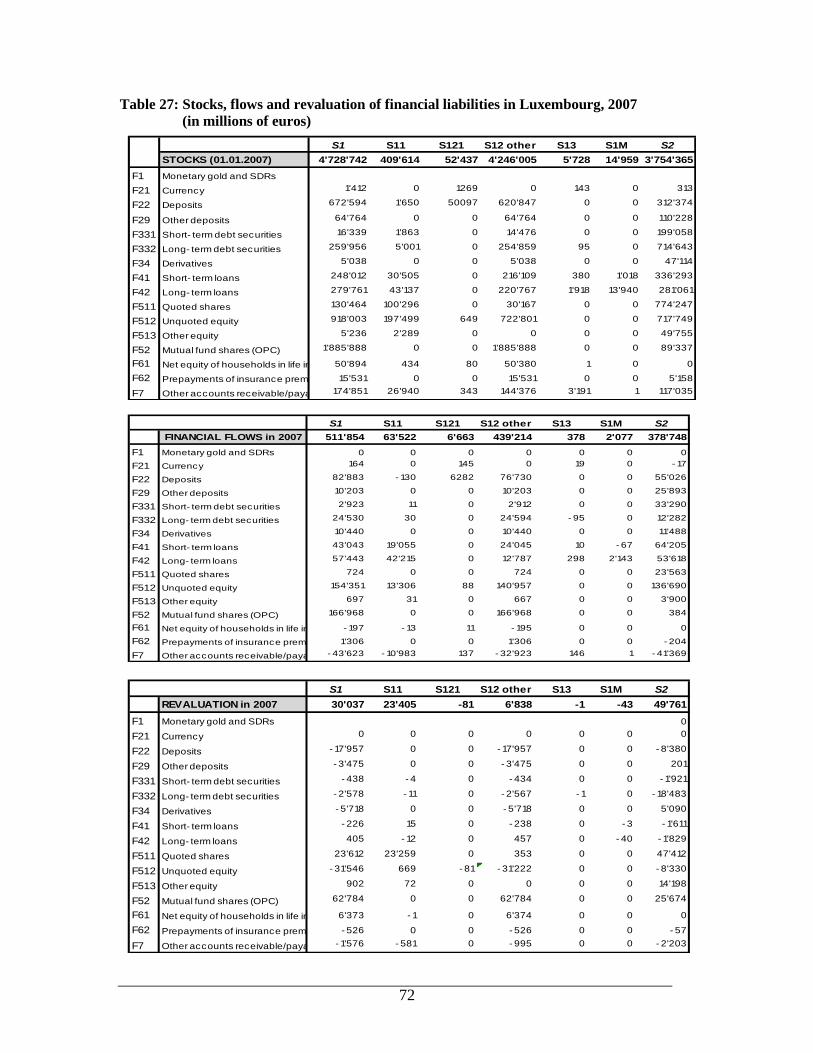
72
Table 27: Stocks, flows and revaluation of financial liabilities in Luxembourg, 2007
(in millions of euros)
S1 S11 S121 S12 other S13 S1M S2
STOCKS (01.01.2007) 4'728'742 409'614 52'437 4'246'005 5'728 14'959 3'754'365
F1 Monetary gold and SDRs
F21 Currency 1'412 0 1269 0 143 0 313
F22 Deposits 672'594 1'650 50097 620'847 0 0 312'374
F29 Other deposits 64'764 0 0 64'764 0 0 110'228
F331 Short- term debt securities 16'339 1'863 0 14'476 0 0 199'058
F332 Long- term debt securities 259'956 5'001 0 254'859 95 0 714'643
F34 Derivatives 5'038 0 0 5'038 0 0 47'114
F41 Short- term loans 248'012 30'505 0 216'109 380 1'018 336'293
F42 Long- term loans 279'761 43'137 0 220'767 1'918 13'940 281'061
F511 Quoted shares 130'464 100'296 0 30'167 0 0 774'247
F512 Unquoted equity 918'003 197'499 649 722'801 0 0 717'749
F513 Other equity 5'236 2'289 0 0 0 0 49'755
F52 Mutual fund shares (OPC) 1'885'888 0 0 1'885'888 0 0 89'337
F61 Net equity of households in life insurance reserves and in pension fund reserves50'894 434 80 50'380 1 0 0
F62 Prepayments of insurance premiums and reserves for outstanding claims15'531 0 0 15'531 0 0 5'158
F7 Other accounts receivable/payable 174'851 26'940 343 144'376 3'191 1 117'035
S1 S11 S121 S12 other S13 S1M S2
FINANCIAL FLOWS in 2007 511'854 63'522 6'663 439'214 378 2'077 378'748
F1 Monetary gold and SDRs 0 0 0 0 0 0 0
F21 Currency 164 0 145 0 19 0 - 17
F22 Deposits 82'883 - 130 6282 76'730 0 0 55'026
F29 Other deposits 10'203 0 0 10'203 0 0 25'893
F331 Short- term debt securities 2'923 11 0 2'912 0 0 33'290
F332 Long- term debt securities 24'530 30 0 24'594 - 95 0 12'282
F34 Derivatives 10'440 0 0 10'440 0 0 11'488
F41 Short- term loans 43'043 19'055 0 24'045 10 - 67 64'205
F42 Long- term loans 57'443 42'215 0 12'787 298 2'143 53'618
F511 Quoted shares 724 0 0 724 0 0 23'563
F512 Unquoted equity 154'351 13'306 88 140'957 0 0 136'690
F513 Other equity 697 31 0 667 0 0 3'900
F52 Mutual fund shares (OPC) 166'968 0 0 166'968 0 0 384
F61 Net equity of households in life insurance reserves and in pension fund reserves- 197 - 13 11 - 195 0 0 0
F62 Prepayments of insurance premiums and reserves for outstanding claims1'306 0 0 1'306 0 0 - 204
F7 Other accounts receivable/payable - 43'623 - 10'983 137 - 32'923 146 1 - 41'369
S1 S11 S121 S12 other S13 S1M S2
REVALUATION in 2007 30'037 23'405 -81 6'838 -1 -43 49'761
F1 Monetary gold and SDRs 0
F21 Currency 0 0 0 0 0 0 0
F22 Deposits - 17'957 0 0 - 17'957 0 0 - 8'380
F29 Other deposits - 3'475 0 0 - 3'475 0 0 201
F331 Short- term debt securities - 438 - 4 0 - 434 0 0 - 1'921
F332 Long- term debt securities - 2'578 - 11 0 - 2'567 - 1 0 - 18'483
F34 Derivatives - 5'718 0 0 - 5'718 0 0 5'090
F41 Short- term loans - 226 15 0 - 238 0 - 3 - 1'611
F42 Long- term loans 405 - 12 0 457 0 - 40 - 1'829
F511 Quoted shares 23'612 23'259 0 353 0 0 47'412
F512 Unquoted equity - 31'546 669 - 81 - 31'222 0 0 - 8'330
F513 Other equity 902 72 0 0 0 0 14'198
F52 Mutual fund shares (OPC) 62'784 0 0 62'784 0 0 25'674
F61 Net equity of households in life insurance reserves and in pension fund reserves6'373 - 1 0 6'374 0 0 0
F62 Prepayments of insurance premiums and reserves for outstanding claims- 526 0 0 - 526 0 0 - 57
F7 Other accounts receivable/payable - 1'576 - 581 0 - 995 0 0 - 2'203
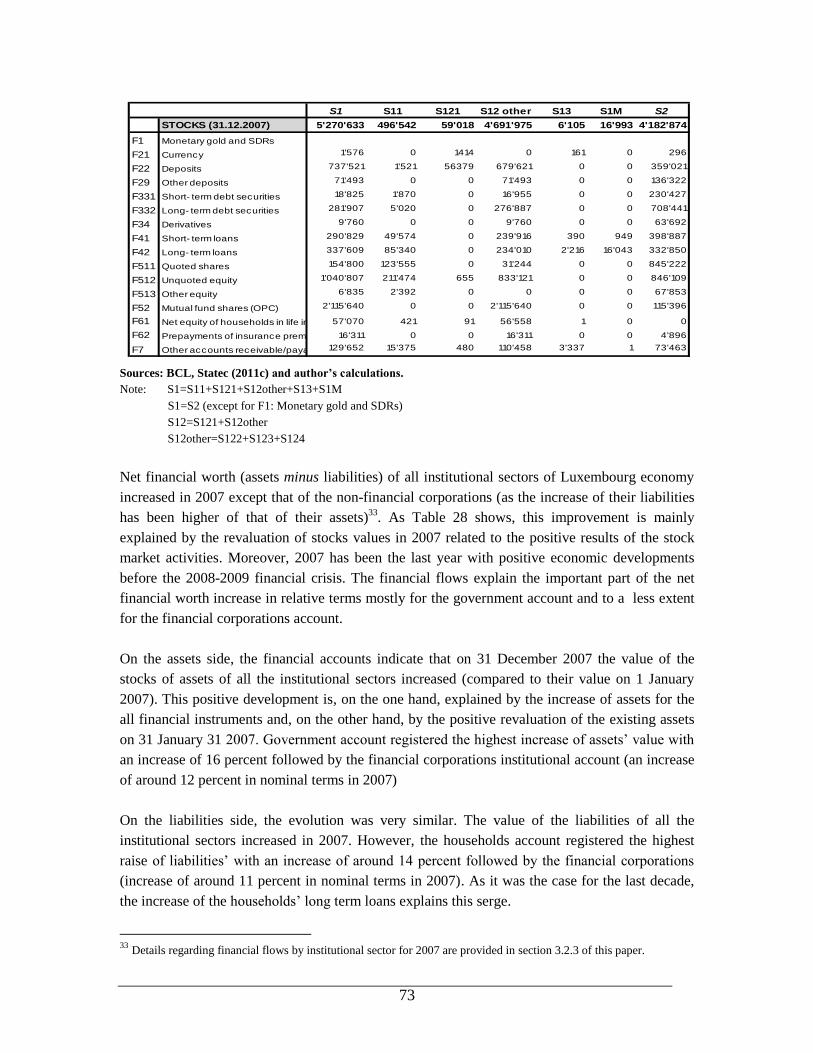
73
S1 S11 S121 S12 other S13 S1M S2
STOCKS (31.12.2007) 5'270'633 496'542 59'018 4'691'975 6'105 16'993 4'182'874
F1 Monetary gold and SDRs
F21 Currency 1'576 0 1414 0 161 0 296
F22 Deposits 737'521 1'521 56379 679'621 0 0 359'021
F29 Other deposits 71'493 0 0 71'493 0 0 136'322
F331 Short- term debt securities 18'825 1'870 0 16'955 0 0 230'427
F332 Long- term debt securities 281'907 5'020 0 276'887 0 0 708'441
F34 Derivatives 9'760 0 0 9'760 0 0 63'692
F41 Short- term loans 290'829 49'574 0 239'916 390 949 398'887
F42 Long- term loans 337'609 85'340 0 234'010 2'216 16'043 332'850
F511 Quoted shares 154'800 123'555 0 31'244 0 0 845'222
F512 Unquoted equity 1'040'807 211'474 655 833'121 0 0 846'109
F513 Other equity 6'835 2'392 0 0 0 0 67'853
F52 Mutual fund shares (OPC) 2'115'640 0 0 2'115'640 0 0 115'396
F61 Net equity of households in life insurance reserves and in pension fund reserves57'070 421 91 56'558 1 0 0
F62 Prepayments of insurance premiums and reserves for outstanding claims16'311 0 0 16'311 0 0 4'896
F7 Other accounts receivable/payable 129'652 15'375 480 110'458 3'337 1 73'463
Sources: BCL, Statec (2011c) and author’s calculations.
Note: S1=S11+S121+S12other+S13+S1M
S1=S2 (except for F1: Monetary gold and SDRs)
S12=S121+S12other
S12other=S122+S123+S124
Net financial worth (assets minus liabilities) of all institutional sectors of Luxembourg economy
increased in 2007 except that of the non-financial corporations (as the increase of their liabilities
has been higher of that of their assets)33
. As Table 28 shows, this improvement is mainly
explained by the revaluation of stocks values in 2007 related to the positive results of the stock
market activities. Moreover, 2007 has been the last year with positive economic developments
before the 2008-2009 financial crisis. The financial flows explain the important part of the net
financial worth increase in relative terms mostly for the government account and to a less extent
for the financial corporations account.
On the assets side, the financial accounts indicate that on 31 December 2007 the value of the
stocks of assets of all the institutional sectors increased (compared to their value on 1 January
2007). This positive development is, on the one hand, explained by the increase of assets for the
all financial instruments and, on the other hand, by the positive revaluation of the existing assets
on 31 January 31 2007. Government account registered the highest increase of assets‟ value with
an increase of 16 percent followed by the financial corporations institutional account (an increase
of around 12 percent in nominal terms in 2007)
On the liabilities side, the evolution was very similar. The value of the liabilities of all the
institutional sectors increased in 2007. However, the households account registered the highest
raise of liabilities‟ with an increase of around 14 percent followed by the financial corporations
(increase of around 11 percent in nominal terms in 2007). As it was the case for the last decade,
the increase of the households‟ long term loans explains this serge.
33
Details regarding financial flows by institutional sector for 2007 are provided in section 3.2.3 of this paper.
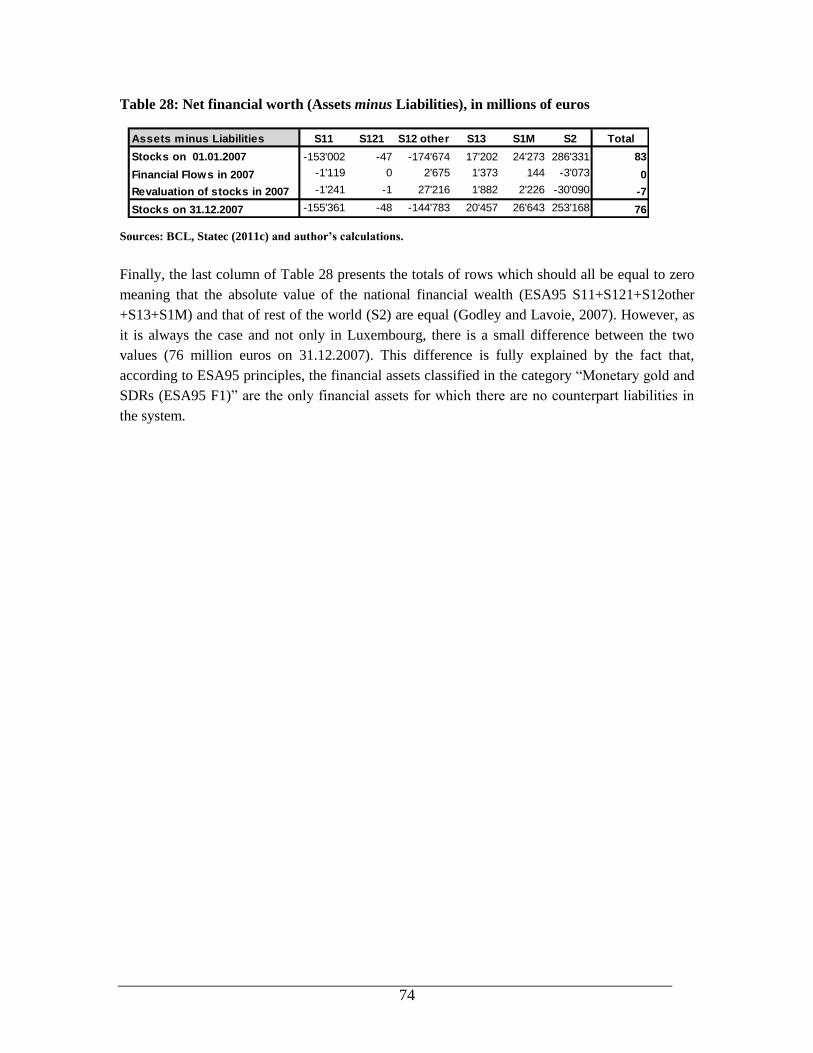
74
Table 28: Net financial worth (Assets minus Liabilities), in millions of euros
Assets minus Liabilities S11 S121 S12 other S13 S1M S2 Total
Stocks on 01.01.2007 -153'002 -47 -174'674 17'202 24'273 286'331 83
Financial Flows in 2007 -1'119 0 2'675 1'373 144 -3'073 0
Revaluation of stocks in 2007 -1'241 -1 27'216 1'882 2'226 -30'090 -7
Stocks on 31.12.2007 -155'361 -48 -144'783 20'457 26'643 253'168 76
Sources: BCL, Statec (2011c) and author’s calculations.
Finally, the last column of Table 28 presents the totals of rows which should all be equal to zero
meaning that the absolute value of the national financial wealth (ESA95 S11+S121+S12other
+S13+S1M) and that of rest of the world (S2) are equal (Godley and Lavoie, 2007). However, as
it is always the case and not only in Luxembourg, there is a small difference between the two
values (76 million euros on 31.12.2007). This difference is fully explained by the fact that,
according to ESA95 principles, the financial assets classified in the category “Monetary gold and
SDRs (ESA95 F1)” are the only financial assets for which there are no counterpart liabilities in
the system.
75
4 Conclusions
This paper presents the first financial SAM that has been built for Luxembourg for the year 2007.
Its construction has been discussed in detail in this paper. Although, different sources of data
have been used for building the financial SAM there were no major resulting statistical
discrepancies and so there was no need to use any statistical method to balance the matrix. The
structural relationship between the main institutional sectors (non-financial and financial
corporations, government, households and the rest of the world) as represented in the financial
SAM provided an opportunity to outline some characteristics of the Luxembourg economy, with
special emphasis on the government sector and on the financial accounts.
The financial SAM for Luxembourg incorporates a very detailed disaggregated financial account
of the economy presenting the financial transactions taking place between the national
institutional units, and between them and the rest of the world. It thereby provides a useful
overview of the main financial flows in the economy, as well as the main risks and
interdependencies. The financial SAM provides a consistent and comprehensive set of financial
information at a certain point in time.
By revealing the inter-sector linkages and showing the counterpart sectors for each type of
transactions, the financial accounts assist us for detecting the interrelationships between portfolio
shifts and restructuring of liabilities of various sectors as a consequence of, or in anticipation of,
monetary policy decisions. Furthermore, this feature potentially enables tracing the impacts of a
monetary policy decision from the financial to the non-financial side of the economy and back.
The financial SAM has two principal objectives: first, to organize the information that would
allow an analysis of the structure of the economy of Luxembourg, and second, to provide the
benchmark data set for the creation of a financial CGE model. This financial SAM is prepared to
be used for calibration of the first financial CGE model for Luxembourg that will be presented in
a forthcoming Working paper of the BCL.
There are two main issues that remain for the future development of the financial SAM for
Luxembourg. First, the disaggregation of institutional sector „Financial corporations‟
(ESA95 S12) should be included in the SAM in order to better take into account the structure of
the financial sector in Luxembourg. Ideally, this sector should be disaggregated in four sub-
institutional sectors (following ESA95 nomenclature): central bank (S121); other monetary
financial institutions (MFIs) (S122); other financial intermediaries except insurance corporations
and pension funds and financial auxiliaries (S123+S124); and insurance corporations and pension
funds (S125). In this version of financial SAM, this sector has been disaggregated in two: „central
bank‟ and „other financial institutions‟. Second, the interest rates (ESA95 D41) should be
disaggregated according to the institutional sector that pays it or receives it. The structure of this
disaggregation is presented in this paper (as an empty matrix). Unfortunately, at this stage, this
data is not available.
76
Bibliography
Adam, F., Aka, F., Dramais, F., Opese, M., Mohora, C. (2010), Luxgem: modèle d’équilibre
général calculable pour le Luxembourg, Cahier économique No 110, Statec. Retrieved from:
http://www.statistiques.public.lu/fr/publications/series/cahiers-economiques/2010/110-
luxgem/index.html
Aslan, M. (2007), “The Construction of a Financial Social Accounting Matrix for the Turkish
Economy with 1996 Data”, Anadolu University Journal of Social Sciences, Vol.7, Issue 1,
pp. 287-306.
Bacharach, M. (1970), Biproportional matrices and input-output changes, Cambridge University
Press, Cambridge.
Banque centrale du Luxembourg - BCL (2010), Balance of Payments (BoP) data, Luxembourg.
Retrieved from:
www.bcl.lu/en/statistics/series/07_balance_payments/07_01_Table.xls
Banque Nationale de Belgique (2007), Aperçu méthodologique des comptes financiers de la
Belgique, Bulletin statistique (2007-I), pp. 1-11. Retrieved from:
http://www.nbb.be/doc/dq/f_method/M1_SFB07I.pdf
Bê Duc, L. and Le Breton, G. (2009), Flows-of-Funds Analysis at the ECB: Framework and
Applications, European Central Bank, Working Paper Series No 105.
Retrieved from: http://www.ecb.int/pub/pdf/scpops/ecbocp105.pdf
Breisinger, C., Thomas, M. and Thurlow, J. (2009), Social accounting matrices and multiplier
analysis: An introduction with exercises, International Food Policy Research Institute.
Retrieved from: http://ifpri.org.
Brito, B. (2009), La construction des comptes financiers du Luxembourg, Statec, Working Paper
No 32. Retrieved from: http://www.statistiques.public.lu/catalogue-publications/economie-
statistiques/2009/32-2009.pdf
Debowicz, D. (2010), Modelling trade and financial liberalization effects for Argentina, PhD
dissertation, University of Sussex, UK. Retrieved from: http://sro.sussex.ac.uk/6298/
Deutsche Bundesbank (2010), Financial Accounts for Germany 1991 to 2009, Special Statistical
Publication No 4. Retrieved from:
http://www.bundesbank.de/download/statistik/stat_sonder/statso4_en.pdf
Emini, C.A. and Fofack H. (2004), A Financial Social Accounting Matrix for the Integrated
Macroeconomic Model for Poverty Analysis: Application to Cameroon with a Fixed
Multiplier Analysis, Policy Research Working Paper No 3219, World Bank. Retrieved from:
http://www-wds.worldbank.org/external/default/WDSContentServer/IW3P/IB/2004/
03/30/000160016_20040330152325/additional/126526322_20041117173055.pdf

77
Emini, C.A. (2002), Designing the Financial Social Accounting Matrix Underlying the
“Intergrated Macroeconomic Model for Poverty Analysis”: The Cameroon Country-Case,
Draft 28.03.2002, University of Yaounde II and CREFA-Université Laval, Canada. Directly
transmitted by author.
European Commission (2010), VAT Rates Applied in the Member states of the European Union,
Taxation and Customs Union, Taxud.c.1(2010) 477911. Retrieved from:
http://ec.europa.eu/taxation_customs/resources/documents/taxation/vat/how_vat_works/rates/
vat_rates_en.pdf.
Eurostat and European Commission (2008), Eurostat Manual of Supply, Use and Input-Output
Tables, Office for Official Publications of the European Communities, Luxembourg.
Eurostat and European Commission (1996), European System of Accounts (ESA) 1995, Office for
Official Publications of the European Communities, Luxembourg.
European Commission and Eurostat (2002a), ESA95 manual on government deficit and debt,
Luxembourg: Office for Official Publications of the European Communities.
Retrieved from:
http://epp.eurostat.ec.europa.eu/cache/ITY_SDDS/Annexes/naga_a_esms_an1.pdf
European Commission and Eurostat (2002b), Manual on Sources and Methods for the
compilation of ESA95 Financial Accounts, First Edition, Office for Official Publications of
the European Communities, Luxembourg. Retrieved from:
http://epp.eurostat.ec.europa.eu/cache/ITY_OFFPUB/KS-BE-02-004/EN/KS-BE-02-004-
EN.PDF
European Communities (2006), Council Directive 2006/112/EC of 28 November 2006 on the
common system of value added tax, Official Journal of the European Communities.
Retrieved from: http://eur-lex.europa.eu/
European Communities (2000), Regulation (EC) No 2516/2000 of the European Parliament and
of the Council of 7 November 2000 modifying the common principles of the European system
of national and regional accounts in the Community (ESA) 95 as concerns taxes and social
contributions and amending Council Regulation (EC) No 2223/96, Official Journal of the
European Communities. Retrieved from: http://eur-lex.europa.eu/
European Communities (1996), Council Regulation (EC) No 2223/96 of 25 June 1996 on the
European system of national and regional accounts in the Community, Official Journal of
the European Communities. Retrieved from: http://eur-lex.europa.eu
Gilchrist, D. A. and St Louis, L. V. (1999), “Completing input-output tables using partial
information, with an application to Canadian data”, Economic Systems Research, Vol. 11,
No 2, pp.185-194.
78
Godley, W. and Lavoie, M. (2007), Monetary Economics: An Integrated Approach to Credit,
Money, Income, Production and Wealth, Palgrave MacMillan.
Gosset, D. (2010), Financial accounts, IFC Seminar held at National Bank of Belgium, Brussels.
Günlük-Şenesen, G. and Bates, J. M. (1988), “Some experiments with methods of adjusting
unbalanced data matrices”, Journal of Royal Statistical Society, Vol. 151, No 3, pp.473-490.
Hernàndez, G. (2008), “Building a Financial Social Accounting Matrix for Colombia”, Estudios
de Economia Aplicada, Vol. 26, No 3, pp. 1-24.
Hubic, A. (2005), An economic analysis of Bosnia and Herzegovina and its perspectives: a
general equilibrium approach, BA thesis, Free University of Brussels.
Hubic, A. (2006), BiHMod-Reg: A Regional Multi-Sectoral General Equilibrium Analysis for
Bosnia and Herzegovina, MA thesis, Free University of Brussels.
Jellema, T., Keuning, S., McAdam, P., Mink, R. (2004), Developing a Euro Area Accounting
Matrix: Issues and Applications, European Central Bank, Working Paper Series No 356.
Retrieved from: http://www.ecb.int/pub/pdf/scpwps/ecbwp356.pdf
Jensen, H. T., Bayar, A., Haddad, E. (2004), Documentation of the Argentina 1997 Social
Accounting Matrix for the IMMPA Model Framework, University of Copenhagen, EcoMod
and Free University of Brussels, University of Sao Paolo. Unpublished paper received from
authors.
Jensen, H. T., Bayar, A., Haddad, E. (2004), Documentation of the Colombia 2000 Social
Accounting Matrix for the IMMPA Model Framework, University of Copenhagen, EcoMod
and Free University of Brussels, University of Sao Paolo. Unpublished paper received from
authors.
Kafaï, M. (2009), Méthodologie de l’élaboration de Tableau entrées-sorties (TES) et son
application pour le Luxembourg, Statec, Working Paper No 26. Retrieved from:
http://www.statistiques.public.lu/fr/publications/series/Economie_et_statistiques/2009
Kehoe, T. J. (1996), Social Accounting Matrices and Applied General Equilibrium Models,
Working Paper No 563, Federal Reserve Bank of Minneapolis. Retrieved from: www.psu.edu
Krecke, J. and Di Bartolomeo, M. (2003), La Déclaration d’Impôt, Editions Promoculture.
Kuznets, S. (1937), National income and capital formation, 1919-1935, National Bureau of
Economic Research (NBER), New York.
Retrieved from: http://www.nber.org/books/kuzn37-2
Leontief, W. W. (1941), The structure of American economy, 1919-1929: An empirical
application of equilibrium analysis, Harvard University Press, Cambridge, MA.
79
Lequiller, F. and Blades, D. (2006), Understanding National Accounts, OECD Publishing.
Leung, D. And Secrieru, O. (2010), Real-Financial Linkages in the Canadian Economy: An
Input-Output Approach, Bank of Canada.
Retrieved from: http://www.bankofcanada.ca/ec/osecrieru/io_leung_secrieru.pdf
Lucena, A. and Serrano, M. (2006), Building a Social Accounting Matrix within the ESA95
Framework: Obtaining a Dataset for Applied General Equilibrium Modelling, Working
Paper 168, University of Barcelona.
Retrieved from: http://ideas.repec.org/p/bar/bedcje/2006168.html#provider
Meade, J.E. and Stone, R. (1941), “The Construction of Tables of National Income, Expenditure,
Savings and Investment”, The Economic Journal, Vol. 51, No 202/203, pp. 216-233.
Mohora, M.C. (2006), RoMod: A Dynamic CGE Model for Romania, a Tool for Policy Analysis,
PhD dissertation, Erasmus University Rotterdam. Retrieved from:
http://publishing.eur.nl/ir/repub/asset/7455/few_mohora_20060217_thesis.pdf
Morales, J.V. (1995), A Social Accounting Matrix (SAM) for Chile, Economic Studies Series
No 39, Banco Central de Chile. Retrieved from:
http://www.bcentral.cl/estudios/estudios-economicos/pdf/serieestudios39_ingles.pdf
Pyatt, G. (1999), “Some Relationships between T-Accounts, Input-Output Tables and Social
Accounting Matrices”, Economic Systems Research, 11(4), pp. 365-387.
Pyatt, G. (1988), “A SAM Approach to Modeling”, Journal of Policy Modeling, 10(3), pp. 327-
352.
Pyatt, G. and Round, J.I. (1985), Social Accounting Matrices: A Basis for Planning, World Bank,
Washington D.C.
Pyatt, G. and Round, J. I. (1977), “Social accounting matrices for development planning”, Review
of Income and Wealth, No. 23, pp. 339–364.
Ricart, R. And Longet, B. (2010), Balance of Payments and Financial Accounts, IFC Seminar
held at National Bank of Belgium, Brussels.
Robinson, S., Cattaneo, A., El-Said, M. (2000a), Updating and Estimating a Social Accounting
Matrix Using Cross Entropy Methods, International Food Policy Research Institute, TMD
Discussion Paper, No 58. Retrieved from: http://ifpri.org
Robinson, S. and El-Said, M. (2000b), GAMS Code for Estimating a Social Accounting Matrix
(SAM) Using Cross Entropy (CE) methods, International Food Policy Research Institute,
TMD Discussion Paper, No 64. Retrieved from: http://ifpri.org
80
Robinson, S., Cattaneo, A., El-Said, M. (1998), Estimating a Social Accounting Matrix Using
Cross Entropy Methods, International Food Policy Research Institute, TMD Discussion
Paper, No 33. Retrieved from: http://ifpri.org
Siddiqi, Y. and Salem, M. (2006), A Social Accounting Matrix for Canada, Statistics Canada.
Retrieved from: http://www.iariw.org/papers/2006/salem.pdf
Statec (2011a), National accounts: April 2011 notification, Luxembourg. Retrieved from:
http://www.statistiques.public.lu/stat/ReportFolders/ReportFolder.aspx?IF_Language=fra&M
ainTheme=5&FldrName=2
Statec (2011b - April), Financial accounts and non-financial institutional accounts, Luxembourg.
Retrieved from:
http://www.statistiques.public.lu/stat/ReportFolders/ReportFolder.aspx?IF_Language=fra&M
ainTheme=5&FldrName=2&RFPath=23
Statec (2011c - July), Quarterly financial accounts by institutional sector, Luxembourg.
Retrieved from:
http://www.statistiques.public.lu/stat/ReportFolders/ReportFolder.aspx?IF_Language=fra&M
ainTheme=5&FldrName=2&RFPath=23
Statec (2011d), National accounts: October 2011 notification, Luxembourg. Retrieved from:
http://www.statistiques.public.lu/stat/ReportFolders/ReportFolder.aspx?IF_Language=fra&M
ainTheme=5&FldrName=2
Statec (2010a), National accounts: October 2010 notification, Luxembourg. Retrieved from:
http://www.statistiques.public.lu/fr/economie/index.html
Statec (2010b), Tableaux Ressources et Emploi (à prix courants) 1995-2008, Luxembourg.
Retrieved from: http://www.statistiques.public.lu/fr/economie/index.html
Statistics Indonesia and Bank Indonesia (2009), Financial Social Accounting Matrix (FSAM)
Indonesia 2005, BPS Catalogue 9 503 004. Retrieved from:
http://www.bi.go.id/web/en/Publikasi/Publikasi+Lain/Publikasi+Lainnya/FSAM.htm
Stone, R. (1947), Measurement of national income and the construction of social accounts,
United Nations, Geneva. Retrieved from: http://unstats.un.org/unsd/nationalaccount/hsna.asp
Thissen, M. (2000), Building Financial CGE Models: Data, Parameters, and the Role of
Expectations – A Financial CGE Model for Egypt, PhD dissertation, Rijksuniversiteit
Groningen, Labyrint Publication.
United Nations (2008), A system of national accounts (SNA) and supporting tables, United
Nations, New York. Retrieved from: http://unstats.un.org/unsd/nationalaccount/sna2008.asp

81
United Nations (1993), A system of national accounts (SNA) and supporting tables, United
Nations, New York. Retrieved from: http://unstats.un.org/unsd/nationalaccount/sna1993.asp
United Nations (1968), A system of national accounts (SNA), United Nations, New York.
Retrieved from: http://unstats.un.org/unsd/nationalaccount/hsna.asp
United Nations (1953), A system of national accounts (SNA) and supporting tables, United
Nations, New York. Retrieved from: http://unstats.un.org/unsd/nationalaccount/hsna.asp
Waheed, A., Ezaki, M. (2006), A Financial Social Accounting Matrix for Pakistan, Discussion
paper No 141, Nagoya University. Retrieved from:
http://www.gsid.nagoya-u.ac.jp/bpub/research/public/paper/article/141.pdf

82
Appendix A: Disaggregation of the commodities and production sectors in the
financial SAM of Luxembourg (following ESA95 accounting
principles)
The classification of the commodities and production sectors in the financial Luxembourg SAM
and its correspondence to ESA95 accounts, NACE Rev.1 is given in the following table. The
classification of the commodities follows the same classification as the one for the production
sectors, even though in general it should not necessarily be the same.
Table Appendix A: Disaggregation of the commodities and production sectors in the
financial SAM of Luxembourg
Code34
Classification of the commodities and production sectors in the Luxembourg
financial SAM ESA95
Code NACE rev.1
35
sec1 Agriculture, hunting and forestry; fishing Agriculture, hunting and related service activities AYA+AYB
sec2 Mining and quarrying Mining and quarrying of energy producing materials CA
Mining and quarrying except energy producing mat. CB
sec3 Manufacturing Manufacture of food products; beverages and tob. DA
Manufacture of textiles and textile products DB
Tanning and dressing of leather; manufacture of luggage, handbags, saddlery, harness and footwear
AP19
Manufacture of wood and of products of wood and cork, except furniture; manufacture of articles of straw and plaiting materials
AP20
Manufacture of furniture; manufacturing n.e.c. AP36
Recycling AP37
Manufacture of pulp, paper and paper products; publishing and printing
DE
Manufacture of coke, refined petroleum products and nuclear fuels
AP23
Manufacture of chemicals and chemical products AP24
Manufacture of rubber and plastic products AP25
Manufacture of other non-metallic mineral products AP26
34
Code of the sectors used in the financial SAM of Luxembourg. 35
Classification of Economic Activities in the European Community (Eurostat and European Commission,
1996).
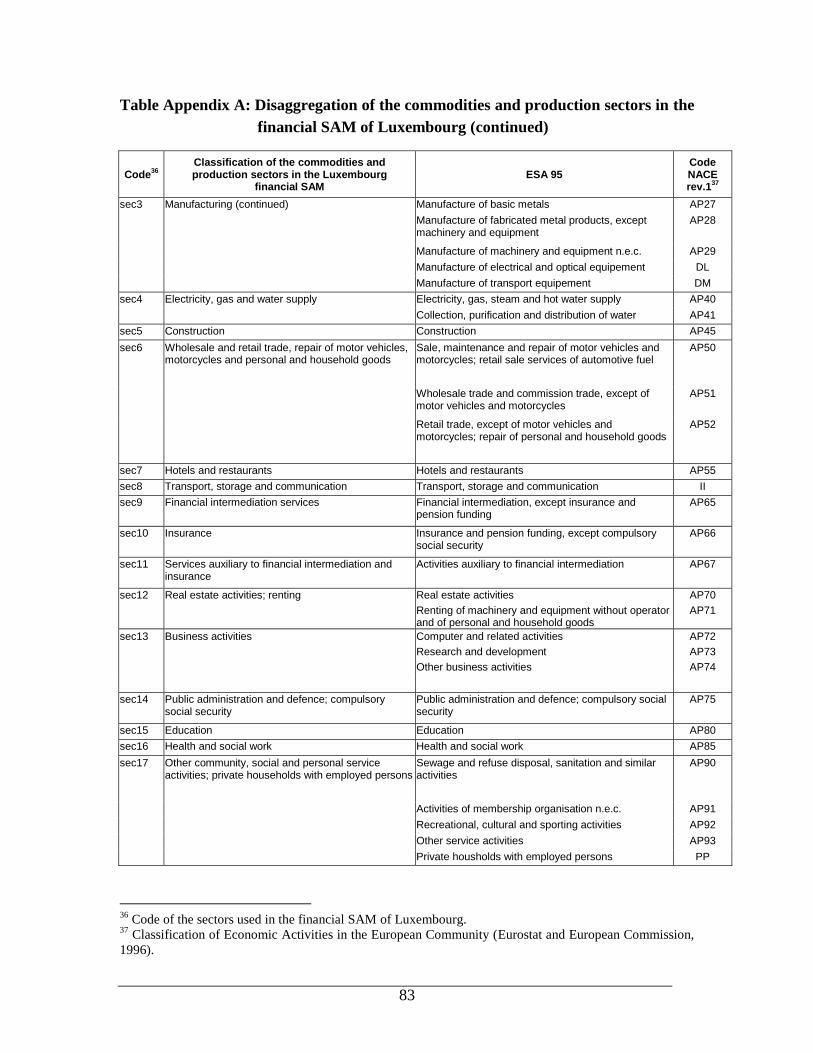
83
Table Appendix A: Disaggregation of the commodities and production sectors in the
financial SAM of Luxembourg (continued)
Code36
Classification of the commodities and production sectors in the Luxembourg
financial SAM ESA 95
Code NACE rev.1
37
sec3 Manufacturing (continued) Manufacture of basic metals AP27
Manufacture of fabricated metal products, except machinery and equipment
AP28
Manufacture of machinery and equipment n.e.c. AP29
Manufacture of electrical and optical equipement DL
Manufacture of transport equipement DM
sec4 Electricity, gas and water supply Electricity, gas, steam and hot water supply AP40
Collection, purification and distribution of water AP41
sec5 Construction Construction AP45
sec6 Wholesale and retail trade, repair of motor vehicles, motorcycles and personal and household goods
Sale, maintenance and repair of motor vehicles and motorcycles; retail sale services of automotive fuel
AP50
Wholesale trade and commission trade, except of motor vehicles and motorcycles
AP51
Retail trade, except of motor vehicles and motorcycles; repair of personal and household goods
AP52
sec7 Hotels and restaurants Hotels and restaurants AP55
sec8 Transport, storage and communication Transport, storage and communication II
sec9 Financial intermediation services Financial intermediation, except insurance and pension funding
AP65
sec10 Insurance Insurance and pension funding, except compulsory social security
AP66
sec11 Services auxiliary to financial intermediation and insurance
Activities auxiliary to financial intermediation AP67
sec12 Real estate activities; renting Real estate activities
Renting of machinery and equipment without operator and of personal and household goods
AP70
AP71
sec13 Business activities Computer and related activities
Research and development
Other business activities
AP72
AP73
AP74
sec14 Public administration and defence; compulsory social security
Public administration and defence; compulsory social security
AP75
sec15 Education Education AP80
sec16 Health and social work Health and social work AP85
sec17 Other community, social and personal service activities; private households with employed persons
Sewage and refuse disposal, sanitation and similar activities
AP90
Activities of membership organisation n.e.c. AP91
Recreational, cultural and sporting activities AP92
Other service activities AP93
Private housholds with employed persons PP
36
Code of the sectors used in the financial SAM of Luxembourg. 37
Classification of Economic Activities in the European Community (Eurostat and European Commission,
1996).
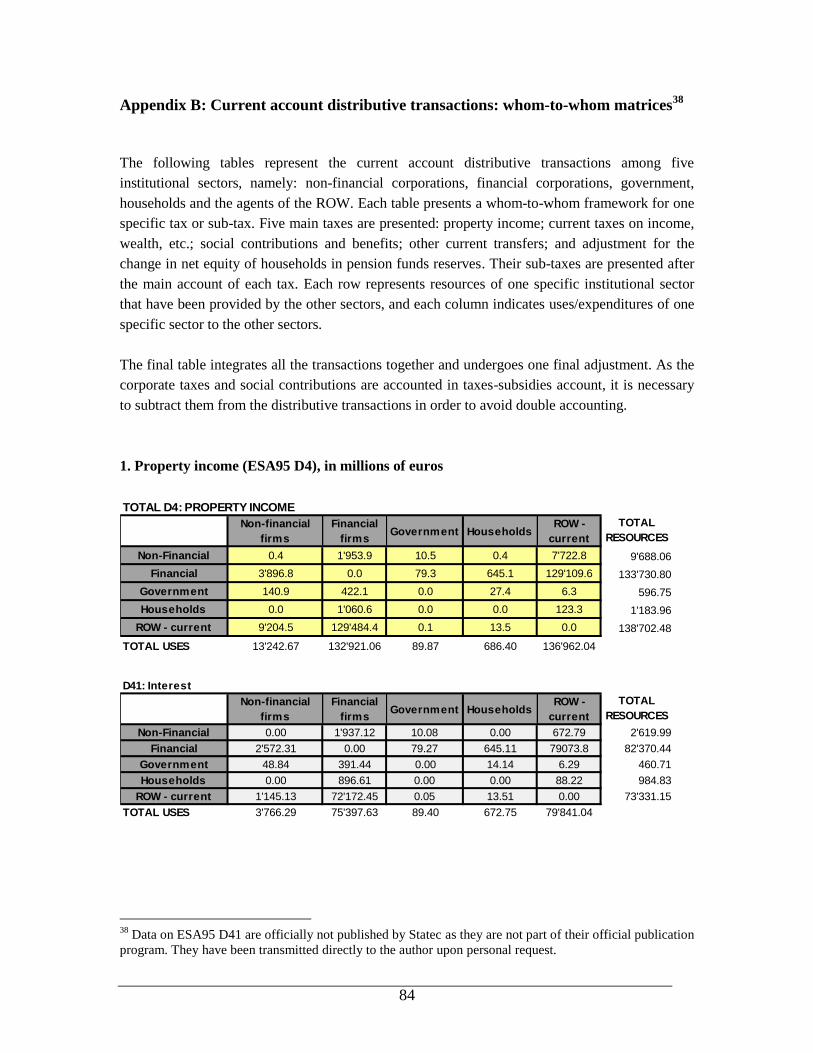
84
Appendix B: Current account distributive transactions: whom-to-whom matrices38
The following tables represent the current account distributive transactions among five
institutional sectors, namely: non-financial corporations, financial corporations, government,
households and the agents of the ROW. Each table presents a whom-to-whom framework for one
specific tax or sub-tax. Five main taxes are presented: property income; current taxes on income,
wealth, etc.; social contributions and benefits; other current transfers; and adjustment for the
change in net equity of households in pension funds reserves. Their sub-taxes are presented after
the main account of each tax. Each row represents resources of one specific institutional sector
that have been provided by the other sectors, and each column indicates uses/expenditures of one
specific sector to the other sectors.
The final table integrates all the transactions together and undergoes one final adjustment. As the
corporate taxes and social contributions are accounted in taxes-subsidies account, it is necessary
to subtract them from the distributive transactions in order to avoid double accounting.
1. Property income (ESA95 D4), in millions of euros
TOTAL D4: PROPERTY INCOME
Non-financial
firms
Financial
firmsGovernment Households
ROW -
current
TOTAL
RESOURCES
Non-Financial 0.4 1'953.9 10.5 0.4 7'722.8 9'688.06
Financial 3'896.8 0.0 79.3 645.1 129'109.6 133'730.80
Government 140.9 422.1 0.0 27.4 6.3 596.75
Households 0.0 1'060.6 0.0 0.0 123.3 1'183.96
ROW - current 9'204.5 129'484.4 0.1 13.5 0.0 138'702.48
TOTAL USES 13'242.67 132'921.06 89.87 686.40 136'962.04
D41: Interest
Non-financial
firms
Financial
firmsGovernment Households
ROW -
current
TOTAL
RESOURCES
Non-Financial 0.00 1'937.12 10.08 0.00 672.79 2'619.99
Financial 2'572.31 0.00 79.27 645.11 79073.8 82'370.44
Government 48.84 391.44 0.00 14.14 6.29 460.71
Households 0.00 896.61 0.00 0.00 88.22 984.83
ROW - current 1'145.13 72'172.45 0.05 13.51 0.00 73'331.15
TOTAL USES 3'766.29 75'397.63 89.40 672.75 79'841.04
38
Data on ESA95 D41 are officially not published by Statec as they are not part of their official publication
program. They have been transmitted directly to the author upon personal request.
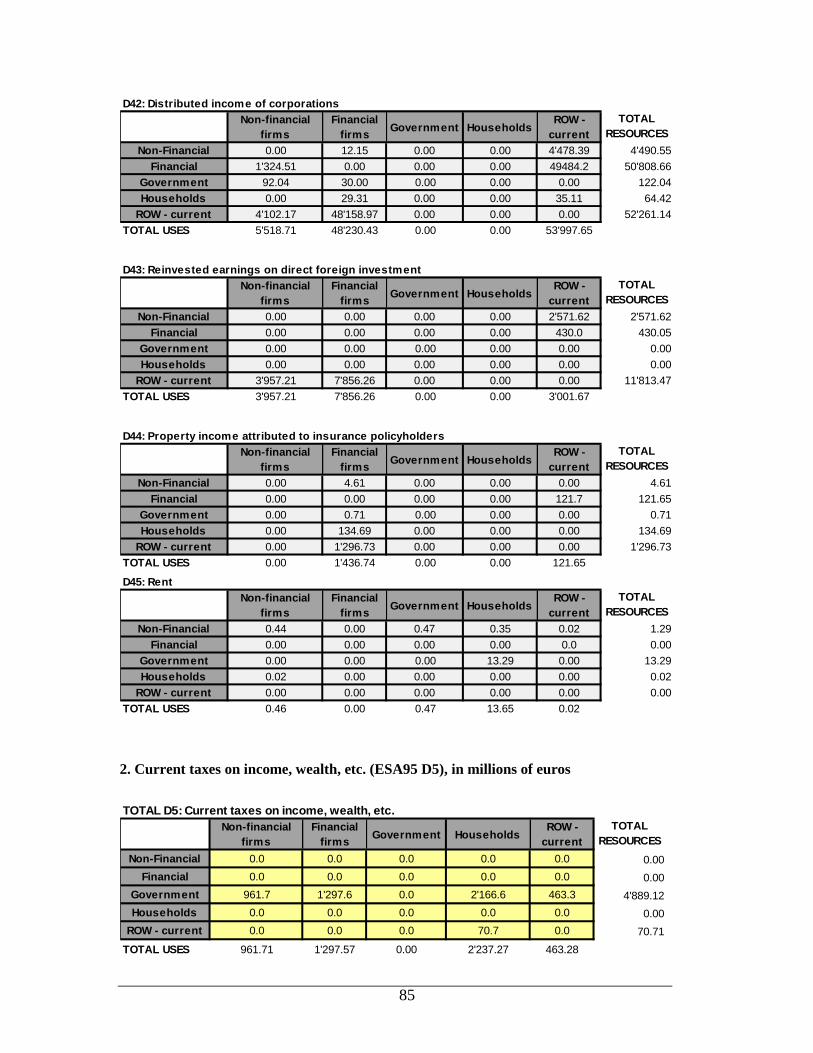
85
D42: Distributed income of corporations
Non-financial
firms
Financial
firmsGovernment Households
ROW -
current
TOTAL
RESOURCES
Non-Financial 0.00 12.15 0.00 0.00 4'478.39 4'490.55
Financial 1'324.51 0.00 0.00 0.00 49484.2 50'808.66
Government 92.04 30.00 0.00 0.00 0.00 122.04
Households 0.00 29.31 0.00 0.00 35.11 64.42
ROW - current 4'102.17 48'158.97 0.00 0.00 0.00 52'261.14
TOTAL USES 5'518.71 48'230.43 0.00 0.00 53'997.65
D43: Reinvested earnings on direct foreign investment
Non-financial
firms
Financial
firmsGovernment Households
ROW -
current
TOTAL
RESOURCES
Non-Financial 0.00 0.00 0.00 0.00 2'571.62 2'571.62
Financial 0.00 0.00 0.00 0.00 430.0 430.05
Government 0.00 0.00 0.00 0.00 0.00 0.00
Households 0.00 0.00 0.00 0.00 0.00 0.00
ROW - current 3'957.21 7'856.26 0.00 0.00 0.00 11'813.47
TOTAL USES 3'957.21 7'856.26 0.00 0.00 3'001.67
D44: Property income attributed to insurance policyholders
Non-financial
firms
Financial
firmsGovernment Households
ROW -
current
TOTAL
RESOURCES
Non-Financial 0.00 4.61 0.00 0.00 0.00 4.61
Financial 0.00 0.00 0.00 0.00 121.7 121.65
Government 0.00 0.71 0.00 0.00 0.00 0.71
Households 0.00 134.69 0.00 0.00 0.00 134.69
ROW - current 0.00 1'296.73 0.00 0.00 0.00 1'296.73
TOTAL USES 0.00 1'436.74 0.00 0.00 121.65 D45: Rent
Non-financial
firms
Financial
firmsGovernment Households
ROW -
current
TOTAL
RESOURCES
Non-Financial 0.44 0.00 0.47 0.35 0.02 1.29
Financial 0.00 0.00 0.00 0.00 0.0 0.00
Government 0.00 0.00 0.00 13.29 0.00 13.29
Households 0.02 0.00 0.00 0.00 0.00 0.02
ROW - current 0.00 0.00 0.00 0.00 0.00 0.00
TOTAL USES 0.46 0.00 0.47 13.65 0.02
2. Current taxes on income, wealth, etc. (ESA95 D5), in millions of euros
TOTAL D5: Current taxes on income, wealth, etc.
Non-financial
firms
Financial
firmsGovernment Households
ROW -
current
TOTAL
RESOURCES
Non-Financial 0.0 0.0 0.0 0.0 0.0 0.00
Financial 0.0 0.0 0.0 0.0 0.0 0.00
Government 961.7 1'297.6 0.0 2'166.6 463.3 4'889.12
Households 0.0 0.0 0.0 0.0 0.0 0.00
ROW - current 0.0 0.0 0.0 70.7 0.0 70.71
TOTAL USES 961.71 1'297.57 0.00 2'237.27 463.28

86
D51: Taxes on income
Non-financial
firms
Financial
firmsGovernment Households
ROW -
current
TOTAL
RESOURCES
Non-Financial 0.00 0.00 0.00 0.00 0.00 0.00
Financial 0.00 0.00 0.00 0.00 0.0 0.00
Government 910.64 1'177.29 0.00 2'103.78 463.28 4'654.99
Households 0.00 0.00 0.00 0.00 0.00 0.00
ROW - current 0.00 0.00 0.00 70.71 0.00 70.71
TOTAL USES 910.64 1'177.29 0.00 2'174.49 463.28
D59: Other current taxes
Non-financial
firms
Financial
firmsGovernment Households
ROW -
current
TOTAL
RESOURCES
Non-Financial 0.00 0.00 0.00 0.00 0.00 0.00
Financial 0.00 0.00 0.00 0.00 0.0 0.00
Government 51.07 120.28 0.00 62.78 0.00 234.13
Households 0.00 0.00 0.00 0.00 0.00 0.00
ROW - current 0.00 0.00 0.00 0.00 0.00 0.00
TOTAL USES 51.07 120.28 0.00 62.78 0.00
3. Social contributions and benefits (ESA95 D6), in millions of euros
TOTAL D6: Social contributions and benefits
Non-financial
firms
Financial
firmsGovernment Households
ROW -
current
TOTAL
RESOURCES
Non-Financial 0.0 0.0 0.0 88.6 0.0 88.64
Financial 0.0 0.0 0.0 63.3 0.0 63.29
Government 0.0 0.0 0.0 2'518.0 1'475.8 3'993.76
Households 88.6 73.9 3'497.2 0.0 177.4 3'837.11
ROW - current 0.0 0.0 1'277.2 255.5 0.0 1'532.66
TOTAL USES 88.64 73.90 4'774.37 2'925.41 1'653.14
D611: Actual social contributions
Non-financial
firms
Financial
firmsGovernment Households
ROW -
current
TOTAL
RESOURCES
Non-Financial 0.00 0.00 0.00 88.64 0.00 88.64
Financial 0.00 0.00 0.00 63.29 0.0 63.29
Government 0.00 0.00 0.00 2'286.44 1'416.45 3'702.89
Households 0.00 0.00 0.00 0.00 0.00 0.00
ROW - current 0.00 0.00 0.00 140.72 0.00 140.72
TOTAL USES 0.00 0.00 0.00 2'579.10 1'416.45

87
D612: Imputed social contributions
Non-financial
firms
Financial
firmsGovernment Households
ROW -
current
TOTAL
RESOURCES
Non-Financial 0.00 0.00 0.00 0.00 0.00 0.00
Financial 0.00 0.00 0.00 0.00 0.0 0.00
Government 0.00 0.00 0.00 231.56 59.31 290.87
Households 0.00 0.00 0.00 0.00 0.00 0.00
ROW - current 0.00 0.00 0.00 114.75 0.00 114.75
TOTAL USES 0.00 0.00 0.00 346.31 59.31
D62: Social benefits other than social tranfers in kind
Non-financial
firms
Financial
firmsGovernment Households
ROW -
current
TOTAL
RESOURCES
Non-Financial 0.00 0.00 0.00 0.00 0.00 0.00
Financial 0.00 0.00 0.00 0.00 0.0 0.00
Government 0.00 0.00 0.00 0.00 0.00 0.00
Households 88.64 73.90 3'497.18 0.00 177.38 3'837.11
ROW - current 0.00 0.00 1'277.19 0.00 0.00 1'277.19
TOTAL USES 88.64 73.90 4'774.37 0.00 177.38
4. Other current transfers (ESA95 D7), in millions of euros
TOTAL D7: Other current transfers
Non-financial
firms
Financial
firmsGovernment Households
ROW -
current
TOTAL
RESOURCES
Non-Financial 0.0 133.1 138.4 0.0 74.7 346.13
Financial 40.8 241.2 4.6 257.0 3'002.1 3'545.67
Government 0.0 13.7 0.0 0.0 38.8 52.56
Households 83.7 218.7 460.0 0.0 36.2 798.60
ROW - current 1.7 4'702.1 348.5 199.8 0.0 5'251.95
TOTAL USES 126.13 5'308.76 951.47 456.75 3'151.78
D71: Net non-life insurance premiums
Non-financial
firms
Financial
firmsGovernment Households
ROW -
current
TOTAL
RESOURCES
Non-Financial 0.00 0.00 0.00 0.00 0.00 0.00
Financial 40.82 151.87 4.62 256.98 2352.81 2'807.10
Government 0.00 0.00 0.00 0.00 0.00 0.00
Households 0.00 0.00 0.00 0.00 0.00 0.00
ROW - current 0.00 523.31 0.00 0.00 0.00 523.31
TOTAL USES 40.82 675.19 4.62 256.98 2'352.81

88
D72: Non-life insurance claims
Non-financial
firms
Financial
firmsGovernment Households
ROW -
current
TOTAL
RESOURCES
Non-Financial 0.00 133.09 0.00 0.00 0.00 133.09
Financial 0.00 89.31 0.00 0.00 588.64 677.94
Government 0.00 13.72 0.00 0.00 0.00 13.72
Households 0.00 218.70 0.00 0.00 0.00 218.70
ROW - current 0.00 2'352.27 0.00 0.00 0.00 2'352.27
TOTAL USES 0.00 2'807.10 0.00 0.00 588.64
D74: Current international cooperation
Non-financial
firms
Financial
firmsGovernment Households
ROW -
current
TOTAL
RESOURCES
Non-Financial 0.00 0.00 0.00 0.00 0.00 0.00
Financial 0.00 0.00 0.00 0.00 0.00 0.00
Government 0.00 0.00 0.00 0.00 9.08 9.08
Households 0.00 0.00 0.00 0.00 0.00 0.00
ROW - current 0.00 0.00 149.45 0.00 0.00 149.45
TOTAL USES 0.00 0.00 149.45 0.00 9.08
D75: Miscellaneous current transfers
Non-financial
firms
Financial
firmsGovernment Households
ROW -
current
TOTAL
RESOURCES
Non-Financial 0.00 0.00 138.36 0.00 74.67 213.03
Financial 0.00 0.00 0.00 0.00 60.63 60.63
Government 0.00 0.00 0.00 0.00 29.76 29.76
Households 83.66 0.00 460.04 0.00 36.20 579.89
ROW - current 1.66 1'826.48 199.01 199.77 0.00 2'226.91
TOTAL USES 85.31 1'826.48 797.40 199.77 201.26
5. Adjustment for the change in net equity of households in pension funds reserves
(ESA95 D8), in millions of euros
D8: Adj. For the change in net equity of housholds in pension funds reserves
Non-financial
firms
Financial
firmsGovernment Households
ROW -
current
TOTAL
RESOURCES
Non-Financial 0.0 0.0 0.0 0.0 0.0 0.00
Financial 0.0 0.0 0.0 0.0 0.0 0.00
Government 0.0 0.0 0.0 0.0 0.0 0.00
Households 0.0 -6.7 0.0 0.0 0.0 -6.73
ROW - current 0.0 0.0 0.0 0.0 2.8 2.82
TOTAL USES 0.00 -6.73 0.00 0.00 2.82

89
6) Total of five taxes: D4+D5+D6+D7+D8, in millions of euros
D4+D5+D6+D7+D8
Non-financial
firms
Financial
firmsGovernment Households
ROW -
current
Non-Financial 0.44 2'086.98 148.91 89.00 7'797.50 10'122.83
Financial 3'937.64 241.18 83.89 965.37 132'111.68 137'339.76
Government 1'102.59 1'733.44 0.00 4'712.00 508.36 8'056.38
Households 172.32 1'346.48 3'957.22 0.00 336.91 5'812.93
ROW - current 9'206.17 134'186.47 1'625.69 539.46 2.82 145'560.62
14'419.16 139'594.55 5'815.71 6'305.83 140'757.26
7) Total of five taxes (ESA95 D4+D5+D6+D7+D8) and additional adjustment of corporate
taxes and social contributions, in millions of euros
D4+D5+D6+D7+D8 +adjustement on K and L
Non-financial
firms
Financial
firmsGovernment Households
ROW -
current
Non-Financial 0.44 2'086.98 148.91 89.00 7'797.50 10'122.83
Financial 3'937.64 241.18 83.89 965.37 132'111.68 137'339.76
Government 140.88 546.91 0.00 2'119.41 508.36 3'315.56
Households 172.32 1'346.48 3'957.22 0.00 336.91 5'812.93
ROW - current 9'206.17 134'186.47 1'625.69 539.46 2.82 145'560.62
13'457.45 138'408.02 5'815.71 3'713.25 140'757.26
Ajustement on K and L
D51B+D59 961.7 1186.5 0.0 62.8
D61 2529.8 1475.8
Total 961.7 1186.5 0.0 2592.6 1475.8
B.2n adjusted 4'853 3'692 126 2'315 -12'109
D1 (resources) 8'123 5'047
D2 4'662 74
D3 -562 -21
D1 (uses) 1'040
Sub-total 1'519 2'623 1'727 12'538 -3'246
Final consumption 0 0 5'541 11'997 0
2nd sub-total 1'519 2'623 -3'814 541 -3'246
Taxes account in SAM 6'217
B8n Net savings 1'519 2'623 2'403 541 -3'246
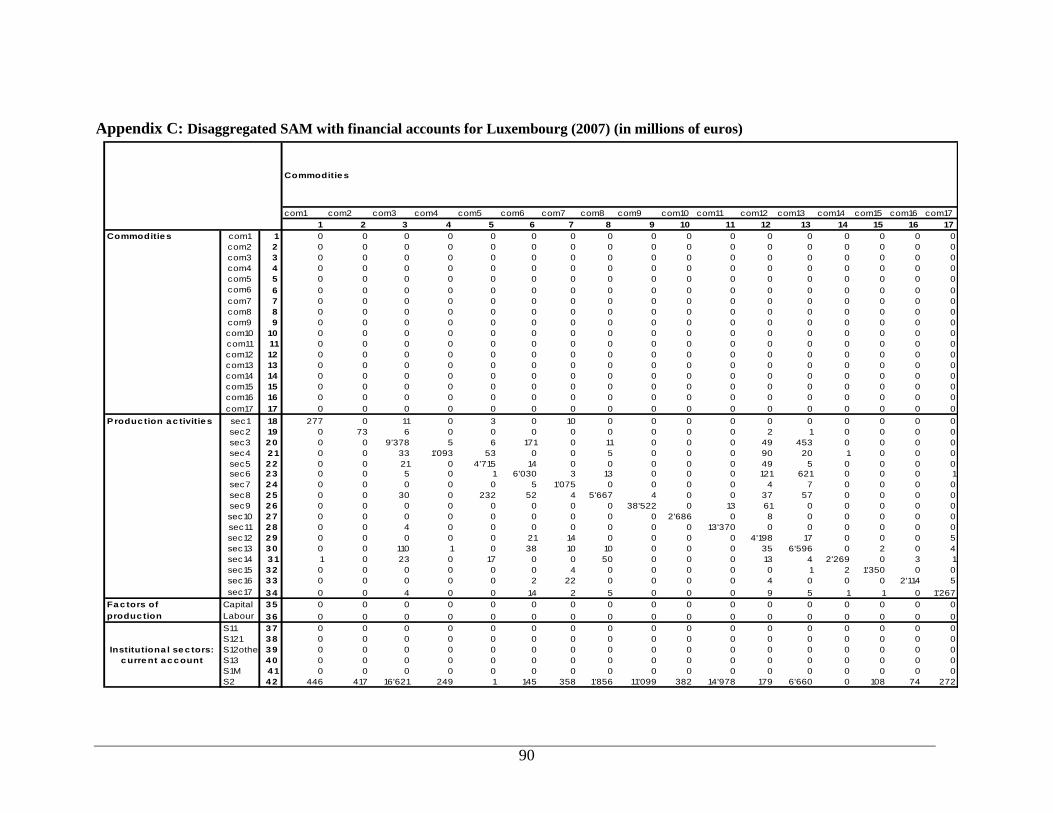
90
Appendix C: Disaggregated SAM with financial accounts for Luxembourg (2007) (in millions of euros)
Commoditie s
com1 com2 com3 com4 com5 com6 com7 com8 com9 com10 com11 com12 com13 com14 com15 com16 com17
1 2 3 4 5 6 7 8 9 10 11 12 13 14 15 16 17
Commoditie s com1 1 0 0 0 0 0 0 0 0 0 0 0 0 0 0 0 0 0
com2 2 0 0 0 0 0 0 0 0 0 0 0 0 0 0 0 0 0
com3 3 0 0 0 0 0 0 0 0 0 0 0 0 0 0 0 0 0
com4 4 0 0 0 0 0 0 0 0 0 0 0 0 0 0 0 0 0
com5 5 0 0 0 0 0 0 0 0 0 0 0 0 0 0 0 0 0
com6 6 0 0 0 0 0 0 0 0 0 0 0 0 0 0 0 0 0
com7 7 0 0 0 0 0 0 0 0 0 0 0 0 0 0 0 0 0
com8 8 0 0 0 0 0 0 0 0 0 0 0 0 0 0 0 0 0
com9 9 0 0 0 0 0 0 0 0 0 0 0 0 0 0 0 0 0
com10 10 0 0 0 0 0 0 0 0 0 0 0 0 0 0 0 0 0
com11 11 0 0 0 0 0 0 0 0 0 0 0 0 0 0 0 0 0
com12 12 0 0 0 0 0 0 0 0 0 0 0 0 0 0 0 0 0
com13 13 0 0 0 0 0 0 0 0 0 0 0 0 0 0 0 0 0
com14 14 0 0 0 0 0 0 0 0 0 0 0 0 0 0 0 0 0
com15 15 0 0 0 0 0 0 0 0 0 0 0 0 0 0 0 0 0
com16 16 0 0 0 0 0 0 0 0 0 0 0 0 0 0 0 0 0
com17 17 0 0 0 0 0 0 0 0 0 0 0 0 0 0 0 0 0
Produc tion a c tivitie s sec1 18 277 0 11 0 3 0 10 0 0 0 0 0 0 0 0 0 0
sec2 19 0 73 6 0 0 0 0 0 0 0 0 2 1 0 0 0 0
sec3 2 0 0 0 9'378 5 6 171 0 11 0 0 0 49 453 0 0 0 0
sec4 2 1 0 0 33 1'093 53 0 0 5 0 0 0 90 20 1 0 0 0
sec5 2 2 0 0 21 0 4'715 14 0 0 0 0 0 49 5 0 0 0 0
sec6 2 3 0 0 5 0 1 6'030 3 13 0 0 0 121 621 0 0 0 1
sec7 2 4 0 0 0 0 0 5 1'075 0 0 0 0 4 7 0 0 0 0
sec8 2 5 0 0 30 0 232 52 4 5'667 4 0 0 37 57 0 0 0 0
sec9 2 6 0 0 0 0 0 0 0 0 38'522 0 13 61 0 0 0 0 0
sec10 2 7 0 0 0 0 0 0 0 0 0 2'686 0 8 0 0 0 0 0
sec11 2 8 0 0 4 0 0 0 0 0 0 0 13'370 0 0 0 0 0 0
sec12 2 9 0 0 0 0 0 21 14 0 0 0 0 4'198 17 0 0 0 5
sec13 3 0 0 0 110 1 0 38 10 10 0 0 0 35 6'596 0 2 0 4
sec14 3 1 1 0 23 0 17 0 0 50 0 0 0 13 4 2'269 0 3 1
sec15 3 2 0 0 0 0 0 0 4 0 0 0 0 0 1 2 1'350 0 0
sec16 3 3 0 0 0 0 0 2 22 0 0 0 0 4 0 0 0 2'114 5
sec17 3 4 0 0 4 0 0 14 2 5 0 0 0 9 5 1 1 0 1'267
Fa c tors of Capital 3 5 0 0 0 0 0 0 0 0 0 0 0 0 0 0 0 0 0
produc tion Labour 3 6 0 0 0 0 0 0 0 0 0 0 0 0 0 0 0 0 0
S11 3 7 0 0 0 0 0 0 0 0 0 0 0 0 0 0 0 0 0
S121 3 8 0 0 0 0 0 0 0 0 0 0 0 0 0 0 0 0 0
S12other 3 9 0 0 0 0 0 0 0 0 0 0 0 0 0 0 0 0 0
S13 4 0 0 0 0 0 0 0 0 0 0 0 0 0 0 0 0 0 0
S1M 4 1 0 0 0 0 0 0 0 0 0 0 0 0 0 0 0 0 0
S2 4 2 446 417 16'621 249 1 145 358 1'856 11'099 382 14'978 179 6'660 0 108 74 272
Institutiona l se c tors:
c urre nt a c c ount
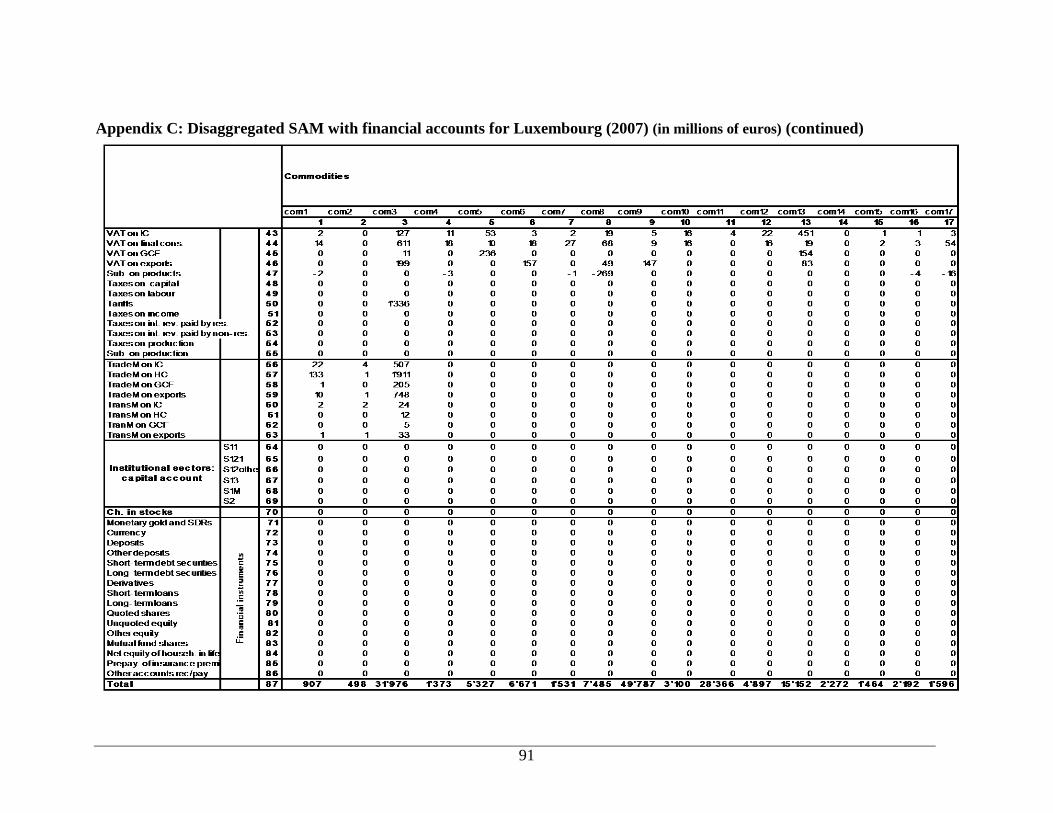
91
Appendix C: Disaggregated SAM with financial accounts for Luxembourg (2007) (in millions of euros) (continued)
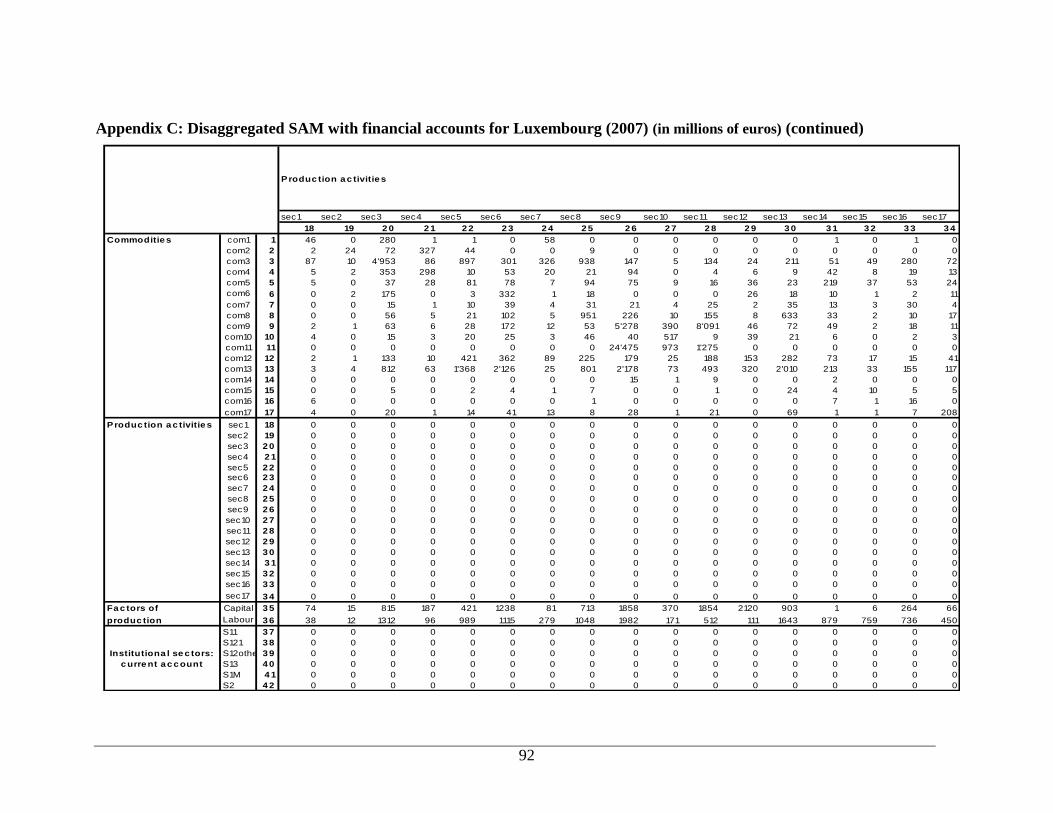
92
Appendix C: Disaggregated SAM with financial accounts for Luxembourg (2007) (in millions of euros) (continued)
Produc tion a c tivitie s
sec1 sec2 sec3 sec4 sec5 sec6 sec7 sec8 sec9 sec10 sec11 sec12 sec13 sec14 sec15 sec16 sec17
18 19 2 0 2 1 2 2 2 3 2 4 2 5 2 6 2 7 2 8 2 9 3 0 3 1 3 2 3 3 3 4
Commoditie s com1 1 46 0 280 1 1 0 58 0 0 0 0 0 0 1 0 1 0
com2 2 2 24 72 327 44 0 0 9 0 0 0 0 0 0 0 0 0
com3 3 87 10 4'953 86 897 301 326 938 147 5 134 24 211 51 49 280 72
com4 4 5 2 353 298 10 53 20 21 94 0 4 6 9 42 8 19 13
com5 5 5 0 37 28 81 78 7 94 75 9 16 36 23 219 37 53 24
com6 6 0 2 175 0 3 332 1 18 0 0 0 26 18 10 1 2 11
com7 7 0 0 15 1 10 39 4 31 21 4 25 2 35 13 3 30 4
com8 8 0 0 56 5 21 102 5 951 226 10 155 8 633 33 2 10 17
com9 9 2 1 63 6 28 172 12 53 5'278 390 8'091 46 72 49 2 18 11
com10 10 4 0 15 3 20 25 3 46 40 517 9 39 21 6 0 2 3
com11 11 0 0 0 0 0 0 0 0 24'475 973 1'275 0 0 0 0 0 0
com12 12 2 1 133 10 421 362 89 225 179 25 188 153 282 73 17 15 41
com13 13 3 4 812 63 1'368 2'126 25 801 2'178 73 493 320 2'010 213 33 155 117
com14 14 0 0 0 0 0 0 0 0 15 1 9 0 0 2 0 0 0
com15 15 0 0 5 0 2 4 1 7 0 0 1 0 24 4 10 5 5
com16 16 6 0 0 0 0 0 0 1 0 0 0 0 0 7 1 16 0
com17 17 4 0 20 1 14 41 13 8 28 1 21 0 69 1 1 7 208
Produc tion a c tivitie s sec1 18 0 0 0 0 0 0 0 0 0 0 0 0 0 0 0 0 0
sec2 19 0 0 0 0 0 0 0 0 0 0 0 0 0 0 0 0 0
sec3 2 0 0 0 0 0 0 0 0 0 0 0 0 0 0 0 0 0 0
sec4 2 1 0 0 0 0 0 0 0 0 0 0 0 0 0 0 0 0 0
sec5 2 2 0 0 0 0 0 0 0 0 0 0 0 0 0 0 0 0 0
sec6 2 3 0 0 0 0 0 0 0 0 0 0 0 0 0 0 0 0 0
sec7 2 4 0 0 0 0 0 0 0 0 0 0 0 0 0 0 0 0 0
sec8 2 5 0 0 0 0 0 0 0 0 0 0 0 0 0 0 0 0 0
sec9 2 6 0 0 0 0 0 0 0 0 0 0 0 0 0 0 0 0 0
sec10 2 7 0 0 0 0 0 0 0 0 0 0 0 0 0 0 0 0 0
sec11 2 8 0 0 0 0 0 0 0 0 0 0 0 0 0 0 0 0 0
sec12 2 9 0 0 0 0 0 0 0 0 0 0 0 0 0 0 0 0 0
sec13 3 0 0 0 0 0 0 0 0 0 0 0 0 0 0 0 0 0 0
sec14 3 1 0 0 0 0 0 0 0 0 0 0 0 0 0 0 0 0 0
sec15 3 2 0 0 0 0 0 0 0 0 0 0 0 0 0 0 0 0 0
sec16 3 3 0 0 0 0 0 0 0 0 0 0 0 0 0 0 0 0 0
sec17 3 4 0 0 0 0 0 0 0 0 0 0 0 0 0 0 0 0 0
Fa c tors of Capital 3 5 74 15 815 187 421 1238 81 713 1858 370 1854 2120 903 1 6 264 66
produc tion Labour 3 6 38 12 1312 96 989 1115 279 1048 1982 171 512 111 1643 879 759 736 450
S11 3 7 0 0 0 0 0 0 0 0 0 0 0 0 0 0 0 0 0
S121 3 8 0 0 0 0 0 0 0 0 0 0 0 0 0 0 0 0 0
S12other 3 9 0 0 0 0 0 0 0 0 0 0 0 0 0 0 0 0 0
S13 4 0 0 0 0 0 0 0 0 0 0 0 0 0 0 0 0 0 0
S1M 4 1 0 0 0 0 0 0 0 0 0 0 0 0 0 0 0 0 0
S2 4 2 0 0 0 0 0 0 0 0 0 0 0 0 0 0 0 0 0
Institutiona l se c tors:
c urre nt a c c ount
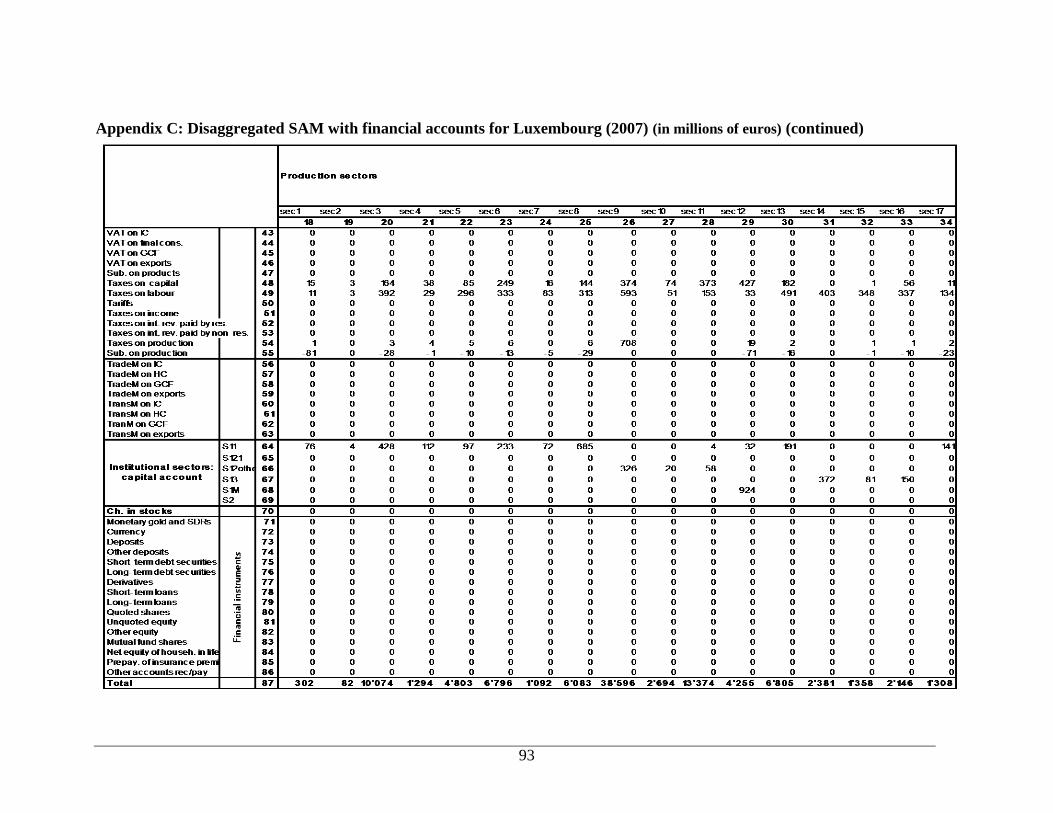
93
Appendix C: Disaggregated SAM with financial accounts for Luxembourg (2007) (in millions of euros) (continued)
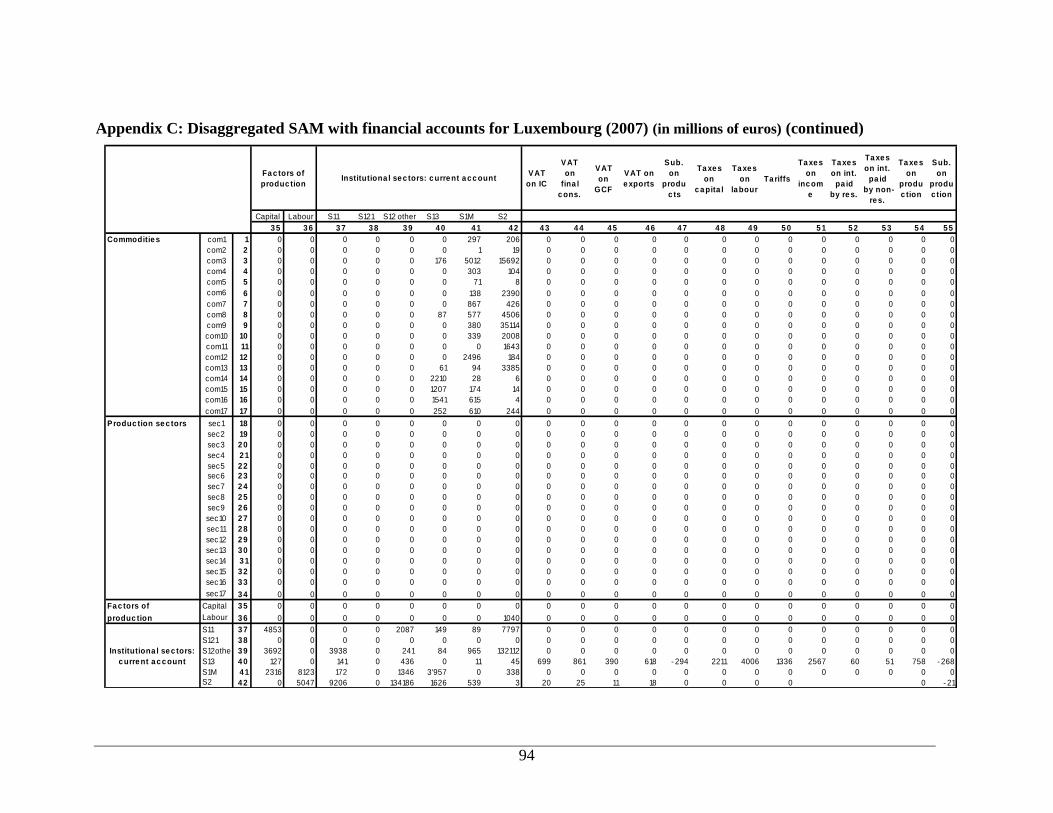
94
Appendix C: Disaggregated SAM with financial accounts for Luxembourg (2007) (in millions of euros) (continued)
VAT
on IC
VAT
on
fina l
c ons.
VAT
on
GCF
VAT on
e xports
Sub.
on
produ
c ts
Ta xe s
on
c a pita l
Ta xe s
on
la bour
Ta riffs
Ta xe s
on
inc om
e
Ta xe s
on int.
pa id
by re s.
Ta xe s
on int.
pa id
by non-
re s.
Ta xe s
on
produ
c tion
Sub.
on
produ
c tion
Capital Labour S11 S121 S12 other S13 S1M S2
3 5 3 6 3 7 3 8 3 9 4 0 4 1 4 2 4 3 4 4 4 5 4 6 4 7 4 8 4 9 5 0 5 1 5 2 5 3 5 4 5 5
Commoditie s com1 1 0 0 0 0 0 0 297 206 0 0 0 0 0 0 0 0 0 0 0 0 0
com2 2 0 0 0 0 0 0 1 19 0 0 0 0 0 0 0 0 0 0 0 0 0
com3 3 0 0 0 0 0 176 5012 15692 0 0 0 0 0 0 0 0 0 0 0 0 0
com4 4 0 0 0 0 0 0 303 104 0 0 0 0 0 0 0 0 0 0 0 0 0
com5 5 0 0 0 0 0 0 71 8 0 0 0 0 0 0 0 0 0 0 0 0 0
com6 6 0 0 0 0 0 0 138 2390 0 0 0 0 0 0 0 0 0 0 0 0 0
com7 7 0 0 0 0 0 0 867 426 0 0 0 0 0 0 0 0 0 0 0 0 0
com8 8 0 0 0 0 0 87 577 4506 0 0 0 0 0 0 0 0 0 0 0 0 0
com9 9 0 0 0 0 0 0 380 35114 0 0 0 0 0 0 0 0 0 0 0 0 0
com10 10 0 0 0 0 0 0 339 2008 0 0 0 0 0 0 0 0 0 0 0 0 0
com11 11 0 0 0 0 0 0 0 1643 0 0 0 0 0 0 0 0 0 0 0 0 0
com12 12 0 0 0 0 0 0 2496 184 0 0 0 0 0 0 0 0 0 0 0 0 0
com13 13 0 0 0 0 0 61 94 3385 0 0 0 0 0 0 0 0 0 0 0 0 0
com14 14 0 0 0 0 0 2210 28 6 0 0 0 0 0 0 0 0 0 0 0 0 0
com15 15 0 0 0 0 0 1207 174 14 0 0 0 0 0 0 0 0 0 0 0 0 0
com16 16 0 0 0 0 0 1541 615 4 0 0 0 0 0 0 0 0 0 0 0 0 0
com17 17 0 0 0 0 0 252 610 244 0 0 0 0 0 0 0 0 0 0 0 0 0
Produc tion se c tors sec1 18 0 0 0 0 0 0 0 0 0 0 0 0 0 0 0 0 0 0 0 0 0
sec2 19 0 0 0 0 0 0 0 0 0 0 0 0 0 0 0 0 0 0 0 0 0
sec3 2 0 0 0 0 0 0 0 0 0 0 0 0 0 0 0 0 0 0 0 0 0 0
sec4 2 1 0 0 0 0 0 0 0 0 0 0 0 0 0 0 0 0 0 0 0 0 0
sec5 2 2 0 0 0 0 0 0 0 0 0 0 0 0 0 0 0 0 0 0 0 0 0
sec6 2 3 0 0 0 0 0 0 0 0 0 0 0 0 0 0 0 0 0 0 0 0 0
sec7 2 4 0 0 0 0 0 0 0 0 0 0 0 0 0 0 0 0 0 0 0 0 0
sec8 2 5 0 0 0 0 0 0 0 0 0 0 0 0 0 0 0 0 0 0 0 0 0
sec9 2 6 0 0 0 0 0 0 0 0 0 0 0 0 0 0 0 0 0 0 0 0 0
sec10 2 7 0 0 0 0 0 0 0 0 0 0 0 0 0 0 0 0 0 0 0 0 0
sec11 2 8 0 0 0 0 0 0 0 0 0 0 0 0 0 0 0 0 0 0 0 0 0
sec12 2 9 0 0 0 0 0 0 0 0 0 0 0 0 0 0 0 0 0 0 0 0 0
sec13 3 0 0 0 0 0 0 0 0 0 0 0 0 0 0 0 0 0 0 0 0 0 0
sec14 3 1 0 0 0 0 0 0 0 0 0 0 0 0 0 0 0 0 0 0 0 0 0
sec15 3 2 0 0 0 0 0 0 0 0 0 0 0 0 0 0 0 0 0 0 0 0 0
sec16 3 3 0 0 0 0 0 0 0 0 0 0 0 0 0 0 0 0 0 0 0 0 0
sec17 3 4 0 0 0 0 0 0 0 0 0 0 0 0 0 0 0 0 0 0 0 0 0
Fa c tors of Capital 3 5 0 0 0 0 0 0 0 0 0 0 0 0 0 0 0 0 0 0 0 0 0
produc tion Labour 3 6 0 0 0 0 0 0 0 1040 0 0 0 0 0 0 0 0 0 0 0 0 0
S11 3 7 4853 0 0 0 2087 149 89 7797 0 0 0 0 0 0 0 0 0 0 0 0 0
S121 3 8 0 0 0 0 0 0 0 0 0 0 0 0 0 0 0 0 0 0 0 0 0
S12othe 3 9 3692 0 3938 0 241 84 965 132112 0 0 0 0 0 0 0 0 0 0 0 0 0
S13 4 0 127 0 141 0 436 0 11 45 699 861 390 618 - 294 2211 4006 1336 2567 60 51 758 - 268
S1M 4 1 2316 8123 172 0 1346 3'957 0 338 0 0 0 0 0 0 0 0 0 0 0 0 0
S2 4 2 0 5047 9206 0 134186 1626 539 3 20 25 11 18 0 0 0 0 0 - 21
Institutiona l se c tors:
c urre nt a c c ount
Fa c tors of
produc tionInstitutiona l se c tors: c urre nt a c c ount
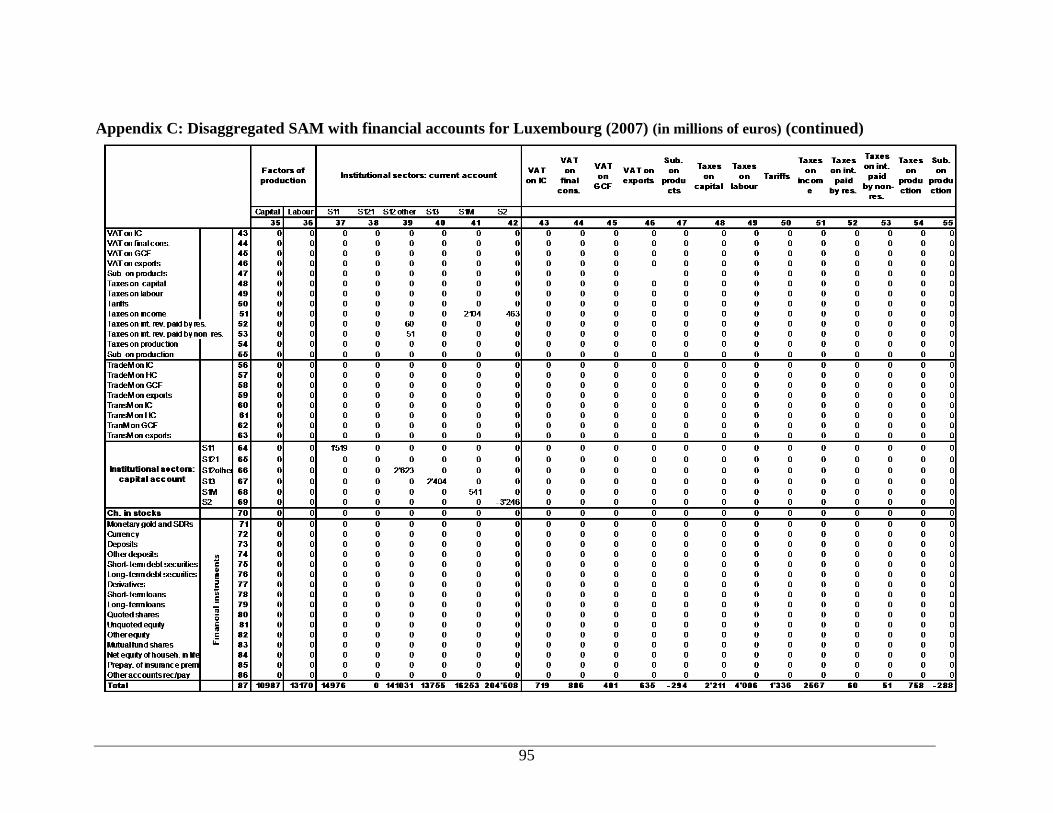
95
Appendix C: Disaggregated SAM with financial accounts for Luxembourg (2007) (in millions of euros) (continued)
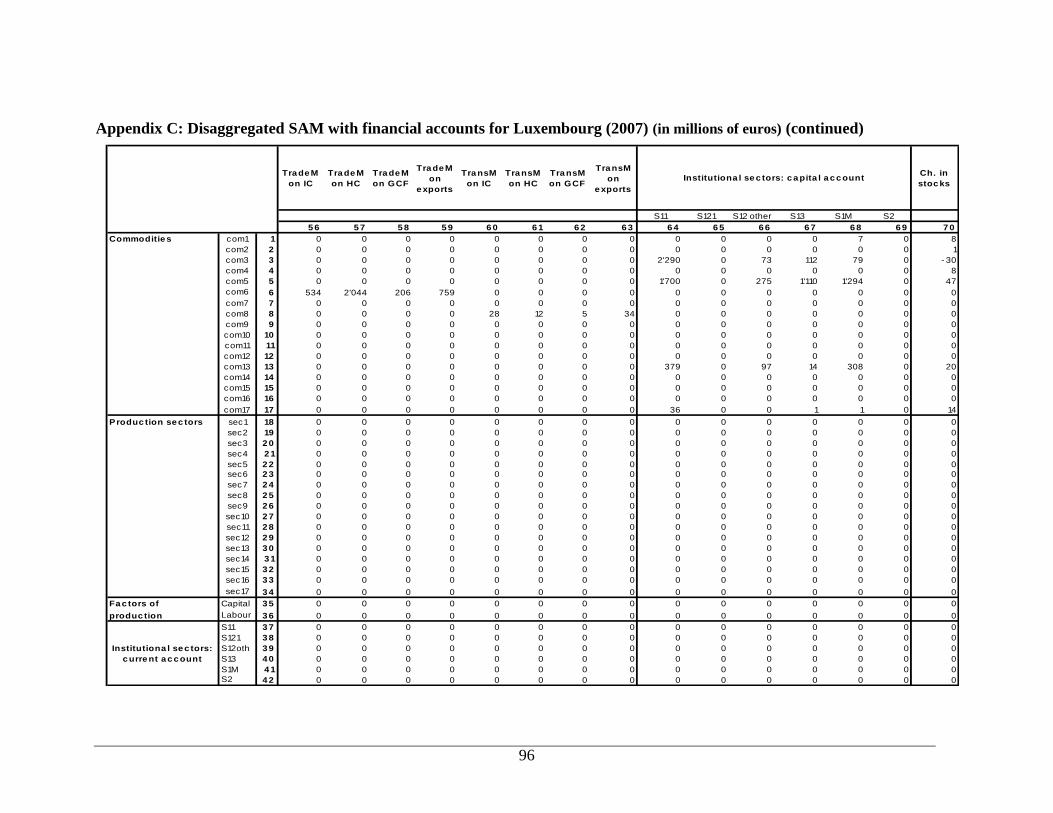
96
Appendix C: Disaggregated SAM with financial accounts for Luxembourg (2007) (in millions of euros) (continued)
Tra de M
on IC
Tra de M
on HC
Tra de M
on GCF
Tra de M
on
e xports
Tra nsM
on IC
Tra nsM
on HC
Tra nsM
on GCF
Tra nsM
on
e xports
Ch. in
stoc ks
S11 S121 S12 other S13 S1M S2
5 6 5 7 5 8 5 9 6 0 6 1 6 2 6 3 6 4 6 5 6 6 6 7 6 8 6 9 7 0
Commoditie s com1 1 0 0 0 0 0 0 0 0 0 0 0 0 7 0 8
com2 2 0 0 0 0 0 0 0 0 0 0 0 0 0 0 1
com3 3 0 0 0 0 0 0 0 0 2'290 0 73 112 79 0 - 30
com4 4 0 0 0 0 0 0 0 0 0 0 0 0 0 0 8
com5 5 0 0 0 0 0 0 0 0 1'700 0 275 1'110 1'294 0 47
com6 6 534 2'044 206 759 0 0 0 0 0 0 0 0 0 0 0
com7 7 0 0 0 0 0 0 0 0 0 0 0 0 0 0 0
com8 8 0 0 0 0 28 12 5 34 0 0 0 0 0 0 0
com9 9 0 0 0 0 0 0 0 0 0 0 0 0 0 0 0
com10 10 0 0 0 0 0 0 0 0 0 0 0 0 0 0 0
com11 11 0 0 0 0 0 0 0 0 0 0 0 0 0 0 0
com12 12 0 0 0 0 0 0 0 0 0 0 0 0 0 0 0
com13 13 0 0 0 0 0 0 0 0 379 0 97 14 308 0 20
com14 14 0 0 0 0 0 0 0 0 0 0 0 0 0 0 0
com15 15 0 0 0 0 0 0 0 0 0 0 0 0 0 0 0
com16 16 0 0 0 0 0 0 0 0 0 0 0 0 0 0 0
com17 17 0 0 0 0 0 0 0 0 36 0 0 1 1 0 14
Produc tion se c tors sec1 18 0 0 0 0 0 0 0 0 0 0 0 0 0 0 0
sec2 19 0 0 0 0 0 0 0 0 0 0 0 0 0 0 0
sec3 2 0 0 0 0 0 0 0 0 0 0 0 0 0 0 0 0
sec4 2 1 0 0 0 0 0 0 0 0 0 0 0 0 0 0 0
sec5 2 2 0 0 0 0 0 0 0 0 0 0 0 0 0 0 0
sec6 2 3 0 0 0 0 0 0 0 0 0 0 0 0 0 0 0
sec7 2 4 0 0 0 0 0 0 0 0 0 0 0 0 0 0 0
sec8 2 5 0 0 0 0 0 0 0 0 0 0 0 0 0 0 0
sec9 2 6 0 0 0 0 0 0 0 0 0 0 0 0 0 0 0
sec10 2 7 0 0 0 0 0 0 0 0 0 0 0 0 0 0 0
sec11 2 8 0 0 0 0 0 0 0 0 0 0 0 0 0 0 0
sec12 2 9 0 0 0 0 0 0 0 0 0 0 0 0 0 0 0
sec13 3 0 0 0 0 0 0 0 0 0 0 0 0 0 0 0 0
sec14 3 1 0 0 0 0 0 0 0 0 0 0 0 0 0 0 0
sec15 3 2 0 0 0 0 0 0 0 0 0 0 0 0 0 0 0
sec16 3 3 0 0 0 0 0 0 0 0 0 0 0 0 0 0 0
sec17 3 4 0 0 0 0 0 0 0 0 0 0 0 0 0 0 0
Fa c tors of Capital 3 5 0 0 0 0 0 0 0 0 0 0 0 0 0 0 0
produc tion Labour 3 6 0 0 0 0 0 0 0 0 0 0 0 0 0 0 0
S11 3 7 0 0 0 0 0 0 0 0 0 0 0 0 0 0 0
S121 3 8 0 0 0 0 0 0 0 0 0 0 0 0 0 0 0
S12oth 3 9 0 0 0 0 0 0 0 0 0 0 0 0 0 0 0
S13 4 0 0 0 0 0 0 0 0 0 0 0 0 0 0 0 0
S1M 4 1 0 0 0 0 0 0 0 0 0 0 0 0 0 0 0
S2 4 2 0 0 0 0 0 0 0 0 0 0 0 0 0 0 0
Institutiona l se c tors:
c urre nt a c c ount
Institutiona l se c tors: c a pita l a c c ount

97
Appendix C: Disaggregated SAM with financial accounts for Luxembourg (2007) (in millions of euros) (continued)
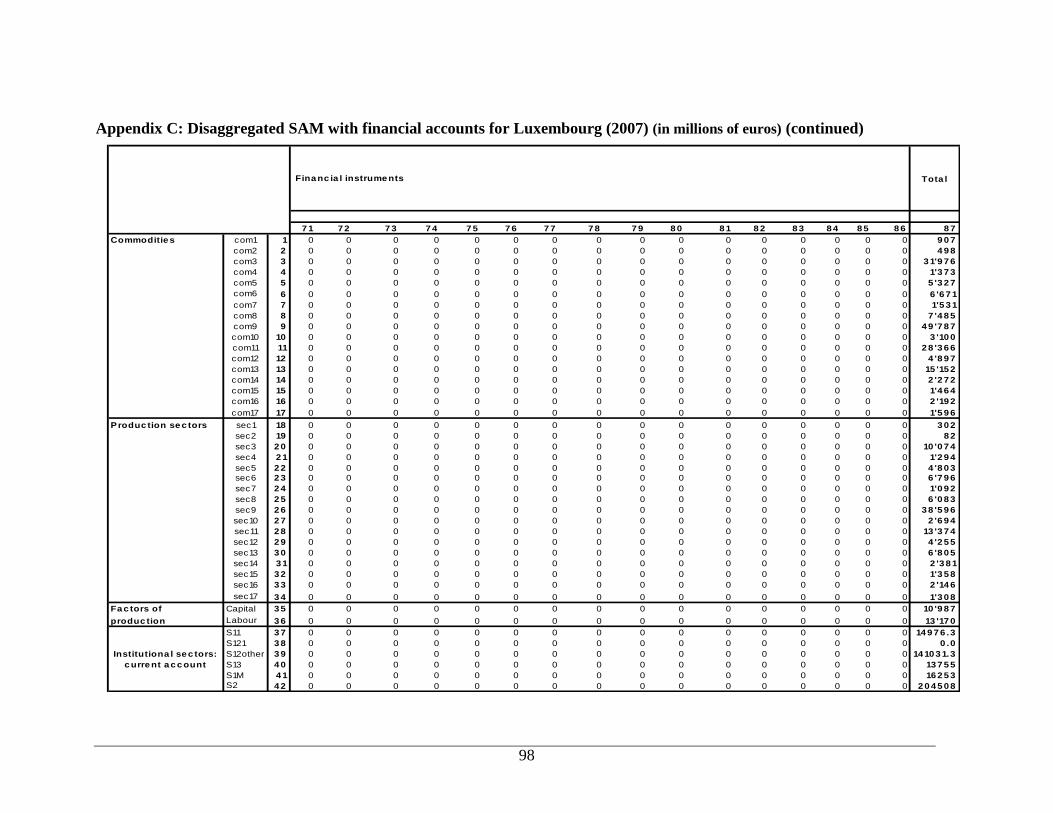
98
Appendix C: Disaggregated SAM with financial accounts for Luxembourg (2007) (in millions of euros) (continued)
Tota l
7 1 7 2 7 3 7 4 7 5 7 6 7 7 7 8 7 9 8 0 8 1 8 2 8 3 8 4 8 5 8 6 8 7
Commoditie s com1 1 0 0 0 0 0 0 0 0 0 0 0 0 0 0 0 0 9 0 7
com2 2 0 0 0 0 0 0 0 0 0 0 0 0 0 0 0 0 4 9 8
com3 3 0 0 0 0 0 0 0 0 0 0 0 0 0 0 0 0 3 1'9 7 6
com4 4 0 0 0 0 0 0 0 0 0 0 0 0 0 0 0 0 1'3 7 3
com5 5 0 0 0 0 0 0 0 0 0 0 0 0 0 0 0 0 5 '3 2 7
com6 6 0 0 0 0 0 0 0 0 0 0 0 0 0 0 0 0 6 '6 7 1
com7 7 0 0 0 0 0 0 0 0 0 0 0 0 0 0 0 0 1'5 3 1
com8 8 0 0 0 0 0 0 0 0 0 0 0 0 0 0 0 0 7 '4 8 5
com9 9 0 0 0 0 0 0 0 0 0 0 0 0 0 0 0 0 4 9 '7 8 7
com10 10 0 0 0 0 0 0 0 0 0 0 0 0 0 0 0 0 3 '10 0
com11 11 0 0 0 0 0 0 0 0 0 0 0 0 0 0 0 0 2 8 '3 6 6
com12 12 0 0 0 0 0 0 0 0 0 0 0 0 0 0 0 0 4 '8 9 7
com13 13 0 0 0 0 0 0 0 0 0 0 0 0 0 0 0 0 15 '15 2
com14 14 0 0 0 0 0 0 0 0 0 0 0 0 0 0 0 0 2 '2 7 2
com15 15 0 0 0 0 0 0 0 0 0 0 0 0 0 0 0 0 1'4 6 4
com16 16 0 0 0 0 0 0 0 0 0 0 0 0 0 0 0 0 2 '19 2
com17 17 0 0 0 0 0 0 0 0 0 0 0 0 0 0 0 0 1'5 9 6
Produc tion se c tors sec1 18 0 0 0 0 0 0 0 0 0 0 0 0 0 0 0 0 3 0 2
sec2 19 0 0 0 0 0 0 0 0 0 0 0 0 0 0 0 0 8 2
sec3 2 0 0 0 0 0 0 0 0 0 0 0 0 0 0 0 0 0 10 '0 7 4
sec4 2 1 0 0 0 0 0 0 0 0 0 0 0 0 0 0 0 0 1'2 9 4
sec5 2 2 0 0 0 0 0 0 0 0 0 0 0 0 0 0 0 0 4 '8 0 3
sec6 2 3 0 0 0 0 0 0 0 0 0 0 0 0 0 0 0 0 6 '7 9 6
sec7 2 4 0 0 0 0 0 0 0 0 0 0 0 0 0 0 0 0 1'0 9 2
sec8 2 5 0 0 0 0 0 0 0 0 0 0 0 0 0 0 0 0 6 '0 8 3
sec9 2 6 0 0 0 0 0 0 0 0 0 0 0 0 0 0 0 0 3 8 '5 9 6
sec10 2 7 0 0 0 0 0 0 0 0 0 0 0 0 0 0 0 0 2 '6 9 4
sec11 2 8 0 0 0 0 0 0 0 0 0 0 0 0 0 0 0 0 13 '3 7 4
sec12 2 9 0 0 0 0 0 0 0 0 0 0 0 0 0 0 0 0 4 '2 5 5
sec13 3 0 0 0 0 0 0 0 0 0 0 0 0 0 0 0 0 0 6 '8 0 5
sec14 3 1 0 0 0 0 0 0 0 0 0 0 0 0 0 0 0 0 2 '3 8 1
sec15 3 2 0 0 0 0 0 0 0 0 0 0 0 0 0 0 0 0 1'3 5 8
sec16 3 3 0 0 0 0 0 0 0 0 0 0 0 0 0 0 0 0 2 '14 6
sec17 3 4 0 0 0 0 0 0 0 0 0 0 0 0 0 0 0 0 1'3 0 8
Fa c tors of Capital 3 5 0 0 0 0 0 0 0 0 0 0 0 0 0 0 0 0 10 '9 8 7
produc tion Labour 3 6 0 0 0 0 0 0 0 0 0 0 0 0 0 0 0 0 13 '17 0
S11 3 7 0 0 0 0 0 0 0 0 0 0 0 0 0 0 0 0 14 9 7 6 .3
S121 3 8 0 0 0 0 0 0 0 0 0 0 0 0 0 0 0 0 0 .0
S12other 3 9 0 0 0 0 0 0 0 0 0 0 0 0 0 0 0 0 14 10 3 1.3
S13 4 0 0 0 0 0 0 0 0 0 0 0 0 0 0 0 0 0 13 7 5 5
S1M 4 1 0 0 0 0 0 0 0 0 0 0 0 0 0 0 0 0 16 2 5 3
S2 4 2 0 0 0 0 0 0 0 0 0 0 0 0 0 0 0 0 2 0 4 5 0 8
Fina nc ia l instrume nts
Institutiona l se c tors:
c urre nt a c c ount
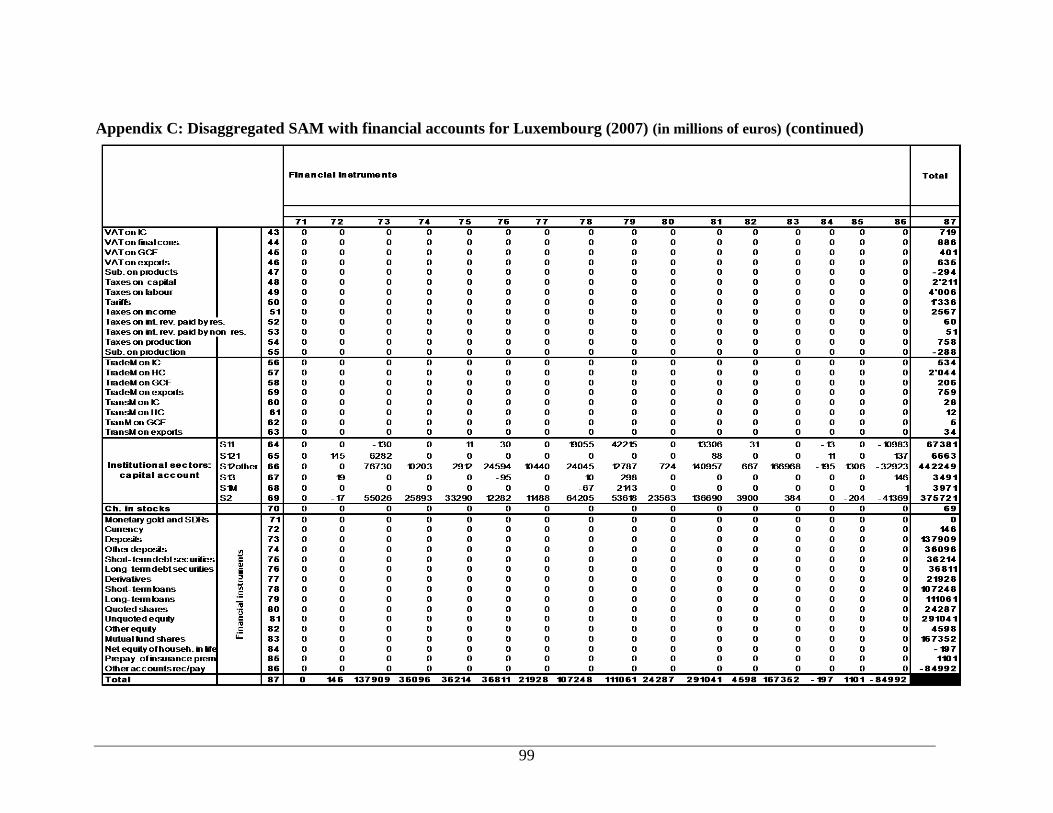
99
Appendix C: Disaggregated SAM with financial accounts for Luxembourg (2007) (in millions of euros) (continued)

Amela HUBIC
A FinAnciAl SociAl Accounting MAtrix (SAM) For luxeMbourg
cAhier d’étudeSworking pAper
n° 72
FEBRUARY 2012
2, boulevard RoyalL-2983 Luxembourg
Tél. : +352 4774-1Fax: +352 4774 4910
www.bcl.lu • [email protected]