Embed Size (px)
Citation preview

Main results of the climate pilot exercise for 2020 1
33333
Analyses et synthèses
A first assessment of financial risks
stemming from climate change:
The main results of the 2020 climate
pilot exercise
No. 122-2021

Main results of the climate pilot exercise for 2020 2
OVERVIEW
The climate pilot exercise conducted by the ACPR is unprecedented. It is the first time that a supervisory authority organised with the banking and insurance groups under its responsibility such a comprehensive and challenging exercise to assess the risks associated with climate change. Its unprecedented and ambitious nature lies in the time horizon over which the risks were assessed (30 years), the methodologies used (analysis of scenarios broken down by economic sector), its innovative hypotheses (notably the dynamic balance sheet), its coverage of physical and transition risks, and the fact that the participating institutions directly assessed their risks on the basis of common hypotheses. It illustrates the leading role played by the French financial authorities and the Paris financial centre and the progress made in the fight against climate change since the adoption of the Law on Energy Transition and Green Growth and the signing of the Paris Agreement in 2015. This exercise, conducted from July 2020 to April 2021, achieved its objectives of:
Mobilising French banks and insurers: Virtually all the banks and insurers that contributed to
the preparation of the exercise were present, as the exercise was carried out on a voluntary
basis, and others joined them even though they had not taken part in the preparatory phase: in
total, 9 banking groups and 15 insurance groups got involved over three quarters without
accounting for the preparatory phase, despite the context of the Covid-19 crisis, to carry
out this pilot exercise. This very high level of mobilisation enables us to present
representative results (85% of the total balance sheet of banks and 75% of the total
balance sheet of insurers) with high added value for these two sectors.
Raising awareness about climate risks: despite the methodological difficulties and the
absence of certain key data, the participating institutions welcomed the relevance of this pilot
exercise and the many advances it led to in terms of cross-disciplinary team mobilisation,
internal discussions on risk analysis and the limits of the models currently used, but also in
terms of strategic orientation and a better understanding of the issues and the impact of climate
change on business models. Financial institutions became aware of the fact that this type
of exercise was not only feasible but also extremely useful for making headway in taking
climate risk into consideration. The pilot exercise therefore served as a catalyst for
spurring debate and, for some, sped up the mobilisation of teams and resources.
Quantifying and assessing complex transition or physical risk scenarios, drawing in
particular on the work of the NGFS, which is the network of central banks and supervisors for
greening the financial sector. The ACPR, with the help of Banque de France staff, prepared this
exercise in accordance with the NGFS guidelines on the construction of climate change
scenarios and based on two of the scenarios published by the NGFS in June 2020. These
scenarios will also serve as a basis for other exercises currently being prepared, such as those
of the Bank of England in June 2021 and the European Central Bank in 2022. It is important
that a growing number of supervisors take up this work in order to launch their own
exercises and thus contribute to the development of a common base of knowledge and
climate risk assessment.
Providing a first measurement of risks and vulnerabilities to which French financial
institutions are exposed: the pilot exercise thus usefully complements the ACPR's previous
analyses, published in April 2019, which were based on questionnaires. In addition to this
snapshot, the pilot exercise adds a forward-looking view of risks over a long-term horizon,
conditional on the implementation of several alternative scenarios. The exercise thus offered
financial institutions the possibility of assessing their corrective actions (e.g. exit from certain
sectors), thanks to the dynamic balance sheet hypothesis, and of taking new risks into
consideration: potential hiatus between strategies for exiting certain greenhouse gas emitting
activities and the objective of maintaining market shares, the willingness to finance the economy
or to preserve a client relationship, which could result in a more lasting exposure to transition or
physical risks than expected.

Main results of the climate pilot exercise for 2020 3
The pilot exercise revealed an overall "moderate" exposure of French banks and insurers to
climate risks. However, this conclusion must be put into perspective in view of the uncertainties
concerning both the speed and the impact of climate change. It also crucially depends on the
assumptions, the scenarios analysed and the methodological difficulties raised by the exercise.
Based on the current balance sheet structures, it nevertheless appears that considerable efforts
must be made to help significantly reduce greenhouse gas emissions by 2050 and to contain the
rise in temperature by the end of the century.
The pilot exercise exhibits, conditional on the retained scenarios and assumptions, an
overall "moderate" exposure and vulnerabilities as highlighted in the ACPR's previous
work. According to the projections of the Intergovernmental Panel on Climate Change (IPCC)
used in this exercise, France, which accounts for about 50% of the exposures of French financial
institutions, and Europe, which accounts for about 75% of exposures, are relatively less affected
than other geographical areas. France also produces less than 2% of global greenhouse gas
emissions1. On the other hand, exposures to geographical areas such as the United States
(which accounts for around 9% of exposures) appears to be sensitive to transition risk.
The exposure of French institutions to the sectors most impacted by transition risk, as
identified in this exercise (e.g. mining, coking and refining, oil, agriculture, construction,
etc.), is relatively low. In addition, institutions tend to reduce their exposures to these sectors
by 2050. However, these sectors post the highest increase in the cost of risk and probabilities
of default. The cost of risk rises threefold in these sensitive sectors. By way of comparison, the
Covid-19 crisis led in 2020 to a twofold increase in the cost of risk for French banks in a context
of heavy business losses. The contribution of these sectors to the rise in the cost of risk (e.g.
provision for expected losses) appears to be greater than their share of banks' balance sheet.
Relative portfolio losses for banks and insurers are also concentrated in these sectors, albeit
with significant dispersions depending on individual exposures. When interpreting these
results, it should be borne in mind that none of the scenarios analysed implies an
economic recession by 2050, contrary to the usual practice of stress tests, but, for the
adverse scenarios, a lower trend in activity. In this context, the increase in the cost of risk
indicates that the energy transition, which is necessary in order to comply with the Paris
Agreement, requires significant efforts to adjust the system and economic structures.
Even though France is relatively spared in the Intergovernmental Panel on Climate
Change (IPCC) scenarios, the pilot exercise shows that the vulnerabilities associated
with physical risk are far from negligible. Thus, on the basis of the information provided
by insurers, the cost of claims could rise by a factor of 5 to 6 in certain French
departments between 2020 and 2050. The main hazards contributing to this increase in claims
are related to the risk of "drought" on the one hand and that of "flooding" on the other, as well
as to the rise in the risk of cyclonic storms in the overseas territories (French Caribbean). This
increase in claims highlights an insurability risk in certain parts of the country, a risk, which
insurers felt could be fully offset by an increase in contributions. As regards banks, the exercise
shows that the progress made in taking physical risk into consideration is very limited in view of
the findings of the ACPR in 2019 which already underlined that the assessment of this risk was
lagging significantly transition risk analysis. Only two institutions were able to quantify the impact
of an increase in the lack of insurance coverage on its credit risk parameters. This situation is
primarily linked to the difficulty encountered by institutions in obtaining a precise view of the
geographical location of their exposures (real estate, corporate) at the group consolidated level.
Banks and insurers must therefore step up their efforts to combat climate change today
by integrating climate risks into their financial risk assessment process, as these efforts
will contribute to the changes that will be observed in the medium and long-term. Taking
1 This favourable situation is due to the high share of nuclear power in electricity production in France. However, this situation is not without
risks in the context of climate change, as illustrated by the severe drought episode of summer 2020. The drop in water level has indeed made it difficult to cool certain nuclear power plants, leading France to produce or import electricity from coal-fired power stations.

Main results of the climate pilot exercise for 2020 4
better account of climate risks is indeed necessary to promote a better allocation of
resources and ensure the financing of the transition. While banks and insurers seem to be
generally aware of this issue, their degree of maturity remains heterogeneous and some
institutions have not necessarily yet integrated the proper degree of urgency to act.
This exercise also brought to light a number of methodological limitations on which progress needs to be made. It therefore marks the starting point for further work to improve the methodology of climate stress tests. The main points for improvement identified by the ACPR concern:
The hypotheses used to create the scenarios and identify sensitive sectors: one difficulty encountered by the institutions that took part in the exercise was the low variability between the different scenarios put forward by the ACPR. This point had already been identified by the ACPR, which had led it to add a sudden transition scenario to the scenarios published by the NGFS. Moreover, the models used by banks to quantify risks are not able to integrate very smooth evolutions of macroeconomic and financial variables over a long period. The same applies to insurers, which are used to dealing with extreme climate shocks but not with smooth and deterministic impacts over a long period. The very long time horizon also implies costly work in projecting transition matrices. Finally, the absence of feedback effects between the sectoral structure of the balance-sheet of the financial sector and financial risks (generated by climate change) does not necessarily encourage institutions to implement an active risk reduction policy, as most of the transition scenarios considered reach the objective of carbon neutrality in 2050. A second difficulty lies in the identification of sectors that are sensitive or exposed to climate risk: this identification first of all depends on the method used. It then implies assumptions on the evolution of the energy mix, the intensity and the energy efficiency of production, which were not properly integrated in this exercise. Finally, there is the question of sectoral granularity and the linking of exposures or counterparties to a given nomenclature, in particular when those counterparties are active in several economic sectors.
Taking into account the "physical risk" is a notable area for improvement on which
collective work is also needed because it also implies taking into account interdependencies and a sound knowledge of the value chains, which remains largely insufficient. One of the main reasons for this is the absence or incomplete nature of the information published by companies. This obstacle may be gradually reduced with future ESG disclosure requirements for companies (at least at the European level). As regards the insurance sector, further work should be conducted on the insurance protection gap.
The improvement of the models used by banks and insurers and the data sources is
needed to take better account of climate risk (in particular at the sectoral or company and counterparty level). Several interesting methodological avenues implemented by financial institutions in the context of this exercise should be explored in greater depth.
Next steps: the results obtained will be followed up by the setting-up of new working groups with the Paris financial centre and with external counterparties. In addition, ACPR and Banque de France experts are actively contributing to the preparation of the exercise to be conducted by the ECB in 2022 and to the European and international work conducted in several fora such as the European Insurance and Occupational Pensions Authority, the Basel Committee on Banking Supervision, the International Association of Insurance Supervisors and the Financial Stability Board. This financial risks assessment exercise induced by climate change will be repeated regularly. The next ACPR exercise may take place 2023/2024.

Main results of the climate pilot exercise for 2020 5
A First assessment of financial risks
stemming from climate change:
The main results of
the 2020 climate pilot exercise
Keywords: climate change; carbon price; long-term projections; banking regulation; scenarios; stress tests. JEL codes: G21, G28, H23, Q48, Q54
By:
Laurent CLERC, Anne-Lise BONTEMPS-CHANEL, Sébastien DIOT, George OVERTON, Solène
SOARES DE ALBERGARIA, Lucas VERNET and Maxime LOUARDI
DIRECTORATE FOR RESEARCH AND RISK ANALYSIS
AUTORITÉ DE CONTRÔLE PRUDENTIEL ET DE RÉSOLUTION
AUTORITÉ DE CONTRÔLE PRUDENTIEL ET DE RÉSOLUTION
4, PLACE DE BUDAPEST
75436 PARIS CEDEX 09

Main results of the climate pilot exercise for 2020 6
TABLE OF CONTENTS
Key figures ....................................................................................................................................... 7
Introduction: reminder on the objectives and main features of the pilot exercise ........................... 8
Conditions for the implementation and conduct of the ACPR pilot exercise ................................... 10
1. Background .............................................................................................................................. 10
2. Implementation of the pilot exercise ........................................................................................ 11
3. The pilot exercise has achieved its main objectives ................................................................ 12
Very strong industry-wide mobilisation .......................................................................... 12
Stakeholder awareness of climate change risks: .......................................................... 12
Quantification and assessment of complex transition and physical risk scenarios based on the work of the NGFS .................................................................................... 12
A first assessment of risks and vulnerabilities to climate change .................................. 13
Transition risk: a rather moderate impact by 2050 .......................................................................... 14
1. Reminder on transition scenarios ............................................................................................ 14
2. The impact of transition risk on French banks ......................................................................... 15
Dynamic balance sheet ................................................................................................. 16
Credit risk ....................................................................................................................... 17
2.2.4 Impact of a dynamic balance sheet assumption on the evolution of the cost of risk ..... 22
Market risk ..................................................................................................................... 23
3. Transition risk analysis for French insurers. ............................................................................ 26
4. Transition risk has a relatively moderate impact ...................................................................... 31
Physical risks: significant increase in claims by 2050 ..................................................................... 32
1. Background on the assumptions made for the physical risk scenario by 2050 ....................... 32
Physical risk assessed using the RCP 8.5 scenario of the IPCC .................................. 32
Natural disaster scenarios: impact on the property damage business .......................... 32
Health scenarios: the spread of vector-borne diseases or pandemics and the impact of urban pollution ................................................................................................ 33
2. Perils natural disasters (CATNAT) ........................................................................................... 34
3. Health hazards ......................................................................................................................... 37
Vector-borne diseases / pandemics .............................................................................. 37
Air pollution .................................................................................................................... 41
4. The effects of reinsurance ....................................................................................................... 45
5. Consideration of the indirect (second-round) effects of physical risk on the banking sector........................................................................................................................................ 46
Methodological lessons from an exercise with unprecedented characteristics ............................... 49
1. Assumptions used in scenario building and identification of sensitive sectors ........................ 49
2. Consideration of the physical risk ............................................................................................ 52
3. Improving models and methodologies used by participants .................................................... 53
Annexes ........................................................................................................................................... 56

Main results of the climate pilot exercise for 2020 7
Strong mobilisation of the financial centre 15 insurer groups - 22 insurers - and 9 banking groups participated in this exercise, representing
respectively 75% of insurers’ technical provisions and assets and 85% of French banks’ total
assets.
Exhaustive & completely unprecedented exercise With a 30-year horizon, including three transition scenarios, two of them published by the NGFS,
the network of central banks and supervisors for the greening of the economy, and one physical
risk scenario.
Key figures Chiffres Clés
Chiffres Clés
Moderate exposition of the financial sector to the transition risk In view of the analysis metrics used, which will be gradually refined, and within the limits of the
assumptions and models used, the exercise confirms the moderate exposure of the French
financial sector to transition risk. However, seven sensitive sectors concentrate a significant
share of market losses and see their cost of risk tripled over the period.
Significant increase in loss ratios and insurance premiums Climate change would entail a two-fold to five-fold increase in the loss ratio for claims related
to natural disasters in the most affected departments throughout France, and premiums would
increase by 130 to 200% over 30 years to cover these losses.

Main results of the climate pilot exercise for 2020 8
Introduction: reminder on the objectives and main features of the pilot exercise
The climate pilot exercise conducted between
July 2020 and April 2021 by the Autorité de
contrôle prudentiel et de résolution (ACPR – the
French Prudential Supervision and Resolution
Authority) is an important step in supervising
climate change-related risks. This is the first
time that a supervisory authority has performed
a bottom-up climate-related stress test exercise
as comprehensive and demanding as this one,
based on a risk assessment directly conducted
by the financial institutions under its
responsibility on the basis of common
assumptions.
The preparation of this exercise was carried out
by working groups led by the ACPR, bringing
together leading players in the banking industry
and insurance groups. The preparatory work
immediately began after three reports were
published in April 20192.
In addition, the ACPR drew on various national
and international studies. The designed
scenarios thus build on the recommendations
published by the network of central banks and
supervisors for the greening of the financial
system (NGFS3). They are based on an original
2 See in particular:
ACPR (2019a): "Climate Change: what risks to banks and insurers?", Analyses et Synthèses, April. https://acpr.banque-france.fr/sites/default/files/medias/documents/as_cover_note_en.pdf
ACPR (2019b): "French banking groups facing climate risk", Analyses et Synthèses n°101, April. https://acpr.banque-
france.fr/sites/default/files/medias/documents/as_101_climate_risk_banks_en.pdfACPR (2019c): "French insurers facing climate change risk", Analyses et Synthèses n°102, April. https://acpr.banque-france.fr/sites/default/files/medias/documents/as_102_climate_change_insurers_en.pdf
3 See notably https://www.banque-france.fr/en/financial-stability/international-role/network-greening-financial-system
4 Allen et al. (2020): Climate-related scenarios for financial stability assessment: An application to France, Banque de France
Working Paper, No 774, July. https://publications.banque-france.fr/en/climate-related-scenarios-financial-stability-assessment-application-france
analytical framework developed specifically for
this exercise with the involvement of Banque de
France4 teams. This new analytical framework
has benefited from numerous contributions
resulting from exchanges with the academic
sphere and climatologists. Lastly, this exercise
benefitted from the guidelines of the
Supervisory College of the ACPR as well as
from the opinions of the members of its
Committee on Climate Change and Sustainable
Finance, chaired by Patrick de CAMBOURG.
Lastly, French banks and insurers have been
able to share their expertise in climate change
risk analysis over the past few years. In
particular, the Caisse centrale de reassurance
(the French central reinsurance fund), which is
responsible for the natural disaster
compensation scheme in France, and AON, a
reinsurance broker, provided the assumptions
for physical risk, based on projections by
Météo-France, and for health risk, respectively,
by considering the risks associated with the rise
of vector-borne pandemics and the increase in
acute respiratory pathologies linked to an
increase in both the frequency and duration of
heat waves.

Main results of the climate pilot exercise for 2020 9
The main objectives of the ACPR’s climate pilot
exercise were to:
・ assess the risks and vulnerabilities to which
French banks and insurers could be exposed
and their strategic reaction function in the face
of these risks (under the dynamic balance sheet
assumption), under different scenarios
including orderly and disorderly transitions and
a physical risk scenario, illustrating a laissez-
faire policy and based on the IPCC’s worst-case
scenario. This scenario was assessed with the
assistance of CCR regarding the exposures of
French insurance and re-insurance
undertakings.
・ mobilise and raise financial institutions’
awareness of climate change risks by
contributing to improving their ability to
anticipate and manage these risks, the
materialisation of which may exceed their
normal decision-making and exposure horizon.
Beyond this, the exercise aims to identify
current gaps in terms of data and resources
(staff numbers, training needs, analytical
capabilities, etc.).
Box 1 summarises the main features of this
exercise5.
Box 1- Main features of the ACPR’s climate pilot exercise
A 30-year horizon covering the 2020-2050 period, which is sufficiently long to integrate
the effects of climate change, in contrast to the usual duration considered for stress-tests (3 to 5 years);
A bottom-up exercise covering banks and insurers aiming to analyse the interactions between the two sectors, in particular the impact of insurance coverage on banks’ risk parameters
An international dimension, designed to take account of the global nature of climate change and its differentiated impact across different regions of the world as well as of the international scope of the major French banking and insurance groups;
A sector-specific, granular approach encompassing 55 sectors of activity, for each scenario and each geographical area considered, to capture the very contrasting effects of transition policies depending on the business sectors considered;
The combination of two assumptions: first a "static balance sheet" assumption up to 2025, the traditional framework for supervisory stress-testing, then a "dynamic balance sheet" assumption, from 2025 to 2050, in order to analyse the strategies of financial institutions and the actions implemented to mitigate the effects of climate change; this assumption also aims to analyse the coherence of the strategies implemented by these institutions and their climate commitments;
The exercise also includes the consideration of "second-round effects" to measure banks’ indirect exposure to physical risk, under the hypothesis of an increase in the insurance protection gap for certain assets due to the increase in the cost and frequency of extreme weather events;
Lastly, participation in the pilot exercise is voluntary and it is carried out by institutions without any regulatory purpose.
55 The assumptions used by the ACPR and the full features of the exercise are described in the "Main scenarios and
assumptions of the pilot exercise" published on the ACPR website on 16/07/2020: https://acpr.banque-france.fr/sites/default/files/medias/documents/20200717_main_assumptions_and_scenarios_of_the_acpr_climate_pilot_exercise.pdf

Main results of the climate pilot exercise for 2020 10
.
Conditions for the implementation and conduct of the ACPR pilot exercise
1. Background
The ACPR’s pilot exercise follows on previous
works initiated by the Authority since 2015,
notably in the context of the implementation of
the French Law on Energy Transition and
Green Growth (LTCEV) and of its participation,
as a founding member alongside the Banque de
France, to the network of central banks and
supervisors for the greening of the financial
sector, the NGFS.
These previous works focused6 on:
i. An emphasis on the governance of climate
change risks, including the publication in
May 2020 of a good practices handbook for
the banking sector and the launch in 2021 of
similar work with insurers;
ii. The regular monitoring of risks, based in
particular on the analysis of non-financial
disclosures of information regarding
financial institutions’ and insurers’
environmental, social and governance
(ESG) and their climate risk strategies under
Article 173 of the LTCEV, or based on ad
6 All of these analyses can be found on the ACPR website at https://acpr.banque-
france.fr/sites/default/files/medias/documents/20200525_synthese_gouvernance_anglais.pdf
7 See, for example :
- ECB's November 2020 guide to managing climate change and environmental risks: https://www.bankingsupervision.europa.eu/ecb/pub/pdf/ssm.202011finalguideonclimaterelated-andenvironmentalrisks~58213f6564.en.pdf - Opinion on the supervision of the use of climate change risk scenarios in ORSA : https://www.eiopa.europa.eu/sites/default/files/publications/opinions/opinion-on-climate-change-risk-scenarios-in-orsa.pdf
8 See for example:
hoc surveys aimed at measuring the
exposure of French banks and insurers to
climate risk. This work was complemented
by the publication in December 2020 of a
joint report with the Autorité des Marchés
Financiers (French Financial Markets
Authority or AMF) on the climate
commitments of financial institutions and the
establishment of Climate and Sustainable
Finance Commissions within these two
authorities in 2019, following the financial
centre agreement of 2 July 2019.
iii. The analysis of climate change scenarios
with the aim of measuring its financial impact
and identifying potential vulnerabilities in the
French financial sector, the climate pilot
exercise materialising a first step towards
such measurement.
Furthermore, the pilot exercise is also part of a
dynamic European environment. These results
will thus contribute to the ongoing reflections on
the integration of these risks into the risk
management of financial intermediaries7 and in
prudential requirements (particularly under
Pillar II8) which is among the priorities of the

Main results of the climate pilot exercise for 2020 11
European Union's sustainable finance strategy.
The exercise and the difficulties encountered
underline the need for better availability of
climate-related data at EU level (physical
damage data, transition risks). The revision of
the Directive on the non-financial reporting and
the associated standardisation process will help
bridge this data gap
2. Implementation of the pilot exercise
The assumptions of the pilot exercise were
published in July 2020, following a public
consultation phase, and a year of preparative
work with the industry in working groups with
major banking and insurance players. In order
to limit the cost of the exercise, it was also
agreed upon to retain a certain number of
standard stress-testing procedures, such as
those used by the European Banking Agency
and the European Insurance and Occupational
Pensions Authority.
A Q&A procedure was therefore established
with the institutions participating in the exercise.
The frequency of this procedure was set on a
weekly basis over the entire duration of the
exercise, and ended in mid-April 2021 with a
series of bilateral interviews and two feedback
sessions with the participants.
In addition to methodological clarifications on
assumptions or scenarios, the financial
institutions' questions focused mainly on
requests for additional information or data
aimed, in particular, at refining their risk
assessment, particularly of their sectoral or
international exposures. These discussions
also highlighted methodological issues that had
not been identified during the preparatory
phase. One of the issues with the most
structuring effects was the application of IFRS
standards. In standard stress-testing exercises,
such as those of the European Banking Agency,
- The consultation launched in November 2020 by the European Banking Authority on ESG risk management and supervision
of credit institutions and investment firms: https://www.eba.europa.eu/calendar/discussion-paper-management-and-supervision-esg-risks-credit-institutions-and-investment - EIOPA’s Technical Advice on the integration of sustainability risks and factors in the delegated acts under Solvency II and
IDD :https://www.eiopa.europa.eu/sites/default/files/publications/advice/technical_advice_for_the_integration_of_sustainability_risks_and_factors.pdf
where the projection horizon is limited to 3
years, it is assumed that claims at default that
reach their maturity are reissued as defaulted
exposures. However, given the 30-year span of
the pilot exercise scenarios, this assumption
becomes problematic because it creates an
artificial build-up of defaulted exposures (see in
particular the section of this document
dedicated to methodological lessons).
The implementation of the dynamic balance
sheet assumption required a review of the
consistency of the institutions’ individual
answers to ensure that their aggregation is
compatible with the projected economic
structures to be funded for each scenario. This
was done in October 2020 for banks, on the
basis of a first submission of credit projections,
and in January 2021 for insurers, at the time of
final submission of financial reports. This quality
assurance process was carried out in two
stages.
As a first step, the ACPR requested of some
banking institutions that they make minor
corrections to the evolution of portfolio
segments where it did not appear to be
consistent with that of the sector-specific
structure of the economy. As a second step, the
ACPR identified, for each
sector/scenario/geographical area combination,
individual developments that appeared to be too
far out of line with developments in the rest of
the financial centre.
These corrections were very limited because,
overall, the changes in the composition of
portfolios remained broadly consistent with the
evolution in the structure of this sector of the
economy in all relevant scenarios. In addition,
these corrections have made it possible to
maintain diversity among the strategies used by
financial institutions to mitigate the impact of
risks related to climate change.

Main results of the climate pilot exercise for 2020 12
The overall timetable set for the exercise was
fully respected, despite the exercise being
launched in the midst of the COVID crisis. One
reason for this may be that the scenarios
published in July by the ACPR included the
Eurosystem’s first estimates of the impact of
this crisis, with a detailed sectoral breakdown of
activity that was particularly useful. The other
stems from the strong involvement of the
banking and insurance teams that participated
in the exercise.
The submissions were made in January 2021.
Following a new quality assurance procedure, a
sensitivity exercise to measure the indirect
impact of physical risk on the banking sector
was launched, but with limited success, notably
owing to tighter submission deadlines.
3. The pilot exercise has achieved its main objectives
Despite its complexity and unprecedented
nature, the climate pilot exercise has achieved
its main objectives.
Very strong industry-wide mobilisation
Almost all the banks and insurers that
contributed to the preparation of the exercise
took part in it, the exercise being conducted on
a voluntary basis. Others joined the exercise,
although they had not taken part in the
preparatory phase: in total, 9 banking groups
(the 6 main French groups as well as 3 public
sector financial institutions) and 15 insurance
groups (or 22 undertakings)9 rallied over several
months, despite the backdrop of the COVID
crisis, to carry out this exercise. This very strong
mobilisation gives us representative results
(85% of the total balance sheet for the banking
side, and 75% of total balance sheet and
technical provisions for insurers) with high
added value in both sectors.
9 The list of participants is presented in Annex A
10 NGFS, Guide to climate scenario analysis for central banks and supervisors, June 2020 : https://www.ngfs.net/sites/default/files/medias/documents/ngfs_guide_scenario_analysis_final.pdf
Stakeholder awareness of climate change risks:
Despite the many difficulties encountered and
the absence of certain key data, the
participating institutions commended the
benefits of this pilot exercise and the progress it
has fostered in terms of cross-functional
mobilisation of teams, internal reflections on risk
analysis and the limits of the models currently
used, but also in terms of strategic guidelines
and towards a better understanding of the
issues and the impact of climate change on their
business model. In particular, despite the many
limitations that such a pilot exercise may pose,
financial institutions have become aware that
this type of exercise is not only feasible but also
extremely useful in advancing their
consideration of climate risk. The pilot exercise
was therefore a catalyst for reflection and, for
some, accelerated the mobilisation of teams
and resources.
Quantification and assessment of complex transition and physical risk scenarios based on the work of the NGFS
The ACPR, assisted by Banque de France
teams, designed this exercise in accordance
with NGFS guidelines on the building of climate
change scenarios and by retaining two of the
scenarios published by the latter in June 202010.
These scenarios will also serve as a basis for
other exercises under preparation, such as
those of the Bank of England starting in June
2021 or those of the European Central Bank in
2022. It is therefore important that more
supervisors take up this work in order to be able
to launch their own exercises and thereby
contribute to the development of a common
knowledge base and assessment of climate
risks.

Main results of the climate pilot exercise for 2020 13
A first assessment of risks and vulnerabilities to climate change
The pilot exercise usefully complements
previous ACPR analyses, published in April
2019, based on ad hoc surveys. In addition to
this snapshot, the pilot exercise adds a forward-
looking view of risks over a long-term horizon
that is conditional on the implementation of
several alternative scenarios. The exercise thus
provided financial institutions with the
opportunity to assess their corrective actions
(e.g. exit from certain sectors), using the
dynamic balance sheet assumption, thus
becoming aware of new risks: potential
discrepancies between exit strategies from
certain greenhouse gas-emitting activities and
market share retention objectives, between a
desire to finance the economy or to maintain a
customer relationship, which may result in a
more lasting exposure to transition or physical
risks than expected.
.

Main results of the 2020 climate pilot exercise 14
Transition risk: a rather moderate impact by 2050
1. Reminder on transition scenarios
It is important to emphasize that the
development of scenarios to measure the
impact of climate change on financial risks
comes with significant uncertainties. Indeed,
any scenario on CO2 emission trajectories is
based on a set of assumptions modelling the
interactions between socio-economic systems
and the climate. These interactions could
indeed be affected by the existence of tipping
points, irreversibility or threshold effects. The
exact nature of these interactions is complex
and potentially non-linear11.
The results displayed in this publication are
therefore contingent to the assumptions and
models used, which present many
simplifications.
In order to perform this exercise, the ACPR and
the Banque de France relied on the guidelines12
published by the NGFS13 and retained three
transition scenarios, two of which were
published by the latter in June 2020.
The transition scenarios include a baseline
scenario, corresponding to an orderly transition,
11 See for instance NGFS publications on these
issues (https://www.ngfs.net/en) as well as the
recent reports from the Basel Comittee. (https://www.bis.org/press/p210414.htm).
12 For a complete overview of the assumptions and models used to develop these scenarios, see :
- T. Allen et al: "Climate transition scenarios for
assessing financial stability: an application to France", Working Paper No. 774, Banque de
France, July 2020. https://publications.banque-
and two disorderly transition scenarios (see
Chart 1 below). Each of these scenarios
combines different assumptions in terms of (i)
trajectory of the carbon tax; (ii) total productivity
levels of factors.
The baseline scenario chosen by the ACPR and
drawn from NGFS work, corresponds to an
orderly transition consistent with the narrative of
the Stratégie Nationale Bas Carbone (the
French National Low Carbon Strategy, or
SNBC), which is France's roadmap for fulfilling
its commitments made under the Paris
Agreement. It is the most favourable scenario,
although it includes a significant increase in the
price of carbon, inducing a non-trivial
adjustment in the economic system.
The first adverse disorderly transition scenario
is that of a late transition. It assumes that the
target for reducing greenhouse gas emissions
is not met by 2030, which calls for the
implementation of more proactive measures.
This scenario exactly replicates the aggregate
level emission, carbon price and GDP
trajectories of the representative scenario for a
"disorderly" transition published by the NGFS in
June 2020. It makes the assumption that carbon
sequestration technologies are less efficient
france.fr/sites/default/files/medias/documents/wp774.pdf
- ACPR, “ Scenarios and main assumptions of the
ACPR pilot climate exercise”, https://acpr.banque-
france.fr/sites/default/files/medias/documents/20
200717_main_assumptions_and_scenarios_of_the_acpr_climate_pilot_exercise.pdf
13 See for instance :
https://www.ngfs.net/sites/default/files/medias/documents

Main results of the climate pilot exercise for 2020 15
than expected to offset emissions. It is based on
a very high increase in the price of carbon in
2030 in order to maintain the carbon neutrality
target in 2050. Indeed, it rises from $14 per ton
of CO2 globally in 2030 to $704 in 2050. This
increase is reflected in a series of
heterogeneous shocks to the industries and led
to a very strong increase in real energy prices
(+125%) over the period for France.
The second adverse scenario for a disorderly
transition - later called the "sudden transition"
scenario - combines a sharp increase in the
price of carbon, which reaches $917 per ton of
CO2 in 2050, and a less favourable evolution of
productivity than in the baseline scenario from
2025 onwards. Moreover, renewable-energy
technologies are less efficient than expected,
implying even higher energy prices and
additional investment needs.
In interpreting the results presented in the
remainder of this chapter, it should be borne
in mind that none of the scenarios analysed
trigger an economic downturn by 2050,
contrary to the usual stress-testing practice,
but they do integrate, for adverse scenarios, a
slower economic growth. In this context,
impacts are interpreted in relative terms, as
deviations from the baseline scenario.
Chart 1- Schematic representation of the transition and physical risk scenarios included in the ACPR pilot exercise
Source: ACPR and Banque de France data - technical specifications https://acpr.banque-france.fr/sites/default/files/medias/documents/20200717_main_assumptions_and_scenarios_of_the_acpr_climate_pilot_exercise.pdf
2. The impact of transition risk on French banks
The impact of transition risk on French banks
can be broken down into three components,
which are discussed later in this section. The
first section tackles the implementation of the
dynamic balance sheet assumption, which
enables institutions to take management
decisions in response to the different scenarios
analysed and to reallocate their corporate
portfolio across different economic sectors from
2025 onwards. This assumption makes it
possible in principle to analyse the long-term
strategies implemented by institutions. The
second section relates to credit risk projections
in the various transition scenarios. The last one
focuses on analysing the impact of financial
shocks caused by the implementation of energy
transition policies. The results obtained for the
six main French banking groups are displayed
hereafter (except in the section on dynamic

Main results of the climate pilot exercise for 2020 16
balance-sheet which also aggregates public
financial institutions). More specifically, the data
submitted by public or development banks are
presented in a box (see Box 2).
Dynamic balance sheet
The institutions’ initial submissions related to
the dynamic balance sheet assumption.
Participants were expected to project their
credit exposures in the various scenarios
provided by the ACPR. These projections,
although subject to a consistency check
presented in the section dedicated to the
implementation of the exercise, offered
institutions the possibility to reallocate their
corporate credit portfolio across different
economic sectors.
These balance sheet projections show a
distortion of the sectoral structure of corporate
credit exposures, to the detriment of the sectors
most affected by the transition scenarios. For
example, Chart 2 below shows that the
electricity and gas sector, which stands to
benefit from the transition in the scenarios, sees
its share in total exposures increase sharply,
while the mining and quarrying sector, which is
negatively impacted by the transition, sees its
share in corporate exposures of banks
declining.
Moreover, the implementation of the dynamic
balance sheet assumption highlights the
diversity of the strategies that banks have
undertaken. Chart 3 shows how the exposure of
the six largest banking groups to the
manufacture of coke and refined petroleum
products sector will change between 2025 and
2050 according to the sudden transition
scenario. On this chart, one could note that two
institutions (black and green curves) have
chosen to adjust the structure of their exposures
by following the sectoral distortion induced by
the scenario.
By contrast, two other banks (represented by
the light blue and light green curves respectively
– and which have relatively low shares of these
sectors at the starting point) chose not to reduce
significantly their exposure. Lastly, two
institutions (yellow and blue curves) have
implemented an exit policy in this sector, in line
with their public commitments.
Chart 2 - Sectoral structure of credit exposures
Note: across geographical areas for all banks participating in the exercise under the sudden transition scenario
Source: ACPR
In general, two main types of strategies appear: Those of some institutions that choose
to finance the economy as a whole, and
0,0%
1,0%
2,0%
3,0%
4,0%
5,0%
6,0%
7,0%
Cro
p a
nd
an
ima
l pro
du
ction
Min
ing a
nd
qu
arr
yin
g
Foo
d p
rod
ucts
Coke
an
d r
efin
ed
pe
trole
um
pro
du
cts
Che
mic
al p
rodu
cts
Rub
ber
and
pla
stic p
rod
ucts
Oth
er
non
-meta
llic m
ine
ral p
rod
ucts
Ba
sic
me
tals
Fab
ricate
d m
eta
l p
rod
ucts
Moto
r veh
icle
s a
nd
tra
ilers
Ele
ctr
icity a
nd
ga
s
Se
wera
ge
an
d w
aste
colle
ction
Con
str
uctio
n
Moto
r veh
icle
s a
nd
mo
torc
ycle
s t
rad
e
Wh
ole
sa
le t
rade
Reta
il tr
ad
e
La
nd
tra
nsp
ort
Air
tra
nsp
ort
Acco
mm
od
atio
n a
nd
fo
od
serv
ice
Su
pp
ort
se
rvic
e a
ctivitie
s2025
2050

Main results of the climate pilot exercise for 2020 17
which, for this purpose, align the
structure of their credit portfolios with
the sectoral structure of the economy.
However, it cannot be entirely ruled out
that this choice reflects a passive
adaptation strategy or a desire to
reduce the cost of the exercise by
minimising the risk of having to submit
new projections after the consistency
and quality assurance check carried out
by the ACPR. It is also possible that this
choice stems from the difficulty for
some institutions to decide on strategic
management actions with such a
distant time horizon in mind.
Other banks also conducted a sector-
by-sector analysis in order to have a
more detailed basis for the required
reallocations. This choice may be
conditioned by: (i) the existence of
public commitments or of an already
adopted sectoral policy; (ii) a
willingness to support key sectors in the
transition; (iii) pressure from civil
society to reduce certain sectoral
exposures; iv) finally, analyses on
sectoral dynamics up to 2050 that
diverge from that of the scenarios
provided by the ACPR.
Chart 3 - Evolution of credit exposures in the sector of manufacture of coke and refined petroleum products
Note: across geographical areas for all banks participating in the exercise under the sudden transition scenario. Changes in exposure are normalised to 100 in 2025.
Source: ACPR
Credit risk
2.2.1 Aggregated results
To assess the impact of transition scenarios on
credit risk, we use an approximation of the
annual cost of credit risk14 (expressed in basis
points) for each interval of time studied. The
dual benefit of this metric is that it corresponds
14 The annual cost of credit risk is calculated by dividing the total annualised provisioning flows for each time interval by the
average exposure over the same time interval. The figures presented correspond to the aggregate of the 6 main French banks participating in the exercise.
to a central risk management tool used by
institutions and it limit comparison biases that
would result from different methodological
approaches.
The dynamics of the cost of credit risk at the
level of the six main banking groups can
therefore be observed for all relevant transition
scenarios. As expected, institutions project a
0
20
40
60
80
100
120
2020 2025 2030 2035 2040 2045 2050 2055

Main results of the climate pilot exercise for 2020 18
higher cost of credit risk in adverse scenarios
than in the baseline scenario (see Chart 4). In
the case of an orderly transition, the cost of risk
is estimated to reach 15.8 bps in 2050 for the
top 6 banks participating in the exercise,
meaning a 22.4% increase compared with
2025, when the price of carbon rose
significantly. This is not surprising given that the
orderly transition scenario already entails a very
significant economic adjustment and a near-
tripling of the price of carbon between 2025 and
2050. This result in a slowdown in GDP growth,
with significant impacts on sectors most
sensitive to an increase in the price of carbon,
such as mining and quarrying or manufacture of
coke and refined petroleum products. In the
sudden transition scenario, the most adverse
one, in 2050 the cost of risk would reach
17.2 bps (8.9% higher than in the orderly
transition scenario)15 and 16.4 bps (+3.9%) in
the late transition scenario. In the latter two
scenarios, the cost of risk rises by 32.4% and
27.7% respectively, compared to 2025.
Chart 4 – Evolution of the cost of risk per year for the main 6 banks
Note: data in basis points. The annual cost of credit risk is calculated by dividing the total annualised flows of provisions for each time interval by the average of the exposures over that time interval. The figures presented correspond to the aggregate of the six main French banks participating in the exercise covering all geographical areas. Under the sudden transition scenario, the cost of annual credit risk was 17.2 bps in 2050, compared with 15.8 bps in the orderly transition scenario (+8.9%).
Source: ACPR
However, these initial results would need to be
confirmed as part of a more prescriptive
exercise from a methodological perspective,
using more comprehensive scenarios. Yet, our
analyses tend to confirm that a disorderly
transition significantly affects the credit risk of
banks. The magnitude of this impact is smaller
than that observed in the biannual stress tests
conducted by the European Banking Authority
15 The last interval was chosen, as it is during that time that the cost of credit risk is the highest in all scenarios. Another possibility
would have been to consider the average annual cost over the entire time period of the scenario. This, however, would not have changed the magnitude of the impacts.
(EBA). The reason stems from the fact that
none of the transition scenarios considered
includes a decline in GDP, contrary to the usual
regulatory stress-testing framework.
2.2.2 Cost of risk dynamics by portfolio and
geographical area
10
11
12
13
14
15
16
17
18
2019 2025 2035 2040 2050
Orderly
Delayed
Sudden

Main results of the climate pilot exercise for 2020 19
Institutions were requested to perform credit
risk projections on three portfolios: (i) the
corporate portfolio including SMEs; (ii) the retail
portfolio; iii) and the sovereign portfolio, using
the benchmark probabilities of default provided
by the ACPR. In the orderly transition scenario,
aggregate projections of institutions’ risk costs
rose by 22.4% between 2025 and 2050. The
corporate portfolio accounts for almost 60% of
this growth, the retail portfolio (households)
accounts for about one-third, and the rest
(6.5%) accounts for the contribution of the
sovereign portfolio. By looking at the difference
in the cost of risk between the sudden transition
and orderly transition scenarios by 2050, one
can draw the following conclusions. While
banks may have been able to account for
different sectoral dynamics depending on the
level of adversity of scenarios, the risk
assessment of the retail portfolio mainly relies
on the usual macroeconomic variables
(unemployment and GDP in particular).
However, these variables do not vary much
within different scenarios16. The difference in
the cost of risk on the retail portfolio is limited to
0.5% between the two scenarios. As a result,
the cost-of-risk deviation from the orderly
transition scenario is concentrated on the
corporate portfolio (+11.6% between the orderly
transition scenario and the sudden transition
scenario and therefore 75% of the inter-
scenario deviation). The sovereign portfolio is
very affected by the benchmarks set by ACPR17
(+87.5%) but explains 22.6% of the total
deviation.
The breakdown of the evolution of the cost of
risk according to the geographic location of
exposures shows that the increase in the cost
of risk in the orderly transition scenario between
2025 and 2050 comes, for 66.4%, from
exposures located in the EU area (including
France), for 11.6% from exposures in the United
16 For example, the unemployment rate differential between the accelerated and orderly transition scenarios never exceeds 0.4
percentage points.
17 ACPR sovereign default probability benchmarks were generated on the basis of changes in sovereign interest rates and GDP. The sharp changes in interest rates in the scenarios thus led to significant variations in the probabilities of default estimated by the ACPR.
18 The cost of zone-specific risk for this period increases by 21.8%, 42.9% and 34.4% respectively for the EU, the United States, and the rest of the world.
19 See Annex B for the definition of sensitive sectors and taxonomy used.
States and for 21.9% from exposures located
elsewhere18. The difference in the cost of risk
between the sudden transition scenario and the
orderly transition in 2050 is slightly higher in the
United States (+18.5%) than in Europe
(respectively +8.7% and +8.4% in France and
the rest of the EU). The inter-scenario
difference is slightly lower for the rest of the
world (+6.1%). In the case of the United States,
this impact reflects a compositional effect
related to a larger share of sensitive19 sectors in
the total corporate portfolio (10.4% versus 7.4%
for the EU area including France) and to more
marked impacts on some sectors in adverse
scenarios (especially in the extractive industries
sector). The scenarios for the rest of the world
are less severe, also at the sectoral level, which
leads to a lesser impact on the cost of risk. In
the end, it is essentially the European portfolio
(including France), which, due to its weight
(74.2% of exposures in 2019), explains most of
the difference between scenarios (74.5%).
2.2.3 Focus on the corporate portfolio and
sectoral dynamics
It is possible to assess the contribution of
sensitive sectors, such as those identified by
the ACPR in the pilot exercise assumptions and
scenarios (see Annex B), to the increase in the
cost of risk (see Chart 5). These sectors
accounted for 9.7% of institutions’ total
corporate portfolio. Under the orderly transition
scenario, the cost of corporate risk rose by
24.6% (+5.2 bps) between 2025 and 2050.
Approximately one third of this increase is
attributable to sensitive sectors, which are
therefore already significantly stressed in the
orderly transition scenario. In 2050, the cost of
corporate risk is 12.2% higher under the sudden
transition scenario than in the orderly transition
scenario (+3.3 bps). Sensitive sectors only
account for 4.2% of this inter-scenario

Main results of the climate pilot exercise for 2020 20
difference. Looking at the total impact (orderly
plus sudden), the sensitive sectors explain
20.6% of the increase in the cost of corporate
risk. It can be noted that the banking groups
were therefore able to quantify the various
scenarios taking into account the differences in
dynamics between sectors.
Chart 5 - Breakdown of the evolution of the corporate cost of risk by sectors
Note: The triangle represents the total rate of variation (in %) in the cost of corporate risk between the two studied bounds. Each part of the
histogram then represents the variation (in %) induced by the different sets of sectors The reading of this chart is as follows: the left-hand side represents the dynamics of the cost of risk between 2025 and 2050 in the orderly transition scenario; the right-hand side represents the additional effect of a disorderly transition (i.e. the cost of corporate risk observed at the end of 2050 in the sudden transition scenario. This cost is 12.2% higher than that observed in the orderly transition scenario at the same date) .
Source: ACPR
Table 1 below shows the cost of risk by
grouping sectors according to their sensitivity to
the transition risk. It confirms that the increase
in the cost of risk is significant in sensitive
sectors under any scenario. For example, the
cost of risk is multiplied by 2.5 in the orderly
transition scenario and by 3 in the sudden
transition scenario compared with the level
observed in 2025. By way of comparison, the
cost of risk was multiplied by 2.1 in 2020 in the
context of the COVID crisis associated with a
sharp decline in economic activity.
In all scenarios, the sectors affected or those
that relatively benefit from the transition remain
the same ones. This is an observation that can
be made when analysing the risk metrics
associated with each sector. This exercise
allows an analysis of these variables according
to different reading grids: (i) by sector first, as
shown in Chart 6 where the evolution of
probabilities of default (PD) is represented over
time for the different scenarios and for the most
impacted sectors, (ii) by geographical area (iii)
or even by scenario as shown in Chart 7.
Table 1: cost of risk by set of sectors and scenario (in bps)
Orderly 2025
(A)
Orderly 2050
(B)
Ratio
(B) / (A)
Sudden 2050
(C)
Ratio
(C) / (A)
Sensitive sectors 12.4 30.8 2.5 37.3 3.0
Other sectors of interest 19.0 23.3 1.2 27.8 1.5
Other sectors 19.4 24.1 1.2 26.8 1.4
Not allocated 39.1 36.4 0.9 37.0 0.9
Total 21.6 26.3 1.2 29.5 1.4
-5,0
0,0
5,0
10,0
15,0
20,0
25,0
30,0
Orderly 2050 - 2025 Sudden 2050 - Orderly 2050
Sensitive sectors
Other sectors ofinterest
Other sectors
Unallocated
Total
Impact orderly + sudden

Main results of the 2020 climate pilot exercise 21
In Chart 7, it can be noted that the probabilities
of default for the orderly transition scenario by
sector (green curve) in 2050 are almost always
lower than those of the sudden transition
scenario (red curve) at the same point in time.
The winning sectors are those for which the
probabilities of default are shown to be
decreasing (e.g. construction sector).
Compared to the 2019 levels, these deviations
also illustrate what a forward-looking estimate
of the climate change transition risk might be.
Chart 6 - Point-in-time probability of default broken down by economic activity
Note: the chart represents the weighted average (weighted using the exposures for each sector) of the one-year probabilities of default by sector for the 6 main French banking groups.
Source: ACPR
Chart 7 - Evolution of the probability of default broken down by sector
Note: the graph below represents the weighted average (weighted using total corporate exposures) of the one-year probabilities of default by sector of the 6 main French banking groups. The levels shown for the orderly and sudden transition scenarios correspond to those observed in 2050.
Source: ACPR
0%
1%
2%
3%
4%
2015 2020 2025 2030 2035 2040 2045 2050 2055Crop and animal production Mining and quarrying
Coke and refined petroleum products Chemical products
Other non-metallic mineral products Basic metals
Sewerage and waste collection Support service activities
0,00%
0,50%
1,00%
1,50%
2,00%
2,50%
3,00%
Sudden
Orderly
2019

Main results of the 2020 climate pilot exercise 22
2.2.4 Impact of a dynamic balance sheet assumption on the evolution of the cost of risk
In the course of our analyses, the effect of the
dynamic balance sheet is not the main factor
explaining the observed difference between the
orderly and sudden transition scenarios.
Indeed, the possibility for institutions to
reallocate their sectoral exposures leads to two
opposite effects: i) first, a decrease in
exposures to the sectors that are most affected
in the scenarios, due to a reallocation of credit
portfolios, ii) then, an effect linked to the starting
level of these probabilities of default: since that
starting level is initially higher in certain sectors
that ultimately benefit from the transition,
sectoral reallocation sometimes leads to an
increase in the cost of risk.
Finally, under the dynamic balance sheet
assumption, institutions increase their
exposures to sectors that benefit from the
energy transition with a decrease in their level
of risk (in the form of a probability of default). In
the end, these different effects partially offset
each other and the dynamic balance sheet
assumption as such ultimately has little impact
on the total cost of risk (Chart 8). On the other
hand, on a static balance sheet assumption, the
rate of growth in the cost of risk would be
greater for sectors sensitive to transition risk
than for others.
Chart 8 - Impact of a dynamic balance sheet assumption in scenarios on the cost of corporate risk
Note: the chart reads as follows: the dynamic balance sheet assumption lowers the total corporate cost of risk by 0.2bps in the sudden transition scenario compared to the level that would have prevailed under a static balance sheet assumption by 2050. For both the orderly and sudden transition scenarios, the ratio between provisioning flows over the time interval 2040-2050 and the average exposure over the same period is calculated for each sector. This ratio is applied to sectoral exposures recalculated on the basis of the shares of each sector in the corporate portfolio observed in 2025, when the balance sheet is still static.
Source: ACPR
2.2.5 Dispersion of the evolution of the cost
of risk across institutions
Overall, this exercise confirms that transition
scenarios, especially when they are disorderly,
are indeed a source of additional risk for French
banks compared to an orderly transition
scenario. Looking at the distribution of these
impacts for the 6 main institutions, a significant
heterogeneity also appears in the levels of the
cost of risk. Indeed, the interquartile range of the
cost of risk is equal to 11.5 bps in 2019 but it
reaches 16.2 bps (+40.8%) in the sudden
transition scenario (15.6 bps in the orderly
transition scenarios). This reflects the different
-0,80
-0,60
-0,40
-0,20
0,00
0,20
0,40
0,60
Sensitive sectors Other sectors ofinterest
Other sectors Unallocated Total
Sudden
Orderly

Main results of the climate pilot exercise for 2020 23
rates of change in the cost of credit risk
(particularly corporate) between scenarios
depending on the institution. These increase
ranges from +0.8% to +46.0% for five
institutions for which the cost of risk increases
by 2050 in the sudden transition scenario.
Although the low number of points calls for
caution in interpreting this result, we can
nevertheless note an increasing relationship
between the impact observed on the institutions
and the share of sensitive sectors in their
corporate portfolio (see Chart 9).
Chart 9 - Dispersion of the cost of risk across institutions and correlation with the share of sensitive sectors in portfolios
Left-hand chart: the cost of risk is calculated in the same way as before. The crossed-hatched part represents the interquartile range, and the lines extend from the observed minimum to the observed maximum. For example, in the sudden transition scenario, the aggregate cost of risk for 2050 is equal to 17.2 bps (red line), the median is 16.4 bps, the minimum is 0.8 bps and the maximum is 26.3 bps. three banks have a cost of risk comprised between 11.7 and 16.2 bps.
Right-hand chart: this chart shows the rate of change in the cost of corporate risk (on the x-axis) between the sudden transition scenario and the orderly transition scenario over the last time interval (2040-2050) and the share of sensitive sectors in the corporate portfolio in 2025 (on the y-axis). Only five institutions are shown since one institution takes a different approach compared to other institutions by not relying on the evolution of sectoral added values.
Source: ACPR
Market risk
Market risk is the second category of risks for
which banks calculate projected losses. It is
divided into two sub-categories: (i) the fair value
revaluation of the trading book following an
instantaneous market shock induced by the
valuation of assets under adverse transition
scenarios; (ii) the impact of market shocks on
the counterparty risk in the most sensitive
sectors. For these two components, the
positions therefore remain constant. On the first
component of market risk, the following
exposures were studied: equity, corporate
credit spreads (mainly related to bonds),
20 In the end, variations in the valuation of interest
rate portfolios were excluded from the results, as the magnitude of the impacts (linked to massive
interest rate variations in the scenarios)
sovereign credit spreads, commodities (only oil-
related positions) and finally interest rate20
instruments. In total, the instantaneous impact
of the transition scenarios on the top six banking
institutions reaches 160 million euros in case of
a sudden transition and 69.6 million euros in
case of a delayed transition. As a result, the
recorded losses are relatively modest
compared with standard stress tests such as
those usually carried out by the EBA. The
market shocks used for this exercise were
significant but applied to a small portion of the
portfolio (equity in sensitive sectors and
complicates the reading of the results without these instruments being specifically linked to the analysis of the transition risk.
0,0
5,0
10,0
15,0
20,0
25,0
30,0
2019 Orderly 2050 Delayed 2050 Sudden 2050
0%
2%
4%
6%
8%
10%
12%
14%
16%
18%
0% 10% 20% 30% 40%

Main results of the climate pilot exercise for 2020 24
corporate credit spreads in the same sectors as
well as to sovereign risk). In addition, the
analysis per instrument shows that sensitive
sectors may be the subject of short positions at
the cut-off date studied (31 December 2019),
thereby offsetting the adverse impact of shocks.
In the end, it is essentially on the sovereign
segment, that the total impact is felt (-198.8
million euros in the sudden transition scenario),
due to the very adverse interest rate scenarios.
Chart 10 - Impact of financial shocks on market risk (in € millions)
Note: on the left is the impact on the fair value of the trading book, on the right the impact on the counterparty risk. In the left-hand chart, the significant impact of interest rate positions is not taken into account as it makes the results more difficult to read without these instruments being particularly relevant to the analysis of the transition risk. Sensitive exposures are isolated (not summed up with other contributions) and correspond to equity and bond instruments on the 6 sensitive sectors identified in the exercise template (A01, B, C23, C24, E37-37) based on the magnitude of market shocks.
Source: ACPR
The modest magnitude of these results calls for
careful consideration as to how best to assess
the impact of transition risk on market risk,
particularly given the operational burden
involved. Indeed, the information systems used
in market risk management do not (at this time)
allow for market risk to be analysed from a
sectoral perspective as these systems are built
around risk factors. Therefore, the
implementation of this exercise has required
extensive manual adjustments with a limited
impact in the end. This issue was combined with
the lack of understanding of the narrative
underlying the market scenarios (scopes,
sensitivity parameters studied, gap between the
usual horizon for analysing market risk and that
for transition risk). However, the following
elements are worth noting. First, the exercise
raised awareness within the functions in charge
of market risk management regarding the need
21 This risk is measured using the impact of default
of the two largest counterparties of the institution
to incorporate this sectoral dimension into
market risk analysis. Indeed, repeated market
shocks with unusual correlations are likely to
occur in the coming years following the
implementation of transition policies, such as
carbon taxes. Second, the trading book does
not represent the full range of market activities
of banking institutions. It might be useful to
integrate a broader view of market activities,
such as transactions subject to fees.
The counterparty21 risk analysis, which is the
second component of the market risk studied in
this exercise, shows a total impact on the six
largest banks in the range of €190 million and
€145 million respectively in the sudden and
delayed transition scenarios. The average
impact per counterparty for each institution is
thus €15.6 million and €11.9 million respectively
(with an average maximum impact of €48
-250
-200
-150
-100
-50
0
50
100
Equity Total Credit Spread- Corporates
Credit Spread- Sovereign
Commodities TOTAL Sensitiveexposures
Sudden
Delayed
-200
-180
-160
-140
-120
-100
-80
-60
-40
-20
0
Sudden Delayed

Main results of the climate pilot exercise for 2020 25
million). The majority of counterparties identified
by institutions as being in vulnerable sectors
and subject to default belong to mining and
quarrying or manufacture of coke and refined
petroleum products. This type of analysis
(similar to credit risk) is thus useful for
identifying substantial market positions on
carbon intensive counterparties.
Box 2 - Results of the pilot exercise for financial institutions in the public sector
In addition to the 6 main French commercial banks, three other institutions volunteered to participate in
the pilot exercise: the Caisse des Dépôts et Consignations (French deposits and consignments fund,
Savings Fund and General Section), the Agence Française de Développement (French Development
Agency) and the Société de Financement Local (French local financing company, SFIL). For these three
public sector financial institutions, the methodology and scenarios of the pilot exercise were not always
adapted to their business model, which was very different from that of commercial banks, especially for
the latter two. For example, in the case of the Agence Française de Développement, the bulk of the
financing concerns the geographical area labelled "Rest of the world". Economic developments in the
euro area are described in the scenarios provided by the ACPR/Banque de France in an aggregated
manner and therefore without sufficient differentiation between countries that present very different
vulnerabilities. This approximation, a reasonable one for commercial banks (as credit exposures are
mostly located in Europe and the United States) was therefore not appropriate for the portfolio of the
AFD. Similarly, the scenario does not describe specific trends at the level of local authorities, which is the
main source of SFIL22 credit exposure. This has required in a significant additional effort to adapt the
exercise to the specific characteristics of these two institutions.
Agence Française de Développement (AFD)
The AFD approach was broken down into two steps. Sovereign and then non-sovereign portfolio stress.
As regards the first cited portfolio, AFD's country economists assessed the sovereign rating trajectories
of 20 countries representing 66% of sovereign exposure, based on the "rest of the world" scenario and
the narrative accompanying the Banque de France's methodological document describing the building of
the scenarios. By taking into account criteria such as sectoral diversification of the economy, the energy
mix and the potential impact on public finances, AFD was therefore able to differentiate the impact of the
countries under consideration on the ratings. This assessment led to a downgrade of the sovereign
portfolio by slightly less than one notch under the sudden transition scenario. It also indirectly affects the
rating of corporate counterparties (support capacity when the State is a shareholder of the counterparty
and country caps). Corporate counterparties are then subjected to specific line by line stress based on
three criteria: changes in value added and sector margin and financial resilience of the counterparty.
Altogether, this analysis led to downgrades by three notches or more for 17 sectors accounted for 38.9%
of the non-sovereign portfolio for a total weighted impact equal to one notch. The downgrade across the
entire portfolio (including sovereign portfolio) is of the same order. However, the AFD noted the need to
further refine the analysis for two sectors: that of financial23 counterparties which, in AFD's areas of
intervention, may be highly specialised in risky sectors, and the electricity and gas sector which, in the
scenarios, did not allow for a distinction to be made between the impacts according to the technological
mix of the companies. The AFD has launched specific working groups for these sectors (accounting for
44.2% of the non-sovereign portfolio).
22 SFIL work is not finalised at the date of publication.
23 For this exercise, the AFD has decided to apply an ad hoc three-notch downgrade assumption to its financial counterparties.

Main results of the climate pilot exercise for 2020 26
Caisse des Dépôts et Consignations Group
In the case of the CDC group, the scenarios were also not fully adapted to the group’s activity as there
was no element related to the issue of social housing financing (although such exposures could be
associated with sovereign exposures) and the methodology excluded equity holdings. For “Section
Générale”, 62.7% of credit exposures did not fit into the segments studied in this exercise, in particular
equity holdings. In the case of the “Fond ‘Epargne” according to which exposures associated with social
housing financing are considered as a sovereign exposure (as 95% of them are guaranteed by local
authorities), 76.1 % of credit exposures fell within the scope of the exercise. Out of the three portfolios
studied in the exercise, the Fond d’Epargne and Section Générale24 projected the expected losses over
the entire period encompassed in the exercise. Given the low level of corporate exposures (particularly
in sensitive sectors), the CDC group did not differentiate between sectors. However, with the limited
divergence in the trajectories of the macroeconomic variables (GDP, unemployment, etc.) retained in the
model, the impacts of the adverse scenarios are ultimately very low. On the contrary, the most
discriminating variable in the model retained is the risk-free interest rate. As the risk-free interest rate is
higher in the orderly transition scenario, the latter constitutes the most adverse scenario for the CDC
group.
3. Transition risk analysis for French insurers.
For several years now, French insurers have
been involved in policies aimed at reducing the
carbon footprint of their asset portfolios. Their
current exposure to sectors that are potentially
at risk in the event of transition risk shocks
remains limited to about 17% of their total
assets. In addition, the majority of them
committed to achieving carbon neutrality by
2030.
24 This is based on a methodology developed by the General Section which adapted its IFRS9 model to project migration matrices
with a 30 year horizon based on annualised macroeconomic data resulting from scenarios. Note that sovereign portfolio
projections are not conducted using the ACPR benchmarks because it is impossible to normalise migration matrices on an ad hoc target.

Main results of the 2020 climate pilot exercise 27
Chart 11 - Portfolio structure over the course of the exercise (as a % of the balance sheet)
Source: ACPR
The exercise only partially shed light on the
implementation of portfolio reallocation
strategies as participants generally maintained
their asset allocation stable. While all
companies implemented existing coal exit
strategies, the shocks provided - which varied
relatively little depending on variants - did not
lead insurers to significantly alter their portfolio
structure. The results above (see Chart 11)
largely reflect a prolongation of the current
portfolio composition, both in terms of asset
classes and sectoral allocation.
The value of the assets held in the portfolio
therefore mainly varies on account of
assumptions regarding the pace of carbon tax
developments and technological progress
required to achieve the objectives of the Paris
Agreement. On-balance sheet shocks have a
different impact for different asset classes and
business sectors. Measured as a deviation from
the initial market value in 2025 and 2050, Charts
12, 13 and 14 show, by asset class, the sectoral
impact of the two disorderly transition scenarios
as a deviation from the baseline scenario
(orderly transition).
0,0%
20,0%
40,0%
60,0%
80,0%
100,0%
120,0%
2019 Orderly 2050 Delayed 2050 Sudden 2050
Sovereign bonds Corporate bonds Equities Investment funds
Structured securities Secured securities Deposits Real estate
Loans Other Unknown

Main results of the 2020 climate pilot exercise 28
Chart 12 – Sectors that are sensitive to the transition risk: impact of alternative scenarios on bond assets as compared to the reference scenario
The reference scenario corresponds to an orderly transition, Variant 1 to a delayed transition scenario, and Variant 2 to a Sudden transition scenario (see pages 14 et seq.).
Source: ACPR
Chart 12 shows a limited overall impact on bond
portfolios for the most carbon-emitting sectors.
The value of extractive industry corporate
bonds - the sector most affected in this asset
class - decreases in the sudden transition
scenario by about 4% more than in the
reference scenario, and by 2% in the delayed
transition one. The limited impact of the decline
in value of corporate bonds from other polluting
sectors is mitigated by the already low level of
exposure of French insurers to these industries:
in 2019, the sectors included in these graphs
represented less than 0.5% of the bond
portfolio, illustrating the significant
commitments already made within the French
market in terms of climate-related investment
policies.
-3,50
-3,00
-2,50
-2,00
-1,50
-1,00
-0,50
0,00
0,50
1,00
orderly vs delayed transition 2025 orderly vs delayed transition 2050
orderly vs sudden transition 2025 orderly vs sudden transition 2050

Main results of the climate pilot exercise for 2020 29
Chart 13 – Sectors that are sensitive to the transition risk: impact of alternative scenarios on the equity portfolio as deviations from the baseline scenario
Source: ACPR
As equity portfolios are more sensitive to
macroeconomic and financial volatility, a
disorderly transition to a low-carbon economy
results in larger shocks to equity market values.
The impact of shocks is particularly strong for
the agricultural, extractive and manufacturing
sectors. However, although the shocks to
equities are greater than the projected impacts
on bond portfolios, the impact of the shocks on
insurers' asset portfolios is lower, given the
relatively limited exposure of insurers to equities
(9% of investments are in directly held equities
or equity interests, and around 15 % if equities
held through collective investment schemes are
also taken into account).
-30,00
-25,00
-20,00
-15,00
-10,00
-5,00
0,00
5,00
10,00
orderly vs delayed transition 2025 orderly vs delayed transition 2050
orderly vs sudden transition 2025 orderly vs sudden transition 2050

Main results of the climate pilot exercise for 2020 30
Chart 14 – Sectors that are sensitive to the transition risk: impact of alternative scenarios as deviations from the baseline scenario: units in funds
Source: ACPR
Chart 15 - Impact vs baseline scenario: Total investment (€million)
Source: ACPR
-16,00
-14,00
-12,00
-10,00
-8,00
-6,00
-4,00
-2,00
0,00
2,00
4,00
orderly vs delayed transition 2025 orderly vs delayed transition 2050
orderly vs sudden transition 2025 orderly vs sudden transition 2050
-40 000 €
-30 000 €
-20 000 €
-10 000 €
0 €
10 000 €
20 000 €
30 000 €
2025 2035 2040 2050
Retardée AccéleréeDelayed Sudden

Main results of the 2020 climate pilot exercise 31
However, the evolution of both corporate bond
and equity prices is not the main factor
explaining changes in the value of insurers’
assets. Insurers manage their investment
according to the characteristics of their
liabilities: the longer the maturities of liabilities
are, the more insurers invest in assets with a
long maturity. The average duration of insurers’
liabilities is 10 years in France, compared with
8 years for assets. As a result, the level of
interest rates plays a key role in the valuation of
insurers’ balance sheets.
The scenarios considered in the pilot exercise
involve disturbances in the global economy.
The monetary policy response to these
disturbances is a cut in interest rates to
compensate for the slowdown in activity. This
decrease in interest rates increases the value of
bonds purchased at a time when interest rates
were higher, with a positive effect on the total
value of assets given the size of insurers' bond
holdings and without significant increases in
defaults in the different scenarios. The transition
to a low-carbon economy would only become a
threat to insurers if it resulted in a prolongation
of the low interest rate environment. As the
duration of assets is shorter than that of
liabilities, the increase in bond values would not
compensate for the increase in the value of
liabilities, discounted at the risk-free rate.
Furthermore, the scenarios do not directly take
into account the consequences on the valuation
of the insurers' balance sheet of an increase in
the frequency and cost of extreme weather
events should the implementation of transition
policies be delayed or abandoned.
4. Transition risk has a relatively moderate impact
Overall, the pilot exercise thus reveals a
generally "moderate" exposure of French banks
and insurers to the climate transition risk.
However, this conclusion needs to be put into
perspective in view of the uncertainty
surrounding both the pace and impact of climate
change. It is also contingent on the
assumptions, scenarios analysed and
methodological difficulties raised by the
exercise.
Furthermore, while this analysis does integrate
sectoral interactions and the risk of a significant,
if not massive, devaluation of the prices of
certain assets, it does not take into account the
risks of a spillover effect, of supply chain
disruptions or of amplification that are typically
observed during episodes of financial stress or
crises. The conservative assumptions adopted
in this exercise therefore suggest that these
estimates represent a downward bias in terms
of financial risks. Lastly, in interpreting these
results, it should be borne in mind that the
scenarios analysed do not induce an economic
downturn by 2050, as is the case with standard
stress testing, but adverse scenarios do include
a slower business growth component. In this
context, the impacts are thus interpreted in
relative terms, as a deviation from the baseline
scenario of an orderly transition. However, the
substantial increase in the cost of risk in some
sensitive sectors, which is already induced by
the orderly transition scenario, indicates that the
energy transition which is necessary in order to
comply with the Paris Agreement, presupposes
a considerable effort to adjust the system and
the economic structures.

Main results of the climate pilot exercise for 2020 32
Physical risks: significant increase in claims by 2050
1. Background on the assumptions made for the physical risk scenario by 2050
Physical risk assessed using the RCP 8.5 scenario of the IPCC
The physical risk assessed in this exercise is
based on the following assumptions:
1/ an increase in the frequency and cost of
extreme weather events due to climate change;
2/ the spread of vector-borne
diseases/pandemics and respiratory
pathologies caused by the increase of
heatwave episodes and their duration, in
particular through increased air pollution. These
events are likely to have consequences for
property and people. Insurance activities are
thus primarily affected by these changes, and
only insurers have had to apply these scenarios
to their non-life25 liabilities.
Physical risk is assessed on the basis of the
Intergovernmental Panel on Climate Change’s
(IPCC) "RCP 8.5" scenario, which corresponds
to a temperature increase comprised between
1.4°C and 2.6°C in 2050. This is the worst case
scenario chosen by the IPCC. This choice takes
into account the fact that, by 2050, the effects of
the various IPCC scenarios are still rather
undifferentiated. Choosing the worst-case
scenario allows us to choose the scenario with
the greatest potential impact. Given the inertia
of climate change, which depends in particular
on the accumulation of greenhouse gases over
25 In order to take account of the indirect effects of these scenarios on banks, a second-round effects analysis has
been included (see p. 46 and Annex C for a presentation of assumptions). 26CCR (2018): Consequences of climate change on the cost of natural disasters in France by 2050
the past 20-25 years, the behaviour and
developments observed over the pilot period
from 2020 to 2050 will condition longer-term
developments up to the end of the century (see
Chart 16 below).
Natural disaster scenarios: impact on the property damage business
The impact of the increased frequency and
intensity of extreme weather events on the
property damage business of insurers was
assessed with the support of the Caisse
Centrale de Réassurance (the public French
reinsurer). The latter has carried out, for those
organisations that so wished, an estimation of
the damage suffered over the period 2020-
2050 for all the perils covered by the natural
disasters compensation scheme in France
(droughts, floods, coastal floods and cyclones
for the ultra-marine territories). These
projections are based on those made by
Météo-France at a very granular26 level.
Participants could also opt for their own loss
projection models using the IPCC RCP 8.5
scenario, especially for the assessment of the
physical risk outside French territory, using the
weather projections made available by the
NGFS.

Main results of the climate pilot exercise for 2020 33
Health scenarios: the spread of vector-borne diseases or pandemics and the impact of urban pollution
Climate change and environmental degradation
also have observable effects on the
development of exotic diseases or chronic
conditions related to heat exposure or
increased levels of particulate matter in the air,
and could therefore affect the health of the
inhabitants of a given region.
The two health scenarios are based on
assumptions regarding changes in mortality
tables and health costs by geographical area
and age of the population27 provided by AON
(see Drif, Roche and Valade28 and Drif, Messina
and Valade29) based on the temperature
trajectories included in the scenario RCP 8.5.
The aim was for insurers to assess the impact
of the spread of these vector-borne diseases or
pandemics and the increase in urban pollution
on health claims, due to increased deaths,
healthcare costs and work stoppages linked
with climate change, for example due to an
increase in the frequency and duration of
heatwaves.
Chart 16 - Physical risk assessment based on IPCC RCP 8.5 scenario
Average temperature in metropolitan France: deviation from the 1976-2005 reference Climate observations and simulations
Source: CCR
Because their role is to protect firms and
households from the effects of adverse events,
insurers face the risk of an increase in the
27 This information is detailed in the technical documentation provided to undertakings prior to the exercise:
https://acpr.banque-france.fr/sites/default/files/medias/documents/20200717_main_assumptions_and_scenarios_of_the_acpr_climate_pilot_exercise.pdf
28 Effects of climate change on vector-borne diseases and personal insurance impact (2020). 29 Effects of climate change on air pollution and impact on the insurance of persons (2020).
number of claims to be covered in the coming
decades. This would be particularly relevant for
property damage activities covering the
Deviations from the reference for observations Deviations from the reference for the RCP 2.6 scenario
Deviations from the reference for past and future climate simulations for the RCP 4.5 and RCP
8.5 scenarios

Main results of the climate pilot exercise for 2020 34
deterioration of real estate or motor property
during extreme weather events and for health
insurance, as pollution and rising temperatures
lead to the development of diseases and
pathologies. Insurance contracts including this
type of cover are usually concluded for one
year: insurers therefore have the possibility to
adjust their pricing annually in order to integrate
the increasing cost of claims into the premiums.
However, such a strategy may not be
sustainable in the long term, if the premiums
charged to cover a given risk become
prohibitive in relation to the amount to be
insured. One of the objectives of the exercise
was to make insurers aware of this insurability
limit.
2. Perils natural disasters (CATNAT)
The impact of the increased frequency and
intensity of natural disasters on the property-
damage activities of insurers was assessed with
the assistance of the Caisse Centrale de
Réassurance, which provided participants with
the increase in claims per French department
based on their exposures to various climate
risks considered at a city level. From 2025
onwards, participants were given the
opportunity to review their underwriting policy in
view of the evolution of the loss ratio: by
considering a geographical reallocation of their
portfolio; by increasing premiums to
compensate for the rising cost of claims; by
revising their reinsurance programmes; or,
finally, by adapting the products offered to
reduce the risks borne by policyholders.
In their simulation, participants mainly chose to
maintain their claims to premiums ratio
throughout the projection. As a result,
premiums increase by between 130% and
200% over 30 years depending on the
category, i.e. an increase in insurance
premiums comprised between 2.8% and 3.7%
per year. Such an increase exceeds GDP
growth by around 170 percentage points over
the 30-year period covered by the exercise for
certain specific insurance classes.
In particular, in the French territory as a whole,
the claims of the insurance classes included in
the calculation of the contribution to the natural
disasters compensation scheme increased by
174% between 2019 and 2050. This increase
also takes into account the assumption of an
increase from 12% to 18% in the cost of funding
CATNAT, the French state reinsurance system.
Given the choice made by participants in the
exercise to keep their loss ratios constant over
time, gross premiums increase by 172%—a
steeper rise than GDP, which increases by only
33% over the same period.
Further assumptions on the behaviour of
policyholders would therefore be required to
assess the sustainability of such an increase in
premiums and to be able to analyse more
precisely the materialisation of an insurance
protection gap. Furthermore, insurers have not
taken advantage of the possibility of amending
their underwriting strategy, in particular by
reallocating their portfolio, in order to get out of
the geographical areas most affected by an
increase in claims or by refusing to insure the
areas most exposed to climate change.
Chart 17 shows, for each French department,
the per capita claims in 2019 and the evolution
of loss ratios, expressed in percentage, for the
perils modelled in the exercise, each of which is
consistent with the IPCC RCP 8.5 scenario. The
change in the claims expresses a combination
of the following risks: an increase in the
frequency and intensity of natural disasters
such as droughts, floods, coastal floods and
tropical storms for ultra-marine territories. The
estimation of the claims depends on the
concentration of the population and economic
activities based on INSEE demographic
projections for 2050 and taking into account the
increase in the size of the population.
Thus, in the framework of the assumptions of
this exercise, in addition to the effect of the

Main results of the climate pilot exercise for 2020 35
increase in insured amounts, the geographical
distribution of the population and economic
activities shows strong regional disparities. In
the charts presented below, the amount of
claims is compared to the number of inhabitants
per department.
This representation sheds important light on the
forecasting of physical risk. For some perils,
such as drought (see Chart 18), a catch-up
effect is observed: the departments in which
claims increase the most in the scenarios (dark
red) are often those in which the amounts of
claims are currently the lowest (low
superimposed number). The departments in
which large cities are located are therefore not
affected more severely than the rest of
metropolitan France, despite the high overall
value of insured assets.
Chart 17 – Claims for all perils (2019 - 2050)
Reading aid: In the Gironde department, insurance claims amounted to 14.02 euros per inhabitant in 2019. Over the 2020-
20520 period, they increase in a range comprised between 92 and 134%.
Source: ACPR

Main results of the 2020 climate pilot exercise 36
Chart 18 – Claims for marine submersion (coastal floods), droughts and floods (2019-2050)
Source: ACPR
The peril for which the dual dimension of
demographic intensity/intensity of the impact of
the climate-related phenomenon is best
illustrated is certainly coastal floods. The Alpes-
Maritimes department- a densely built-up and
highly populated area- appears to be the only
one with both a high initial level of losses and a
significant evolution over time. The evolution of
the claims by 2050 is mainly due to the rising
sea level. Topography is therefore the main
Marine Submersions Droughts
Floods

Main results of the climate pilot exercise for 2020 37
factor that explains this development, with many
low-lying areas in the Mediterranean regions,
which are not particularly exposed at present,
but which will be more so in 2050.
Finally, an increase in cyclonic storms was
modelled solely for the French overseas
departments (DOM), as this is the only part of
the country where a causal link can be
established with global warming. The results
received were very heterogeneous depending
on the modelling technique used by insurers:
the evolution of the cost of claims ranged from
20% over the period to more than 1000% when
few events were recorded during the reference
year. On average, the projected claims for
Martinique, Guadeloupe and Reunion islands
(see Chart 19) exceed the 'all perils' average for
mainland France. Consequently, exposure in
these regions may be high risk for some
insurers depending on the breakdown of their
non-life business.
3. Health hazards
Vector-borne diseases / pandemics
Beyond its impact on the frequency and
intensity of extreme weather events, climate
change may have consequences for human
health, through an increased spread of
mosquito-borne viruses and the effects of air
pollution. The work of Drif, Roche and Valade30
quantifies the consequences of global warming
on the risk of epidemics involving viruses
transmitted by the Aedes Albopictus mosquito
in mainland France. This mosquito, which
carries, among other diseases, those
responsible for the Dengue fever, Chikungunya
and Zika, arrived in mainland France in 2004
and is now present throughout the country. Its
spread is boosted by global warming.
30 Consequences of climate change for vector-borne diseases and impact on life and health insurance (2020)
Chart 19 - All perils - Martinique, Guadeloupe, Reunion islands
Source: ACPR

Main results of the 2020 climate pilot exercise 38
Chart 20 – Claims for vector-borne diseases (2019 - 2050)
Source: ACPR
The observed loss ratio would increase sharply
in the southern regions, in Brittany and in
Corsica. These trends are directly linked to the
evolution of the average rate of infected people
per region in mainland France between 2019
and 2050.
The increase in average temperature and the
resulting impact on the breeding of mosquitoes,
which are disease carriers, lead to an increase
in costs related to healthcare and work
stoppages in these regions.
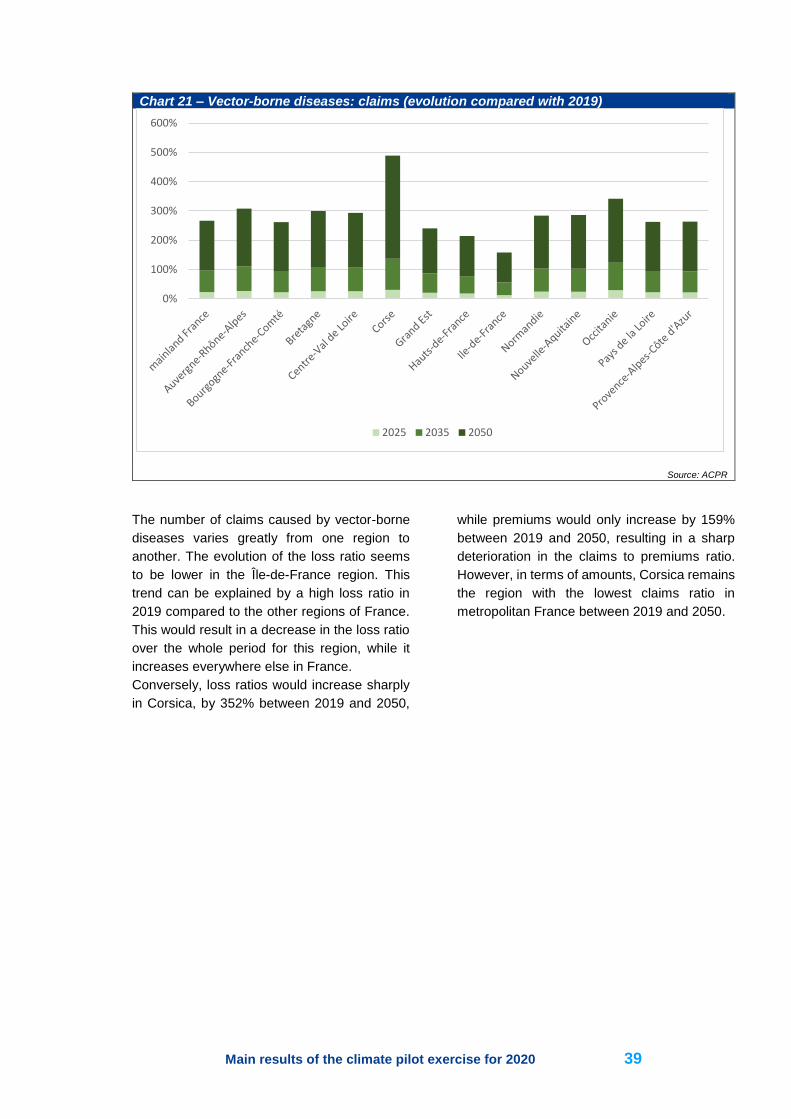
Main results of the climate pilot exercise for 2020 39
Chart 21 – Vector-borne diseases: claims (evolution compared with 2019)
Source: ACPR
The number of claims caused by vector-borne
diseases varies greatly from one region to
another. The evolution of the loss ratio seems
to be lower in the Île-de-France region. This
trend can be explained by a high loss ratio in
2019 compared to the other regions of France.
This would result in a decrease in the loss ratio
over the whole period for this region, while it
increases everywhere else in France.
Conversely, loss ratios would increase sharply
in Corsica, by 352% between 2019 and 2050,
while premiums would only increase by 159%
between 2019 and 2050, resulting in a sharp
deterioration in the claims to premiums ratio.
However, in terms of amounts, Corsica remains
the region with the lowest claims ratio in
metropolitan France between 2019 and 2050.
0%
100%
200%
300%
400%
500%
600%
2025 2035 2050

Main results of the 2020 climate pilot exercise 40
Contrary to the strategy adopted by insurers in
natural disaster insurance classes, some
participants in the pilot exercise did not transfer
the totality of the increase in claims to the
amount of premiums to be paid by the insured.
The result is a slight deterioration in the
claims/premiums ratio, on average, and a
tightening of intra-market distribution over the
time horizon of the exercise.
Chart 22 – Vector-borne diseases: claims/premiums ratio up to 2050
Source: ACPR
0,0%
20,0%
40,0%
60,0%
80,0%
100,0%
120,0%
140,0%
2019 2035 2050

Main results of the 2020 climate pilot exercise 41
Chart 23 – Vector-borne diseases: evolution of the claims/premiums ratio
Note: the claims/premiums ratio measures the ability of non-life insurers to cover claims paid over a given period with premiums collected
over the same period.
Reading aid: In 2050, the median claims/premiums ratio of the sample is 68%, the average being 65%. The minimum ratio is 55% and the
maximum one is 92%. The claims/premiums ratio of the first quartile is 59% and that of the 3rd quartile is 74%.
Source: ACPR
Air pollution
The work of Drif, Roche and Valade31 quantifies
the effects of the change in air quality caused
by the sharp increase in pollutant emissions,
combined with the change in weather
conditions, especially the rising temperature. Air
pollution has a direct impact on health, leading
to respiratory and cardiovascular diseases,
cancers, and premature deaths. The scenarios
developed in the exercise quantify the
consequences of an increase in temperatures
on air pollution and its impact on death benefits,
healthcare benefits, and benefits in the event of
work stoppage. The consequences are most
visible in major metropolitan areas, and the
exercise also draws on assumptions about
migration flows between French regions, again
relying on INSEE projections for 2050.
31 Effects of climate change on air pollution and impact on the insurance of persons (2020).

Main results of the climate pilot exercise for 2020 42
Chart 24 - Air pollution: claims (evolution compared with 2019)
Source: ACPR
Claims associated with these risks would
increase by 119% between 2019 and 2050 in
metropolitan France, with an especially sharp
increase in the cities of Bordeaux, Montpellier
and Toulouse. For these three cities, this
phenomenon can be explained by an increase
in the number of contracts by more than 20%
between 2019 and 2050.
The impact of the evolution of air pollution in the
Île-de-France region between 2019 and 2050
was the least pronounced (see Chart 16): the
number of claims over the same period would
double, while the claims ratio in other cities
would triple. It should be noted, however, that
the Île-de-France region recorded 100 times
more claims in 2019, on average.
0%
50%
100%
150%
200%
250%
300%
2025 2035 2050

Main results of the climate pilot exercise for 2020 43
Chart 25 - Air pollution: evolution of the claims/premiums ratio by 2050
Source: ACPR
Premiums are projected to increase less rapidly
than claims in the Île-de-France region, in Lyon,
Marseille and Nice between 2019 and 2050,
which explains an increase in the
claims/premiums ratio compared to the
previous period. For example, premiums in the
Île-de-France region are projected to increase
by 91% between 2019 and 2050, while the
claims are projected to rise by 98%. By contrast,
in most major French cities, the
claims/premiums ratio is projected to decrease.
This decrease, a sign of better profitability for
insurers, cannot be explained by the
demographic assumptions underlying the
scenarios. In most of these cities, the amount of
claims to be paid per contract increases
significantly, more than the average 110%
increase observed on the whole territory.
Insurers have not commented on their pricing
strategy for this line of business, but they
appear to have chosen to make policyholders
bear cost of the increase in claims, as some
geographical diversification is maintained in the
portfolios. As a result, an increase in the
dispersion of results is observed between 2019
and 2050.
56,0%
58,0%
60,0%
62,0%
64,0%
66,0%
68,0%
70,0%
2019 2035 2050

Main results of the 2020 climate pilot exercise 44
Chart 26 - Air pollution: evolution of claims/premiums ratio
Source: ACPR

Main results of the climate pilot exercise for 2020 45
4. The effects of reinsurance
Insurers have various tools at their disposal to
mitigate the impact of adverse events on their
earnings. In particular, reinsurance makes it
possible to cover excessive claims for a given
event (natural disasters, increased mortality,
etc.). By giving reinsurers part of the premiums
they received, the insurer also transfers part of
the insured risks.
Insurers have not explicitly mentioned any
substantial changes to reinsurance
programmes as a result of the increase in the
claims due to climate change. The gradual
decrease in the share of ceded premiums
therefore appears to be mainly driven by the
insurers' assumption that the claims/premiums
ratio will remain stable over time (see Charts 27
and 28).
Chart 27 - Share of premiums ceded under reinsurance programmes: all line of business
Source: ACPR
7,7%
7,1%
6,6%6,4%
6,1%
0
1E+10
2E+10
3E+10
4E+10
5E+10
6E+10
7E+10
8E+10
9E+10
1E+11
2019 2025 2035 2040 2050
Ceded All lines of business Gross All lines of business

Main results of the climate pilot exercise for 2020 46
Chart 28 - Share of premiums ceded under reinsurance programmes, broken down by business lines impacted by scenarios of the pilot exercise
Source: ACPR
5. Consideration of the indirect (second-round) effects of physical risk on the banking sector
In the work published by the ACPR in April 2019
on banks' consideration of the risks associated
with climate change, banks did not consider
that, beyond the operational risk relating to their
own facilities, they were particularly concerned
by physical risk, as the latter is handled by
insurers. In order to raise awareness of this risk
in the banking sector, a plan was made to apply
the insurers’ reaction function to changes in
premiums and coverage policies to banks’
15,8%
15,1%
14,7%14,4%
14,1%
0
1000
2000
3000
4000
5000
6000
7000
2019 2025 2035 2040 2050
Mill
ion
a/ Natural disasters
Ceded Natural catastrophes Gross Natural catastrophes
5,0%
2,8%
2,6%2,5%
2,4%
0
2000
4000
6000
8000
10000
12000
14000
2019 2025 2035 2040 2050
Mill
ion
c/ Health
Ceded Health Gross Health

Main results of the climate pilot exercise for 2020 47
credit risk parameters, in particular loss given
default and probability of default. The
measurement of this second-round effect
targeted two types of exposures in particular:
those that are financed or guaranteed by
immovable properties (corporate and retail
portfolio) and those that are directly related to
the corporate portfolio.
The analysis consisted of two steps: (i)
institutions were asked to identify, within the
abovementioned portfolios, the proportion of
exposures at risk due to of their geographical
location of the immovable property or the
business activities and value chain of a
company; (ii) it was then requested of them to
indicate orders of magnitude for the impact of
both the physical risk scenario and changes in
insurance coverage on credit risk parameters.
On this second point, institutions were asked to
consider, on the basis of available data on the
evolution of claims worldwide and of the
elements provided by the ACPR, the following
transmission mechanisms:
- Portfolios secured by immovable
properties (retail and corporate). The
impact of a higher probability of occurrence
of extreme weather events such as marine
submersion, floods and droughts -which
could affect the value of real estate, for
example due to the expansion of clay soils-
on credit risk, materialising as the
depreciation of a given secured property
located in risk areas and therefore as a
possible increase in loss given default
(LGD). For households, this effect is coupled
with a possible increase in the probability of
default (and LGD) in the event of restrictions
applied to the insurance coverage of
households.
- Corporate portfolio (vulnerable sectors).
In addition to the transmission channels
described above, institutions were asked to
take into account the impact of such events
for businesses (business disruption, crop
losses, supply chain disruptions, etc.), which
32 Moreover, the development of the methodology for the analysis of the physical risk was not the subject of a joint reflection
with the industry, as was the case for the transition risk.
could lead to a lower turnover and to a
decrease in value added for counterparties
at risk, which could result in an increase in
the probability of default.
Due to timing constraints and the late delivery
of assumptions, banks were not able to initiate
specific work on these issues32. Banks were
therefore asked to provide a description of the
state of progress in their internal work on
physical risk. Only two institutions (a
commercial bank and a public institution) were
able to provide an exhaustive template on the
basis of ad hoc assumptions established by the
ACPR. These assumptions are presented in
Annex C, as the answers provided by the
insurers did not allow for the quantification of
risks related to the uninsurable nature of certain
exposures.
A first challenge, identified as early as the first
stage, consists in identifying exposures
sensitive to physical risk with different
implications depending on the type of portfolio.
In the case of immovable properties, whether as
collateral or financed, institutions have at their
disposal information such as the address of the
property, or at least the address of the client
linked to that property. However, such
information is not systematically centralised
and/or matched with the risk management
information systems at the consolidated level,
which limits the ability of institutions to perform
this type of analysis at the portfolio level with
sufficient granularity, without first launching a
major data collection exercise within the group’s
entities. In most cases, the institutions have
launched projects aimed at systematising the
reporting of information in order to assess the
risks associated with climate change, using a
component based on the location of funded
assets. Recurrent physical risk analyses
continue to be performed at country-level and
are occasionally accompanied by studies on
very localised segments aimed at improving our
understanding of the criteria used for the

Main results of the climate pilot exercise for 2020 48
assessment of the physical33 risk. For instance,
it should be noted that in France housing loans
are often guaranteed by specialized financial
institutions (“organismes de caution”). The final
impact of physical risks on credit risk will
accordingly depends on the impact on these
guarantors.
With regard to the corporate portfolio, the limits
encountered concern the availability of
information on the location of the production
sites of businesses and their value chain. The
identification of the geographical location of the
counterparty’s head office constitutes an
achievable but insufficient approximations.
Besides the data issue, the analysis is complex
to implement and requires significant resources
to analyse even a sample of counterparties
representative of the corporate portfolio. As a
result, some institutions have initiated work on
specific sectors or portfolios, aided by third
parties specialising in physical risk assessment
to speed up the work.
The second stage, which concerns the
assessment of the impact in terms of credit risk,
is therefore constrained by the limited
availability of the data needed to differentiate
risks within portfolios, particularly in the
corporate portfolio (excluding SMEs).
Nonetheless, banks have undertaken
significant work in this area, mainly ad hoc work
(at a local level) on very localised portfolio
segments or for specific risks (e.g. coastal
floods). The objective is to gain a better
understanding of how physical risk is
transmitted to credit risk and to define the key
criteria for modelling, for example, the impact of
natural disasters on credit risk. Thus, studies
aimed at reconciling the evolution of defaulted
loans (retail and business- VSEs/SMEs) and
the occurrence of past natural disasters are first
steps in this direction. In the end, this second-
round exercise points to the need for institutions
as well as supervisors to carry this work
forward.
33 For example, one institution points out that the analysis of flood risk at the level of the address of a financed property is
imperfect as this information has to be cross-checked with data on altimetry, etc. Accordingly, ACPR requests on the identification of exposures at risk at a department level was not granular enough.

Main results of the 2020 climate pilot exercise 49
Methodological lessons from an exercise with unprecedented characteristics
The pilot exercise provides insightful lessons
but also raises a number of methodological
issues on which additional work will be carried
out in the coming quarters. This work will enrich
discussions within financial institutions as well
as among European and international
supervisors. Three main areas of development
were identified concerning: i) the design of long-
term scenarios and the identification of
vulnerable sectors; ii) consideration of the
physical risk; and iii) improvements to the
models used by the participants and the issue
of the data needed to carry out this type of
exercise.
1. Assumptions used in scenario building and identification of sensitive sectors
The challenges associated with a long-term
horizon
The first difficulty encountered by financial
institutions relates to the time horizon of the
exercise. The covered time span, 30 years,
exceeds by far the usual horizon over which
institutions conduct their stress tests, whether
those implemented by supervisors or their own
risk assessment testing (usually over 3 to 5
years). The scenarios provided in the
framework of the pilot exercise take the form of
a set of macroeconomic and financial variables
projected over the long term, in five-year
intervals. These scenarios reflect long-term
trends. However, the models used by banks to
quantify risks are not adapted to incorporate
smoothed trends in macroeconomic and
financial variables over a long period. The same
applies to non-life insurance companies, which
are used to dealing with extreme climate shocks
but not with the smoothed-out deterministic
effects over a long period of time which are
typical of chronic physical risk.
The very long time horizon also implies costly
work in projecting credit risk parameters. This
cost is multiplied by the number of sectors
considered in the analysis, the number of
scenarios and the number of geographical
areas to be covered.
The second difficulty encountered by the
institutions that participated in the exercise was
the low variability between the different
scenarios provided by the ACPR. This issue
had already been identified by the ACPR, which
led the authority to add a sudden transition
scenario to the scenarios published by the
NGFS in order to increase the level of
macroeconomic and financial stress. However,
the nature of this exercise differs from traditional
stress-testing practices. The objective here was
not to ensure that financial institutions are
sufficiently capitalised in the event of an
extreme but plausible shock, but rather to make
those institutions aware of the risks induced by
climate change and their transmission
channels. Hence, unlike the stress tests
conducted by the European Banking Agency,
which require scenarios based on three
consecutive years of GDP contraction, the pilot
exercise is based on a set of plausible transition
scenarios, none of which induce an economic
recession.

Main results of the climate pilot exercise for 2020 50
Finally, another innovative aspect of the
exercise was the implementation of the dynamic
balance sheet assumption. The latter provides
very interesting results and information on the
strategies of financial institutions. However, the
building of the transition scenarios, whether
orderly or not, results in achieving the carbon
neutrality target by 2050, except in the case of
the scenario underlying the physical risk
analysis. In this context, the absence of
feedback effects between the management
decisions of financial institutions and the
dynamics of the economy, including the
evolution of sectoral structures, does not
necessarily encourage them to implement an
active risk reduction policy despite the dynamic
balance sheet assumption.
Identification of sensitive sectors
A second challenge associated with this type of
exercise is the identification of sectors that are
sensitive or exposed to climate risk:
identification is firstly contingent on the method
used. It then requires assumptions on the
evolution of the energy mix, the intensity and the
energy efficiency of production, which have not
been satisfactorily integrated into this exercise.
Finally, there is the matter of sectoral granularity
and the incorporation of exposures or
counterparties into a given nomenclature or
taxonomy. Some supervisors identify these
sectors solely on the basis of their greenhouse
gas (GHG) emissions. In the pilot exercise, the
choice was made to take into account the
financial risk associated with the
implementation of transition policies in the form
of a carbon tax. The analytical framework
underlying the production of the scenarios is
based, in its sectoral part, on input-output
matrices which make it possible to take account
of sectoral interactions. Thus, even though its
direct GHG emissions are limited, the
manufacture of coke and refined petroleum
products sector is the most affected, its value
added being about 58% lower in 2050 in the
abrupt transition scenario than in the baseline
scenario. This sectors is particularly impacted
due to the fact that its production emits large
34 Each counterparty had to be allocated in full to a single NACE code in the exercise.
quantities of GHG. Indeed, the consumption of
oil and coke is highly taxed, prompting players
to invest in cleaner energy sources and to
reduce their demand significantly. As a result,
oil production in France in 2050 fell by 47%
compared to the baseline scenario in the
delayed transition scenario and by nearly 60%
in the transition scenario. This demand effect is
also transmitted to the French mining sector,
with value added dropping by 25% in the case
of a sudden transition. Similarly, sectors
upstream of the production network also tend to
be more impacted. Hence, these
methodological choices are not neutral in terms
of scenario narrative and impact assessment.
The limits of the NACE code segmentation
One of the features of the pilot exercise was
asking institutions to analyse credit risk by
disaggregating the impacts by economic activity
applying the statistical classification of
economic activities in the European
Community, NACE rev2 level. The institutions
had to start by allocating each counterparty to
one of the various NACE codes. The corporate
exposures (often VSEs / SMEs) that were not
allocated usually represented a relatively small
share of the corporate portfolio (15.2% of the
portfolio for all the participating banks). The
institutions were therefore able to allocate the
vast majority of their corporate exposures to
economic activity sectors, usually because they
already have this information available in their
information systems or because they had an
internal sectoral classification system that was
compatible with NACE codes. In the case of
multiple-activity companies, however, this
sectoral allocation process may have posed
difficulties34. Indeed, a company in which part of
its economic activity is little exposed to
transition risk but of which another part is more
vulnerable so can be assigned to one or other
of these NACE sectors, with the risk of
underestimating exposure to transition risk (see
box below). Though it is difficult to assess the
extent of this issue, further work will be needed
to standardise the process by which
establishments categorise exposures.

Main results of the 2020 climate pilot exercise 51
Box 3 - Case study: Glencore - Xstrata
A practical example encountered during the pilot exercise helps to illustrate this issue. Originally a trading
company, Glencore merged with Xstrata to become a major mining company35. As a trading company,
Glencore Xstrata can be allocated to the 'wholesale trade' sector (G46), but the scale of its extraction
activity can also justify its allocation to the mining and quarrying sector (sector B). Thus, out of the five
institutions that submitted data on Glencore Xstrata, three allocated the company to sector B and two
allocated it to sector G46, the latter being much less impacted in the various scenarios of the pilot
exercise. When the company was allocated to the 'wholesale' sector, the associated probability of default
remained close to its 2025 level (before the increase in the price of carbon) over the entire period
considered. Conversely, for institutions that categorised this company as belonging to sector B, a sharp
increase can be observed in the probability of default over the 2025-2050 period. This observation was
the result of the approaches retained by banks to project parameters as the same banks that allocated
the company into the G46 economic activity projected very different PD paths for the sector B.
Note: The evolution of the probability of default (PD PiT stands for for point in time Probability of default) compared to 2025 in the
orderly transition scenario is presented as a ratio relative to the starting point. On the left-hand side, the graph represents the
average default probability for institutions assigning Glencore - Xstrata to NACE code B and institutions assigning the same
company into the NACE code G46. On the right-hand side, the chart focuses on the institutions assigning Glencore Xstrata into the
NACE code G46 and compares the evolution of the PD PiT with another company assigned in the NACE code B.
we it should be noted that the institutions that have classified Glencore Xstrata in the G46 sector project a probability of default for this company that differs from their projections for Rio Tinto (a company belonging to the extractive industries sector). This confirms the underestimation of the transition risk incurred by Glencore Xstrata due to its sector allocation.
Another identified methodological limitation
stems from the fact that the breakdown of
sectoral impacts using NACE at 2-digit level
codes does not allow for account to be taken of
the heterogeneity of exposures to the transition
risk among companies within the same
economic sector. Indeed, companies with
varying degrees of exposure to the transition
risk can be found in the same sector. For
35 According to the Global Coal Exit List, more than 20% of Glencore - Xstrata's revenues are derived from the coal mining
business
example, the value added of the “electricity and
gas” sector is growing significantly in the
scenarios of the pilot exercise, and institutions
project slightly increasing probabilities of default
for this sector in the three transition scenarios.
However, when considering four companies
that are assigned to this specific NACE code
(Enel, EDF, Engie, and RWE), companies that
use very different technologies and therefore
0,0
0,5
1,0
1,5
2,0
2,5
3,0
3,5
Orderly2025
Orderly2050
Delayed2050
Sudden2050
Evolution of PiT PD per scenario Glencore -Xstrata
Orderly 2025 = 1
Average G46 Average B
0,0
0,5
1,0
1,5
2,0
2,5
3,0
3,5
Orderly 2025Orderly 2050 Delayed2050
Sudden2050
PiT PD per scenarioOrderly 2025 = 1
Glencore - Xstrata (G46) Rio Tinto (B)

Main results of the climate pilot exercise for 2020 52
have, at first glance, very different transition risk
exposures themselves. The same dynamics
regarding probabilities of default can be seen in
Table 2 below, although in the case of RWE, for
example, about 30% of its electricity production
is generated by coal36. This example confirms
the need for a more granular approach for key
transition sectors. Another example commonly
presented to illustrate this heterogeneity is that
of the automotive industry, which includes
companies that are more or less advanced in
the development of electric transport.
Table 2: PiT PD evolution per Electricity and Gas sector (D35) counterparty
Normalized at 1 in 2025
Counterparty Orderly 2025
Disorderly 2050 Delayed 2050 Sudden 2050
Engie 1.0 1.4 1.4 1.4
EDF 1.0 1.5 1.5 1.5
ENEL 1.0 1.3 1.2 1.2
RWE 1.0 1.9 1.8 1.8
The impact of financial assumptions on
insurers’ and banks’ results
The pilot exercise reveals an overall "moderate"
exposure of French banks and insurance
companies to the risks associated with climate
change. For the insurance sector, and in a
regulatory framework such as Solvency 2, the
valuation of insurers' balance sheets depends
to a large extent on the level of interest rates.
Additional assumptions could be developed to
better take into account, in the scenarios, the
link between interest rates and climate change
or to better differentiate the impact of variations
due to climate change from that resulting from
other factors.
For banks, market risk assessment applied to
portfolios managed over a very short-term in the
framework of an exercise aimed at assessing
long-term risks also poses significant
methodological problems. The assessment
provided in this exercise is similar to a sensitivity
exercise on which progress needs to be made
in order to have a better appreciation of the
vulnerability of banks to market adjustments
generated by the implementation of transition
policies or by the default of major stakeholders
due to the lasting impact of extreme weather
events on economic activity.
36 https://www.group.rwe/-/media/RWE/documents/05-investor-relations/2020-Q4/2021-03-16-rwe-annual-report-2020-
tables.xlsx?la=en&hash=D00D131952E8DF428475BEE69D7AEA2F
2. Consideration of the physical risk
In order to assess the impact of a natural
disaster, insurers have highly granular
information at their disposal on the geographical
location of insured assets. In order to do so,
they also need to know the geographic
coordinates of the climate event. However, this
exercise required a different approach, based
on an increase in the frequency and intensity of
natural disasters to be simulated according to a
given temperature trajectory. As mentioned
above, the public reinsurer CCR played a very
important intermediary role by applying the
Météo France climate model to insurers'
exposures at a very granular geographical level.
For undertakings that did not wish to go through
CCR, the ACPR, in collaboration with the
NGFS, has made available a database
projecting the main climate variables at the
global level, each of them being consistent with
one of several climate scenarios, including RCP
8.5. However, insurers have found it very
difficult to use this data to derive the impacts of
an increase in the claims on their portfolios, due
to the incompatibility of the data with internal
models and assumptions. Further work on the
nature and quality of the data to be made
available to insurers during an exercise is
therefore necessary to enable them to use this

Main results of the climate pilot exercise for 2020 53
data in their model and guarantee the
comparability of results.
The pilot exercise also included a second
round, following on from the estimates made by
the insurers to assess the impact of changes in
insurance coverage on banks' credit risk. In the
absence of management decisions by insurers,
ad hoc assumptions were provided to banks,
but only two institutions were able to submit full
statements. Further work is also needed on this
topic in order to allow for an assessment of the
physical risk on exposures relating to the
financing or guarantee of property and those of
the corporate portfolios of credit institutions.
The first necessary step is for banks to integrate
the geographical location of their exposures into
their information systems. The second one is
the identification of the geographical location of
suppliers and customers in order to identify
potential vulnerabilities resulting from a lasting
disruption of supply chains.
3. Improving models and methodologies used by participants
Projecting results over a 30-year horizon
On the insurance side, participants did not
necessarily have the skills or tools necessary to
make projections over a 30-year period. Out of
the 15 insurance groups that took part in the
exercise, six used an external service provider,
who created dedicated projection tools. Others
adapted existing tools, most often assuming a
stable market share over time. Overall, the
ability of ALM tools to manage the time horizons
inherent to climate change scenarios remains
limited and the adaptation of these tools is more
complicated than recursive calculations over
consecutive periods.
As a result, insurers, who usually perform
projections over a horizon comprised between
3 and 5 years, have not fully taken advantage of
the room for adaptation allowed under the
dynamic balance sheet assumption:
On the assets side, only one participant
conducted a strategic reallocation in response
to the transition risk scenarios provided for the
exercise. It is true that banks and insurers were
not severely impacted by the shocks included in
the scenarios, especially given their low ex ante
exposure to sensitive sectors and equities
(subject to higher losses than bonds), as French
financial players have already made
commitments to exit polluting sectors -
especially coal-producing and coal-intensive
industries.
On the liabilities side, in the absence of
decisions on the geographical reallocations in
the insurers' portfolio, the exercise failed to
show the potential emergence of an insurability
risk. Insurers continued to provide coverage in
all regions independently of the differential
exposure to extreme weather events,
considering that customers would be able to
financially absorb the increased premiums.
During the dynamic balance sheet assumption
phase, insurers have generally chosen to
maintain a stable claims/premiums ratio,
essentially maintaining a static balance sheet
by increasing premiums in proportion to the
increase in claims. Similarly, insurers did not
appear to be sensitive to the assumption of a
proposal of reform of the French CATNAT
scheme, which was incorporated into the
exercise to ensure the stability of the natural
disaster scheme. This triggered an adjustment
from 12% to 18% of the reinsurance of certain
non-life insurance premiums required to fund
the public scheme However, despite this
assumption, no participant modified its
reinsurance strategy.
Most of these management actions were
carried out in a concerted manner within the
participating undertakings, leading to the
convergence of methods used. The choice of
more elaborate management decisions, such
as portfolio reallocation or a change in
reinsurance programmes, would require the
involvement of the management bodies of
insurance groups, which, contrary to what was
done in several banking institutions, were not
involved in this exploratory exercise. Further
reflection is needed to develop methods

Main results of the climate pilot exercise for 2020 54
allowing for the assessment of the actual impact
of scenarios on insurers' practices, notably to
better understand the insurability risk related to
climate change.
30-year projection and re-issuing as
performing of the exposures at default of
banking institutions
Due to the long-term horizon of the exercise,
significant adaptation was required to the
methodology used in the biannual stress tests
organised by the European Banking Agency. In
these exercises, as the projection horizon is
limited to three years, it is assumed that
exposures at default reaching their maturity are
reissued as defaulted. As the pilot scenarios of
the ACPR cover 30 years, this assumption
becomes problematic as it creates an artificial
build-up of defaulted exposures. In its pilot
exercise, the ACPR therefore makes the
assumption that exposures at default reaching
their maturity were reissued as performing
ones.
With the exception of one institution, banks
were able to apply this methodological principle
in more or less sophisticated ways depending
on the tools they had available. Several
approaches were observed that aimed at
dealing with this issue: (i) a "simplified"
approach, similar to the methodology presented
by the ACPR and based on the use of a residual
maturity at the entry of default; (ii) a more
"comprehensive" (but more cumbersome)
approach to differentiating between survival in
default, write-off and repayment with specific
calibrations. Some institutions also modified
survival in default in response to the shock
applied to the sector.
Chart 29 shows that these methodological
differences make it difficult to compare
provision stocks across institutions. However,
they only have a moderate impact on the
projections of provision flows. It is therefore the
main metric retained and discussed in this
publication.
Chart 29 - Stock of provisions vs accumulated flows of provisions
Note: The graph shows, for two banks representing each type of approach ("simplified" or "full"): i) the evolution of the provisioning stock; ii) the cumulative provisioning flows for each time interval that are added to the provisioning stock at the starting point. When the two curves merge, this means that past provisions remain integrated until the end of the financial year in the provision stock even when the associated exposure no longer exists.
Source: ACPR
Treatment of sectoral impacts
While insurers simply applied the assumptions
provided in the portfolio valuation scenarios
according to the business sector considered,
various approaches were retained by credit
institutions to deal with the differentiated nature
of impacts depending on economic activities.
Some have integrated sectoral differentiation by
substituting, in existing models, and for a given
business activity, the GDP shock for the
0
100
200
300
400
500
600
700
2019 2025 2035 2040 2050
Complete approach (stock 2019 + cumulated flows)
Complete approach (stocks)
Simplified appraoch (stock 2019 + cumulated flows)
Simplified approach (stocks)

Main results of the climate pilot exercise for 2020 55
corresponding sector’s value-added shock. For
other banks, a sectoral overlay was added,
often using a multiplier (or a change upfront in
the IFRS9 buckets distribution for a given
sector) that were applied to the output of
existing models. These multiplier factors can be
produced using a quantitative model or by
sector experts. Finally, some institutions simply
differentiated the starting points but applied a
common stress factor across sectors. It should
also be noted that projections for SMEs were
not always differentiated on a sectoral basis.
To some extent, differences in methodology
may explain variations across institutions. Chart
30 below shows that relatively unaffected
sectors have growth rates for probabilities of
default, projected by different institutions, which
are quite similar. Conversely, the sectors most
affected by the scenarios have very different
dynamics depending on the institution that
projected them. The methodological approach
used in the calculation of sectoral impacts is
therefore likely to have an impact on the level of
projections on probability of default. One action
to be carried out as a follow-up to this exercise
will therefore be the assessment of the various
approaches taken by institutions and the issue
of methodological recommendations.
Chart 30 - PiT PD developments - Accommodation and food services (I) and Chemical Industry (C20) according to the various banking groups
Note: the chart on the left-hand side shows the evolution of the probability of default (weighted average for all geographical areas) of the accommodation and catering sector (I) and the one on the right-hand side shows the evolution of the probability of default for the chemical industry sector (C20).
Source: ACPR
0,50
0,70
0,90
1,10
1,30
1,50
1,70
1,90
2,10
2,30
2,50
Orderly 2050 Delayed 2050 Sudden 2050
PD PiT Accomodation and food servicesOrderly 2025 = 1
0,50
0,70
0,90
1,10
1,30
1,50
1,70
1,90
2,10
2,30
2,50
Orderly 2050 Delayed 2050 Sudden 2050
PD PiT Chemical productsOrderly 2025 = 1

Main results of the climate pilot exercise for 2020 56
Annexes
ANNEX A - List of institutions that participated in the ACPR pilot exercise
1. Banking groups participating in the 2020 climate pilot exercise
Banking Group Business model
AGENCE FRANÇAISE DE DÉVELOPPEMENT Public Development Bank
BNP PARIBAS Universal Bank
BPCE Universal Bank
CAISSE DES DÉPÔTS Public Development Bank
CREDIT AGRICOLE Universal Bank
CREDIT MUTUEL Universal Bank
LA BANQUE POSTALE Public retail bank
SOCIÉTÉ GÈNÉRALE Universal Bank
SOCIÉTÉ DE FINANCEMENT LOCALE Public Development Bank

Main results of the climate pilot exercise for 2020 57
2. French insurers that participated in the 2020 climate pilot exercise
Insurance organisations Life/non-life/mixed
ACM IARD Non-life
ACM Vie Life
AESIO Non-life
ALLIANZ IARD Non-life
AXA Mixed
BNP PARIBAS CARDIF Life
BPCE Assurances Non-life
BPCE Vie Life
CCR Reinsurer
CNP Mixed
CREDIT AGRICOLE ASSURANCE Mixed
GMF Assurances Non-life
GROUPAMA Mixed
MAAF Assurances Non-life
MAAF Santé Non-life
MACIF Apivia Mixed
MACIF SAM Non-life
MAIF Non Vie Non-life
MAIF Vie Life
MMA IARD Non-life
SCOR Reinsurer
SOGECAP Life
Source: ACPR

Main results of the climate pilot exercise for 2020 58
ANNEX B - NACE sectoral grouping
The ACPR’s pilot exercise is based on a detailed segmentation of the corporate portfolio. Institutions
were asked to carry forward credit risk projections for 22 sectors or groups of sectors deemed relevant
for the transition risk analysis. These sectors are identified within the meaning of the European economic
activities classification NACE rev2. With the aim of isolating the contribution of sectors depending on
their vulnerability to transition risk, the ACPR in this publication grouped the sectors as follows:
Sensitive sectors
The sectors sensitive to transition risk correspond to the seven sectors or groups of NACE sectors
whose value added deteriorates significantly in the scenarios provided by the Banque de France /
ACPR. These sectors correspond to the following economic activities:
Sensitive sectors NACE code
Crop and animal production, hunting and related service activities A01
Mining and quarrying B
Manufacture of coke and refined petroleum products C19
Manufacture of chemicals and chemical products C20
Manufacture of other non-metallic mineral products C23
Manufacture of basic metals C24
Sewerage; waste collection, treatment and disposal activities; materials recovery; remediation activities and other waste management services
E37-39
Other interest sectors
The other interest sectors correspond to 13 other NACE sectors which are not classified as sensitive
but which were selected on the basis of their importance in the institutions’ portfolio and also taking into
account that the scenarios might not fully reflect the vulnerability of some sectors to the transition risk
(e.g. air transport).
Other sectors of interest NACE code
Manufacture of food products, beverages and tobacco products C10-C12
Manufacture of rubber and plastic products C22
Manufacture of fabricated metal products, except machinery and equipment
C25
Manufacture of motor vehicles, trailers and semi-trailers C29
Electricity, gas, steam and air conditioning supply D35
Construction F
Wholesale and retail trade and repair of motor vehicles and motorcycles
G45
Wholesale trade, except of motor vehicles and motorcycles G46
Retail trade, except of motor vehicles and motorcycles G47
Land transport and transport via pipelines H49
Air Transport H51
Accommodation and food service activities I
Administrative and support services activities N

Main results of the climate pilot exercise for 2020 59
Other sectors
The residual corporate exposures assigned to a NACE code were then grouped into a common segment
("other business activities").
Unallocated exposure
Corporate exposures not assigned to a NACE code (often SMEs/VSEs) were grouped in a common
segment ("not allocated").

Main results of the climate pilot exercise for 2020 60
ANNEX C - Assumptions for the evolution of the insurance coverage gap
The assumptions used to calibrate the evolution
of the gap between the total economic losses
due to climate change scenarios and the losses
covered by insurance are based, on the one
hand, on ad hoc assumptions on the evolution
of claims at the global level by 2050, established
on the basis of external data and, on the other
hand, in the case of France, on the evolution of
claims (drought, floods, marine submersion) by
2050, based on the IPCC's RCP 8. 5 scenario
and on simulations by Météo-France and the
JRC.
1. Assumptions regarding the evolution of
the global insurance gap
The assumptions are based on data published
by the reinsurer Swiss-Re. In particular, it is
assumed that past trends will continue, namely:
・A tripling of total losses due to natural disasters
between 2014 and 2054, as observed over the
previous four decades, resulting in an
exponential evolution of losses to reflect the
nonlinear impact of climate change on the
frequency and cost of extreme weather events;
・A continuation of the trend observed over the
last four decades in the evolution of insured
amounts.
・The insurance coverage gap is the difference
between the two (see Chart below).
Chart 31 - Insurance coverage gap (% of world GDP)
Source: Swiss Re, ACPR
2. Assumptions on the evolution of the
protection gap in France
For France, which has a ratio of uncovered
losses to total economic losses close to the
European average, it is assumed that this ratio
also increases by almost 4 points between 2019
and 2050. Covered losses include the recourse
to the natural disaster scheme.
The evolution of this protection gap by
department is assumed to be a function of the
relative dynamics of losses compared to the
national average, based on the IPCC RCP 8.5
scenario and the exercise carried out by the
Caisse Centrale de Réassurance in 2018.
The distribution between households and
businesses is based on 2018 data, with
agricultural losses reallocated to the household
sector. This allocation is assumed to be
constant over time.
The assumptions for the variation in the
insurance protection gap by department
between 2019 and 2050 are presented in the
chart below. This variation corresponds to the
difference in the ratio of uncovered losses to
total economic losses between 2019 and 2050.
0
0,1
0,2
0,3
0,4
0,5
0,6
0,7
0,8
0,9
1975-1984 1985-1994 1995-2004 2005-2014 2015-2024* 2025-2034* 2035-2044* 2045-2054*
Ecart de protection en assurance (en % du PIB Mondial)
Pertes assurées Pertes non assurées Pertes totales

Main results of the climate pilot exercise for 2020 61
Chart 32 - Ad hoc assumptions on the evolution of the insurance protection gap (2019 - 2050)
Source: ACPR
4.1
3.7
3.3
3.9
4.2
3.4
2.5
3.5
3.2
4.3
4.1
2.9
3.7
4.6
2.7
3.84.1
3.2
2.3
4.3
4.7
3.8
3.4
4.2
2.8
4.2
4.05.0
7.7
7.7
3.4
4.3
3.7
4.7
4.1
5.9
3.2
4.2
3.4
3.8
4.0
4.0
3.3
3.5
5.6
4.0
3.2
3.52.4
5.6
3.44.4
3.64.8
3.5
3.8
4.9
3.5
3.3
3.9
4.2
3.9
3.9
3.9
3.7
3.0
3.4
3.7
3.2
4.0
3.2
3.8
4.2
2.7
3.3
3.9
4.5
4.0
4.1
4.2
3.5
3.9
4.5
2.7
4.14.7
3.9
3.1
3.9
3.7
4.5
4.7
4.2
Evolution (%)(7.5,8.5](6.5,7.5]
(5.5,6.5](4.5,5.5](3.5,4.5](2.5,3.5][1.5,2.5]
Ecart de Protection Assurentielle (2019-2050)