Embed Size (px)
Citation preview
Marine and River Dune Dynamics - M ARIDIV- 15 & 16 April 2013 - Bruges, Belgium
A first phase in the habitat classification for the Zeeschelde: Bed form classification.
G.R. Vos®2\ T. Maximova®, Y.M.G. Plancke®, A. Van Braeckel®, R. De Sutter®
1. Flanders Hydraulics Research, Antwerpen, Belgium - [email protected]. Antea Group, Antwerpen, Belgium - [email protected]. Instituut voor Natuur- en Bosonderzoek, Brussel, Belgium - [email protected]
AbstractWithin the scope of the long term vision of the Schelde Estuary and the Development Outline 2010 low dynamic intertidal and shallow water areas are considered to be of high ecological value. Little is known about the occurrence of such valuable areas in the Schelde Estuary, nor are the physical and morphological processes which determine the occurrence of these areas fully understood. Based on the results and recommendations of a 2008- 2009 research project in the Westerschelde, a new research project was defined to determine relationships between abiotic (bedforms, hydrodynamics, sediment) and biotic (benthos) characteristics in the Zeeschelde (Belgium) and to set up a classification of deep and undeep subtidal areas. A first phase in the habitat classification comprises of the analysis of bed form occurrence and the setup of a bed form classification based on multibeam echo sounding data. Results show within the different sub areas a variation in bed forms going from hard bed layers to no bed forms to ripples (H ~ 0,1 to 0,3 m | L ~ 10 m) and smaller dunes (H ~ 0,5 to 1 m | L ~ 15 to 25 m). On-going research investigates relationships between the bed form characteristics and flow and sediment characteristics. Preliminary results show weak relationships between flow velocity and bed form size, and between depth and bed form size.
1 INTRODUCTIONWithin the scope of the long term vision of the Schelde Estuary and the Development Outline 2010, low dynamic intertidal and shallow water areas are considered to be of high ecological value. These areas are in fact linked to eutrophic foraging zones for birds and young fish and to refugees for tidal migrators as shrimps. However, this assumption is based on experiences in other areas and there is no evidence that all parts of the shallow water area are equally valuable. Little is known about the occurrence of such valuable areas in the Schelde estuary, nor are the physical and morphological processes which determine the occurrence of these areas fully understood. Therefore, a research project was defined in 2008- 2009 to investigate the relation between on one hand the bed forms, hydrodynamics and sediment properties and on the other hand the ecological value of the shallow water areas (Plancke, Y. 2009). This ‘Walsoorden’ research project was conducted by NIOZ-CEME in collaboration with Flanders Hydraulics and IMARES, focused on the area near the Walsoorden Sandbar in the Westerschelde (the
Netherlands). This study resulted in a criterion based on abiotic parameters (depth and duration during a full tidal cycle in which flow velocity exceeds 65 cm/s) that was able to predict habitats with a high ecological value. Where this criterion was found for only one specific area of the Schelde Estuary, a validation is necessary. Therefore 2 new studies were started: one to validate the criterium in the Westerschelde, a second one to validate it in the Zeeschelde. This paper describes the results of the abiotic analysis in the Zeeschelde, the Belgian upstream part of the Schelde Estuary. In a first phase a bed form classification was made for 4 specific subareas (spread over the full salinity gradient), based on multibeam echo sounding data. In a second phase the hydrodynamics were analyzed, while in the third phase it was investigated whether relations existed between bed form and hydrodynamic characteristics.
2 BED FORM ANALYSIS
2.1 Study area and used dataWithin the Zeeschelde detailed research has beenconducted in 4 subareas. These subareas were
315
Marine and River Dune Dynamics - M ARID IV - 15 & 16 April 2013 - Bruges, Belgium
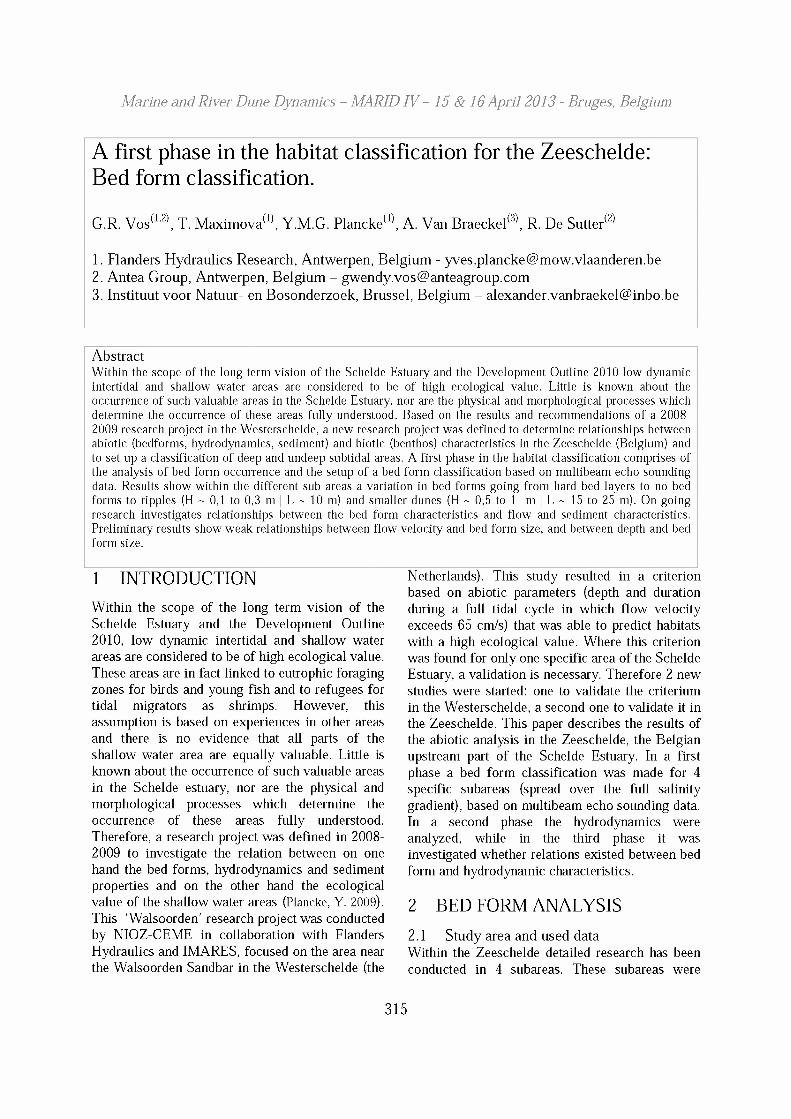
selected based on the salinity zones in the Zeeschelde and the occurrence of a vast undeep water area. The selected subareas are:
• Mesohaline: Schaar van Ouden Doei andGalgenschoor area
• Oligohaline: Notelaer and Ballooi area• Freshwater with long residence time:
B ranst area• Freshwater with short residence time :
Appels areaW alsoordenHabitatmapping V\festerschelde 2008-2009
Ouden Doei & G algeschoor M esohaline
Notelaer & Ballooi Oligohaline
BranstFreshw ater with long residence time
AppelsFreshw ater with short residence time
Figure 1. Location of analyzed subareas in the Schelde estuary
The bathymetry of the mesohaline area in the Beneden-Zeeschelde is based on multibeam echo sounding measurements from 2011, the bathymety for the more upstream areas in the Boven- Zeeschelde is composed of data from 2009, 2010 and 2011. For the intertidal area LIDAR data from 2011 is used.
2.2 MethodologyThe analysis was executed using the following steps:
1 Visual classification in zones, starting from the shaded view image of the area
2 Selection of zones without bed forms3 Definition of several longitudinal transects
(along the direction of the flow) within each zone with bed forms
4 Analysis of average bed form characteristics in each transect such as length, height, asymmetry and steepness of the bed forms
5 Classification of the sub area in a limited amount of bed form classes
2.2.1 Visual classification in sub areasA so-called ‘shaded view’ map was used as a base for the visual classification in sub areas. This computer-generated map shows a simulated cast shadow of sun upon a raised bathymetry. The angle of the sun on the bathymetry has been chosen to discern the bed forms optimally. The optimal angle was found to be parallel to the direction of the flow, because the direction of bed forms is expected to be perpendicular to the direction of the flow.Based upon this ‘shaded view’ images, different sub areas were delimited (see zoom detail in Figure 3). Boundaries were defined visually in those places where differences in bed forms appeared to occur.
2.2.2 Selection of zones without bed forms While determining the zones without bed forms, a distinction was made between flat zones and zones with irregular bed forms (caused by geological hard layers or human interference such as sediment disposal or extraction). This distinction is not always clear on the basis of topo-bathymetric maps. Especially the recognition of hard layers, which can have both irregular and a flat appearance, is often difficult. The in situ sediment sampling campaign that has been conducted in the scope of this research, will make this distinction more clear.
2.2.3 Definition of longitudinal transects Within every subarea some longitudinal transects were defined, assuming that these sections are representative for the whole subarea. If possible, the length of the transects was chosen long enough to ensure a sufficient number of bed forms within one transect, in order to be able to conduct a representative analysis. The depth values of these
316
Marine and River Dune Dynamics - MARIDIV - 15 & 16 April 2013 - Bruges, Belgium
sections were exported from a lm *lm raster covering the study area using GIS-software.
2.2.4 Analysis of the transects to obtain bed form characteristics
For every longitudinal transect following characteristics were deduced:
• Length of the individual bed forms• Height of the individual bed forms• Asymmetry of the individual bed forms• Average steepness of the bed forms per
transect
« Crest ■ ^ ■ - T ransecto Trough Floating Average• Intersections for filtering , , , , — ,--------- ,----------- ,------
480 500 520 540 560 580 600 620 640 660 680distance (m)
-7.5
-8
-8.5
-9
-9.5Ldstr Lustr
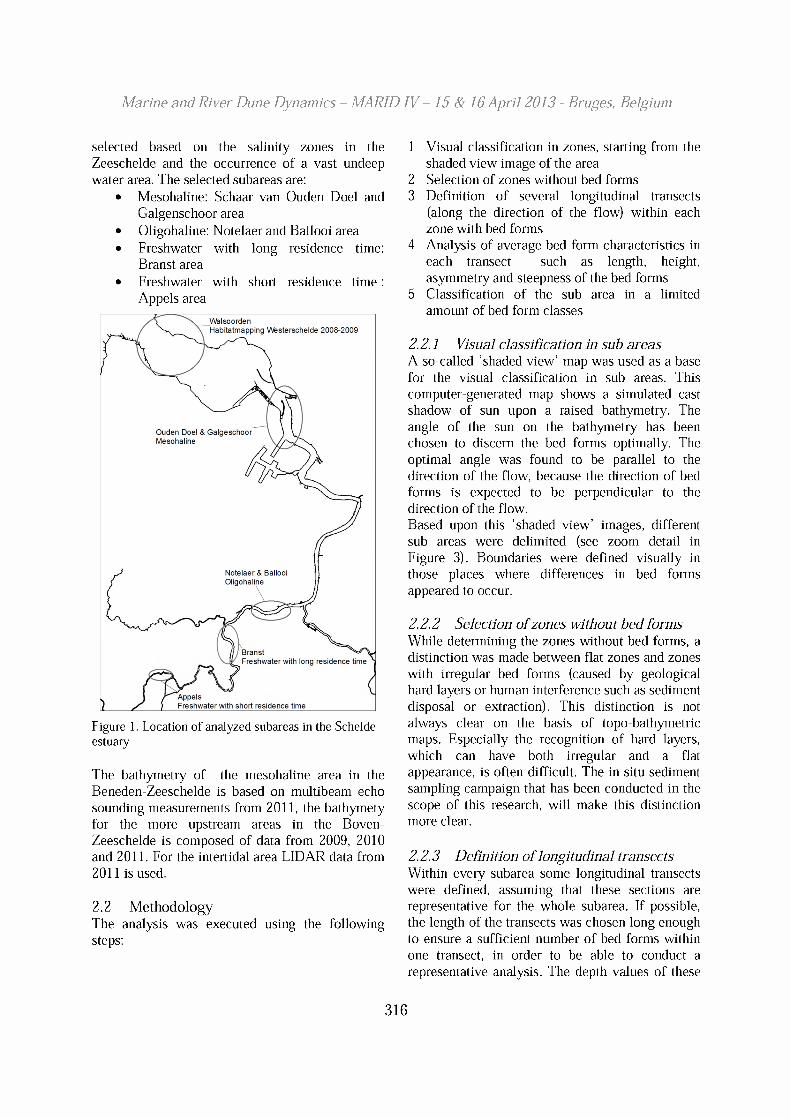
Figure 2. Methodology for determining characteristicparameters, above: step 1 - 4 , below: step 5 - 7
This analysis was executed using a self-developed Matlab routine, based on the methodology used in the Bed form Tracking Tool (van der Mark et al. 2007). This routine consists out of the following steps to define the characteristic parameters of the bed forms in a certain transect (Figure 1) :1 Choosing a period for a floating average to
remove trends (large scale depth variation)
from the section without losing the individual bed forms.
2 Detrending of the section by subtracting the floating average from the original data.
3 Determining the intersections of the detrended signal and the zero-line.
4 Determining the crests and troughs, based upon the assumption that between two intersections with the zero-line, a crest or a trough can be found.
5 Determining the length of every individual bed form, defined as the distance between 2 successive crests.
6 Determining the height of every individual bed form, defined as the difference between the height of a crest and the following trough.
7 Determining the asymmetry of every individual bed form, defined as the ratio between the inclination length (Ldstr) and the declination length (Lustr) of the bed form (from trough to trough).
8 Determining the average steepness per transect, defined as the ratio between the average height and the average length of the bed forms (from trough to trough) in that section.
Next, the characteristics of the individual bed forms were averaged per transect. The resulting average values for length, height and asymmetry were filtered to minimize outlier-effects: all values outside the interval [0,25*average: l,75*average] were discarded and a new average was calculated using the remaining values.The transects were always defined from down- estuary to up-estuary side. Thus, an asymmetry value greater than 1 implies a bed form where the seaward side is longer than the landward side. This indicates flood dominance. A value smaller than 1 indicates ebb dominance.
2.2.5 Classification of the study area in a limited amount of bed form classes
In order to group the different sub areas in a feasible amount of classes, the averaged characteristics were compared and classified according to the classification used in the 2008- 2009 Walsoorden research project, which makes it easier to compare results of the Zeeschelde research project with those of the Westerschelde research project.
317
Marine and River Dune Dynamics - M ARID IV- 15 & 16 April 2013 - Bruges, Belgium
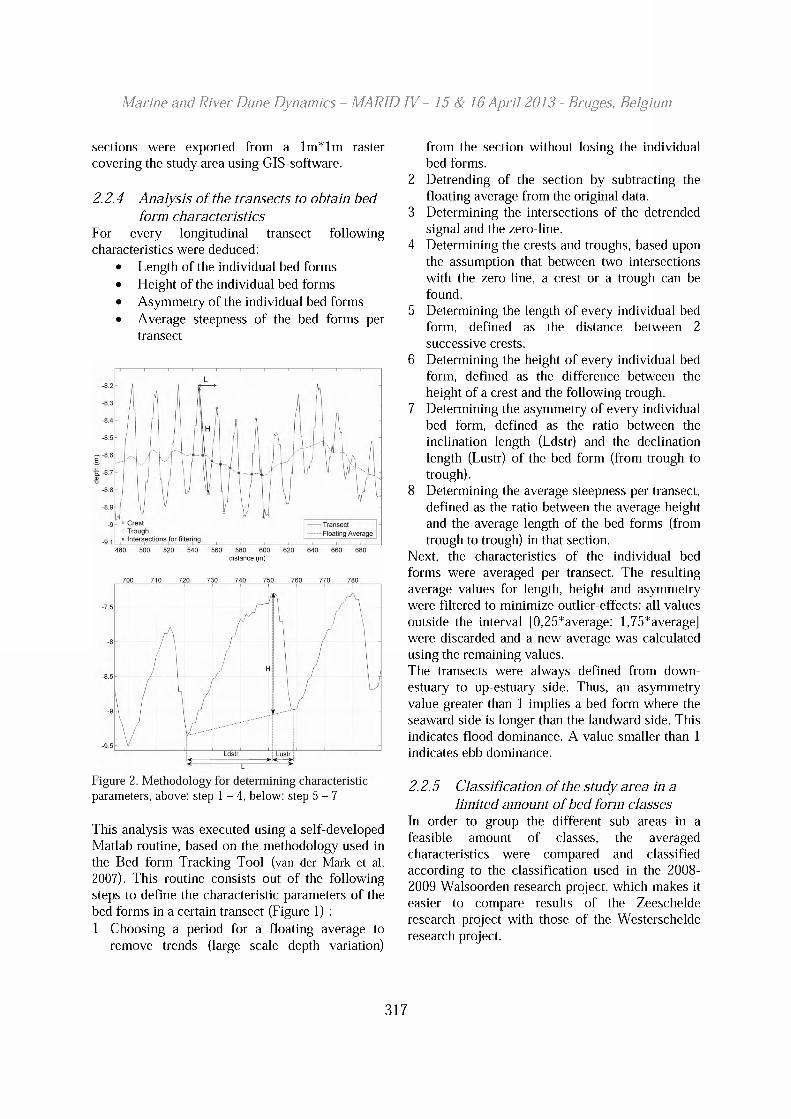
Class Length Height1 < 10 m < 5 cm2 - 10 m 15 - 30 cm3 1 0 - 15 m 30 - 50 cm4 15 - 25 m 50 - 100 cm5 1 5 -3 0 m 100 - 150 cm6 > 30 m > 150 cm7 > 30 m < 100 cm
Table 1 : Overview of length/height classes
Table 1 shows the classification based on length and height of the bed forms, table 2 shows an overview of the asymmetry classes.
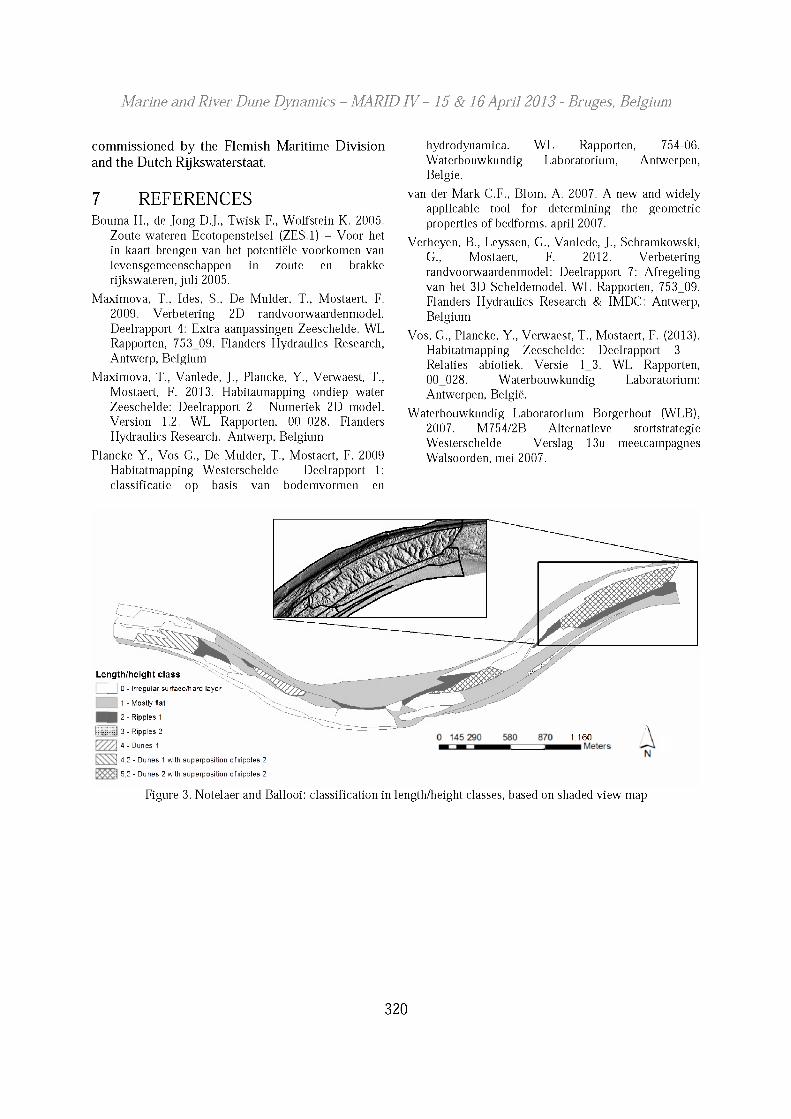
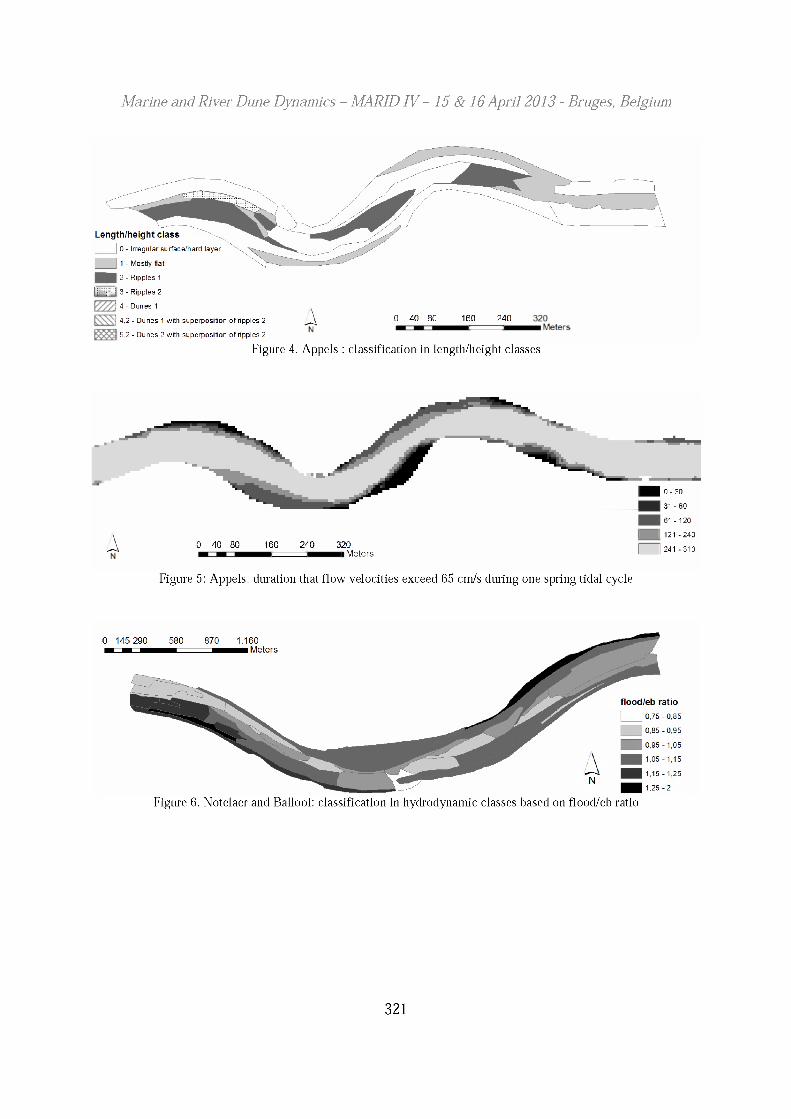
2.3 ResultsBased on the mean length, height and asymmetry of the bed forms per transect, each of the zones is attributed to one of the bed form and asymmetry classes. A class 0 is also defined, holding the zones with irregular bed-surface. Where small bed forms are superposed on larger ones (e.g. dunes of class 5 with superposition of ripples of class 2), a combined class number is attributed (e.g. class 5,2). In figure 3 an example of the length/height classification for the subarea Notelaer/Ballooi can be found, figure 4 shows the length/height classification for the upstream subarea Appels.
The most downstream subareas Ouden Doei and Galgeschoor in the Beneden-Zeeschelde are strongly influenced by human interference (disposal/sand extraction). This means only few zones contain bed forms, which makes it difficult to draw general conclusions on the occurrence of bed forms. Most of the bed forms in this area are small ripples (class 2).In the other sub areas, in the upstream Boven- Zeeschelde, bed form characteristics are more diverse. Next to zones with small ripples, sub areas Notelaer/Ballooi and Branst also contain dunes and dunes with superimposed ripples. In most upstream sub area Appels no dunes can be found, but ripples from class 3 are present, next to the small class 2 ripples.
It was noticed that most of the classes with bed forms are located in the deeper, central parts of the river.
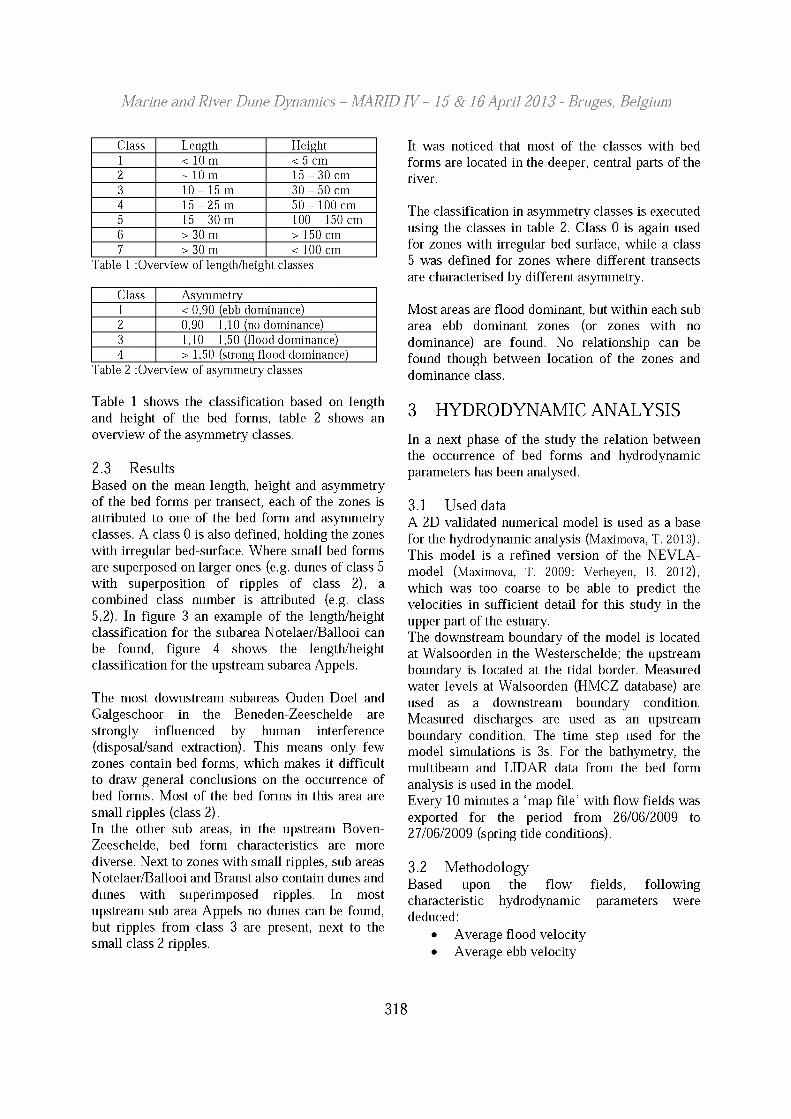
The classification in asymmetry classes is executed using the classes in table 2. Class 0 is again used for zones with irregular bed surface, while a class 5 was defined for zones where different transects are characterised by different asymmetry.
Most areas are flood dominant, but within each sub area ebb dominant zones (or zones with no dominance) are found. No relationship can be found though between location of the zones and dominance class.
3 HYDRODYNAMIC ANALYSISIn a next phase of the study the relation between the occurrence of bed forms and hydrodynamic parameters has been analysed.
3.1 Used dataA 2D validated numerical model is used as a base for the hydrodynamic analysis (Maximova, T. 2013). This model is a refined version of the NEVLA- model (Maximova, T. 2009; Verheyen, B. 2012), which was too coarse to be able to predict the velocities in sufficient detail for this study in the upper part of the estuary.The downstream boundary of the model is located at Walsoorden in the Westerschelde; the upstream boundary is located at the tidal border. Measured water levels at Walsoorden (HMCZ database) are used as a downstream boundary condition. Measured discharges are used as an upstream boundary condition. The time step used for the model simulations is 3s. For the bathymetry, the multibeam and LIDAR data from the bed form analysis is used in the model.Every 10 minutes a ‘map file’ with flow fields was exported for the period from 26/06/2009 to 27/06/2009 (spring tide conditions).
3.2 MethodologyBased upon the flow fields, following characteristic hydrodynamic parameters were deduced:
• Average flood velocity• Average ebb velocity
Class Asymmetry1 < 0,90 (ebb dominance)2 0,90 - 1,10 (no dominance)3 1,10 - 1,50 (flood dominance)4 > 1,50 (strong flood dominance)
Table 2 : Overview of asymmetry classes
318
Marine and River Dune Dynamics - MARIDIV - 15 & 16 April 2013 - Bruges, Belgium
• Ratio average flood velocity to average ebb velocity
• Maximum flood velocity• Maximum ebb velocity• Duration that flow velocities exceed 65
cm/s during one spring tidal cycle (figure 5 shows the duration map for Appels).
Similar to the bed form analysis, the hydrodynamic analysis was performed using 2 types of classification: first a classification based on the magnitude of average velocities, second a classification based on the ratio between average velocities.For the first classification, the used boundary values are related to characteristic velocity boundaries for e.g. initiation of sediment transport (Flanders Hydraulics Research, 2007) and low versus high dynamic conditions (Bouma et al., 2005). For every point in the flow field, ebb as well as flood velocity has been classified using these boundary values. Based on the combination of ebb and flood velocity the eventual classification is made (see Table 5).
Table 5: Classification based on hydrodynamic characteristics.
3.3 ResultsThe hydrodynamic analysis shows as can be expected an increase of velocities with increasing depth. The duration during which flow velocities are higher than 65 cm/s exceeds 240 minutes almost everywhere, except along the river banks and on the leeward side of the guiding wall. Flood/ebb ratio shows a similar pattern in all sub areas, namely an alternating pattern of ebb and flood dominated zones along each river bank.
4 ON-GOING RESEARCHBased on the bed form classification the Research Institute for Nature and Forest has taken ca. 200 samples, stratified random over the different
classes and subareas. At this moment the samples are being analysed on both grain size and the density and number of benthic species. These results will be used to investigate potential relations between abiotic characteristics presented in this paper, and biotic characteristics.
5 CONCLUSIONSBased on the bed form classification and hydrodynamic classification a relationship between both aspects has been investigated. Therefore the hydrodynamic characteristics were attributed to the bed form classes by calculating the average value per bed form zone for each of the hydrodynamic parameters. Figure 6 shows an example of the classification, based on the ratio between average flood and ebb velocity.
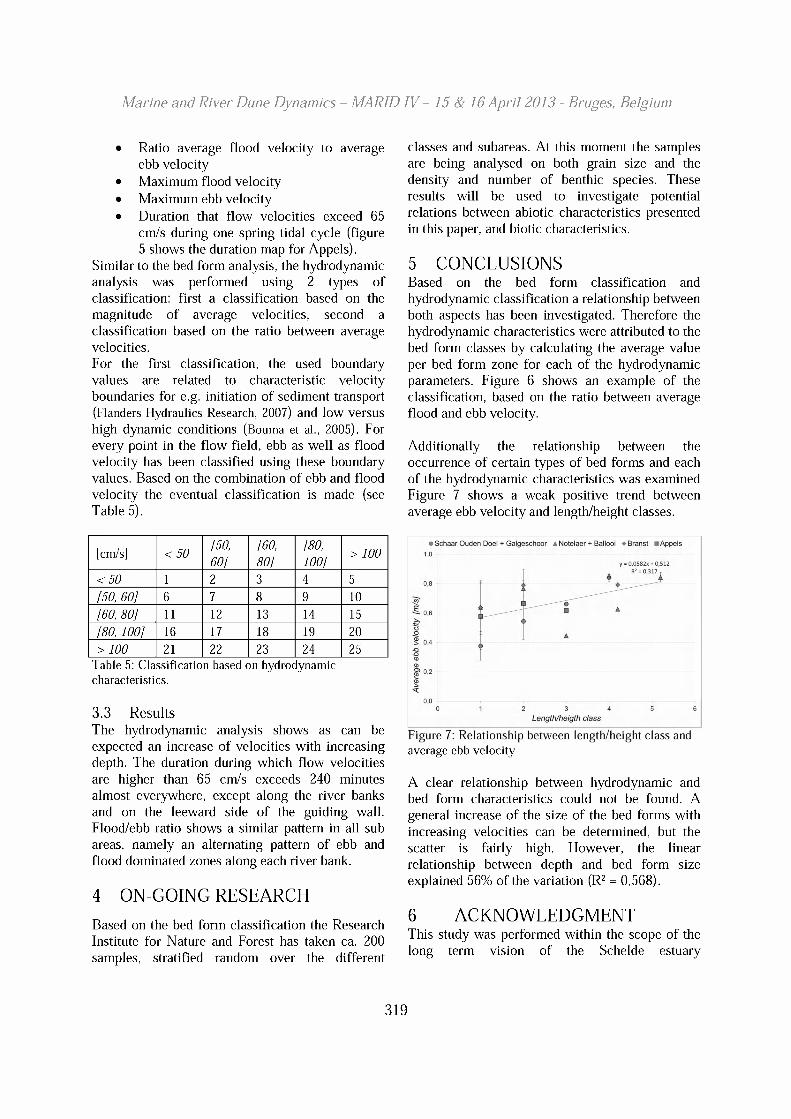
Additionally the relationship between the occurrence of certain types of bed forms and each of the hydrodynamic characteristics was examined Figure 7 shows a weak positive trend between average ebb velocity and length/height classes.
• Schaar Ouden Doei + Galgeschoor ▲ Notelaer + Ballooi ♦Branst «Appels
y = 0,0582x + 0,512 R2 = 0,317 r
0,0
Length/heigth class
Figure 7: Relationship between length/height class andaverage ebb velocity
A clear relationship between hydrodynamic and bed form characteristics could not be found. A general increase of the size of the bed forms with increasing velocities can be determined, but the scatter is fairly high. However, the linear relationship between depth and bed form size explained 56% of the variation (R2 = 0,568).
6 ACKNOWLEDGMENTThis study was performed within the scope of the long term vision of the Schelde estuary
[cm/s] <50 [50,60]
[60,80]
[80,100]
>100
<50 1 2 3 4 5[50, 60] 6 7 8 9 10[60, 80] 11 12 13 14 15[80, 100] 16 17 18 19 20> 100 21 22 23 24 25
319
Marine and River Dune Dynamics - M ARID IV- 15 & 16 April 2013 - Bruges, Belgium
commissioned by the Flemish Maritime Division and the Dutch Rijkswaterstaat.
7 REFERENCESBouma H., de Jong D.J., Twisk F., Wolfstein K. 2005.
Zoute wateren Ecotopenstelsel (ZES.l) - Voor het in kaart brengen van het potentiële voorkomen van levensgemeenschappen in zoute en brakke rijkswateren, juli 2005.
Maximova, T., Ides, S., De Mulder, T., Mostaert, F. 2009. Verbetering 2D randvoorwaardenmodel. Deelrapport 4: Extra aanpassingen Zeeschelde. WL Rapporten, 753 09. Flanders Hydraulics Research, Antwerp, Belgium
Maximova, T., Vanlede, J., Plancke, Y., Veiwaest, T., Mostaert, F. 2013. Habitatmapping ondiep water Zeeschelde: Deelrapport 2 - Numeriek 2D model. Version 1.2. WL Rapporten, 00_028. Flanders Hydraulics Research. Antwerp, Belgium
Plancke Y., Vos G., De Mulder, T., Mostaert, F. 2009 Habitatmapping Westerschelde - Deelrapport 1: classificatie op basis van bodemvormen en
hydrodynamica. WL Rapporten, 754-06. Waterbouwkundig Laboratorium, Antwerpen, Belgie.
van der Mark C.F., Blom, A. 2007. A new and widely applicable tool for determining the geometric properties of bedforms. april 2007.
Verheyen, B., Leyssen, G., Vanlede, J., Schramkowski, G., Mostaert, F. 2012. Verbetering randvoorwaardenmodel: Deelrapport 7: Afregeling van het 3D Scheldemodel. WL Rapporten, 753J39. Flanders Hydraulics Research & IMDC: Antwerp, Belgium
Vos, G., Plancke, Y., Veiwaest, T., Mostaert, F. (2013). Habitatmapping Zeeschelde: Deelrapport 3 -Relaties abiotiek. Versie 1 3 . WL Rapporten, 00 028. Waterbouwkundig Laboratorium: Antwerpen, België.
Waterbouwkundig Laboratorium Borgerhout (WLB), 2007. M754/2B Alternatieve stortstrategieWesterschelde - Verslag 13u meetcampagnes Walsoorden, mei 2007.
1.160
L ength/height c la ss^ 0 - Irregular surface/hard layer
I 1 - Mostly flat
I 2 - Ripples 1
m u n i n 3 - r¡ppi e s 2
] 4 - Dunes 1
] 4,2 - Dunes 1 with superposition of ripples 2
j 5,2 - Dunes 2 with superposition of ripples 2
Figure 3. Notelaer and Ballooi: classification in length/height classes, based on shaded view map
320
Marine and River Dune Dynamics - M ARID IV- 15 & 16 April 2013 - Bruges, Belgium
Length /heigh t c la ssI 0 - Irregular surface/hard layer
I 1 - Mostly flat
I 2 - Ripples 1
minim 3 - Rippi e s 2
] 4 - Dunes 1
] 4,2 - Dunes 1 with superposition of ripples 2
j 5,2 - Dunes 2 with superposition of ripples 2
Figure 4. Appels : classification in length/height classes
A 0 40 80 160 2 4 0
A 0 40 80 160 240 320 ■ M eters
IHI 0 - 3 0
31 - 60
61 - 120
1 1 121 -240
□ 241 -310
Figure 5: Appels: duration that flow velocities exceed 65 cm/s during one spring tidal cycle
0 145 290 580 870 1.160Meters
flood/eb ratio0 ,7 5 -0 ,8 5
0 ,8 5 -0 ,9 5
0,95 -1 ,05
1 ,0 5 -1 ,1 5
1 ,15 -1 ,25
1 ,2 5 -2
Figure 6. Notelaer and Ballooi: classification in hydrodynamic classes based on flood/eb ratio
321