Embed Size (px)
Citation preview
Caregiving in the U.S.
funded by
conducted by in collaboration with
A Focused Look at Those Caring for Someone Age 50 or Older

CAREGIVING IN THE U.S.
A Focused Look at Those Caring for Someone Age 50 or Older
Executive Summary
November 2009
National Alliance for CaregivingIn Collaboration with
AARP
Funded by
The MetLife Foundation
Copyright © 2009 NAC and AARP. May be copied only for noncommercial purposes and with attribution. Permission required for all other purposes.
ii
Acknowledgements
The National Alliance for Caregiving in collaboration with AARP and with funding by MetLife Foundation is proud to present Caregiving in the U.S. A Focused Look at Those Caring for Someone Age 50 or older, a companion report partially based on findings from the Caregiving in the U.S. survey.
Many people played important roles throughout the research process including the fol-lowing:
Gail Gibson Hunt, National Alliance for CaregivingLinda L. Barrett, Ph.D., AARPLinda Naiditch, Mathew Greenwald & AssociatesSusan Lutz, AARP
NAC ADVISORY PANEL
Susie Butler, Centers for Medicare & Medicaid Services (CMS)Lynn Friss Feinberg, National Partnership for Women and FamiliesMarty Ford, The ArcRick Greene, Department of Veterans AffairsRobert Hodapp, Vanderbilt UniversityCarol Levine, United Hospital Fund of New York CityKatie Maslow, Alzheimer’s AssociationMartha Pelaez, International Consultant on Aging and HealthRuth Stein, MD, Albert Einstein College of MedicineNancy Vuckovic, IntelDonna Wagner, Ph.D., Towson University
Questionnaire revisions were made by a team representing the National Alliance for Caregiving, AARP and Mathew Greenwald & Associates. AARP funded Mathew Green-wald & Associates to conduct oversamples to match or exceed the numbers attained in 2004 to allow for a robust analysis and tracking of caregiving trends between 2004 and 2009. We would like to thank Linda Naiditch for her assistance. This report was written by Linda L. Barrett, Ph.D. It was reviewed by Teresa A. Keenan, Ph.D., Health Team Lead in AARP’s Knowledge Management. Within AARP, we would also like to thank Liz Bradley, Elinor Ginzler, Robert Hodder, Susan Lutz, Kieun Oh, and Nancy Thompson for their insights and support as well as Jennifer Leslie for preparing the graphics for the ethnic subgroups. For additional information about this study, contact Linda Barrett at 202-434-6197 or [email protected]. This executive summary, along with the full report, is available at www.aarp.org/caregivingus , www.caregiving.org, and www.metlife.org.
iii
Table of Contents
I. Introduction and Summary ........................................................... 1
II. Overview of Methodology ............................................................. 6
III. Key Findings .................................................................................. 8
Prevalence of Caregiving ........................................................... 8
Basics of the Caregiving Situation.............................................. 8
Care Recipient Condition ..........................................................11
Caregiving Activities and Burden of Care ................................. 12
Presence of Other Caregivers .................................................. 18
Care Recipient Living Situation ................................................ 20
Stress and Strain of Caregiving................................................ 24
Impact of Caregiving on Work .................................................. 28
Information Sources and Needs ............................................... 30
Support for Caregivers ............................................................. 33
IV. Summary and Conclusions ........................................................ 37
Respondent Profile ................................................................. 38
Caregiving Questionnaire………………………………………....43
iv
Table of Figures
Figure 1: Respondent Profile Caregivers Age 18+ Caring for Someone Age 50+ .................................................... 5
Figure 2: Estimates of Individual Caregiving Prevalence ......................... 8
Figure 3: Age of Caregiver........................................................................ 9
Figure 4: Duration of Care for Recipient ................................................. 10
Figure 5: Age of Care Recipient ............................................................. 10
Figure 6: Main Problem or Illness Identified by Caregiver .......................11
Figure 7: Types of Care Recipient Conditions ........................................ 12
Figure 8: Hours of Care Provided ........................................................... 12
Figure 9: Help with Activities of Daily Living ........................................... 13
Figure 10: Help with Instrumental Activities of Daily Living .................... 15
Figure 11: Help with Other Supportive Activities..................................... 16
Figure 12: Level of Burden Index ........................................................... 17
Figure 13: Presence of Other Unpaid Caregivers .................................. 18
Figure 14: Primary Caregiver Status ...................................................... 18
Figure 15: Use of Paid Services ............................................................. 19
Figure 16: Predominant Caregiver Among Unpaid and Paid Helpers .... 19
Figure 17: Geographic Area Where Care Recipient Lives...................... 20
Figure 18: Where Care Recipient Lives.................................................. 21
Figure 19: Co-Residence by Level of Burden......................................... 22
Figure 20: Who Care Recipient Lives With............................................. 22
Figure 21: Caregiver Distance from Care Recipient ............................... 23
Figure 22: Caregiver Health ................................................................... 24
Figure 23: Impact of Caregiving on Caregiver’s Health .......................... 24
Figure 24: Physical Strain of Caregiving ................................................ 25
v
Figure 25: Emotional Stress of Caregiving ............................................. 26
Figure 26: Financial Hardship of Caregiving .......................................... 27
Figure 27: Concurrence of Employment and Caregiving........................ 28
Figure 28: Work Accommodations Due to Caregiving ............................ 29
Figure 29: Sources Used for Caregiving Information ............................. 30
Figure 30: Internet Usage ....................................................................... 31
Figure 31: Caregiving Information Sought Online .................................. 31
Figure 32: Caregiving Information Needs ............................................... 32
Figure 33: Use of Services ..................................................................... 33
Figure 34: Use of Services to Ease Care ............................................... 33
Figure 35: Use of Technology in Caregiving ........................................... 34
Figure 36: Reaction to Caregiving-Related Policies ............................. 35
1
C A R E G I V I N G I N T H E U . S . - A F O C U S E D L O O K AT T H O S E C A R I N G F O R S O M E O N E A G E 5 0 O R O L D E R
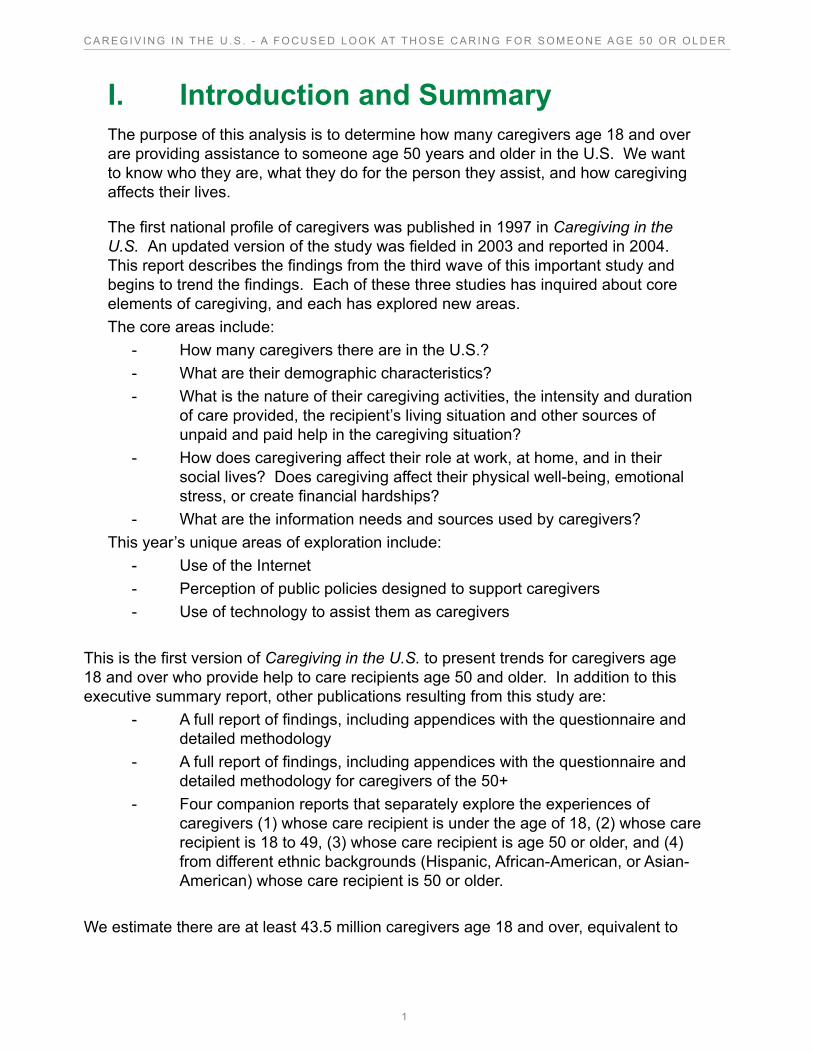
I. Introduction and SummaryThe purpose of this analysis is to determine how many caregivers age 18 and over are providing assistance to someone age 50 years and older in the U.S. We want to know who they are, what they do for the person they assist, and how caregiving affects their lives.
The first national profile of caregivers was published in 1997 in Caregiving in the U.S. An updated version of the study was fielded in 2003 and reported in 2004. This report describes the findings from the third wave of this important study and begins to trend the findings. Each of these three studies has inquired about core elements of caregiving, and each has explored new areas.The core areas include:
- How many caregivers there are in the U.S.?- What are their demographic characteristics?- What is the nature of their caregiving activities, the intensity and duration
of care provided, the recipient’s living situation and other sources of unpaid and paid help in the caregiving situation?
- How does caregivering affect their role at work, at home, and in their social lives? Does caregiving affect their physical well-being, emotional stress, or create financial hardships?
- What are the information needs and sources used by caregivers?This year’s unique areas of exploration include:
- Use of the Internet- Perception of public policies designed to support caregivers- Use of technology to assist them as caregivers
This is the first version of Caregiving in the U.S. to present trends for caregivers age 18 and over who provide help to care recipients age 50 and older. In addition to this executive summary report, other publications resulting from this study are:
- A full report of findings, including appendices with the questionnaire and detailed methodology
- A full report of findings, including appendices with the questionnaire and detailed methodology for caregivers of the 50+
- Four companion reports that separately explore the experiences of caregivers (1) whose care recipient is under the age of 18, (2) whose care recipient is 18 to 49, (3) whose care recipient is age 50 or older, and (4) from different ethnic backgrounds (Hispanic, African-American, or Asian-American) whose care recipient is 50 or older.
We estimate there are at least 43.5 million caregivers age 18 and over, equivalent to
2
C A R E G I V I N G I N T H E U . S . - A F O C U S E D L O O K AT T H O S E C A R I N G F O R S O M E O N E A G E 5 0 O R O L D E R
19 percent of all adults, who provide unpaid care to an adult family member or friend who is age 50 years or older. The percentage of people who are caregivers does not appear to have changed significantly since 2004.1 Most caregivers assist other family members, most commonly their mother.While caregivers and care recipients continue to be predominately female, they are approximately two years older now than their counterparts were five years ago. The average age of today’s caregiver is 50, and the average age of today’s care recipient is 77. While it is tempting to think the group of caregivers interviewed for this study are metaphorically the same caregivers from the last study, only older, the data shows that caregiving is a fluid role that people move into and out of over time. For example, on average, people are caregivers for four years.
Although there has been a decrease in the number of hours of care provided in an average week, a higher proportion of caregivers report helping their care recipient get into and out of beds and chairs, assisting with housework, and preparing meals.
There is also an increase in the proportion of caregivers who say they need help or information. Specific areas of increased need include information on:
• Keeping their recipient safe at home, • Finding easy activities to do with their care recipient, • Choosing a home care agency, an assisted living facility, or a nursing home.
These results suggest good target areas for caregiver interventions.
Caregivers also say they have increased their use of some services (such as outside transportation services for the person they help, and using a respite services or sitters).
Approximately three-fourths of caregivers have worked while caregiving. While this has remained consistent since our last study, there has been an increase in the proportion who say they have had to make a workplace accommodation due to caregiving. For example, there has been an increase in the most common workplace accommodation - having to go into work late, leave early, or take time off during the day to fulfill their caregiving responsibilities. Caregivers who have worked while being a caregiver are also more likely to say they need help balancing their work and family responsibilities which represents another potential area for caregiver interventions.
Time is an important issue for caregivers because this role takes time they could devote to other parts of their life. This situation can be further complicated when the caregiver does not feel she or he had a choice in taking on the role. Four in ten (43%) say they did not feel they had a choice in taking on this role. While caregiving is often a shared responsibility, it is not shared equally. Most caregivers say at least one other person has provided unpaid help to their care recipient in the past year. Among caregivers who say another unpaid caregiver provided help in the last twelve months, only one in ten say they split the care equally. One-third says they are the caregiver who provides most of the unpaid care.
1 The 2009 study used a new method for measuring prevalence of caregiving. However, the methodology used in 2004 was applied to the 2009 findings to estimate if a change in prevalence has occurred. See the detailed findings and the detailed methodology appen-dix for more information. The estimate in 2004 was 16% vs. 18.9% in 2009, not a significant difference.
3
C A R E G I V I N G I N T H E U . S . - A F O C U S E D L O O K AT T H O S E C A R I N G F O R S O M E O N E A G E 5 0 O R O L D E R
Among caregivers who assist someone living in the community, the proportion of those who use paid services has decreased since our last study. However, among those who use paid services, there has been an increase in the proportion who says the paid caregiver provides more of the care recipient’s care. We are more likely to see this happen among caregivers with higher educational and income levels, along with those who have a low or medium level of burden and those who do not live with their care recipient.
Although most caregivers say they experience little physical strain, emotional stress, or financial hardship as a result of being a caregiver, there are indications that caregiving is becoming more emotionally stressful for some, and that some are experiencing more financial hardship fulfilling this role than five years ago.
While two-thirds of caregivers of those 50 and older say it is very or somewhat easy to coordinate their care recipient’s health care professionals or service providers, one-quarter (24%) say they have a very or somewhat difficult time doing so. Caregivers who have a very or somewhat difficult time coordinating their care recipient’s care are more likely to be caring for someone with Alzheimer’s disease, to feel they had no choice in becoming a caregiver, have a high level of burden, and live one hour or more away from their care recipient.
Caregivers say they are likely to turn to health care providers, the Internet / print media, and family / friends / other caregivers for information. However, nearly half of caregivers say they have never gone to an Internet website in the past year to find information in any way related to being a caregiver. Nonetheless, caregivers are using technologies that help them meet their needs without having to go online. For example nearly half report using one of six types of technology we asked about (such as electronic organizers or calendars, emergency response systems, electronic systems that send information to a doctor or care manager and electronic sensors to detect safety problems).2,3
Finally, caregivers tend to support the following caregiving-related policies: a tax credit of $3,000, respite services, a voucher program which pays them a minimum wage to be a caregiver, and transportation services.
Since caregivers are a diverse and ever-changing group, we need to continually reach out to them, over time, with information and services tailored to their needs in a variety of ways including providing information through intermediaries (such as doctors, nurses, case workers, disease-related organizations, friends and family). New technological services will be disseminated that help caregivers and care recipients. While most caregivers say they are doing well, those who are vulnerable may need more than information. The caregivers in this study prefer tax credits, respite services, voucher programs, and transportation services.
When we take a closer look, we find there are many faces of caregiving. Three-fourths,
2 Remote patient monitoring devices are projected to increase 77 percent over the next five years according to a study by ABI Research, Oyster Bay, NY.3 Research shows a willingness to try new technologies that can help both caregiver and care recipient. See Healthy @ Home Using Technology to Remain Independent, AARP, 2008.
4
C A R E G I V I N G I N T H E U . S . - A F O C U S E D L O O K AT T H O S E C A R I N G F O R S O M E O N E A G E 5 0 O R O L D E R
are White (76%). One in ten (10%) is Hispanic and another one in ten (11%) is African-American. Two percent are Asian-American. While there are similarities there are also important differences in these subgroups. We intentionally focused on each group separately so that their uniqueness can shine. Some key points follow:
Hispanic caregivers are an average of 43 years old and are significantly younger than White and African-American caregivers. They are less likely to be married than White caregivers (48% vs. 63%), more likely to say there are children or grand-children currently living in their household under age 18 (47% vs. 32% of all caregivers, 30% of White caregivers, and 30% of African-American caregivers). Hispanic caregivers are more like to be a primary caregiver (61% vs. 48% of White caregivers and 43% of Asian-American caregivers) and more likely to say they have an annual income of under $50,000 (56% vs. 39% of caregivers overall, 34% of White caregivers, and 31% of Asian-American caregivers. Therefore, it is not surprising that Hispanic caregivers are more likely to feel they need help balancing their work and family responsibilities (39% of Hispanic caregiver’s vs. 27% of caregivers overall and 25% of White caregivers) and finding time for themselves (41% vs. 29% White caregivers). While two-thirds have rarely / never gone to an Internet website in the past year to find information related to being a caregiver, more than half (53%) have use one of six technologies in caring for their care recipient. A caregiver tax credit was identified as the most or second most helpful public policy option, followed by respite services.
African-American caregivers are significantly older (48 years old), on average, than Hispanic caregivers. They are more likely to be single-never married (28%) than caregivers overall (15%) or White caregivers (12%). Most African-American caregivers (59%) have an annual household income of less than $50,000 and they are more likely to be in this situation than caregivers overall (39%), White caregivers (34%), or Asian-American caregivers (31%). African-American caregivers (41%) are more likely to provide assistance with three or more ADLs than White caregivers (28%) and Asian-American caregivers (23%). Seven in ten say they have rarely or never gone to Internet websites in the past year to find information in any way related to being a caregiver, yet about half (51%) report using one of six technologies in caring for their care recipient. African-American caregivers are more likely than Hispanic caregivers to support a three thousand dollar tax credit for caregivers. They are also more likely to support a voucher program than White Americans.
Asian-American caregivers are almost equally likely to be male or female. While most are married (58%), significantly more than other caregiving groups are single, never-married (29% vs. 15% of all caregivers and 12% of White caregivers). Asian-Americans are highly educated. They are more likely to be college graduates than other caregiving group (40% vs. 26% of caregivers overall, 26% of White caregivers, and 22% of Hispanic caregivers) and have a relatively high annual income.
5
C A R E G I V I N G I N T H E U . S . - A F O C U S E D L O O K AT T H O S E C A R I N G F O R S O M E O N E A G E 5 0 O R O L D E R
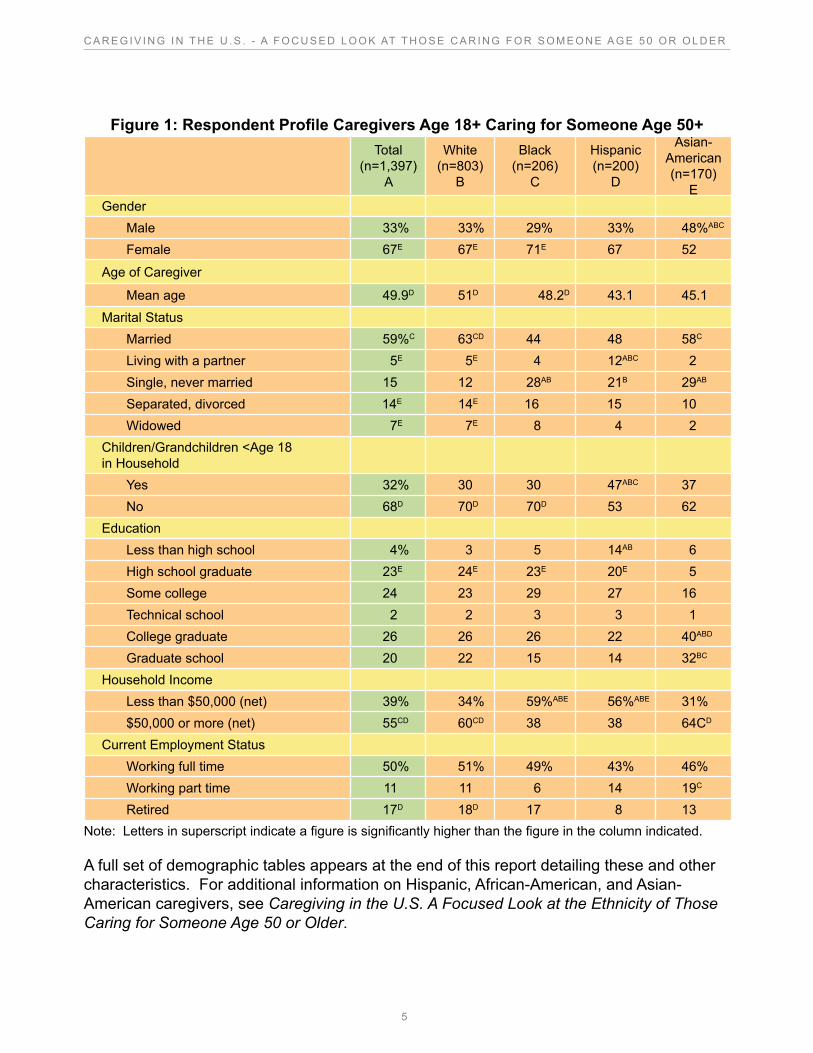
Figure 1: Respondent Profile Caregivers Age 18+ Caring for Someone Age 50+
Total
(n=1,397) A
White (n=803)
B
Black (n=206)
C
Hispanic (n=200)
D
Asian-American (n=170)
EGender Male 33% 33% 29% 33% 48%ABC
Female 67E 67E 71E 67 52
Age of Caregiver
Mean age 49.9D 51D 48.2D 43.1 45.1
Marital Status Married 59%C 63CD 44 48 58C
Living with a partner 5E 5E 4 12ABC 2 Single, never married 15 12 28AB 21B 29AB
Separated, divorced 14E 14E 16 15 10 Widowed 7E 7E 8 4 2Children/Grandchildren <Age 18 in Household Yes 32% 30 30 47ABC 37 No 68D 70D 70D 53 62Education Less than high school 4% 3 5 14AB 6 High school graduate 23E 24E 23E 20E 5 Some college 24 23 29 27 16 Technical school 2 2 3 3 1 College graduate 26 26 26 22 40ABD
Graduate school 20 22 15 14 32BC
Household Income Less than $50,000 (net) 39% 34% 59%ABE 56%ABE 31% $50,000 or more (net) 55CD 60CD 38 38 64CD
Current Employment Status Working full time 50% 51% 49% 43% 46% Working part time 11 11 6 14 19C
Retired 17D 18D 17 8 13Note: Letters in superscript indicate a figure is significantly higher than the figure in the column indicated.
A full set of demographic tables appears at the end of this report detailing these and other characteristics. For additional information on Hispanic, African-American, and Asian-American caregivers, see Caregiving in the U.S. A Focused Look at the Ethnicity of Those Caring for Someone Age 50 or Older.
6
C A R E G I V I N G I N T H E U . S . - A F O C U S E D L O O K AT T H O S E C A R I N G F O R S O M E O N E A G E 5 0 O R O L D E R
II. Overview of MethodologyThis report is based on telephone interviews with 1,397 caregivers who are 18 years of age and over who provide assistance to someone 50 years of age or older. The sample includes just over 800 Whites, approximately 200 African-Americans, 200 Hispanics, and 170 Asian-Americans. Caregivers are those who provide unpaid care to an older adult as described in the following question.
At any time in the last 12 months, including now, have you provided unpaid care to a relative or friend 50 years or older to help them take care of themselves? Caregiving may include help with personal needs or household chores. It might be managing a person’s finances, arranging for outside services, or visiting regularly to see how they are doing. This person does not need to live with you.
Participants were recruited using a variety of appropriate sampling techniques. All of the White non-Hispanic participants were recruited using random digit dialing from the base study reported elsewhere. Most of the base study minority respondents were recruited using targeted samples. In addition, AARP commissioned the development of oversamples to allow us to better understand and compare caregivers assisting older adults. Geographic density samples were used to oversample African-Americans. The Hispanics and Asian-American oversamples required a combination of surname and density sampling. In addition, Knowledge Networks screened their Asian-American panel members to pre-identify Asian-American caregivers. Detailed information about the research methods appears in an appendix of the full report which is available online at www.aarp.org.
The screening results and survey results for the base study are weighted by household, based on the race/ethnicity and age of householder, and type of household (family or non-family) obtained from the initial respondent in each household. Weighting targets were derived from the Current Population Survey 2008 Annual Social and Economic Supplement, conducted by the U.S. Census. The oversample of caregivers of recipients age 50 or older were weighted to the weighted distribution of caregivers age 50 and over in the base sample by householder race/ethnicity, age of the householder, and type of household (family or non-family).
The questionnaire was designed to replicate many of the questions posed in 1997 and 2004 as well as to explore new areas. It was designed by a team from the National Alliance for Caregiving, AARP, and Mathew Greenwald & Associates, and was also shaped by feedback from the advisory board.
Respondents were given the option of conducting the interview in Spanish or English, and 31% of the Hispanic respondents chose to conduct part, or all, of the interview in Spanish. The average length of the interview was 22.3 minutes. The survey data was collected between March 5 and June 17, 2009.
To signal key differences between 2004 and 2009 findings, the report uses an asterisk to
7
C A R E G I V I N G I N T H E U . S . - A F O C U S E D L O O K AT T H O S E C A R I N G F O R S O M E O N E A G E 5 0 O R O L D E R
highlight any percentage that is significantly higher than the comparison figure at the 95 percent level of confidence (occasionally we use capital letters in tables to signal significant differences). With a 95 percent confidence level as a threshold, one can expect that 95 percent of the time the differences identified as statistically significant would not have occurred by chance (i.e., one in twenty of the differences would be due to chance).4 The margin of error at this level is +/-3.2 percent. In order to meaningfully manage subgroup differences, we report subgroup findings at the 99 percent level of confidence. The margin of error for the sub-groups reported in this section (caregivers 18 years of age and older caring for people age 50 and over) is +/-4.2 percent at the 99 percent confidence level.
Reading this Report
The graphics in this report are designed to capture the descriptive information from the current wave of this study side-by-side with the new trend information. Consequently readers should keep in mind that the graphic (pie chart or bar chart) on the left side of the page shows the new data, and the table on the right side of the page represents a “mini” trend comparing the findings from 2004 with 2009. When the text describing the data is on the same page as the chart or table, the proportion is not repeated in the text. If they appear on different pages, the proportion will appear in both places for easy reading and referencing.
All figures have been weighted and rounded. In addition, “don’t know” or “refused” responses are not always presented. For these reasons, some charts and tables will not add to 100 percent. The results for multiple response questions may also add to greater than 100 percent.
When presenting differences between different racial/ethnic groups, any mention of Whites refers solely to non-Hispanic Whites.
When presenting differences among age groups, “young caregivers” refers to caregivers between the ages of 18 to 49, “middle aged caregivers” refers to caregivers between the ages of 50 to 64, and “older caregivers” refers to caregivers age 65 or older.
When talking about the reason the caregiver says the care recipient need assistance, the term Alzheimer’s disease or Alzheimer’s also includes care recipients the caregiver may have classified as having confusion, dementia, or forgetfulness.
4 This takes Type I errors into account, that is, the possibility of rejecting a true hypothesis.
8
C A R E G I V I N G I N T H E U . S . - A F O C U S E D L O O K AT T H O S E C A R I N G F O R S O M E O N E A G E 5 0 O R O L D E R
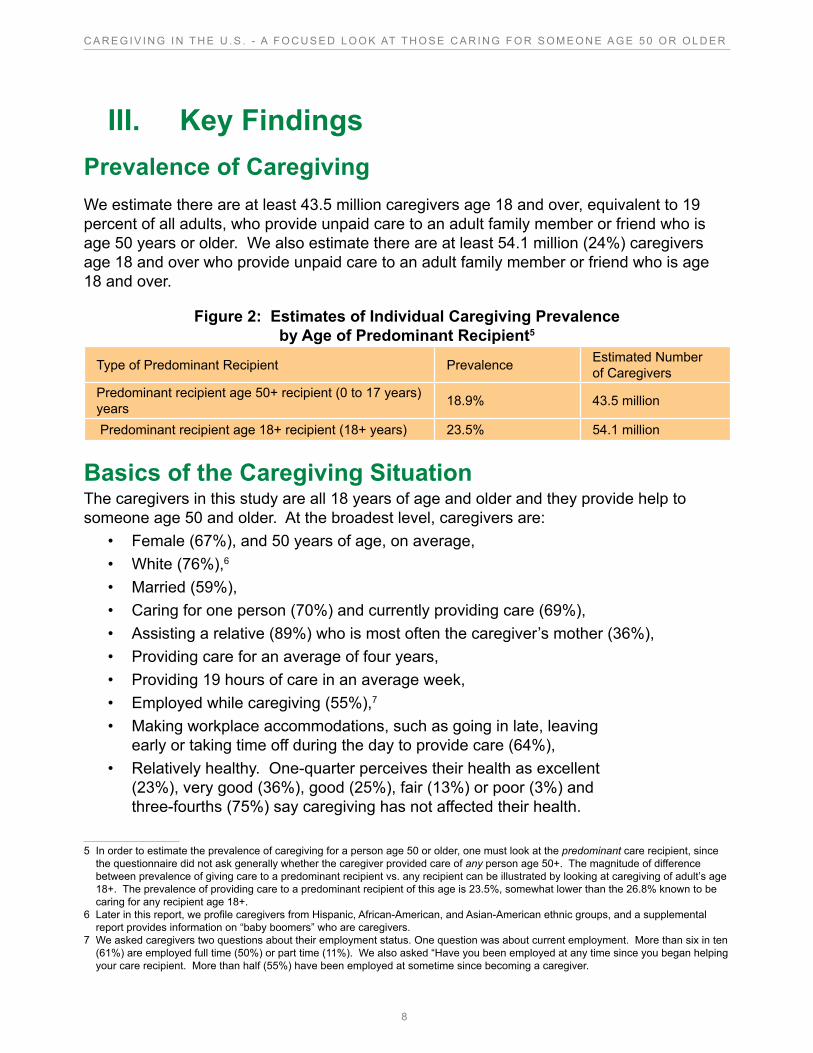
III. Key FindingsPrevalence of CaregivingWe estimate there are at least 43.5 million caregivers age 18 and over, equivalent to 19 percent of all adults, who provide unpaid care to an adult family member or friend who is age 50 years or older. We also estimate there are at least 54.1 million (24%) caregivers age 18 and over who provide unpaid care to an adult family member or friend who is age 18 and over.
Figure 2: Estimates of Individual Caregiving Prevalence by Age of Predominant Recipient5
Type of Predominant Recipient Prevalence Estimated Number of Caregivers
Predominant recipient age 50+ recipient (0 to 17 years) years 18.9% 43.5 million
Predominant recipient age 18+ recipient (18+ years) 23.5% 54.1 million
Basics of the Caregiving SituationThe caregivers in this study are all 18 years of age and older and they provide help to someone age 50 and older. At the broadest level, caregivers are:
• Female (67%), and 50 years of age, on average,• White (76%),6 • Married (59%),• Caring for one person (70%) and currently providing care (69%),• Assisting a relative (89%) who is most often the caregiver’s mother (36%),• Providing care for an average of four years,• Providing 19 hours of care in an average week,• Employed while caregiving (55%),7
• Making workplace accommodations, such as going in late, leaving early or taking time off during the day to provide care (64%),
• Relatively healthy. One-quarter perceives their health as excellent (23%), very good (36%), good (25%), fair (13%) or poor (3%) and three-fourths (75%) say caregiving has not affected their health.
5 In order to estimate the prevalence of caregiving for a person age 50 or older, one must look at the predominant care recipient, since the questionnaire did not ask generally whether the caregiver provided care of any person age 50+. The magnitude of difference between prevalence of giving care to a predominant recipient vs. any recipient can be illustrated by looking at caregiving of adult’s age 18+. The prevalence of providing care to a predominant recipient of this age is 23.5%, somewhat lower than the 26.8% known to be caring for any recipient age 18+.
6 Later in this report, we profile caregivers from Hispanic, African-American, and Asian-American ethnic groups, and a supplemental report provides information on “baby boomers” who are caregivers.
7 We asked caregivers two questions about their employment status. One question was about current employment. More than six in ten (61%) are employed full time (50%) or part time (11%). We also asked “Have you been employed at any time since you began helping your care recipient. More than half (55%) have been employed at sometime since becoming a caregiver.
9
C A R E G I V I N G I N T H E U . S . - A F O C U S E D L O O K AT T H O S E C A R I N G F O R S O M E O N E A G E 5 0 O R O L D E R
Nearly three in ten (27%) say they need help balancing their work and family responsibilities or need help finding time for themselves (31%)
One-third (32%) say they are the caregiver who provides the most unpaid care and four in ten (43%) feel they did not have a choice to take on this role.
The care recipients in this study are all age 50 or older. At the broadest level, care recipients are:
• Female• 77 years of age, on average,• Widowed (49%), about three in ten are married (30%)• Living in their own household (58%), one in five (20%)
is living in their caregiver’s household,• Needing care because of long-term physical conditions (76%).
Caregivers most often say the reason their care recipient needs help is because of aging (15%) or Alzheimer’s disease, confusion, dementia or forgetfulness (15%)
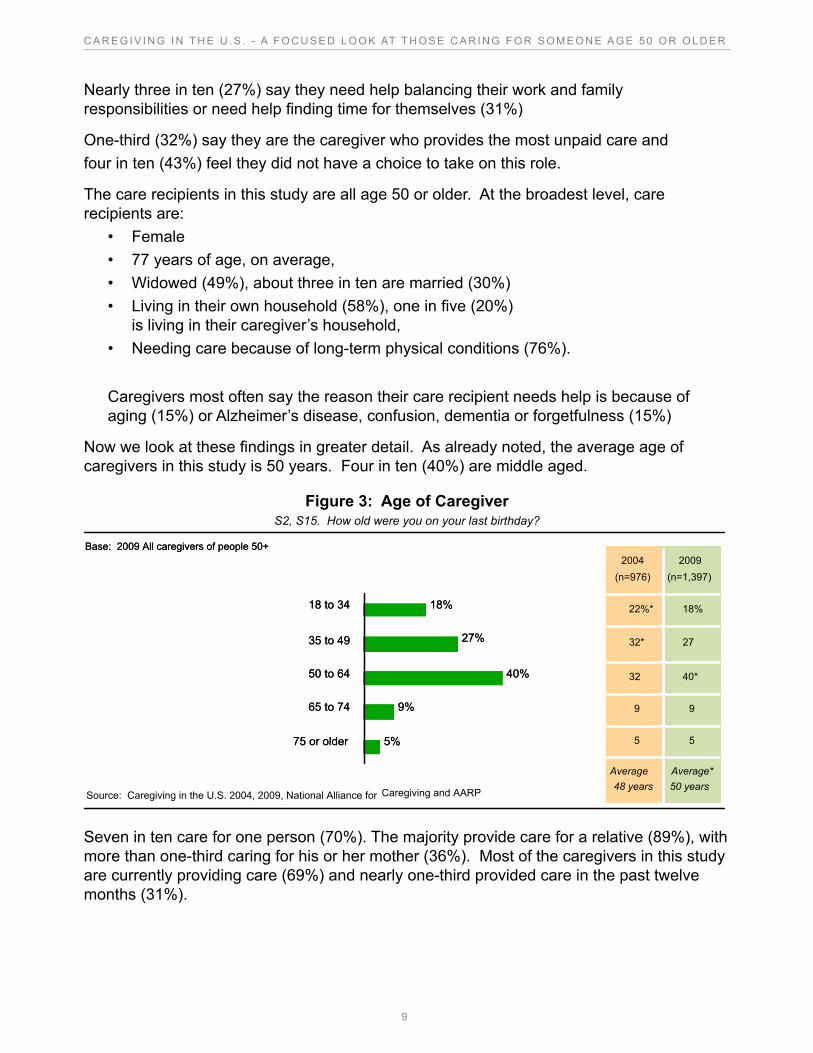
Now we look at these findings in greater detail. As already noted, the average age of caregivers in this study is 50 years. Four in ten (40%) are middle aged.
Figure 3: Age of CaregiverS2, S15. How old were you on your last birthday?
Average
50 years
Average
48 years
5 5
9 9
18% 22%*
40* 32
27 32*
2004
(n=976)
2009
(n=1,397)
Average*
50 years
Average
48 years
5 5
9 9
18% 22%*
40* 32
27 32*
2004
(n=976)
2009
(n=1,397)
27%
40%
9%
5%
18% 18 to 34
35 to 49
50 to 64
65 to 74
75 or older
Base: 2009 All caregivers of people 50+
Source: Caregiving in the U.S. 2004, 2009, National Alliance for
27%
40%
9%
5%
18% 18 to 34
35 to 49
50 to 64
65 to 74
75 or older
Base: 2009 All caregivers of people 50+
Caregiving and AARP
Seven in ten care for one person (70%). The majority provide care for a relative (89%), with more than one-third caring for his or her mother (36%). Most of the caregivers in this study are currently providing care (69%) and nearly one-third provided care in the past twelve months (31%).
10
C A R E G I V I N G I N T H E U . S . - A F O C U S E D L O O K AT T H O S E C A R I N G F O R S O M E O N E A G E 5 0 O R O L D E R
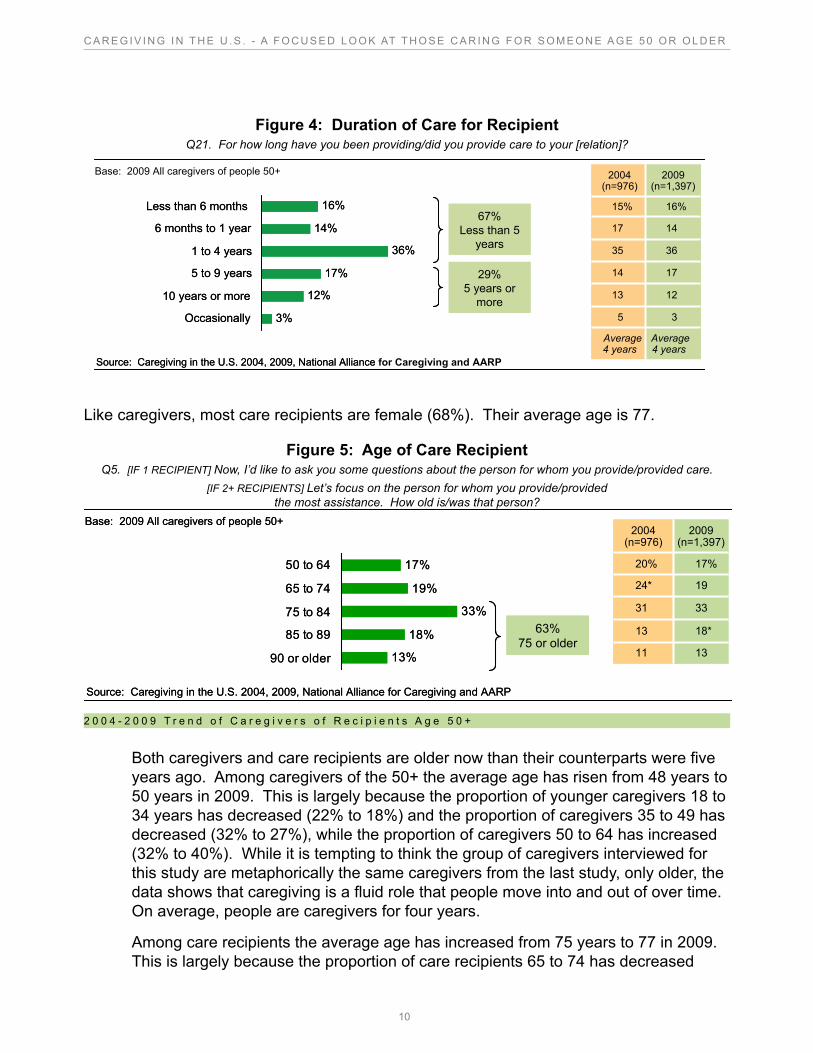
Figure 4: Duration of Care for RecipientQ21. For how long have you been providing/did you provide care to your [relation]?
14% 36%
17% 12%
3%
16% Less than 6 months 6 months to 1 year
1 to 4 years 5 to 9 years
10 years or more Occasionally
67% Less than 5
years
29% 5 years or
more
Base: 2009 All caregivers of people 50+
Source: Caregiving in the U.S. 2004, 2009, National Alliance
14% 36%
17% 12%
3%
16% Less than 6 months 6 months to 1 year
1 to 4 years 5 to 9 years
10 years or more Occasionally
67% Less than 5
years
29% 5 years or
more
Source: Caregiving in the U.S. 2004, 2009, National Alliance for Caregiving and AARP Average 4 years
Average 4 years
3 5 12 13 17 14 36 35 14 17 16% 15%
2004 (n=976)
2009 (n=1,397)
Average 4 years
Average 4 years
3 5 12 13 17 14 36 35 14 17 16% 15%
2004 (n=976)
2009 (n=1,397)
Like caregivers, most care recipients are female (68%). Their average age is 77.
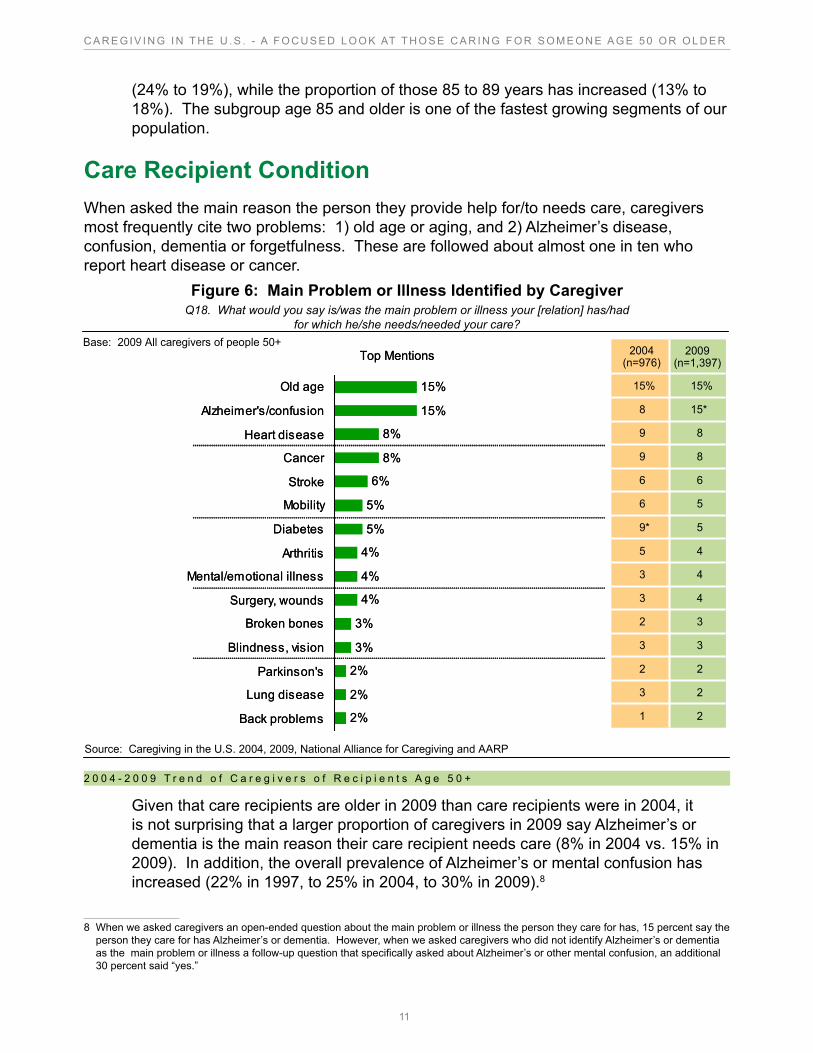
Figure 5: Age of Care RecipientQ5. [IF 1 RECIPIENT] Now, I’d like to ask you some questions about the person for whom you provide/provided care.
[IF 2+ RECIPIENTS] Let’s focus on the person for whom you provide/provided the most assistance. How old is/was that person?
1311
18*13
3331
1924*
17%20%
2004(n=976)
2009(n=1,397)
1311
18*13
3331
1924*
17%20%
2004(n=976)
2009(n=1,397)
19%
33%
18%
13%
17%50 to 64
65 to 74
75 to 84
85 to 89
90 or older
Base: 2009 All caregivers of people 50+
Source: Caregiving in the U.S. 2004, 2009, National Alliance for Caregiving and AARP
63%75 or older
19%
33%
18%
13%
17%50 to 64
65 to 74
75 to 84
85 to 89
90 or older
Base: 2009 All caregivers of people 50+
Source: Caregiving in the U.S. 2004, 2009, National Alliance for Caregiving and AARP
63%75 or older
2 0 0 4 - 2 0 0 9 T r e n d o f C a r e g i v e r s o f R e c i p i e n t s A g e 5 0 +
Both caregivers and care recipients are older now than their counterparts were five years ago. Among caregivers of the 50+ the average age has risen from 48 years to 50 years in 2009. This is largely because the proportion of younger caregivers 18 to 34 years has decreased (22% to 18%) and the proportion of caregivers 35 to 49 has decreased (32% to 27%), while the proportion of caregivers 50 to 64 has increased (32% to 40%). While it is tempting to think the group of caregivers interviewed for this study are metaphorically the same caregivers from the last study, only older, the data shows that caregiving is a fluid role that people move into and out of over time. On average, people are caregivers for four years.
Among care recipients the average age has increased from 75 years to 77 in 2009. This is largely because the proportion of care recipients 65 to 74 has decreased
11
C A R E G I V I N G I N T H E U . S . - A F O C U S E D L O O K AT T H O S E C A R I N G F O R S O M E O N E A G E 5 0 O R O L D E R
(24% to 19%), while the proportion of those 85 to 89 years has increased (13% to 18%). The subgroup age 85 and older is one of the fastest growing segments of our population.
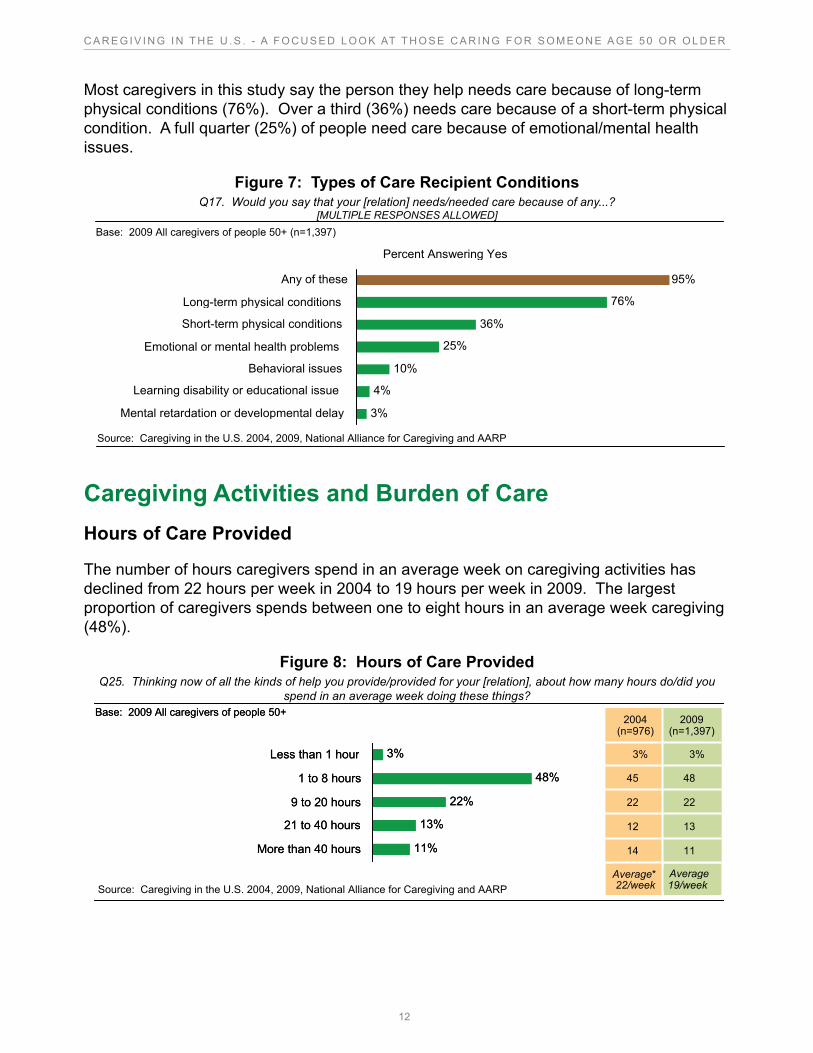
Care Recipient ConditionWhen asked the main reason the person they provide help for/to needs care, caregivers most frequently cite two problems: 1) old age or aging, and 2) Alzheimer’s disease, confusion, dementia or forgetfulness. These are followed about almost one in ten who report heart disease or cancer.
Figure 6: Main Problem or Illness Identified by CaregiverQ18. What would you say is/was the main problem or illness your [relation] has/had
for which he/she needs/needed your care?
15%
15%
8%
8%
6%
5%
5%
4%
4%
4%
3%
3%
2%
2%
2%
Old age
Alzheimer's/confusion
Heart disease
Cancer
Stroke
Mobility
Diabetes
Arthritis
Mental/emotional illness
Surgery, wounds
Broken bones
Blindness, vision
Parkinson's
Lung disease
Back problems
Top Mentions
15%
15%
8%
8%
6%
5%
5%
4%
4%
4%
3%
3%
2%
2%
2%
Old age
Alzheimer's/confusion
Heart disease
Cancer
Stroke
Mobility
Diabetes
Arthritis
Mental/emotional illness
Surgery, wounds
Broken bones
Blindness, vision
Parkinson's
Lung disease
Back problems
Top Mentions
22
23
21
43
32
33
43
45
56
59*
66
89
89
15*8
15%15%
2004(n=976)
2009(n=1,397)
22
23
21
43
32
33
43
45
56
59*
66
89
89
15*8
15%15%
2004(n=976)
2009(n=1,397)
Source: Caregiving in the U.S. 2004, 2009, National Alliance for Caregiving and AARP
Base: 2009 All caregivers of people 50+
2 0 0 4 - 2 0 0 9 T r e n d o f C a r e g i v e r s o f R e c i p i e n t s A g e 5 0 +
Given that care recipients are older in 2009 than care recipients were in 2004, it is not surprising that a larger proportion of caregivers in 2009 say Alzheimer’s or dementia is the main reason their care recipient needs care (8% in 2004 vs. 15% in2009). In addition, the overall prevalence of Alzheimer’s or mental confusion has increased (22% in 1997, to 25% in 2004, to 30% in 2009).8
8 When we asked caregivers an open-ended question about the main problem or illness the person they care for has, 15 percent say the person they care for has Alzheimer’s or dementia. However, when we asked caregivers who did not identify Alzheimer’s or dementia as the main problem or illness a follow-up question that specifically asked about Alzheimer’s or other mental confusion, an additional 30 percent said “yes.”
12
C A R E G I V I N G I N T H E U . S . - A F O C U S E D L O O K AT T H O S E C A R I N G F O R S O M E O N E A G E 5 0 O R O L D E R
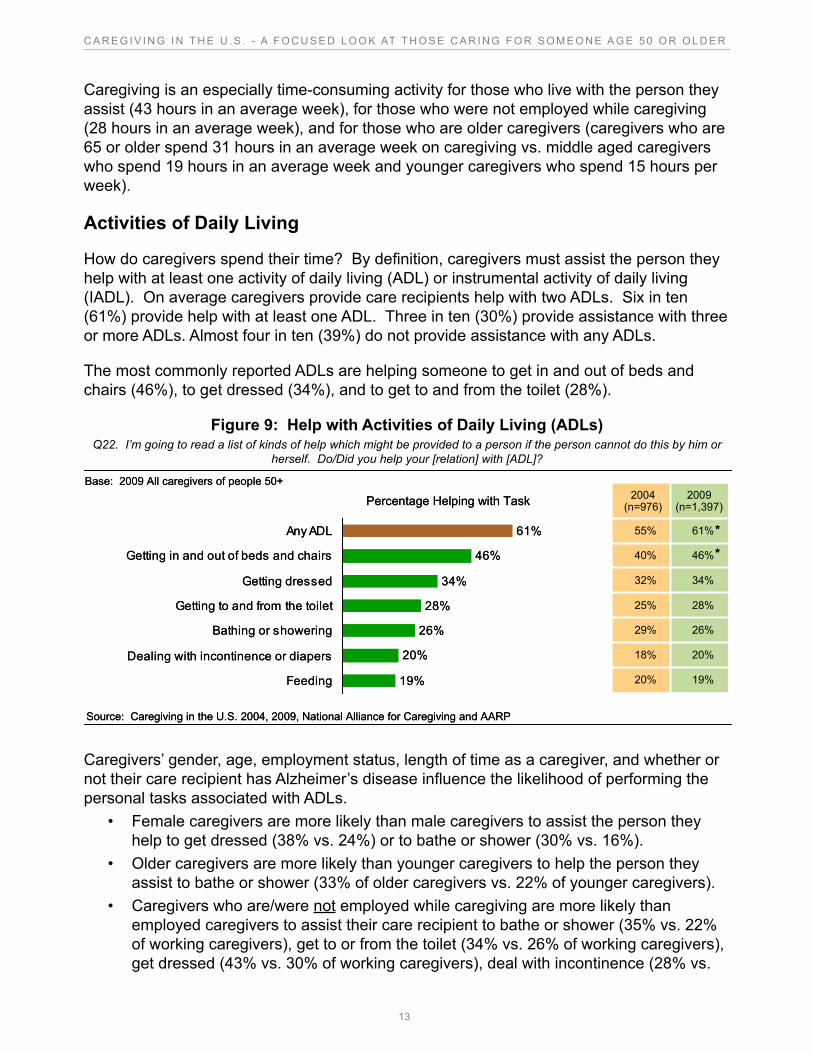
Most caregivers in this study say the person they help needs care because of long-term physical conditions (76%). Over a third (36%) needs care because of a short-term physical condition. A full quarter (25%) of people need care because of emotional/mental health issues.
Figure 7: Types of Care Recipient ConditionsQ17. Would you say that your [relation] needs/needed care because of any...?
[MULTIPLE RESPONSES ALLOWED]
Source: Caregiving in the U.S. 2004, 2009, National Alliance for Caregiving and AARP
95% 76%
25% 10%
4% 3%
36%
Any of these Long-term physical conditions Short-term physical conditions
Emotional or mental health problems Behavioral issues
Learning disability or educational issue Mental retardation or developmental delay
Percent Answering Yes Base: 2009 All caregivers of people 50+ (n=1,397)
Caregiving Activities and Burden of CareHours of Care Provided
The number of hours caregivers spend in an average week on caregiving activities has declined from 22 hours per week in 2004 to 19 hours per week in 2009. The largest proportion of caregivers spends between one to eight hours in an average week caregiving (48%).
Figure 8: Hours of Care ProvidedQ25. Thinking now of all the kinds of help you provide/provided for your [relation], about how many hours do/did you
spend in an average week doing these things?
Source: Caregiving in the U.S. 2004, 2009, National Alliance for Caregiving and AARP
3% 48%
22% 13%
11%
Less than 1 hour 1 to 8 hours
9 to 20 hours 21 to 40 hours
More than 40 hours
Base: 2009 All caregivers of people 50+
3% 48%
22% 13%
11%
Less than 1 hour 1 to 8 hours
9 to 20 hours 21 to 40 hours
More than 40 hours
Base: 2009 All caregivers of people 50+
Average 19/week
Average 22/week
3% 3%
11 14 13 12 22 22 48 45
2004 (n=976)
2009 (n=1,397)
Average 19/week
Average* 22/week
3% 3%
11 14 13 12 22 22 48 45
2004 (n=976)
2009 (n=1,397)
13
C A R E G I V I N G I N T H E U . S . - A F O C U S E D L O O K AT T H O S E C A R I N G F O R S O M E O N E A G E 5 0 O R O L D E R
Caregiving is an especially time-consuming activity for those who live with the person they assist (43 hours in an average week), for those who were not employed while caregiving (28 hours in an average week), and for those who are older caregivers (caregivers who are 65 or older spend 31 hours in an average week on caregiving vs. middle aged caregivers who spend 19 hours in an average week and younger caregivers who spend 15 hours per week).
Activities of Daily Living
How do caregivers spend their time? By definition, caregivers must assist the person they help with at least one activity of daily living (ADL) or instrumental activity of daily living (IADL). On average caregivers provide care recipients help with two ADLs. Six in ten (61%) provide help with at least one ADL. Three in ten (30%) provide assistance with three or more ADLs. Almost four in ten (39%) do not provide assistance with any ADLs.
The most commonly reported ADLs are helping someone to get in and out of beds and chairs (46%), to get dressed (34%), and to get to and from the toilet (28%).
Figure 9: Help with Activities of Daily Living (ADLs)Q22. I’m going to read a list of kinds of help which might be provided to a person if the person cannot do this by him or
herself. Do/Did you help your [relation] with [ADL]?
19%20%
20%18%
26%29%
28%25%
34%32%
46%40%
61%55%
2004(n=976)
2009(n=1,397)
19%20%
20%18%
26%29%
28%25%
34%32%
46%40%
61%55%
2004(n=976)
2009(n=1,397)
*
*
*
*
61%
34%
28%
26%
20%
46%
19%
Any ADL
Getting in and out of beds and chairs
Getting dressed
Getting to and from the toilet
Bathing or showering
Dealing with incontinence or diapers
Feeding
Percentage Helping with TaskBase: 2009 All caregivers of people 50+
Source: Caregiving in the U.S. 2004, 2009, National Alliance for Caregiving and AARP
Caregivers’ gender, age, employment status, length of time as a caregiver, and whether or not their care recipient has Alzheimer’s disease influence the likelihood of performing the personal tasks associated with ADLs.
• Female caregivers are more likely than male caregivers to assist the person they help to get dressed (38% vs. 24%) or to bathe or shower (30% vs. 16%).
• Older caregivers are more likely than younger caregivers to help the person they assist to bathe or shower (33% of older caregivers vs. 22% of younger caregivers).
• Caregivers who are/were not employed while caregiving are more likely than employed caregivers to assist their care recipient to bathe or shower (35% vs. 22% of working caregivers), get to or from the toilet (34% vs. 26% of working caregivers), get dressed (43% vs. 30% of working caregivers), deal with incontinence (28% vs.
14
C A R E G I V I N G I N T H E U . S . - A F O C U S E D L O O K AT T H O S E C A R I N G F O R S O M E O N E A G E 5 0 O R O L D E R
18% of working caregivers), and by feeding him or her (24% vs. 17% of working caregivers).
Short-term caregivers are more likely than long-term caregivers to assist with the following four tasks:9
• Getting in and out of beds and chairs (54% vs. 39%)• Getting dressed (43% vs. 31%)• Getting to and from the toilet (35% vs. 26%)• Bathing or showering (34% vs. 25%)
Caregivers of people with Alzheimer’s are more likely than other caregivers to help with at least one ADL (72% vs. 56%). Specifically, they are more likely to help with the following four tasks:
• Getting in and out of beds and chairs (54% vs. 42%)• Getting dressed (40% vs. 31%)• Dealing with incontinence or diapers (31% vs. 16%)• Feeding their care recipient (31% vs. 14%)
Instrumental Activities of Daily Living
All caregivers perform at least one IADL. On average caregivers assist with four IADLs and this has remained constant over time. Eight in ten (82%) caregivers report helping their care recipient with three or more IADLs.
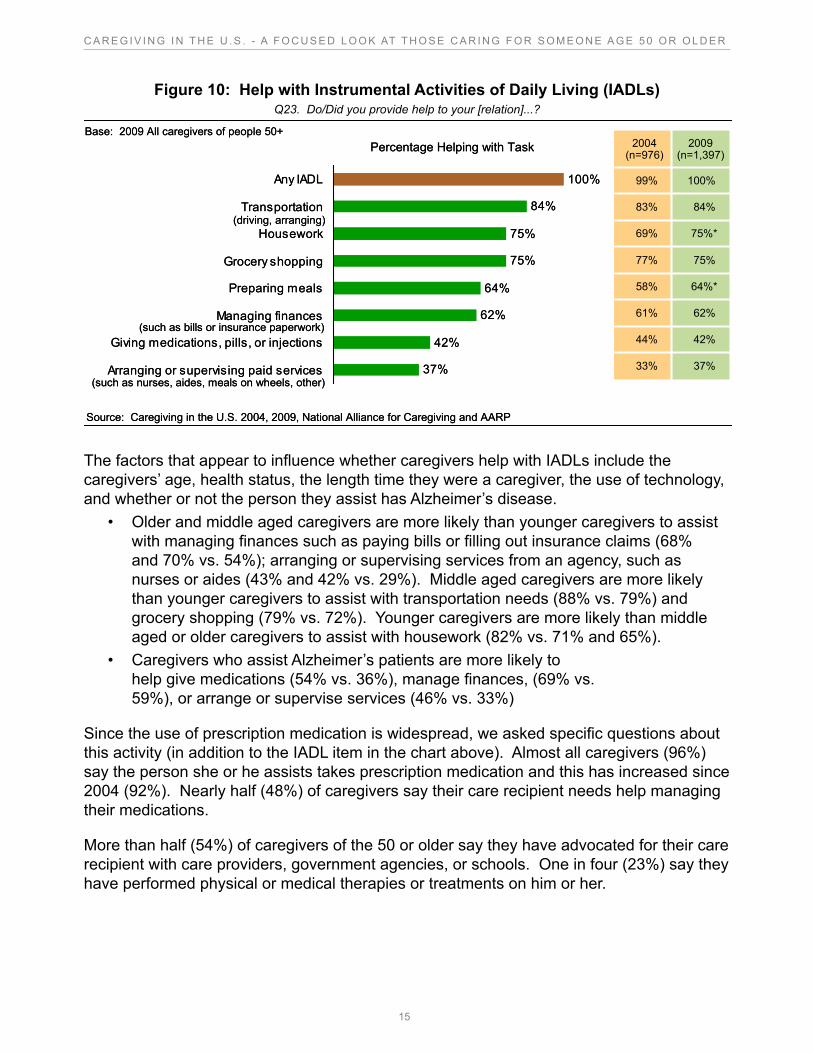
The most frequently reported IADLs performed are providing transportation, such as driving or obtaining transportation for their care recipient (84%), followed by housework (75%) and grocery shopping (75%).
9 Short-term caregivers are those who have been caregiving for less than one year and long-term caregivers are those who have been caregiving for five years or more.
15
C A R E G I V I N G I N T H E U . S . - A F O C U S E D L O O K AT T H O S E C A R I N G F O R S O M E O N E A G E 5 0 O R O L D E R
Figure 10: Help with Instrumental Activities of Daily Living (IADLs)Q23. Do/Did you provide help to your [relation]...?
37%33%
42%44%
62%61%
64%*58%
75%77%
75%*69%
84%83%
100%99%
2004(n=976)
2009(n=1,397)
37%33%
42%44%
62%61%
64%*58%
75%77%
75%*69%
84%83%
100%99%
2004(n=976)
2009(n=1,397)
100%
75%
42%
37%
84%
64%
75%
62%
Any IADL
Transportation
Housework
Grocery shopping
Preparing meals
Managing finances
Giving medications, pills, or injections
Arranging or supervising paid services
(such as bills or insurance paperwork)
(driving, arranging)
(such as nurses, aides, meals on wheels, other)
Percentage Helping with TaskBase: 2009 All caregivers of people 50+
Source: Caregiving in the U.S. 2004, 2009, National Alliance for Caregiving and AARP
The factors that appear to influence whether caregivers help with IADLs include the caregivers’ age, health status, the length time they were a caregiver, the use of technology, and whether or not the person they assist has Alzheimer’s disease.
• Older and middle aged caregivers are more likely than younger caregivers to assist with managing finances such as paying bills or filling out insurance claims (68% and 70% vs. 54%); arranging or supervising services from an agency, such as nurses or aides (43% and 42% vs. 29%). Middle aged caregivers are more likely than younger caregivers to assist with transportation needs (88% vs. 79%) and grocery shopping (79% vs. 72%). Younger caregivers are more likely than middle aged or older caregivers to assist with housework (82% vs. 71% and 65%).
• Caregivers who assist Alzheimer’s patients are more likely to help give medications (54% vs. 36%), manage finances, (69% vs. 59%), or arrange or supervise services (46% vs. 33%)
Since the use of prescription medication is widespread, we asked specific questions about this activity (in addition to the IADL item in the chart above). Almost all caregivers (96%) say the person she or he assists takes prescription medication and this has increased since 2004 (92%). Nearly half (48%) of caregivers say their care recipient needs help managing their medications.
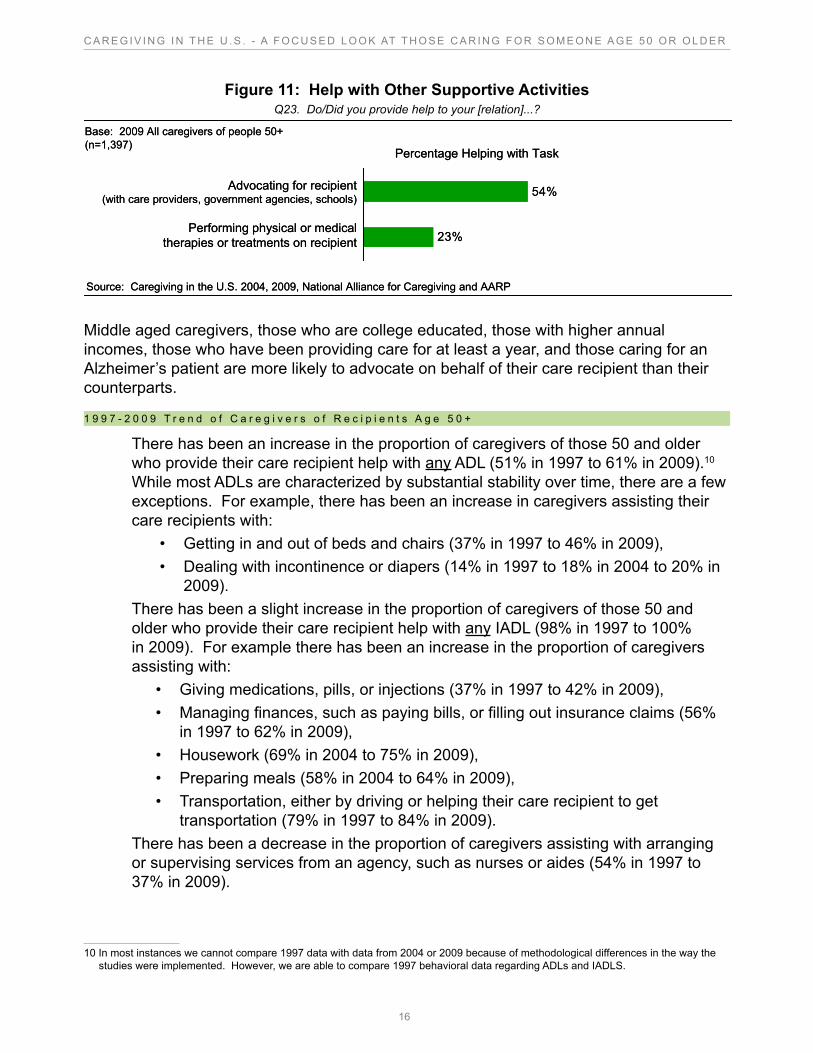
More than half (54%) of caregivers of the 50 or older say they have advocated for their care recipient with care providers, government agencies, or schools. One in four (23%) say they have performed physical or medical therapies or treatments on him or her.
16
C A R E G I V I N G I N T H E U . S . - A F O C U S E D L O O K AT T H O S E C A R I N G F O R S O M E O N E A G E 5 0 O R O L D E R
Figure 11: Help with Other Supportive ActivitiesQ23. Do/Did you provide help to your [relation]...?
54%
23%
Percentage Helping with Task
Advocating for recipient(with care providers, government agencies, schools)
Performing physical or medical therapies or treatments on recipient
Base: 2009 All caregivers of people 50+(n=1,397)
Source: Caregiving in the U.S. 2004, 2009, National Alliance for Caregiving and AARP
Middle aged caregivers, those who are college educated, those with higher annual incomes, those who have been providing care for at least a year, and those caring for an Alzheimer’s patient are more likely to advocate on behalf of their care recipient than their counterparts.
1 9 9 7 - 2 0 0 9 T r e n d o f C a r e g i v e r s o f R e c i p i e n t s A g e 5 0 +
There has been an increase in the proportion of caregivers of those 50 and older who provide their care recipient help with any ADL (51% in 1997 to 61% in 2009).10 While most ADLs are characterized by substantial stability over time, there are a few exceptions. For example, there has been an increase in caregivers assisting their care recipients with:
• Getting in and out of beds and chairs (37% in 1997 to 46% in 2009),• Dealing with incontinence or diapers (14% in 1997 to 18% in 2004 to 20% in
2009).There has been a slight increase in the proportion of caregivers of those 50 and older who provide their care recipient help with any IADL (98% in 1997 to 100% in 2009). For example there has been an increase in the proportion of caregivers assisting with:
• Giving medications, pills, or injections (37% in 1997 to 42% in 2009),• Managing finances, such as paying bills, or filling out insurance claims (56%
in 1997 to 62% in 2009),• Housework (69% in 2004 to 75% in 2009), • Preparing meals (58% in 2004 to 64% in 2009),• Transportation, either by driving or helping their care recipient to get
transportation (79% in 1997 to 84% in 2009).There has been a decrease in the proportion of caregivers assisting with arranging or supervising services from an agency, such as nurses or aides (54% in 1997 to 37% in 2009).
10 In most instances we cannot compare 1997 data with data from 2004 or 2009 because of methodological differences in the way the studies were implemented. However, we are able to compare 1997 behavioral data regarding ADLs and IADLS.
17
C A R E G I V I N G I N T H E U . S . - A F O C U S E D L O O K AT T H O S E C A R I N G F O R S O M E O N E A G E 5 0 O R O L D E R
Level of Burden Index
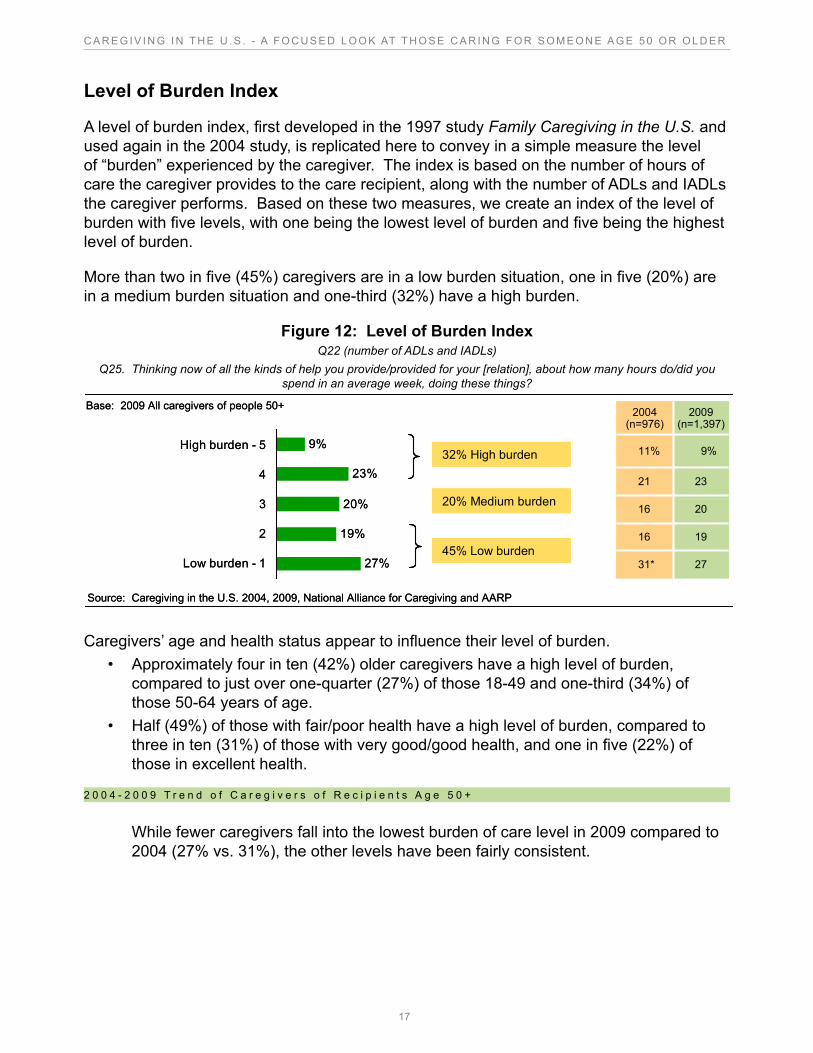
A level of burden index, first developed in the 1997 study Family Caregiving in the U.S. and used again in the 2004 study, is replicated here to convey in a simple measure the level of “burden” experienced by the caregiver. The index is based on the number of hours of care the caregiver provides to the care recipient, along with the number of ADLs and IADLs the caregiver performs. Based on these two measures, we create an index of the level of burden with five levels, with one being the lowest level of burden and five being the highest level of burden.
More than two in five (45%) caregivers are in a low burden situation, one in five (20%) are in a medium burden situation and one-third (32%) have a high burden.
Figure 12: Level of Burden IndexQ22 (number of ADLs and IADLs)
Q25. Thinking now of all the kinds of help you provide/provided for your [relation], about how many hours do/did you spend in an average week, doing these things?
2731*
1916
2016
2321
9%11%
2004(n=976)
2009(n=1,397)
2731*
1916
2016
2321
9%11%
2004(n=976)
2009(n=1,397)
9%
23%
20%
19%
27%
High burden - 5
4
3
2
Low burden - 1
32% High burden
45% Low burden
20% Medium burden
Base: 2009 All caregivers of people 50+
Source: Caregiving in the U.S. 2004, 2009, National Alliance for Caregiving and AARP
9%
23%
20%
19%
27%
High burden - 5
4
3
2
Low burden - 1
32% High burden
45% Low burden
20% Medium burden
32% High burden
45% Low burden
20% Medium burden
Base: 2009 All caregivers of people 50+
Source: Caregiving in the U.S. 2004, 2009, National Alliance for Caregiving and AARP
Caregivers’ age and health status appear to influence their level of burden.• Approximately four in ten (42%) older caregivers have a high level of burden,
compared to just over one-quarter (27%) of those 18-49 and one-third (34%) of those 50-64 years of age.
• Half (49%) of those with fair/poor health have a high level of burden, compared to three in ten (31%) of those with very good/good health, and one in five (22%) of those in excellent health.
2 0 0 4 - 2 0 0 9 T r e n d o f C a r e g i v e r s o f R e c i p i e n t s A g e 5 0 +
While fewer caregivers fall into the lowest burden of care level in 2009 compared to 2004 (27% vs. 31%), the other levels have been fairly consistent.
18
C A R E G I V I N G I N T H E U . S . - A F O C U S E D L O O K AT T H O S E C A R I N G F O R S O M E O N E A G E 5 0 O R O L D E R
Presence of Other CaregiversUnpaid Caregivers
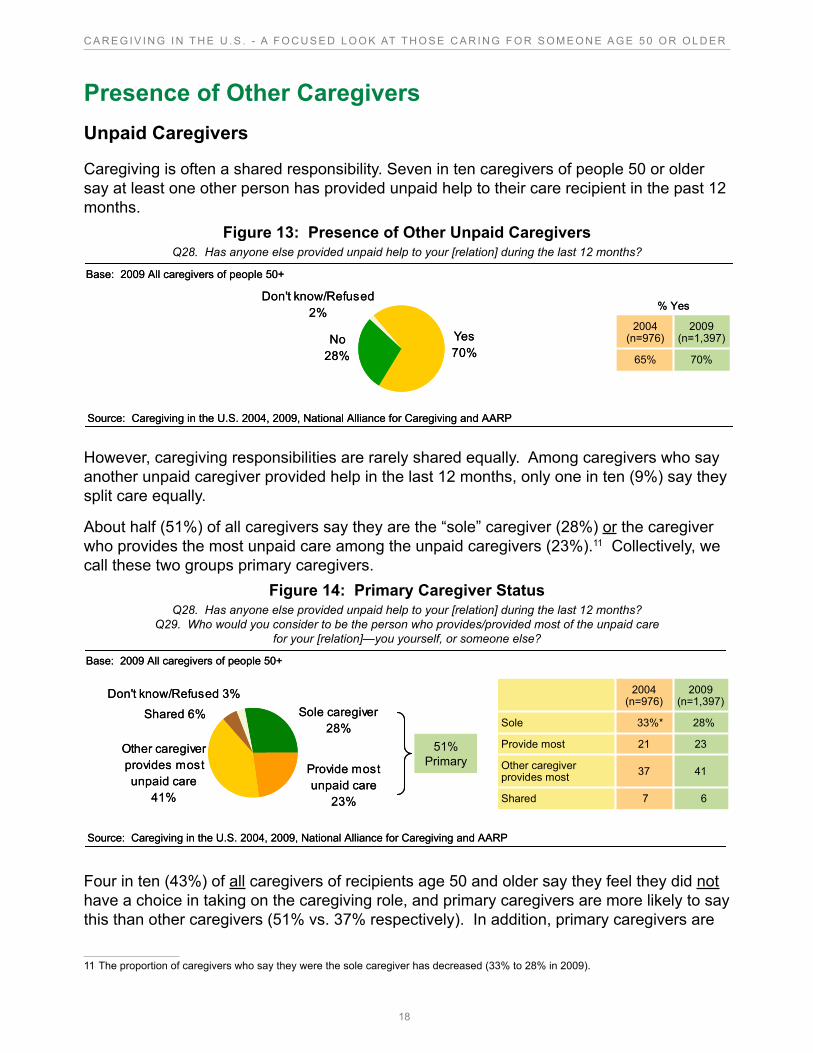
Caregiving is often a shared responsibility. Seven in ten caregivers of people 50 or older say at least one other person has provided unpaid help to their care recipient in the past 12 months.
Figure 13: Presence of Other Unpaid CaregiversQ28. Has anyone else provided unpaid help to your [relation] during the last 12 months?
70%65%
2004(n=976)
2009(n=1,397)
70%65%
2004(n=976)
2009(n=1,397)
Don't know/Refused2%
Yes70%
No28%
% Yes
Base: 2009 All caregivers of people 50+
Source: Caregiving in the U.S. 2004, 2009, National Alliance for Caregiving and AARP
Don't know/Refused2%
Yes70%
No28%
% Yes
Base: 2009 All caregivers of people 50+
Source: Caregiving in the U.S. 2004, 2009, National Alliance for Caregiving and AARP
However, caregiving responsibilities are rarely shared equally. Among caregivers who say another unpaid caregiver provided help in the last 12 months, only one in ten (9%) say they split care equally.
About half (51%) of all caregivers say they are the “sole” caregiver (28%) or the caregiver who provides the most unpaid care among the unpaid caregivers (23%).11 Collectively, we call these two groups primary caregivers.
Figure 14: Primary Caregiver StatusQ28. Has anyone else provided unpaid help to your [relation] during the last 12 months?
Q29. Who would you consider to be the person who provides/provided most of the unpaid care for your [relation]—you yourself, or someone else?
67Shared
4137Other caregiver provides most
2321Provide most
Sole 28%33%*
2004(n=976)
2009(n=1,397)
67Shared
4137Other caregiver provides most
2321Provide most
Sole 28%33%*
2004(n=976)
2009(n=1,397)
Base: 2009 All caregivers of people 50+
Provide most unpaid care
23%
Sole caregiver28%
Other caregiver provides most unpaid care
41%
Shared 6%
Don't know/Refused 3%
Source: Caregiving in the U.S. 2004, 2009, National Alliance for Caregiving and AARP
51%Primary
Base: 2009 All caregivers of people 50+
Provide most unpaid care
23%
Sole caregiver28%
Other caregiver provides most unpaid care
41%
Shared 6%
Don't know/Refused 3%
Source: Caregiving in the U.S. 2004, 2009, National Alliance for Caregiving and AARP
51%Primary
Four in ten (43%) of all caregivers of recipients age 50 and older say they feel they did not have a choice in taking on the caregiving role, and primary caregivers are more likely to say this than other caregivers (51% vs. 37% respectively). In addition, primary caregivers are
11 The proportion of caregivers who say they were the sole caregiver has decreased (33% to 28% in 2009).
19
C A R E G I V I N G I N T H E U . S . - A F O C U S E D L O O K AT T H O S E C A R I N G F O R S O M E O N E A G E 5 0 O R O L D E R
more likely to have a high level of burden (42% vs. 22% of other caregivers).
Non-primary caregivers (47%) represent the balance of caregivers. They are defined as those who say another caregiver provides most of the unpaid care (41%), or who share care equally (6%).
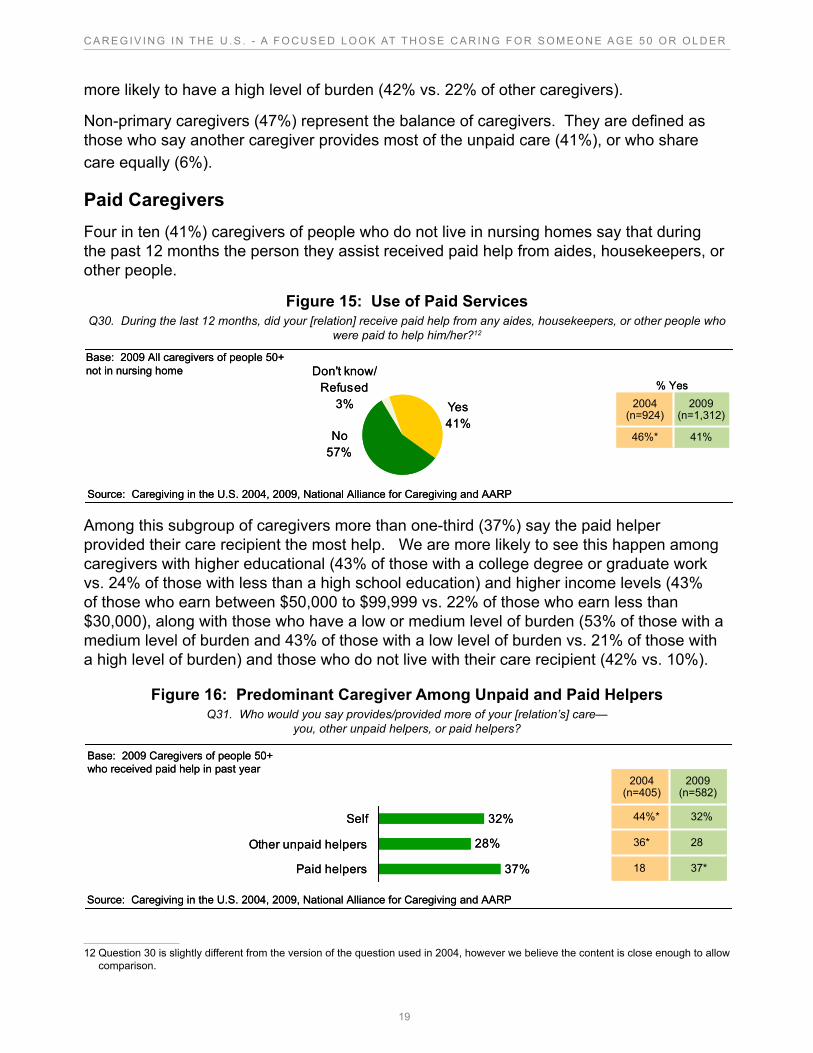
Paid CaregiversFour in ten (41%) caregivers of people who do not live in nursing homes say that during the past 12 months the person they assist received paid help from aides, housekeepers, or other people.
Figure 15: Use of Paid ServicesQ30. During the last 12 months, did your [relation] receive paid help from any aides, housekeepers, or other people who
were paid to help him/her?12
41%46%*
2004(n=924)
2009(n=1,312)
41%46%*
2004(n=924)
2009(n=1,312)
No57%
Don't know/ Refused
3% Yes41%
% Yes
Base: 2009 All caregivers of people 50+not in nursing home
Source: Caregiving in the U.S. 2004, 2009, National Alliance for Caregiving and AARP
No57%
Don't know/ Refused
3% Yes41%
% Yes
Base: 2009 All caregivers of people 50+not in nursing home
Source: Caregiving in the U.S. 2004, 2009, National Alliance for Caregiving and AARP
Among this subgroup of caregivers more than one-third (37%) say the paid helper provided their care recipient the most help. We are more likely to see this happen among caregivers with higher educational (43% of those with a college degree or graduate work vs. 24% of those with less than a high school education) and higher income levels (43% of those who earn between $50,000 to $99,999 vs. 22% of those who earn less than $30,000), along with those who have a low or medium level of burden (53% of those with a medium level of burden and 43% of those with a low level of burden vs. 21% of those with a high level of burden) and those who do not live with their care recipient (42% vs. 10%).
Figure 16: Predominant Caregiver Among Unpaid and Paid HelpersQ31. Who would you say provides/provided more of your [relation’s] care—
you, other unpaid helpers, or paid helpers?
37*18
2836*
32%44%*
2004(n=405)
2009(n=582)
37*18
2836*
32%44%*
2004(n=405)
2009(n=582)
32%
28%
37%
Self
Other unpaid helpers
Paid helpers
Base: 2009 Caregivers of people 50+ who received paid help in past year
Source: Caregiving in the U.S. 2004, 2009, National Alliance for Caregiving and AARP
32%
28%
37%
Self
Other unpaid helpers
Paid helpers
Base: 2009 Caregivers of people 50+ who received paid help in past year
Source: Caregiving in the U.S. 2004, 2009, National Alliance for Caregiving and AARP
12 Question 30 is slightly different from the version of the question used in 2004, however we believe the content is close enough to allow comparison.
20
C A R E G I V I N G I N T H E U . S . - A F O C U S E D L O O K AT T H O S E C A R I N G F O R S O M E O N E A G E 5 0 O R O L D E R
2 0 0 4 - 2 0 0 9 T r e n d o f C a r e g i v e r s o f R e c i p i e n t s A g e 5 0 +
Overall, there has also been a decrease in the use of paid caregivers (46% to 41% in 2009). However, among those who do use paid services the proportion who say paid helpers provided their care recipient the most care has increased substantially (18% to 37%).
Among caregivers who say the person they assist received paid help in the past twelve months, there has been a decrease in the proportion who says they provide most of their care recipient’s help (44% to 32%).
Care Recipient Living SituationWhere Care Recipients Live
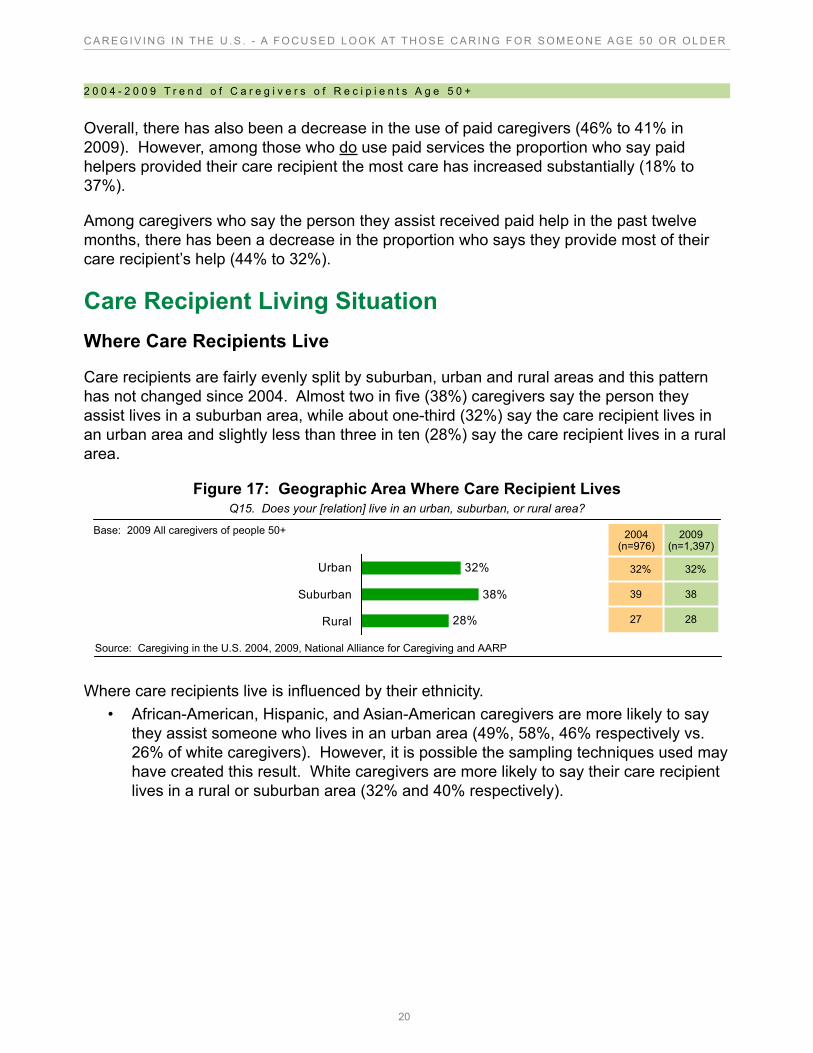
Care recipients are fairly evenly split by suburban, urban and rural areas and this pattern has not changed since 2004. Almost two in five (38%) caregivers say the person they assist lives in a suburban area, while about one-third (32%) say the care recipient lives in an urban area and slightly less than three in ten (28%) say the care recipient lives in a rural area.
Figure 17: Geographic Area Where Care Recipient LivesQ15. Does your [relation] live in an urban, suburban, or rural area?
Source: Caregiving in the U.S. 2004, 2009, National Alliance for Caregiving and AARP
38%
28%
32%Urban
Suburban
Rural
Base: 2009 All caregivers of people 50+
2827
3839
32%32%
2004(n=976)
2009(n=1,397)
2827
3839
32%32%
2004(n=976)
2009(n=1,397)
Where care recipients live is influenced by their ethnicity.• African-American, Hispanic, and Asian-American caregivers are more likely to say
they assist someone who lives in an urban area (49%, 58%, 46% respectively vs. 26% of white caregivers). However, it is possible the sampling techniques used may have created this result. White caregivers are more likely to say their care recipient lives in a rural or suburban area (32% and 40% respectively).
21
C A R E G I V I N G I N T H E U . S . - A F O C U S E D L O O K AT T H O S E C A R I N G F O R S O M E O N E A G E 5 0 O R O L D E R
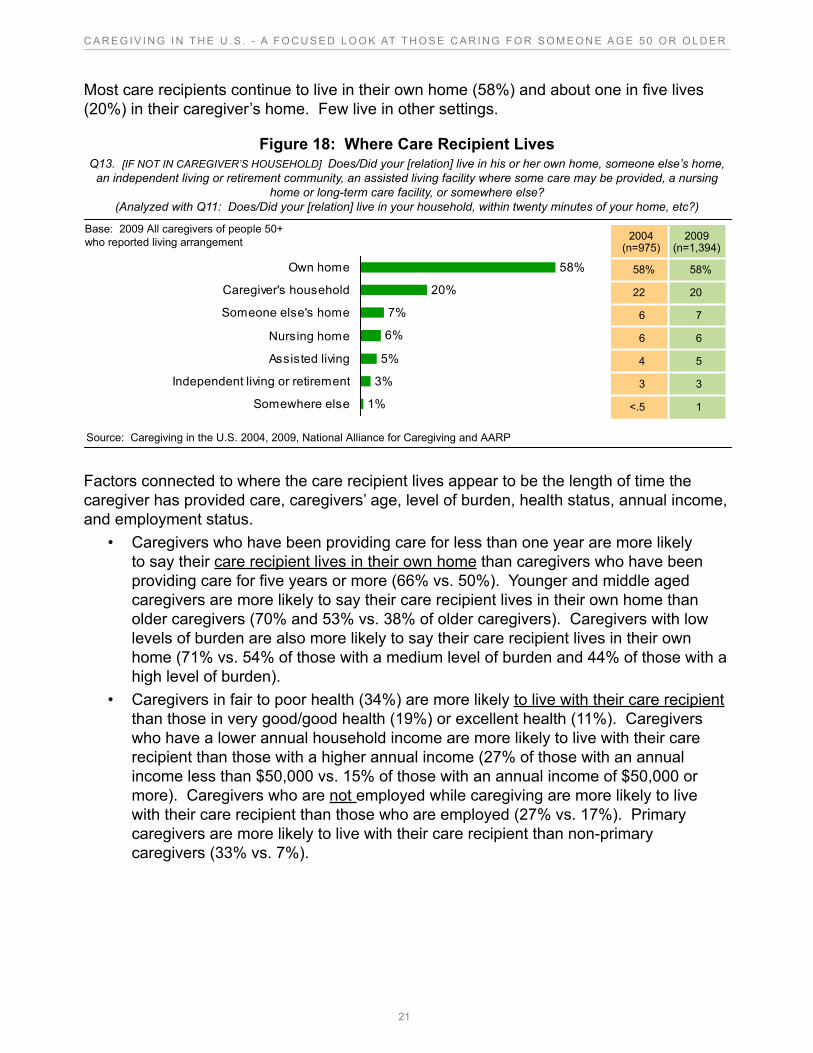
Most care recipients continue to live in their own home (58%) and about one in five lives (20%) in their caregiver’s home. Few live in other settings.
Figure 18: Where Care Recipient LivesQ13. [IF NOT IN CAREGIVER’S HOUSEHOLD] Does/Did your [relation] live in his or her own home, someone else’s home,
an independent living or retirement community, an assisted living facility where some care may be provided, a nursing home or long-term care facility, or somewhere else?
(Analyzed with Q11: Does/Did your [relation] live in your household, within twenty minutes of your home, etc?)
33
1<.5
54
66
76
2022
58%58%
2004(n=975)
2009(n=1,394)
33
1<.5
54
66
76
2022
58%58%
2004(n=975)
2009(n=1,394)
58%
20%
6%
5%
1%
7%
3%
Own home
Caregiver's household
Someone else's home
Nursing home
Assisted living
Independent living or retirement
Somewhere else
Source: Caregiving in the U.S. 2004, 2009, National Alliance for Caregiving and AARP
Base: 2009 All caregivers of people 50+ who reported living arrangement
Factors connected to where the care recipient lives appear to be the length of time the caregiver has provided care, caregivers’ age, level of burden, health status, annual income, and employment status.
• Caregivers who have been providing care for less than one year are more likely to say their care recipient lives in their own home than caregivers who have been providing care for five years or more (66% vs. 50%). Younger and middle aged caregivers are more likely to say their care recipient lives in their own home than older caregivers (70% and 53% vs. 38% of older caregivers). Caregivers with low levels of burden are also more likely to say their care recipient lives in their own home (71% vs. 54% of those with a medium level of burden and 44% of those with a high level of burden).
• Caregivers in fair to poor health (34%) are more likely to live with their care recipient than those in very good/good health (19%) or excellent health (11%). Caregivers who have a lower annual household income are more likely to live with their care recipient than those with a higher annual income (27% of those with an annual income less than $50,000 vs. 15% of those with an annual income of $50,000 or more). Caregivers who are not employed while caregiving are more likely to live with their care recipient than those who are employed (27% vs. 17%). Primary caregivers are more likely to live with their care recipient than non-primary caregivers (33% vs. 7%).
22
C A R E G I V I N G I N T H E U . S . - A F O C U S E D L O O K AT T H O S E C A R I N G F O R S O M E O N E A G E 5 0 O R O L D E R
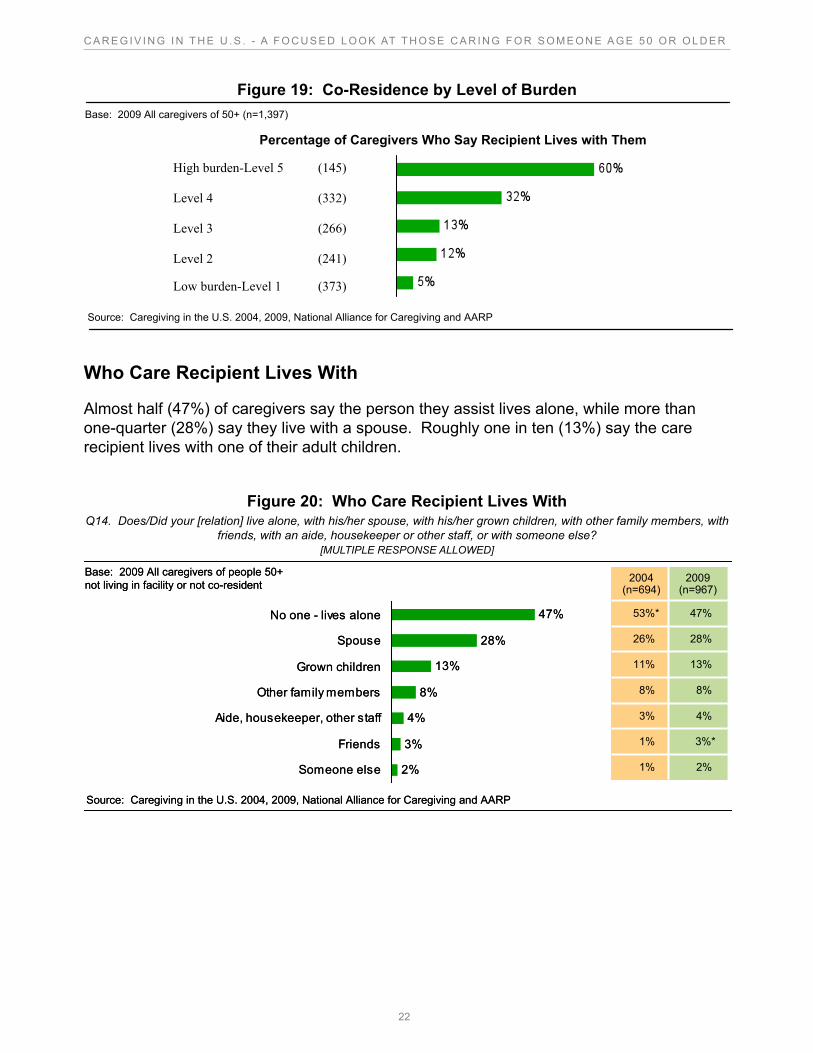
Figure 19: Co-Residence by Level of Burden
Base: 2009 All caregivers of 50+ (n=1,397)
Source: Caregiving in the U.S. 2004, 2009, National Alliance for Caregiving and AARP
High burden-Level 5 (145)
Level 4 (332)
Level 3 (266)
Level 2 (241)
Low burden-Level 1 (373)
Percentage of Caregivers Who Say Recipient Lives with Them
Who Care Recipient Lives With
Almost half (47%) of caregivers say the person they assist lives alone, while more than one-quarter (28%) say they live with a spouse. Roughly one in ten (13%) say the care recipient lives with one of their adult children.
Figure 20: Who Care Recipient Lives WithQ14. Does/Did your [relation] live alone, with his/her spouse, with his/her grown children, with other family members, with
friends, with an aide, housekeeper or other staff, or with someone else? [MULTIPLE RESPONSE ALLOWED]
28%
13%
8%
4%
3%
2%
47%No one - lives alone
Spouse
Grown children
Other family members
Aide, housekeeper, other staff
Friends
Someone else
Base: 2009 All caregivers of people 50+not living in facility or not co-resident
Source: Caregiving in the U.S. 2004, 2009, National Alliance for Caregiving and AARP
13%11%
4%3%
2%1%
3%*1%
8%8%
28%26%
47%53%*
2004(n=694)
2009(n=967)
13%11%
4%3%
2%1%
3%*1%
8%8%
28%26%
47%53%*
2004(n=694)
2009(n=967)
23
C A R E G I V I N G I N T H E U . S . - A F O C U S E D L O O K AT T H O S E C A R I N G F O R S O M E O N E A G E 5 0 O R O L D E R
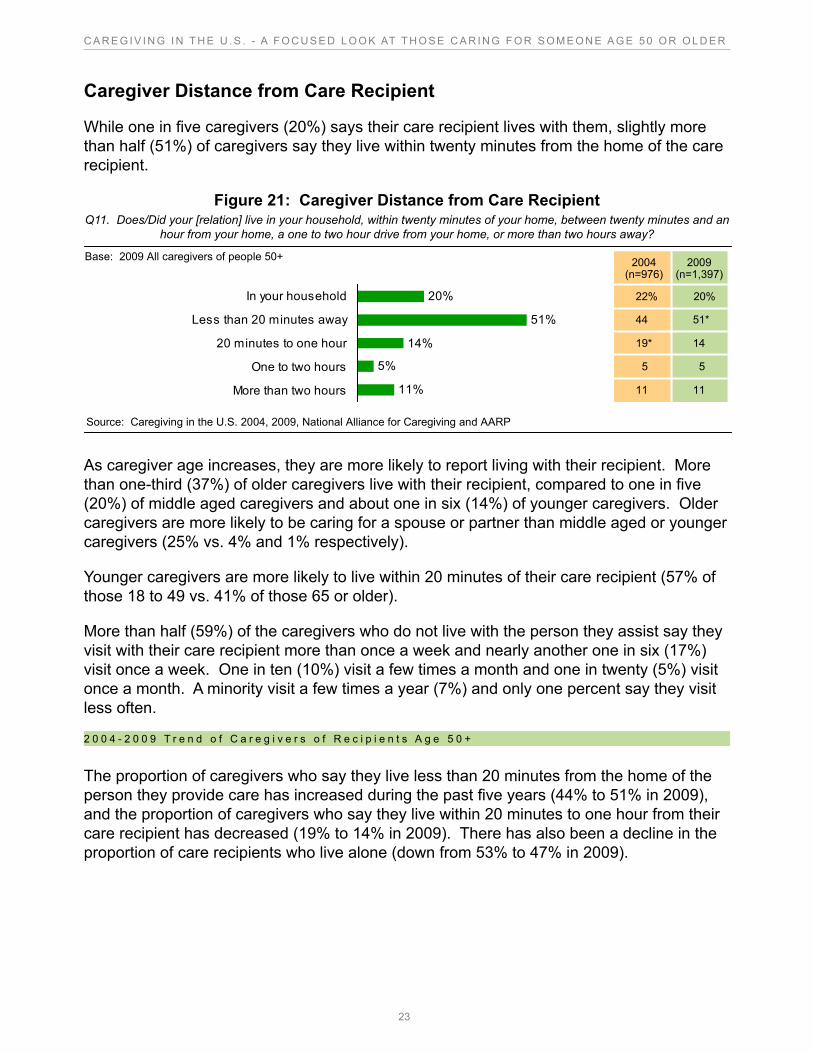
Caregiver Distance from Care Recipient
While one in five caregivers (20%) says their care recipient lives with them, slightly more than half (51%) of caregivers say they live within twenty minutes from the home of the care recipient.
Figure 21: Caregiver Distance from Care RecipientQ11. Does/Did your [relation] live in your household, within twenty minutes of your home, between twenty minutes and an
hour from your home, a one to two hour drive from your home, or more than two hours away?
1111
55
1419*
51*44
20%22%
2004(n=976)
2009(n=1,397)
1111
55
1419*
51*44
20%22%
2004(n=976)
2009(n=1,397)
Base: 2009 All caregivers of people 50+
51%
14%
5%
11%
20%In your household
Less than 20 minutes away
20 minutes to one hour
One to two hours
More than two hours
Source: Caregiving in the U.S. 2004, 2009, National Alliance for Caregiving and AARP
As caregiver age increases, they are more likely to report living with their recipient. More than one-third (37%) of older caregivers live with their recipient, compared to one in five (20%) of middle aged caregivers and about one in six (14%) of younger caregivers. Older caregivers are more likely to be caring for a spouse or partner than middle aged or younger caregivers (25% vs. 4% and 1% respectively).
Younger caregivers are more likely to live within 20 minutes of their care recipient (57% of those 18 to 49 vs. 41% of those 65 or older).
More than half (59%) of the caregivers who do not live with the person they assist say they visit with their care recipient more than once a week and nearly another one in six (17%) visit once a week. One in ten (10%) visit a few times a month and one in twenty (5%) visit once a month. A minority visit a few times a year (7%) and only one percent say they visit less often.
2 0 0 4 - 2 0 0 9 T r e n d o f C a r e g i v e r s o f R e c i p i e n t s A g e 5 0 +
The proportion of caregivers who say they live less than 20 minutes from the home of the person they provide care has increased during the past five years (44% to 51% in 2009), and the proportion of caregivers who say they live within 20 minutes to one hour from their care recipient has decreased (19% to 14% in 2009). There has also been a decline in the proportion of care recipients who live alone (down from 53% to 47% in 2009).
24
C A R E G I V I N G I N T H E U . S . - A F O C U S E D L O O K AT T H O S E C A R I N G F O R S O M E O N E A G E 5 0 O R O L D E R
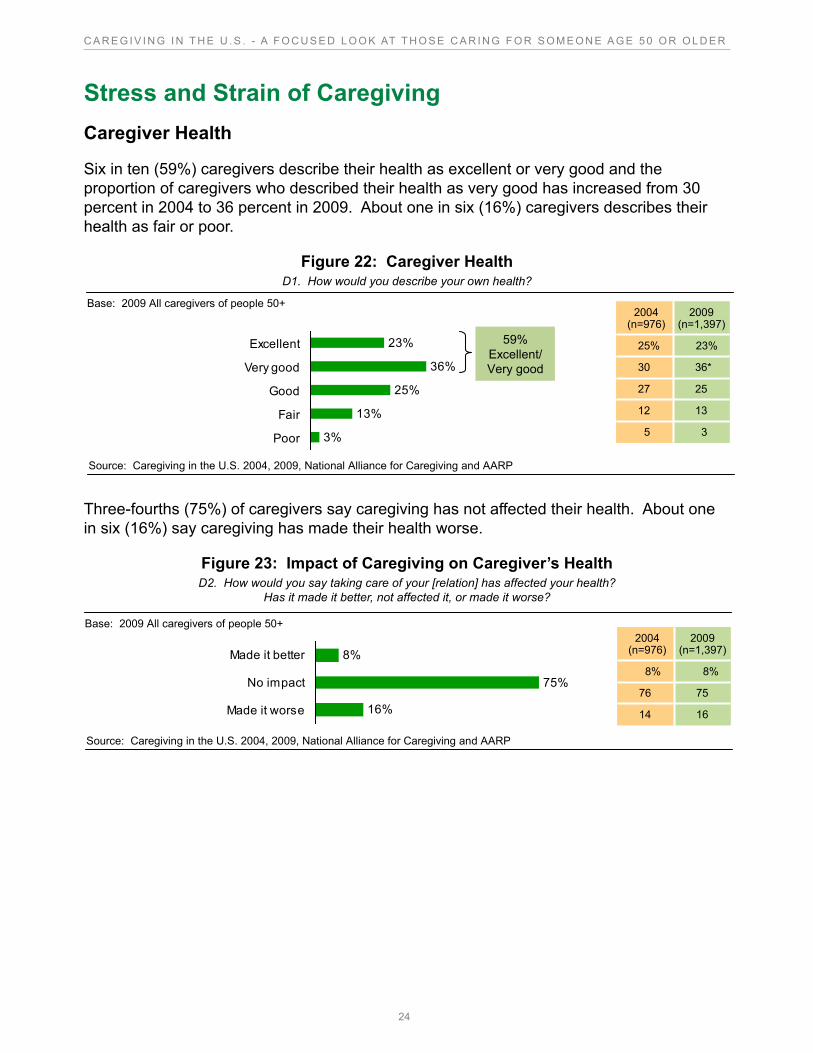
Stress and Strain of CaregivingCaregiver Health
Six in ten (59%) caregivers describe their health as excellent or very good and the proportion of caregivers who described their health as very good has increased from 30 percent in 2004 to 36 percent in 2009. About one in six (16%) caregivers describes their health as fair or poor.
Figure 22: Caregiver HealthD1. How would you describe your own health?
Source: Caregiving in the U.S. 2004, 2009, National Alliance for Caregiving and AARP
36%
25%
13%
3%
23%Excellent
Very good
Good
Fair
Poor
59% Excellent/Very good
35
1312
2527
36*30
23%25%
2004(n=976)
2009(n=1,397)
35
1312
2527
36*30
23%25%
2004(n=976)
2009(n=1,397)
Base: 2009 All caregivers of people 50+
Three-fourths (75%) of caregivers say caregiving has not affected their health. About one in six (16%) say caregiving has made their health worse.
Figure 23: Impact of Caregiving on Caregiver’s HealthD2. How would you say taking care of your [relation] has affected your health?
Has it made it better, not affected it, or made it worse?
Source: Caregiving in the U.S. 2004, 2009, National Alliance for Caregiving and AARP
Base: 2009 All caregivers of people 50+
75%
16%
8%Made it better
No impact
Made it worse 1614
7576
8%8%
2004(n=976)
2009(n=1,397)
1614
7576
8%8%
2004(n=976)
2009(n=1,397)
25
C A R E G I V I N G I N T H E U . S . - A F O C U S E D L O O K AT T H O S E C A R I N G F O R S O M E O N E A G E 5 0 O R O L D E R
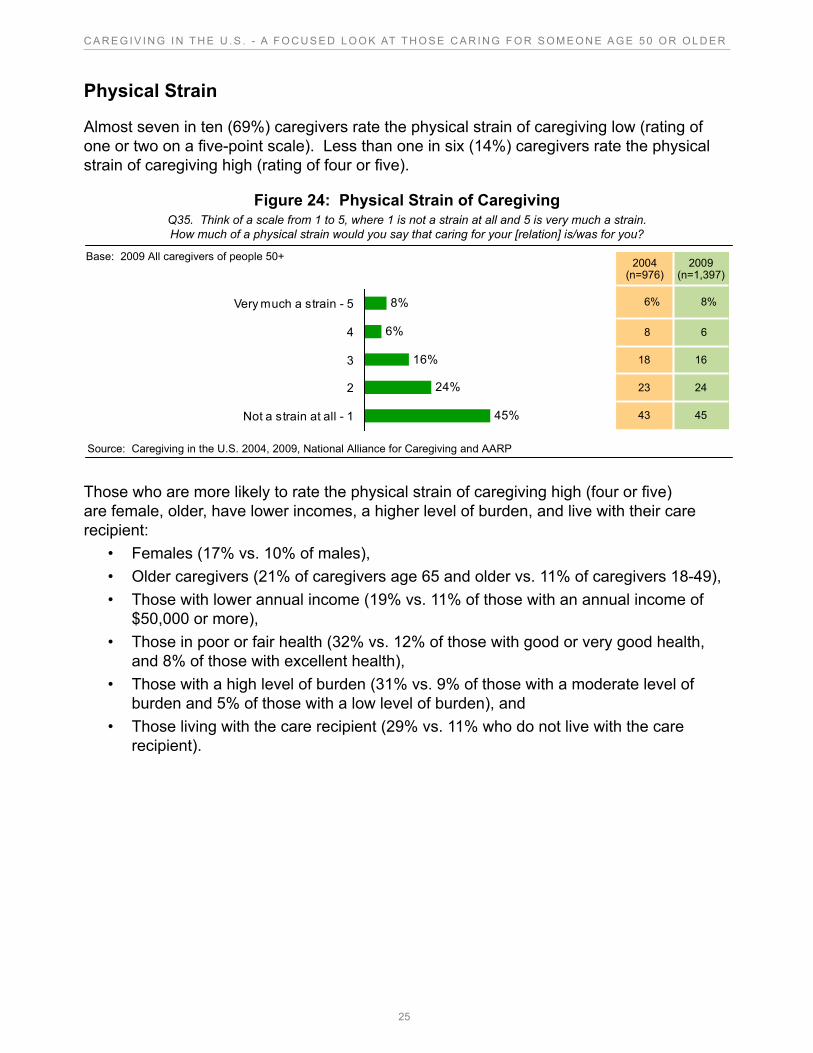
Physical Strain
Almost seven in ten (69%) caregivers rate the physical strain of caregiving low (rating of one or two on a five-point scale). Less than one in six (14%) caregivers rate the physical strain of caregiving high (rating of four or five).
Figure 24: Physical Strain of CaregivingQ35. Think of a scale from 1 to 5, where 1 is not a strain at all and 5 is very much a strain. How much of a physical strain would you say that caring for your [relation] is/was for you?
4543
2423
1618
68
8%6%
2004(n=976)
2009(n=1,397)
4543
2423
1618
68
8%6%
2004(n=976)
2009(n=1,397)
8%
6%
16%
24%
45%
Very much a strain - 5
4
3
2
Not a strain at all - 1
Base: 2009 All caregivers of people 50+
Source: Caregiving in the U.S. 2004, 2009, National Alliance for Caregiving and AARP
Those who are more likely to rate the physical strain of caregiving high (four or five) are female, older, have lower incomes, a higher level of burden, and live with their care recipient:
• Females (17% vs. 10% of males), • Older caregivers (21% of caregivers age 65 and older vs. 11% of caregivers 18-49),• Those with lower annual income (19% vs. 11% of those with an annual income of
$50,000 or more), • Those in poor or fair health (32% vs. 12% of those with good or very good health,
and 8% of those with excellent health), • Those with a high level of burden (31% vs. 9% of those with a moderate level of
burden and 5% of those with a low level of burden), and • Those living with the care recipient (29% vs. 11% who do not live with the care
recipient).
26
C A R E G I V I N G I N T H E U . S . - A F O C U S E D L O O K AT T H O S E C A R I N G F O R S O M E O N E A G E 5 0 O R O L D E R
Emotional Stress of Caregiving
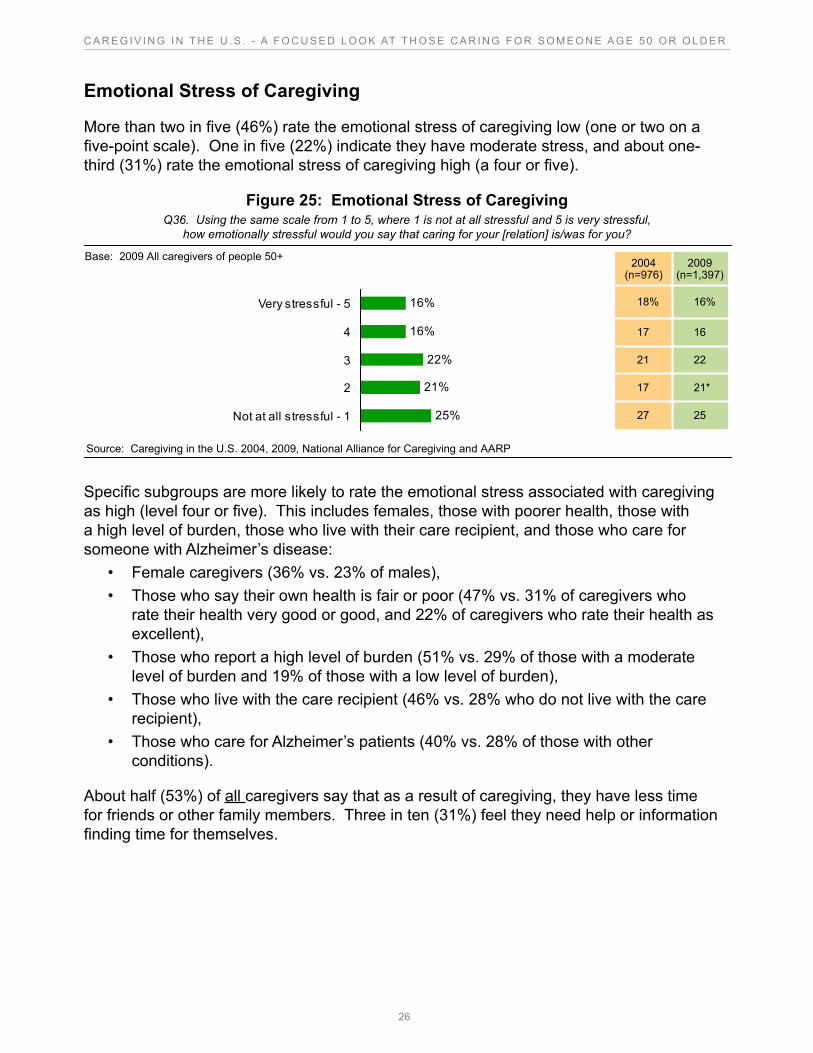
More than two in five (46%) rate the emotional stress of caregiving low (one or two on a five-point scale). One in five (22%) indicate they have moderate stress, and about one-third (31%) rate the emotional stress of caregiving high (a four or five).
Figure 25: Emotional Stress of CaregivingQ36. Using the same scale from 1 to 5, where 1 is not at all stressful and 5 is very stressful,
how emotionally stressful would you say that caring for your [relation] is/was for you?
2527
21*17
2221
1617
16%18%
2004(n=976)
2009(n=1,397)
2527
21*17
2221
1617
16%18%
2004(n=976)
2009(n=1,397)
Source: Caregiving in the U.S. 2004, 2009, National Alliance for Caregiving and AARP
16%
16%
22%
21%
25%
Very stressful - 5
4
3
2
Not at all stressful - 1
Base: 2009 All caregivers of people 50+
Specific subgroups are more likely to rate the emotional stress associated with caregiving as high (level four or five). This includes females, those with poorer health, those with a high level of burden, those who live with their care recipient, and those who care for someone with Alzheimer’s disease:
• Female caregivers (36% vs. 23% of males), • Those who say their own health is fair or poor (47% vs. 31% of caregivers who
rate their health very good or good, and 22% of caregivers who rate their health as excellent),
• Those who report a high level of burden (51% vs. 29% of those with a moderate level of burden and 19% of those with a low level of burden),
• Those who live with the care recipient (46% vs. 28% who do not live with the care recipient),
• Those who care for Alzheimer’s patients (40% vs. 28% of those with other conditions).
About half (53%) of all caregivers say that as a result of caregiving, they have less time for friends or other family members. Three in ten (31%) feel they need help or information finding time for themselves.
27
C A R E G I V I N G I N T H E U . S . - A F O C U S E D L O O K AT T H O S E C A R I N G F O R S O M E O N E A G E 5 0 O R O L D E R
Financial Hardship of Caregiving
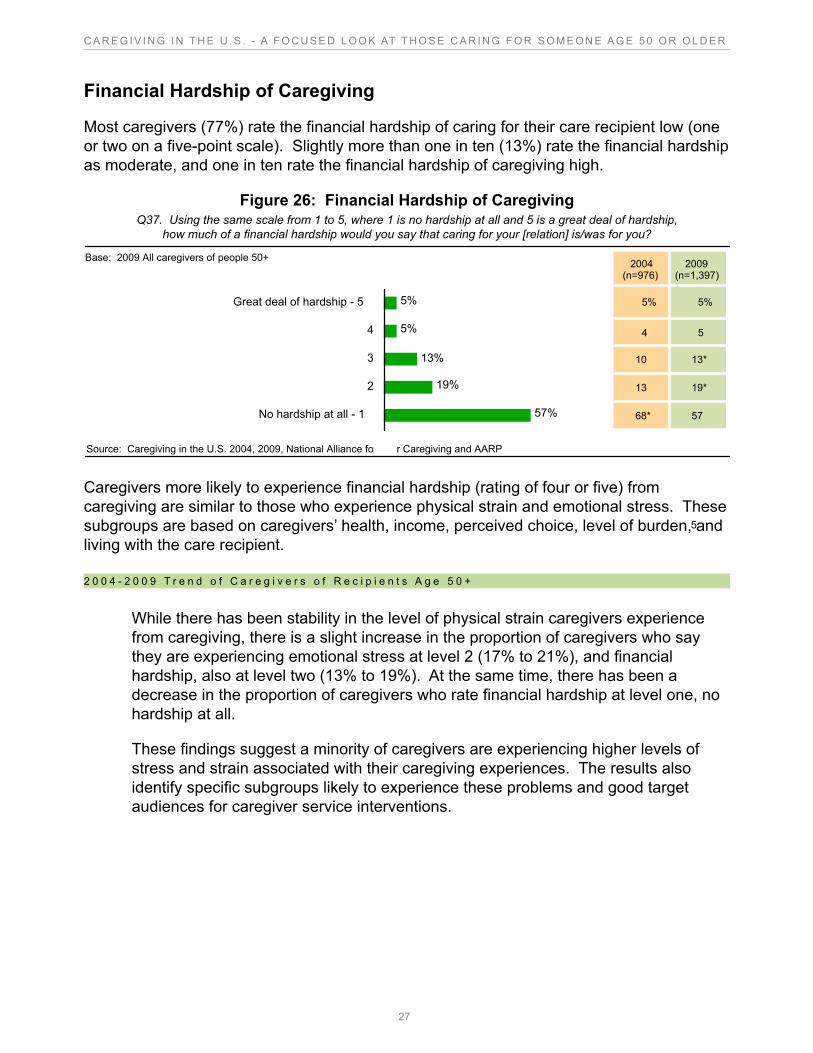
Most caregivers (77%) rate the financial hardship of caring for their care recipient low (one or two on a five-point scale). Slightly more than one in ten (13%) rate the financial hardship as moderate, and one in ten rate the financial hardship of caregiving high.
Figure 26: Financial Hardship of CaregivingQ37. Using the same scale from 1 to 5, where 1 is no hardship at all and 5 is a great deal of hardship,
how much of a financial hardship would you say that caring for your [relation] is/was for you?
5768*
19*13
1310
54
5%5%
2004(n=976)
2009(n=1,397)
5768*
19*13
13*10
54
5%5%
2004(n=976)
2009(n=1,397)
5%
5%
13%
19%
57%
Great deal of hardship - 5
4
3
2
No hardship at all - 1
Source: Caregiving in the U.S. 2004, 2009, National Alliance fo r Caregiving and AARP
Base: 2009 All caregivers of people 50+
Caregivers more likely to experience financial hardship (rating of four or five) from caregiving are similar to those who experience physical strain and emotional stress. These subgroups are based on caregivers’ health, income, perceived choice, level of burden, and living with the care recipient.
2 0 0 4 - 2 0 0 9 T r e n d o f C a r e g i v e r s o f R e c i p i e n t s A g e 5 0 +
While there has been stability in the level of physical strain caregivers experience from caregiving, there is a slight increase in the proportion of caregivers who say they are experiencing emotional stress at level 2 (17% to 21%), and financial hardship, also at level two (13% to 19%). At the same time, there has been a decrease in the proportion of caregivers who rate financial hardship at level one, no hardship at all.
These findings suggest a minority of caregivers are experiencing higher levels of stress and strain associated with their caregiving experiences. The results also identify specific subgroups likely to experience these problems and good target audiences for caregiver service interventions.
5
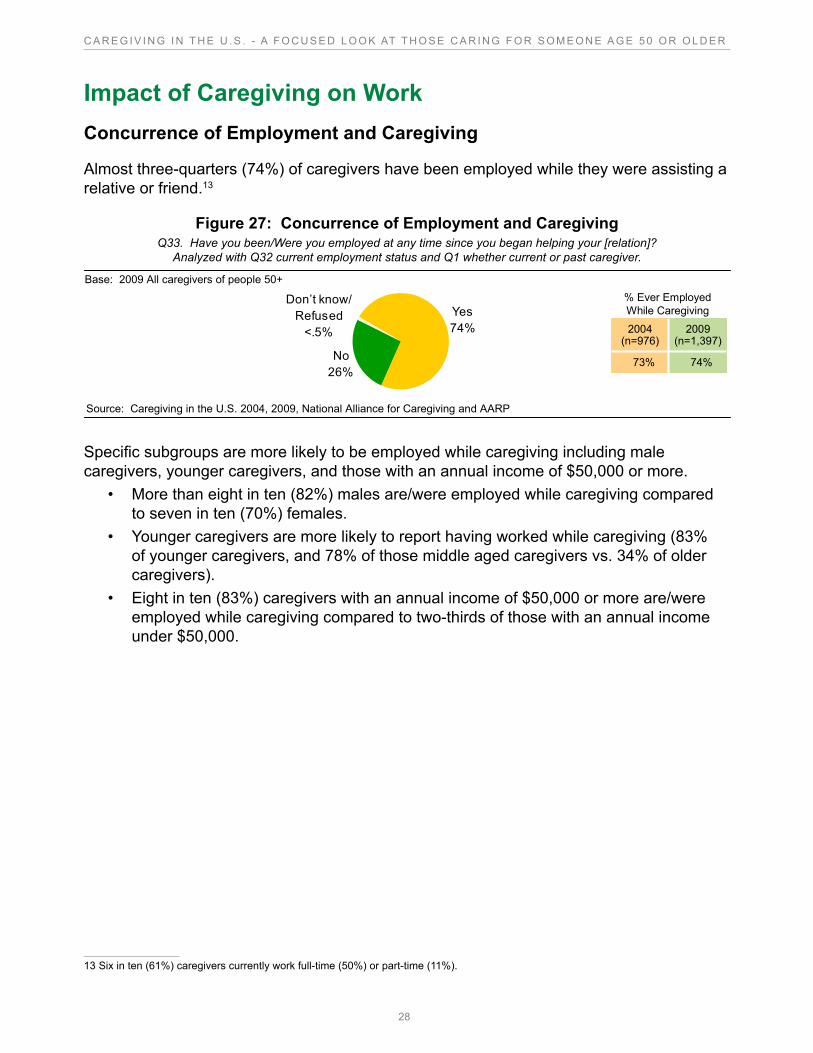
28
C A R E G I V I N G I N T H E U . S . - A F O C U S E D L O O K AT T H O S E C A R I N G F O R S O M E O N E A G E 5 0 O R O L D E R
Impact of Caregiving on WorkConcurrence of Employment and Caregiving
Almost three-quarters (74%) of caregivers have been employed while they were assisting a relative or friend.13
Figure 27: Concurrence of Employment and CaregivingQ33. Have you been/Were you employed at any time since you began helping your [relation]?
Analyzed with Q32 current employment status and Q1 whether current or past caregiver.
74%73%
2004(n=976)
2009(n=1,397)
74%73%
2004(n=976)
2009(n=1,397)
% Ever EmployedWhile CaregivingYes
74%
No26%
Don’t know/ Refused
<.5%
Source: Caregiving in the U.S. 2004, 2009, National Alliance for Caregiving and AARP
Base: 2009 All caregivers of people 50+
Specific subgroups are more likely to be employed while caregiving including male caregivers, younger caregivers, and those with an annual income of $50,000 or more.
• More than eight in ten (82%) males are/were employed while caregiving compared to seven in ten (70%) females.
• Younger caregivers are more likely to report having worked while caregiving (83% of younger caregivers, and 78% of those middle aged caregivers vs. 34% of older caregivers).
• Eight in ten (83%) caregivers with an annual income of $50,000 or more are/were employed while caregiving compared to two-thirds of those with an annual income under $50,000.
13 Six in ten (61%) caregivers currently work full-time (50%) or part-time (11%).
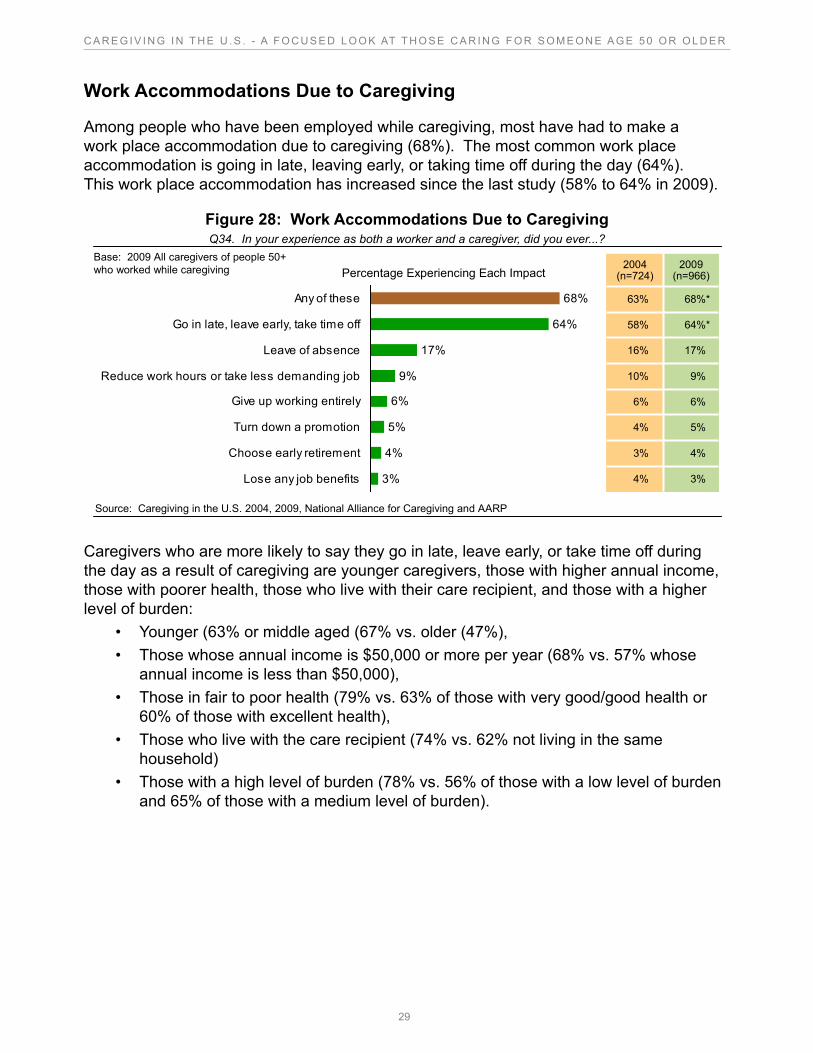
29
C A R E G I V I N G I N T H E U . S . - A F O C U S E D L O O K AT T H O S E C A R I N G F O R S O M E O N E A G E 5 0 O R O L D E R
Work Accommodations Due to Caregiving
Among people who have been employed while caregiving, most have had to make a work place accommodation due to caregiving (68%). The most common work place accommodation is going in late, leaving early, or taking time off during the day (64%). This work place accommodation has increased since the last study (58% to 64% in 2009).
Figure 28: Work Accommodations Due to CaregivingQ34. In your experience as both a worker and a caregiver, did you ever...?
Base: 2009 All caregivers of people 50+who worked while caregiving Percentage Experiencing Each Impact
68%*63%
64%*58%
17%16%
9%10%
6%6%
5%4%
4%3%
3%4%
2004(n=724)
2009(n=966)
68%*63%
64%*58%
17%16%
9%10%
6%6%
5%4%
4%3%
3%4%
2004(n=724)
2009(n=966)
68%
64%
9%
6%
5%
4%
3%
17%
Any of these
Go in late, leave early, take time off
Leave of absence
Reduce work hours or take less demanding job
Give up working entirely
Turn down a promotion
Choose early retirement
Lose any job benefits
Source: Caregiving in the U.S. 2004, 2009, National Alliance for Caregiving and AARP
Caregivers who are more likely to say they go in late, leave early, or take time off during the day as a result of caregiving are younger caregivers, those with higher annual income, those with poorer health, those who live with their care recipient, and those with a higher level of burden:
• Younger (63% or middle aged (67% vs. older (47%), • Those whose annual income is $50,000 or more per year (68% vs. 57% whose
annual income is less than $50,000), • Those in fair to poor health (79% vs. 63% of those with very good/good health or
60% of those with excellent health), • Those who live with the care recipient (74% vs. 62% not living in the same
household) • Those with a high level of burden (78% vs. 56% of those with a low level of burden
and 65% of those with a medium level of burden).
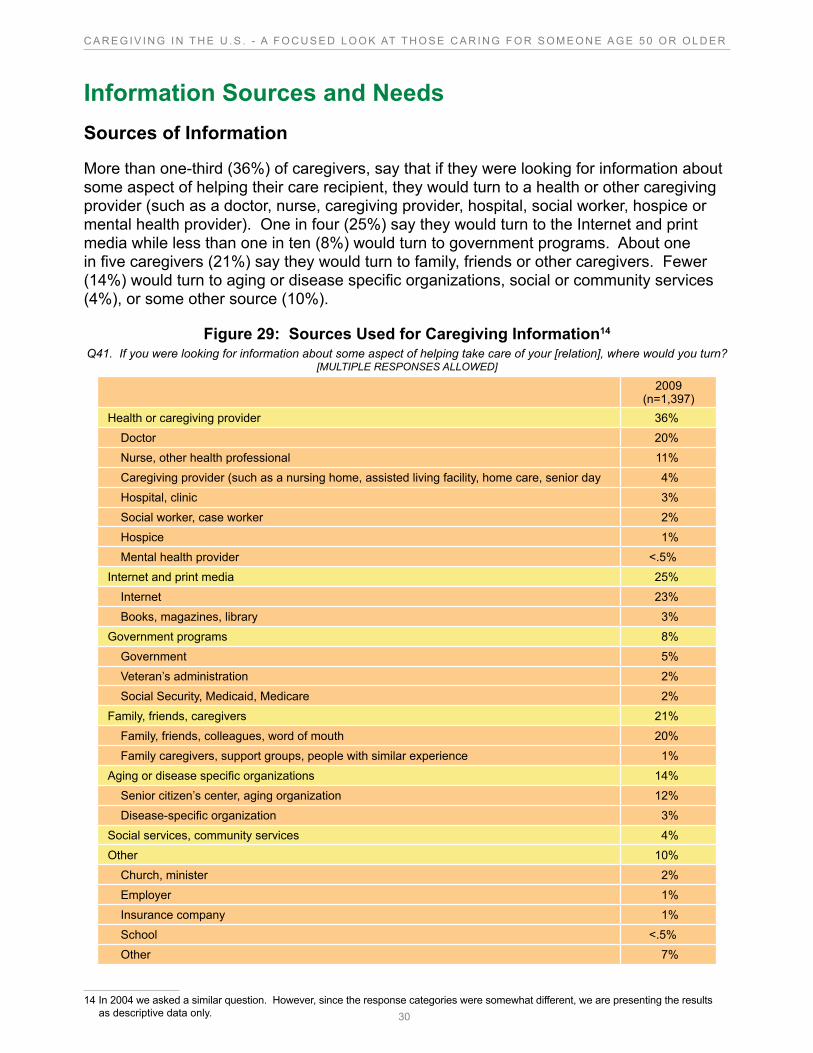
30
C A R E G I V I N G I N T H E U . S . - A F O C U S E D L O O K AT T H O S E C A R I N G F O R S O M E O N E A G E 5 0 O R O L D E R
Information Sources and NeedsSources of Information
More than one-third (36%) of caregivers, say that if they were looking for information about some aspect of helping their care recipient, they would turn to a health or other caregiving provider (such as a doctor, nurse, caregiving provider, hospital, social worker, hospice or mental health provider). One in four (25%) say they would turn to the Internet and print media while less than one in ten (8%) would turn to government programs. About one in five caregivers (21%) say they would turn to family, friends or other caregivers. Fewer (14%) would turn to aging or disease specific organizations, social or community services (4%), or some other source (10%).
Figure 29: Sources Used for Caregiving Information14
Q41. If you were looking for information about some aspect of helping take care of your [relation], where would you turn? [MULTIPLE RESPONSES ALLOWED]
2009 (n=1,397)
Health or caregiving provider 36%Doctor 20%Nurse, other health professional 11%Caregiving provider (such as a nursing home, assisted living facility, home care, senior day 4%Hospital, clinic 3%Social worker, case worker 2%Hospice 1%Mental health provider <.5%
Internet and print media 25%Internet 23%Books, magazines, library 3%
Government programs 8%Government 5%Veteran’s administration 2%Social Security, Medicaid, Medicare 2%
Family, friends, caregivers 21%Family, friends, colleagues, word of mouth 20%Family caregivers, support groups, people with similar experience 1%
Aging or disease specific organizations 14%Senior citizen’s center, aging organization 12%Disease-specific organization 3%
Social services, community services 4%Other 10%
Church, minister 2%Employer 1%Insurance company 1%School <.5%Other 7%
14 In 2004 we asked a similar question. However, since the response categories were somewhat different, we are presenting the results as descriptive data only.
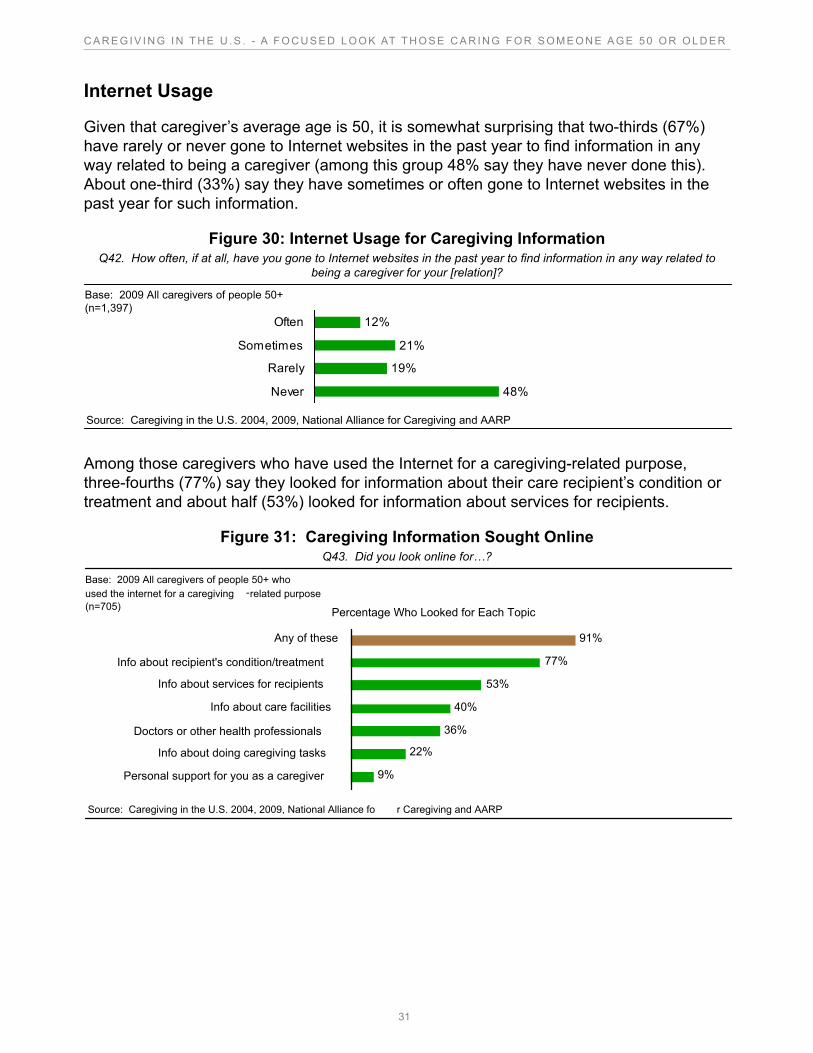
31
C A R E G I V I N G I N T H E U . S . - A F O C U S E D L O O K AT T H O S E C A R I N G F O R S O M E O N E A G E 5 0 O R O L D E R
Internet Usage
Given that caregiver’s average age is 50, it is somewhat surprising that two-thirds (67%) have rarely or never gone to Internet websites in the past year to find information in any way related to being a caregiver (among this group 48% say they have never done this). About one-third (33%) say they have sometimes or often gone to Internet websites in the past year for such information.
Figure 30: Internet Usage for Caregiving InformationQ42. How often, if at all, have you gone to Internet websites in the past year to find information in any way related to
being a caregiver for your [relation]?
12%
21%
19%
48%
Often
Sometimes
Rarely
Never
Source: Caregiving in the U.S. 2004, 2009, National Alliance for Caregiving and AARP
Base: 2009 All caregivers of people 50+(n=1,397)
Among those caregivers who have used the Internet for a caregiving-related purpose, three-fourths (77%) say they looked for information about their care recipient’s condition or treatment and about half (53%) looked for information about services for recipients.
Figure 31: Caregiving Information Sought OnlineQ43. Did you look online for…?
Base: 2009 All caregivers of people 50+ who
used the internet for a caregiving -related purpose
(n=705)Percentage Who Looked for Each Topic
91%
77%
9%
53%
36%
40%
22%
Any of these
Info about recipient's condition/treatment
Info about services for recipients
Info about care facilities
Doctors or other health professionals
Info about doing caregiving tasks
Personal support for you as a caregiver
Source: Caregiving in the U.S. 2004, 2009, National Alliance fo r Caregiving and AARP
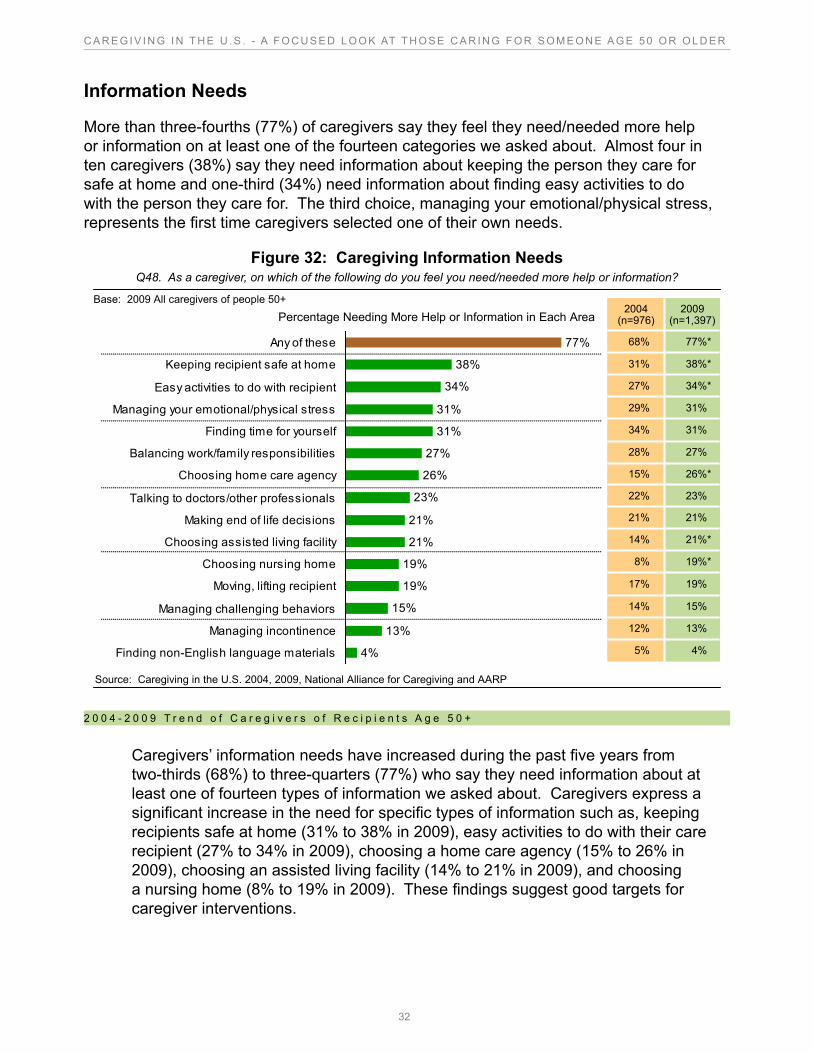
32
C A R E G I V I N G I N T H E U . S . - A F O C U S E D L O O K AT T H O S E C A R I N G F O R S O M E O N E A G E 5 0 O R O L D E R
Information Needs
More than three-fourths (77%) of caregivers say they feel they need/needed more help or information on at least one of the fourteen categories we asked about. Almost four in ten caregivers (38%) say they need information about keeping the person they care for safe at home and one-third (34%) need information about finding easy activities to do with the person they care for. The third choice, managing your emotional/physical stress, represents the first time caregivers selected one of their own needs.
Figure 32: Caregiving Information NeedsQ48. As a caregiver, on which of the following do you feel you need/needed more help or information?
19%*8%
19%17%
26%*15%
34%*27%
4%5%
13%12%
15%14%
21%*14%
21%21%
77%*68%
38%*31%
31%29%
31%34%
27%28%
23%22%
2004(n=976)
2009(n=1,397)
19%*8%
19%17%
26%*15%
34%*27%
4%5%
13%12%
15%14%
21%*14%
21%21%
77%*68%
38%*31%
31%29%
31%34%
27%28%
23%22%
2004(n=976)
2009(n=1,397)
Source: Caregiving in the U.S. 2004, 2009, National Alliance for Caregiving and AARP
Percentage Needing More Help or Information in Each AreaBase: 2009 All caregivers of people 50+
77%
31%
31%
27%
26%
23%
21%
21%
19%
19%
15%
13%
4%
38%
34%
Any of these
Keeping recipient safe at home
Easy activities to do with recipient
Managing your emotional/physical stress
Finding time for yourself
Balancing work/family responsibilities
Choosing home care agency
Talking to doctors/other professionals
Making end of life decisions
Choosing assisted living facility
Choosing nursing home
Moving, lifting recipient
Managing challenging behaviors
Managing incontinence
Finding non-English language materials
2 0 0 4 - 2 0 0 9 T r e n d o f C a r e g i v e r s o f R e c i p i e n t s A g e 5 0 +
Caregivers’ information needs have increased during the past five years from two-thirds (68%) to three-quarters (77%) who say they need information about at least one of fourteen types of information we asked about. Caregivers express a significant increase in the need for specific types of information such as, keeping recipients safe at home (31% to 38% in 2009), easy activities to do with their care recipient (27% to 34% in 2009), choosing a home care agency (15% to 26% in 2009), choosing an assisted living facility (14% to 21% in 2009), and choosing a nursing home (8% to 19% in 2009). These findings suggest good targets for caregiver interventions.
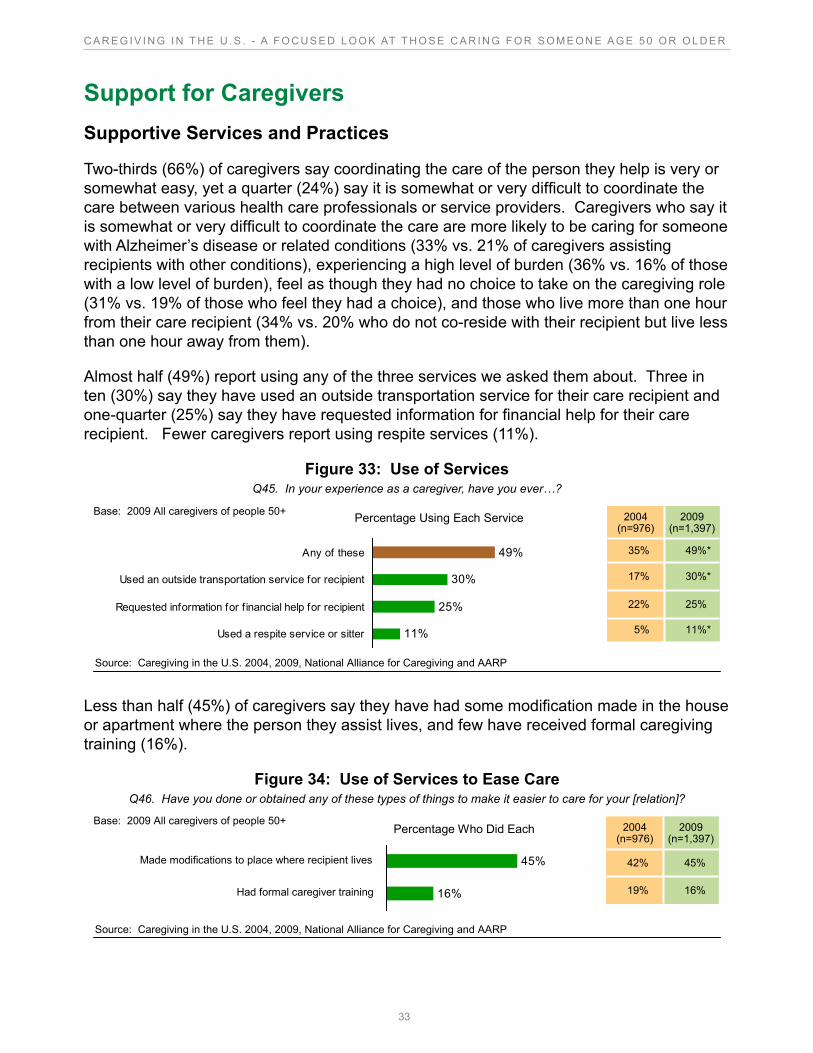
33
C A R E G I V I N G I N T H E U . S . - A F O C U S E D L O O K AT T H O S E C A R I N G F O R S O M E O N E A G E 5 0 O R O L D E R
Support for CaregiversSupportive Services and Practices
Two-thirds (66%) of caregivers say coordinating the care of the person they help is very or somewhat easy, yet a quarter (24%) say it is somewhat or very difficult to coordinate the care between various health care professionals or service providers. Caregivers who say it is somewhat or very difficult to coordinate the care are more likely to be caring for someone with Alzheimer’s disease or related conditions (33% vs. 21% of caregivers assisting recipients with other conditions), experiencing a high level of burden (36% vs. 16% of those with a low level of burden), feel as though they had no choice to take on the caregiving role (31% vs. 19% of those who feel they had a choice), and those who live more than one hour from their care recipient (34% vs. 20% who do not co-reside with their recipient but live less than one hour away from them).
Almost half (49%) report using any of the three services we asked them about. Three in ten (30%) say they have used an outside transportation service for their care recipient and one-quarter (25%) say they have requested information for financial help for their care recipient. Fewer caregivers report using respite services (11%).
Figure 33: Use of ServicesQ45. In your experience as a caregiver, have you ever…?
49%*35%
30%*17%
25%22%
11%*5%
2004(n=976)
2009(n=1,397)
49%*35%
30%*17%
25%22%
11%*5%
2004(n=976)
2009(n=1,397)
Source: Caregiving in the U.S. 2004, 2009, National Alliance for Caregiving and AARP
49%
30%
25%
11%
Any of these
Used an outside transportation service for recipient
Requested information for f inancial help for recipient
Used a respite service or sitter
Base: 2009 All caregivers of people 50+ Percentage Using Each Service
Less than half (45%) of caregivers say they have had some modification made in the house or apartment where the person they assist lives, and few have received formal caregiving training (16%).
Figure 34: Use of Services to Ease CareQ46. Have you done or obtained any of these types of things to make it easier to care for your [relation]?
16%19%
45%42%
2004(n=976)
2009(n=1,397)
16%19%
45%42%
2004(n=976)
2009(n=1,397)
Base: 2009 All caregivers of people 50+
45%
16%
Percentage Who Did Each
Source: Caregiving in the U.S. 2004, 2009, National Alliance for Caregiving and AARP
Made modifications to place where recipient lives
Had formal caregiver training
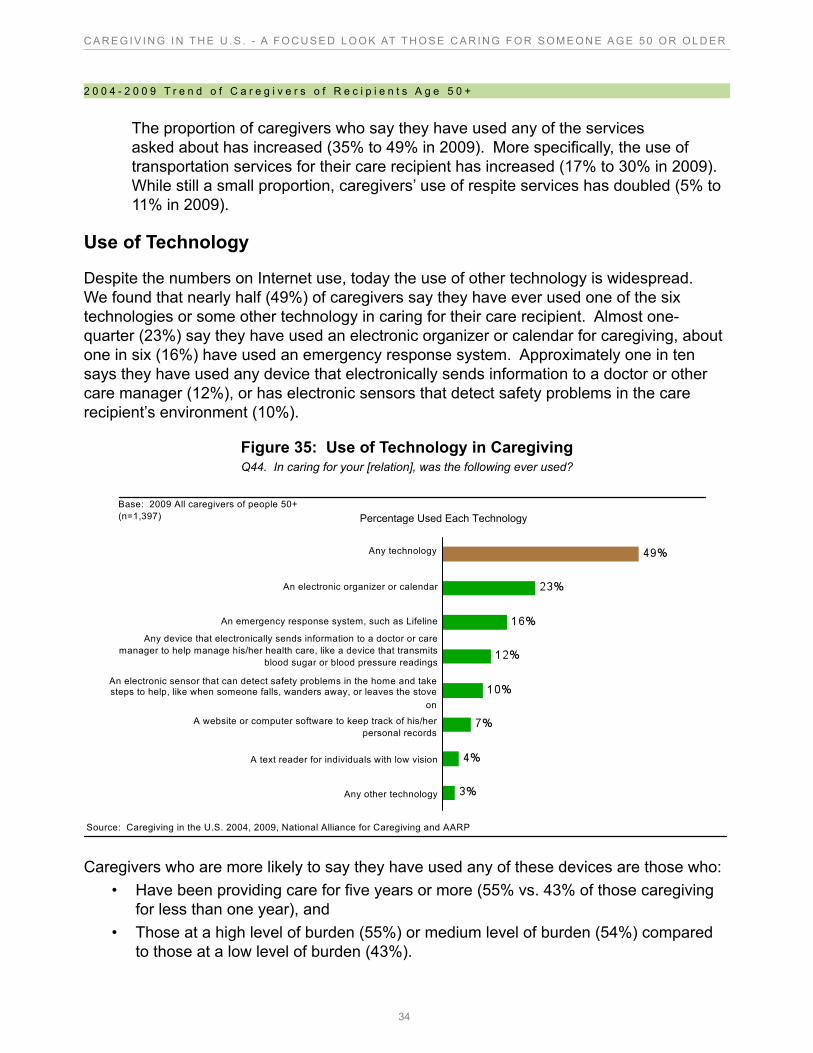
34
C A R E G I V I N G I N T H E U . S . - A F O C U S E D L O O K AT T H O S E C A R I N G F O R S O M E O N E A G E 5 0 O R O L D E R
2 0 0 4 - 2 0 0 9 T r e n d o f C a r e g i v e r s o f R e c i p i e n t s A g e 5 0 +
The proportion of caregivers who say they have used any of the services asked about has increased (35% to 49% in 2009). More specifically, the use of transportation services for their care recipient has increased (17% to 30% in 2009). While still a small proportion, caregivers’ use of respite services has doubled (5% to 11% in 2009).
Use of Technology
Despite the numbers on Internet use, today the use of other technology is widespread. We found that nearly half (49%) of caregivers say they have ever used one of the six technologies or some other technology in caring for their care recipient. Almost one-quarter (23%) say they have used an electronic organizer or calendar for caregiving, about one in six (16%) have used an emergency response system. Approximately one in ten says they have used any device that electronically sends information to a doctor or other care manager (12%), or has electronic sensors that detect safety problems in the care recipient’s environment (10%).
Figure 35: Use of Technology in CaregivingQ44. In caring for your [relation], was the following ever used?
Source: Caregiving in the U.S. 2004, 2009, National Alliance for Caregiving and AARP
Any technology
Any device that electronically sends information to a doctor or care
manager to help manage his/her health care, like a device that transmits
blood sugar or blood pressure readings
An emergency response system, such as Lifeline
An electronic sensor that can detect safety problems in the home and take steps to help, like when someone falls, wanders away, or leaves the stove
on
An electronic organizer or calendar
A website or computer software to keep track of his/her
personal records
Any other technology
A text reader for individuals with low vision
Percentage Used Each Technology
Base: 2009 All caregivers of people 50+
(n=1,397)
Caregivers who are more likely to say they have used any of these devices are those who:• Have been providing care for five years or more (55% vs. 43% of those caregiving
for less than one year), and • Those at a high level of burden (55%) or medium level of burden (54%) compared
to those at a low level of burden (43%).
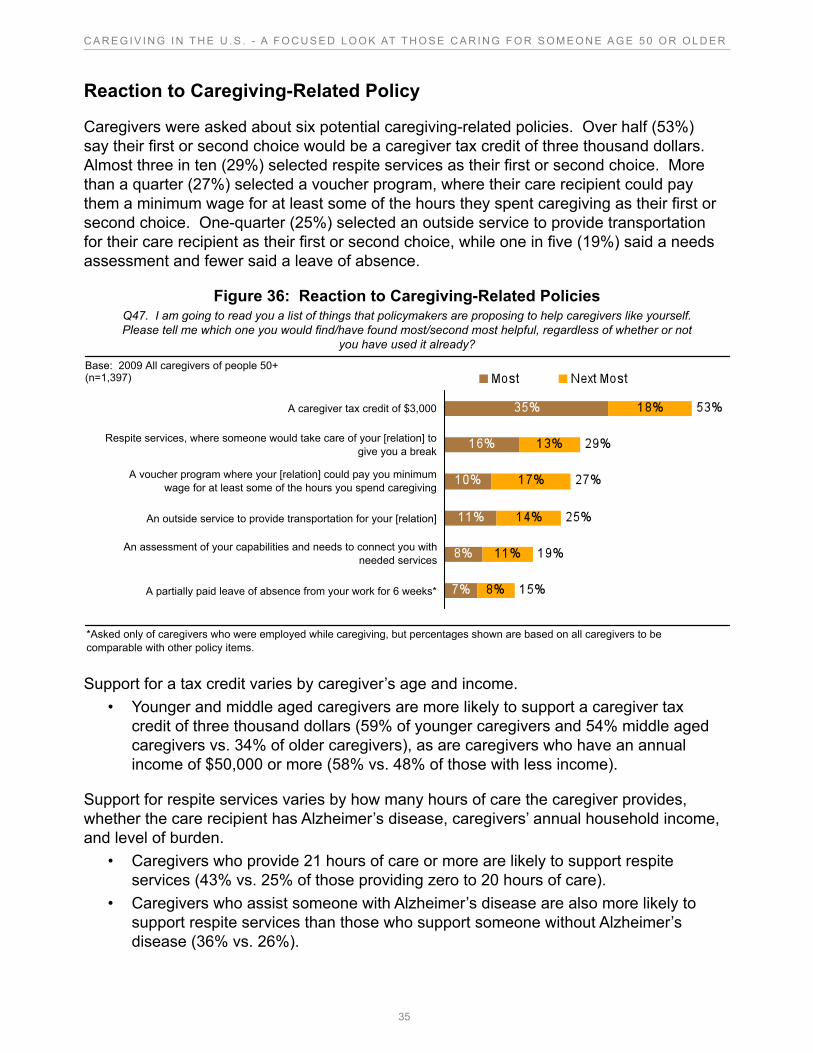
35
C A R E G I V I N G I N T H E U . S . - A F O C U S E D L O O K AT T H O S E C A R I N G F O R S O M E O N E A G E 5 0 O R O L D E R
Reaction to Caregiving-Related Policy
Caregivers were asked about six potential caregiving-related policies. Over half (53%) say their first or second choice would be a caregiver tax credit of three thousand dollars. Almost three in ten (29%) selected respite services as their first or second choice. More than a quarter (27%) selected a voucher program, where their care recipient could pay them a minimum wage for at least some of the hours they spent caregiving as their first or second choice. One-quarter (25%) selected an outside service to provide transportation for their care recipient as their first or second choice, while one in five (19%) said a needs assessment and fewer said a leave of absence.
Figure 36: Reaction to Caregiving-Related PoliciesQ47. I am going to read you a list of things that policymakers are proposing to help caregivers like yourself. Please tell me which one you would find/have found most/second most helpful, regardless of whether or not
you have used it already?
*Asked only of caregivers who were employed while caregiving, but percentages shown are based on all caregivers to be
comparable with other policy items.
Base: 2009 All caregivers of people 50+ (n=1,397)
A caregiver tax credit of $3,000
Respite services, where someone would take care of your [relation] to
give you a break
An outside service to provide transportation for your [relation]
An assessment of your capabilities and needs to connect you with
needed services
A voucher program where your [relation] could pay you minimum
wage for at least some of the hours you spend caregiving
A partially paid leave of absence from your work for 6 weeks*
Support for a tax credit varies by caregiver’s age and income. • Younger and middle aged caregivers are more likely to support a caregiver tax
credit of three thousand dollars (59% of younger caregivers and 54% middle aged caregivers vs. 34% of older caregivers), as are caregivers who have an annual income of $50,000 or more (58% vs. 48% of those with less income).
Support for respite services varies by how many hours of care the caregiver provides, whether the care recipient has Alzheimer’s disease, caregivers’ annual household income, and level of burden.
• Caregivers who provide 21 hours of care or more are likely to support respite services (43% vs. 25% of those providing zero to 20 hours of care).
• Caregivers who assist someone with Alzheimer’s disease are also more likely to support respite services than those who support someone without Alzheimer’s disease (36% vs. 26%).
36
C A R E G I V I N G I N T H E U . S . - A F O C U S E D L O O K AT T H O S E C A R I N G F O R S O M E O N E A G E 5 0 O R O L D E R
• Caregivers who have an annual household income of $100,000 or more are more likely to support respite services (37% vs. 25% of those with an annual income of $30,000 to $49,000).
• Caregivers with a high or medium level of burden are more likely to support respite services than caregivers with a low level of burden (42% and 34% vs. 18% respectively).
Support for a voucher program varies by whether the caregiver and recipient live together. It also varies by caregiver’s age, annual income, and hours of care provided. Caregivers who are more likely to support a voucher program:
• Live with their care recipient (35% vs. 24% who do not live with their care recipient),
• Are younger (33% of caregivers 18 to 49 vs. 23% of caregivers 50 to 64 and 17% of caregivers age 65 and older),
• Have lower incomes (32% vs. 22% of those with an annual income of $50,000 or more).
• Provide more hours of care (32% of those who provide 21 hours of care or more vs. 22% who provide zero to eight hours of care in an average week).
37
C A R E G I V I N G I N T H E U . S . - A F O C U S E D L O O K AT T H O S E C A R I N G F O R S O M E O N E A G E 5 0 O R O L D E R
IV. Summary and ConclusionsCaregivers are still a diverse group with a variety of experiences. There are caregivers who are minimally involved in providing care, they report having a relatively easy experience managing their care recipient’s needs and little negative impact on their own emotional, physical or financial lives. On the other hand, a smaller proportion of caregivers carry a heavy burden which takes a toll on them by increasing their vulnerability to physical strain, emotional stress, and financial hardships.
As the baby boom continues to age over the next 25 years, the proportion of people needing care may increase while the availability of family members to fill the caregiving role may decrease. This study shows caregivers are already using some types of technology that provide them greater freedom while helping to maintain the health and safety of their care recipients in the home. They are also using transportation services to navigate the community.
In the future, new policies may help support caregivers or expand services to assist both themselves and their care recipient. This study has given a voice to the preferences of today’s caregivers regarding policy options. In the meantime, we need to provide specific information and supports identified in this study such as how to provide safe and stimulating home environments, meet their transportation needs, and help them choose home care agencies, assisted living facilities, or nursing homes when the time is right for them. We can also identify functional benchmarks which can assist families to decide when a variety of technologies may be helpful to both the caregiver and the care recipient.
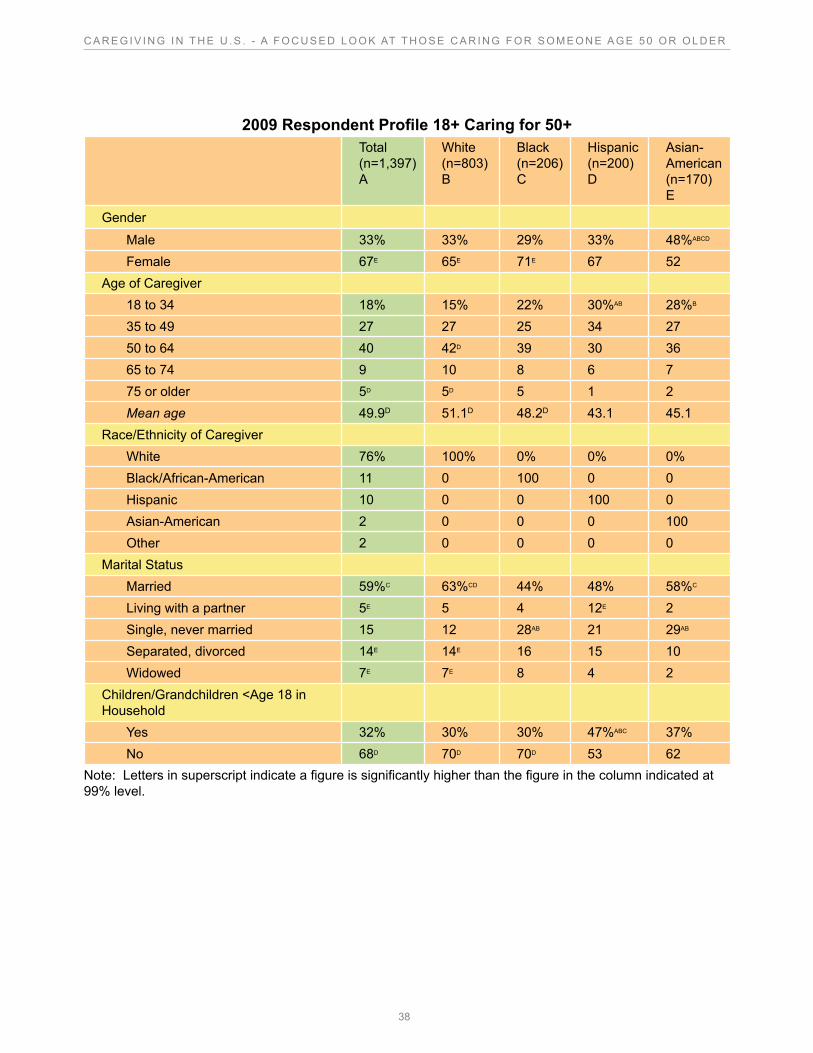
38
C A R E G I V I N G I N T H E U . S . - A F O C U S E D L O O K AT T H O S E C A R I N G F O R S O M E O N E A G E 5 0 O R O L D E R
2009 Respondent Profile 18+ Caring for 50+ Total
(n=1,397) A
White (n=803) B
Black (n=206) C
Hispanic (n=200) D
Asian-American (n=170) E
Gender
Male 33% 33% 29% 33% 48%ABCD
Female 67E 65E 71E 67 52Age of Caregiver 18 to 34 18% 15% 22% 30%AB 28%B
35 to 49 27 27 25 34 27 50 to 64 40 42D 39 30 36 65 to 74 9 10 8 6 7 75 or older 5D 5D 5 1 2 Mean age 49.9D 51.1D 48.2D 43.1 45.1Race/Ethnicity of Caregiver White 76% 100% 0% 0% 0% Black/African-American 11 0 100 0 0 Hispanic 10 0 0 100 0 Asian-American 2 0 0 0 100 Other 2 0 0 0 0Marital Status Married 59%C 63%CD 44% 48% 58%C
Living with a partner 5E 5 4 12E 2 Single, never married 15 12 28AB 21 29AB
Separated, divorced 14E 14E 16 15 10 Widowed 7E 7E 8 4 2Children/Grandchildren <Age 18 in Household Yes 32% 30% 30% 47%ABC 37% No 68D 70D 70D 53 62
Note: Letters in superscript indicate a figure is significantly higher than the figure in the column indicated at 99% level.
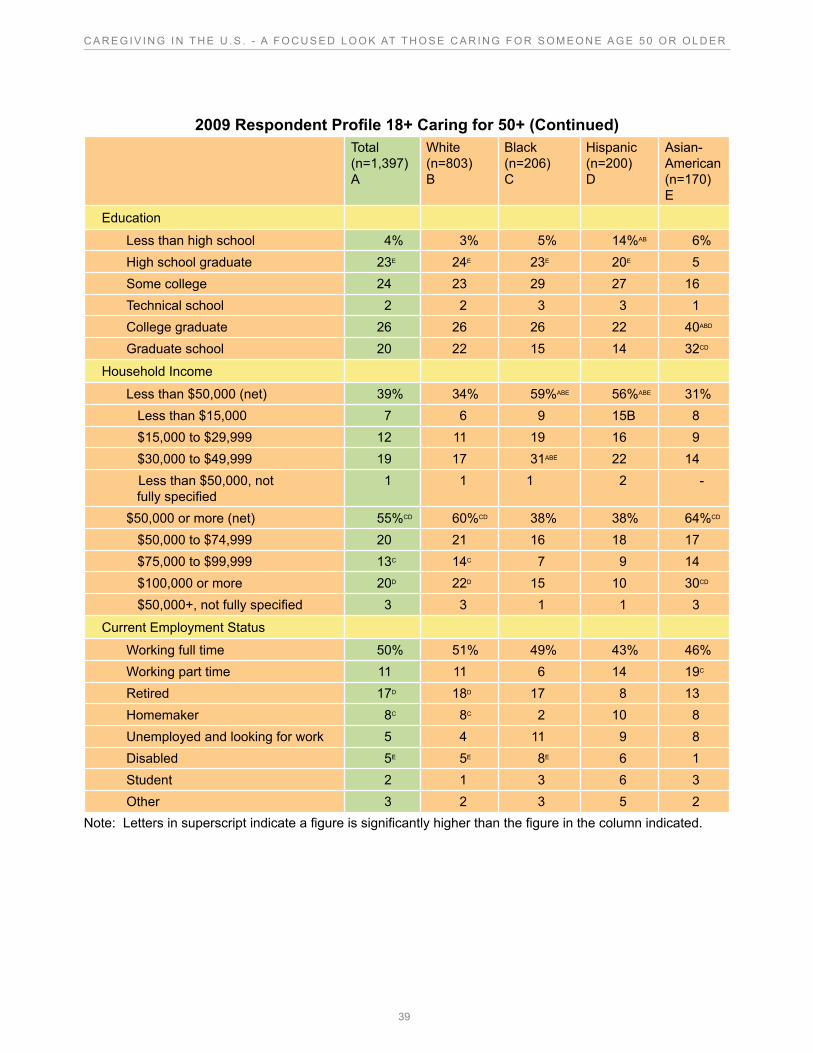
39
C A R E G I V I N G I N T H E U . S . - A F O C U S E D L O O K AT T H O S E C A R I N G F O R S O M E O N E A G E 5 0 O R O L D E R
2009 Respondent Profile 18+ Caring for 50+ (Continued) Total
(n=1,397) A
White (n=803) B
Black (n=206) C
Hispanic (n=200) D
Asian-American (n=170) E
Education
Less than high school 4% 3% 5% 14%AB 6% High school graduate 23E 24E 23E 20E 5 Some college 24 23 29 27 16 Technical school 2 2 3 3 1 College graduate 26 26 26 22 40ABD
Graduate school 20 22 15 14 32CD
Household Income
Less than $50,000 (net) 39% 34% 59%ABE 56%ABE 31% Less than $15,000 7 6 9 15B 8 $15,000 to $29,999 12 11 19 16 9 $30,000 to $49,999 19 17 31ABE 22 14
Less than $50,000, not fully specified
1 1 1 2 -
$50,000 or more (net) 55%CD 60%CD 38% 38% 64%CD
$50,000 to $74,999 20 21 16 18 17 $75,000 to $99,999 13C 14C 7 9 14 $100,000 or more 20D 22D 15 10 30CD
$50,000+, not fully specified 3 3 1 1 3
Current Employment Status
Working full time 50% 51% 49% 43% 46% Working part time 11 11 6 14 19C
Retired 17D 18D 17 8 13 Homemaker 8C 8C 2 10 8 Unemployed and looking for work 5 4 11 9 8 Disabled 5E 5E 8E 6 1 Student 2 1 3 6 3 Other 3 2 3 5 2
Note: Letters in superscript indicate a figure is significantly higher than the figure in the column indicated.
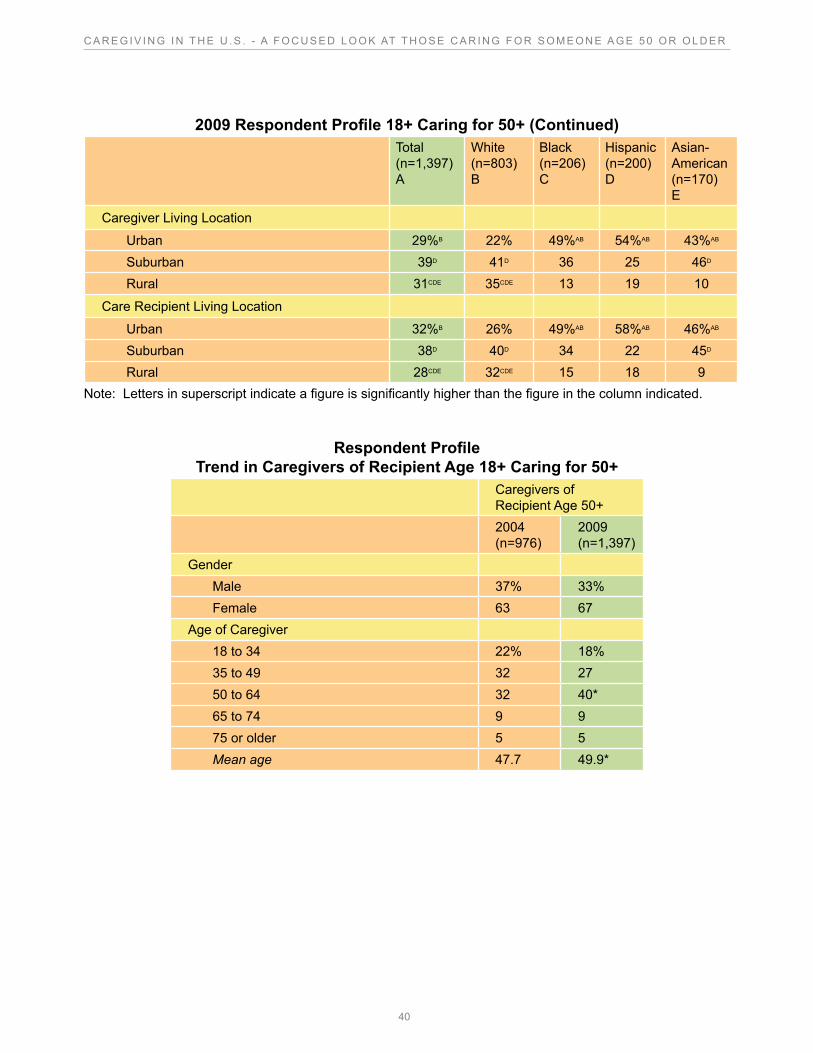
40
C A R E G I V I N G I N T H E U . S . - A F O C U S E D L O O K AT T H O S E C A R I N G F O R S O M E O N E A G E 5 0 O R O L D E R
2009 Respondent Profile 18+ Caring for 50+ (Continued) Total
(n=1,397) A
White (n=803) B
Black (n=206) C
Hispanic (n=200) D
Asian-American (n=170) E
Caregiver Living Location
Urban 29%B 22% 49%AB 54%AB 43%AB
Suburban 39D 41D 36 25 46D
Rural 31CDE 35CDE 13 19 10
Care Recipient Living Location
Urban 32%B 26% 49%AB 58%AB 46%AB
Suburban 38D 40D 34 22 45D
Rural 28CDE 32CDE 15 18 9Note: Letters in superscript indicate a figure is significantly higher than the figure in the column indicated.
Respondent Profile Trend in Caregivers of Recipient Age 18+ Caring for 50+
Caregivers of Recipient Age 50+
2004 (n=976)
2009 (n=1,397)
Gender Male 37% 33% Female 63 67Age of Caregiver 18 to 34 22% 18% 35 to 49 32 27 50 to 64 32 40* 65 to 74 9 9 75 or older 5 5 Mean age 47.7 49.9*
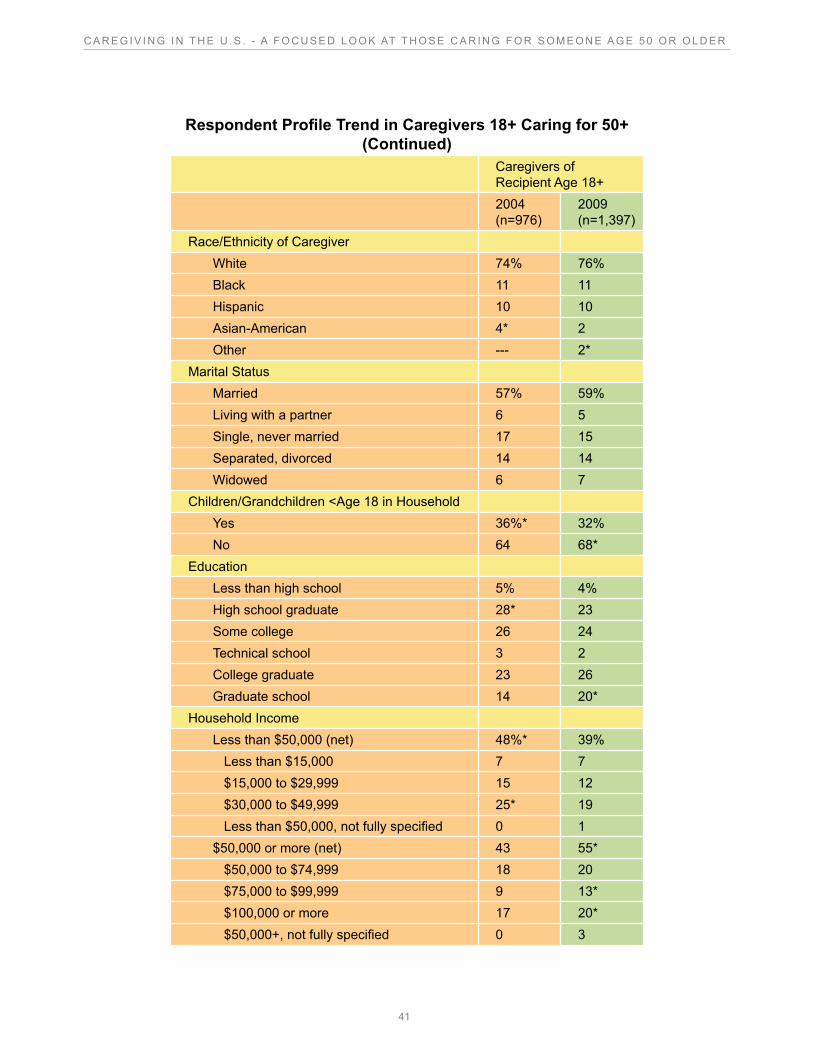
41
C A R E G I V I N G I N T H E U . S . - A F O C U S E D L O O K AT T H O S E C A R I N G F O R S O M E O N E A G E 5 0 O R O L D E R
Respondent Profile Trend in Caregivers 18+ Caring for 50+ (Continued)
Caregivers of Recipient Age 18+
2004 (n=976)
2009 (n=1,397)
Race/Ethnicity of Caregiver White 74% 76% Black 11 11 Hispanic 10 10 Asian-American 4* 2 Other --- 2*Marital Status Married 57% 59% Living with a partner 6 5 Single, never married 17 15 Separated, divorced 14 14 Widowed 6 7Children/Grandchildren <Age 18 in Household Yes 36%* 32% No 64 68*Education Less than high school 5% 4% High school graduate 28* 23 Some college 26 24 Technical school 3 2 College graduate 23 26 Graduate school 14 20*Household Income Less than $50,000 (net) 48%* 39% Less than $15,000 7 7 $15,000 to $29,999 15 12 $30,000 to $49,999 25* 19 Less than $50,000, not fully specified 0 1 $50,000 or more (net) 43 55* $50,000 to $74,999 18 20 $75,000 to $99,999 9 13* $100,000 or more 17 20* $50,000+, not fully specified 0 3
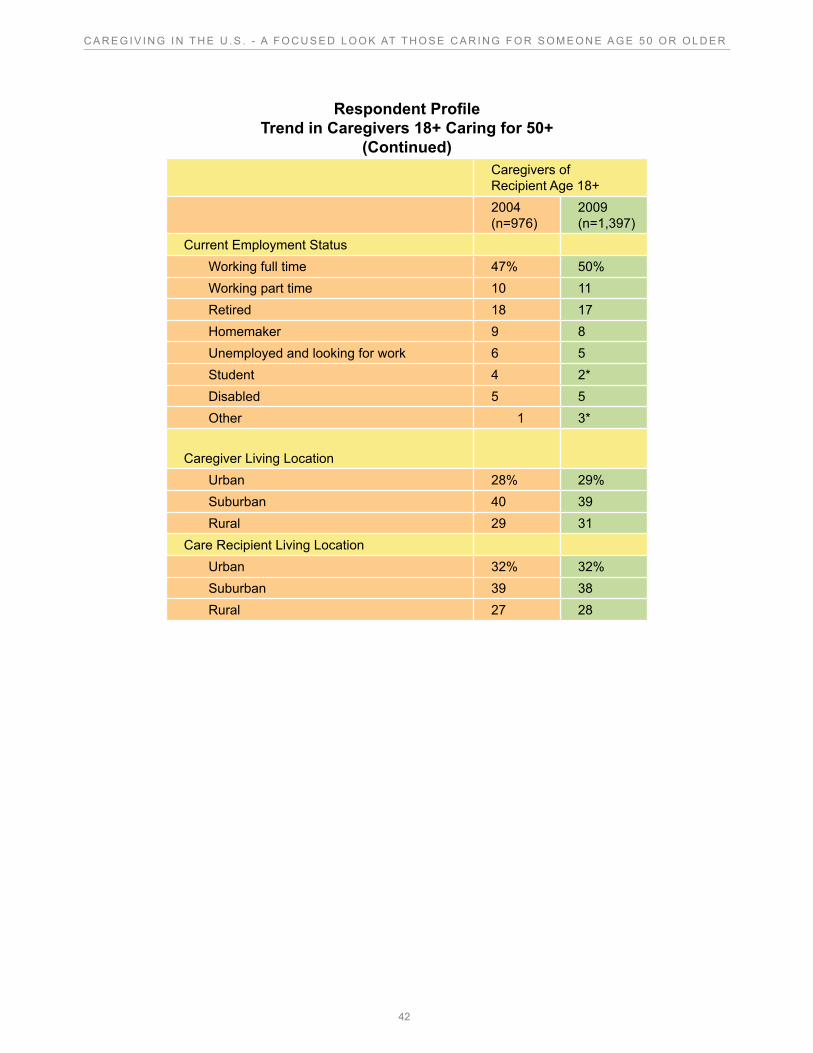
42
C A R E G I V I N G I N T H E U . S . - A F O C U S E D L O O K AT T H O S E C A R I N G F O R S O M E O N E A G E 5 0 O R O L D E R
Respondent Profile Trend in Caregivers 18+ Caring for 50+
(Continued)Caregivers of Recipient Age 18+
2004 (n=976)
2009 (n=1,397)
Current Employment Status Working full time 47% 50% Working part time 10 11 Retired 18 17 Homemaker 9 8 Unemployed and looking for work 6 5 Student 4 2* Disabled 5 5 Other 1 3*
Caregiver Living Location Urban 28% 29% Suburban 40 39 Rural 29 31Care Recipient Living Location Urban 32% 32% Suburban 39 38 Rural 27 28
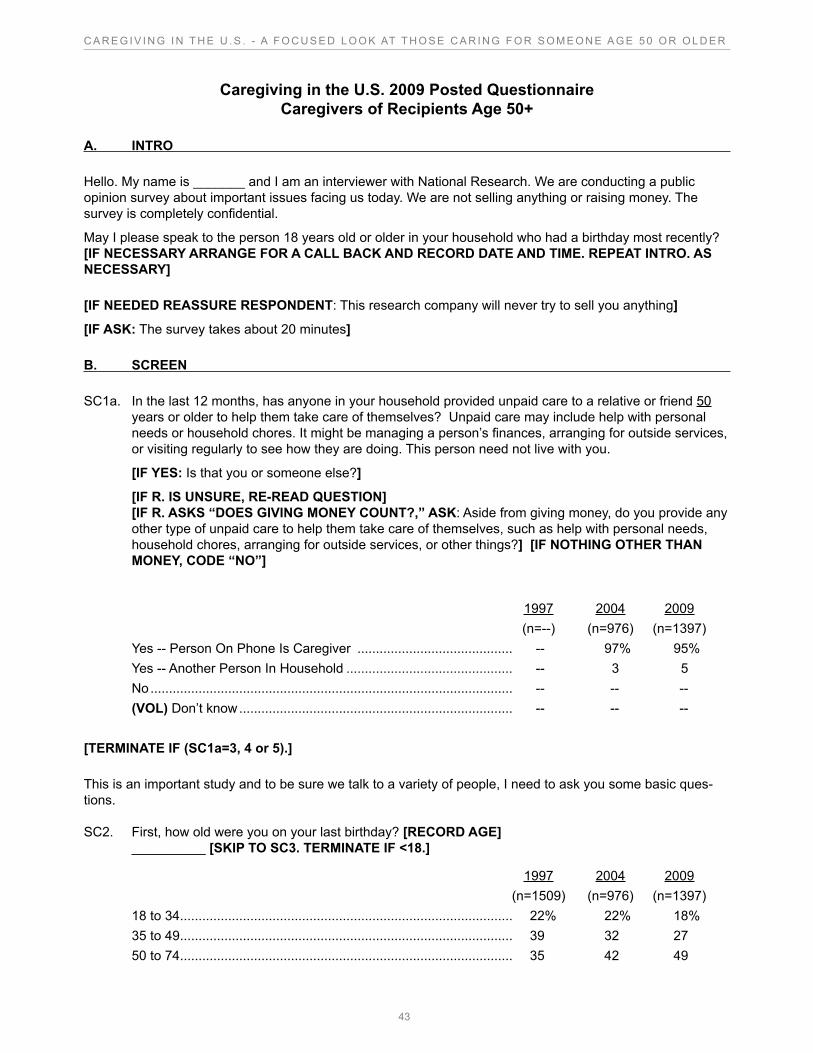
43
C A R E G I V I N G I N T H E U . S . - A F O C U S E D L O O K AT T H O S E C A R I N G F O R S O M E O N E A G E 5 0 O R O L D E R
Caregiving in the U.S. 2009 Posted QuestionnaireCaregivers of Recipients Age 50+
A. INTRO
Hello. My name is _______ and I am an interviewer with National Research. We are conducting a public opinion survey about important issues facing us today. We are not selling anything or raising money. The survey is completely confidential.
May I please speak to the person 18 years old or older in your household who had a birthday most recently? [IF NECESSARY ARRANGE FOR A CALL BACK AND RECORD DATE AND TIME. REPEAT INTRO. AS NECESSARY]
[IF NEEDED REASSURE RESPONDENT: This research company will never try to sell you anything]
[IF ASK: The survey takes about 20 minutes]
B. SCREEN
SC1a. In the last 12 months, has anyone in your household provided unpaid care to a relative or friend 50 years or older to help them take care of themselves? Unpaid care may include help with personal needs or household chores. It might be managing a person’s finances, arranging for outside services, or visiting regularly to see how they are doing. This person need not live with you.
[IF YES: Is that you or someone else?]
[IF R. IS UNSURE, RE-READ QUESTION] [IF R. ASKS “DOES GIVING MONEY COUNT?,” ASK: Aside from giving money, do you provide any other type of unpaid care to help them take care of themselves, such as help with personal needs, household chores, arranging for outside services, or other things?] [IF NOTHING OTHER THAN MONEY, CODE “NO”]
1997 2004 2009 (n=--) (n=976) (n=1397)Yes -- Person On Phone Is Caregiver .......................................... -- 97% 95% Yes -- Another Person In Household ............................................. -- 3 5No .................................................................................................. -- -- --(VOL) Don’t know .......................................................................... -- -- --
[TERMINATE IF (SC1a=3, 4 or 5).]
This is an important study and to be sure we talk to a variety of people, I need to ask you some basic ques-tions.
SC2. First, how old were you on your last birthday? [RECORD AGE]__________ [SKIP TO SC3. TERMINATE IF <18.]
1997 2004 2009 (n=1509) (n=976) (n=1397)18 to 34 .......................................................................................... 22% 22% 18%35 to 49 .......................................................................................... 39 32 2750 to 74 .......................................................................................... 35 42 49
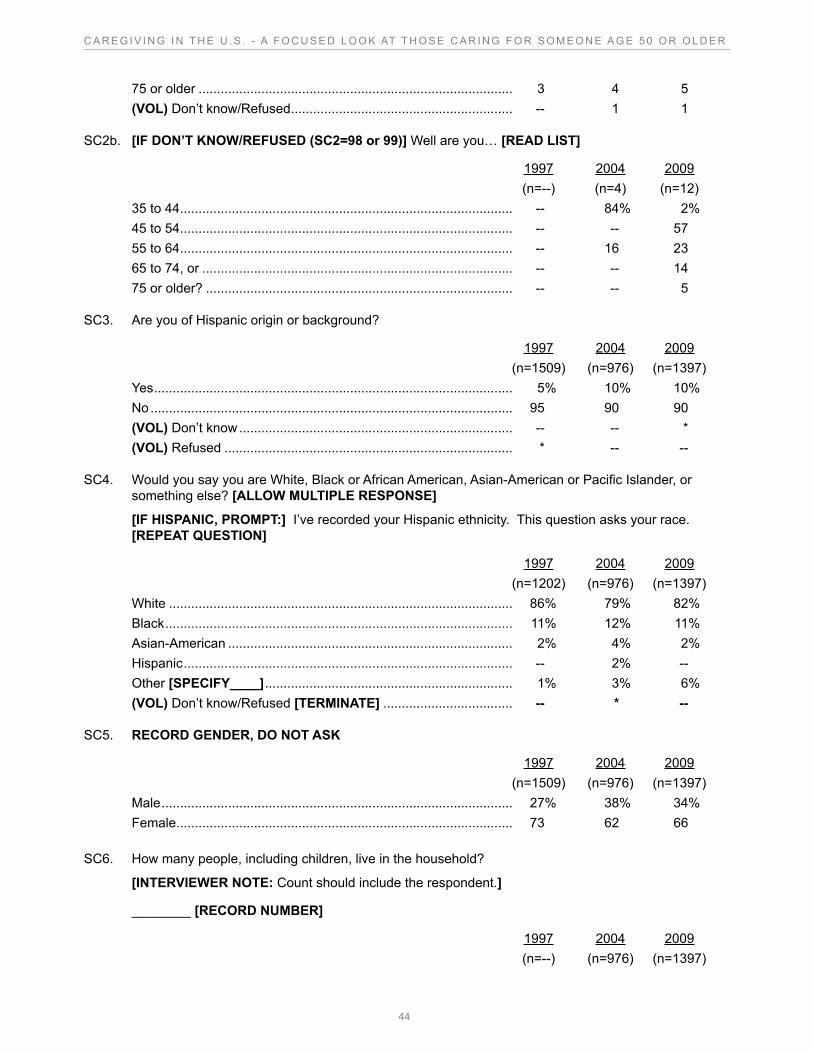
44
C A R E G I V I N G I N T H E U . S . - A F O C U S E D L O O K AT T H O S E C A R I N G F O R S O M E O N E A G E 5 0 O R O L D E R
75 or older ..................................................................................... 3 4 5(VOL) Don’t know/Refused ............................................................ -- 1 1
SC2b. [IF DON’T KNOW/REFUSED (SC2=98 or 99)] Well are you… [READ LIST]
1997 2004 2009 (n=--) (n=4) (n=12)35 to 44 .......................................................................................... -- 84% 2%45 to 54 .......................................................................................... -- -- 5755 to 64 .......................................................................................... -- 16 2365 to 74, or .................................................................................... -- -- 1475 or older? ................................................................................... -- -- 5
SC3. Are you of Hispanic origin or background?
1997 2004 2009 (n=1509) (n=976) (n=1397)Yes ................................................................................................. 5% 10% 10%No .................................................................................................. 95 90 90(VOL) Don’t know .......................................................................... -- -- *(VOL) Refused .............................................................................. * -- --
SC4. Would you say you are White, Black or African American, Asian-American or Pacific Islander, or something else? [ALLOW MULTIPLE RESPONSE]
[IF HISPANIC, PROMPT:] I’ve recorded your Hispanic ethnicity. This question asks your race. [REPEAT QUESTION]
1997 2004 2009 (n=1202) (n=976) (n=1397)White ............................................................................................. 86% 79% 82%Black .............................................................................................. 11% 12% 11%Asian-American ............................................................................. 2% 4% 2%Hispanic ......................................................................................... -- 2% --Other [SPECIFY____] ................................................................... 1% 3% 6%(VOL) Don’t know/Refused [TERMINATE] ................................... -- * --
SC5. RECORD GENDER, DO NOT ASK
1997 2004 2009 (n=1509) (n=976) (n=1397)Male ............................................................................................... 27% 38% 34%Female ........................................................................................... 73 62 66
SC6. How many people, including children, live in the household?
[INTERVIEWER NOTE: Count should include the respondent.]
________ [RECORD NUMBER]
1997 2004 2009 (n=--) (n=976) (n=1397)
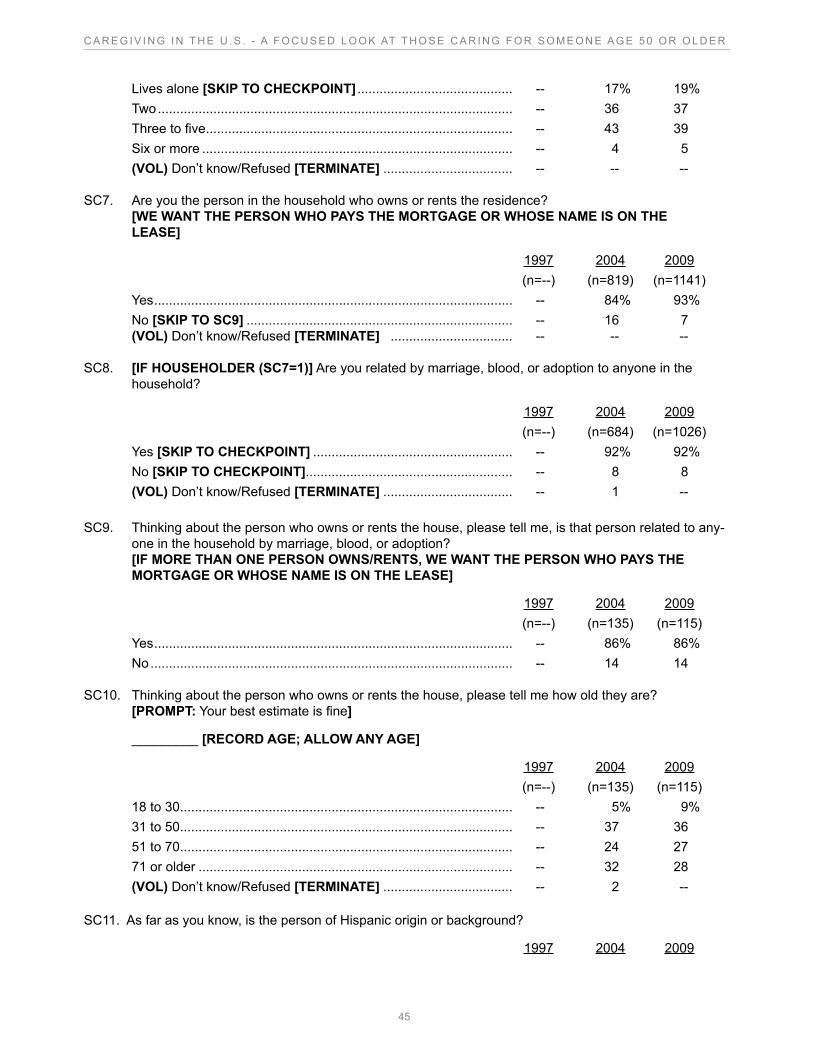
45
C A R E G I V I N G I N T H E U . S . - A F O C U S E D L O O K AT T H O S E C A R I N G F O R S O M E O N E A G E 5 0 O R O L D E R
Lives alone [SKIP TO CHECKPOINT] .......................................... -- 17% 19%Two ................................................................................................ -- 36 37Three to five ................................................................................... -- 43 39 Six or more .................................................................................... -- 4 5(VOL) Don’t know/Refused [TERMINATE] ................................... -- -- --
SC7. Are you the person in the household who owns or rents the residence? [WE WANT THE PERSON WHO PAYS THE MORTGAGE OR WHOSE NAME IS ON THE LEASE]
1997 2004 2009 (n=--) (n=819) (n=1141)Yes ................................................................................................. -- 84% 93%No [SKIP TO SC9] ........................................................................ -- 16 7(VOL) Don’t know/Refused [TERMINATE] ................................. -- -- --
SC8. [IF HOUSEHOLDER (SC7=1)] Are you related by marriage, blood, or adoption to anyone in the household?
1997 2004 2009 (n=--) (n=684) (n=1026)Yes [SKIP TO CHECKPOINT] ...................................................... -- 92% 92%No [SKIP TO CHECKPOINT]........................................................ -- 8 8(VOL) Don’t know/Refused [TERMINATE] ................................... -- 1 --
SC9. Thinking about the person who owns or rents the house, please tell me, is that person related to any-one in the household by marriage, blood, or adoption? [IF MORE THAN ONE PERSON OWNS/RENTS, WE WANT THE PERSON WHO PAYS THE MORTGAGE OR WHOSE NAME IS ON THE LEASE]
1997 2004 2009 (n=--) (n=135) (n=115)Yes ................................................................................................. -- 86% 86%No .................................................................................................. -- 14 14
SC10. Thinking about the person who owns or rents the house, please tell me how old they are? [PROMPT: Your best estimate is fine]
_________ [RECORD AGE; ALLOW ANY AGE]
1997 2004 2009 (n=--) (n=135) (n=115)18 to 30 .......................................................................................... -- 5% 9% 31 to 50 .......................................................................................... -- 37 3651 to 70 .......................................................................................... -- 24 2771 or older ..................................................................................... -- 32 28(VOL) Don’t know/Refused [TERMINATE] ................................... -- 2 --
SC11. As far as you know, is the person of Hispanic origin or background?
1997 2004 2009
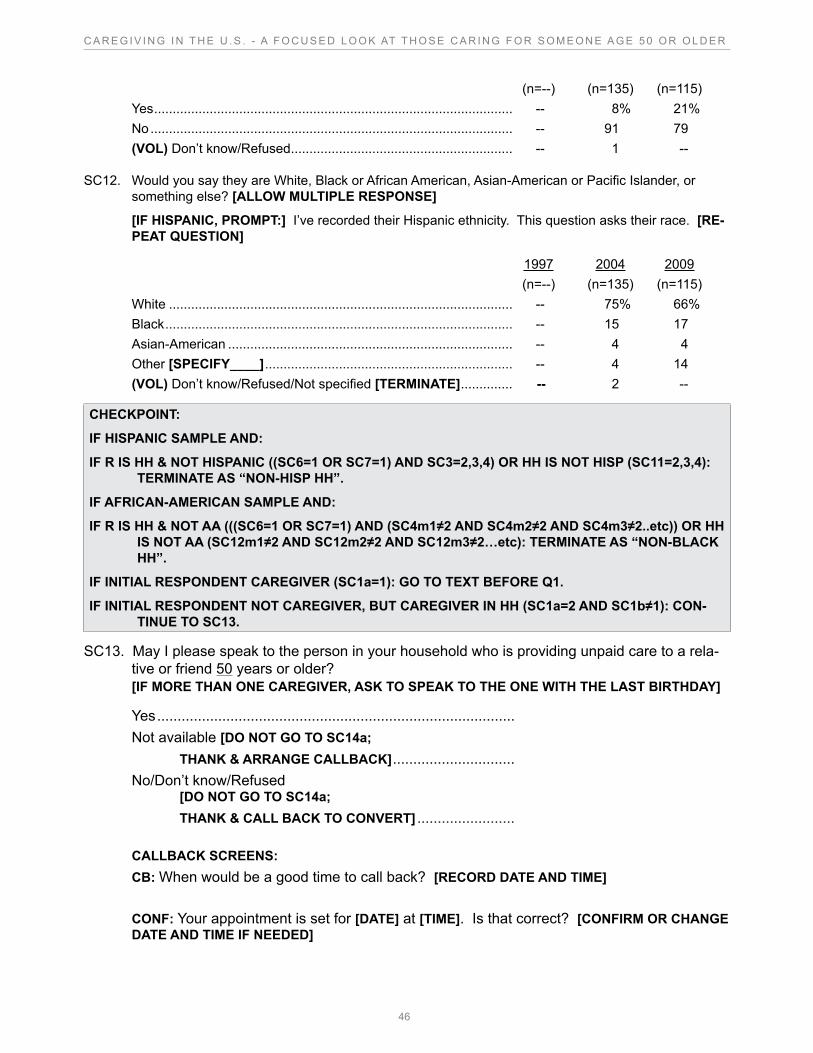
46
C A R E G I V I N G I N T H E U . S . - A F O C U S E D L O O K AT T H O S E C A R I N G F O R S O M E O N E A G E 5 0 O R O L D E R
(n=--) (n=135) (n=115)Yes ................................................................................................. -- 8% 21%No .................................................................................................. -- 91 79(VOL) Don’t know/Refused ............................................................ -- 1 --
SC12. Would you say they are White, Black or African American, Asian-American or Pacific Islander, or something else? [ALLOW MULTIPLE RESPONSE]
[IF HISPANIC, PROMPT:] I’ve recorded their Hispanic ethnicity. This question asks their race. [RE-PEAT QUESTION]
1997 2004 2009 (n=--) (n=135) (n=115)White ............................................................................................. -- 75% 66%Black .............................................................................................. -- 15 17Asian-American ............................................................................. -- 4 4Other [SPECIFY____] ................................................................... -- 4 14(VOL) Don’t know/Refused/Not specified [TERMINATE] .............. -- 2 --
CHECKPOINT:
IF HISPANIC SAMPLE AND:
IF R IS HH & NOT HISPANIC ((SC6=1 OR SC7=1) AND SC3=2,3,4) OR HH IS NOT HISP (SC11=2,3,4): TERMINATE AS “NON-HISP HH”.
IF AFRICAN-AMERICAN SAMPLE AND:
IF R IS HH & NOT AA (((SC6=1 OR SC7=1) AND (SC4m1≠2 AND SC4m2≠2 AND SC4m3≠2..etc)) OR HH IS NOT AA (SC12m1≠2 AND SC12m2≠2 AND SC12m3≠2…etc): TERMINATE AS “NON-BLACK HH”.
IF INITIAL RESPONDENT CAREGIVER (SC1a=1): GO TO TEXT BEFORE Q1.
IF INITIAL RESPONDENT NOT CAREGIVER, BUT CAREGIVER IN HH (SC1a=2 AND SC1b≠1): CON-TINUE TO SC13.
SC13. May I please speak to the person in your household who is providing unpaid care to a rela-tive or friend 50 years or older? [IF MORE THAN ONE CAREGIVER, ASK TO SPEAK TO THE ONE WITH THE LAST BIRTHDAY]
Yes ........................................................................................Not available [DO NOT GO TO SC14a;
THANK & ARRANGE CALLBACK] ..............................No/Don’t know/Refused
[DO NOT GO TO SC14a; THANK & CALL BACK TO CONVERT] ........................
CALLBACK SCREENS:CB: When would be a good time to call back? [RECORD DATE AND TIME]
CONF: Your appointment is set for [DATE] at [TIME]. Is that correct? [CONFIRM OR CHANGE DATE AND TIME IF NEEDED]
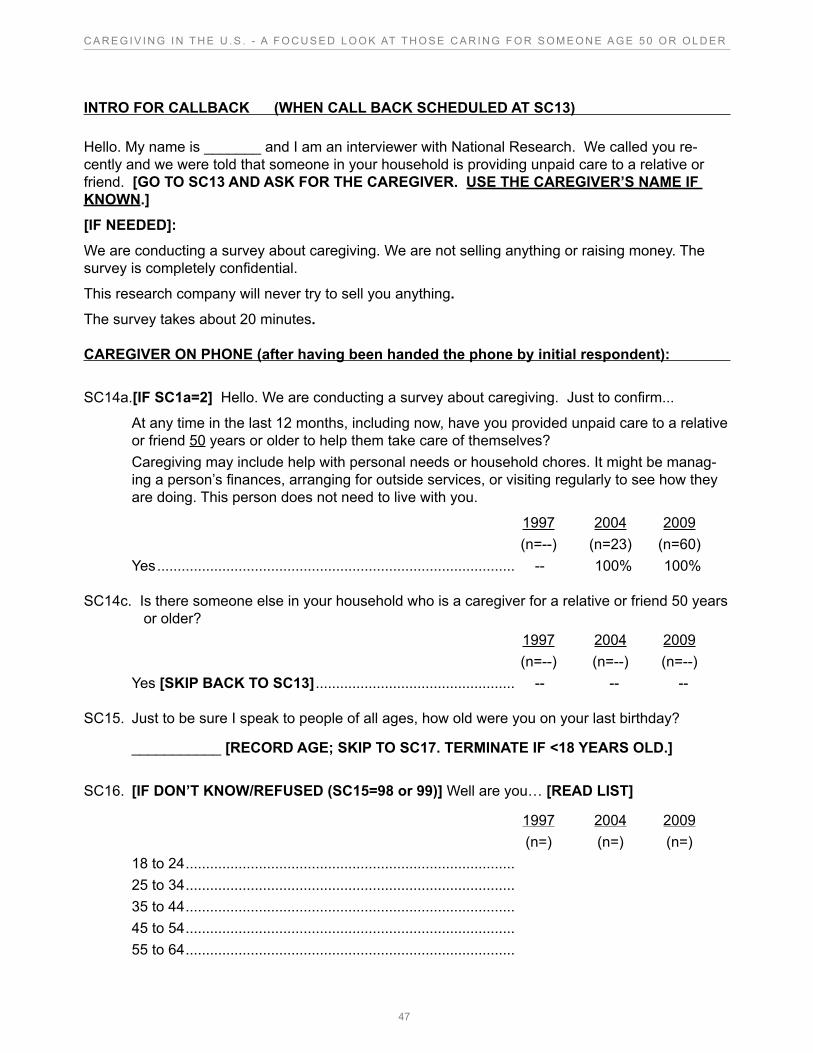
47
C A R E G I V I N G I N T H E U . S . - A F O C U S E D L O O K AT T H O S E C A R I N G F O R S O M E O N E A G E 5 0 O R O L D E R
INTRO FOR CALLBACK (WHEN CALL BACK SCHEDULED AT SC13)
Hello. My name is _______ and I am an interviewer with National Research. We called you re-cently and we were told that someone in your household is providing unpaid care to a relative or friend. [GO TO SC13 AND ASK FOR THE CAREGIVER. USE THE CAREGIVER’S NAME IF KNOWN.]
[IF NEEDED]:
We are conducting a survey about caregiving. We are not selling anything or raising money. The survey is completely confidential.
This research company will never try to sell you anything.
The survey takes about 20 minutes.
CAREGIVER ON PHONE (after having been handed the phone by initial respondent):
SC14a.[IF SC1a=2] Hello. We are conducting a survey about caregiving. Just to confirm...
At any time in the last 12 months, including now, have you provided unpaid care to a relative or friend 50 years or older to help them take care of themselves?
Caregiving may include help with personal needs or household chores. It might be manag-ing a person’s finances, arranging for outside services, or visiting regularly to see how they are doing. This person does not need to live with you.
1997 2004 2009 (n=--) (n=23) (n=60)Yes ........................................................................................ -- 100% 100%
SC14c. Is there someone else in your household who is a caregiver for a relative or friend 50 years or older?
1997 2004 2009 (n=--) (n=--) (n=--)Yes [SKIP BACK TO SC13] ................................................. -- -- --
SC15. Just to be sure I speak to people of all ages, how old were you on your last birthday?
___________ [RECORD AGE; SKIP TO SC17. TERMINATE IF <18 YEARS OLD.]
SC16. [IF DON’T KNOW/REFUSED (SC15=98 or 99)] Well are you… [READ LIST]
1997 2004 2009 (n=) (n=) (n=)18 to 24 .................................................................................25 to 34 .................................................................................35 to 44 .................................................................................45 to 54 .................................................................................55 to 64 .................................................................................
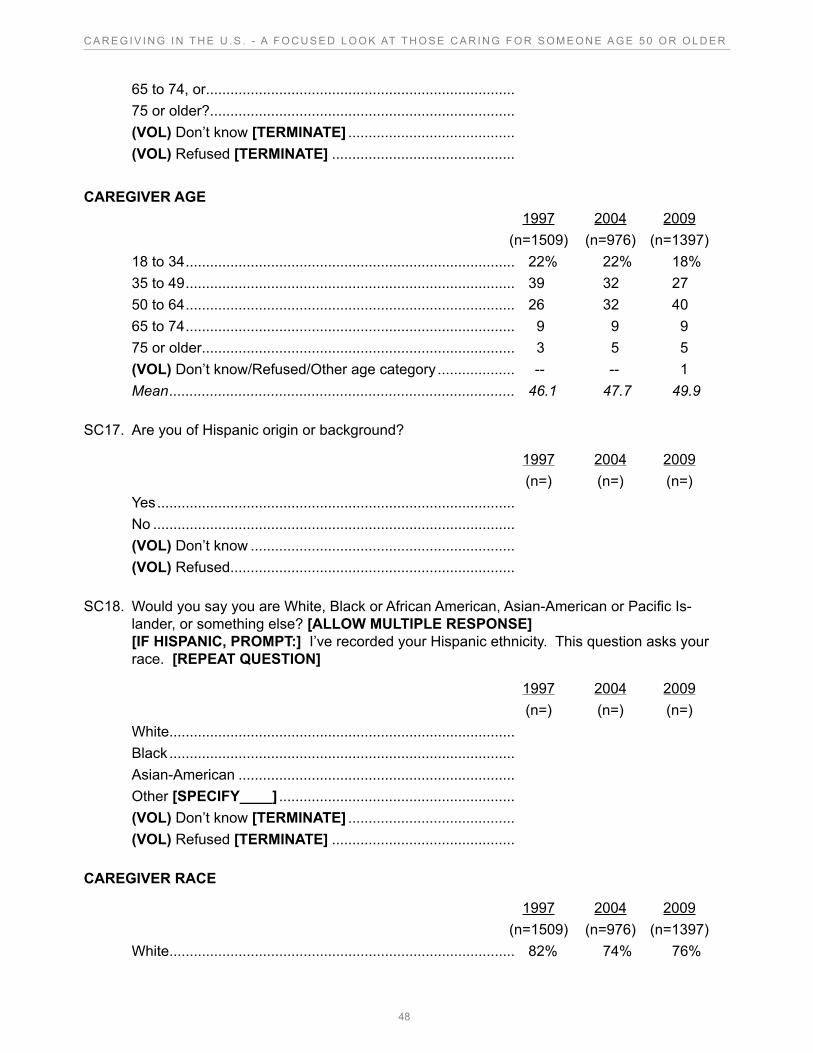
48
C A R E G I V I N G I N T H E U . S . - A F O C U S E D L O O K AT T H O S E C A R I N G F O R S O M E O N E A G E 5 0 O R O L D E R
65 to 74, or ............................................................................75 or older? ...........................................................................(VOL) Don’t know [TERMINATE] ......................................... (VOL) Refused [TERMINATE] .............................................
CAREGIVER AGE 1997 2004 2009 (n=1509) (n=976) (n=1397)18 to 34 ................................................................................. 22% 22% 18%35 to 49 ................................................................................. 39 32 2750 to 64 ................................................................................. 26 32 4065 to 74 ................................................................................. 9 9 975 or older ............................................................................. 3 5 5(VOL) Don’t know/Refused/Other age category ................... -- -- 1Mean ..................................................................................... 46.1 47.7 49.9
SC17. Are you of Hispanic origin or background?
1997 2004 2009 (n=) (n=) (n=)Yes ........................................................................................No .........................................................................................(VOL) Don’t know .................................................................(VOL) Refused ......................................................................
SC18. Would you say you are White, Black or African American, Asian-American or Pacific Is-lander, or something else? [ALLOW MULTIPLE RESPONSE]
[IF HISPANIC, PROMPT:] I’ve recorded your Hispanic ethnicity. This question asks your race. [REPEAT QUESTION]
1997 2004 2009 (n=) (n=) (n=)White ..................................................................................... Black .....................................................................................Asian-American ....................................................................Other [SPECIFY____] ..........................................................(VOL) Don’t know [TERMINATE] ......................................... (VOL) Refused [TERMINATE] .............................................
CAREGIVER RACE
1997 2004 2009 (n=1509) (n=976) (n=1397)White ..................................................................................... 82% 74% 76%
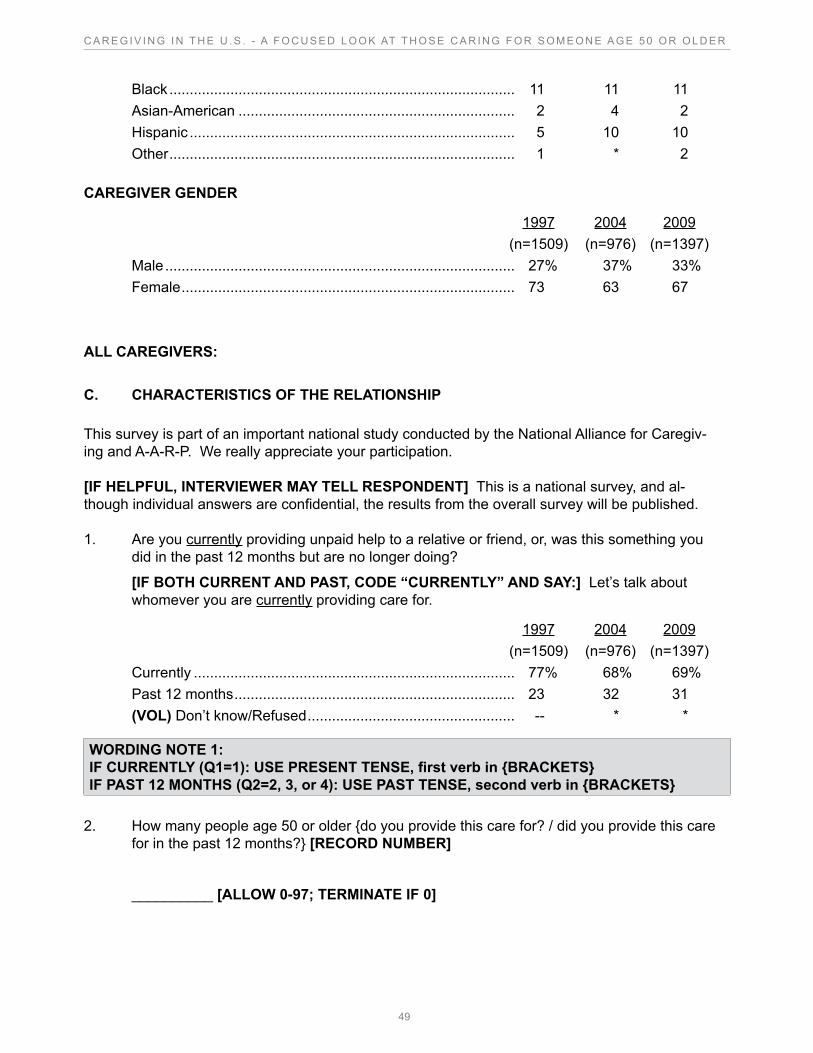
49
C A R E G I V I N G I N T H E U . S . - A F O C U S E D L O O K AT T H O S E C A R I N G F O R S O M E O N E A G E 5 0 O R O L D E R
Black ..................................................................................... 11 11 11Asian-American .................................................................... 2 4 2Hispanic ................................................................................ 5 10 10Other ..................................................................................... 1 * 2
CAREGIVER GENDER
1997 2004 2009 (n=1509) (n=976) (n=1397)Male ...................................................................................... 27% 37% 33% Female .................................................................................. 73 63 67
ALL CAREGIVERS:
C. CHARACTERISTICS OF THE RELATIONSHIP
This survey is part of an important national study conducted by the National Alliance for Caregiv-ing and A-A-R-P. We really appreciate your participation.
[IF HELPFUL, INTERVIEWER MAY TELL RESPONDENT] This is a national survey, and al-though individual answers are confidential, the results from the overall survey will be published.
1. Are you currently providing unpaid help to a relative or friend, or, was this something you did in the past 12 months but are no longer doing?
[IF BOTH CURRENT AND PAST, CODE “CURRENTLY” AND SAY:] Let’s talk about whomever you are currently providing care for.
1997 2004 2009 (n=1509) (n=976) (n=1397)Currently ............................................................................... 77% 68% 69%Past 12 months ..................................................................... 23 32 31(VOL) Don’t know/Refused ................................................... -- * *
WORDING NOTE 1:IF CURRENTLY (Q1=1): USE PRESENT TENSE, first verb in {BRACKETS}IF PAST 12 MONTHS (Q2=2, 3, or 4): USE PAST TENSE, second verb in {BRACKETS}
2. How many people age 50 or older {do you provide this care for? / did you provide this care for in the past 12 months?} [RECORD NUMBER]
__________ [ALLOW 0-97; TERMINATE IF 0]
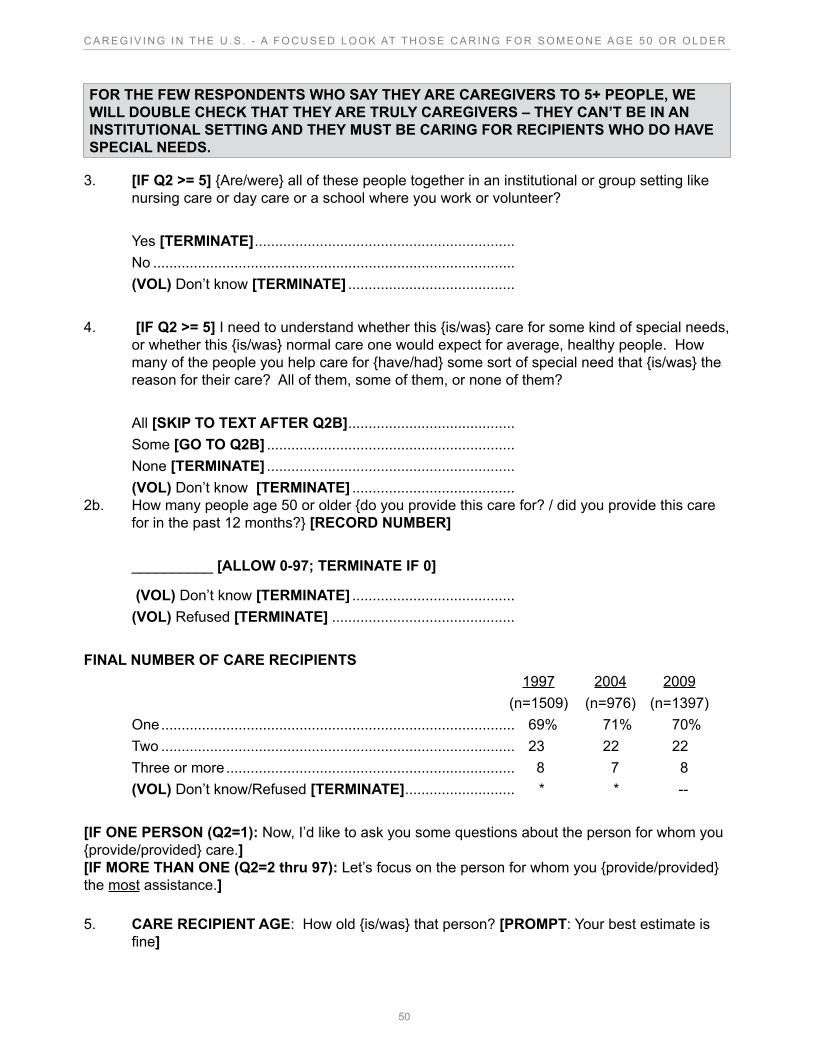
50
C A R E G I V I N G I N T H E U . S . - A F O C U S E D L O O K AT T H O S E C A R I N G F O R S O M E O N E A G E 5 0 O R O L D E R
FOR THE FEW RESPONDENTS WHO SAY THEY ARE CAREGIVERS TO 5+ PEOPLE, WE WILL DOUBLE CHECK THAT THEY ARE TRULY CAREGIVERS – THEY CAN’T BE IN AN INSTITUTIONAL SETTING AND THEY MUST BE CARING FOR RECIPIENTS WHO DO HAVE SPECIAL NEEDS.
3. [IF Q2 >= 5] {Are/were} all of these people together in an institutional or group setting like nursing care or day care or a school where you work or volunteer? Yes [TERMINATE] ................................................................No .........................................................................................(VOL) Don’t know [TERMINATE] .........................................
4. [IF Q2 >= 5] I need to understand whether this {is/was} care for some kind of special needs, or whether this {is/was} normal care one would expect for average, healthy people. How many of the people you help care for {have/had} some sort of special need that {is/was} the reason for their care? All of them, some of them, or none of them? All [SKIP TO TEXT AFTER Q2B] .........................................Some [GO TO Q2B] .............................................................None [TERMINATE] .............................................................(VOL) Don’t know [TERMINATE] ........................................
2b. How many people age 50 or older {do you provide this care for? / did you provide this care for in the past 12 months?} [RECORD NUMBER]
__________ [ALLOW 0-97; TERMINATE IF 0]
(VOL) Don’t know [TERMINATE] ........................................ (VOL) Refused [TERMINATE] .............................................
FINAL NUMBER OF CARE RECIPIENTS 1997 2004 2009 (n=1509) (n=976) (n=1397)One ....................................................................................... 69% 71% 70%Two ....................................................................................... 23 22 22Three or more ....................................................................... 8 7 8(VOL) Don’t know/Refused [TERMINATE] ........................... * * --
[IF ONE PERSON (Q2=1): Now, I’d like to ask you some questions about the person for whom you {provide/provided} care.][IF MORE THAN ONE (Q2=2 thru 97): Let’s focus on the person for whom you {provide/provided} the most assistance.]
5. CARE RECIPIENT AGE: How old {is/was} that person? [PROMPT: Your best estimate is fine]
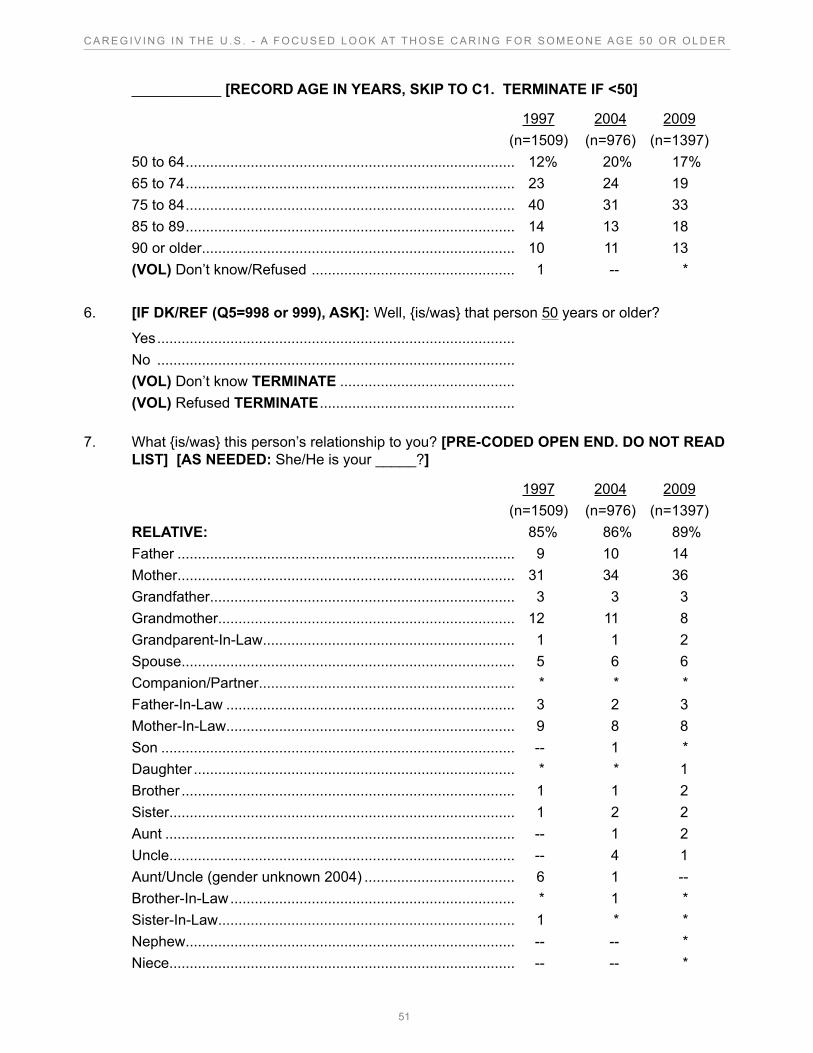
51
C A R E G I V I N G I N T H E U . S . - A F O C U S E D L O O K AT T H O S E C A R I N G F O R S O M E O N E A G E 5 0 O R O L D E R
___________ [RECORD AGE IN YEARS, SKIP TO C1. TERMINATE IF <50]
1997 2004 2009 (n=1509) (n=976) (n=1397)50 to 64 ................................................................................. 12% 20% 17%65 to 74 ................................................................................. 23 24 1975 to 84 ................................................................................. 40 31 3385 to 89 ................................................................................. 14 13 1890 or older ............................................................................. 10 11 13(VOL) Don’t know/Refused .................................................. 1 -- *
6. [IF DK/REF (Q5=998 or 999), ASK]: Well, {is/was} that person 50 years or older?
Yes ........................................................................................No ........................................................................................(VOL) Don’t know TERMINATE ........................................... (VOL) Refused TERMINATE ................................................
7. What {is/was} this person’s relationship to you? [PRE-CODED OPEN END. DO NOT READ LIST] [AS NEEDED: She/He is your _____?]
1997 2004 2009 (n=1509) (n=976) (n=1397)RELATIVE: 85% 86% 89%Father ................................................................................... 9 10 14Mother ................................................................................... 31 34 36Grandfather ........................................................................... 3 3 3Grandmother ......................................................................... 12 11 8Grandparent-In-Law .............................................................. 1 1 2Spouse .................................................................................. 5 6 6Companion/Partner ............................................................... * * *Father-In-Law ....................................................................... 3 2 3Mother-In-Law ....................................................................... 9 8 8Son ....................................................................................... -- 1 *Daughter ............................................................................... * * 1Brother .................................................................................. 1 1 2Sister ..................................................................................... 1 2 2Aunt ...................................................................................... -- 1 2Uncle ..................................................................................... -- 4 1Aunt/Uncle (gender unknown 2004) ..................................... 6 1 --Brother-In-Law ...................................................................... * 1 *Sister-In-Law ......................................................................... 1 * *Nephew ................................................................................. -- -- *Niece ..................................................................................... -- -- *
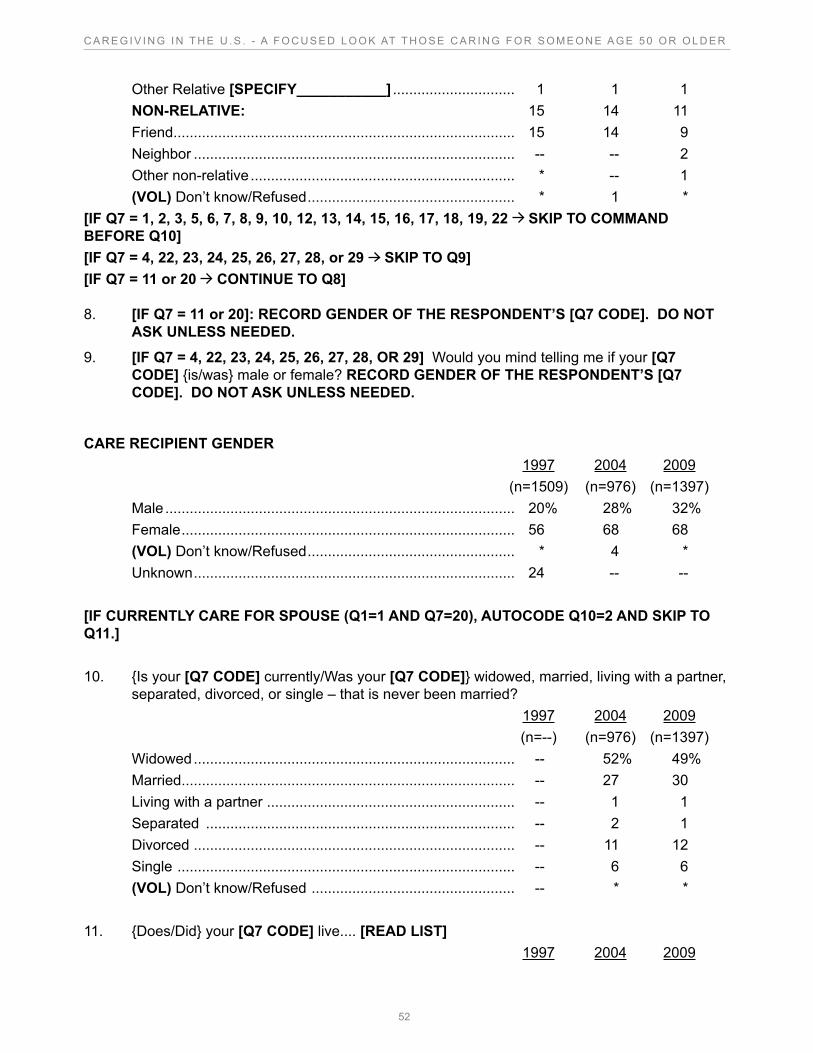
52
C A R E G I V I N G I N T H E U . S . - A F O C U S E D L O O K AT T H O S E C A R I N G F O R S O M E O N E A G E 5 0 O R O L D E R
Other Relative [SPECIFY___________] .............................. 1 1 1NON-RELATIVE: 15 14 11Friend .................................................................................... 15 14 9Neighbor ............................................................................... -- -- 2Other non-relative ................................................................. * -- 1(VOL) Don’t know/Refused ................................................... * 1 *
[IF Q7 = 1, 2, 3, 5, 6, 7, 8, 9, 10, 12, 13, 14, 15, 16, 17, 18, 19, 22 SKIP TO COMMAND BEFORE Q10][IF Q7 = 4, 22, 23, 24, 25, 26, 27, 28, or 29 SKIP TO Q9][IF Q7 = 11 or 20 CONTINUE TO Q8]
8. [IF Q7 = 11 or 20]: RECORD GENDER OF THE RESPONDENT’S [Q7 CODE]. DO NOT ASK UNLESS NEEDED.
9. [IF Q7 = 4, 22, 23, 24, 25, 26, 27, 28, OR 29] Would you mind telling me if your [Q7 CODE] {is/was} male or female? RECORD GENDER OF THE RESPONDENT’S [Q7 CODE]. DO NOT ASK UNLESS NEEDED.
CARE RECIPIENT GENDER 1997 2004 2009 (n=1509) (n=976) (n=1397)Male ...................................................................................... 20% 28% 32%Female .................................................................................. 56 68 68(VOL) Don’t know/Refused ................................................... * 4 *Unknown ............................................................................... 24 -- --
[IF CURRENTLY CARE FOR SPOUSE (Q1=1 AND Q7=20), AUTOCODE Q10=2 AND SKIP TO Q11.]
10. {Is your [Q7 CODE] currently/Was your [Q7 CODE]} widowed, married, living with a partner, separated, divorced, or single – that is never been married? 1997 2004 2009 (n=--) (n=976) (n=1397)Widowed ............................................................................... -- 52% 49%Married .................................................................................. -- 27 30Living with a partner ............................................................. -- 1 1Separated ............................................................................ -- 2 1Divorced ............................................................................... -- 11 12Single ................................................................................... -- 6 6(VOL) Don’t know/Refused .................................................. -- * *
11. {Does/Did} your [Q7 CODE] live.... [READ LIST] 1997 2004 2009
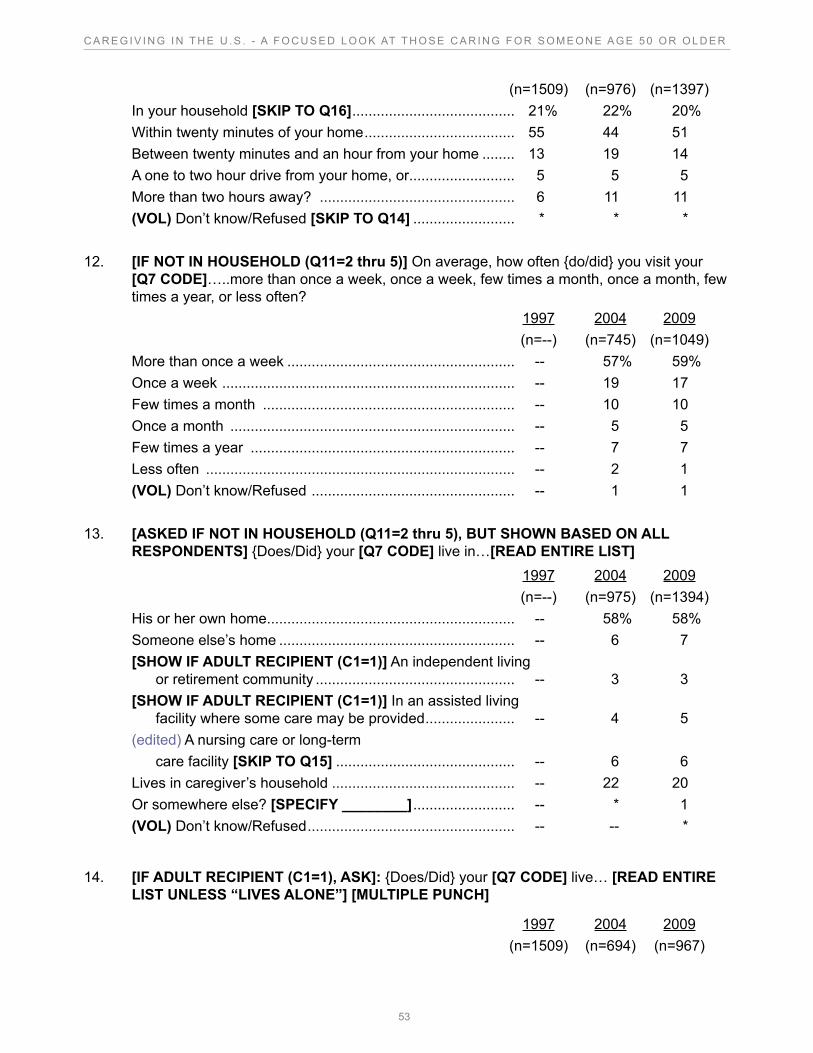
53
C A R E G I V I N G I N T H E U . S . - A F O C U S E D L O O K AT T H O S E C A R I N G F O R S O M E O N E A G E 5 0 O R O L D E R
(n=1509) (n=976) (n=1397)In your household [SKIP TO Q16] ........................................ 21% 22% 20%Within twenty minutes of your home ..................................... 55 44 51Between twenty minutes and an hour from your home ........ 13 19 14A one to two hour drive from your home, or .......................... 5 5 5More than two hours away? ................................................ 6 11 11(VOL) Don’t know/Refused [SKIP TO Q14] ......................... * * *
12. [IF NOT IN HOUSEHOLD (Q11=2 thru 5)] On average, how often {do/did} you visit your [Q7 CODE]…..more than once a week, once a week, few times a month, once a month, few times a year, or less often? 1997 2004 2009 (n=--) (n=745) (n=1049)More than once a week ........................................................ -- 57% 59%Once a week ........................................................................ -- 19 17Few times a month .............................................................. -- 10 10Once a month ...................................................................... -- 5 5Few times a year ................................................................. -- 7 7Less often ............................................................................ -- 2 1(VOL) Don’t know/Refused .................................................. -- 1 1
13. [ASKED IF NOT IN HOUSEHOLD (Q11=2 thru 5), BUT SHOWN BASED ON ALL RESPONDENTS] {Does/Did} your [Q7 CODE] live in…[READ ENTIRE LIST] 1997 2004 2009 (n=--) (n=975) (n=1394)His or her own home ............................................................. -- 58% 58%Someone else’s home .......................................................... -- 6 7[SHOW IF ADULT RECIPIENT (C1=1)] An independent living
or retirement community ................................................. -- 3 3[SHOW IF ADULT RECIPIENT (C1=1)] In an assisted living
facility where some care may be provided ...................... -- 4 5(edited) A nursing care or long-term care facility [SKIP TO Q15] ............................................ -- 6 6Lives in caregiver’s household ............................................. -- 22 20Or somewhere else? [SPECIFY ________] ......................... -- * 1(VOL) Don’t know/Refused ................................................... -- -- *
14. [IF ADULT RECIPIENT (C1=1), ASK]: {Does/Did} your [Q7 CODE] live… [READ ENTIRE LIST UNLESS “LIVES ALONE”] [MULTIPLE PUNCH]
1997 2004 2009 (n=1509) (n=694) (n=967)
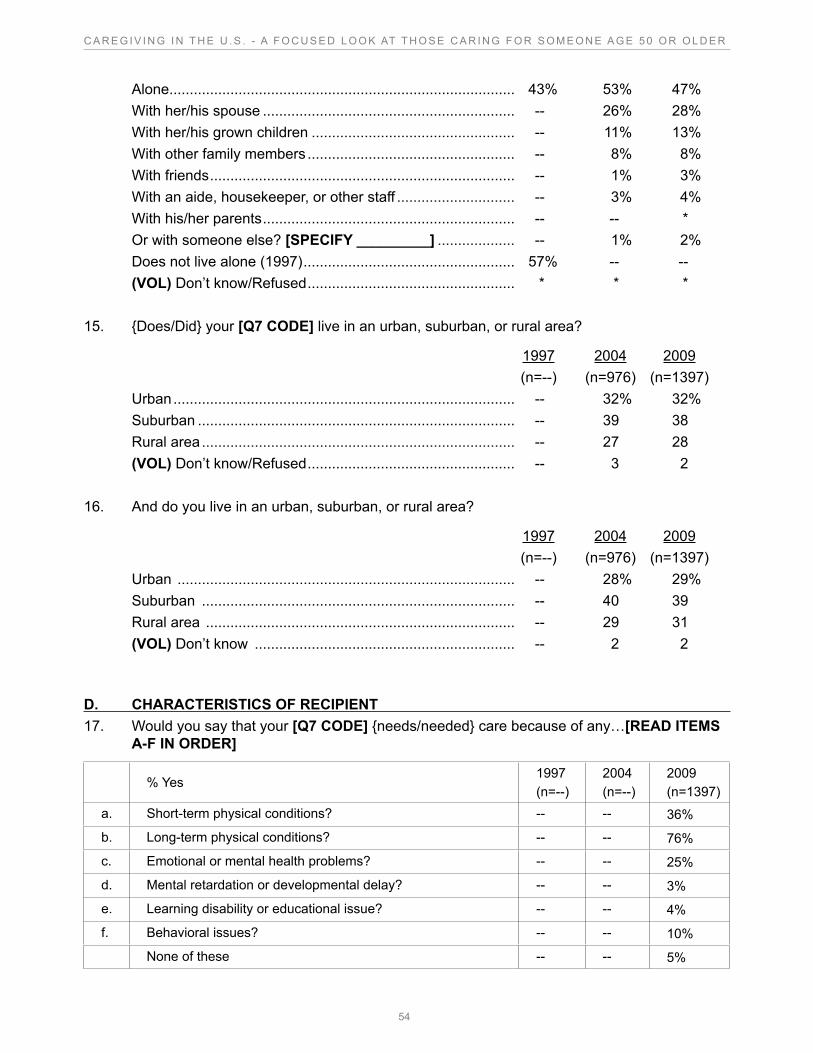
54
C A R E G I V I N G I N T H E U . S . - A F O C U S E D L O O K AT T H O S E C A R I N G F O R S O M E O N E A G E 5 0 O R O L D E R
Alone ..................................................................................... 43% 53% 47%With her/his spouse .............................................................. -- 26% 28%With her/his grown children .................................................. -- 11% 13%With other family members ................................................... -- 8% 8%With friends ........................................................................... -- 1% 3%With an aide, housekeeper, or other staff ............................. -- 3% 4%With his/her parents .............................................................. -- -- *Or with someone else? [SPECIFY _________] ................... -- 1% 2%Does not live alone (1997) .................................................... 57% -- --(VOL) Don’t know/Refused ................................................... * * *
15. {Does/Did} your [Q7 CODE] live in an urban, suburban, or rural area?
1997 2004 2009 (n=--) (n=976) (n=1397)Urban .................................................................................... -- 32% 32%Suburban .............................................................................. -- 39 38Rural area ............................................................................. -- 27 28(VOL) Don’t know/Refused ................................................... -- 3 2
16. And do you live in an urban, suburban, or rural area?
1997 2004 2009 (n=--) (n=976) (n=1397)Urban ................................................................................... -- 28% 29%Suburban ............................................................................. -- 40 39Rural area ............................................................................ -- 29 31(VOL) Don’t know ................................................................ -- 2 2
D. CHARACTERISTICS OF RECIPIENT 17. Would you say that your [Q7 CODE] {needs/needed} care because of any…[READ ITEMS
A-F IN ORDER]
% Yes1997(n=--)
2004(n=--)
2009(n=1397)
a. Short-term physical conditions? -- -- 36%
b. Long-term physical conditions? -- -- 76%
c. Emotional or mental health problems? -- -- 25%
d. Mental retardation or developmental delay? -- -- 3%
e. Learning disability or educational issue? -- -- 4%
f. Behavioral issues? -- -- 10%
None of these -- -- 5%
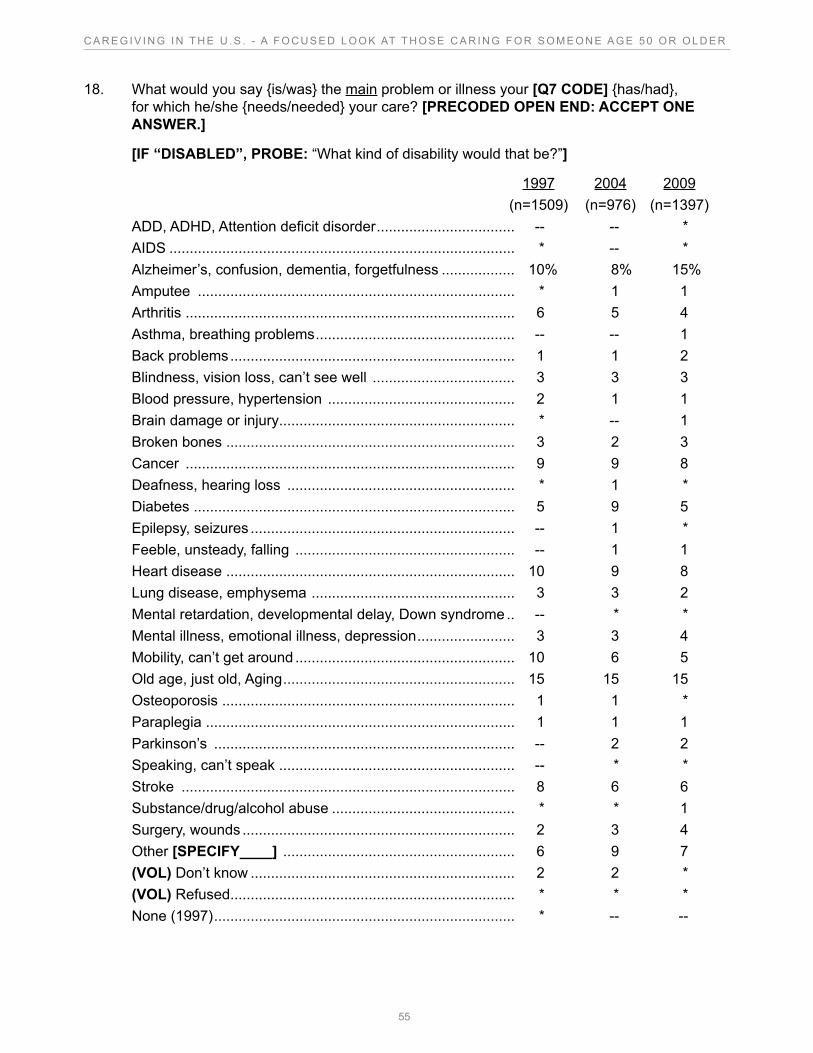
55
C A R E G I V I N G I N T H E U . S . - A F O C U S E D L O O K AT T H O S E C A R I N G F O R S O M E O N E A G E 5 0 O R O L D E R
18. What would you say {is/was} the main problem or illness your [Q7 CODE] {has/had}, for which he/she {needs/needed} your care? [PRECODED OPEN END: ACCEPT ONE ANSWER.]
[IF “DISABLED”, PROBE: “What kind of disability would that be?”]
1997 2004 2009 (n=1509) (n=976) (n=1397)ADD, ADHD, Attention deficit disorder .................................. -- -- *AIDS ..................................................................................... * -- *Alzheimer’s, confusion, dementia, forgetfulness .................. 10% 8% 15%Amputee .............................................................................. * 1 1Arthritis ................................................................................. 6 5 4Asthma, breathing problems ................................................. -- -- 1Back problems ...................................................................... 1 1 2Blindness, vision loss, can’t see well ................................... 3 3 3Blood pressure, hypertension .............................................. 2 1 1Brain damage or injury .......................................................... * -- 1Broken bones ....................................................................... 3 2 3Cancer ................................................................................. 9 9 8Deafness, hearing loss ........................................................ * 1 *Diabetes ............................................................................... 5 9 5Epilepsy, seizures ................................................................. -- 1 *Feeble, unsteady, falling ...................................................... -- 1 1Heart disease ....................................................................... 10 9 8Lung disease, emphysema .................................................. 3 3 2Mental retardation, developmental delay, Down syndrome .. -- * *Mental illness, emotional illness, depression ........................ 3 3 4Mobility, can’t get around ...................................................... 10 6 5Old age, just old, Aging ......................................................... 15 15 15Osteoporosis ........................................................................ 1 1 *Paraplegia ............................................................................ 1 1 1Parkinson’s .......................................................................... -- 2 2Speaking, can’t speak .......................................................... -- * *Stroke .................................................................................. 8 6 6Substance/drug/alcohol abuse ............................................. * * 1Surgery, wounds ................................................................... 2 3 4Other [SPECIFY____] ......................................................... 6 9 7(VOL) Don’t know ................................................................. 2 2 *(VOL) Refused ...................................................................... * * *None (1997) .......................................................................... * -- --
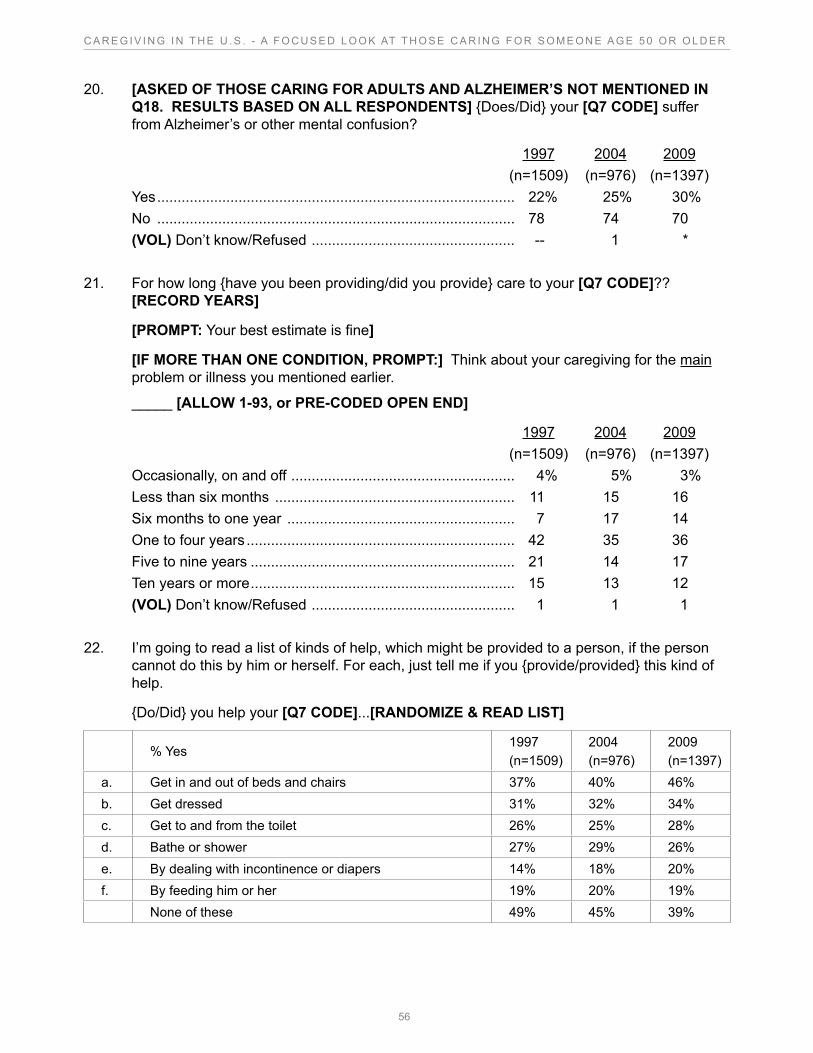
56
C A R E G I V I N G I N T H E U . S . - A F O C U S E D L O O K AT T H O S E C A R I N G F O R S O M E O N E A G E 5 0 O R O L D E R
20. [ASKED OF THOSE CARING FOR ADULTS AND ALZHEIMER’S NOT MENTIONED IN Q18. RESULTS BASED ON ALL RESPONDENTS] {Does/Did} your [Q7 CODE] suffer from Alzheimer’s or other mental confusion?
1997 2004 2009 (n=1509) (n=976) (n=1397)Yes ........................................................................................ 22% 25% 30%No ........................................................................................ 78 74 70(VOL) Don’t know/Refused .................................................. -- 1 *
21. For how long {have you been providing/did you provide} care to your [Q7 CODE]?? [RECORD YEARS]
[PROMPT: Your best estimate is fine]
[IF MORE THAN ONE CONDITION, PROMPT:] Think about your caregiving for the main problem or illness you mentioned earlier.
_____ [ALLOW 1-93, or PRE-CODED OPEN END]
1997 2004 2009 (n=1509) (n=976) (n=1397)Occasionally, on and off ....................................................... 4% 5% 3%Less than six months ........................................................... 11 15 16Six months to one year ........................................................ 7 17 14One to four years .................................................................. 42 35 36Five to nine years ................................................................. 21 14 17Ten years or more ................................................................. 15 13 12(VOL) Don’t know/Refused .................................................. 1 1 1
22. I’m going to read a list of kinds of help, which might be provided to a person, if the person cannot do this by him or herself. For each, just tell me if you {provide/provided} this kind of help.
{Do/Did} you help your [Q7 CODE]...[RANDOMIZE & READ LIST]
% Yes1997(n=1509)
2004(n=976)
2009(n=1397)
a. Get in and out of beds and chairs 37% 40% 46%b. Get dressed 31% 32% 34%c. Get to and from the toilet 26% 25% 28%d. Bathe or shower 27% 29% 26%e. By dealing with incontinence or diapers 14% 18% 20%f. By feeding him or her 19% 20% 19%
None of these 49% 45% 39%
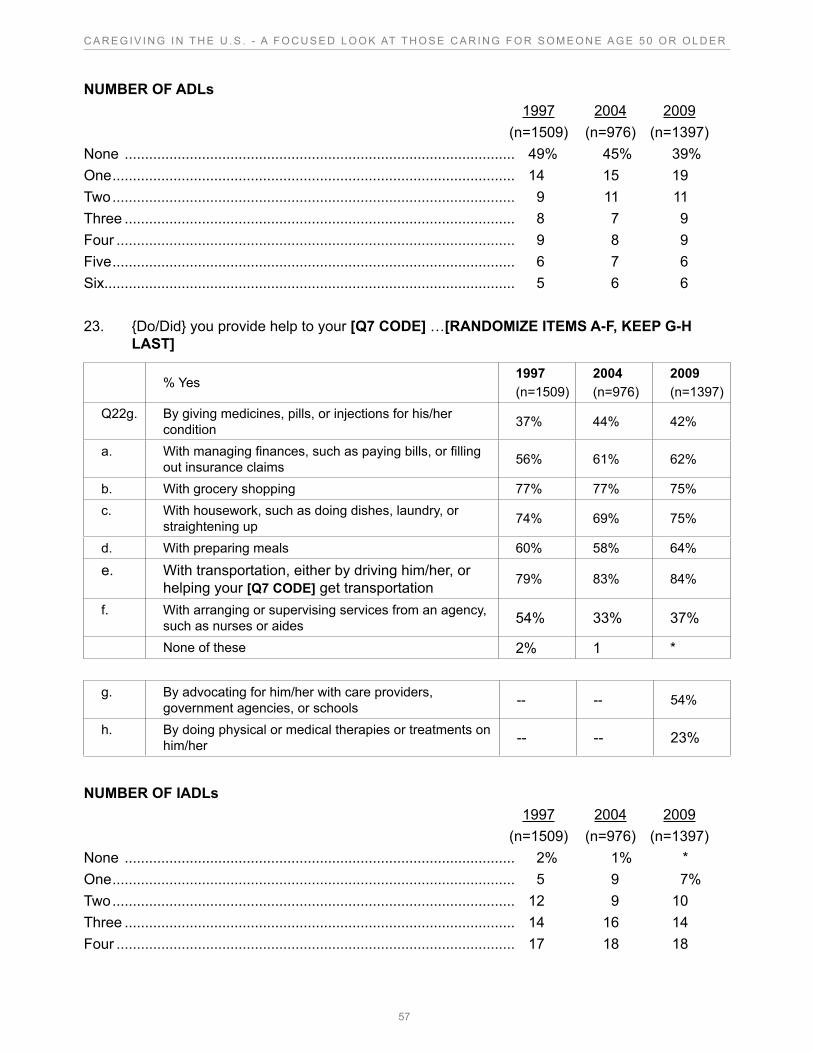
57
C A R E G I V I N G I N T H E U . S . - A F O C U S E D L O O K AT T H O S E C A R I N G F O R S O M E O N E A G E 5 0 O R O L D E R
NUMBER OF ADLs 1997 2004 2009 (n=1509) (n=976) (n=1397)
None ................................................................................................ 49% 45% 39%One ................................................................................................... 14 15 19Two ................................................................................................... 9 11 11Three ................................................................................................ 8 7 9Four .................................................................................................. 9 8 9Five ................................................................................................... 6 7 6Six..................................................................................................... 5 6 6
23. {Do/Did} you provide help to your [Q7 CODE] …[RANDOMIZE ITEMS A-F, KEEP G-H LAST]
% Yes1997(n=1509)
2004(n=976)
2009(n=1397)
Q22g. By giving medicines, pills, or injections for his/her condition 37% 44% 42%
a. With managing finances, such as paying bills, or filling out insurance claims 56% 61% 62%
b. With grocery shopping 77% 77% 75%c. With housework, such as doing dishes, laundry, or
straightening up 74% 69% 75%
d. With preparing meals 60% 58% 64%
e. With transportation, either by driving him/her, or helping your [Q7 CODE] get transportation 79% 83% 84%
f. With arranging or supervising services from an agency, such as nurses or aides 54% 33% 37%
None of these 2% 1 *
g. By advocating for him/her with care providers, government agencies, or schools -- -- 54%
h. By doing physical or medical therapies or treatments on him/her -- -- 23%
NUMBER OF IADLs 1997 2004 2009 (n=1509) (n=976) (n=1397)
None ................................................................................................ 2% 1% *One ................................................................................................... 5 9 7%Two ................................................................................................... 12 9 10Three ................................................................................................ 14 16 14Four .................................................................................................. 17 18 18
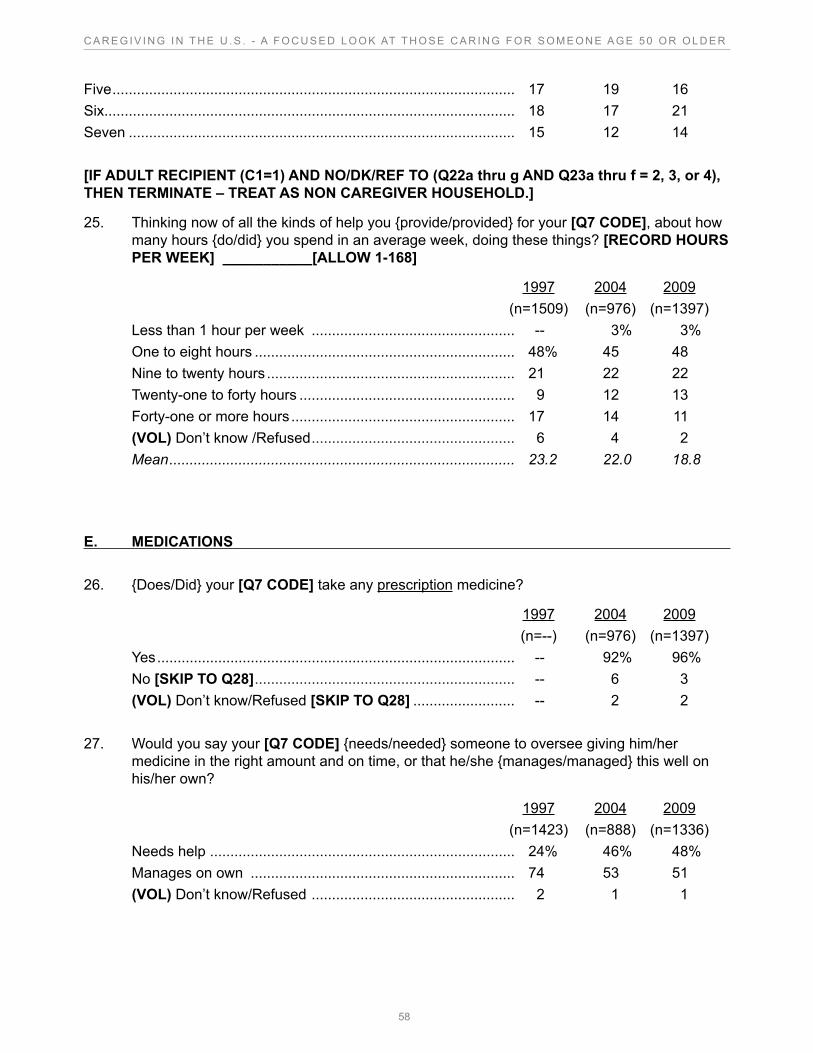
58
C A R E G I V I N G I N T H E U . S . - A F O C U S E D L O O K AT T H O S E C A R I N G F O R S O M E O N E A G E 5 0 O R O L D E R
Five ................................................................................................... 17 19 16Six..................................................................................................... 18 17 21Seven ............................................................................................... 15 12 14
[IF ADULT RECIPIENT (C1=1) AND NO/DK/REF TO (Q22a thru g AND Q23a thru f = 2, 3, or 4), THEN TERMINATE – TREAT AS NON CAREGIVER HOUSEHOLD.]
25. Thinking now of all the kinds of help you {provide/provided} for your [Q7 CODE], about how many hours {do/did} you spend in an average week, doing these things? [RECORD HOURS PER WEEK] ___________[ALLOW 1-168]
1997 2004 2009 (n=1509) (n=976) (n=1397)Less than 1 hour per week .................................................. -- 3% 3%One to eight hours ................................................................ 48% 45 48Nine to twenty hours ............................................................. 21 22 22Twenty-one to forty hours ..................................................... 9 12 13Forty-one or more hours ....................................................... 17 14 11(VOL) Don’t know /Refused .................................................. 6 4 2Mean ..................................................................................... 23.2 22.0 18.8
E. MEDICATIONS
26. {Does/Did} your [Q7 CODE] take any prescription medicine?
1997 2004 2009 (n=--) (n=976) (n=1397)Yes ........................................................................................ -- 92% 96%No [SKIP TO Q28] ................................................................ -- 6 3(VOL) Don’t know/Refused [SKIP TO Q28] ......................... -- 2 2
27. Would you say your [Q7 CODE] {needs/needed} someone to oversee giving him/her medicine in the right amount and on time, or that he/she {manages/managed} this well on his/her own?
1997 2004 2009 (n=1423) (n=888) (n=1336)Needs help ........................................................................... 24% 46% 48%Manages on own ................................................................. 74 53 51(VOL) Don’t know/Refused .................................................. 2 1 1
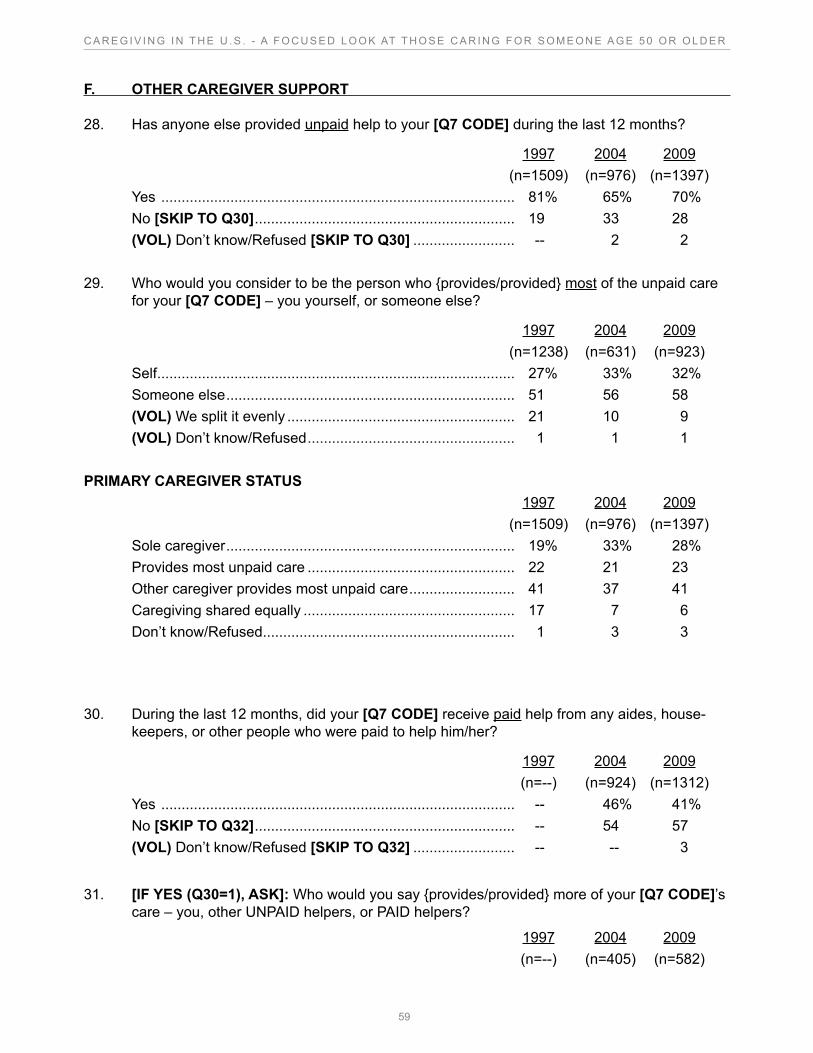
59
C A R E G I V I N G I N T H E U . S . - A F O C U S E D L O O K AT T H O S E C A R I N G F O R S O M E O N E A G E 5 0 O R O L D E R
F. OTHER CAREGIVER SUPPORT
28. Has anyone else provided unpaid help to your [Q7 CODE] during the last 12 months?
1997 2004 2009 (n=1509) (n=976) (n=1397)Yes ....................................................................................... 81% 65% 70%No [SKIP TO Q30] ................................................................ 19 33 28(VOL) Don’t know/Refused [SKIP TO Q30] ......................... -- 2 2
29. Who would you consider to be the person who {provides/provided} most of the unpaid care for your [Q7 CODE] – you yourself, or someone else?
1997 2004 2009 (n=1238) (n=631) (n=923)Self ........................................................................................ 27% 33% 32%Someone else ....................................................................... 51 56 58(VOL) We split it evenly ........................................................ 21 10 9(VOL) Don’t know/Refused ................................................... 1 1 1
PRIMARY CAREGIVER STATUS 1997 2004 2009 (n=1509) (n=976) (n=1397)Sole caregiver ....................................................................... 19% 33% 28%Provides most unpaid care ................................................... 22 21 23Other caregiver provides most unpaid care .......................... 41 37 41Caregiving shared equally .................................................... 17 7 6Don’t know/Refused .............................................................. 1 3 3
30. During the last 12 months, did your [Q7 CODE] receive paid help from any aides, house-keepers, or other people who were paid to help him/her?
1997 2004 2009 (n=--) (n=924) (n=1312)Yes ....................................................................................... -- 46% 41%No [SKIP TO Q32] ................................................................ -- 54 57(VOL) Don’t know/Refused [SKIP TO Q32] ......................... -- -- 3
31. [IF YES (Q30=1), ASK]: Who would you say {provides/provided} more of your [Q7 CODE]’s care – you, other UNPAID helpers, or PAID helpers?
1997 2004 2009 (n=--) (n=405) (n=582)
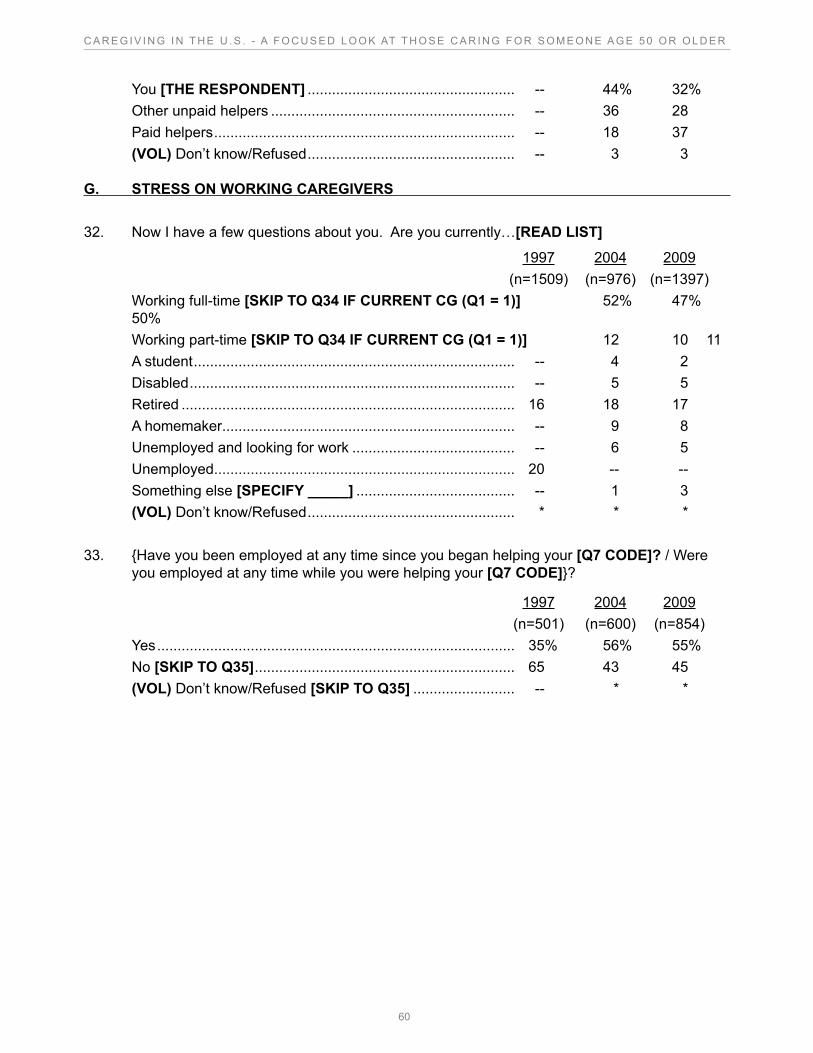
60
C A R E G I V I N G I N T H E U . S . - A F O C U S E D L O O K AT T H O S E C A R I N G F O R S O M E O N E A G E 5 0 O R O L D E R
You [THE RESPONDENT] ................................................... -- 44% 32%Other unpaid helpers ............................................................ -- 36 28Paid helpers .......................................................................... -- 18 37(VOL) Don’t know/Refused ................................................... -- 3 3
G. STRESS ON WORKING CAREGIVERS
32. Now I have a few questions about you. Are you currently…[READ LIST]
1997 2004 2009 (n=1509) (n=976) (n=1397)Working full-time [SKIP TO Q34 IF CURRENT CG (Q1 = 1)] 52% 47% 50%Working part-time [SKIP TO Q34 IF CURRENT CG (Q1 = 1)] 12 10 11A student ............................................................................... -- 4 2Disabled ................................................................................ -- 5 5Retired .................................................................................. 16 18 17A homemaker ........................................................................ -- 9 8Unemployed and looking for work ........................................ -- 6 5Unemployed .......................................................................... 20 -- --Something else [SPECIFY _____] ....................................... -- 1 3(VOL) Don’t know/Refused ................................................... * * *
33. {Have you been employed at any time since you began helping your [Q7 CODE]? / Were you employed at any time while you were helping your [Q7 CODE]}?
1997 2004 2009 (n=501) (n=600) (n=854)Yes ........................................................................................ 35% 56% 55%No [SKIP TO Q35] ................................................................ 65 43 45(VOL) Don’t know/Refused [SKIP TO Q35] ......................... -- * *
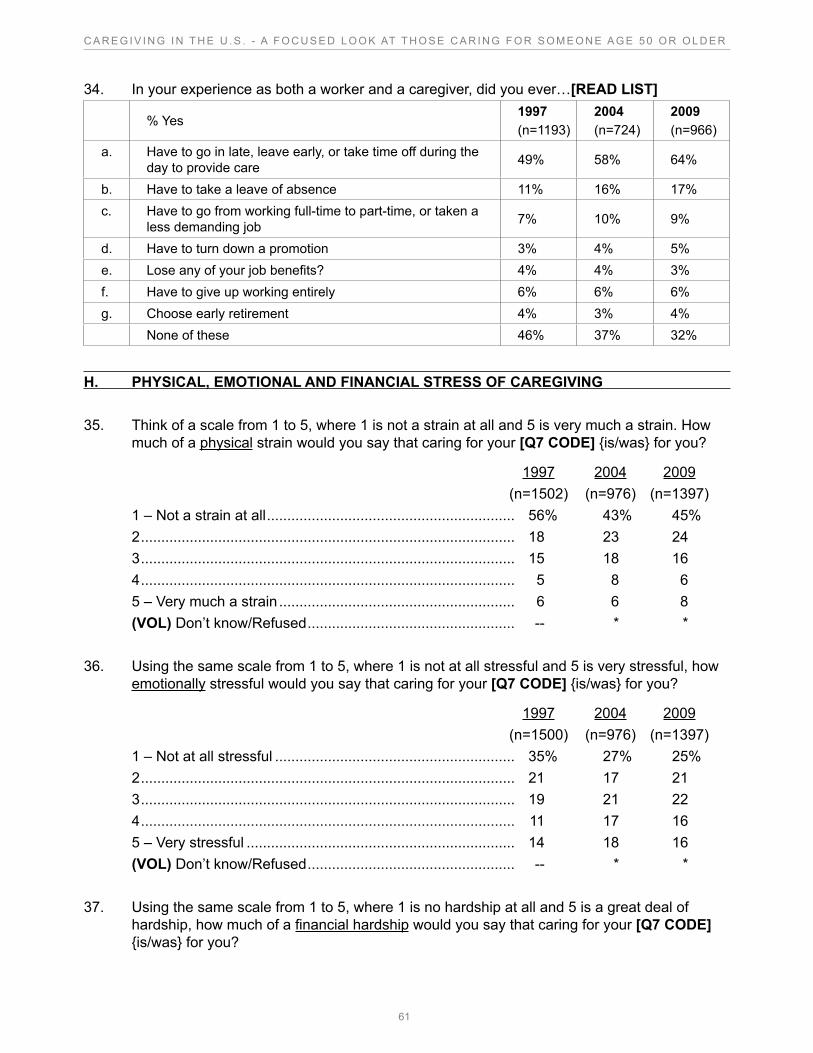
61
C A R E G I V I N G I N T H E U . S . - A F O C U S E D L O O K AT T H O S E C A R I N G F O R S O M E O N E A G E 5 0 O R O L D E R
34. In your experience as both a worker and a caregiver, did you ever…[READ LIST]
% Yes1997(n=1193)
2004(n=724)
2009(n=966)
a. Have to go in late, leave early, or take time off during the day to provide care 49% 58% 64%
b. Have to take a leave of absence 11% 16% 17%c. Have to go from working full-time to part-time, or taken a
less demanding job 7% 10% 9%
d. Have to turn down a promotion 3% 4% 5%e. Lose any of your job benefits? 4% 4% 3%f. Have to give up working entirely 6% 6% 6%g. Choose early retirement 4% 3% 4%
None of these 46% 37% 32%
H. PHYSICAL, EMOTIONAL AND FINANCIAL STRESS OF CAREGIVING
35. Think of a scale from 1 to 5, where 1 is not a strain at all and 5 is very much a strain. How much of a physical strain would you say that caring for your [Q7 CODE] {is/was} for you?
1997 2004 2009 (n=1502) (n=976) (n=1397)1 – Not a strain at all ............................................................. 56% 43% 45%2 ............................................................................................ 18 23 243 ............................................................................................ 15 18 164 ............................................................................................ 5 8 65 – Very much a strain .......................................................... 6 6 8(VOL) Don’t know/Refused ................................................... -- * *
36. Using the same scale from 1 to 5, where 1 is not at all stressful and 5 is very stressful, how emotionally stressful would you say that caring for your [Q7 CODE] {is/was} for you?
1997 2004 2009 (n=1500) (n=976) (n=1397)1 – Not at all stressful ........................................................... 35% 27% 25%2 ............................................................................................ 21 17 213 ............................................................................................ 19 21 22 4 ............................................................................................ 11 17 165 – Very stressful .................................................................. 14 18 16(VOL) Don’t know/Refused ................................................... -- * *
37. Using the same scale from 1 to 5, where 1 is no hardship at all and 5 is a great deal of hardship, how much of a financial hardship would you say that caring for your [Q7 CODE] {is/was} for you?
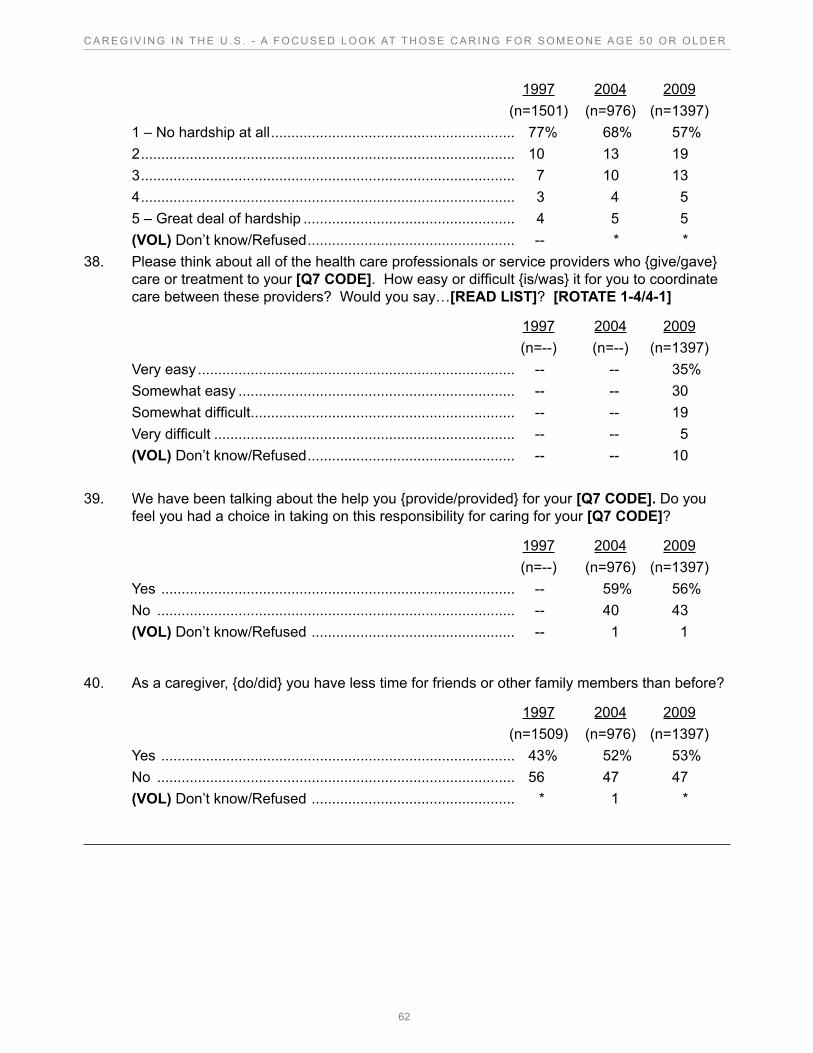
62
C A R E G I V I N G I N T H E U . S . - A F O C U S E D L O O K AT T H O S E C A R I N G F O R S O M E O N E A G E 5 0 O R O L D E R
1997 2004 2009 (n=1501) (n=976) (n=1397)1 – No hardship at all ............................................................ 77% 68% 57%2 ............................................................................................ 10 13 193 ............................................................................................ 7 10 134 ............................................................................................ 3 4 55 – Great deal of hardship .................................................... 4 5 5(VOL) Don’t know/Refused ................................................... -- * *
38. Please think about all of the health care professionals or service providers who {give/gave} care or treatment to your [Q7 CODE]. How easy or difficult {is/was} it for you to coordinate care between these providers? Would you say…[READ LIST]? [ROTATE 1-4/4-1]
1997 2004 2009 (n=--) (n=--) (n=1397)Very easy .............................................................................. -- -- 35%Somewhat easy .................................................................... -- -- 30Somewhat difficult ................................................................. -- -- 19Very difficult .......................................................................... -- -- 5(VOL) Don’t know/Refused ................................................... -- -- 10
39. We have been talking about the help you {provide/provided} for your [Q7 CODE]. Do you feel you had a choice in taking on this responsibility for caring for your [Q7 CODE]?
1997 2004 2009 (n=--) (n=976) (n=1397)Yes ....................................................................................... -- 59% 56%No ........................................................................................ -- 40 43(VOL) Don’t know/Refused .................................................. -- 1 1
40. As a caregiver, {do/did} you have less time for friends or other family members than before?
1997 2004 2009 (n=1509) (n=976) (n=1397)Yes ....................................................................................... 43% 52% 53%No ........................................................................................ 56 47 47(VOL) Don’t know/Refused .................................................. * 1 *
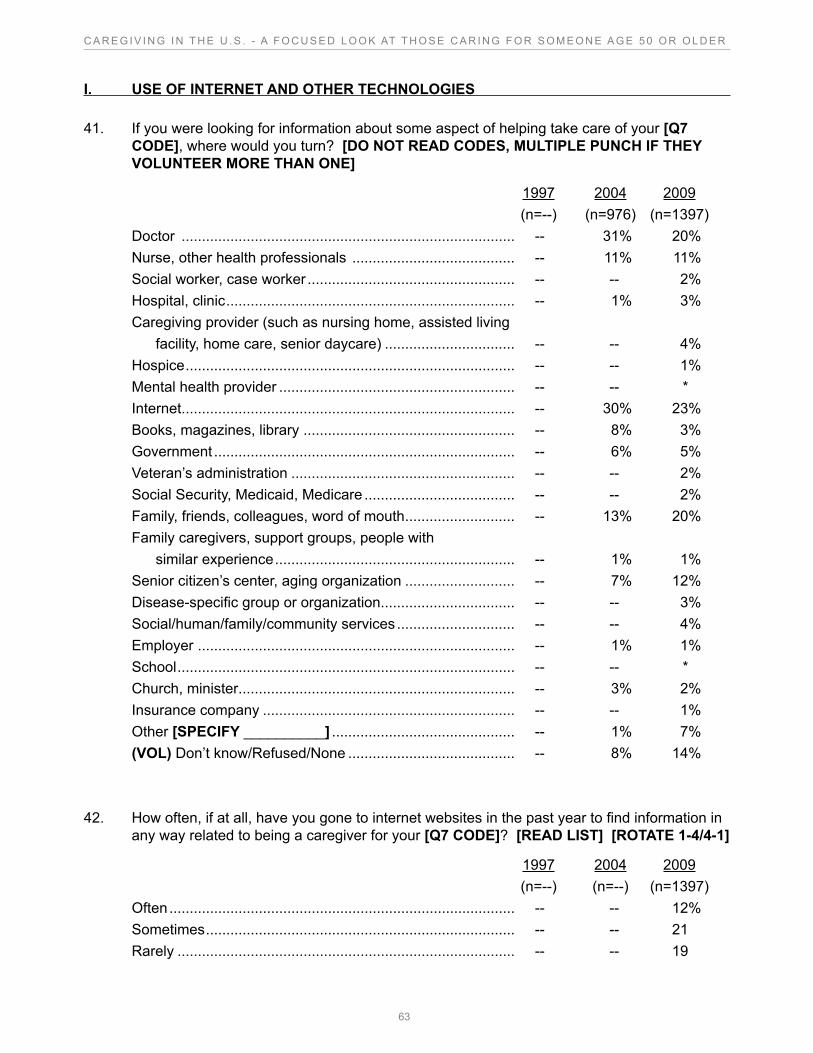
63
C A R E G I V I N G I N T H E U . S . - A F O C U S E D L O O K AT T H O S E C A R I N G F O R S O M E O N E A G E 5 0 O R O L D E R
I. USE OF INTERNET AND OTHER TECHNOLOGIES
41. If you were looking for information about some aspect of helping take care of your [Q7 CODE], where would you turn? [DO NOT READ CODES, MULTIPLE PUNCH IF THEY VOLUNTEER MORE THAN ONE]
1997 2004 2009 (n=--) (n=976) (n=1397)Doctor .................................................................................. -- 31% 20%Nurse, other health professionals ........................................ -- 11% 11%Social worker, case worker ................................................... -- -- 2%Hospital, clinic ....................................................................... -- 1% 3%Caregiving provider (such as nursing home, assisted living facility, home care, senior daycare) ................................ -- -- 4%Hospice ................................................................................. -- -- 1%Mental health provider .......................................................... -- -- *Internet .................................................................................. -- 30% 23%Books, magazines, library .................................................... -- 8% 3%Government .......................................................................... -- 6% 5%Veteran’s administration ....................................................... -- -- 2%Social Security, Medicaid, Medicare ..................................... -- -- 2%Family, friends, colleagues, word of mouth ........................... -- 13% 20%Family caregivers, support groups, people with similar experience ........................................................... -- 1% 1%Senior citizen’s center, aging organization ........................... -- 7% 12%Disease-specific group or organization ................................. -- -- 3%Social/human/family/community services ............................. -- -- 4%Employer .............................................................................. -- 1% 1%School ................................................................................... -- -- *Church, minister .................................................................... -- 3% 2%Insurance company .............................................................. -- -- 1%Other [SPECIFY __________] ............................................. -- 1% 7%(VOL) Don’t know/Refused/None ......................................... -- 8% 14%
42. How often, if at all, have you gone to internet websites in the past year to find information in any way related to being a caregiver for your [Q7 CODE]? [READ LIST] [ROTATE 1-4/4-1]
1997 2004 2009 (n=--) (n=--) (n=1397)Often ..................................................................................... -- -- 12%Sometimes ............................................................................ -- -- 21Rarely ................................................................................... -- -- 19
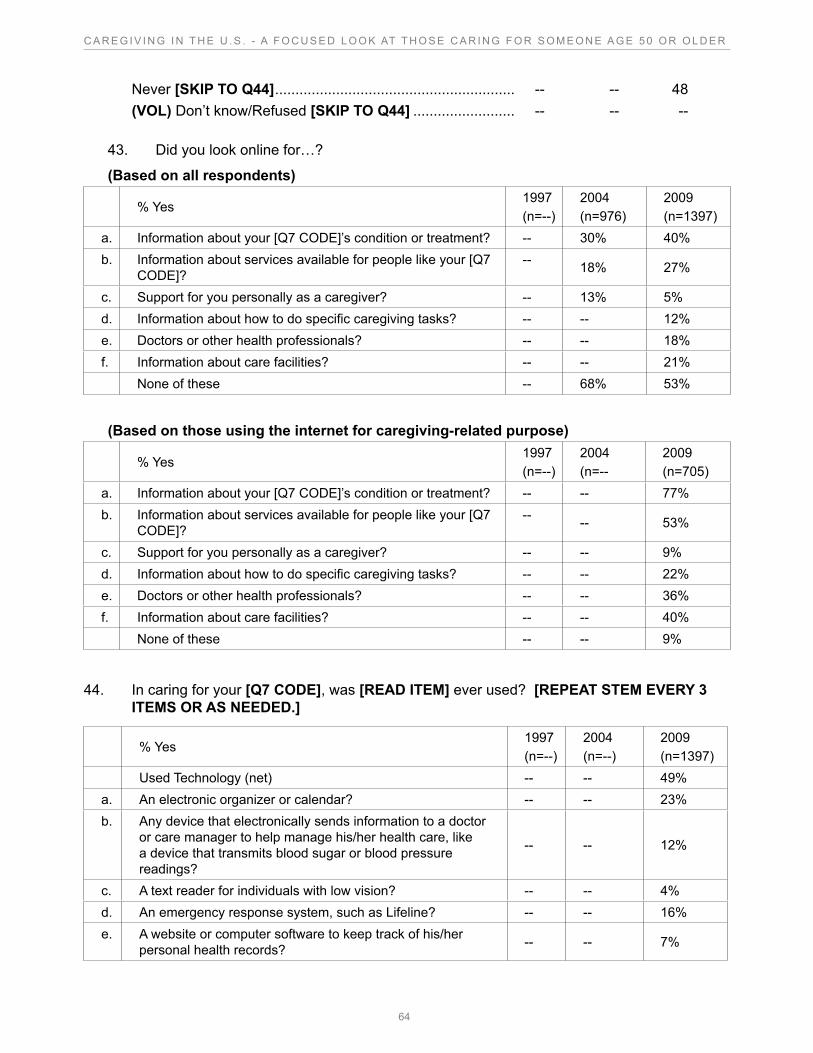
64
C A R E G I V I N G I N T H E U . S . - A F O C U S E D L O O K AT T H O S E C A R I N G F O R S O M E O N E A G E 5 0 O R O L D E R
Never [SKIP TO Q44] ........................................................... -- -- 48(VOL) Don’t know/Refused [SKIP TO Q44] ......................... -- -- --
43. Did you look online for…?
(Based on all respondents)
% Yes1997(n=--)
2004(n=976)
2009(n=1397)
a. Information about your [Q7 CODE]’s condition or treatment? -- 30% 40%b. Information about services available for people like your [Q7
CODE]? -- 18% 27%
c. Support for you personally as a caregiver? -- 13% 5%d. Information about how to do specific caregiving tasks? -- -- 12%e. Doctors or other health professionals? -- -- 18%f. Information about care facilities? -- -- 21%
None of these -- 68% 53%
(Based on those using the internet for caregiving-related purpose)
% Yes1997(n=--)
2004(n=--
2009(n=705)
a. Information about your [Q7 CODE]’s condition or treatment? -- -- 77%b. Information about services available for people like your [Q7
CODE]? -- -- 53%
c. Support for you personally as a caregiver? -- -- 9%d. Information about how to do specific caregiving tasks? -- -- 22%e. Doctors or other health professionals? -- -- 36%f. Information about care facilities? -- -- 40%
None of these -- -- 9%
44. In caring for your [Q7 CODE], was [READ ITEM] ever used? [REPEAT STEM EVERY 3 ITEMS OR AS NEEDED.]
% Yes1997(n=--)
2004(n=--)
2009(n=1397)
Used Technology (net) -- -- 49%a. An electronic organizer or calendar? -- -- 23%b. Any device that electronically sends information to a doctor
or care manager to help manage his/her health care, like a device that transmits blood sugar or blood pressure readings?
-- -- 12%
c. A text reader for individuals with low vision? -- -- 4%d. An emergency response system, such as Lifeline? -- -- 16%e. A website or computer software to keep track of his/her
personal health records? -- -- 7%
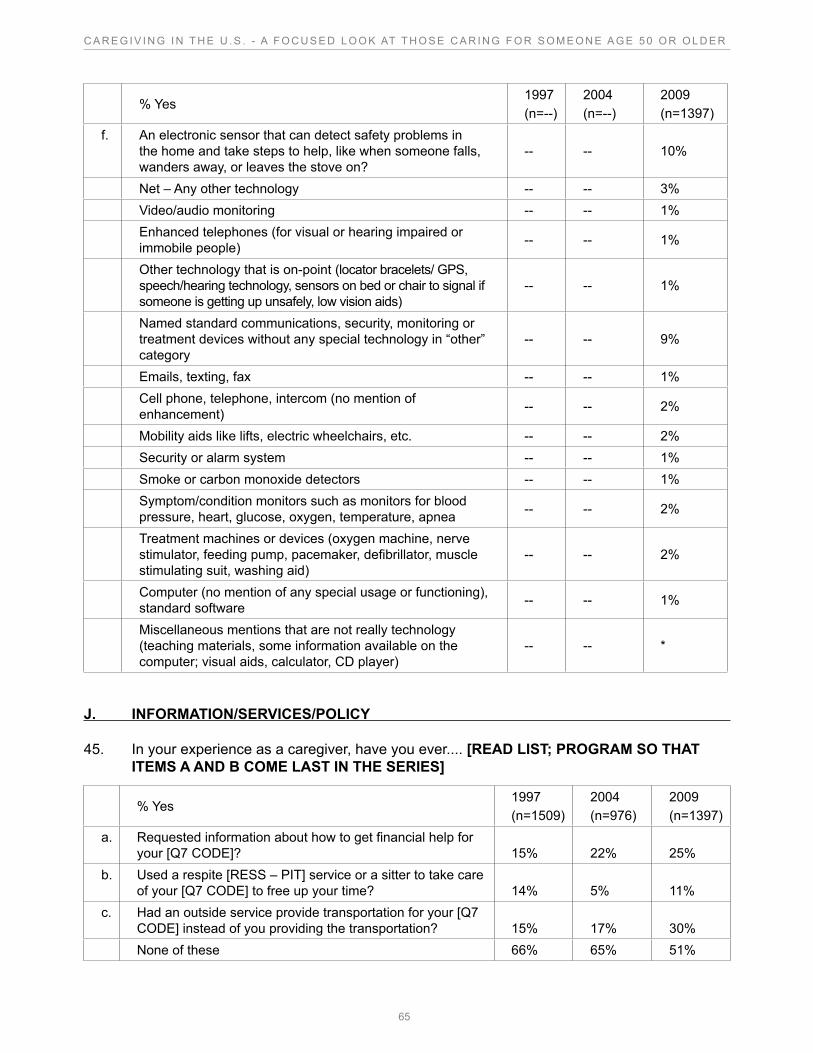
65
C A R E G I V I N G I N T H E U . S . - A F O C U S E D L O O K AT T H O S E C A R I N G F O R S O M E O N E A G E 5 0 O R O L D E R
% Yes1997(n=--)
2004(n=--)
2009(n=1397)
f. An electronic sensor that can detect safety problems in the home and take steps to help, like when someone falls, wanders away, or leaves the stove on?
-- -- 10%
Net – Any other technology -- -- 3%Video/audio monitoring -- -- 1%Enhanced telephones (for visual or hearing impaired or immobile people) -- -- 1%
Other technology that is on-point (locator bracelets/ GPS, speech/hearing technology, sensors on bed or chair to signal if someone is getting up unsafely, low vision aids)
-- -- 1%
Named standard communications, security, monitoring or treatment devices without any special technology in “other” category
-- -- 9%
Emails, texting, fax -- -- 1%Cell phone, telephone, intercom (no mention of enhancement) -- -- 2%
Mobility aids like lifts, electric wheelchairs, etc. -- -- 2%Security or alarm system -- -- 1%Smoke or carbon monoxide detectors -- -- 1%Symptom/condition monitors such as monitors for blood pressure, heart, glucose, oxygen, temperature, apnea -- -- 2%
Treatment machines or devices (oxygen machine, nerve stimulator, feeding pump, pacemaker, defibrillator, muscle stimulating suit, washing aid)
-- -- 2%
Computer (no mention of any special usage or functioning), standard software -- -- 1%
Miscellaneous mentions that are not really technology (teaching materials, some information available on the computer; visual aids, calculator, CD player)
-- -- *
J. INFORMATION/SERVICES/POLICY
45. In your experience as a caregiver, have you ever.... [READ LIST; PROGRAM SO THAT ITEMS A AND B COME LAST IN THE SERIES]
% Yes1997(n=1509)
2004(n=976)
2009(n=1397)
a. Requested information about how to get financial help for your [Q7 CODE]? 15% 22% 25%
b. Used a respite [RESS – PIT] service or a sitter to take care of your [Q7 CODE] to free up your time? 14% 5% 11%
c. Had an outside service provide transportation for your [Q7 CODE] instead of you providing the transportation? 15% 17% 30%None of these 66% 65% 51%
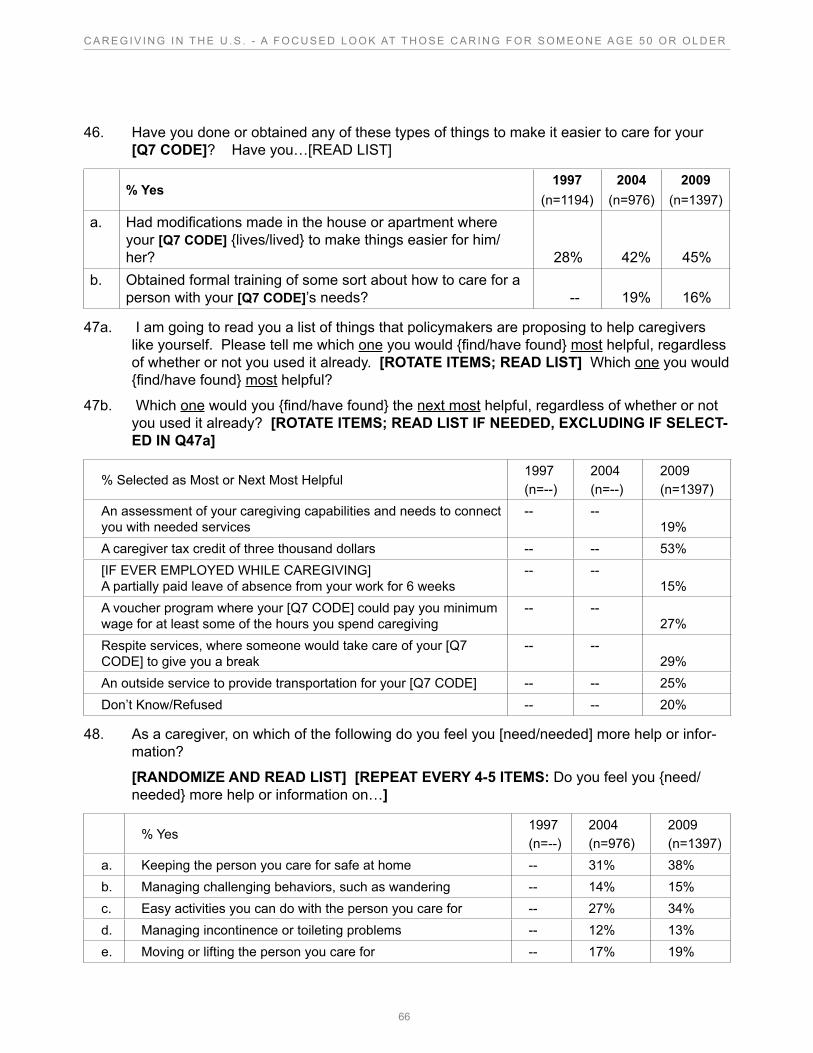
66
C A R E G I V I N G I N T H E U . S . - A F O C U S E D L O O K AT T H O S E C A R I N G F O R S O M E O N E A G E 5 0 O R O L D E R
46. Have you done or obtained any of these types of things to make it easier to care for your [Q7 CODE]? Have you…[READ LIST]
% Yes1997
(n=1194)2004
(n=976)2009
(n=1397)
a. Had modifications made in the house or apartment where your [Q7 CODE] {lives/lived} to make things easier for him/her? 28% 42% 45%
b. Obtained formal training of some sort about how to care for a person with your [Q7 CODE]’s needs? -- 19% 16%
47a. I am going to read you a list of things that policymakers are proposing to help caregivers like yourself. Please tell me which one you would {find/have found} most helpful, regardless of whether or not you used it already. [ROTATE ITEMS; READ LIST] Which one you would {find/have found} most helpful?
47b. Which one would you {find/have found} the next most helpful, regardless of whether or not you used it already? [ROTATE ITEMS; READ LIST IF NEEDED, EXCLUDING IF SELECT-ED IN Q47a]
% Selected as Most or Next Most Helpful1997(n=--)
2004(n=--)
2009(n=1397)
An assessment of your caregiving capabilities and needs to connect you with needed services
-- --19%
A caregiver tax credit of three thousand dollars -- -- 53%[IF EVER EMPLOYED WHILE CAREGIVING] A partially paid leave of absence from your work for 6 weeks
-- --15%
A voucher program where your [Q7 CODE] could pay you minimum wage for at least some of the hours you spend caregiving
-- --27%
Respite services, where someone would take care of your [Q7 CODE] to give you a break
-- --29%
An outside service to provide transportation for your [Q7 CODE] -- -- 25%Don’t Know/Refused -- -- 20%
48. As a caregiver, on which of the following do you feel you [need/needed] more help or infor-mation?
[RANDOMIZE AND READ LIST] [REPEAT EVERY 4-5 ITEMS: Do you feel you {need/needed} more help or information on…]
% Yes1997(n=--)
2004(n=976)
2009(n=1397)
a. Keeping the person you care for safe at home -- 31% 38%b. Managing challenging behaviors, such as wandering -- 14% 15%c. Easy activities you can do with the person you care for -- 27% 34%d. Managing incontinence or toileting problems -- 12% 13%e. Moving or lifting the person you care for -- 17% 19%
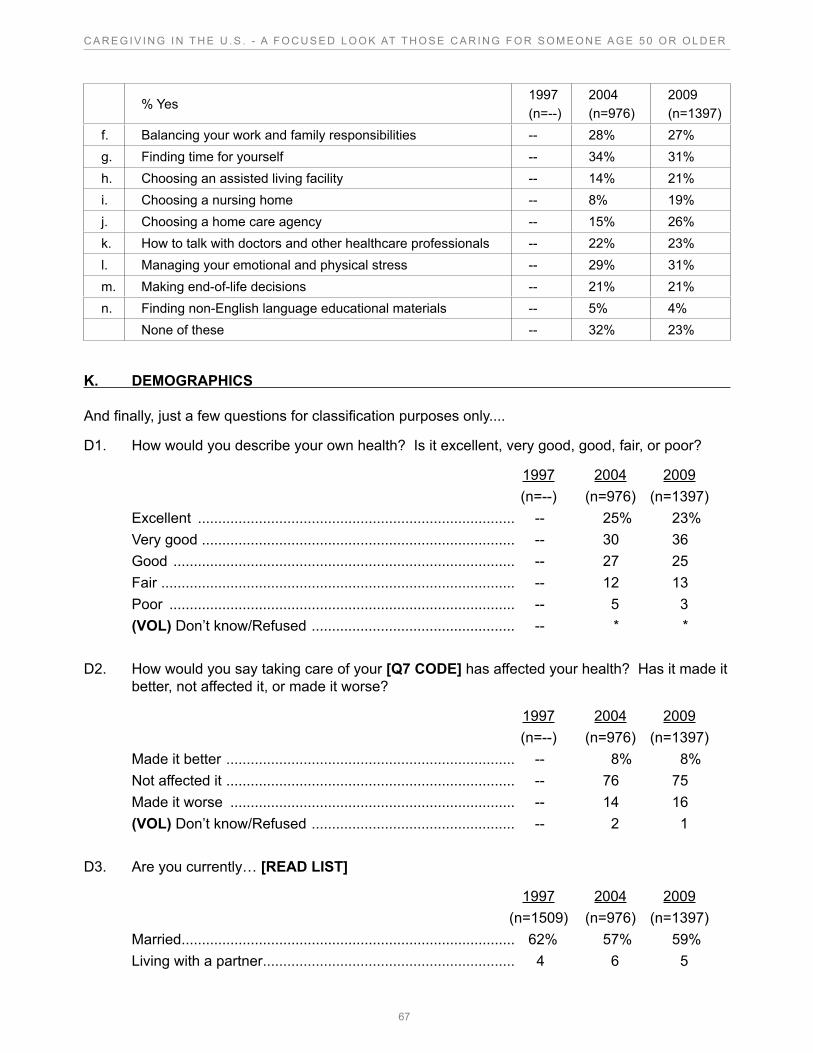
67
C A R E G I V I N G I N T H E U . S . - A F O C U S E D L O O K AT T H O S E C A R I N G F O R S O M E O N E A G E 5 0 O R O L D E R
% Yes1997(n=--)
2004(n=976)
2009(n=1397)
f. Balancing your work and family responsibilities -- 28% 27%g. Finding time for yourself -- 34% 31%h. Choosing an assisted living facility -- 14% 21%i. Choosing a nursing home -- 8% 19%j. Choosing a home care agency -- 15% 26%k. How to talk with doctors and other healthcare professionals -- 22% 23%l. Managing your emotional and physical stress -- 29% 31%m. Making end-of-life decisions -- 21% 21%n. Finding non-English language educational materials -- 5% 4%
None of these -- 32% 23%
K. DEMOGRAPHICS
And finally, just a few questions for classification purposes only....
D1. How would you describe your own health? Is it excellent, very good, good, fair, or poor?
1997 2004 2009 (n=--) (n=976) (n=1397)Excellent .............................................................................. -- 25% 23%Very good ............................................................................. -- 30 36 Good .................................................................................... -- 27 25Fair ....................................................................................... -- 12 13Poor ..................................................................................... -- 5 3(VOL) Don’t know/Refused .................................................. -- * *
D2. How would you say taking care of your [Q7 CODE] has affected your health? Has it made it better, not affected it, or made it worse?
1997 2004 2009 (n=--) (n=976) (n=1397)Made it better ....................................................................... -- 8% 8%Not affected it ....................................................................... -- 76 75Made it worse ...................................................................... -- 14 16(VOL) Don’t know/Refused .................................................. -- 2 1
D3. Are you currently… [READ LIST]
1997 2004 2009 (n=1509) (n=976) (n=1397)Married .................................................................................. 62% 57% 59%Living with a partner .............................................................. 4 6 5
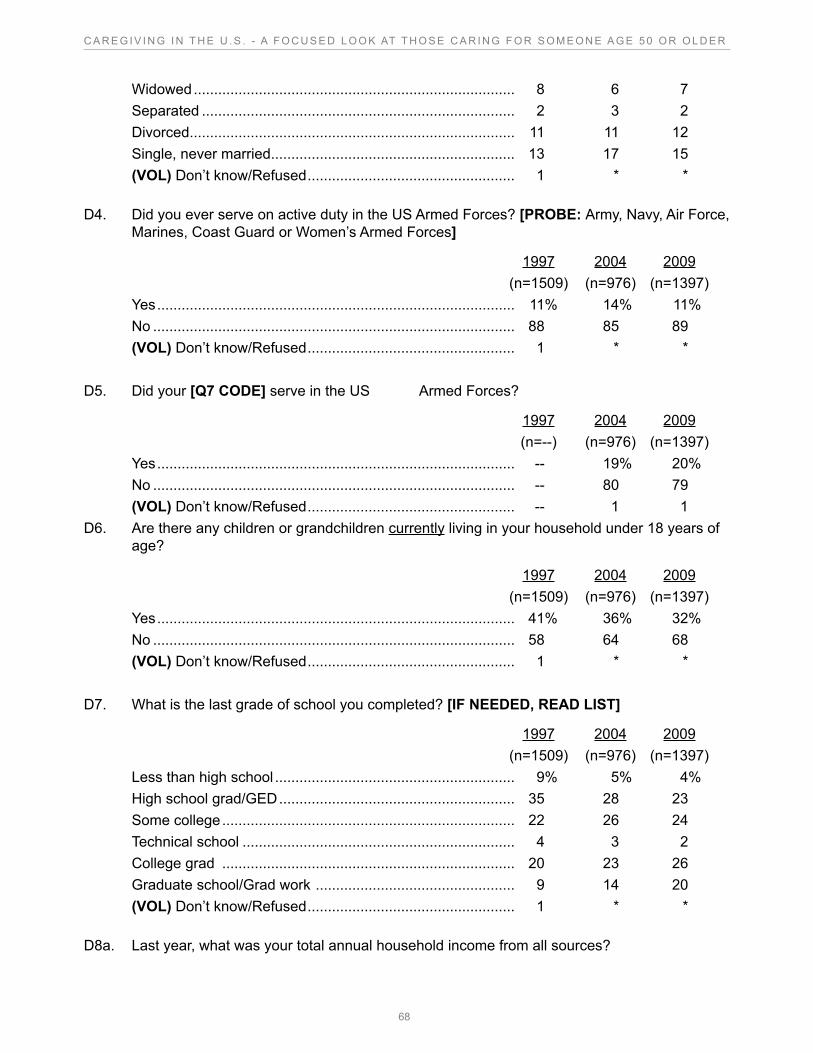
68
C A R E G I V I N G I N T H E U . S . - A F O C U S E D L O O K AT T H O S E C A R I N G F O R S O M E O N E A G E 5 0 O R O L D E R
Widowed ............................................................................... 8 6 7Separated ............................................................................. 2 3 2Divorced ................................................................................ 11 11 12Single, never married ............................................................ 13 17 15(VOL) Don’t know/Refused ................................................... 1 * *
D4. Did you ever serve on active duty in the US Armed Forces? [PROBE: Army, Navy, Air Force, Marines, Coast Guard or Women’s Armed Forces]
1997 2004 2009 (n=1509) (n=976) (n=1397)Yes ........................................................................................ 11% 14% 11%No ......................................................................................... 88 85 89(VOL) Don’t know/Refused ................................................... 1 * *
D5. Did your [Q7 CODE] serve in the US Armed Forces?
1997 2004 2009 (n=--) (n=976) (n=1397)Yes ........................................................................................ -- 19% 20%No ......................................................................................... -- 80 79(VOL) Don’t know/Refused ................................................... -- 1 1
D6. Are there any children or grandchildren currently living in your household under 18 years of age?
1997 2004 2009 (n=1509) (n=976) (n=1397)Yes ........................................................................................ 41% 36% 32%No ......................................................................................... 58 64 68(VOL) Don’t know/Refused ................................................... 1 * *
D7. What is the last grade of school you completed? [IF NEEDED, READ LIST]
1997 2004 2009 (n=1509) (n=976) (n=1397)Less than high school ........................................................... 9% 5% 4%High school grad/GED .......................................................... 35 28 23Some college ........................................................................ 22 26 24Technical school ................................................................... 4 3 2College grad ........................................................................ 20 23 26Graduate school/Grad work ................................................. 9 14 20(VOL) Don’t know/Refused ................................................... 1 * *
D8a. Last year, what was your total annual household income from all sources?
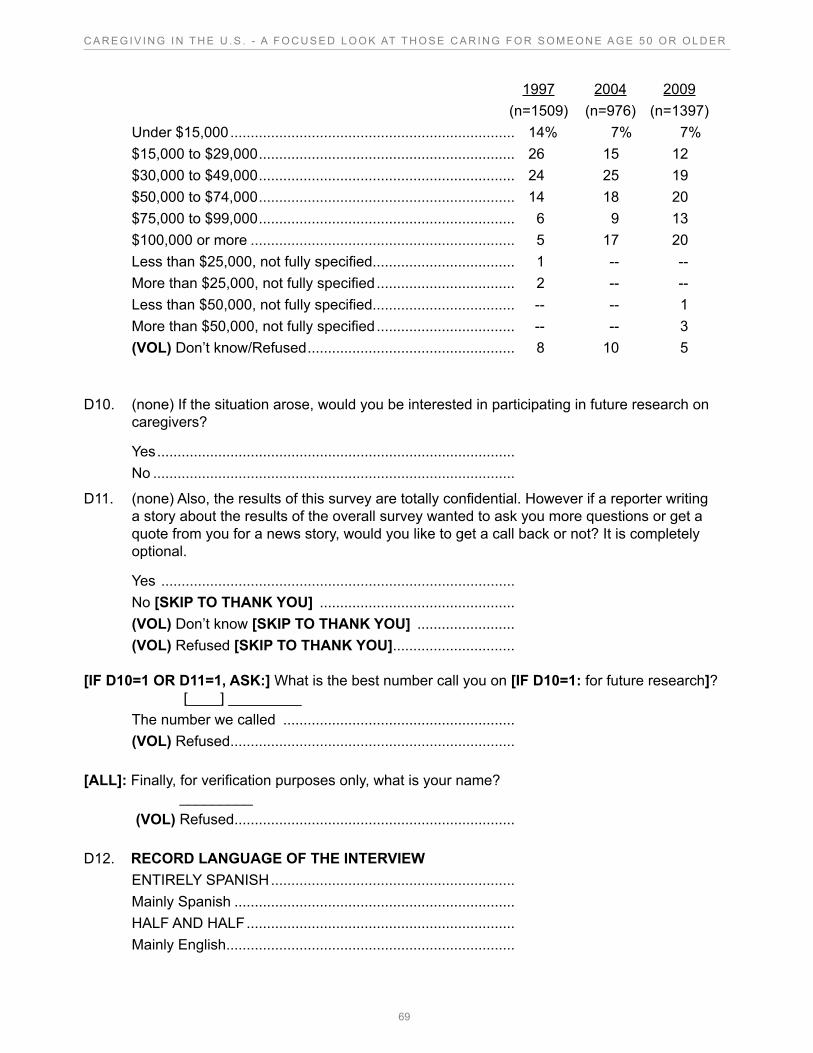
69
C A R E G I V I N G I N T H E U . S . - A F O C U S E D L O O K AT T H O S E C A R I N G F O R S O M E O N E A G E 5 0 O R O L D E R
1997 2004 2009 (n=1509) (n=976) (n=1397)Under $15,000 ...................................................................... 14% 7% 7%$15,000 to $29,000 ............................................................... 26 15 12$30,000 to $49,000 ............................................................... 24 25 19$50,000 to $74,000 ............................................................... 14 18 20$75,000 to $99,000 ............................................................... 6 9 13$100,000 or more ................................................................. 5 17 20Less than $25,000, not fully specified................................... 1 -- --More than $25,000, not fully specified .................................. 2 -- --Less than $50,000, not fully specified................................... -- -- 1More than $50,000, not fully specified .................................. -- -- 3(VOL) Don’t know/Refused ................................................... 8 10 5
D10. (none) If the situation arose, would you be interested in participating in future research on caregivers?
Yes ........................................................................................No .........................................................................................
D11. (none) Also, the results of this survey are totally confidential. However if a reporter writing a story about the results of the overall survey wanted to ask you more questions or get a quote from you for a news story, would you like to get a call back or not? It is completely optional.
Yes .......................................................................................No [SKIP TO THANK YOU] ................................................(VOL) Don’t know [SKIP TO THANK YOU] ........................(VOL) Refused [SKIP TO THANK YOU] ..............................
[IF D10=1 OR D11=1, ASK:] What is the best number call you on [IF D10=1: for future research]? [____] _________
The number we called .........................................................(VOL) Refused ......................................................................
[ALL]: Finally, for verification purposes only, what is your name? _________
(VOL) Refused .....................................................................
D12. RECORD LANGUAGE OF THE INTERVIEWENTIRELY SPANISH ............................................................Mainly Spanish .....................................................................HALF AND HALF ..................................................................Mainly English .......................................................................
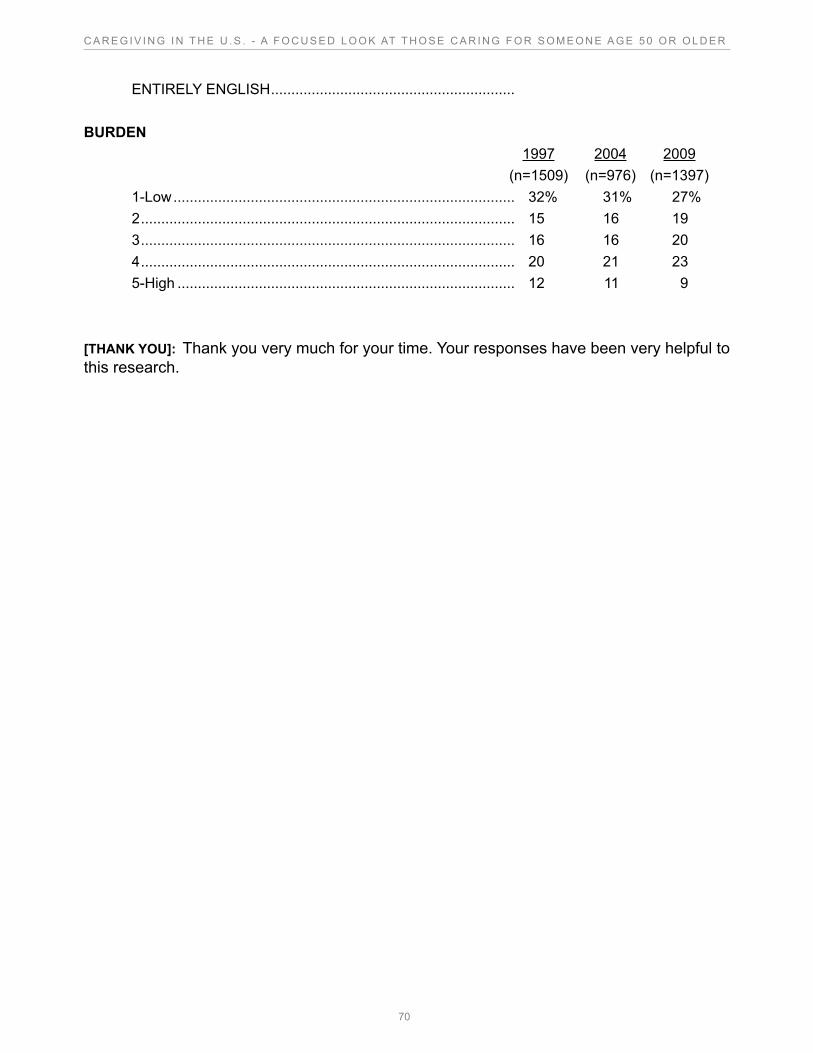
70
C A R E G I V I N G I N T H E U . S . - A F O C U S E D L O O K AT T H O S E C A R I N G F O R S O M E O N E A G E 5 0 O R O L D E R
ENTIRELY ENGLISH ............................................................
BURDEN 1997 2004 2009 (n=1509) (n=976) (n=1397)1-Low .................................................................................... 32% 31% 27%2 ............................................................................................ 15 16 193 ............................................................................................ 16 16 204 ............................................................................................ 20 21 235-High ................................................................................... 12 11 9
[THANK YOU]: Thank you very much for your time. Your responses have been very helpful to this research.
the national alliance for Caregiving is dedicated to providing support to family caregivers and the professionals who help them and to increasing public awareness of issues facing family caregivers.
Established in 1996, The National Alliance for Caregiving is a non-profit coalition of national organizations focusing on issues of family caregiving. Alliance members include grassroots organizations, professional associations, service organizations, disease-specific organizations, a government agency, and corporations.
The Alliance was created to conduct research, do policy analysis, develop national programs, increase public awareness of family caregiving issues, work to strengthen state and local caregiving coalitions, and represent the US caregiving community inter-nationally. Recognizing that family caregivers provide important societal and financial contributions toward maintaining the well-being of those they care for, the Alliance’s mission is to be the objective national resource on family caregiving with the goal of improving the quality of life for families and care recipients.
aarP is a nonprofit, nonpartisan membership organization that helps people 50+ have independence, choice and control in ways that are beneficial and affordable to them and society as a whole. AARP does not endorse candidates for public office or make contributions to either political campaigns or candidates. We produce AARP The Maga-zine, the definitive voice for 50+ Americans and the world’s largest-circulation maga-zine with over 35.5 million readers; AARP Bulletin, the go-to news source for AARP’s 40 million members and Americans 50+; AARP Segunda Juventud, the only bilingual U.S. publication dedicated exclusively to the 50+ Hispanic community; and our website, AARP.org. AARP Foundation is an affiliated charity that provides security, protection, and empowerment to older persons in need with support from thousands of volunteers, donors, and sponsors. We have staffed offices in all 50 states, the District of Columbia, Puerto Rico, and the U.S. Virgin Islands.
MetLife Foundation was established in 1976 by MetLife to carry on its longstanding tradition of corporate contributions and community involvement. In the area of aging, the Foundation funds programs that promote healthy aging and address issues of care-giving, intergenerational activities, aging in place, mental fitness, and civic engagement. More information about MetLife Foundation is available at www.metlife.org.
www.metlife.org
601 E Street,NWWashington, DC 20049
www.aarp.org
4720 Montgomery LaneSuite 205
Bethesda, MD 20814www.caregiving.org
Caregiving in the U.S.
D19236(1209)
A Focused Look at Those Caring for Someone Age 50 or Older