Embed Size (px)
Citation preview
IOSR Journal of VLSI and Signal Processing (IOSR-JVSP)
Volume 4, Issue 4, Ver. III (Jul-Aug. 2014), PP 09-13 e-ISSN: 2319 – 4200, p-ISSN No. : 2319 – 4197
www.iosrjournals.org
www.iosrjournals.org 9 | Page
A Fourier series based Template Matching Approach to Detect the
Splitting of Second Heart Sound
Anandarup Mukherjeea, Angshuman Khan
b
a,b(Dept. of Electronics & Communication Engg., University of Engineering & Management, Jaipur, India)
Abstract: In this paper, we present a method of detecting the splitting of heart sound S2 based on a template
matching approach. A mathematical model of normal S2 is created and tested on other normal S2 complexes for
goodness of fit. The generalized mathematical model is used as a template for detecting splitting of S2 sounds,
as they will not generate a good fit with a model of a normal S2 complex. This automated detection of splitting
of S2 can be used in the detection of congenital heart diseases or pulmonary hypertension. We have provided an
estimate of the fit results of the mathematically synthesized S2 complex with the split S2 complexes.
Keywords: Curve fitting, Fourier Series, Goodness of fit, Phonocardiography, Splitting of S2.
I. Phonocardiography The diagnostic procedure of generating a graphical registration of the sounds and murmurs produced in
the heart, its valves and great vessels is called phonocardiography. The graphical record of phonocardiogram is
called phonocardiograph (PCG) [1]. A typical phonocardiograph is recorded using microphones, which are kept
on the human thorax; the procedure is quite similar to using a stethoscope. Sounds in the frequency range of
25Hz to 100Hz are filtered out by the microphones. The fundamental advantages of PCG are:
a. The sounds which are below of human hearing range can be recorded;
b. Sounds can be exactly timed with the cardiac cycle;
c. The diagnostically significant properties like pitch, intensity or duration of sounds can also be analyzed.
1.1 Heart sounds
The generation of heart sounds can be attributed to some special mechanical events within the heart,
such as those caused by the closing & opening of the heart valves or the sudden distension of the arterial walls at
the time of ejection or during contraction of the myocardium. Amongst the reasons for generation of heart
sounds, the closure sound of valves is most significant as they are responsible for the generation of high
frequency sounds. The first heart sound is called S1 or systolic sound or „lub‟. It is a high frequency sound and
is related to opening and closing of Mitral & Tricuspid valve. This sound appears 0.02 seconds to 0.04 seconds
after the occurrence of QRS complex. It lasts for duration of 0.12 seconds to 0.15 seconds. The first heart sound
is attributed to the closing of the tricuspid & mitral valves. This sound is best heard in the area of mitral and
tricuspid auscultator. This sound precedes the sound of carotid pulse upstroke & it synchronous with the apex
beat. The intensity of S1 may vary depending on the atrio-ventricular valve mobility. S1 has four components
and when compared to an electrocardiogram (ECG), the first component starts at the peak of the R wave of the QRS complex.
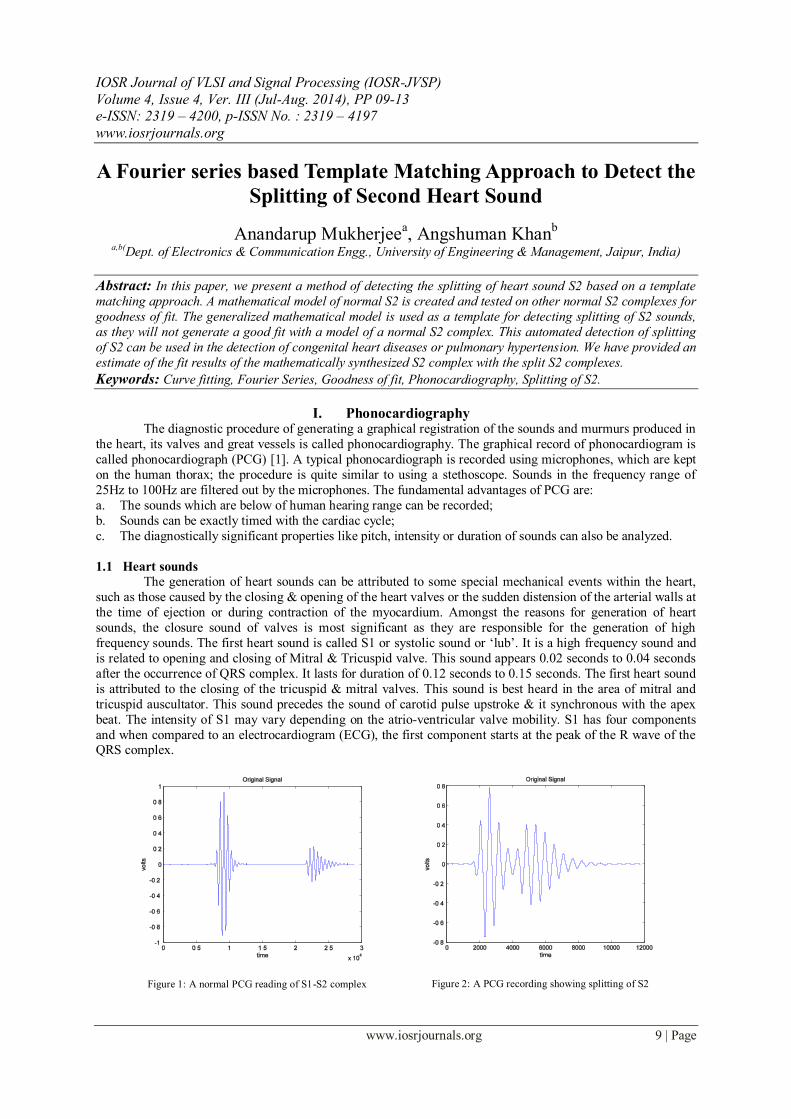
Figure 1: A normal PCG reading of S1-S2 complex
Figure 2: A PCG recording showing splitting of S2
A Fourier series based Template Matching Approach to Detect the Splitting of Second Heart Sound
www.iosrjournals.org 10 | Page
The second heart sound is known as S2 or diastolic sound or „dub‟. It is also a high frequency sound &
related to closing and opening of the semi-lunar valves. In the terminal period of the T wave, it appears & lasts
for 0.08 seconds to 0.12 seconds within a frequency range 50Hz to 70 Hz. This sound mainly arises due to the
closure of aortic valve and pulmonic valve. S2 starts with a gap of 5ms after closure of the aortic valves &
synchronous with dicrotic notch. S2 is best heard at the second left inter-space, near the sternal border. The second heart sound, S2, also consists of four components, i.e. S2A, S2B, S2C & S2D. S2A is a low pitched
vibration. It is due to the ventricular relaxation during a commencing diastole. The S2B represents the closure
sound of the semi-lunar valves & has high amplitude as well as high frequency. The third component represents
blood passing through arteries and is composed of one or two coarse vibrations of smaller amplitudes. It is
vascular in origin. The S2D component is due to the opening of the mitral and tricuspid valve with a low
vibration. Figure-1 illustrates a normal S1 and S2 heart sound from a PCG [10], [11].
1.2 Splitting of the Second Heart Sound:
Splitting of the second heart sound is generally found in the pulmonary area of healthy children. The
existence of aortic and pulmonary vessels is the indication of second sound splitting. In the case of congenital
heart disease, splitting of second sound is an important factor. If S2 splitting is found, it signifies the occurrence
of S2A due to closure of the aortic valves and occurrence of S2B due to the closure of pulmonary valves. In congenital heart disease or pulmonary hypertension accentuation, the diagnosis of other S2 components is
important [10]. In the aortic valve and apical valve areas S2 is generally single. Pathologically S2 splitting can
be of three types:
i. Fixed splitting: Due to the atrial septal defect (ASD)
ii. Large variable splitting(A2P2): Due to the late systole of right ventricle
iii. Paradoxial splitting (P2A2): Due to late systole of left ventricular & early closure of pulmonary valve.
Figure 2 illustrates the PCG recording of the splitting of second heart sound.
II. Curve Fitting The main objective of curve fitting is to generate a function or a curve such that it satisfies the given set
of data points. The main task associated with curve fitting is the determination of coefficients and other
parameters that fit best in the curve. It helps in generating a pattern or trend that is generally invisible in normal
data points. The advantage of curve fitting is that it sets the seemingly random points into an arranged format
making it more informative and in some cases even eliminating the noise and unwanted data. There are many
types of curve fitting methods that are used, depending on the desired result and the available data like the
Linear curve fitting, Polynomial curve fitting and Regression. Curve fitting can be further classified or extended
to Interpolation and Smoothing. Interpolation is the process of obtaining a data or point anywhere along the
generated curve that fits exactly to the given data. When this curve is used to find the points beyond the given
set of data it is called Extrapolation i.e., estimating the next possible data. Smoothing involves generating a
curve that is not an exact but an approximate fit to the data. The diverse usage of curve fitting has gained the interest of many researchers and over the years there have been many approaches to curve fitting, making it
more efficient and robust [4], [5]. M. Gulsen et al. [6] gave a genetic algorithm based approach to curve fitting
with multiple parameters and coefficients. Liang and David [7] proposed a method of fitting multi parametric
curve to disordered and erroneous data by using non linear minimization. Due to its ability of visualizing and
decreasing the randomness of the data, curve fitting finds its use in statistical analysis, biological signal
modeling and establishing relationship or connection between the biological events that follow such as ECG
Restitution Curve Analysis, Metabonomic Toxicology [8], modeling the kinetic flow of Bolus fluids [9]
III. Methodology 3.1 Database
The database for this paper is taken from the University of Michigan, Heart Sound and Murmur library.
This database contains the PCG recordings of various types of heart sounds and murmurs, recorded and encoded
in „.mp3‟ format with a bit-rate of 128kbps [12]. The recordings are primarily divided into three parts, based on
the place of recording of data from the human body, viz. Apex area, aortic area and pulmonary area. In our
work, we have taken into account, the recordings from the apex area only. Our selection from the database
reflects a normal S1-S2 database and three types of murmurs, namely, early systolic, mid- systolic and holo-
systolic murmur.
A Fourier series based Template Matching Approach to Detect the Splitting of Second Heart Sound
www.iosrjournals.org 11 | Page
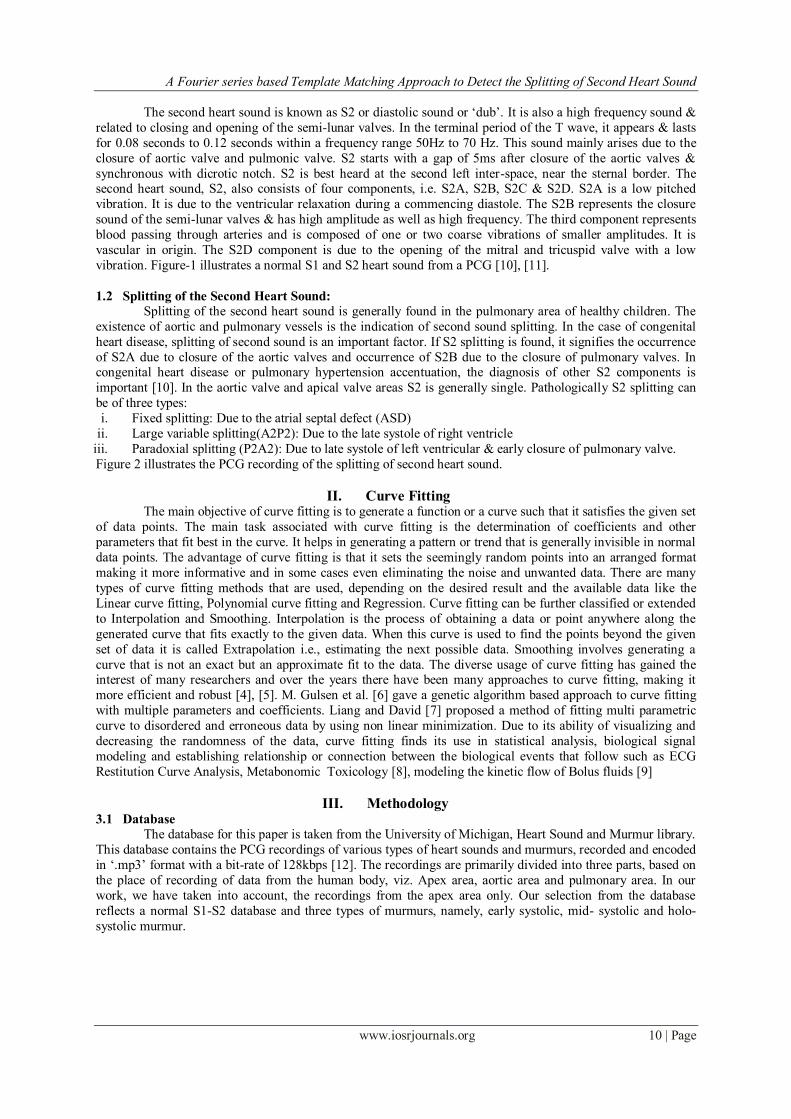
3.2 Flowchart
IV. Results 4.1 TABLE OF FOURIER COEFFICIENTS
The table of coefficients (table-1) lists the mean coefficients determined by the 8th order Fourier series
decomposition of normal S2 complexes. This synthesized curve for normal S2 gives an average goodness of fit,
determined by 2R value, of approximately 0.9818 for all normal S2 complexes. The values listed in table-1 are used for formulating equation 1.
Table 1: A table of the mean 8th Order Fourier Coefficients for synthesizing a normal S2 complex a0 a1 a2 a3 a4 a5 a6 a7 a8
-0.001178 -0.000335 -0.001958 0.006822 0.001567 0.0101614 -0.07982 0.1046 -0.0655
b1 b2 b3 b4 b5 b6 b7 b8
-0.000572 0.004044 -0.00969 -0.01401 0.09801 -0.195 0.1789 -0.0647 0.001472
4.2 EQUATION OF SYNTHESIZED CURVE
The equation in (1) is used as the template for distinguishing normal S2 sounds from Split S2 sounds in PCG recordings of various subjects. The template for matching, generated by the equation in (1) is illustrated in
figure 4.
)8sin(0647.0)7sin(1789.0
)6sin(195.0)5sin(09801.0)4sin(01401.0)3sin(00969.0)2sin(004044.0
)sin(0005722.0)8cos(0655.0)7cos(1046.0)6cos(07982.0)5cos(01614.0
)4cos(001567.0)3cos(006822.0)2cos(001958.0)cos(0003356.0001178.0)(
xx
xxxxx
xxxxx
xxxxxf
(1)
PCG Database
Normal PCG recordsPCG records with split
S2
Fourier Series based
eqn. for S2
Goodness of Fit
Use the equation as a
template for checking
S2
Is equation valid for all
normal complexes?
Stop
NO
YES
Is goodness of fit above
0.9 ?
Normal S2 detected Split S2 detected
YES
NO
Figure 1: A flowchart describing the methodology followed in this paper.
A Fourier series based Template Matching Approach to Detect the Splitting of Second Heart Sound
www.iosrjournals.org 12 | Page
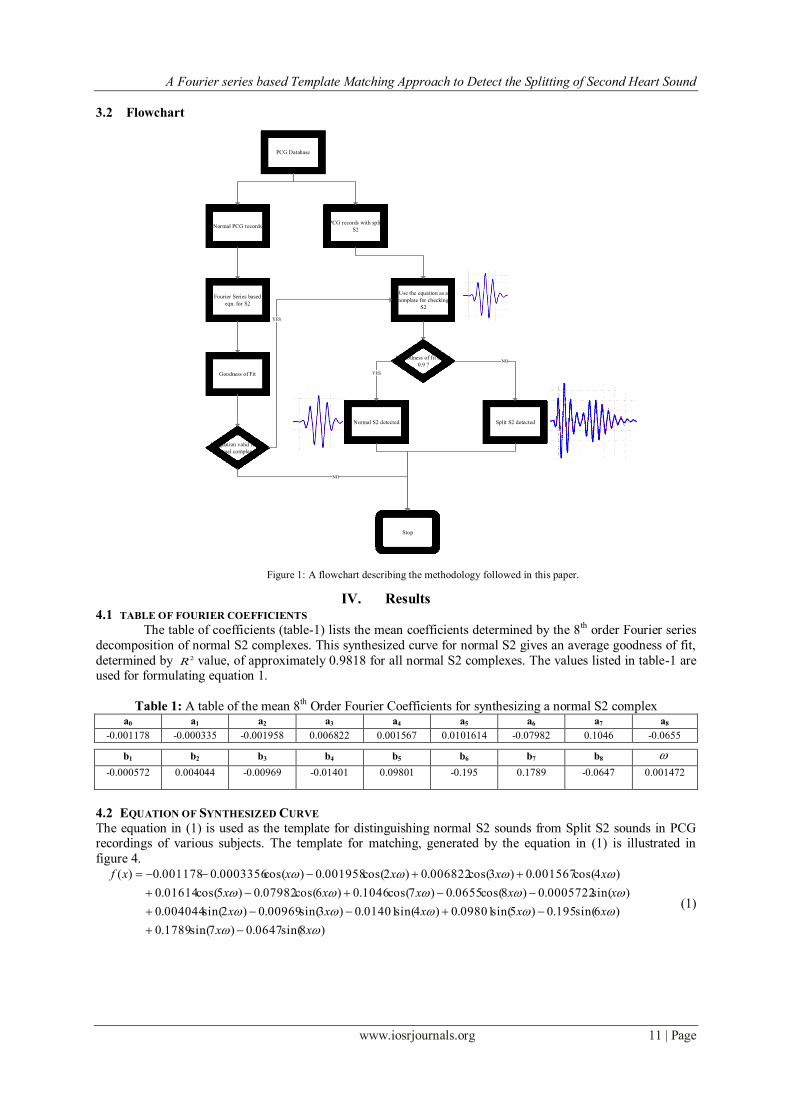
4.3 RESULT OF TEMPLATE BASED DETECTION FOR S2 SPLITTING
Figure 2: A plot of the synthesizing equation given in (1), which acts as the template for detection of Split S2
The following figures, from fig. 5 to 7 depict the use of the synthesized template for matching to the
original signal. It is evident in figure 5, that the synthesized signal gives a good fit when tested with a normal S2
complex, with an R2 value of over 0.98. The magnified view of the template matching
operation with a normal S2 is shown in figure 6. The template matching operation gives an R2 value of
below 0.60 for complexes with splitting of S2 sounds as the fit is not good. This is clearly observed in
figure 7 and in table 2.
Table 2: A table of the R2 values obtained during the fitting of normal S2 template to original PCG signals with
split S2
V. Conclusion The previous section makes it clear that this approach is quite efficient in detecting split S2 complexes
and the value of R2 can clearly indicate the presence of S2 splitting. The dependence of this method on a
singular goodness of fit coefficient, to differentiate between normal and split S2 complexes, makes this method
easier and faster to implement on digital systems. Only the basic operation of comparing the template
coefficients to the data points on the original curve is required to implement this system, which can be done very easily on a FPGA board. Our method took a maximum of 0.6856 seconds to execute and generate results on an
Intel core i3 processor with a 4GB RAM. Our future work will include the performance analysis of this method
to already existing algorithms and its implementation on a FPGA board.
Complex-1 Complex-2 Complex-3 Complex-4 Complex-5 Complex-6
0.5915 0.5798 0.5764 0.5796 0.5794 0.5733
Complex-7 Complex-8 Complex-9 Complex-10 Complex-11 Complex-12
0.5749 0.5816 0.4863 0.5803 0.5444 0.5260
Figure 5: A plot of the synthesized
template on the original, Normal S2,
providing a good fit (R2>0.9)
Figure 6: A magnified view of one of the
peaks from Fig. 3, highlighting the fit of the
synthesized complex to the original curve
Figure 7: A plot of the template matching
operation with a split S2 complex, giving
a very poor fit (R2<0.6)
A Fourier series based Template Matching Approach to Detect the Splitting of Second Heart Sound
www.iosrjournals.org 13 | Page
References Books: [1] Howard B. Sprague, M.D., Patrick A. Ongley, M.D., “The Clinical Value of Phonocardiography”, Circulation. 1954;9:127-134
[2] Sandra LachArlinghaus, PHB Practical Handbook of Curve Fitting. CRC Press, 1994.
[3] William M. Kolb. Curve Fitting for Programmable Calculators. Syntec, Incorporated, 1984
Journals: [4] Brooks, E.B.; Thomas, V.A; Wynne, R.H.; Coulston, J.W., "Fitting the Multitemporal Curve: A Fourier Series Approach to the
Missing Data Problem in Remote Sensing Analysis," Geoscience and Remote Sensing, IEEE Transactions on , vol.50, no.9,
pp.3340,3353, Sept. 2012,doi: 10.1109/TGRS.2012.2183137
[5] Brooks, E.B.; Thomas, V.A; Wynne, R.H.; Coulston, J.W., "Fitting the Multitemporal Curve: A Fourier Series Approach to the
Missing Data Problem in Remote Sensing Analysis," Geoscience and Remote Sensing, IEEE Transactions on , vol.50, no.9,
pp.3340,3353, Sept. 2012,doi: 10.1109/TGRS.2012.218313
[6] M. GULSEN, A. E. SMITH, D. M. TATE,"A genetic algorithm approach to curve fitting", International Journal of Production
Research Vol. 33, Iss. 7, 1995
[7] 18. Songxin Liang, David J. Jeffrey, "An analytical approach for solving nonlinear boundary value problems in finite domains",
Numerical Algorithms, Volume 56, Issue 1 , pp 93-106 , Springer US 2011, doi: 10.1007/s11075-010-9375-z
[8] 19. Crockford DJ1, Keun HC, Smith LM, Holmes E, Nicholson JK. "Curve-fitting method for direct quantitation of compounds in
complex biological mixtures using 1H NMR: application in metabonomic toxicology studies", Anal Chem. 2005 Jul
15;77(14):4556-62.PMID: 16013873
[9] 20. Regine Schmidt, Dirk Graafen, Stefan Weber, and Laura M. Schreiber. "Computational Fluid Dynamics Simulations of Contrast
Agent Bolus Dispersion in a Coronary Bifurcation: Impact on MRI-Based Quantification of Myocardial Perfusion", Computational
and Mathematical Methods in Medicine Volume 2013 (2013), Article ID 513187,http://dx.doi.org/10.1155/2013/513187
Online Resources: [10] http://www.easyauscultation.com/heart-sounds
[11] Dugdale David C, Chen Michael A., Zieve D, “Heart murmur and sounds, Medline Plus,
http://www.nlm.nih.gov/medlineplus/ency/article/003266 .htm”
[12] University of Michigan, Heart Sound and Murmur Library, http://www.med.umich.edu/lrc/psb/heartsounds/.


![QATM: Quality-Aware Template Matching for Deep Learning · 2019. 6. 10. · Classic template matching [11, 26, 14], constrained template matching [31], image-to-GPS matching [7],](https://img.pdfslide.net/doc/110x75/60c910b5151713028a33cc0a/qatm-quality-aware-template-matching-for-deep-learning-2019-6-10-classic-template.jpg)