Embed Size (px)
Citation preview
sensors
Article
A Framework for Agricultural Pest and DiseaseMonitoring Based on Internet-of-Things andUnmanned Aerial Vehicles
Demin Gao 1,2,* , Quan Sun 1 , Bin Hu 3 and Shuo Zhang 1
1 College of Information Science & Technology, Nanjing Forestry University, Nanjing 210037, China;[email protected] (Q.S.); [email protected] (S.Z.)
2 Department of Computer Science and Engineering, University of Minnesota, Minneapolis, MN 55414, USA3 College on Information Science & Technology, Nanjing Agriculture University, Nanjing 210095, China;
[email protected]* Correspondence: [email protected]
Received: 9 January 2020; Accepted: 4 March 2020; Published: 8 March 2020�����������������
Abstract: With the development of information technology, Internet-of-Things (IoT) and low-altituderemote-sensing technology represented by Unmanned Aerial Vehicles (UAVs) are widely used inenvironmental monitoring fields. In agricultural modernization, IoT and UAV can monitor theincidence of crop diseases and pests from the ground micro and air macro perspectives, respectively.IoT technology can collect real-time weather parameters of the crop growth by means of numerousinexpensive sensor nodes. While depending on spectral camera technology, UAVs can capturethe images of farmland, and these images can be utilize for analyzing the occurrence of pests anddiseases of crops. In this work, we attempt to design an agriculture framework for providingprofound insights into the specific relationship between the occurrence of pests/diseases and weatherparameters. Firstly, considering that most farms are usually located in remote areas and far away frominfrastructure, making it hard to deploy agricultural IoT devices due to limited energy supplement,a sun tracker device is designed to adjust the angle automatically between the solar panel and thesunlight for improving the energy-harvesting rate. Secondly, for resolving the problem of shortflight time of UAV, a flight mode is introduced to ensure the maximum utilization of wind force andprolong the fight time. Thirdly, the images captured by UAV are transmitted to the cloud data centerfor analyzing the degree of damage of pests and diseases based on spectrum analysis technology.Finally, the agriculture framework is deployed in the Yangtze River Zone of China and the resultsdemonstrate that wheat is susceptible to disease when the temperature is between 14 ◦C and 16 ◦C,and high rainfall decreases the spread of wheat powdery mildew.
Keywords: agricultural pests and diseases; internet of things; unmanned aerial vehicle
1. Introduction
Due to population growth and social development, world food demand is expected to doubleby 2050 [1], but it is currently challenging to increase food production because of falling water levels,climate change, arable land reduction, and pests and diseases [2]. Pests and diseases have alwaysbeen among the critical factors that restrict the increase of grain production [3], causing substantialeconomic losses to agriculture. According to the statistics of the Food and Agriculture Organization ofthe United Nations (FAO), global grain production will be reduced by 10–16% annually owing to theoccurrence of crop pests and diseases. In China, investigation shows that pests and diseases causeabout 40 million tons of grain loss each year [4].
Sensors 2020, 20, 1487; doi:10.3390/s20051487 www.mdpi.com/journal/sensors

Sensors 2020, 20, 1487 2 of 18
For detecting the occurrence of pests and diseases on farms, remote-sensing technologies (e.g.,satellites and drones (in this paper, we will use “drone” and “UAV” interchangeably)), are employedto find insect pests and inform farmers of the state-of-affairs promptly [5]. Agricultural detectiontechnology depending on satellites, called high-altitude remote-sensing technology, has the advantagesof the extensive monitoring area, fine timeliness, short revisit period, and low cost [6]. On the onehand, a satellite device can cover a large area and is suitable for a wide range of disaster monitoring.On the other hand, satellite technology is susceptible to weather and has a low spatial resolution,making it challenging to meet the need for pest and disease monitoring in agricultural fields [7]. Now,the remote-sensing technology with low-altitude (e.g., drones) has the characteristics of high flexibilityand image definition [8], which can meet the requirements of pest and disease monitoring for crops.
Currently, the detection technology depending on drones or UAV devices, named low-altituderemote-sensing technology, has been applied widely in modern farms [9], which can guarantee a hightimeliness of acquired data [10]. When drones are used for detecting the occurrence of pests anddiseases, the information about pests and diseases of crops should be standardized and digitized [11].However, for a drone, due to limited carrying weight and battery capacity in a remote large-scale farm,it faces the problems containing short flight time and frequent battery replacement [12]. Nowadays,these characteristics affect the promotion and application of drones in the modern agricultural field.In this work, for reducing the energy consumption of a drone, its flight route on the farm is plannedpreviously to ensure that the entire farm is checked with the shortest flight distance. At the same time,the drone can utilize wind force to prolong its flight time when it flies on the farm and selects the pathwith the largest proportion of the downwind distance. Besides, the drone can adjust its flying angledynamically for saving energy according to different wind directions.
The eruption of pests and diseases is closely related to climate change during the crop growthperiod [13]. IoT technology is utilized to collect information on entities of interest [14], which providesa convenient method to monitor the growing processes of crops in real time. However, most farms areoften far away from infrastructure and face the problem of limited energy supply, which restricts thedevelopment and popularization of agricultural IoT technology [15]. At present, the energy harvestingtype of IoT technology represented by solar power is gradually applied to the agricultural field [16].Nevertheless, in the currently used photovoltaic power generation system, fixed solar panels aremainly used for convenience [17]. The solar energy conversion rate is related to the angle between thesolar panel and sunlight [18], and it is on the influence of the light angle. In the work, an automaticrotary-device based on angle perception of sun illumination is designed for ensuring that the solarpanel is always perpendicular to the sunlight, which ensures that more solar power is converted intoelectric energy.
The contributions are summarized as follows:
• An automatic rotary-device based on angle perception of sun illumination is designed for ensuringthe solar panel is always perpendicular to sunlight and improving the energy-harvesting ratefrom solar power.
• An IoT framework containing multiple wireless technologies (e.g., LoRa, ZigBee, TVWS) is proposedfor collecting information and transmitting the collected data to the base station/gateway.
• A strategy to prolong the flight time of a drone is introduced by planning the flying path with thelargest proportion of downwind and ensuring the maximum utilization of wind force.
The remainder of this paper is organized as follows. Section 2 gives a review on the existingstrategies for monitoring agricultural pests and diseases. Section 3 presents our method and design indetail. Section 4 contains experimental results and Conclusion is in Section 5.
2. Related Work
Pests and diseases of crops have always been an important factor hindering agriculturaldevelopment [19]. A great quantity of works have been proposed for monitoring agricultural pests

Sensors 2020, 20, 1487 3 of 18
and diseases, i.e., early warning system of diseases and pests based on wireless sensor network [20,21]and remote video interactive systems [22]. In [23], a pest and disease reporting system is established toinvestigate and report on various crops such as potatoes, soybeans, rice, and sweet potatoes. In [24],the authors review the influence of pests and diseases to global tomato production. Denmark [25] hasdeveloped a pest and disease monitoring system to monitor seven crops such as winter wheat andspring barley, and developed a plant protection information system to integrate pesticides, pests, plantprotection programs and field records.
At present, the mainstream pest and disease monitoring technologies applied internationally canbe divided into two categories: IoT technology and remote-sensing technology. The IoT technology hasemerged as a significant promising technology [26,27], containing numerous inexpensive sensor nodesrandomly scattered over the area of interest to collect information on entities of interest [27–29], havebeen used for wide-ranging applications in the fields of climate simulation monitoring [30], real-timevideo monitoring of pests and diseases [31], and real-time early warning systems for predicting theoccurrence of pests and diseases [32]. For agroclimatic diseases (such as wheat powdery mildew),the establishment of climate models through data collected by small climatic instruments arrangedin the field can markedly reduce the incidence of pests of crops [33]. In [34], the authors propose ahardware design architecture of the Wireless Sensor and Actuators Networks (WSANs) for real-worldagricultural applications.
Recent advances in remote-sensed imagery and geospatial image processing using unmannedaerial vehicles have enabled the rapid and ongoing development of monitoring tools for cropmanagement and the detecting/surveillance of insect pests and diseases [35]. The real-time videomonitoring system for pests and diseases is established publicly by the aid of high-definitioncameras [36] on UAVs or mounting racks, which means farmers have to enter the farmland forchecking the crops frequently and improve the overall working efficiency [37]. For mapping theoverflown environment of farms in point clouds, a Light Detection and Ranging (LiDAR) sensormounted on an Unmanned Aerial Vehicle (UAV) is introduced in [38], Other examples can be foundin [39–41] and references therein.
Some monitoring and early warning devices for climatic epidemics of crops have been employedin China, such as the potato late blight real-time monitoring [42] and early warning system adopted byChongqing (City of China) which relies on sensor devices deployed in the farm to collect importantenvironmental parameters, such as humidity, temperature, wind speed and rainfall [43]. Then, theseparameters are uploaded to a cloud data center through wireless networks, and the server uses thepre-established model based on big data analytic methods to analyze the probability of occurrence ofplant diseases, and provides an early warning to formers [44]. In [45], the authors perform a reviewon current studies and research works in agriculture which employ the recent practice of big dataanalysis, in order to solve various relevant problems.
However, with regard to the current research and application of IoT technology in the agriculturalpests-monitoring field, the IoT monitoring technology is not mature enough, and there is still a gapbetween the standards and demands for large-scale promotion. The factors restricting the applicationof agricultural IoT technology have not been fully solved yet, e.g., energy supply, data fusion andcommunication, etc. Moreover, the IoT technology used to monitor pests and diseases has not yetformed a unified standard in terms of interfaces, services and equipment development. At present,most of the existing IoT monitoring technologies are still at the stages of demonstration and experiment,failing to build a complete IoT monitoring platform for pests and diseases.
3. System Model
3.1. The Agricultural IoT Platform
The occurrence of plant diseases and pests is closely related to many weather paraments [46],such as the pests of crop surviving in some unusual weather conditions. At the same time, rainfall and

Sensors 2020, 20, 1487 4 of 18
high humidity will affect the propagation and spread of pathogens significantly [47]. Wind can notonly affect the spread of spores, but also increase the risk of pests and diseases for crops. Therefore, foranalyzing the reasons causing the occurrence of diseases and pests of crops, a modern agricultural IoTplatform is designed for monitoring plant pests and diseases. In the system, the primary role of theagriculture IoT platform is to collect the information and monitor the weather parameters of the farm.
Considering a farm is open and in outdoor generally, the agricultural IoT platform mainly containsthe following parts: energy supplying devices, IoT base stations, gateways, a cloud data center, and APP(Application) software. An overview of the system is given in Figure 1. A smart solar power systembased on angle perception of sun illumination is designed to provide power for the platform, the detailof energy supplying system is provided in Section 3.2. The IoT base station is mainly composed of TVWhite Spaces (TVWS) and LoRa sensor connection modules. LoRa technology with a long transmissionrange is used for collecting data from multiple sensors and transmitting the data to the gateway. TVWStechnology with high-bandwidth is utilized for transmitting the videos or images from UAVs equippedwith special optical sensors. The communication of IoT base stations is introduced in Section 3.3.
The cloud data center is responsible for providing services of data fusion and data analysis. Sincethe cloud data center is generally far away from the farms, the data from LoRa devices and TVWSwill first be forwarded to the gateway. Currently, wired networks or wireless networks are widelydeployed in China. According to the “CT China 2008 High Level Forum”, the 4G network coversmore than 98% of the population and 95% of the country’s land area of China [48]. Therefore, thegateway can be deployed in farmer houses to forward these data to cloud data centers relying onthese networks. In cloud data centers, the data collected by LoRa devices are used for monitoringweather parameters, and the information provided by the TVWS communication system is utilizedfor generating a precision map and planning the UAV path. It is important to note that the clouddata center is one of the most important parts of the framework and is responsible for processing thedata. The results of data analysis will provide the real-time conditions of crops for farmers; details areprovided in Sections 3.4 and 4.2. The system also provides an APP interface, which is more convenientfor farmers to control their farms.
Sensor
LoRa
TVWS
Precision
Map
UAV path
Planning
Local computing
Pest monitoring
Environmental
monitoring
Service
Data
storageInternet of
Things center
Cloud
APP
Solar
Panel
IoT Base Station
UAV
Gatew
ay
Figure 1. Overview of the agricultural IoT platform.
3.2. Energy Supply Based on an Automatic Rrotary Alignment Device
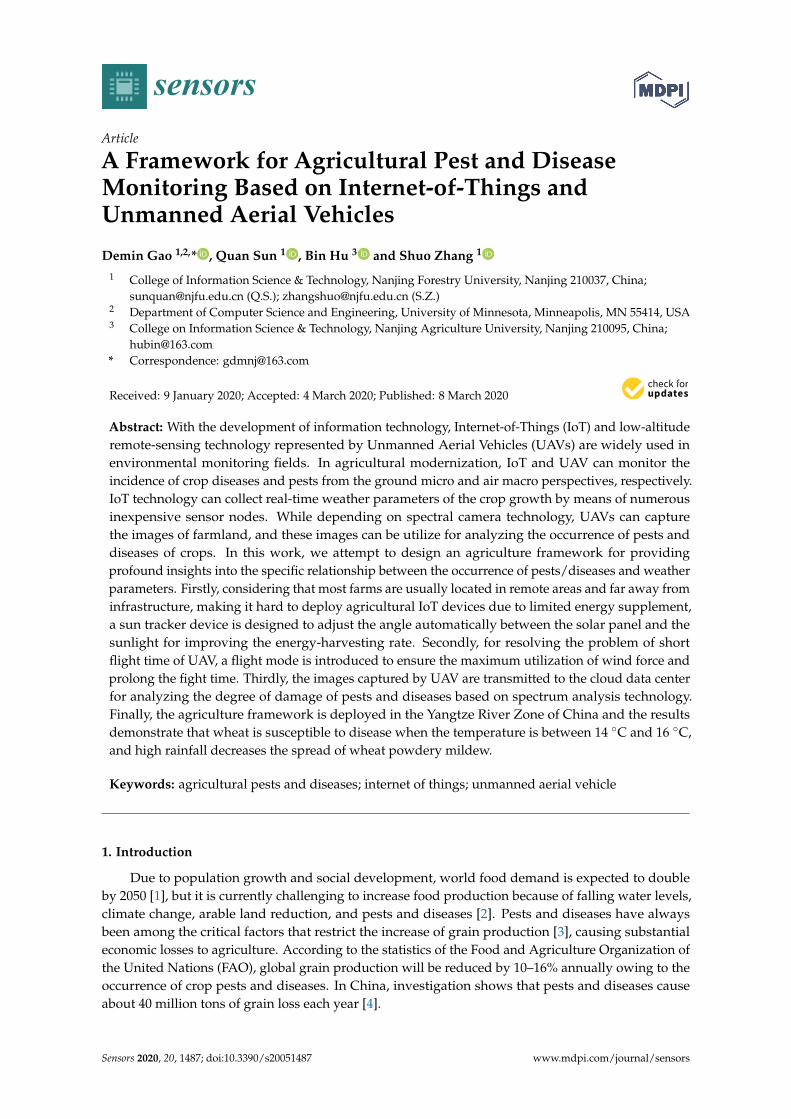
The energy system uses a solar panel to generate electricity and power sensor devices.The harvesting energy is under the influence of weather conditions. For instance, when a sensorlies in direct sunlight at 12 am, the power density can reach 3700 µW/cm2, energy harvesting rate is370 mW, and the duty cycle achieved by the Crossbow MICAz can reach about 45%. When the sensornode lies indoors, the power density is about 320 µW/cm2, the energy harvesting rate is 320 µW, andthe duty cycle is estimated to be about 0.04% [49]. Therefore, the energy harvesting sensor networksare environment-dependent networks. Figure 2 shows the affordable duty cycle of a node in three
Sensors 2020, 20, 1487 5 of 18
different weather conditions in spring. From the empirical measurement results, a node can onlyoperate about 3.5 hours continuously if its duty cycle is over 20%.
0 5 10 15 20 250
0.05
0.1
0.15
0.2
0.25
0.3
0.35
Time(hours)
aver
age
duty
−cy
cles
of s
enso
rs
0−10% percent10−30% percent30−70% percent
Figure 2. A solar powered sensor is deployed in outdoor.
For improving energy-harvesting rates, an OpenWeather API [50] interface is applied in theenergy system to obtain the future possible weather in the next few days (e.g., 3 days). According tothe obtained information, the system regulates its energy consumption by controlling its duty-cycles.At the same time, an Automatic Device based on Angle Perception of sun illumination, named AD–AP,is used to control a solar panel rotating with the movement of the sun, which guarantees that thesolar panel is always perpendicular to the sun. The principle of AD–AP imitates the living habits ofsunflowers, which maximize the utilization of solar energy. The AD–AP consists of a sun tracker, aheight angle axis, a speed reducer, two motors, an upper pedestal, a lateral axis, and a lower pedestal.The structure of the AD–AP is shown in Figure 3.
1.Sun tracker
2.Height angle axis
3.Motor1
4.Reducer
5.Upper pedestal
6.Lateral axis
7.Motor2
8.Lower pedestal
2
6
5
1
7
Figure 3. Model of automatic rotary alignment device based on angle perception of sun illumination.
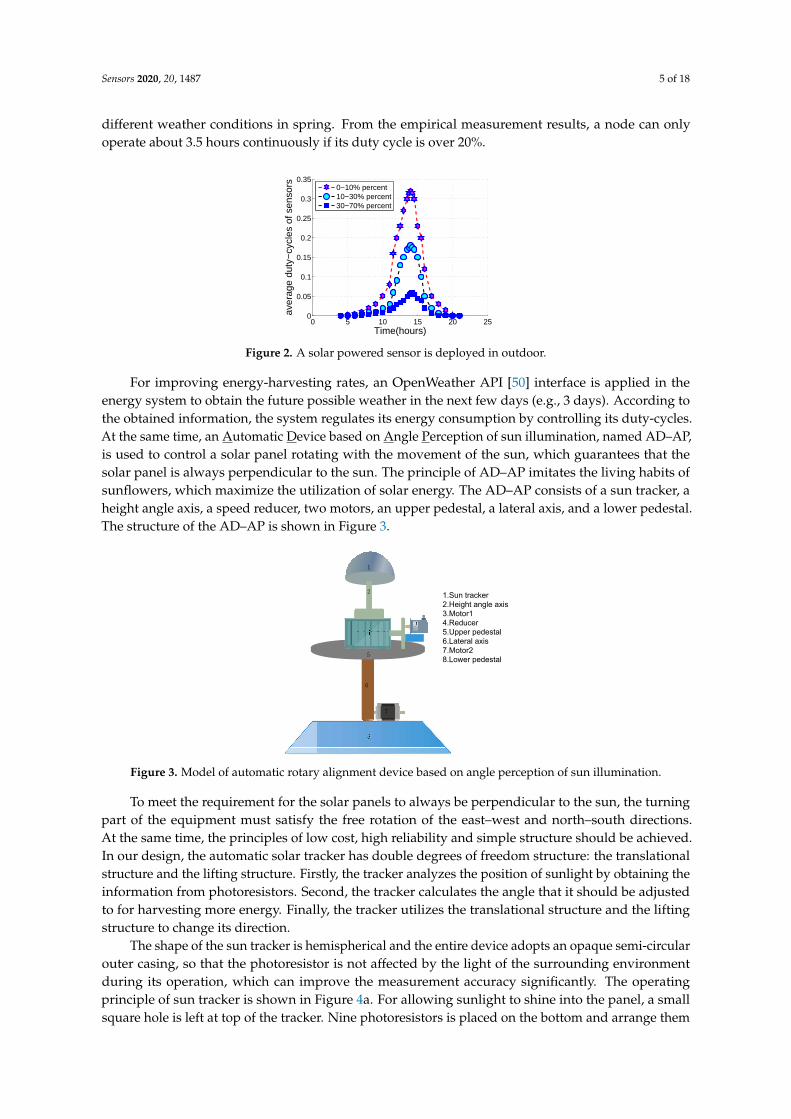
To meet the requirement for the solar panels to always be perpendicular to the sun, the turningpart of the equipment must satisfy the free rotation of the east–west and north–south directions.At the same time, the principles of low cost, high reliability and simple structure should be achieved.In our design, the automatic solar tracker has double degrees of freedom structure: the translationalstructure and the lifting structure. Firstly, the tracker analyzes the position of sunlight by obtaining theinformation from photoresistors. Second, the tracker calculates the angle that it should be adjustedto for harvesting more energy. Finally, the tracker utilizes the translational structure and the liftingstructure to change its direction.
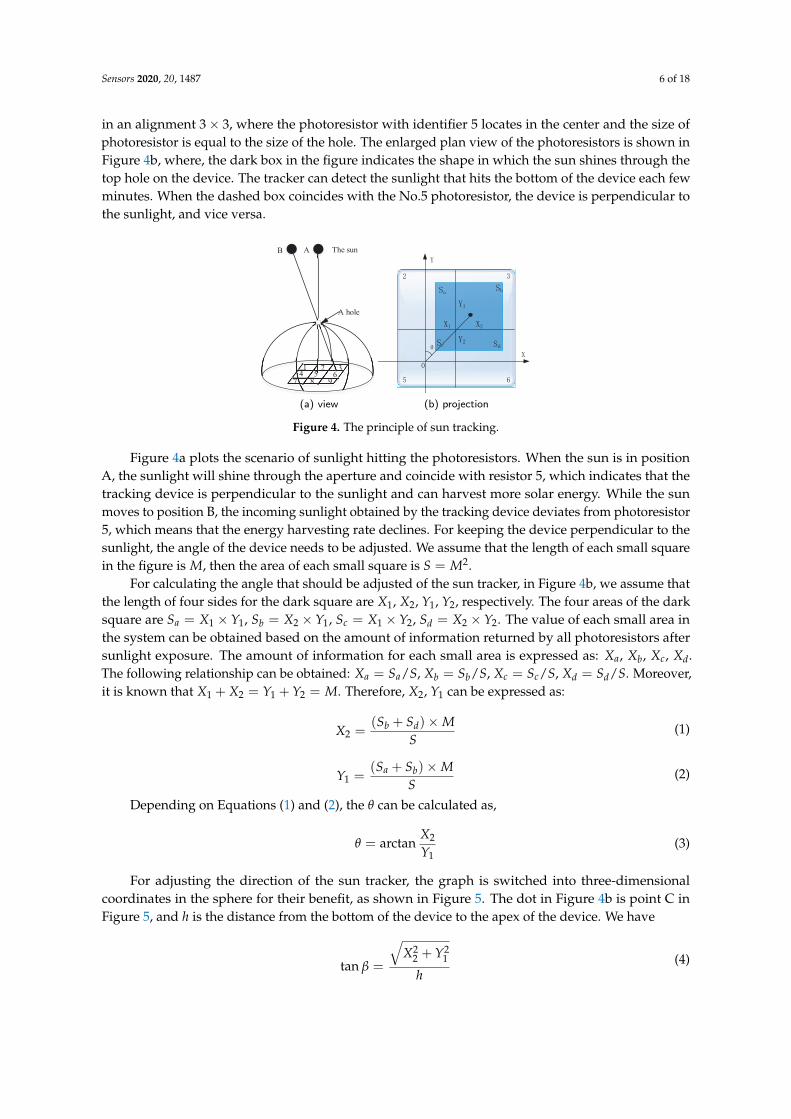
The shape of the sun tracker is hemispherical and the entire device adopts an opaque semi-circularouter casing, so that the photoresistor is not affected by the light of the surrounding environmentduring its operation, which can improve the measurement accuracy significantly. The operatingprinciple of sun tracker is shown in Figure 4a. For allowing sunlight to shine into the panel, a smallsquare hole is left at top of the tracker. Nine photoresistors is placed on the bottom and arrange them
Sensors 2020, 20, 1487 6 of 18
in an alignment 3 × 3, where the photoresistor with identifier 5 locates in the center and the size ofphotoresistor is equal to the size of the hole. The enlarged plan view of the photoresistors is shown inFigure 4b, where, the dark box in the figure indicates the shape in which the sun shines through thetop hole on the device. The tracker can detect the sunlight that hits the bottom of the device each fewminutes. When the dashed box coincides with the No.5 photoresistor, the device is perpendicular tothe sunlight, and vice versa.
The sunB A
51
4
7
2 36
8 9
A hole
(a) view (b) projection
Figure 4. The principle of sun tracking.
Figure 4a plots the scenario of sunlight hitting the photoresistors. When the sun is in positionA, the sunlight will shine through the aperture and coincide with resistor 5, which indicates that thetracking device is perpendicular to the sunlight and can harvest more solar energy. While the sunmoves to position B, the incoming sunlight obtained by the tracking device deviates from photoresistor5, which means that the energy harvesting rate declines. For keeping the device perpendicular to thesunlight, the angle of the device needs to be adjusted. We assume that the length of each small squarein the figure is M, then the area of each small square is S = M2.
For calculating the angle that should be adjusted of the sun tracker, in Figure 4b, we assume thatthe length of four sides for the dark square are X1, X2, Y1, Y2, respectively. The four areas of the darksquare are Sa = X1 × Y1, Sb = X2 × Y1, Sc = X1 × Y2, Sd = X2 × Y2. The value of each small area inthe system can be obtained based on the amount of information returned by all photoresistors aftersunlight exposure. The amount of information for each small area is expressed as: Xa, Xb, Xc, Xd.The following relationship can be obtained: Xa = Sa/S, Xb = Sb/S, Xc = Sc/S, Xd = Sd/S. Moreover,it is known that X1 + X2 = Y1 + Y2 = M. Therefore, X2, Y1 can be expressed as:
X2 =(Sb + Sd)× M
S(1)
Y1 =(Sa + Sb)× M
S(2)
Depending on Equations (1) and (2), the θ can be calculated as,
θ = arctanX2
Y1(3)
For adjusting the direction of the sun tracker, the graph is switched into three-dimensionalcoordinates in the sphere for their benefit, as shown in Figure 5. The dot in Figure 4b is point C inFigure 5, and h is the distance from the bottom of the device to the apex of the device. We have
tan β =
√X2
2 + Y21
h(4)

Sensors 2020, 20, 1487 7 of 18
where, β can be formulated as:
β = arctan
√( (Sb+Sd)×M
S )2 + ( (Sa+Sb)×MS )2
h(5)
Z
Y
X
H
β
C
Figure 5. A three-dimensional coordinate when the device is not perpendicular to the sunlight.
For keeping the AD–AP perpendicular to the sunlight, the device can first move θ angle in theX-axis, and then move β angle in the opposite direction of the Z-axis to ensure that the device isperpendicular to the sunlight again. In order to save energy, the direction of the tracker should beadjusted back to the initial state at night and then remain unchanged. On cloudy days, the trackerdoes not need to rotate for saving energy. After the tracker adjusts its position, a reasonable period oftime is set to initiate another adjustment, e.g., ten minutes or one hour, etc. In some special situations,if the tracker can not adjust to a normal position in the period of time, it can be considered that theremaining energy of AD–AP can not support its action, e.g., the weather is cloudy or rainy. In thissituation, the tracker should try to adjust the position after another period of time until the sun trackeris perpendicular to the sunlight again.
3.3. Communication Systems of the Agricultural IoT Platform
In the design, the communication system contains two parts: LoRa technology and TVWStechnology. LoRa technology is a point-to-point communication mode with low power consumption,low data transmission rate and long transmission range, where, the transmission distance can reach15 km in the unobstructed situation, while the transmission range is only about 100 meters for ZigBeedevices (e.g., MICAz, TelosB) [51]. As a gateway, a LoRa device can connect a certain number ofwireless sensor nodes for data collection, which replaces the traditional General Packet Radio Service(GPRS) module (monthly fee, e.g., about 2 dollars every month in China). Therefore, in the long run,LoRa technology can effectively reduce communication costs by replacing GPRS as the gateway.
When LoRa devices are used as relay nodes in a multi-hop LoRa mode, data can reach hundredsof kilometers through multiple-hop forwarding at low rates without the help of satellites or basestations, which is sufficient for data transmission in modern agricultural fields. In some countries,LoRa technology has been employed in some agricultural cooperations, e.g., intelligent irrigationsystems [52]. LoRa technology is utilized for collecting information by connecting the sensors deployedin the farm, and transmitting the collected data to the base station/gateway. In the system, multipleLoRa devices are deployed in the farm, as is shown in Figure 6. A base station or gateway generallyis equipped with high energy power and transmission ability. Thence, all packets will be forwardedto farmer’s home by multiple gateways. For processing received data, the cloud data center is builtand stores all collection data. However, the cloud data center is usually far away from the farmer’shome, and there are many obstacles between them to hinder the transmission of information. It is

Sensors 2020, 20, 1487 8 of 18
dificult to accomplish the task of data transmission relying using traditional methods (e.g., ZigBee,LoRa, Bluetooth).
Figure 6. Multiple LoRa devices are deployed in farmland.
The White Space is a blank TV signal band, which refers to a radio video segment that is allocatedfor broadcast utilization but is out of use. It has the advantages of large user volume and low cost.TVWS has also been applied internationally. For example, the United States is actively deployingfarm super Wi-Fi by virtue of TVWS technology [53]. Due to its low frequency and support forhigh-bandwidth data transmission, TVWS technology fully meets the requirement of high-bandwidthconnections between UAVs and gateways. In China, due to the popularity of digital TV, traditionalwireless TV has gradually faded out of sight, which makes the TVWS band free, and can fully utilizethis band for high-bandwidth data transmission.
In the communication system, on the one hand, the compatibility of distinct communicationtechnologies (e.g., ZigBee, LoRa, TVWS) should be guaranteed. On the other hand, the requirement oflong-distance communication and the high-bandwidth connection should be achieved simultaneously.Therefore, a hybrid network based on two-layers for data transmission is adopted in the work. At thefirst layer, TVWS is used to connect the system of farmers’ homes with IoT base stations on the farm.In the second layer, the LoRa module with long transmission distance and strong anti-interferenceability is used to achieve information collection between the base station and sensors deployed infarmland, which ensures that a minimum of sensor nodes can check the maximum farm area. Datacommunication architecture is shown in Figure 7. Currently, a wired network or wireless network iswidely deployed in farmers’ houses of China. Hence, the existing Wi-Fi infrastructure can be exploited,and these existing Wi-Fi devices can be employed to undertake the tasks for data forwarding from thefarmer to the cloud data center.
Figure 7. A two-layers data communication architecture from sensors to farmer.
3.4. The Path Planning of Unmanned Aerial Vehicle
In the design, the UAVs are used to detect the pests and diseases on the farms by periodicallycapturing the images of crops with a spectral camera. Afterwards, these images will be transmittedto the cloud data center and stored for data analysis. With the aid of image processing technology,these images can be analyzed to determine whether there are pests and diseases or not. Currently,a UAV usually is equipped with a smaller fuel tank, which causes the flight time to be short, so that theflight time of a UAV is generally about 30 min in China. For improving energy utilization efficiency,

Sensors 2020, 20, 1487 9 of 18
the flight path of the drone is planned previously. When UAVs take photographs on farms, they flyfrom the initial point to the target point automatically depending on the planned paths. Therefore, it iscrucial to plan the flying routes for prolonging the flight time. At the same time, the planning pathsare restricted by height, the field of view of the camera, and the required image quality, etc.
Multiple flight paths can be designed to check the entire farmland, where one of them is preferredand other paths are set as potential flying paths. Intuitively, for a UAV, the shortest path is the bestchoice to achieve the longest flight time. However, considering weather conditions, especially factorssuch as wind speed and wind direction, the planning path with the highest proportion of downwindcan ensure the maximum utilization of wind force. At the same time, during the flight, the speed ofthe drone can be adjusted dynamically to save energy and extend the flight time of a UAV. When adrone flies on the farm, without considering the wind force, if the flight speed of the drone is Vw andthe flight distance is S, the flight time can be calculated as:
t =S
vw(6)
The farmlands usually cover large areas and are open, where wind force exists commonly. Whena drone flies in such a scenario and the wind force has not been utilized efficiently, it may causeunnecessary energy waste and reduce the flight time. Therefore, considering the wind force on thefarm, a flight mode is designed to save energy and prolong the fight time of UAVs. When there isan angle between the wind direction on the farm and the planning path of the drone, as shown inFigure 8, if the flight time of the drone is required to be held in this planning path, or in other words, ifthe original energy expenditure rate is required to remain constant, the flight speed and flight directionof the drone should be adjusted dynamically.
Figure 8. When consider the wind speed and wind direction, how to control the flight speed anddirection of UAV.
The drone is equipped with special sensors for acquiring the wind direction and wind speed.Thus, the Vf is available depending on the surface sensor in the drone. The symbols that used inFigure 8 are summarized as in Table 1.
Table 1. Symbol List of Figure 8.
Symbol Description
Vf the wind speed on the farmVh the actual flight speed, which combination of
the speed of drone and the windVs the planing flight speed of the droneθ the angle between Vf and Vhβ the angle between Vs and Vh
According to Equation (6), the equality Vh = Vw is achieved. For calculating the Vs and β, we findthat Vs = Vs1, Vf = Vf 1. Therefore, Vs1 can be formulated as:
Vs1 =√
V2f + V2
h − 2 × Vf × Vh × cos θ (7)
Sensors 2020, 20, 1487 10 of 18
According to Equation (7), the β angle is expressed as:
β = arccosV2
h + V2s − V2
f
2 × Vf × Vh(8)
According to Equations (7) and (8), the direction and the speed of the drone in actual flight areknown. If the energy consumption is expected to be reduced by the drone, the speed of the droneshould satisfy Vs < Vw. Since Vw = Vh, we can find that inequality Vs < Vh holds. According toEquations (7) and (8), in order to save energy of a drone, the following constraints need to be satisfied:
Vf < 2 × Vh × cos θ (9)
Although the wind speed and wind direction on a farm can not be controlled artificially, the anglebetween the wind and the flight path can be controlled. At the same time, the flight speed of drone can beadjusted dynamically according to the wind speed. Therefore, it is necessary to design the flight pathof the drone in combination with the actual conditions. It is interesting to note that it is a challenge forthe stability of a drone in some special scenarios with strong wind. However, note that we would onlyrequire long flight times when the pests and diseases occur in farms and we only use the UAV to collectthe information of crops. Hence, a sunny day can be selected to arrange the flight or in a day with slightwind, which is different than if the UAV is used in military fields with time-tight requirements.
4. Analysis
4.1. Energy Harvesting Analysis
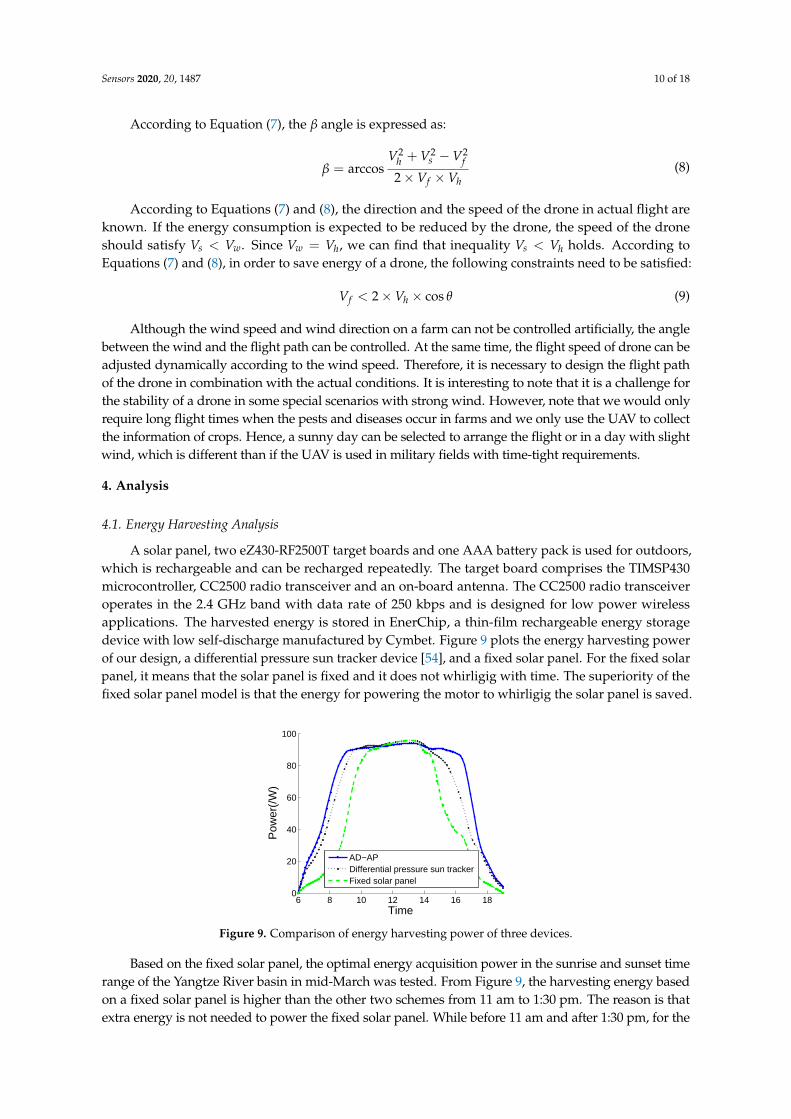
A solar panel, two eZ430-RF2500T target boards and one AAA battery pack is used for outdoors,which is rechargeable and can be recharged repeatedly. The target board comprises the TIMSP430microcontroller, CC2500 radio transceiver and an on-board antenna. The CC2500 radio transceiveroperates in the 2.4 GHz band with data rate of 250 kbps and is designed for low power wirelessapplications. The harvested energy is stored in EnerChip, a thin-film rechargeable energy storagedevice with low self-discharge manufactured by Cymbet. Figure 9 plots the energy harvesting powerof our design, a differential pressure sun tracker device [54], and a fixed solar panel. For the fixed solarpanel, it means that the solar panel is fixed and it does not whirligig with time. The superiority of thefixed solar panel model is that the energy for powering the motor to whirligig the solar panel is saved.
6 8 10 12 14 16 180
20
40
60
80
100
Time
Pow
er(/
W)
AD−APDifferential pressure sun trackerFixed solar panel
Figure 9. Comparison of energy harvesting power of three devices.
Based on the fixed solar panel, the optimal energy acquisition power in the sunrise and sunset timerange of the Yangtze River basin in mid-March was tested. From Figure 9, the harvesting energy basedon a fixed solar panel is higher than the other two schemes from 11 am to 1:30 pm. The reason is thatextra energy is not needed to power the fixed solar panel. While before 11 am and after 1:30 pm, for the
Sensors 2020, 20, 1487 11 of 18
fixed solar panel, the harvesting energy is lower than AD–AP and the model of [54]. According to theinvestigation, the differential pressure solar tracker [54] can use the pressure difference of the medium inthe container to slowly adjust the device back to a state perpendicular to the sunlight. This tracker has asimple structure, but it is limited to a single-axis tracker with low precision. From Figure 9, the incidentangle between the sunlight and the fixed solar panel is close to 0 and the energy acquisition power is at amaximum from 11:00 to 14:30. The installation of an automatic rotary alignment device proposed in oursystem enables the energy harvesting power to reach its peak value at around 9 o’clock in advance, andcan increase the energy acquisition power by about 38% in one day.
4.2. Generating Accurate Maps for Farms
For detecting the emergence of pests and diseases in agriculture precisely, it is necessary toanalyze the data of the accurate farm maps taken by a drone, which means that the entire farm has aspecific distribution of characteristics based on image analysis. The agricultural IoT platform supportsa novel and accurate map generation method that utilizes the aerial imagery of drones and the datareturned by sensors placed on the farm. Specifically, the system uses the images generated by thedrone video and the values observed by the sensors planted in the soil to predict the possibility ofoccurrence of diseases and pests. The system’s gateway embeds a machine learning pipeline thatdraws on probabilistic graphical models that embed Gaussian processes [55].
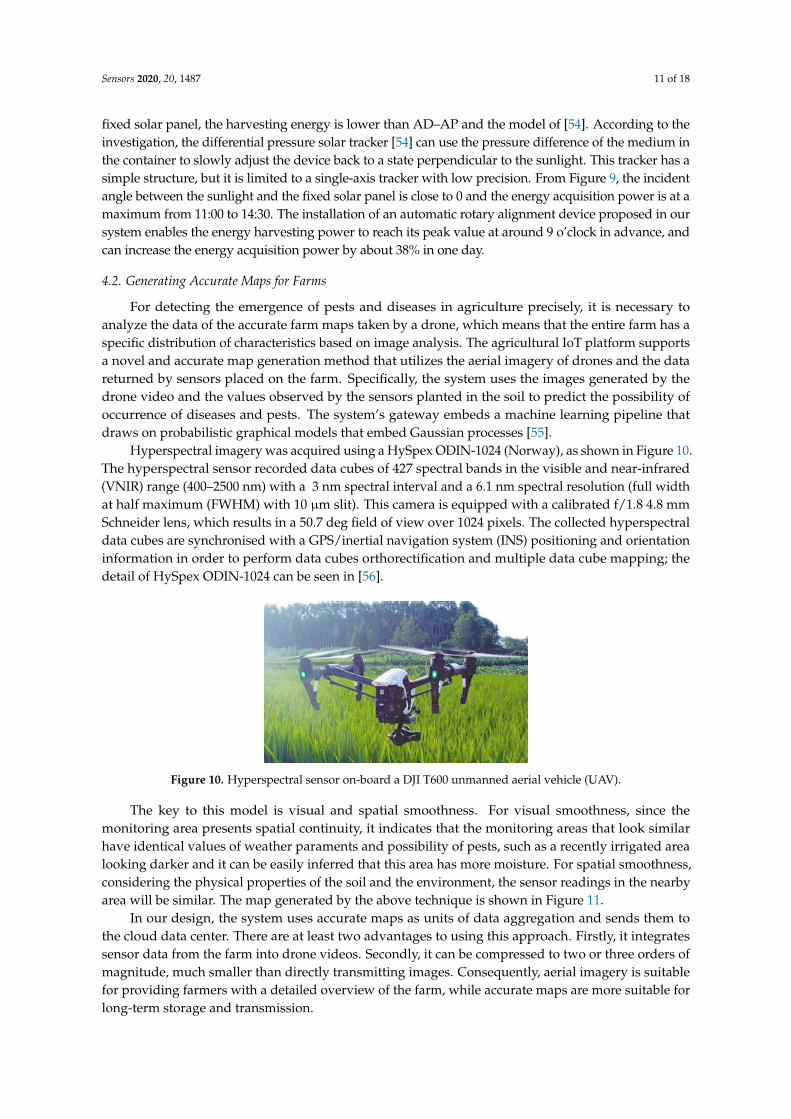
Hyperspectral imagery was acquired using a HySpex ODIN-1024 (Norway), as shown in Figure 10.The hyperspectral sensor recorded data cubes of 427 spectral bands in the visible and near-infrared(VNIR) range (400–2500 nm) with a 3 nm spectral interval and a 6.1 nm spectral resolution (full widthat half maximum (FWHM) with 10 µm slit). This camera is equipped with a calibrated f/1.8 4.8 mmSchneider lens, which results in a 50.7 deg field of view over 1024 pixels. The collected hyperspectraldata cubes are synchronised with a GPS/inertial navigation system (INS) positioning and orientationinformation in order to perform data cubes orthorectification and multiple data cube mapping; thedetail of HySpex ODIN-1024 can be seen in [56].
Figure 10. Hyperspectral sensor on-board a DJI T600 unmanned aerial vehicle (UAV).
The key to this model is visual and spatial smoothness. For visual smoothness, since themonitoring area presents spatial continuity, it indicates that the monitoring areas that look similarhave identical values of weather paraments and possibility of pests, such as a recently irrigated arealooking darker and it can be easily inferred that this area has more moisture. For spatial smoothness,considering the physical properties of the soil and the environment, the sensor readings in the nearbyarea will be similar. The map generated by the above technique is shown in Figure 11.
In our design, the system uses accurate maps as units of data aggregation and sends them tothe cloud data center. There are at least two advantages to using this approach. Firstly, it integratessensor data from the farm into drone videos. Secondly, it can be compressed to two or three orders ofmagnitude, much smaller than directly transmitting images. Consequently, aerial imagery is suitablefor providing farmers with a detailed overview of the farm, while accurate maps are more suitable forlong-term storage and transmission.
Sensors 2020, 20, 1487 12 of 18
Figure 11. The analysis results of pests for a UAV image.
4.3. Pests and dIseases of Crops Are Analyzed Through Reflection Spectrum
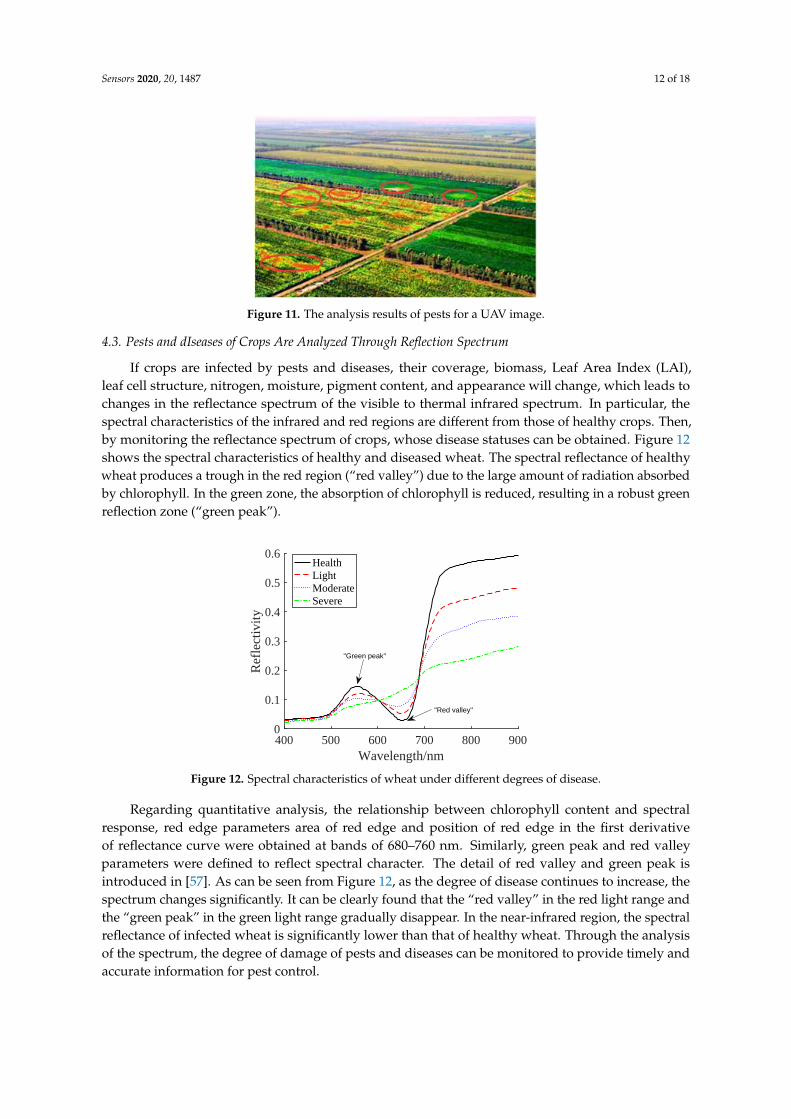
If crops are infected by pests and diseases, their coverage, biomass, Leaf Area Index (LAI),leaf cell structure, nitrogen, moisture, pigment content, and appearance will change, which leads tochanges in the reflectance spectrum of the visible to thermal infrared spectrum. In particular, thespectral characteristics of the infrared and red regions are different from those of healthy crops. Then,by monitoring the reflectance spectrum of crops, whose disease statuses can be obtained. Figure 12shows the spectral characteristics of healthy and diseased wheat. The spectral reflectance of healthywheat produces a trough in the red region (“red valley”) due to the large amount of radiation absorbedby chlorophyll. In the green zone, the absorption of chlorophyll is reduced, resulting in a robust greenreflection zone (“green peak”).
400 500 600 700 800 900Wavelength/nm
0
0.1
0.2
0.3
0.4
0.5
0.6
Ref
lect
ivity
HealthLightModerateSevere
"Green peak"
"Red valley"
Figure 12. Spectral characteristics of wheat under different degrees of disease.
Regarding quantitative analysis, the relationship between chlorophyll content and spectralresponse, red edge parameters area of red edge and position of red edge in the first derivativeof reflectance curve were obtained at bands of 680–760 nm. Similarly, green peak and red valleyparameters were defined to reflect spectral character. The detail of red valley and green peak isintroduced in [57]. As can be seen from Figure 12, as the degree of disease continues to increase, thespectrum changes significantly. It can be clearly found that the “red valley” in the red light range andthe “green peak” in the green light range gradually disappear. In the near-infrared region, the spectralreflectance of infected wheat is significantly lower than that of healthy wheat. Through the analysisof the spectrum, the degree of damage of pests and diseases can be monitored to provide timely andaccurate information for pest control.
Sensors 2020, 20, 1487 13 of 18
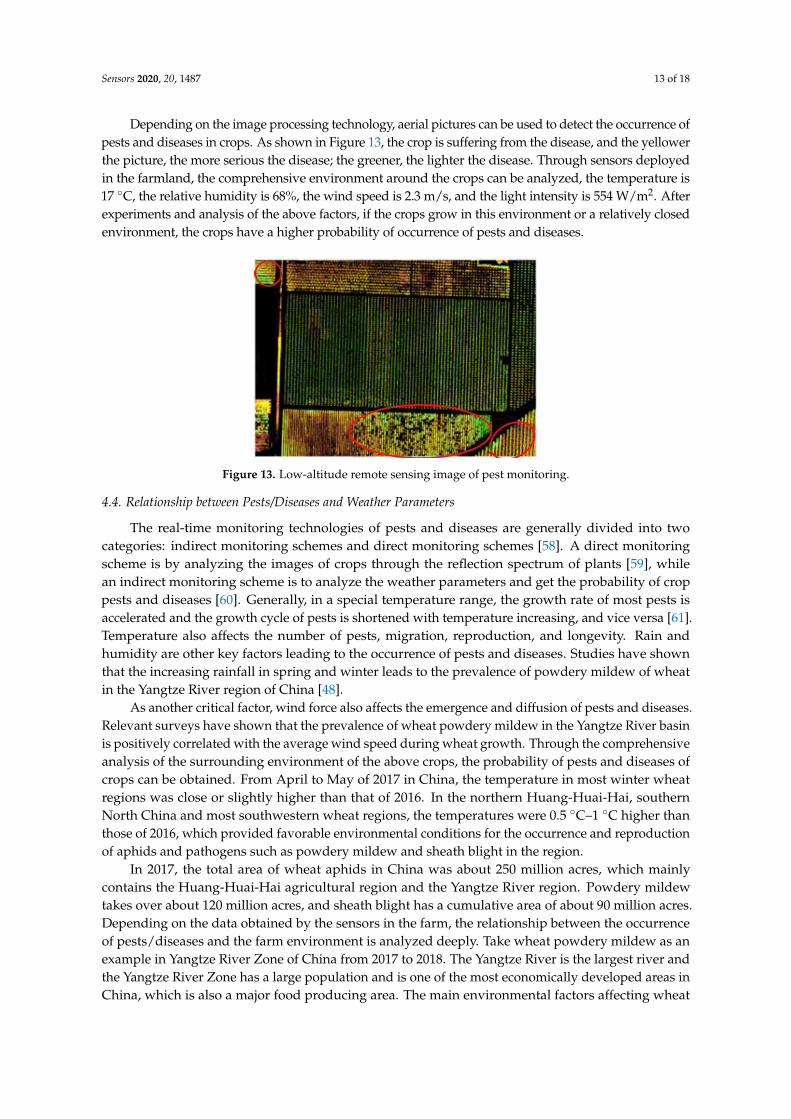
Depending on the image processing technology, aerial pictures can be used to detect the occurrence ofpests and diseases in crops. As shown in Figure 13, the crop is suffering from the disease, and the yellowerthe picture, the more serious the disease; the greener, the lighter the disease. Through sensors deployedin the farmland, the comprehensive environment around the crops can be analyzed, the temperature is17 ◦C, the relative humidity is 68%, the wind speed is 2.3 m/s, and the light intensity is 554 W/m2. Afterexperiments and analysis of the above factors, if the crops grow in this environment or a relatively closedenvironment, the crops have a higher probability of occurrence of pests and diseases.
Figure 13. Low-altitude remote sensing image of pest monitoring.
4.4. Relationship between Pests/Diseases and Weather Parameters
The real-time monitoring technologies of pests and diseases are generally divided into twocategories: indirect monitoring schemes and direct monitoring schemes [58]. A direct monitoringscheme is by analyzing the images of crops through the reflection spectrum of plants [59], whilean indirect monitoring scheme is to analyze the weather parameters and get the probability of croppests and diseases [60]. Generally, in a special temperature range, the growth rate of most pests isaccelerated and the growth cycle of pests is shortened with temperature increasing, and vice versa [61].Temperature also affects the number of pests, migration, reproduction, and longevity. Rain andhumidity are other key factors leading to the occurrence of pests and diseases. Studies have shownthat the increasing rainfall in spring and winter leads to the prevalence of powdery mildew of wheatin the Yangtze River region of China [48].
As another critical factor, wind force also affects the emergence and diffusion of pests and diseases.Relevant surveys have shown that the prevalence of wheat powdery mildew in the Yangtze River basinis positively correlated with the average wind speed during wheat growth. Through the comprehensiveanalysis of the surrounding environment of the above crops, the probability of pests and diseases ofcrops can be obtained. From April to May of 2017 in China, the temperature in most winter wheatregions was close or slightly higher than that of 2016. In the northern Huang-Huai-Hai, southernNorth China and most southwestern wheat regions, the temperatures were 0.5 ◦C–1 ◦C higher thanthose of 2016, which provided favorable environmental conditions for the occurrence and reproductionof aphids and pathogens such as powdery mildew and sheath blight in the region.
In 2017, the total area of wheat aphids in China was about 250 million acres, which mainlycontains the Huang-Huai-Hai agricultural region and the Yangtze River region. Powdery mildewtakes over about 120 million acres, and sheath blight has a cumulative area of about 90 million acres.Depending on the data obtained by the sensors in the farm, the relationship between the occurrenceof pests/diseases and the farm environment is analyzed deeply. Take wheat powdery mildew as anexample in Yangtze River Zone of China from 2017 to 2018. The Yangtze River is the largest river andthe Yangtze River Zone has a large population and is one of the most economically developed areas inChina, which is also a major food producing area. The main environmental factors affecting wheat

Sensors 2020, 20, 1487 14 of 18
powdery mildew were analyzed during the critical period of wheat growth from sowing to maturity.The results are shown in Figures 14 and 15.
2 4 6 8 10 120
2000
4000
6000
8000
10000
Rai
nfal
l(0.1
mm
)
months
2 4 6 8 10 120
10
20
30
40
50
The
rat
e of
des
ease
s
The rainfall of 2017Therainfall of 2018The rate of deseases in 2017The rate of deseases in 2018
Figure 14. The rainfall and wheat incidence in Yangtze River Zone of China from 2017 to 2018
During early spring (April to May), the temperature ranges from 15 ◦C to 20 ◦C and is favorable forgrowing crops. At the same time, the temperature is beneficial to the occurrence of pests and diseases.From Figure 15, the risk of pests increased with temperature and rainfall increasing significantly, and viceversa. In summary, when the temperature is low and precipitation is high, the weather condition is notconducive to wheat growth. The wheat will grow slower and is easily invaded by pests and diseases.
2 4 6 8 10 120
50
100
150
200
250
300
350
400
450
500
Tem
pera
ture
(0.1
°C)
months
2 4 6 8 10 120
5
10
15
20
25
30
35
40
45
50
The
rat
e of
des
ease
s
The temperature of 2017The temperature of 2018The rate of deseases in 2017The rate of deseases in 2018
Figure 15. The temperature and wheat incidence in Yangtze River Zone of China from 2017 to 2018.
If the humidity is considered for the occurrence of diseases, the spores of pathogens can germinatein the humidity ranging from 0% to 100%. Higher humidity is more favorable for the spread of bacteria.When the relative humidity reaches 65% or more, it may cause a massive outbreak of wheat powderymildew, as shown in Figure 16. If the rainfall is large and concentrated, it can destroy the pathogensthat are parasitic on wheat.
For measuring the disease damaging degree to crops, a degree of growth condition of the crops isapplied in this work, where level 0 indicates crop health, level 1 indicates that the symptoms of thedisease are not obvious, and level 2 indicates obvious symptoms on leaves or straw, but the area of thedisease does not exceed 50%. Level 3 indicates apparent symptoms on the leaves or straw, and the areaof the disease is more than 50%. Level 4 indicates that the whole plant is damaged and level 5 indicatesthat the rot occurs. We note that this measurement is widely used in agriculture fields for judgingthe growth condition of crops and the detail of it is shown in [62]. Precipitation and temperatureare related to the occurrence and prevalence of wheat powdery mildew. Wheat is susceptible to thisdisease when the temperature is between 14 ◦C and 16 ◦C. In this temperature range, the germination

Sensors 2020, 20, 1487 15 of 18
rate of conidia is the highest and the mycelial growth rate is also the fastest. Temperature affectsthe rate of propagation of fungal spores, and rainfall affects the spread of wheat powdery mildew,as shown in Figure 17.
2 4 6 8 10 120
10
20
30
40
50
60
70
80
90
100
Rel
ativ
e hu
mid
ity(%
)
months
2 4 6 8 10 120
5
10
15
20
25
30
35
40
45
50
The
rat
e of
des
ease
s
The relative humidity of 2017The relative humidity of 2018The rate of deseases in 2017The rate of deseases in 2018
Figure 16. The relative humidity and wheat incidence in Yangtze River Zone of China from 2017 to 2018.
14.8 15 15.2 15.4 15.6 15.81
1.5
2
2.5
3
3.5
4
4.5
5
Temperature(/oC)
Deg
ree
of d
isea
se
(a) temperature
10 20 30 40 501
1.5
2
2.5
3
3.5
4
4.5
5
Rainfall(mm)
Deg
ree
of d
isea
se
(b) rainfall
Figure 17. Effect of spring temperature and rainfall on the occurrence of disease
5. Conclusions And Future Planning
In this work, for providing energy to our IoT framework in remote farms, an automaticrotary-device based on angle perception of sun illumination is added for improving the utilization ofsolar energy, prolonging the use time of the sensor, and ensuring that the data collected by the sensorare valid in real time. The main contributions for the aspect of drones in this article are: (i) planing theflight route of the drone, (ii) adjusting the flight speed of the drone, (iii) making full use of the farmwind force, and (iv) extending the flight time of the drone to meet the low-altitude remote sensingdemand for pests and diseases on large outdoor farms. It represents the macro and micro perspectivesof modern agricultural techniques of low-altitude remote-sensing technology and IoT technology formonitoring pests and diseases of crops.
Through the analysis of large amounts of data obtained by drones and sensors, we provide an insightinto the specific relationship between the occurrence of pests and the farm environment. The preventionand control of agricultural pests and diseases is a systematic project and a significant challenge for farmersand researchers; it requires long-term observation and analysis using information technology. Throughmore extended data accumulation and analysis of large amounts of data, a long-term pest and diseaseprediction model will be established. Based on agriculture, the model proposed in this work will be verifiedin practical applications. Note that, on the one hand, the pests and diseases of crops can be monitored inreal time based on the framework. On the other hand, the occurrence of pests and diseases can be studiesby analyzing climate changes, and some precautions against pests can be implemented in advance.
Sensors 2020, 20, 1487 16 of 18
Author Contributions: D.G. conceived the study, designed the study and wrote the initial draft of the paper; Q.S.was responsible for reviewing and editing; B.H. collected the data and performed investigations; S.Z. conductedsoftware testing and analysed the data; all authors contributed to the writing and revisions. All authors have readand agreed to the published version of the manuscript.
Funding: This research was supported by grants from the National Key R&D Program of China (No.2016YFD0300607), the Project funded by China Postdoctoral Science Foundation (Grant No. 2018T110505,2017M611828) and The Priority Academic Program Development(PAPD) of Jiangsu Higher Education Institutions.
Conflicts of Interest: The authors declare no conflict of interest.
References
1. United Nations General Assembly. Food Production Must Double by 2050 to Meet Demand from WorldsGrowing Population, Innovative Strategies Needed to Combat Hunger, Experts Tell Second Committee.Available online: http://www.un.org/press/en/2009/gaef3242.doc.htm (accessed on 9 October2009).
2. Dayan M P. Survey, identification and pathogenicity of pests and diseases of bamboo in the Philippines.Sylvatrop 1988, 13, 61–77.
3. Guru-Pirasanna-Pandi, G.; Adak, T.; Gowda, B.; Patil, N.; Annamalai, M.; Jena, M. Toxicological effect ofunderutilized plant, Cleistanthus collinus leaf extracts against two major stored grain pests, the rice weevil,Sitophilus oryzae and red flour beetle, Tribolium castaneum. Ecotoxicol. Environ. Safe. 2018, 154, 92–99.[CrossRef]
4. CCTV News, [EB/OL], Pests and Diseases Cause 40 Million Tons of Grain Loss Each Year in China.Available online: http://news.cctv.com/2017/02/11/ARTIPy3JBOkTuecw4r9lP7JF170211.shtml (accessedon 2 November 2017).
5. Zheng, Q.; Huang, W.; Cui, X.; Shi, Y.; Liu, L. New Spectral Index for Detecting Wheat Yellow Rust UsingSentinel-2 Multispectral Imagery. Sensors 2018, 18, 868. [CrossRef]
6. Li, X.; Pak, C.; Bi, K. Analysis of the development trends and innovation characteristics of Internet of Thingstechnology-based on patentometrics and bibliometrics. Technol. Anal. Strateg. Manag. 2020, 32, 104–118.[CrossRef]
7. Pan, X.; Wang, J.; Zhang, X.; Mei, Y.; Shi, L.; Zhong, G. A deep-learning model for the amplitude inversion ofinternal waves based on optical remote-sensing images. Int. J. Remote Sens. 2018, 39, 607–618. [CrossRef]
8. Wang, B.; Li, N.; Li, W.; Hao, J. Application of 3S Technology to Land Consolidation in Chernozem Region ofChina. Comput. Comput. Technol. Agric. II 2009, 1, 145–153.
9. Huang, Y.; Reddy, K.N.; Fletcher, R.S.; Pennington, D. UAV Low-Altitude Remote Sensing for PrecisionWeed Management. Weed Technol. 2018, 32, 1–5. [CrossRef]
10. Wu, Y.; Chen, J.; Yao, S.; Xu, B. Application of UAV low-altitude remote sensing. Remote Sens. Land Resour.2017, 29, 120–125.
11. Bansod, B.; Singh, R.; Thakur, R.; Singhal, G. A comparision between satellite based and drone based remotesensing technology to achieve sustainable development: A review. J. Agric. Environ. Int. Dev. 2017, 111,383–407.
12. Wei, Z.; Han, Y.; Li, M.; Yang, K.; Yang, Y.; Luo, Y.; Ong, S.H. A small UAV based multi-temporal imageregistration for dynamic agricultural terrace monitoring. Int. J. Remote Sens. 2017, 9, 904. [CrossRef]
13. Collier, R.H. Pest and Disease Prediction Models. Encycl. Appl. Plant Sci. 2017, 31, 120–123.14. Yan, X.; Cao, J.; Sun, L.; Zhou, J.; Wang, S.; Song. A. Accurate analytical-based multi-hop localization with
low energy consumption for irregular networks. IEEE Trans. Veh. Technol. 2019, 69, 2021–2033. [CrossRef]15. Elijah, O.; Rahman, T.A.; Orikumhi, I.; Leow, C.Y.; Hindia, M.N. An overview of Internet of Things (IoT) and
data analytics in agriculture: Benefits and challenges. IEEE Internet Things J. 2018, 5, 3758–3773. [CrossRef]16. Piano, S.L.; Mayumi, K. Toward an integrated assessment of the performance of photovoltaic power stations
for electricity generation. Appl. Energy 2017, 186, 167–174. [CrossRef]17. Chung, W.Y.; Luo, R.H.; Chen, C.L.; Heythem, S.; Chang, C.F.; Po, C.C.; Li, Y.C. Solar powered monitoring
system development for smart farming and Internet of Thing applications, Meeting Abstracts. Electrochem.Soc. 2019, 28, 1371–1371. [CrossRef]
18. Liu, H.; Xu, X.; Meng, Y.; Yu, D.; Shi, K . A Research for the Influence of Tilt Angles of the Solar Panel onPhotovoltaic Power Generation. In Proceddings of the 2018 International Conference on Smart Grid andClean Energy Technologies (ICSGCE), Kajang, Malaysia, 6 December 2018; pp. 95–100.

Sensors 2020, 20, 1487 17 of 18
19. Donatelli, M.; Magarey, R.D.; Bregaglio, S.; Willocquet, L.; Whish, J.P.; Savary, S. Modelling the impacts ofpests and diseases on agricultural systems. Agric. Syst. 2017, 155, 213–224. [CrossRef]
20. Donatelli, M.; Magarey, R.D.; Bregaglio, S.; Willocquet, L.; Whish, J.P.; Savary, S. An early warning system ofdiseases and pests for blueberry based on WSN. In Proceddings of the 2017 36th Chinese Control Conference(CCC), Liaoning, China, 26–28 July 2017.
21. Yan, X.; Sun, L.; Sun, Z.; Zhou, J.; Song, A. Improved hop-based localisation algorithm for irregular networks.IET Commun. 2018, 13, 520–527. [CrossRef]
22. Meissner, H.E.; Fritz, J.M.; Kohl, L.M.; Moylett, H.C.; Moan, M.J.; Emerine, S.E.; Kaye, A.C. PestLens: Anearly-warning system supporting US safeguarding against exotic plant pests. EPPO Bull. 2015, 45, 304–310.[CrossRef]
23. Brust, G.E.; Gotoh, T. Mites: Biology, Ecology, and Management. In Sustainable Management of Arthropod Pestsof Tomato; Academic Press: Cambridge, MA, USA, 2018; Volume 12, pp. 111–130.
24. Vallad, G.E.; Messelink, G.J.; Smith, H.A. Crop Protection: Pest and Disease Management Tomatoes; CABI:Wallingford, UK, 2018; Volume 13, pp. 207–257.
25. Swiergiel, W.; Manduric, S.; Ramert, B.; Porcel, M.; Tasin, M. Development of sustainable plant protectionprograms through multi-actor Co-innovation: An 8-year case study in Swedish apple production.J. Clean. Prod. 2019, 234, 1178–1191. [CrossRef]
26. Yan, X.; Sun, L.; Zhou, J.; Song, A. DV-hop localisation algorithm based on optimal weighted least square inirregular areas. Electron. Lett. 2018, 54, 1243–1245. [CrossRef]
27. Wang, S.; Kim, S.M.; Kong, L.; He, T. Concurrent transmission aware routing in wireless networks.IEEE Trans. Commun. 2018, 66, 6275–6286.
28. Gao, D.; Zhang, S.; Zhang, F.; Fan, X.; Zhang, J. Maximum Data Generation Rate Routing Protocol Based onData Flow Controlling Technology for Rechargeable Wireless Sensor Networks. CMC-Comput. Mater. Cont.2019, 59, 649–667 [CrossRef]
29. Wang, S.; Basalamah, A.; Kim, S.M.; Guo, S.; Tobe, Y.; He, T. Link-correlation-aware opportunistic routing inwireless networks. IEEE Trans. Wirel. Commun. 2014, 14 ,47–56. [CrossRef]
30. Hang, S.; Gao, D.; Lin, H.; Sun, Q. Wildfire detection using sound spectrum analysis based on the internet ofthings. Sensors 2019, 19, 5093–5113.
31. Zhuhua, H.; Yaochi, Z. Construction and application of intelligent video monitoring system for agriculturaldiseases and insect pests. J. Chin. Agric. Mechan. 2016, 31, 42–43.
32. Wang, J.; Chu, M.; Ma, Y. Measuring rice farmer’s pesticide overuse practice and the determinants: A statisticalanalysis based on data collected in Jiangsu and Anhui Provinces of China. Sustainability 2018, 10, 677. [CrossRef]
33. Ma, J.; Zhang, X.Y. Application of Internet of Things Technology in Monitoring and Early Warning ofDiseases and Pests in Ningxia. Forest Investig. Plan. 2018, 43, 71–74.
34. Dimitrios, P.; Konstantinos, A. SensoTube: A Scalable Hardware Design Architecture for Wireless Sensorsand Actuators Networks Nodes in the Agricultural Domain. Sensors 2016, 16, 1227–1246.
35. Vanegas, F.; Bratanov, D.; Powell, K.; Weiss, J.; Gonzalez, F. A Novel Methodology for Improving Plant PestSurveillance in Vineyards and Crops Using UAV-Based Hyperspectral and Spatial Data. Sensors 2018, 18, 260.[CrossRef]
36. Yuan, L.; Zhang, J.; Wang, J. Research progress of crop diseases and pests monitoring-based on remotesensing. Trans. Chin. Soc.Agric. Eng. 2012, 28, 1–11.
37. Rademacher, W. Plant growth regulators: backgrounds and uses in plant production. J. Plant Growth Regul.2015, 34, 845–872. [CrossRef]
38. Christiansen, M.P.; Laursen, M.S.; Jargensen, R.N.; Skovsen, S.; Gislum, R. Designing and Testing a UAVMapping System for Agricultural Field Surveying. Sensors 2017, 17, 2703–2723. [CrossRef] [PubMed]
39. Vazquez-Arellano, M.; Griepentrog, H.W.; Reiser, D.; Paraforos, D.S. 3-D Imaging Systems for AgriculturalApplications-A Review. Sensors 2016, 16, 618–636. [CrossRef] [PubMed]
40. Cheng, X.; Zhang, Y.H.; Wu, Y.Z.; Yue, Y. Agricultural pests tracking and identification in video surveillancebased on deep learning. In Proceddings of the International Conference on Intelligent Computing; Springer:Cham, Switzerland, 2017; pp. 58–70.
41. Polo, J.; Hornero, G.; Duijneveld, C.; Garcia, A.; Casas, O. Design of a low-cost Wireless Sensor Networkwith UAV mobile node for agricultural applications. Comput. Electron. Agric. 2015, 119, 19–32. [CrossRef]
Sensors 2020, 20, 1487 18 of 18
42. Tongle, H.; Yuxin, Z.; Shutong, W. Construction and implementation of China-blight: a monitoring andwarning system on potato late blight in China. Plant Prot. 2010, 5,135–143.
43. Bai, J.; Xu, G.; Zhou, T.; Zhao, Z. Study on temporal distribution and trend prediction of rice plant diseasesand insect pests in Chongqing Municipality. J. Nat. Disasters 2016, 21, 3–4.
44. Shi, X.; An, X.; Zhao, Q.; Liu, H.; Xia, L.; Sun, X.; Guo, Y. State-of-the-art internet of things in protectedagriculture. Sensors 2019, 19, 1833. [CrossRef]
45. Kamilaris, A.; Prenafeta-Boldu, F.X. A review on the practice of big data analysis in agriculture.Comput. Electron. Agric. 2017, 143, 23–37. [CrossRef]
46. Osborne, L.F.; Shaw, B.L.; Mewes, J.J.; Salentiny, D.M. Continual Crop Development Profiling UsingDynamical Extended Range Weather Forecasting With Routine Remotely-Sensed Validation Imagery. U.S.Patent 10,241,098. 26 March 2019.
47. Salgado-Salazar, C.; Shiskoff, N.; Daughtrey, M.; Palmer, C.L.; Crouch, J.A. Downy mildew: A serious diseasethreat to rose health worldwide. Plant Dis. 2018, 102, 1873–1882. [CrossRef]
48. China’s 4G Network Users Grow to 1.24 billion[EB/OL]. Available online: http://english.cqnews.net/html/2019-08/29/content_50648950.htm (accessed on 29 August 2019).
49. Gao, D.; Liu, Y.; Zhang, F.; Song, J. Anycast routing protocol for forest monitoring in rechargeable wirelesssensor networks. Int. J. Distrib. Sens. Netw. 2013, 9, 239860. [CrossRef]
50. OpenWeatherMap, Inc. OpenWeather API. Available online: http://openweathermap.org/ (accessed on 1Jannuay 2010).
51. Gao, D.; Zhang, S.; Zhang, F.; He, T.; Zhang, J. RowBee: A Routing Protocol Based on Cross-TechnologyCommunication for Energy-Harvesting Wireless Sensor Networks. IEEE Access 2019, 7, 40663–40673.[CrossRef]
52. Al-Rubaye, M.J.M.; Ali, A.; Chisab, R. A smart monitoring and controlling for agricultural pumps usingLoRa IOT technology. Indones. J. Electri. Eng. Comput. Sci. 2019, 13, 286–292.
53. Zhang, Y.; Chen, Z.; Dong, F.; Chen, B. Maritime wireless broadband communication system based onTVWS. In Proceddings of the 2015 4th International Conference on Mechatronics, Materials, Chemistry andComputer Engineering, Mechatronics, Materials; Atlantis Press: Paris, France, 2015.
54. Lin, W.; Deng, G.; Wang, T.; Sun, L.; Du, L. A self-calibrating sun tracker based on a differential pressurecontrol system. In Proceedings of the 2013 International Conference on Materials for Renewable Energy andEnvironment, Chengdu China, 6 August 2014; pp. 450–453.
55. Xu, X. Gaussian process regression method and its prediction model. Sci. Technol. Inf. 2016, 14, 97–99.56. Blaaberg, S.; Like, T.; Baarstad, I.; Fridman, A.; Koirala, P. HySpex ODIN-1024: A new high-resolution
airborne HSI system. In Infrared Technology and Applications XL; International Society for Optics and Photonics:Pittsfield, MA, USA, 10 June 2014.
57. Ding, Y.J.; Li, M.Z.; Li, S.Q.; An, D.K. Predicting chlorophyll content of greenhouse tomato with ground-basedremote sensing. In Multispectral, Hyperspectral, and Ultraspectral Remote Sensing Technology, Techniques, andApplications III; International Society for Optics and Photonics: Bellingham, WA, USA , 2010; Volume 7857,p. 785715.
58. Granke, L.L.; Quesada-Ocampo, L.; Lamour, K.; Hausbeck, M.K. Advances in research on Phytophthoracapsici on vegetable crops in the United States. Plant Dis. 2012, 96, 1588–1600. [CrossRef] [PubMed]
59. Chen, P.C.; Zhang, J.H.; Lei, Y.H. Research Progress of Hyperspectral Remote Sensing for Monitoring CropDiseases and Pests. Chin. Agric. Sci. Bull. 2006, 22, 388.
60. Juroszek, P.; Tiedemann, A. Linking plant disease models to climate change scenarios to project future risksof crop diseases: A review. J. Plant Diseases Prot. 2015, 122, 3–15. [CrossRef]
61. Erlina A.; Istas P.; Adhi, D.W. Expert system for diagnosis pests and diseases of the rice plant using forwardchaining and certainty factor method. In Proceedings of the 2017 International Seminar on IntelligentTechnology and Its Applications (ISITIA), Surabaya, Indonesia, 28–29 August 2017.
62. Larsolle, A.; Muhammed, H.H. Measuring crop status using multivariate analysis of hyperspectral fieldreflectance with application to disease severity and plant density. Precis. Agric. 2007, 8, 37–47. [CrossRef]
c© 2020 by the authors. Licensee MDPI, Basel, Switzerland. This article is an open accessarticle distributed under the terms and conditions of the Creative Commons Attribution(CC BY) license (http://creativecommons.org/licenses/by/4.0/).