Embed Size (px)
Citation preview
1
A Framework for Evaluating ComplexityA proposed structure for identifying sources of complexity in systems, and the system process
Michael P. Easton7/26/2010
A Framework for Evaluating Complexity
By
Michael Easton
_____________________________________
A Dissertation Submitted to the Faculty of the
DEPARTMENT OF SYSTEMS AND INDUSTRIAL ENGINEERING
In Partial Fulfillment of the Requirements for the Degree of
MASTERS OF SCIENCE
In the Graduate College
THE UNIVERSITY OF ARIZONA
2010
2

THE UNIVERISTY OF ARIZONA
GRADUATE COLLEGE
As members of the Final Examination Committee, we certify that we have read the dissertation
prepared by Michael Pat Easton
Entitled: A Framework for Evaluating Complexity
And recommend that it be accepted as fulfilling the dissertation requirement for the Degree of
Master of Science
_______________________________________________ __________
A. Terry Bahill Date
_______________________________________________ __________
K. Larry Head Date
_______________________________________________ __________
Jian Liu Date
Final approval and acceptance of this dissertation is contingent upon the candidate’s submission
of the final copy of the dissertation to the Graduate College.
I hereby certify that I have read this dissertation prepared under my direction and recommend
that it be accepted as fulfilling the dissertation requirement.
_______________________________________________ __________
Dissertation Director Date
A. Terry Bahill
3
STATEMENT BY THE AUTHOR
This dissertation has been submitted in partial fulfillment of requirements for an
advanced degree at the University of Arizona and is deposited in the University
Library to be made available to borrowers under rules of the Library.
Brief quotations from this dissertation are allowable without special permission,
provided that accurate acknowledgement of source is made. Requests for
permission for extended quotation from or in part may be granted by the head of
the major department of the Dean of the Graduate College when in his or her
judgment the proposed use of the material is in the interests of scholarship. In all
other instances, however, permission must be obtained from the author.
Signed: ____________________________
4
Abstract
This paper organizes sources of complexity into a proposed taxonomic framework. The discussed
sources are based on a survey of previously published works related to attributes of complexity. The
framework is then evaluated through comparison to previously established complexity measures, the
systems engineering process and real world examples. Outputs that result from this process are: 1. A new
proposed definition of complexity as it relates to systems engineering. 2. Identification of current gaps in
the application of complexity to the systems engineering process 3. An explanation of system
requirements and their relationship to complexity. In addition, several future areas of study are identified.
5

Table of Contents
1. INTRODUCTION.........................................................................................................................................12
1.1. GENERAL INTRODUCTION........................................................................................................................12
1.2. THE GOALS AND SCOPE OF THIS PAPER.................................................................................................17
1.3. AUTHOR'S BACKGROUND........................................................................................................................18
1.4. EXPLANATION OF THE SECTIONS AND THEIR ORGANIZATION................................................................19
1.5. MAJOR INFLUENCES................................................................................................................................21
2. BACKGROUND INFORMATION.............................................................................................................22
2.1. SYSTEMS ENGINEERING...........................................................................................................................22
2.2. COMPLEXITY...........................................................................................................................................24
3. LITERATURE REVIEW.............................................................................................................................26
3.1. PHILOSOPHICAL VIEWS ON COMPLEXITY................................................................................................26
3.1.1. A Topic with Limited Value................................................................................................................26
3.1.2. An Artifact..........................................................................................................................................26
3.1.3. An Intuitive, Unifying Concept...........................................................................................................26
3.1.4. Applicable to Many Scales of Size and System Level.........................................................................26
3.1.5. Contextual...........................................................................................................................................26
3.1.6. Currently Attainable...........................................................................................................................27
3.1.7. Extremely Important...........................................................................................................................27
3.1.8. Fundamentally Inherent to all things.................................................................................................27
3.1.9. Relative...............................................................................................................................................27
3.1.10. Relevant..........................................................................................................................................27
3.1.11. Required for Better Understanding................................................................................................28
3.1.12. Subjective.......................................................................................................................................28
6

3.2. FORMAL DEFINITIONS OF COMPLEXITY..................................................................................................28
3.2.1. Birkhoff, 1933.....................................................................................................................................28
3.2.2. Simon, 1962........................................................................................................................................28
3.2.3. El-Haik and Yang, 1999.....................................................................................................................29
3.2.4. Uspensky, 2001...................................................................................................................................29
3.2.5. Jacobson, 2001...................................................................................................................................29
3.2.6. Suh, 2005............................................................................................................................................29
3.2.7. Sivadasan et. al., 2006........................................................................................................................29
3.3. MANIFESTATIONS OF COMPLEXITY.........................................................................................................30
3.3.1. Adaptation..........................................................................................................................................31
3.3.2. Algorithmic Information.....................................................................................................................32
3.3.3. Changes of State.................................................................................................................................32
3.3.4. Chaotic Structure................................................................................................................................33
3.3.5. Combinatorial Complexity.................................................................................................................33
3.3.6. Computational Resources...................................................................................................................33
3.3.7. Detailed Static Structure....................................................................................................................34
3.3.8. Difficulty to Represent........................................................................................................................34
3.3.9. Diversity of “Entities”........................................................................................................................34
3.3.10. Dynamic Structure.........................................................................................................................34
3.3.11. Emergent Behavior........................................................................................................................35
3.3.12. “Entity” Sharing............................................................................................................................35
3.3.13. Environmental Changes.................................................................................................................35
3.3.14. Feedback........................................................................................................................................35
3.3.15. Funding..........................................................................................................................................35
3.3.16. Hierarchy of Structure...................................................................................................................36
3.3.17. Impact to Context...........................................................................................................................36
7
3.3.18. Input Sensitivity..............................................................................................................................36
3.3.19. Interactions of “Entities”...............................................................................................................36
3.3.20. Knowledge of a System..................................................................................................................37
3.3.21. Large number of “Entities”...........................................................................................................37
3.3.22. Meeting System Requirements.......................................................................................................37
3.3.23. Nature of the Prescribed Task.......................................................................................................38
3.3.24. Nature of Solution..........................................................................................................................38
3.3.25. Non-Deterministic Behavior..........................................................................................................38
3.3.26. Number of Alternatives..................................................................................................................38
3.3.27. Number of Functional Requirements.............................................................................................38
3.3.28. Organizational Setting...................................................................................................................39
3.3.29. Periodic Complexity.......................................................................................................................39
3.3.30. Political Setting..............................................................................................................................39
3.3.31. Priority...........................................................................................................................................39
3.3.32. Psychological.................................................................................................................................39
3.3.33. Radical Openess.............................................................................................................................40
3.3.34. Relationship to Context..................................................................................................................40
3.3.35. Relevance.......................................................................................................................................40
3.3.36. Self-Organization...........................................................................................................................40
3.3.37. Social Roles and Relationships......................................................................................................41
3.3.38. Statistical Uncertainty....................................................................................................................41
3.3.39. Storage Space.................................................................................................................................41
3.3.40. Time Frame....................................................................................................................................41
3.3.41. Tools or Methods...........................................................................................................................41
3.3.42. Unnecessary...................................................................................................................................42
3.3.43. User Capabilities...........................................................................................................................42
8
3.3.44. User Interaction.............................................................................................................................42
4. COMPLEXITY TAXONOMY.....................................................................................................................43
4.1. DEFINITION OF COMPLEXITY CLASSES...................................................................................................43
4.1.1. Character............................................................................................................................................44
4.1.2. Description.........................................................................................................................................45
4.1.3. Setting.................................................................................................................................................46
4.1.4. Interface..............................................................................................................................................47
4.2. POSSIBLE QUESTIONS AND CONCERNS WITH TAXONOMY......................................................................47
4.2.1. The Meaning of the Taxonomy...........................................................................................................47
4.2.2. Excluded Attributes............................................................................................................................48
5. TESTING THE TAXONOMY.....................................................................................................................51
5.1. AGAINST PHILOSOPHIES..........................................................................................................................51
5.1.1. Complexity Versus Difficulty..............................................................................................................52
5.1.2. Complexity Verses Complicated.........................................................................................................54
5.1.3. Complexity Verses Requirements.......................................................................................................55
5.1.4. A Rock.................................................................................................................................................57
5.1.5. Integrating the Concepts....................................................................................................................58
5.2. AGAINST DEFINITIONS............................................................................................................................59
5.3. AGAINST MEASURES...............................................................................................................................61
6. APPLICATIONS...........................................................................................................................................64
6.1. ONCE COMPLEX, NOW ONLY DIFFICULT [ THE ATOMIC BOMB ]..........................................................64
6.2. ONCE COMPLEX, ALWAYS COMPLEX [ RAISING CHILDREN ]................................................................66
6.3. REVIEWING HISTORICAL ENGINEERING TASKS......................................................................................70
6.4. PROJECT MANAGEMENT..........................................................................................................................80
6.5. ZONES OF INTEREST................................................................................................................................83
9
7. CONCLUSIONS............................................................................................................................................86
7.1. SUMMARY OF ACHIEVEMENTS................................................................................................................86
7.2. FUTURE WORK.........................................................................................................................................86
APPENDIX A: DETAILS OF SELECTED COMPLEXITY MEASURES.................................................88
8. REFERENCES..............................................................................................................................................90
Table of Figures
Figure 1. Growth in the Use of the Word “Complexity” in Article Titles...............................................13
Figure 2. The Complexity Taxonomy......................................................................................................16
Figure 3. The SIMILAR Process..............................................................................................................22
Figure 4. Complexity Taxonomy..............................................................................................................43
Figure 5. Bloom's Taxonomy of Learning................................................................................................52
Figure 6. Possible Structure of Concepts..................................................................................................58
Figure 7. Components of Hardness..........................................................................................................59
Figure 8. Mapping of Definitions, Concepts and the Taxonomy.............................................................60
Figure 9. Mapping the Taxonomy to SIMILAR.......................................................................................62
Figure 10. The Difficulty and Complexity of the Atom Bomb................................................................66
Figure 11. Difficulty and Complexity in Raising a Child........................................................................67
Figure 12. Mapping of Difficulty to Complexity.....................................................................................79
Figure 13. Process for Complexity Evaluation.........................................................................................80
Figure 14. The General Complexity Space..............................................................................................81
Figure 15. Forces on the Complexity Space.............................................................................................81
Figure 16. Movement in the Complexity Space.......................................................................................82
Figure 17. Traditional Gantt Chart...........................................................................................................82
10
Figure 18. Complexity Gantt Chart..........................................................................................................83
Figure 19. Plot of New Set.......................................................................................................................85
Table of Tables
Table 1. The SIMILAR Process and the Systems Engineering Consensus..............................................24
Table 2. Mapping of Complexity Attributes by Author...........................................................................30
Table 3. Measures Evaluated Against Taxonomy....................................................................................63
Table 4. Impact of Requirements on Raising a Child...............................................................................68
Table 5. Original scores determined by Moody et. al,.............................................................................70
Table 6. Revised values for project “Difficulty”......................................................................................71
Table 7. Complexity Scores......................................................................................................................76
Table 8. Resource Values for New Set.....................................................................................................84
Table 9. Complexity Values for the New Set...........................................................................................84
Table of Equations
Equation 1. Complexity Curve Fit............................................................................................................77
Equation 2. R Squared..............................................................................................................................77
11
1. INTRODUCTION
“O Lord, my heart is not proud, nor my eyes haughty; Nor do I involve myself in great matters, Or in
things too difficult for me.” King David [NASB, 1995]
“I think the next century will be the century of Complexity” [Hawking, 2001]
“The 21st century has been described as the ‘Systems Century’” [Calvano and John, 2004]
1.1. General Introduction
The study of “complexity” is of increasing interest. John Casti stated in his book on complexity that it
was “one of the most overworked words in the system analysis lexicon” [Casti, 1979]. The fact that this
statement was made thirty years ago provides a reference point for how it is even truer today. A search of
the online Wiley-Interscience database revealed that, for the number of entries (articles, chapters and
protocols) with “Complexity” in the title, there has been significant increase in the last three decades.
When normalized for the total number of articles in a decade the same growth is still demonstrated.
Why this surge of interest in the last 30 years? The answer does not appear readily evident. Complexity
itself is an old concept, even if the name has not been consistently applied. King David acknowledged
that there are just some things too large or marvelous (too complex) for him to understand. The intuitive
feeling of the word seems to relate to the idea of being difficult to comprehend, or explain to someone
else. When asking someone what complexity means you will get various responses to the question. To
satisfy curiosity, a poll was taken from an audience of my close friends and family, who share a diversity
of academic background and levels of education. The answers were:
“ Not simple”
“Multiple factors”
“Takes large amounts of thought to figure out, or solve the task”
12
“Multiple aspects, with each aspect working together. But it can be simple as a whole.”
“A branch of study that attempts to describe the dynamics of a situation or event by trying to
understand the different facets, and the interrelationship of those facets. Sometimes complexity
can be viewed in both the macro and micro levels.”
“Complexity is relative to the person who tries to understand something.”
“It relates to the nature of the item itself, and how it relates to the outside world.”
“It means it is something I am not going to be able to understand, or not be able to understand
without a lot of thought.”
“Something with lots of parts, that are interrelated, that reacts to the environment in various and
surprising ways.”
"A system with many purposes"
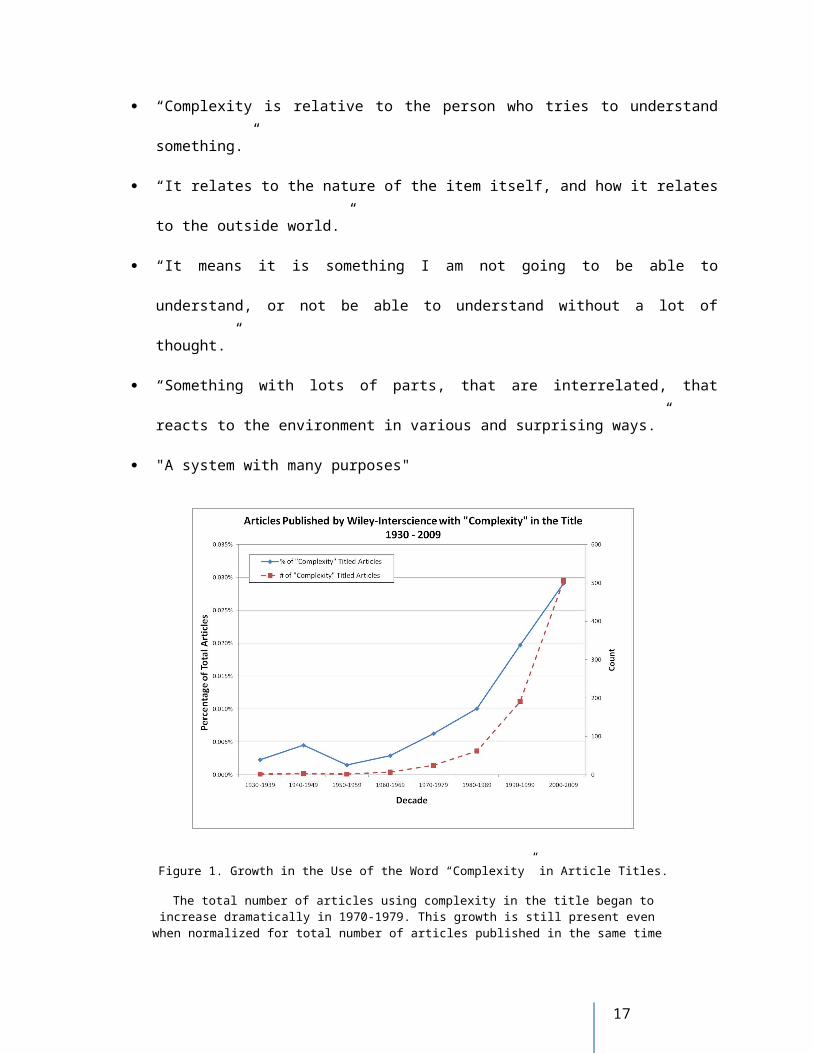
Figure 1. Growth in the Use of the Word “Complexity” in Article Titles.
The total number of articles using complexity in the title began to increase dramatically in 1970-1979. This growth is still present even when normalized for total number of articles published in the same time period.
Source: Wiley-Interscience Documents Database Search, performed June 16th, 2010. http://www3.interscience.wiley.com/cgi-bin/home.
13
Interestingly, these answers mimic the range of responses found in published literature on the subject.
This could be notable, considering that these responses came from physical therapists, creative writers,
house mothers and retired train conductors. It is not clear if this is due to the topic being a fundamentally
intuitive concept, or if over time it has penetrated the zeitgeist of today’s society.
However, despite the established position in the minds of people, there no formal consensus of
definition. Any author writing on the topic is obliged to include a short synopsis declaring their relevant
philosophies, definitions, attributes and applications. This allows readers to understand where they are
coming from, and set the ground rules for future discussion. In fact, there is not even universal agreement
on the need for a definition and framework.
Debate also exists regarding whether complexity is useful to perform meaningful calculations and
decisions for various fields of study. Can it help to avoid common system engineering mistakes, such as
the Forer effect [Smith et al., 2007], or is it just an elaborate way of bringing in common problems that
rely on personal experience and dependant criteria? Is it a property that can only be determined about a
system once details surrounding it have already been solved? Is it the key to performing more powerful
risk analysis, addressing probability and severity simultaneously [A. T. Bahill and Karnavas, 2000] ?
The ingrained nature of this topic, and its philosophical assumptions, presents a specific danger.
Theories and measurements for it depend highly on other agreed upon “facts” relating to the field it is
being applied to. Most people would agree that complexity is increasing for those living in today’s world.
Biologists are particularly interested in this topic and how it relates to their research [Adami, 2002]. With
so much a priori knowledge and assumptions present can we trust that measures of complexity are truly
reliable?
An article published as late as June 2010 discuss how scientists were surprised to find that roundworms
have almost 10,000 more encoding genes than humans, who are more considered more complex and
higher on the evolutionary scale [Wade, 2010]. This revelation caused consternation as it did not match
14
with intuitive ideas about the topic, and caused more questions. It was later found that details for how
mechanisms of RNA for humans function are more involved that those of roundworms, thereby
preserving the “natural” expectations. This may cause one to question if our definitions are being adjusted
to accommodate other factors besides simple scientific enlightenment.
But despite all of these issues and dangers the topic is exciting and open to great possibility. This seems
even truer for systems engineers, and it has been proposed that this field stands to gain greatly in terms of
opportunity [Ren, 2003]. The overlap between both Hawking’s statement, and that of Calvano and John,
seem to hold a great future of promise. Indeed, the study of complexity can expand the role of the
system’s engineer [Jacobson, 2001]. In turn the field of system engineering can, and should, develop
unique tools to support and contribute to the field of complexity science [Ren, 2003] .
15
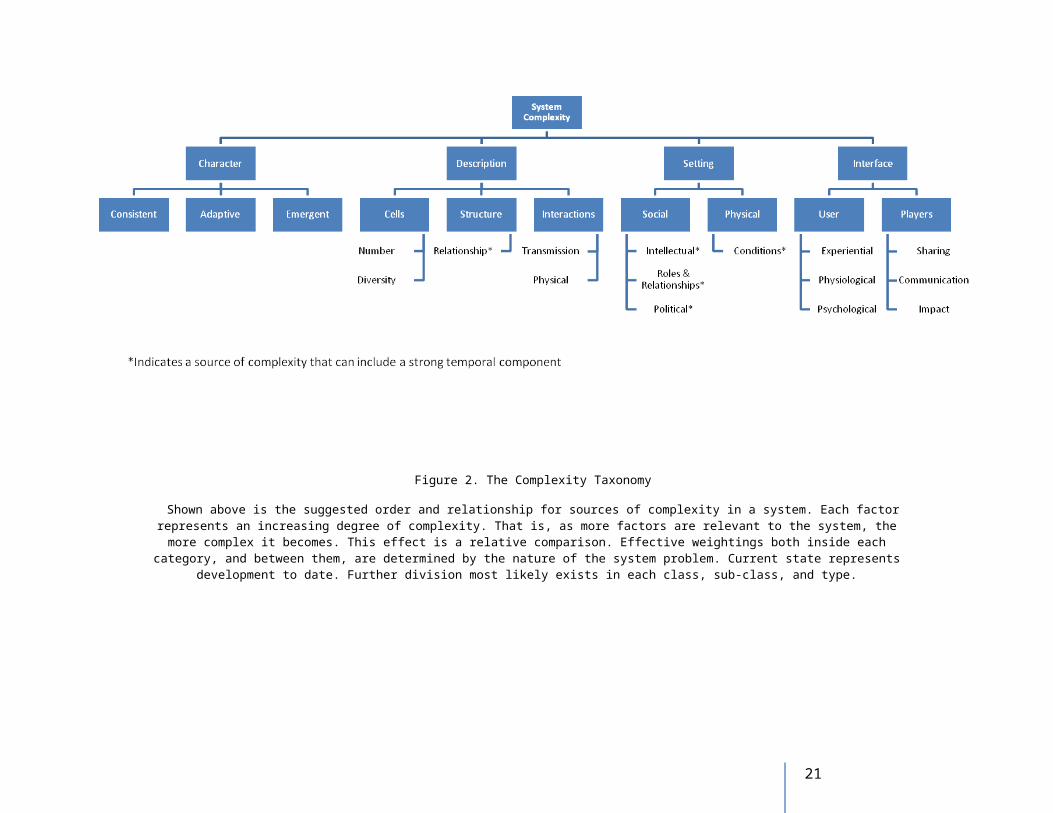
Figure 2. The Complexity Taxonomy
Shown above is the suggested order and relationship for sources of complexity in a system. Each factor represents an increasing degree of complexity. That is, as more factors are relevant to the system, the more complex it becomes. This effect is a relative comparison. Effective weightings both inside each
category, and between them, are determined by the nature of the system problem. Current state represents development to date. Further division most likely exists in each class, sub-class, and type.
16
1.2. The Goals and Scope of This Paper
The goals of this paper are:
1. Compile published information relating to complexity. These will include philosophical ideas,
formal definitions, ways in which complexity manifests in various fields, established measures
and methods of reduction.
2. Categorize these ideas, classifying them into a taxonomy framework. (Shown in Figure 2)
3. Evaluate the newly proposed taxonomy against previously established complexity philosophies,
measures, definitions and the systems engineering process.
4. Propose a new definition of complexity based on the taxonomy.
5. Define the relationship between functional requirements and system complexity.
6. Evaluate the taxonomy against several real world examples to determine possible benefit.
The method and framework chosen for the first goal was chosen by the author to move from more
global holistic views to specific applications in a logical manner. It is hoped that this method will help
develop the relationships between each category in order to augment the reader’s understanding. Sources
have been chosen as best examples for each item found. The scope of this goal is not meant to rigorously
determine who developed each concept and when, although effort has been taken to include as many first
sources as possible. Other, more specific works have served to demonstrate the history of complexity
study and its “parents”. For an example of this one could read the book, “Complexity: Life at the Edge of
Chaos”[Lewin, 1992].
Even a preliminary review of literature today reveals a lack of cohesion in both the definition and
measurement of complexity. This is due to the nature of the term itself, or simply the result of unfinished
understanding. This work will not attempt to reconcile this problem, but instead will acknowledge it as it
exists and seek only to classify the various attempts and applications.
Finally, the overall presentation of this paper is meant to address the following:
17
“We note that most work currently published under the rubric ‘complex systems’ covers only
some aspects of the definition of concepts. Complex systems research would be much more readily
accepted if scientific publications present all components of a new concept. Further, the preference
for abstract concepts leads to a rapid growth of abstract knowledge, whereas practical knowledge
grows only slowly. This means that we may have to wait for quite some time till we develop a
“practical” understanding of complex systems and see practical applications of complex systems
research.” [Hubler, 2007]
Cautioned by Hubler’s statement, and the immense amount of work by much greater people, the author
has attempted to comprehensively incorporate as much previous work as possible while making only
small suggestions to practical application.
1.3. Author's Background
A person's views on complexity are certainly shaped by their background and experience. In order to
clarify the perspectives presented in this paper, a few words about my background, as the author, may be
helpful.
For the last ten years I have worked in aerospace, primarily as a systems engineer. In this role I have
had the opportunity to perform many of the traditional engineering tasks; cost estimating, risk
identification and mitigation, requirements development and validation, modeling and analysis, and even
hardware integration and testing. The ideas presented in this paper are meant to serve as a starting point
for solutions to problems I experienced in each of those activities. Specifically, understanding how
requirements drive properties of a system is at the core of this work.
Much of my job is currently performed at the "cocktail napkin" stage of engineering. At these earliest
stages of development I am often working with vague notions and concepts, and very few requirements.
In fact, the customer often asks for me to tell them what the requirements should be. I am often struck by
the impact these early decisions have on a system, either for benefit or harm.
18
Three questions always come up: "How many of my resources is this going to take?" "How can I reduce
the resources required to perform this task?" and "What is the impact if I give relief on this requirement
by x%?" I believe that complexity can give us insight into these answers much sooner, and at a higher
fidelity, than currently experienced. There is a lot of work to do before that can be realized. A set of
complexity characteristics would need to be defined, a scoring system would need to be established that
includes scale and weighting, and previous project data would need to be analyzed to provide a baseline.
This paper is meant to be the first step in reaching that goal.
1.4. Explanation of the Sections and their Organization
Section 2 will contain background information for the two major areas of interest for this paper, namely
systems engineering and complexity. The systems engineering section will briefly visit basic concepts of
the field and its overall purpose. In addition, a framework will be established for evaluating information
with respect to the field. The complexity section will provide the reader with a brief background into the
difficulties currently experienced in the topic of complexity. Finally, the final section will outline issues
that plague the task of attempting to estimate aspects of the engineering process for both time and
schedule.
Section 3, the review of the literature, will attempt to break out concepts of complexity by their level of
application. Each section has a theme.
Section 3.1 Philosophy “Complexity is:”
Section 3.2 Formal Definitions “Complexity can be defined as:”
Section 3.3 Manifestations “Systems demonstrate complexity by means of:”
Section 3.1 will pull together various key philosophies of complexity. These have been compiled to
provide a reference for testing ideas later presented in the paper. It is assumed that each of the notions are
correct when taken in context.
19
Section 3.2 comprises a list of formal definitions, brief passages describing what complexity is, that
have been compiled from the cited works. This list is not exhaustive. It is not meant to be, and one doubts
if it ever could be. It is instead meant to give the reader a point of reference for how various philosophies
have begun to form definitions about the topic.
Section 3.3 will be a collection of manifestations of complexity. This section will be a “raw” list of
ways that complexity has appeared in various field of study. These manifestations will be accompanied
by examples when supplied by the quoted author. Manifestations will be grouped by type, with annotation
to list of fields of study. In the interest of space, manifestations that are essentially identical will be listed
once and all authors that cited in will follow. This section will be listed chronologically by year of the
first date cited.
A final word on the sections in the review portion: Each piece of information will be stated as fact,
followed by reference to the source. At times these sections will appear contradictory as the reader moves
through the paper. A section discussing the measureable value of a system’s intrinsic complexity may be
directly followed by one asserting the subjective nature of the property. This is done by the author due to
the fact that he believes all these assertions (when properly taken into account with their context
application to a system problem and area of study) are indeed correct and non-contradictory. In fact they
are complimentary. These statements, taken out of their original context, should not be taken as
representations of the philosophical views currently held by the author cited. Instead, it is simply meant to
show that, at the time, their work demonstrated yet another component of complexity.
Section 4 will classify and codify themes of complexity into a framework. In this section possible
questions and concerns related to the new framework will also be addressed.
Section 5 will be dedicated to testing the taxonomy against current philosophies, definitions, measures
and processes for systems engineering. This will be done in an effort to demonstrate possible errors or
areas of study for future work
20
Section 6 will demonstrate the application of the framework against modern day examples. This is done
in an attempt to review whether, according to the taxonomy, a system is complex. Again possible error, or
future topics of study, will also be demonstrated.
Finally, section 7 will contain the conclusion and recommendations for future study.
1.5. Major influences
Several works influenced this thesis. Suh’s principles on axiomatic definitions, and relating complexity
to functional requirements was instrumental in helping to create an appropriate mindset. His book,
Complexity [Suh, 2005], is recommended reading for anyone involved in the systems engineering field.
A.T. Bahill’s work on defining the roles and activities of systems engineering was also instrumental in
providing a framework for relating the field to complexity. Both his work with Gissing on Re-evaluating
Systems Engineering [A. T. Bahill and Gissing, 1998], and with Dean [A. T. Bahill and Dean, 2009], will
provide readers of all backgrounds and experience levels with valuable information.
In addition, the sections on attributes of complexity, and the measures of these attributes, are an
adaptation of the excellent work by Seth Lloyd called “Measures of Complexity: A Non-Exhaustive List”
published in IEEE Control Systems Magazine [Lloyd, 2001]. Although the structure employed by the
author departs in some ways from Lloyd’s, it does so only due to the differing context and purpose of this
work.
Finally, excellent articles comparing various complexity measures and test cases [Ameri et al., 2008]
were useful in paving the way for a process of comparison.
21
2. BACKGROUND INFORMATION
2.1. Systems Engineering
Re-Evaluation With respect
to Stakeholder Needs
State the Problem
Investigate Alternatives
Model the System
Integrate
Launch the System
Asses Performance
Product and
Process
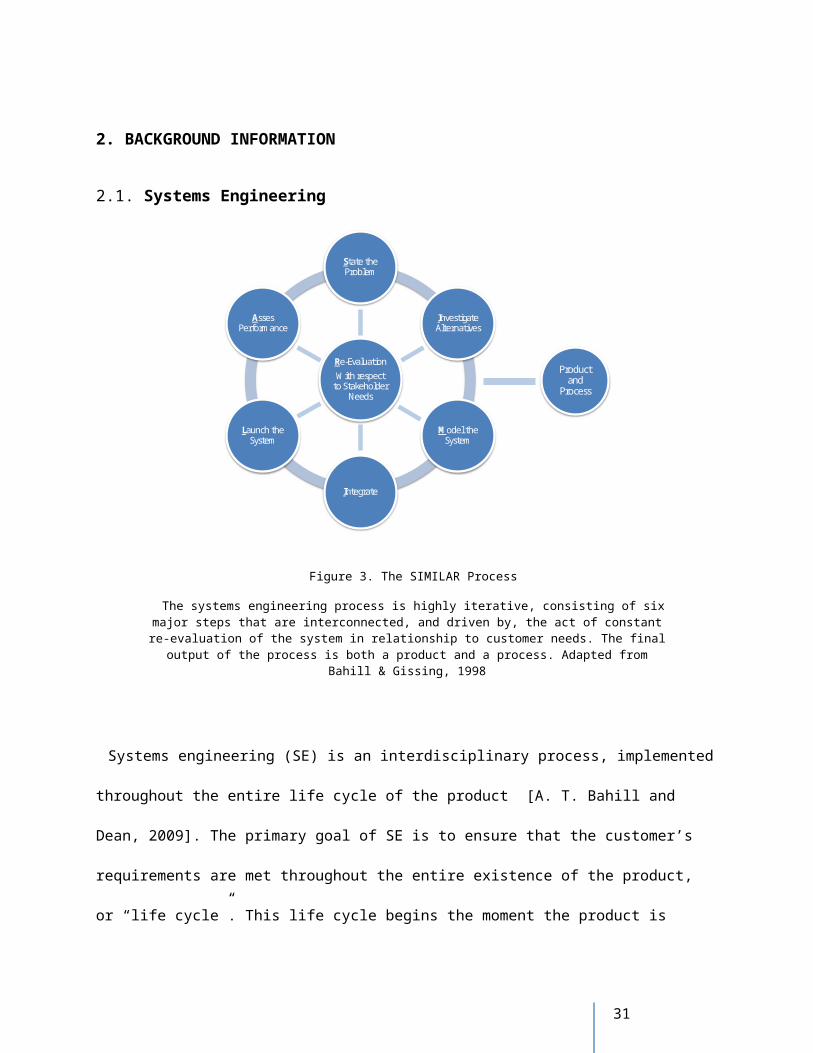
Figure 3. The SIMILAR Process
The systems engineering process is highly iterative, consisting of six major steps that are interconnected, and driven by, the act of constant re-evaluation of the system in relationship to customer needs. The final
output of the process is both a product and a process. Adapted from Bahill & Gissing, 1998
Systems engineering (SE) is an interdisciplinary process, implemented throughout the entire life cycle
of the product [A. T. Bahill and Dean, 2009]. The primary goal of SE is to ensure that the customer’s
requirements are met throughout the entire existence of the product, or “life cycle”. This life cycle begins
the moment the product is first conceived and includes the retirements of the system and its disposal or
decommission.
For the purposes of this paper a “system” will be defined as: a construct or collection of different
elements that together produce results not obtainable by the elements alone. The elements, or parts, can
include people, hardware, software, facilities, policies, and documents; that is, all things required to
22
produce systems-level results. The results include system level qualities, properties, characteristics,
functions, behavior and performance. The value added by the system as a whole, beyond that contributed
independently by the parts, is primarily created by the relationship among the parts; that is, how they are
interconnected [A. T. Bahill and Dean, 2009]. The requirements take the form of two major categories:
1. Functional: The ability of the system to meet a requirement within some specified range. As a
simple example we could use a spring. A possible requirement might be stated as: “The spring
shall compress 3.0 +/- 0.1 inches, when axially loaded by a weight of 10 pounds.”
2. Constraint: An expressed limit of a characteristic of the system in question. For example: “The
spring shall not exceed 0.25 pounds”, or “The material cost of the spring shall not exceed $.50
in material cost.”
Although the above examples may seem simplistic, there is nothing to ensure that an overlap of
manufacturing processes, available materials, and material costs can be found to meet these simple
examples simultaneously. It is the role of SE to begin developing the item, looking holistically at all areas
of interest, to develop a solution that either meets the requirements or explains why it cannot be done.
As may be expected, this process is highly iterative, and involves several stages. A more thorough
review of the various methods employed to describe the SE process can be found in Bahill and Gissing,
[A. T. Bahill and Gissing, 1998] .
This same work provides views of both the process and activities involved in SE and will be used as a
framework for further discussion. Figure 3, above, is of the SIMILAR process, used to demonstrate the
six major stages of the SE process. Note that the process is iterative, with changes in each stage leading to
re-evaluation of previous (or subsequent) stages. The details of how more traditionally labelled activites
map into this process can be found below in Table 1.
23
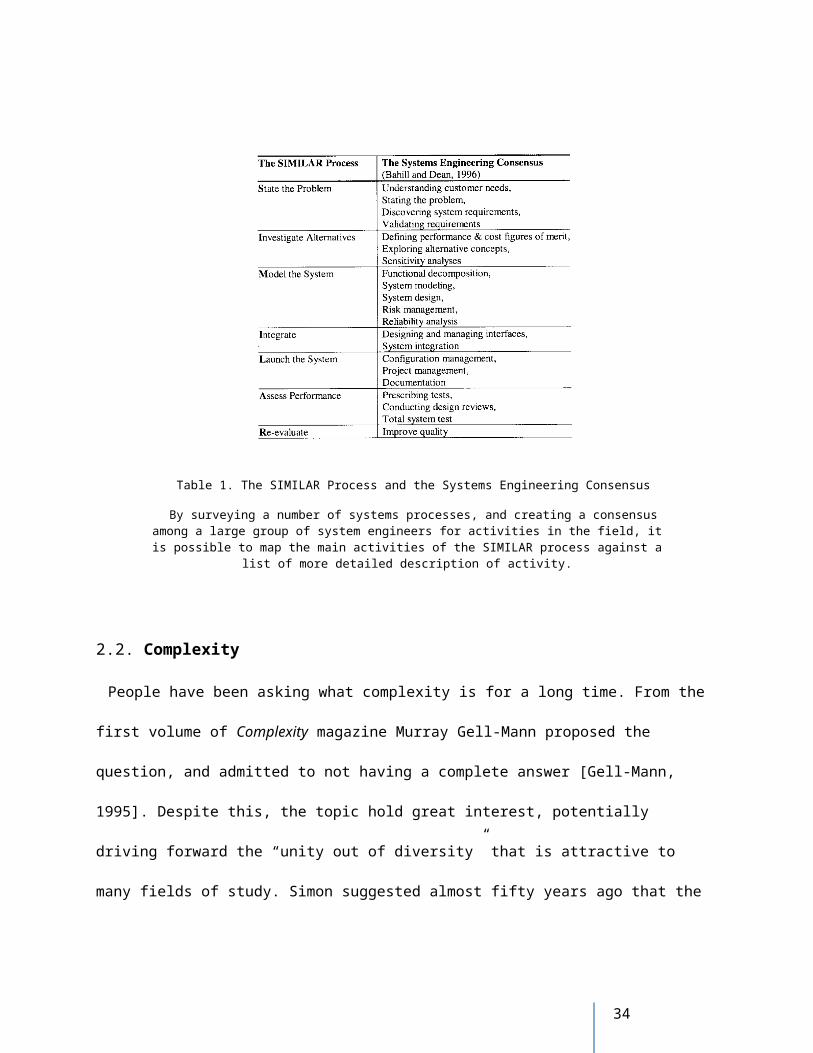
Table 1. The SIMILAR Process and the Systems Engineering Consensus
By surveying a number of systems processes, and creating a consensus among a large group of system engineers for activities in the field, it is possible to map the main activities of the SIMILAR process against a
list of more detailed description of activity.
2.2. Complexity
People have been asking what complexity is for a long time. From the first volume of Complexity
magazine Murray Gell-Mann proposed the question, and admitted to not having a complete answer [Gell-
Mann, 1995]. Despite this, the topic hold great interest, potentially driving forward the “unity out of
diversity” that is attractive to many fields of study. Simon suggested almost fifty years ago that the quest
may be futile, but it is a worthy pursuit given the possible benefit [Simon, 1962].
A common place to start for the definition of any word is the dictionary. Looking up “complexity”
quickly leaves one feeling less than satisfied. The Merriam-Webster dictionary defines it as “something
complex” or “the state of being complex” [2009a], descriptively accurate but not particularly helpful.
Taking the next natural step, the word complex can be investigated in the same reference.
24
Doing so reveals that complex has many meanings depending on the parts of speech, and when used as
an adjective means “hard to separate, analyze, or solve.” [2009b] This definition is, at best, only
somewhat more appealing to a formal researcher. Hard is a relative term, and has a major component of
subjectivity to it. It can depend on experience, intelligence, attitude and even the context. What is “hard”
to one may not be for all, or even many.
The process of disarming a bomb with two possible wires to cut, in a quiet library would be very hard
for me. I would call it complex. Yet, to someone with trained experience from battle zone conditions it
would be a much preferred “easier” task. To the maker of the bomb, who knows exactly which wire to
cut, it would be easy in almost any environment. The psychological time pressure of a clock running in
the last ten seconds would tend to make any of the three of us nervous. Yet, regardless of these details
making the experience more intense, the action would seem to be of the same complexity each time.
It is this relative nature of the definition that frustrates the scientifically minded. The problem seems to
only compound as other words are used to describe the nature of complexity. Words such as emergent,
agility, entropy, causality, self organization and complicated, are often used as augmenting adjectives to
help communicate the point. The fact that these words are themselves not always agreed upon in
definition aggravates the problem.
This is very dissatisfying for all parties involved, especially with the advent of so many useful and
powerful concepts in the last century. Take for example the concept of “statistical significance”. This
term can easily be defined, it can be applied across a large number of disciplines, the applications are
incredibly powerful and it matches with human intuition. It is hoped that one day complexity will achieve
this same level of definition. To that end many have proposed that a definition for complexity, as well as
an explanation for how many complexities exist and what they are, is needed [Morin, 2008].
25
3. LITERATURE REVIEW
3.1. Philosophical Views on Complexity
3.1.1. A Topic with Limited Value
Some, most notably John Horgan, have taken a more pessimistic view of the value of complexity and
the benefit that it can bring [Horgan, 1996]. He notes that it is the goal of the research community to find
a new law, set of principles, or unifying theory, that brings together many aspects of the complex systems.
Showing what it is that drives complexity. To do this, he points out, it needs to be quantified. In fact, it is
in two part article where he debates with Stuart Kauffman the value of complexity in general, and the end
of science.
3.1.2. An Artifact
Complexity is not the function of reality itself, but an artifact of our ability to describe phenomena
[McIntyre, 1998]. This does not mean it has no use, but that it explains why some phenomena cannot be
understood. Complexity means hard to understand, hard to understand means complex.
3.1.3. An Intuitive, Unifying Concept
That it is a possible unifying concept for many branches of study, and that it will promote “systems
thinking” [Erdi, 2008], it also seems to match our internal convictions that the whole is greater than the
sum of its parts.
3.1.4. Applicable to Many Scales of Size and System Level
Complexity is meant to tie together theories of small pieces adding together to make a global structure,
or of a global structure acting to create local interaction, and of self similar scales [Lewin, 1992].
26
3.1.5. Contextual
Studies have shown that the number of rules an employee has to cope with gives them the feeling of the
task being complex [Early, 1985]. This complexity was found to be an inverse with task acceptance, but
could be mitigated with information, indicating a subject condition. The rules could be considered
requirements. It could be looked at that the overlap between requirements range and system performance
define a complexity. It has been pointed out that the proper system formulation depends on both the
context of the problem and the question that is being asked [Schuster, 2005].
3.1.6. Currently Attainable
We are at the point in human history where we can begin to understand complexity and its sister
concepts (emergence, self organization). These avenues hold new promise for scientific exploration and
discovery [Kauffman, 1996] .
3.1.7. Extremely Important
Complexity is one of the most important fields in the future, due to its application for large scale socio-
political problems. These problems may have too large of consequences to be wrong, or may be
irreversible [Schuster, 2008]. Complexity can provide a new source of information to evaluate these
decisions.
3.1.8. Fundamentally Inherent to all things
It has been suggested that all items are complex at some level, whether they appear simple or not.
Umphrey states that every single entity is complex, every shade of blue is complex is and of itself
[Umphrey, 2002].
3.1.9. Relative
Complexity is not a physical, actual, thing but just a relative measure between similar entities [Suh,
2005].
27
3.1.10. Relevant
Life is increasing in complexity. This is an intuitive notion. Complexity theory can help to mitigate this
issue [Calvano and John, 2004] or can help to reset the “complexity clock” [Schuster, 2006]. Designs are
becoming increasingly complex in software, to the point where designers do not even understand the
product., and do not rigorously verify them, and not to the level due their complexity [McCabe and
Butler, 1989].
3.1.11. Required for Better Understanding
With better complexity comes better fit. As a model becomes more complex the capability to better
approximate real life scenarios will increase [Spiegelhalter et al., 2002]. This increased complexity is
required to improve on current levels of difficult systems [Biemans et al., 2001].
3.1.12. Subjective
Davis, in her own personal experience has noted a shift in complexity in dealing with patient palliative
care. It is still multi-faceted, but of subjective items. It is a function of experience and wisdom. This still
means it is pursued [Davis, 2009]. “Complexity is in the eye of the beholder” [Schaufelberger and Sanz,
2001]. This means it can be dealt with without a definition [Dromey, 2005].
3.2. Formal Definitions of Complexity
3.2.1. Birkhoff, 1933
The number of times the mind is caused ‘tension’ in the task of perceiving an object [Birkhoff, 1933].
3.2.2. Simon, 1962
“Roughly, by a complex system I mean one made up of a large number of parts that interact in a non-
simple way. In such systems, the whole is more than the sum of its parts, not in an ultimate metaphysical
sense, but in the important pragmatic sense that, given the properties of the parts and the laws of their
interaction, it is not a trivial matter to infer the properties of the whole. “ [Simon, 1962]
28
3.2.3. El-Haik and Yang, 1999
From a generic perspective, complexity can be defined as a quality of an object with many interwoven
elements and attributes which make the whole object difficult to understand in a collective sense [El-Haik
and Yang, 1999].
3.2.4. Uspensky, 2001
“To be simple means to have a short description. To be complex is not to be simple. To be complex is
to have no short description” [Uspensky, 2001].
3.2.5. Jacobson, 2001
“Briefly, a complex system may be characterized by the interactions of numerous individual elements
or agents (often relatively simple), which self-organize to show emergent and complex properties not
exhibited by the individual elements” [Jacobson, 2001].
3.2.6. Suh, 2005
“A measure of uncertainty in understanding what it is we want to know or in achieving a functional
requirement” [Suh, 2005]
The implications of this statement are as follows:
Overlap of the system range and design range gives a quantitative measure
The overlap can be static or dynamic depending on system drift. This implies there are time
dependant and time independent pieces.
A relationship may exist in which the order, or manner, that the functional requirements are met
is important.
3.2.7. Sivadasan et. al., 2006
“The uncertainty associated with managing the dynamic variations, in time or quantity, across
information-material flows at the supplier-customer relationship.” [Sivadasan et al., 2006]
29

3.3. Manifestations of Complexity
Section Name Birk
off, 1
933
Booc
h, 2
008
Brah
a &
Mai
mon
, 199
8
Brod
u, 2
009
Calin
escu
, Efs
tath
iou,
Sch
irn, &
Ber
mej
o, 1
998
Calv
ano
& Jo
hn, 2
004
Cam
pbel
l, 19
88
Casti
, 197
9
Chu,
Str
and
& F
jella
nd, 2
003
Cillie
rs, 1
998
Erdi
, 200
8
Gem
unde
n &
Hau
schi
ldt,
1985
Kosn
ik, 1
990
Lloyd
, 200
1
Lova
sz, 1
996
McC
abe,
197
6
Mire
l, 20
04
Mor
in, 2
008
Poel
s & D
eden
e, 2
000
Rang
anat
han
& R
. H. C
ampb
ell,
2007
Ren,
200
3
Shea
rd &
Mos
tash
ari,
2009
Shub
ik, 1
996
Siva
dasa
n, E
fsta
thio
u, C
alin
escu
, & H
uatu
co, 2
006
Suh,
200
5
Trau
b an
d W
esch
ultz
, 199
8
Vida
l & M
arle
, 200
8
Wea
ver,
1948
Woo
dwar
d &
Hed
ley,
197
9
Count3.3.1 Adaptation X 13.3.2 Algorithmic Information X 13.3.3 Changes of State X 13.3.4 Chaotic Structure X X 23.3.5 Combinatorial Complexity X 13.3.6 Computational Resources X X 23.3.7 Detailed Static Structure X X X X X X X X 83.3.8 Diffi culty to Represent X X 23.3.9 Diversity of Entities X X X X X X 6
3.3.10 Dynamic Structure X X X X 43.3.11 Emergent Behavior X X 23.3.12 Entity Sharing 03.3.13 Environmental Changes X 13.3.14 Feedback X X 23.3.15 Funding X X 23.3.16 Hierarchy of Structure X 13.3.17 Impact to Context X X 23.3.18 Input Sensitivity X X 23.3.19 Interactions of Entities X X X X X X X X X X X X X 133.3.20 Knowledge of a System X 13.3.21 Large Number of "Entities" X X X X X X X X X X X 113.3.22 Meeting System Requirement X 13.3.23 Nature of Prescribed Task X 13.3.24 Nature of Solution X X 23.3.25 Non-Deterministic Behavior X 13.3.26 Number of Alternative X 13.3.27 Number of Requirements X 13.3.28 Organizational Setting X X 23.3.29 Periodic Complexity X 13.3.30 Political Setting X X 23.3.31 Priority X 13.3.32 Psychological X X X 33.3.33 Radical Openness X 13.3.34 Relationship to Context X X 23.3.35 Relevance X 13.3.36 Self-Organization X X 23.3.37 Social Roles and Relationships X 13.3.38 Statistical Uncertainty X X X 33.3.39 Storage Space X X 23.3.40 Time Frame X X X 33.3.41 Tools and Methods X X 23.3.42 Unnecessary X 13.3.43 User Capabilities X X 23.3.44 User Interaction X 1
Table 2. Mapping of Complexity Attributes by Author
No evaluation is made for redundancy, validity or accuracy at this stage. Table included to aid in attributing citations to authors. A count is provided to give reader a general feel of the frequency of concepts
in articles surveyed. Concepts made appearances across various disciplines and applications of problem, product and processes. Citations do not represent progenitor of ideas, nor is the list intended to be a
comprehensive review of an author’s position on complexity.
30
In order to begin a framework for complexity, it is important to evaluate the attributes of complexity
that have been identified, discussed and applied in the literature. Approximately 30 sources were
reviewed with topics ranging from biology, systems engineering, business, software engineering and
physics. No attempt was made to separate these attributes by topic area, as the goal is to locate common
themes across all disciplines. A large number of attributes (44) were identified in the review of the
articles and the table shown above is included to attribute concepts to the appropriate authors. This is
done to avoid awkward and bulky citations throughout the listings of attributes in subsequent sections.
Specific citations have been included where direct wordings, or examples, have been taken from the
author(s).
The following attributes will be listed by alphabetical order of their titles. Each section will define the
meaning of the title, provide a short explanation and give an example from a topic area. The examples are
not meant to be fully comprehensive, but instead provide a general idea to the reader of what is being
discussed. These attributes will appear in problem, process and product. Redundancies, inaccuracies and
interpretations are not performed in this section and will be addressed later in the paper. Instead “raw”
material is presented to help the reader understand how the framework was developed. It should be noted
that the concepts are not attributed to who created them, or first identified them, but who has used them in
efforts to define and use complexity.
3.3.1. Adaptation
A system may demonstrate complexity by means of behavior that is adaptive. Adaptive behavior in a
system is when either the system increases in specialization or changes in response to influences imposed
by neighboring elements. [Sheard and Mostashari, 2009]. An example of this would include the change
in strategy of a business due to new demands, the response of a biological system to newly introduced
factors or the behavior of humans to changing social situations.
31
3.3.2. Algorithmic Information
The algorithmic information of an entity relates to the total “incompressible” information present in that
entity[Shannon, 1948]. It is a measure of how much effort, or detail, it takes to represent something in its
most efficient form [Kolmogorov, 1965]. It is based on the concept of the inherent information of an
entity determined by the shortest possible method of representing it. Entities, especially software, that
contain more algorithmic information are considered more complex [Gemunden and Hauschildt, 1985].
As an example, the following string:
10101010101010101010101010101010101010101010101010101010101010101010101010101010101
0101010101010101010101010101010101010101010101010101010101010101010101010101010101010
10101010
Could also be represented as:
For i = 1 to 100
Print “10”
Next i
The algorithmic information present in the string would be better represented as the program, as
opposed to string of numbers. One could also say:
Repeat 10, 100 times
for an even more compact definition. The determination of algorithmic information depends on the
chosen language of communication.
3.3.3. Changes of State
Changes to the system state are a combinatorial result of the context (or environment), the nature of
structure itself (both dynamic and static) and a function of timeline. The intensity of this change is also
32
related to the nature of the context and the system itself, and dictates the level of complexity. Also, the
details required to describe this change of state varies, depending on requirements. Example: an ice cube
from 30º to 35º F experiences a more complex change of state than a cube of steel the same volume. It
may be sufficient to simply describe the change as “solid to liquid”, or a more clinical description may be
required to demonstrate a difference (or equivalence) in the system [Botta et al., 2006].
3.3.4. Chaotic Structure
If a system structure is chaotic then the number of parameters required to describe its internal behavior
increases dramatically. The level of this “chaos” determines how complex the task is [Brodu, 2009].
Example: A collection of marbles contained in a loose fitting bag, inside of someone’s pocket as they jog
down the street. The structure will be changing, within a defined boundary, but it will be difficult to
predict the exact location of any marble in the bag at a given time.
3.3.5. Combinatorial Complexity
Combinatorial complexity is created when, due to the number of functional requirements or other
physical phenomena, it becomes hard to find the best combination to meet the required design range.
Example: an airline scheduling problem, where as flights become delayed the future events are required
to change and further deviate from the specified plan [Suh, 2005].
3.3.6. Computational Resources
Computational resources refer to the amount of effort required to compute a given answer. It generally
refers to the processing capability of a computer, or set of computers, that are working on a problem. The
amount of computation resources required to implement a system, particularly a software system, is
considered a representation of the complexity [Lovasz, 1996]. There are several examples of this that
include, but are not limited to: computation time, memory, number of steps required, amount of storage
space.
33
3.3.7. Detailed Static Structure
The structural relationship of the parts increases the required parameters, linearly to the number of
dimensions required for description [Braha and Maimon, 1998; Woodward and Hedley, 1979]. Example:
Billiard balls in a perfect line requires a single x-axis per unit, billiard balls on a flat surface require both
x and y axes etc. In the field of software engineering this static structure can present itself by the number
of paths possible though the programmatic entity [McCabe, 1976; Ranganathan and R. H. Campbell,
2007]. It could relate to the components being put together in a complicated fashion, such as social
relationship. It can be represented by connective patterns as well [Casti, 1979]. Example: The cyclomatic
complexity of the number of possible paths in a software program.
3.3.8. Difficulty to Represent
These classes of complexity emerge in ways that require large amounts effort to relate information
about the system so that it can accurately be communicated. No example.
3.3.9. Diversity of “Entities”
Complexity of the system increases as the variation in entities increases. This adds an addition number
of parameters required to represent the system. Example: In the manufacturing world the number of
various types of components adds to complexity due to newly required sets of parameters to explain
attributes such as lead time, cycle time and lot size [Calinescu et al., 1998].
3.3.10. Dynamic Structure
As the structure of a system becomes more dynamic the required parameters of description grow,
increasing complexity. This is especially true if this description is a function itself of other parameters of
the entity. Example: A billiard table with ten balls, put into motion on a frictionless surface. Another
example would be where customer needs could not be well defined and requirements are moving.
34
3.3.11. Emergent Behavior
Emergent properties are those that cannot be predicted by simply understanding the behaviors of
portions, or entities, of the system. They can arise from the interaction of a multiplicity of more simple
behavior of sub-units of the system. Emergent behaviors can also arise from outside influences working
with a system to create patterns or behavior. Examples: Ripples in a sand dune, ice crystal formation,
temperature, even corporate policies and structures [Sheard and Mostashari, 2009].
3.3.12. “Entity” Sharing
A way that systems manifest contextual behavior is by containing “entities” that are shared with other
systems. This can also occur, if due to context, if the system under investigation is itself a shared entity
between two other systems [Chu et al., 2003]. This indicates that the system has more than one purpose,
many purposes or singular purpose for multiple users.
3.3.13. Environmental Changes
If a system is required to meet all, or some, of its functional requirements over environmental changes it
will increase in complexity. This is due both to the rate and range in which the environmental changes
take place. An example of this is the manufacturing world where the manufacturing system is constantly
changing [Calinescu et al., 1998].
3.3.14. Feedback
Feedback behavior will add complexity to the system. A system with this property will use its output
state as an input and new behavior will develop. This changes the level to which the behavior can be
predicted. An example of this is the stock market.
3.3.15. Funding
It is a description of the effort involved to create, or use, the system. This has been presented as a
measure of complexity [Traub and Werschulz, 1998]. That is, tasks that require more money are more
35
complex. Example: Development of a missile. More complex missiles will require more funding to
develop, even if both programs are run correctly.
3.3.16. Hierarchy of Structure
The nature and methods that the hierarchies are all interrelated together, which dictates the separation of
structure and facilitates the separation of consequences [Casti, 1979]. Example: a toy that requires 100
parts placed together at the same time, or one that has 10 sub-assemblies each with 10 parts.
3.3.17. Impact to Context
The degree to which the operation of system changes the environment around it can increase impact.
The amount of change to “precedence” can increase the complexity of the task as well [Gemunden and
Hauschildt, 1985]. Example: Presenting a new scientific theory, such as the earth revolving around the
sun, can be complex when performed in an environment that assumes the earth is the center of rotation.
There is added complexity to overcoming preconceived ideas.
3.3.18. Input Sensitivity
Systems with high sensitivity to small inputs are higher in complexity. That is, as small local changes
take place, the level to how they impact the entire system will increase as complexity increases. Example:
Changing the oil of a car is of less complexity than changing out the engine. This is due to (among other
factors) the overall level of impact from that component to the system.
3.3.19. Interactions of “Entities”
Interactions between entities again increases the number of parameters required to represent the system.
As the number of the interactions increase the system becomes more difficult to represent [Cilliers, 1998;
Poels and Dedene, 2000]. Example: The heavenly bodies of the solar system. Even at long distance the
gravitational forces must be considered to represent even first order motion. In business this can be
represented by the information that must flow between individuals on a task [Calinescu et al., 1998]. It
can be the degree of communication between people that is required [Gemunden and Hauschildt, 1985].
36
3.3.20. Knowledge of a System
The amount of previous knowledge about a system increases its effective complexity. This complexity
can be considered “imaginary” if it arises to a lack of knowledge regarding the functional requirements
and the manner in which they must be met. Example: Putting together a child’s toy for the first time [Suh,
2005]. This is separate from the perceived (physiological based) complexity of the user.
3.3.21. Large number of “Entities”
The complexity due to a large number of entities increases the parameters associated with its
description. If each item has at minimum one parameter associated with it (e.g. a name designation) then
it will by nature of its presence in the system increase complexity. Example: describing a large number of
billiard balls on a pool table. In other contexts this can be represented by the amount of information that
can be gathered, or number of variables that goes into a calculation. Example: Calculating the price of
wheat, as a function of the sheer number of variables that would have to be collected, would be a complex
task [Weaver, 1948]. In business settings this can be represented by the number of people involved. This
can even be represented by the breadth of domains a business decision will impact. Finally, the amount of
information, and its depth, gathered can impact the level of complexity [Calinescu et al., 1998].
3.3.22. Meeting System Requirements
Failure to meet system requirements can be a manifestation of complexity. This manifestation of
complexity is due to the inability to meet a specified range of performance for a task. The example would
be a machine that cuts lengths of rod. If the machine has a distribution that is larger, or shifted, from the
desired performance range, then the task of fixing it would have complexity associated with it. The level
of complexity would be directly related to the deviation from the intended range of performance. Suh
refers to this as time independent “Real” complexity [Suh, 2005].
37
3.3.23. Nature of the Prescribed Task
The nature of the task involved with a problem, or system, will dictate its level of complexity [Shubik,
1996]. Rules that are simple can still manifest complex behavior. An example would be the Mandelbrot
fractal. Interaction with this entity will change in complexity due to that task. It may be easy to describe
in mathematical language, relatively easy to transmit in today’s email climate but more difficult to redraw
by hand.
3.3.24. Nature of Solution
The nature of a required solution to a systems challenge is dependent on the fundamental requirements,
the tools and methods that are available, the amount of information [Gemunden and Hauschildt, 1985] the
organizational setting, the comprehensiveness required from the solution [Calinescu et al., 1998] etc.
Example: Stranded on a desert island, in need of a fire, with a group of other people desiring to be
rescued. The only source of flame is the groups last signal flare.
3.3.25. Non-Deterministic Behavior
A system may display behavior that is non-determinate, meaning it cannot be predicted, as is chaotic. It
represents a lack of ability to measure the response of a system to a specified input. Example: Imagine a
telephone that has no labels on the buttons, and whose identity of each number changes at random.
3.3.26. Number of Alternatives
The number of alternatives available to the system as a solution will impact the overall complexity of
determining the best option. Example: A business decision with 3 alternatives is not as complex as one
that has 10 viable alternatives, and the task of determining the “best” against any metric will be easier.
3.3.27. Number of Functional Requirements
The number of functional requirements is proposed as a direct link to the complexity of a product,
problem or task [D. J. Campbell, 1988]. The larger the number of requirements that simultaneously must
38
be met affects how complex a system is. Example: The more functional requirements a car must perform
the more complex it has become.
3.3.28. Organizational Setting
The organizational setting, its nature and requirements to operate in, can impact the level of complexity
of a task of system. The cultural organization structures contribute to this [Mirel, 2004]. Example:
Performing tasks can be more complex if more training is required by the organization.
3.3.29. Periodic Complexity
Periodic complexity arises due to time-variant changes to the system that may cause it to oscillate
outside of the design range. Example: Again, the airline scheduling problem, but this time instead with a
snowstorm that causes a delay, but the schedule resets the following morning [Suh, 2005].
3.3.30. Political Setting
The political setting may impact the level of complexity of a task or system operation. Required skills
of diplomacy to make alliances fall into this category [Kosnik, 1990].
3.3.31. Priority
Priority is an aspect of complexity [Calinescu et al., 1998]. Priority is a multi-variable aspect of
complexity as it can be due to several manifestations and are by their nature dynamic. Example:
Manufacturing systems demonstrate this principle at its extreme combining elements, requirements,
psychological, change to inputs etc.
Priority will change as a function of understanding of the customer, the environment, maturity of the
system and the identities of the stakeholders [Botta and A. T. Bahill, 2007].
3.3.32. Psychological
There is a component of complexity that relates to the psychological state of mind of the user. This
means that it may “feel” complex to a user, despite objective measures or other opinions that are in
39
disagreement. This can be thought of as a persona measure of “perceived structure” on the part of a user
[Birkhoff, 1933]. This can be called cognitive complexity [Erdi, 2008]. Example: Two people may look at
the same problem and perceive a different level of complexity due to issues outside of simply personal
knowledge and experience.
3.3.33. Radical Openess
Radically open systems are those that cannot be predicted, in terms of behavior, until all variable are
known and modeled on the systems [Chu et al., 2003]. This can result in complexity, as the system size,
functional requirements, constraints etc. can begin to work against one another in terms of achieving a
total system solution.
3.3.34. Relationship to Context
The amount of complexity relates to the context of the system [Vidal and Marle, 2008]. This is
inclusive of the environment and its demands. No example.
3.3.35. Relevance
The relevance of a system to issues on interest can increase or decrease the complexity. Example:
Attempting to solve a business problem that is not relevant to the current challenges will be more
complex to solve.
3.3.36. Self-Organization
Complex systems can demonstrate self-organization. Self organization exists when one or more
attributes create the following four mechanisms: [Bonabeau et al., 1999]
1. Positive feedback
2. Negative Feedback
3. Balance of exploration and exploitation
4. Multiple Interactions
40
Example: Crystallization, or crystal growth
3.3.37. Social Roles and Relationships
Social roles and the nature of relationships can increase the complexity of a task. Example: Solving a
problem while working with one’s boss may become more complex due to needing to observe appropriate
social roles while doing so.
3.3.38. Statistical Uncertainty
A system’s behavior may not be able to be predicted by using its past actions as a guide line. The
degree to which past information is useful contributes to system complexity. Example: Flipping a coin
multiple times, or the probability of cards being played in Blackjack have differing levels that past system
information can be used to predict future performance. Therefore, they have differing level of statistical
uncertainty (or certainty).
3.3.39. Storage Space
The amount of computation resources required to implement a system, particularly a software system,
represent the complexity of the system. Example: Requiring 4 terabytes of data as opposed to 4 kilobytes.
3.3.40. Time Frame
The amount of time allowed, or not allowed, for a solution can impact the level of complexity for the
system. Example: in the commercial product world would be the trend for reduced development cycles
[Kosnik, 1990].
3.3.41. Tools or Methods
The decision making process itself can make an impact on complexity in the manufacturing or business
worlds [Calinescu et al., 1998]. The limit of the tools, method and knowledge contributes to this
complexity. Example: When the market cannot predict when technology will become available [Kosnik,
1990].
41

3.3.42. Unnecessary
Complexity can sometimes be not required, or inherent in the system, but is manufactured by the user
or customer. This can result from using a solution that is too complex or mismatched by the solution.
Example: Using more sophisticated math methods to perform basic tasks.
3.3.43. User Capabilities
The level of a system’s complexity is determined by the cognitive abilities, knowledge, perception,
motivations, incentives and general skills of the user. Example: A new systems engineer may find the
process more challenging than a seasoned one.
3.3.44. User Interaction
A system and its associated complexity can be increased, or decreased, depending on its interaction
with a user. Walking through a door with a round doorknob will be of greater complexity for someone
who has an amputated set of hands. However, both users would be able to interact with an automatic
door.
42
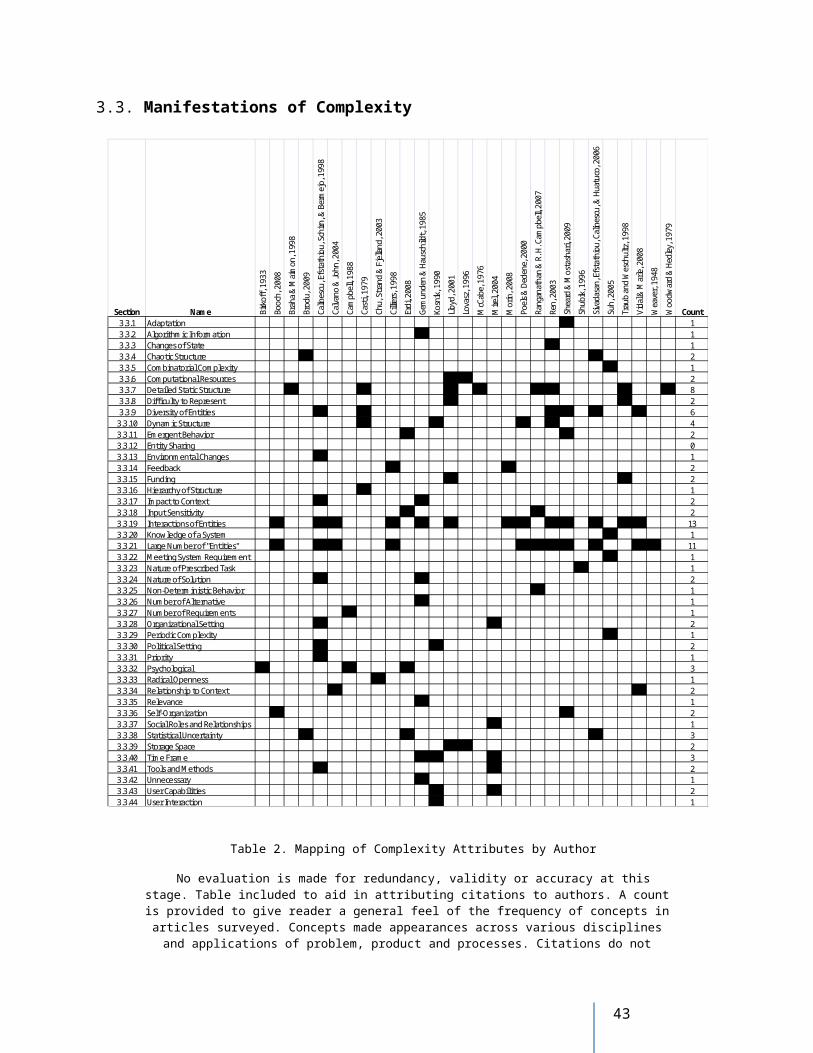
4. COMPLEXITY TAXONOMY
Having determined various attributes of complexity, a taxonomy will now be suggested. The purpose
of this taxonomy is to arrange sources of complexity by details that are common. Figure 4 shows the
general structure, with an example.
Figure 4. Complexity Taxonomy
This arrangement attempts to perform the function of all taxonomies, namely the arrangement of subjects by attribute. The attempted goal by the author is to order the topics such that each “child” topic has the same
attributes (properties, behaviors, constraints) as the adult category, plus one attribute.
4.1. Definition of Complexity Classes
An attempt will now be made to develop classes, and subsequent ranking, of the various attributes of
complexity. This will be performed by looking at the definition of each attribute and attempting to find
common denominators among them. It is not assumed that each attribute is at the same level of hierarchy.
Instead, some serve as class titles, others may well be several levels down in the taxonomy. However, the
goal is to have all attributes accounted for in some fashion at the completion of the taxonomy. The term
"class" in this application is not meant to indicate the same entity as described in the Unified Modeling
Language. Although, such an exploration could be interesting, and useful.
43
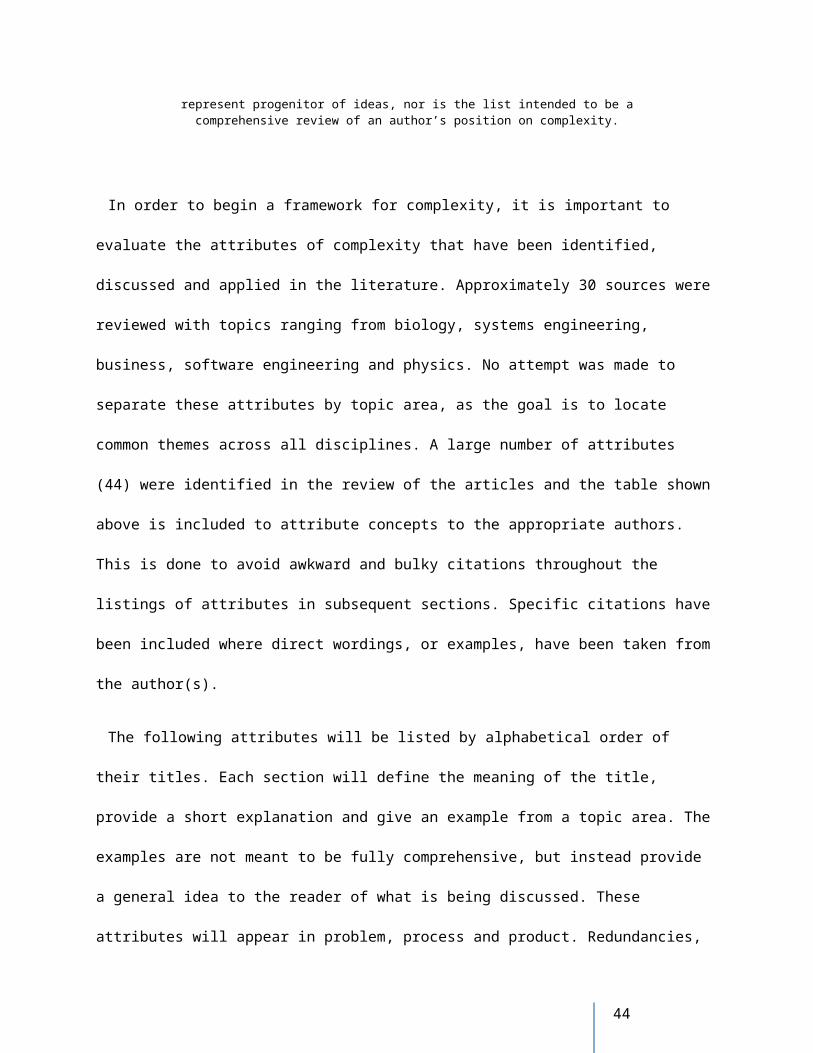
4.1.1. Character
By character we are referring to the response of a system, either internally or externally, to stimulus
(input). This is related to the difficulty of predicting the response of a system, or being able to
characterize its behavior quantifiably.
The subclasses to character will include:
Emergent: Referring to system properties that are the result of more than the sum of its parts,
meaning that system properties cannot be allocated to any particular sub-system or component.
It is broken down into four degrees, with each representing a higher level of complexity.
[Fromm, 2005] These include:
o Simple Intentional / Nominal Emergence (e.g. program code, simple feedback,
thermodynamic properties etc.)
o Weak Emergence (e.g. flocking behavior, bubbles and crashes in stock markets)
o Multiple Emergence & Feedback (e.g. stripes and spots on animals)
o Strong Emergence (e.g. Self-Organization)
Adaptive: Adaptive character in a system is change that is a response to “pressures” imposed by
neighboring elements. Specifically, changes that involve increased specialization or capabilities
[Sheard and Mostashari, 2009] including:
o Behavior: Change in output of system to given input
o Use: Change of implementation of sub-system for given purpose
o Structure: Change to arrangement of sub-system component and interrelationships
Consistent: Issues in this sub-class relate to how much past information collected about the
system can be used to predict future behavior. It includes three increasing degrees:
o Deterministic: Output of a system is repeatable for a given input
44
o Statistical: Collected information can be used to determine output response of system to
within a given level of certainty
o Non-Deterministic: System behavior is chaotic and cannot be predicted
4.1.2. Description
Description refers to the ability to relate attributes of the system. It is considered orthogonally from the
“character” of the system which relates to response of an input. This class refers specifically to inherent
properties of the system that are required to relate what it consists of. It has the following sub-classes:
Cells: The items that make up the system. There are two types of complexity present in this
sub-class
o Number: The overall amount of cells that make up the system. Dictated by system
structure, the nature of the problem and the appropriate scale. (e.g. variables, sub-
systems, people, units , amount of information etc.)
o Diversity: The amount of variation in the overall number of items. Again, this level of
important variation is dictated by the nature of the problem/solution and the scale
required (e.g. varying details of people such as height, weight etc.)
Structure: The relational configuration of cells in a system. Sub types include relationships and
nature.
o Relationships: Manner in which the cells are organized. It represents the actual number
of connections between the cells themselves. It increasing levels of complexity are
Non-Connected (none to none)
Hierarchy (one to many)
Network (many to many)
In addition, these relationships may have another “axis” of complexity to them. That is,
they may have additional complexity due to how they vary over time. This complexity
is described, increasingly, as”
45
Static (fixed over time)
Dynamic (moving with time, but in a manner that can be quantified)
Chaotic (moving in a manner that cannot be quantified
Interaction: The amount of effect two cells of a system have upon each other. There are two
categories
o Transmission: The movement of information back and forth between cells of a system.
(e.g. software variables passed from one location to another, people talking)
o Physical: The physical interaction of entities (e.g. fundamental interaction of physics,
physical lattice structure etc.)
4.1.3. Setting
Setting refers to the set of conditions that the system operates (or is developed) in. This will be
considered separately from the use or interaction of the system. These include:
Social: Settings related to the involvement of people in the development/operation of any
system.
o Roles and Relationships: Similar to the relationship structure of the system, but applied
to humans involved in the system. It deals with allocation of people by function
o Political: Relationships involving authority and power
o Intellectual: The amount of available knowledge present in the setting of the system.
Can also include previously discovered methodologies.
Physical:
o Conditions: The physical attributes that the system operates in. They can be static or
dynamic, and refer to attributes of the setting that impact the functioning/development
of the system.
46
It should be noted that all of these components, like the structural relationships, can have a strong time
component. This means their complexity can also be increased as they move from static to dynamic, or
perhaps even chaotic.
4.1.4. Interface
Interface complexity addresses issues that arise from the interaction with, or use of, the system. The
interface can be with that of another system, or of a user/stakeholder. Unlike setting, which is a one way
communication (from setting to system), interfaces are two-way paths between the systems of concern.
User: Complexity created by the interfacing with human user/actors
o Experiential: Level of experience in interfacing with system
o Physiological: Physical levels of performance as they relate to the user.
o Psychological: Mental levels of performance as they relate to the user. Includes:
Perceptional
Cognitional
Motivational
Emotional
Players: Complexity of interfacing with other systems present.
o Sharing: The existence of a cell, or cells, of a system that are cells of other systems,
resulting in sharing between them.
o Communication: the movement of information between the primary system and other
systems present.
o Impact: The amount of change a system creates to its environment that affects itself or
other systems.
47
4.2. Possible Questions and Concerns with Taxonomy
4.2.1. The Meaning of the Taxonomy
Ideally the taxonomy would allow for accurate descriptive power in discussions surrounding
complexity. As one source of disagreement on any topic is the definition of terms, it is hoped that the
current suggestion of order would allow for a common language. This is for both singular and multiple
sources of system complexity.
For example, a system may have complexity due to the experience of the person attempting to interact
with it. This could be described as:
Complexity due to experience (type) of the user (sub-class) details in relation to the interface (class) of
the system.
For sources that include both sub-type and type, the expression would be:
Complexity due to the network (sub-type) relationship (type) of the structure (sub-class) details in
relation to the description (class) of the system.
The intended goal is that each formation of complexity would have its own descriptive sentence and
meaning, which would have orthogonal meaning to every other expression of complexity. It is
acknowledged that this structure will be plagued with the same debates as others that have been
developed (names of ranks, definitions of criteria, etc.), but it will provide the advantages of both clarity
and stability for the topic of discussion.
4.2.2. Excluded Attributes
Several of the attributes discussed in the literature review have not been included in the classification. A
list of these follows:
Changes of State
48
Combinatorial Complexity
Input Sensitivity
Nature of Prescribed Task
Nature of Solution
Number of Alternatives
Periodic Complexity
Priority
Radical Openness
Relevance
Unnecessary
These attributes have been excluded for the following three reasons:
Descriptive of Other Properties: Some of the attributes found in the literature deal with concepts
closely related to complexity, but are not the same. For an example of this we can consider the attribute of
“relevance”. How much something appears to be relevant to a problem may indeed relate to aspects in the
structure, but not necessarily. Relevance speaks more to how pertinent a system is to a given issue. This is
either a totally subjective evaluation, outside of the structure, or it is related to requirements which will be
discussed later.
In addition, and most likely the most controversial, is the exclusion of measures relating to available
resources and tools. This means that the taxonomy regards measures of money, space, time, steps etc to
be improper indicators of complexity. It is recognized that this is a departure from established
nomenclature, and will be addressed in section 5.
Also included in this category are “nature of the solution”, “unnecessary”, “priority” and “nature of the
prescribed task”.
49
Descriptive of Multiple Components of the Current Taxonomy: Due to the diversity of the topic of
complexity, several terms have emerged as useful in certain contexts. It is argued that these terms are
actually representative of combinations of complexity sources. Since these combinations are common
they have been given specialized names. There is nothing incorrect about them, or their usage, just that
they express multiple concepts simultaneously.
For an example the concept of “input sensitivity” can be considered. Input sensitivity was an attribute
used to describe the effect of the system to an input, and its consequences. It is suggested that this is the
combination of two aspects of the complexity taxonomy, namely the relationships of the structure of a
system and the level of a response in its character.
Also included in this category are: changes of state, combinatorial complexity and radical openness.
Redundant Description: The description of the complexity attribute is concurrent with another equal
(or more comprehensive) area of the taxonomy. For example, the number of alternatives is represented by
the concept of cells in the structure. In this case, where a business decision can be thought of as a system,
each option can represent another sub-system or cell that has to be described accurately.
Attributes of these types are perfectly acceptable, but are manifestations of specialized language arising
from a particular field and not new concepts themselves. Periodic complexity is also considered to be in
this category as it is describing the dynamic nature of structural aspects of the system.
50
5. TESTING THE TAXONOMY
In order to determine the accuracy of the taxonomy it will be compared against the current
philosophies, definitions and measures of complexity today. In addition, a series of examples will be
investigated to test its applicability and usefulness to current problems.
5.1. Against Philosophies
The taxonomy immediately fails the test put forth by John Horgan for the usefulness of the topic. It
does not appear to provide any new laws or set of principles that would allow for application of the topic.
It also does not assist in the quantification of complexity. Instead it provides a unifying framework for the
discussion of the topic to determine if the previously discussed goals can be achieved. In this sense it does
not resolve the philosophical concerns expressed by Horgan as to what is required to make the topic more
valid.
However, it does demonstrate almost every other philosophical expression found in the literature review
section. For example, the demonstration of general terms for sources of complexity would seem to
support the notion that it is inherent to all things. The level of complexity is certainly not discrete, or
digital, but increases as the strength of each category does. Umphrey’s assertion that even a shade of blue
is complex can be understood in light of the psychological components of complexity, in addition with its
ability to be described. This same physiological influence would appear to explain why people feel their
jobs become more complex as the details of the setting increases, along with rules which guide required
interactions of proper interface.
The development of the taxonomy itself would seem to support Kauffman’s assertion that
understanding of complexity is attainable. Even if the current scheme is completely rejected and thrown
out, it demonstrates that the level knowledge collected on the topic has become large enough that a proper
structure could be developed, proposed and accepted.
51
As far as the other philosophical questions regarding the usefulness of complexity, this will be
demonstrated (or not) in the following sections.
5.1.1. Complexity Versus Difficulty
One philosophical question that should be addressed relates to the difference between difficulty and
complexity. A common debate is whether or not they are in fact the same quality of a system. It has been
proposed that these two are in fact different concepts [Sousa, 2006]. A separation was discovered in
studies relating to how the functioning of the mind and the learning styles of individuals.
Figure 5. Bloom's Taxonomy of Learning
Each level of learning requires an increase in the complexity required by the student to attain it. By “complexity” Sousa is referring to the level of sophistication the thought requires. This is different from the
level of effort, referred to as difficulty, which is required by a task. The difficulty related to a task can increase to an infinite level, but never move up in complexity. Adapted from Sousa, 2006
In this study it was found that complexity related to the brain’s required thought process, where as
difficulty refers to the amount of effort required. The example used is that of reciting state capitals. To
perform this act requires the act of remembering (semantic recall) the information. However, if one is
52
required to remember the state capitals and their size of population the task becomes more difficult. The
type of process involved by the brain is the same, but just for a larger group of information. This means
that a task that is at a fixed level of complexity can grow in terms of difficulty. This is similar to the
concept of logical depth.
Bloom’s taxonomy for learning objectives [Bloom et al., 1956], which has gained wide acceptance in
the education system, puts even more clarity around the subject. In this description there are six levels of
learning, each increasing in complexity and having their own depth of difficulty. The figure below
demonstrates this.
The six levels (listed in decreasing complexity) are described here briefly to create a frame of reference
for further discussion. They are:
Evaluation: The ability to present and defend ideas in the face of evidence and criteria.
Synthesis: Using information to create new combinations of elements, relationships and
organization.
Analysis: Being able to break down information to understand elements, relationships and
principles.
Application: Solving problems or challenges with the use of information in a new way
previously not presented.
Comprehension: Being able to organize ideas and concepts, providing translations and
interpretations.
Knowledge: Exhibiting the details of previously acquired information. Being able to recall facts
figures, details, aspects etc.
This taxonomy provides a method by which the complexity taxonomy can be analyzed from a
philosophical level. If an element is required to pursue acts of knowledge, comprehension etc. it can be
53
said to deal with the complexity of the task. A review reveals that most sources do indeed pass this test.
The only glaring exception would be that of the resources available in the setting.
The issues addressed by the taxonomy, as they relate to resources, would appear to be more related to
the difficulty of the system and not its complexity. This would seem to be confirmed in other case studies
performed for engineering designs [Moody et al., 1997]. In these studies the complexity of knowledge
required for the system was one of several contributors to the overall “hardness” of the task.
For the purposes of this paper, resources will be considered as contributors to difficulty, and not to
complexity. The application of this will be shown in section 6.
5.1.2. Complexity Verses Complicated
The word “complicated” has different definitions, especially when taking into account differences due
to parts of speech [2009b].
As an adjective it can mean:
1. Consisting of parts intricately combined
2. Difficult to analyze, understand, or explain
In its transitive verb form “complicate” it can mean:
1. To combine especially in an involved or inextricable manner
2. To make complex or difficult
3. To cause to be more complex or severe
When compared against the taxonomic framework, and the difference already established between
complexity and difficulty, it is clear why confusion exists. Depending on which definition chosen one
could be saying that complicated is equivalent with complexity, an aspect (or component) of complexity
or finally, the net result of an increase in both complexity and difficulty.
54

In order to avoid word redundancy, and increase specificity, the first definition will be chosen as the
most appropriate. That is to say, complication is the increase of elements and their interactions in the
system. In the nomenclature of the taxonomy, this would be expressed as:
Complication: An increase of complexity related to the cells, structures and interactions (sub-classes)
involved in the description (class) of a system.
5.1.3. Complexity Verses Requirements
So far the topic of requirements has not been adequately addressed. The exact role of requirements as it
relates to system complexity is not clear. It has been suggested that the number of requirements increases
complexity of the system, acting as a number of elements in the system [Bjorn Regnell et al., 2008]. It
has also been suggested that complexity is a relative measure of the ability to achieve a given requirement
[Suh, 2005].
The particular challenge to requirements is that they represent both a system, and a solution. Any
system will be driven by a collection of requirements. These requirements can themselves be thought of
as a system. Interestingly, as the complexity of this system of requirements changes, it will have impact
on the required complexity of the solution.
As an example, we can consider a requirements management system (e.g. DOORS). The number of
requirements being managed, the details involved and their level of interaction will dictate the
complexity required by the program. However, the functional requirement of the system is to “manage
requirements”. This is where the limitations of language, and multiple uses of words, can begin to cause
confusion.
In order to reduce this confusion we will revisit some system engineering concepts already discussed in
the paper. The first is the definition of a requirement:
55
• Requirement: a statement that identifies a capability or function that is needed by a system in
order to satisfy its customer’s needs. A functional requirement defines what, how well and under
what conditions one or more inputs must be converted into one or more outputs at the boundary
in question in order to satisfy the customer’s needs.
Secondly, it must be kept in mind that there is a difference between the output product, and the process
used to attain it [Abadi and A. T. Bahill, 2003]. Effort must be put forth to determine if the requirements
for the system are complex, or if the system solution itself is complex.
In order to create an accessible example we will discuss the product of an automobile, and its associated
product requirements. The automobile will have three types of requirements:
1. Functional Requirements: Also referred to as capabilities. For this example we will choose: The
system shall have the capability to come to a complete stop, when travelling at 60 miles per
hour, in no greater than 100 feet.
2. Non-Functional Requirement: Also called “-ilities” In this case: The system shall meet all
safety requirements as defined by document XYZ123.1.2.3.
3. Constraint: The system shall cost no more than $15,000
Looking at the example of a functional requirement it is clear that no individual component of the
system meets this requirement, but that it is the function of all of them working together. This is very
similar to the definition of “emergent” properties in the taxonomy. However, one might ask under what
conditions the auto would have to perform this feat. Is it raining, snowing or a clear day? What is the
temperature and what is the incline of the surface? Very quickly more requirements have been discovered
as the system is attempted to be understood. Now, issues of setting would have to be described.
For the non-function requirement of safety we again consider the setting the system is operating in, but
instead we are look at social, not physical, details. As another example, maintainability could be
56
considered. This could be thought of the amount of interaction with another system that is required to
keep in operation.
Finally, when considering constraints we are almost always discussing resources, and how they relate to
the system. As discussed before, resources relate to the difficulty of a task, not its complexity.
From a logical point of view, it would make sense that requirements, when properly expressed will
prescribe both the complexity and difficulty of creating a system. This could explain a number of
conditions. Two systems can meet the exact same set of requirements, but have differing levels of both
complexity and difficulty. It is proposed that systems with larger complexity/difficulty are due to either
added (non-customer based) requirements or artificial limitations in resources.
5.1.4. A Rock
Conversely, it is notable that the addition of requirements will not always add to complexity. A
requirement could exist as follows:
The system shall be able to be thrown by the average human
The first solution that comes to mind is a rock. This can easily be acquired and delivered to the
customer in record time and a small fee. The addition of more detailed requirements could appear to make
the solution harder (i.e. more complex and difficult):
The system shall have an aerodynamic shape that will support aerodynamic flight accurate to 1
foot at a distance of 10 feet.
The system shall weigh no more than 5 lbs.
The system shall weigh no less than 1 lb
The system shall have a surface hardness of 3 or greater on the Mohs scale.
These requirements limit the types of stones that are allowable, but the complexity of the system
remains the same. Additional requirements could be added. For instance the Mohs number required could
57
be 8 or greater. In addition, the system cost could be required to be less than $10. This would make the
system very difficult to develop, as there are few one pound sapphires, rubies and diamonds that can be
located for less than $10. But, it would not increase the complexity of the solution.
However, it is possible that required complexity did increase after all. If we consider the nature of the
internal structure to a diamond (or other gemstone) we would find that the details of the structure are
more involved. By the definition of the taxonomy this would be an increase in complexity. Yet, there was
nothing inherent in the requirement that indicated a required increase of complexity to the solution.
Indeed, it is the role of the system engineer to determine this fact, feed it back to the customer, and
modify requirements based on a balance of desired complexity and available resources.
5.1.5. Integrating the Concepts
Hard / DifficultDriven by Resources and Complexity
ResourcesGenerally RelatedTo Constraints and
Resources
Sources Include:•Time•Money•Space•Material
ComplexityGenerally Related to
Function & Non-functional Requirements
Sources Include:•Interfaces•Character•Setting
•Description
Figure 6. Possible Structure of Concepts
A proposed structure of how hard, difficult, resources and complex are related. Not shown on the diagram is “complicated” which is considered to be equivalent with increases of complexity to the description of the system. Note that “effort” as discussed in the previous sections can manifest in several forms, such as those shown on the diagram. Other possible forms of effort are calories burned, amount of thought and number of
steps.
58

Having discussed all of these concepts, an integrated framework will now be developed. For the
purposes of discussion, resources have been broken out from the previously established taxonomy to
separate its impact. The word “hard” was chosen to describe the overall problem context due to
precedence of the word to describe both aspects.
Figure 7. Components of Hardness
For the purposes of this paper it is assumed that there are two aspects of what makes a thing "hard". One is the challenge due to resources, the other is the challenge due to complexity. The two can be considered as
components to the overall vector.
5.2. Against Definitions
The level to which the proposed structure agrees with the current definitions of complexity will be an
indication of its validity. This is based on the assumption that all previous definitions of complexity,
when taken into account for context, are correct.
59
Figure 8. Mapping of Definitions, Concepts and the Taxonomy
All aspects presented in the definitions found in the literature are present in the taxonomy, with the exception of those relating to requirements. In this framework requirements are not considered to be a source
of complexity but instead an issue that may relate to it depending on the problem and its implemented solution. It should be noted that each definition had attributes correctly considered part of complexity, but no
definition contained them all.
By inspection of the relationship diagram shown in Figure 8, it is again demonstrated that the current
framework does not align with the definitions of Suh and Sividasan et. al. This is not surprising given that
these attributes were excluded from the taxonomy, but it could be an indication of a flaw in the
formulation.
Having determined which components of previous definitions map into the proposed structure, it then
becomes interesting to ask if it can assist in determining a good definition for the topic. The challenge of
any definition is to use terms that have a universally agreed upon meaning in the description. By taking
the classes of character, description, setting and interface a suggested definition would be:
60

Complexity: A quality of systems that are characterized by an inability to be comprehended; where the
difficulties in comprehension manifest from failure to describe the system, its behavior, its response to a
setting of operation and its interfacing with other systems.
5.3. Against Measures
In this section the taxonomy will be compared to measures of complexity that are already established an
in use. In addition the application of these measures to the systems process, as represented by SIMILAR,
will be mapped. Finally, using the two mappings of the measures as a link, a relationship will be
developed between the systems engineering process and the complexity taxonomy. This will be done to
determine if recurring themes of complexity sources manifest in the process of systems engineering.
The table is provided to summarize the types of measurement, with subject areas included for reference.
Long explanations of each measure have not been included, however for methods that are not recognized
standards more details have been included in 7.2.1.1.1.1.Appendix A:
The figure demonstrates that the majority of the measures of complexity relate to the description of the
system, and they are implemented in the SIMILAR process predominantly for system modeling and
assessing performance. The reason for this result could be due to the nature of measures chosen to
evaluate. It is also possible that further investigation of other measures would reveal the same tendency.
Measuring system components, and their interactions, would seem to be more quantifiable at its nature. It
would tend away from relative details and maintain absolutes instead. The use of these metrics to evaluate
performance could also be explained by a desire to reduce complexity, limiting the system to only its
required components, thereby avoiding unintended emergent behaviors and interactions with the setting.
61
Figure 9. Mapping the Taxonomy to SIMILAR
All measures map to tasks related to modeling the system or assessing performance. In addition, all but on relate to the complexity of a system due to its descriptive sub-classes. The exact reason of this is not clear,
and further investigation of other complexity measures would be useful. It is proposed that this complexity is the easiest to quantify not requiring on subjective measures. The relationship to assessing performance could be due to the assumption that reduced complexity will yield more efficient performance with less unexpected
sources of failure to meet requirements.
62
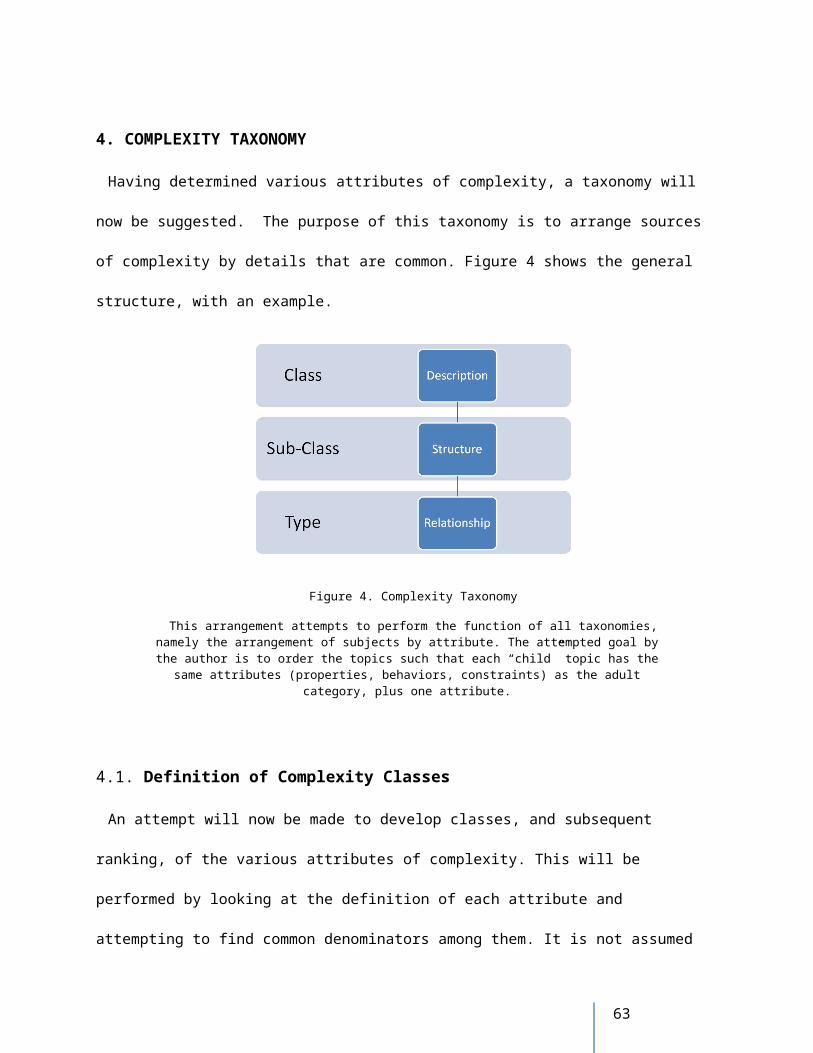
Source Subject Area Systems Activity Method
[Birkhoff, 1933] Arts System Modeling Number of sides to a shape
[McCabe, 1976] Software Total System Test Cyclomatic Complexity
[Phillips, 1985] Ecological Studies System Modeling Fractal D Coefficient
[Munson and Khoshgoftaar, 1992] Software Total System TestReliability Analysis 16 factors of a software program*
[Friston et al., 1995][Calinescu et al., 1998][Lambert et al., 2005][Sivadasan et al., 2006]
Brain ScienceManufacturingSystems EngineeringBusiness
System ModelingTotal System TestRisk Management
Entropy
[Tian and Zelkowitz, 1995][Booch, 2008] Software Total System Test Software Lines of Code (SLOC)
[Calinescu et al., 1998] Manufacturing System Modeling Myer and Foley Curley Method*
[Spiegelhalter et al., 2002] Modeling Total System Test Bayesian Measures
[Arteta and Giachetti, 2004] Business Risk Management Petri Nets
[Liou et al., 2010] Music System Modeling L-SystemTable 3. Measures Evaluated Against Taxonomy
Measures denoted by * are explained in Appendix A
63
6. APPLICATIONS
In this section the structures and taxonomy developed in the paper will be tested against various
examples. This is done in an attempt to demonstrate how the taxonomy distinguishes between, and
groups, classes of complexity problems.
6.1. Once Complex, Now Only Difficult [ The Atomic Bomb ]
For this example we will consider the manufacturing of an atomic bomb. In its years of operation the
development of the first atomic bombs would be considered both difficult and complex. That is, it
required a lot of effort and new levels of thought. At the time of its development both the product and the
process had these attributes.
Product
o Difficulty - The difficulty associated with the components of the atom bomb were low,
in general. The exception to this is the refined Plutonium required to create the bomb,
which at the time was in very short supply. In total, it could be considered as moderate.
o Complexity – At the time of its development, the interaction between the various
components was not completely understood. Although the theory of fission has been
confirmed as feasible, the properties of plutonium and uranium were still not
determined. This included the descriptive components (Cells, Structure, Interactions)
and the character of the substances (Consistent, Adaptive, Emergent). In addition,
various aspects of complexity relating to the class of interface were still being explored.
Finally the setting the bomb was being developed in, specifically relating to the
knowledge currently held, was very low. Overall, this value was very high.
Process
64
o Difficulty – By comparison the difficulty related to the process of creating the atom
bomb was very high. It required a large amount of time, money, space, facilities,
people etc.
o Complexity – At the time the complexity of the process was also very high. This is due
to the fact that it required a large number of cells (people) to coordinate and interact in
a highly integrated manner. The system that was performing the process also required
operation in a more detailed political setting. This social setting was impacted by the
war, causing it to be dynamic in its definition. Roles and relationships set up between
the United States and Germany further increased the complexity. This was of a high
value.
Today the levels of complexity and difficulty in making an atom bomb are much different. The
information on important component, details, interactions and instructions for assembly are readily
available. The work and history of the scientists involved is well documented, and diagrams are ever
present on the internet [Dorneanu, 2007]. In fact, all the details of an atom bomb are considered not to be
complex. In addition, almost all details of the atom bomb are not difficult in terms of resources. A typical
middle class worker could assemble enough resources to build it in a matter of years.
The only detail that prevents it is the acquisition of suitable grade fissionable material. This aspect of
the atom bomb has become extremely difficult due to efforts on the part of the world community both to
limit the amount and the accessibility of it to individuals. In fact, in light of the nature of this task, it
becomes evident why the establishment of watch dog agencies was important to global security. Their
decision, to limit the availability of weapons grade plutonium, is the single impact to driving up prices
outside the range of an average person.
65
Figure 10. The Difficulty and Complexity of the Atom Bomb
While once an extremely complex task, the building of an atom bomb today represents only a high level of difficulty.
It should be noted that the functional requirements for device performance, in general, have remained
the same for all periods of history. Yet due to other factors, mostly related to the acquiring of knowledge,
the overall complexity has been greatly reduced.
6.2. Once Complex, Always Complex [ Raising Children ]
One of the best examples of a persistently complex task is that of raising a child. The sources that drive
complexity in this system have always existed. Using the taxonomy, we can explore what requirements
on the process of raising a child drive both complexity and difficulty.
66
Figure 11. Difficulty and Complexity in Raising a Child
Raising a child addresses every area of complexity identified by the taxonomy. In addition, several aspects of task difficulty are addressed as well. As requirements (capability/constraints) are added to the system, both
difficulty and complexity increase.
When discussing what is meant by raising a child, no two parties completely agree. There are at least
two major sources of this. First, each child represents a completely different system (and system of
systems) so that inherent description and character are completely different. The sources of these
differences and the nature verses nurture augments will be ignored for the moment. It is sufficient to say
that they are different. Secondly, the requirements of what is meant by “raising” the child properly vary
from parent to parent. This would seem to make comparison between systems almost a futile effort.
Indeed, this may help demonstrate why the concept of quantitative complexity, that values the difference
in complexity from different system, completely impossible.
However, keeping the product and user constant, it should be possible to determine how the addition of
new requirements will increase the relative complexity of a system. We can start at the base requirement
of “the child shall function (live)”, and increase from there. If we assume the child’s body is functioning
to the point that it provides homeostasis; for life to continue the child requires resources of oxygen, food,
67
water, sleep, clothing, excretion, and shelter [Maslow, 1943]. At the most basic level these can be
provided in very small quantities. In addition, a child requires some form of touch and attachment with a
user (adult/parent) to continue in existence [Bowlby, 1951]. These then can be considered the basic
components of difficulty and complexity to raising a child.
However, as additional requirements are added to the process and product, the relative levels of
complexity and difficulty will increase. The table included below demonstrates this with examples. As
the specificity of requirements increases, more sources of “hardness” additively are introduced into the
system. It should be noted that only some of these sources are included in the table, as a comprehensive
list would be too large to address here.
This example would seem to indicate that all parents are, by the nature of their actions, attempting to
engage in a systems engineering role. That is, they are balancing out the needs of the customer
(themselves) against levels of complexity and difficulty. The role of parenting resources then becomes not
to tell a parent how to raise a child, but to present common sources of “hardness” in an effort to
demonstrate methods to reduce it.
Level Requirement Sources of Difficulty Sources of Complexity
ExistenceChild Continues to
Function (Live)Food, Water, Oxygen, Clothing,
Excretion, Shelter, SleepInterface: User, Physiological (Touch)
Security Properly Clothed Money, Materials, TimeSetting: Political, Roles & Relationships (What is considered
appropriate?)
Belonging Develop Friendships TimeInterface: Players, Sharing (Child is a shared entity with systems of
other requirements)
Esteem Be Educated Time, Money, MaterialsSetting: Child has a new set of roles, intellectual availability of
knowledge
Self-Actualization Learns to Play InstrumentProvide Instrument (rent/buy)
Provide Instruction ToolsInvestment of Time
Setting: Physical (New Environment), Social (Intellectual and roles)Interface: Players, Communication (must learn to interface with
form of instruction)Character: Emergent (must learn to care for instrument, play
instrument), Adaptation (must use body for new purpose)
MoralitySpecific Religious
WorldviewInvestment of time and materials
Character: Emergent (evaluating the world in a new way)Setting: Political (worldview may not be acceptable in the setting)
Table 4. Impact of Requirements on Raising a Child
As more sophisticated levels of requirements are added to the task of raising a child an increase in both difficulty and complexity is introduced. The table demonstrates just some of the additive sources of both.
68
The introduction of more children into the system has a multiplicative impact on both aspects, as it
represents the introduction of a new system. To explore this we will consider an example where the
second child is of the same sex, to remove difference present in the structure and requirements. We will
assume the exact set of capabilities are required of both. We will assume that the inherent health
requirements (due to structure) are the exact same. Even with these being held constant, the impact will
be:
Difficulty: The amount of resources required by the system will be equal to the first, assuming
the same standards of living and education are equal. Some resources will be able to be shared
(e.g. hand me down clothes) and others will be unique to the child (e.g. learning to play a
different instrument) but on average it will be assumed that difficulty will increase linearly to
the number of children added to the system.
Complexity: By definition, the child will differ in terms of structure from the previous child
(assuming they are not a clone). The child will also differ in character, due to a different
personality. The setting the child is raised in will be different, due to the time changing nature
of the world. The interface with players will be different due to the presence of all of the same
issues as the first. This would indicate that complexity increases (at least) multiplicatively with
the introduction of a new child.
This leads to interesting questions regarding the nature of large families. The introduction of required
resources is mandatory as family size grows. However, to keep both the difficulty and complexity
manageable do large families have to reduce overall requirements to achieve success? Does this change in
the amount of manageable requirements explain certain phenomena? For example, do aspects of “going
without” or “learning to share” come more naturally as a result of limiting resource driven difficulty? Do
children from families of more than one child demonstrate an increased tendency to limit requirements as
mitigation for complexity?
69
6.3. Reviewing Historical Engineering Tasks
Having developed a framework for complexity, and testing it against various measures, a more
comprehensive application will be attempted. In the previously cited work [Moody et al., 1997], 20
different historical tasks were evaluated for their resources and “design difficulty”. The authors broke
down these two major categories as follows:
Resources: The time , cost and infrastructure required to complete the task
Design Difficulty: The design type, the number of steps or pieces involved the complexity of
knowledge required, the quality requirements, the process design and the aggressive selling
price.
Resi
stor
Net
wor
ks
SIER
RA T
rain
Con
trol
lers
Bat C
hoos
er
Sche
dulin
g a
Pine
woo
d De
rby
Seco
nd O
pini
on
Amer
ican
Airl
ines
Sch
edul
ing
Inca
ndes
cent
Ligh
tbul
b
Apol
lo M
oon
Land
ing
Man
hatt
an P
roje
ct
Pola
ris P
rogr
am
Hubb
le S
pace
Tel
esco
pe
Supe
rcon
duct
ors
Boei
ng 7
77
Build
ing
a Ho
use
Cent
ral A
rizon
a Pr
ojec
t
Gre
at P
yram
id a
t Giz
a
Auto
mob
ile F
acto
ry
GM
Impa
ct
Batt
erie
s for
Ele
ctric
Veh
icle
s
C3PO
from
Sta
r War
s
Design DifficultyDesign Type 1 2 6 3 5 6 14 12 14 10 9 15 9 2 4 4 7 10 8 15Knowledge Complexity 1 2 5 2 6 4 5 7 10 7 7 10 6 1 2 4 4 7 6 10Steps 1 1 1 2 3 4 4 10 7 9 5 2 9 4 5 5 6 5 3 10Quality 1 1 3 2 5 2 2 9 6 9 2 3 8 3 2 10 5 3 2 6Process Design 1 1 1 1 3 2 4 2 2 2 3 2 4 1 1 1 5 2 4 4Aggressive Selling Price 1 1 2 1 2 1 4 1 1 3 1 1 4 3 1 1 5 3 4 3
Design Difficulty Total 6 8 18 11 24 19 33 41 40 40 27 33 40 14 15 25 32 30 27 48
ResourcesCost 1 1.5 2 2 2 3 5 15 14 14 6 2 12 12 12 15 9 7 3 2Time 1 1.5 3 2 8 5 3 9 5 7 10 2 7 3 9 10 7 4 10 2Infrastructure 1 1 2 1.5 3 5 2 10 7 8 5 4 8 6 6 9 6 4 4 3
Resources Total 3 4 7 5.5 13 13 10 34 26 29 21 8 27 21 27 34 22 15 17 7
Table 5. Original scores determined by Moody et. al,
The scoring shows the relationship between the various properties and divides projects in regions of high technological risk, or high political risk.
A comprehensive scoring system was developed for each of these categories, and the projects were
graphed. In this section these scores will be built upon, and integrated with the complexity framework, to
70
show a relationship between difficulty and complexity. The original scores given to each project are
shown in Table 5.
Clearly the segregation of categories was different for this evaluation of systems. Still, they are
certainly related, and their scores can still be used. Specifically, the categories of quality, process design,
aggressive selling price, cost, time and infrastructure all related to aspects that make a project difficult. By
grouping these together a new value for “difficulty” as defined by this paper can be found.Re
sist
or N
etw
orks
SIER
RA T
rain
Con
trol
lers
Bat C
hoos
er
Sche
dulin
g a
Pine
woo
d De
rby
Seco
nd O
pini
on
Amer
ican
Airl
ines
Sch
edul
ing
Inca
ndes
cent
Ligh
tbul
b
Apol
lo M
oon
Land
ing
Man
hatt
an P
roje
ct
Pola
ris P
rogr
am
Hubb
le S
pace
Tel
esco
pe
Supe
rcon
duct
ors
Boei
ng 7
77
Build
ing
a Ho
use
Cent
ral A
rizon
a Pr
ojec
t
Gre
at P
yram
id a
t Giz
a
Auto
mob
ile F
acto
ry
GM
Impa
ct
Batt
erie
s for
Ele
ctric
Veh
icle
s
C3PO
from
Sta
r War
s
ResourcesCost 1 1.5 2 2 2 3 5 15 14 14 6 2 12 12 12 15 9 7 3 2Time 1 1.5 3 2 8 5 3 9 5 7 10 2 7 3 9 10 7 4 10 2Infrastructure 1 1 2 1.5 3 5 2 10 7 8 5 4 8 6 6 9 6 4 4 3Quality 1 1 3 2 5 2 2 9 6 9 2 3 8 3 2 10 5 3 2 6Process Design 1 1 1 1 3 2 4 2 2 2 3 2 4 1 1 1 5 2 4 4Aggressive Selling Price 1 1 2 1 2 1 4 1 1 3 1 1 4 3 1 1 5 3 4 3
Resources Total 6 7 13 9.5 23 18 20 46 35 43 27 14 43 28 31 46 37 23 27 20
Table 6. Revised values for project “Difficulty”
In addition, use can be made of the measures for design type, knowledge complexity and steps. These
terms can be directly imported into the complexity taxonomy as it currently exists. By taking this
information, and adding scoring to the other sources of complexity, a metric can be developed for
comparison against the project difficulty. The values of the complexity measure are determined as
follows:
Character
o Predictive (Consistent)
1-3 for deterministic systems
4-6 for varying levels of statistical behavior
71
10 for chaotic
o Adaptive
0 for no adaptation
1-3 for adaptation of behavior
4-6 for adaptation of use
10 for adaptation of structure
o Emergent
0 for no emergence
1-3 for levels of simple emergence
4 for weak emergences
7 for multiple emergences
10 for strong emergence
Description
o Cells
Number
This number is directly equal to “steps” determined by Moody et. al.
Diversity
1 for single
5 for multiple
10 for all different
o Structure
Relationship
1 for serial/parallel
5 for hierarchy
10 for matrix/network
72
Temporal
1 for static
5 for dynamic
10 for chaotic
o Interactions
Transmission
1 for singular information transmission
5 for more than 10
10 for more than a 100
Physical
1 for singular interaction
5 for more than 10
10 for more than a 100
Setting
o Social
Intellectual
Represented by the sum of “knowledge complexity” and “design type” as
established by Moody et.al.
Roles and Relationships
1 for serial/parallel
5 for hierarchy
10 for matrix/network
Political
1 for friendly political environment
5 for mixed/cautious
73
10 for hostile
o Physical
Conditions
1 for normal
5 for challenged
10 for hostile
o Temporal
For all conditions that are changing with time:
1 for static
5 for dynamic
10 for chaotic
Interface
o User
Experiential
1 for previous experience
5 for related experience
10 for no experience
Physiological
0 for does not apply
1 for suited
5 for a system that can be made to work
10 for a system not suited
Psychological
1 for confident user
5 for skeptical/cautious user
74
10 for fearful/overwhelmed user
o Players
Sharing
0 for no sharing
1 for singular shared element
5 for 50% shared
10 for sully shared
Communication
0 for no communication
1 for single direction
5 for dual direction
10 for multiple sources, or requiring interpretation
Impact
0 for no impact
1 for small impact
5 for moderate impact
10 for significant/large impact
By the nature of their application, these scores will create an ordinal value for comparison and not a
cardinal one. The result is that the location on a graph represents only a relative region, or zone of
application. In addition, the scales considered all go from 1 to 10 for the complexity sources considered.
This is most likely inadequate for the long term. The complexity scale for emergent properties should
have a different weighting than the one for cells, for example. What form these weightings should take,
however, is not readily obvious and so are left out at this time.
75
Resi
stor
Net
wor
ks
SIER
RA T
rain
Con
trol
lers
Bat C
hoos
er
Sche
dulin
g a
Pine
woo
d De
rby
Seco
nd O
pini
on
Amer
ican
Airl
ines
Sch
edul
ing
Inca
ndes
cent
Ligh
tbul
b
Apol
lo M
oon
Land
ing
Man
hatt
an P
roje
ct
Pola
ris P
rogr
am
Hubb
le S
pace
Tel
esco
pe
Supe
rcon
duct
ors
Boei
ng 7
77
Build
ing
a Ho
use
Cent
ral A
rizon
a Pr
ojec
t
Gre
at P
yram
id a
t Giz
a
Auto
mob
ile F
acto
ry
GM
Impa
ct
Batt
erie
s for
Ele
ctric
Veh
icle
s
C3PO
from
Sta
r War
s
CharacterPredictive 1 2 1 1 5 5 5 6 4 3 3 10 4 1 3 1 3 2 2 3Adaptive 0 0 0 0 0 2 0 0 1 1 0 0 0 0 0 0 4 0 0 2Emergent 0 0 1 1 1 2 1 3 2 2 3 1 3 3 0 2 1 1 1 7
DescriptionCells
Number 1 1 1 2 3 4 4 10 7 9 5 2 9 4 5 5 6 5 3 10Diversity 1 5 5 5 1 5 5 10 10 10 10 1 10 5 10 1 10 5 5 10
StructureRelationship 1 1 1 1 10 10 1 10 5 10 5 10 10 5 1 1 10 1 5 10Nature 1 1 1 5 1 5 1 5 5 1 1 5 5 1 1 1 5 1 5 1
InteractionsTranmission 1 1 1 1 10 5 1 10 10 5 5 0 10 5 1 1 10 1 1 10Physical 1 1 1 1 0 1 1 10 5 10 10 1 10 10 5 10 10 1 5 10
Setting Social
Intellectual 2 4 11 5 11 10 19 19 24 17 16 25 15 3 6 8 11 17 14 25Roles and Relationships 0 1 1 2 10 1 1 10 5 5 2 5 3 1 1 3 1 1 5 1Political 1 1 5 5 10 5 5 10 10 10 10 5 10 1 5 10 5 5 10 5
PhysicalConditions 1 1 1 1 1 1 1 10 5 10 10 5 5 1 5 5 1 5 5 5
TemporalIntellectual 1 4 4 1 4 1 10 7 7 7 4 7 4 1 4 1 4 4 7 4Roles and Relationships 1 4 1 4 4 1 1 4 4 4 4 4 4 1 4 4 1 1 1 4Political 1 1 1 4 4 4 4 4 7 7 7 4 7 1 4 4 4 7 4 4Conditions 1 1 1 1 1 4 1 4 4 1 1 1 1 1 4 4 1 1 1 1
InterfaceUser
Experiential 1 5 5 1 5 1 10 5 5 5 5 10 1 1 1 1 5 1 5 1Physiological 0 0 1 0 0 0 1 5 0 0 1 0 0 1 0 1 1 1 0 0Physcological 1 5 5 5 5 1 5 5 5 5 5 5 5 1 1 1 1 1 5 1
PlayersSharing 0 5 0 5 1 5 0 0 5 5 1 0 0 5 5 1 5 0 0 5Communication 0 5 5 5 5 10 1 10 10 5 10 0 10 1 5 1 5 5 1 5Impact 1 1 10 5 10 10 10 10 10 10 0 10 10 1 10 5 10 10 10 10
Complexity 17 48 62 60 97 88 83 161 146 139 115 101 132 53 78 70 111 74 93 131Normalized Complexity 0.7 2.1 2.7 2.6 4.2 3.8 3.6 7.0 6.3 6.0 5.0 4.4 5.7 2.3 3.4 3.0 4.8 3.2 4.0 5.7
Table 7. Complexity Scores
Scoring values for each project and its associated sources of complexity. The items in red represent categories whose values were derived from the previous scores of Moody et.al. Both the final sum, and the
normalized values are shown.
It is acknowledged that the described scoring system may not be ideal, and depends on evaluations that
can be, for some categories, only assessed subjectively. In addition, the values ascribed will depend
76
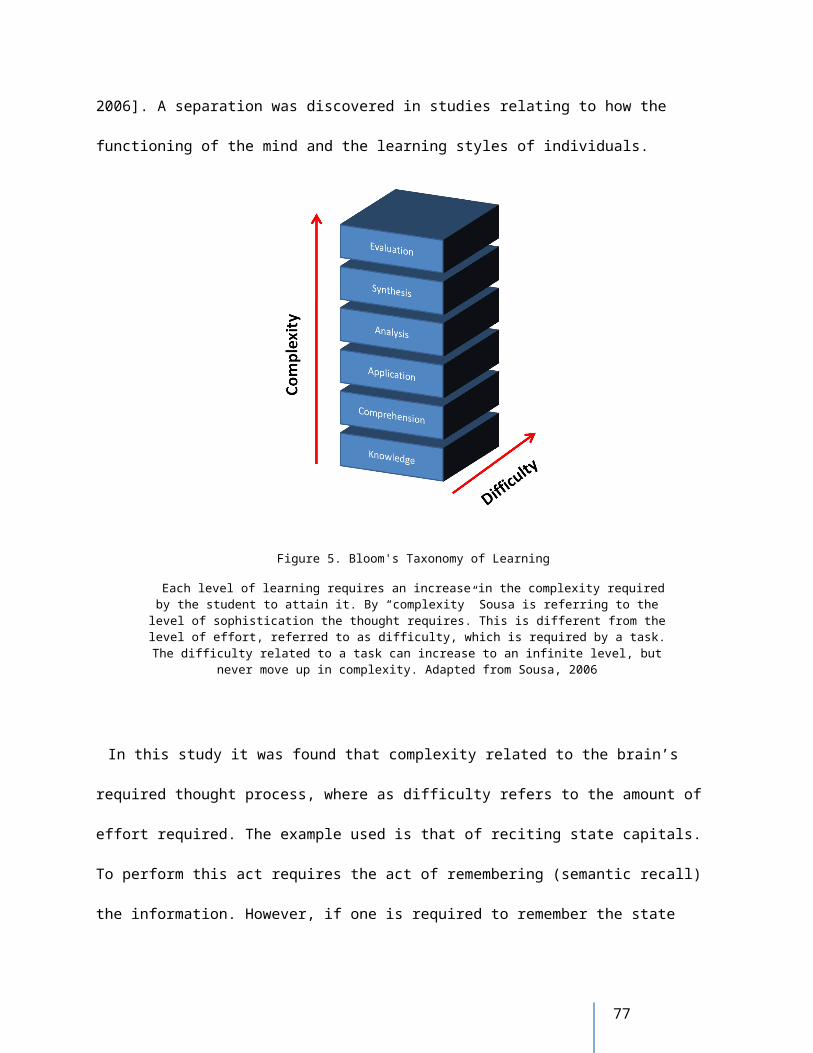
highly on the amount of knowledge the reviewer has to the situation. However, an attempt has been made
to provide numbers based solely on information available to the public. Since the sources of complexity
are 23, and those for difficulty are 6, both numbers will be compared by means of a simple average. This
is done for two reasons. First that it puts them on the same relative scale, and second that the addition of
later complexity characteristics will not artificially drive the values upward. Finally, the segregation of
the numbers from, generally, 1 to 10 was done in an attempt to match the previously established scoring
system. The results for each project are shown in Table 7.
When these numbers are compared to the normalized measure of difficulty, a relationship can be shown
for the majority of the projects. These 12 projects, referred to as “core” in Figure 12 demonstrate a clear
relationship between complexity and difficulty. An exponential curve has been fit to these projects, and is
described by :
y=.7343 e .3603 x
Equation 1. Complexity Curve Fit
This equation would appear to be legitimate, fitting the data points with an r-squared value of .9423
where the value r is defined by:
Equation 2. R Squared
In addition, it is not suggested that a purely defined relationship between complexity and difficulty
could be described. More likely, using this curve fit, it is appropriate to define a “band” or “region”
describing systems operating in the nominal conditions. In an attempt to define this a margin of +/- 25%
has been placed on the cure fit. This complexity band could theoretically be used to determine the
approximate range of resources required for an given engineering project.
77
Five systems fall outside this band (denoted “lesser knowledge systems”) potentially due to a lack of
knowledge on the part of the author’s ability to evaluate there values. Whether or not more forces are at
work cannot be determined at this time.
Of special note are the systems denoted as “outliers” on the charts. These three are well outside the
complexity-resource band, and have a low degree of risk in the author’s evaluations of them. This would
seem to suggest that other forces are at work for these projects, ones that are artificially driving their level
of resources beyond the need of the given complexity. Possible candidates for rationale of this behavior
are:
1. Political, or social, forces were at work and drove resources up. For example, in the case of
the pyramids the role of the government and religion may have influenced a project well
beyond a reasonable scope. In the case of the house, social requirements for a standard of
living may be driving additional resources beyond the level of complexity.
2. These systems represent ones that, for various reasons, do not drive a large amount of
capital investment to reduce resource requirements. That is to say, no investment into
technology or methods is made to drive down the resources.
Whether either of these reasons can explain the behavior is not clear. However, this experiment would
seem to suggest that a method can be developed for evaluating complexity and it can be used to determine
fundamental truths about the nature of engineering endeavors.
78
Figure 12. Mapping of Difficulty to Complexity
A re-evaluation of systems originally compiled by Moody et.al. The figure depicts a core set of systems that represent the normal relationship between complexity and resources. The "lesser knowledge systems" represent systems that either due to application, or data available to the author, have greater error in
their estimated position. It should be noted that the value ascribed to the systems relate highly to the timeframe that the task was attempted.
79
The nature of these results would indicate that a legitimate process can be developed for the evaluation
of system complexity. The process, as we have employed it, is then defined below in the figure.
Figure 13. Process for Complexity Evaluation
Shown above is the process for creating a graph to show the relationship of resources to complexity. The fidelity required for the data, and the relationship demonstrated by the evaluation, will be specific to the
systems under consideration. It is recommended that, for best results, the ordinal comparison be performed across systems that are similar. For example: Automobiles or Modes of Transportation
6.4. Project Management
Having identified complexity as a property of systems that can be (at least relatively) measured, it can
be asked what the implications are to project management. Several regions have been identified that can
be generally discussed. These are shown in the figure below. The green zone represent a region of
physically possible solutions, with its boundary representing the lower limit of resources that can provide
a solution of any given complexity. The orange zone shows physically valid solutions that are eliminated
due to market/competitive pressures. The red zone shows systems that have become obsolete due to low
system performance, even given their low resources and complexity.
This then is the zone that the project manager has to navigate. The following figures demonstrate ways
that this can be performed.
Re-evaluate data and process
80
Figure 14. The General Complexity Space
With the two axes representing Complexity and Resources, we can generally consider different design spaces. The boundary of the green and white zones represents the hypothetical limit to the resources available
for a system of given complexity. That is, the least amount possible to solve a problem. Hypothetically, the amount of resources used could always increase but competition and market pressures keep them from doing
so. This then serves to eliminate a large portion of available design space, as shown by the orange zone. Finally, the red zone depicts via solutions that are low in resources, but also so low in performance that they
are effectively obsolete.
Figure 15. Forces on the Complexity Space
Two main forces operate on the complexity space, and effect systems over time. First, increase in the complexity due to new requirements will drive the systems down the complexity "hill". Secondly, investment by an industry (or lack thereof) will cause the system to either require less resources and stay viable, or cause
them to remain high and drive the system into competitive/financial obsolescence.
81
Figure 16. Movement in the Complexity Space
There are established ways that project managers can move in the complexity space. 1. Discover how to make a system perform in new ways given some NRE to add the necessary relationships 2. Over time
improve how to build/test a system 3. A new solution is found, or created, that holds capability constant but removes cost from either material or production 4. Investment of large amounts of capital to increase our
knowledge about a product and effectively move it down the hill
A final application of complexity, as it pertains to project management, would be to attempt to manage
it similarly to the methods employed for resources. Project management software, such as Microsoft
Project, currently tracks tasks, their relationships, the days required etc. This creates the standard Gantt
charts relationships.
Figure 17. Traditional Gantt Chart
The traditional Gantt chart shows tasks, their predecessors, the total days, dollars, and people. This is a representation of resources and can be managed thorough critical path.
82
An application of these methods, as it relates to the current topic, would be to show task complexity as
well as that of the relationships. This would allow for risk identification at a higher resolution than
normally practiced.
Figure 18. Complexity Gantt Chart
An application of the Gannt chart method to complexity would be to show the complexity inherent to each task, as well as the transfer function between each task. The total could then be expressed through an
equation showing the paths with the greatest complexity. Instead of managing only the resources critical path, the project manager could also address the "river of complexity".
6.5. Zones of Interest
A final application of the complexity framework is to identify what general "zone" of interest the task is
occupying. It would seem that projects in each zone would share common traits, as well as proper
techniques for being addressed. Having populated the middle of the chart, more attention will now be
paid to the outer edges. The same scoring system will be employed as that used in section 6.3, but we will
apply it instead to the following list:
RSA Encryption: the act of encrypting, de-crypting, and breaking the encryption
Painting: painting a room, or painting a masterpiece
Dreams
Creation: Cooking a gourmet meal, creating a Stradivarius quality violin
Political Campaign for Senate
As before the numbers used are shown in the tables below.
83
Table 8. Resource Values for New Set
Table 9. Complexity Values for the New Set
84
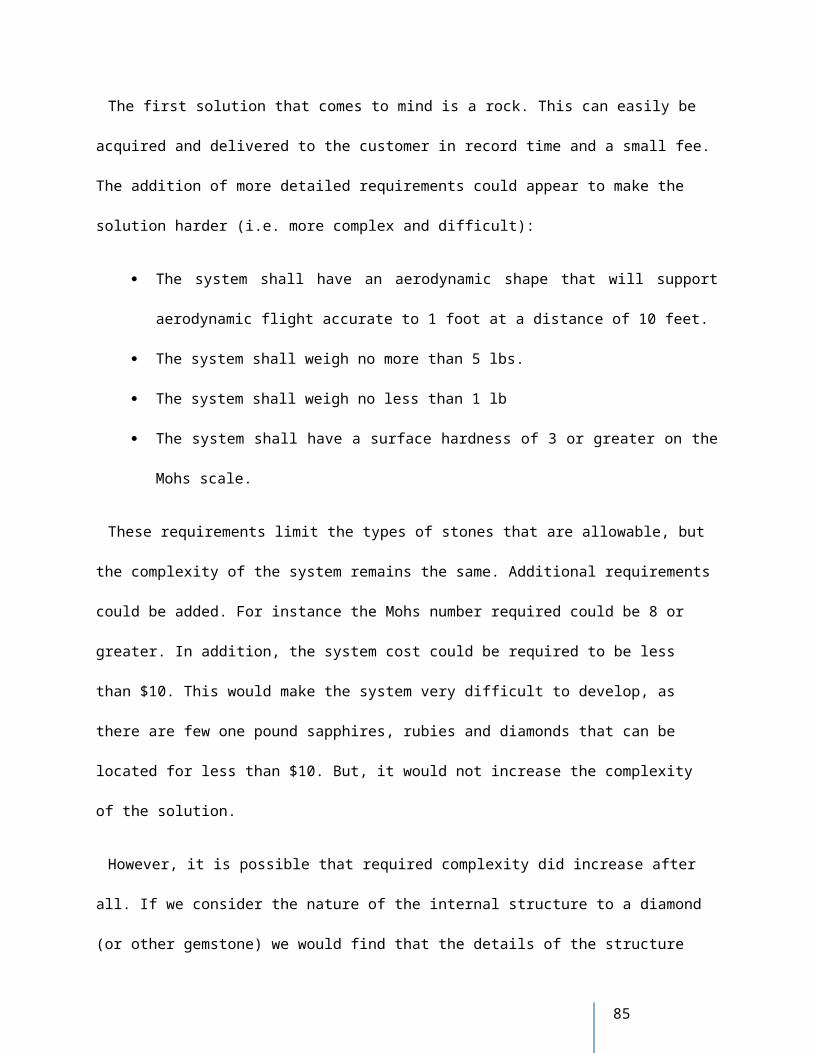
Having scored the new projects, a graph can now be generated.
Figure 19. Plot of New Set
It is interesting to note that once the projects were scored using the defined method, the results were not what was expected. These tasks all seem to hug the curve previously defined. It would appear that systems
that deviate from the complexity curve are hard to locate, and even conceive of. Dreams, and breaking RSA code appear to be the only exceptions.
It is interesting that even when project are chosen with the intent to deviate from the complexity curve,
they generally do not. This would seem to indicate that finding systems that deviate from the central
region is difficult. Whether this is due to some fundamental property, or the method employed, is
unknown.
85
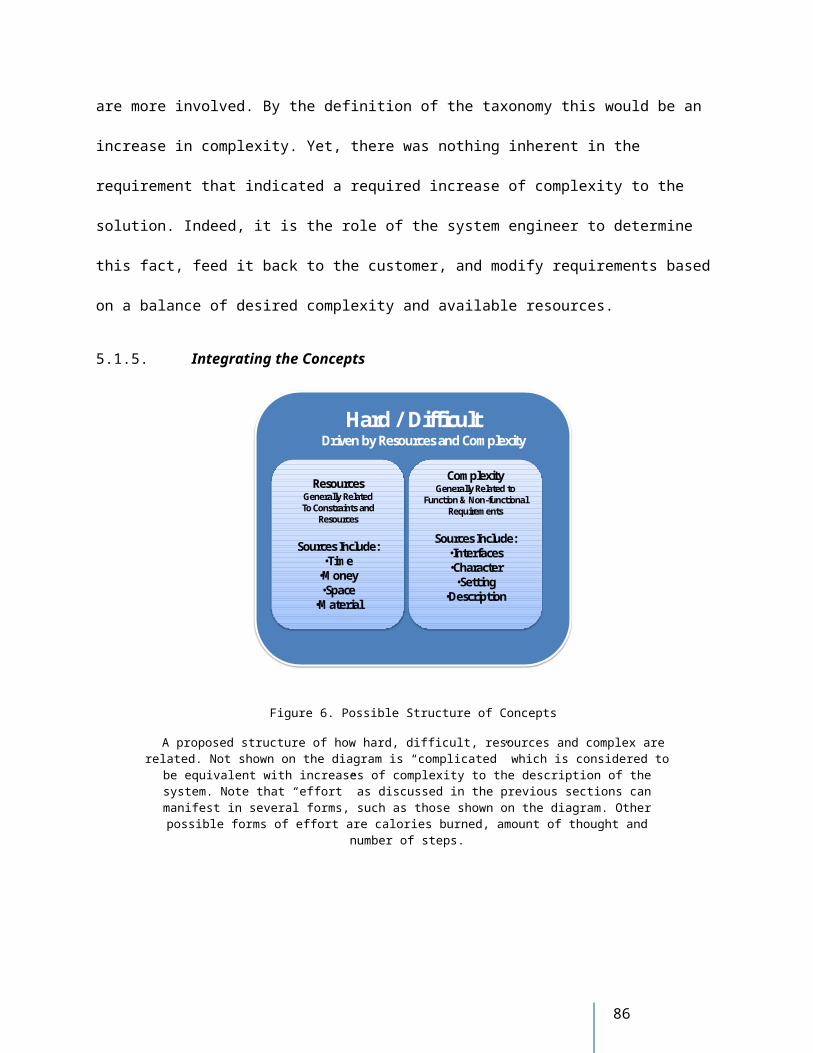
7. CONCLUSIONS
7.1. Summary of Achievements
Many topics have been addressed throughout the course of this paper, and they will be summarized
here.
First, by compiling a large amount of published information on the topic of complexity a set of
manifestations, measures, definitions, and philosophies were collected. These were sifted for attributes
relating to complexity until a large list could be compiled that appeared to begin to comprehensively
address the topic.
This list of attributes was then organized into a structure, and sorted by shared characteristics. From this
organized list, a taxonomy was created to show how complexity develops in systems.
Next, this newly formed taxonomy was tested against various philosophies, definitions and measures
previously established on the topic complexity. Although not all aspects were organized in the same
fashion as some previously held notions, all components were addressed.
In order to address area of internal consistency the taxonomy was tested against the framework
developed for systems engineering, as well as examples from everyday life. It was found, that as a
framework for evaluating systems, the taxonomy held up. Insights were gleaned as to the nature of
complexity for various challenges and whether that complexity is expected to be transient or fixed over
time.
Finally, as a result, a common language and set of definitions was created to assist in future exploration
of the topic. This yielded to the definition of possible further work.
7.2. Future work
The following is a list of identified possible areas for future study:
86

Complexity in History: Research of the concept of complexity in order to determine how it has
developed in human thought through recorded history
Methods of Complexity Reduction: The review of successful project and programs from the
history of engineering. An analysis of how complexity was addressed and the methods that
might match to certain classes of problems.
Refinement of the Taxonomy: A review of more areas of scientific discovery to determine if
current themes are accurate or need to be augmented. In addition, more detail to break down
types of complexity into their proper sub-types. This could include a binomial nomenclature
system to address and identify specific complexities.
Defining a Limit on the Complex: This paper looked at complexity as a continuous increasing
feature of a system. Further work could be performed to determine which attributes must be
present for a system to be “officially” complex by current standards.
Complexity and Requirements: Performing a survey of requirements developed for various
systems. Mapping these requirements to the sources of the taxonomy and search for possible
indications of what causes a requirement to drive complexity or not.
87
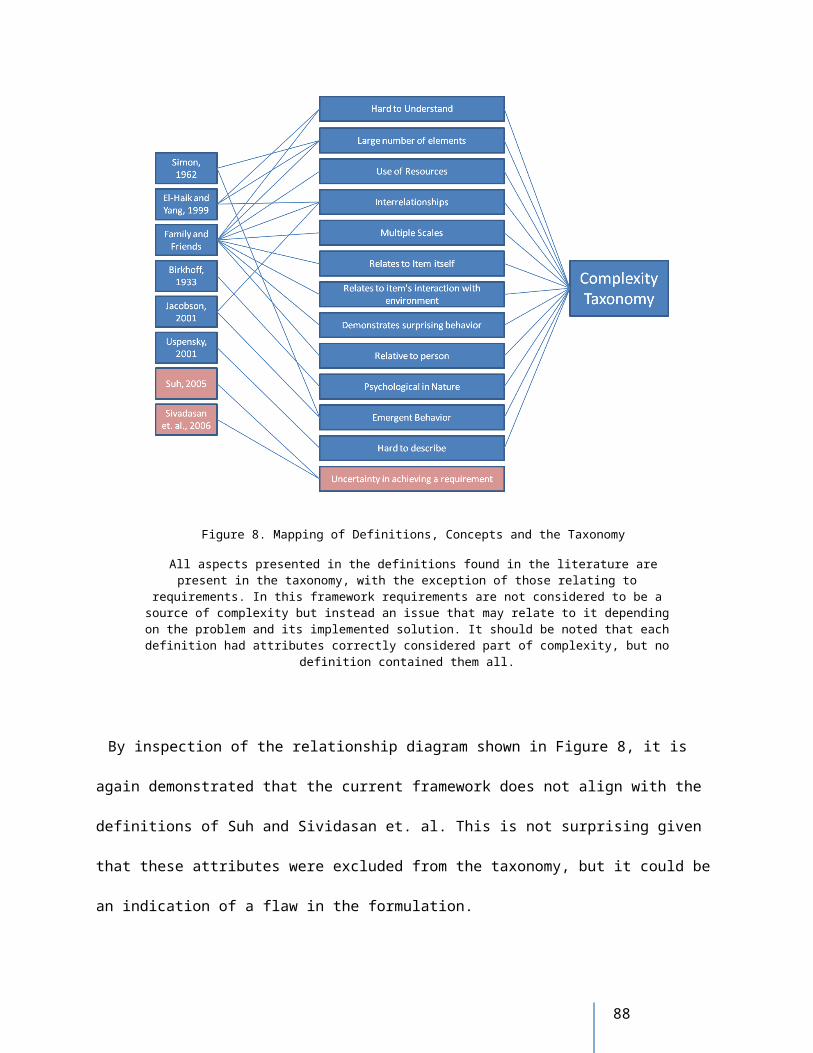
Appendix A: Details of Selected Complexity Measures
Factorial Analysis of Software Metrics, [Munson and Khoshgoftaar, 1992]
Using a metric analyzer, the following 16 metrics were collected.
MFC Method, [Meyer and Foley Curley, 1995]
Developed through the performing of case studies to determine how knowledge complexity was
combined with technology complexity in the development of software applications.
88
Knowledge complexity was broken down into three factors:
The knowledge of the decision-maker
The information used by the decision-maker
The interpretation and synthesis of the above information
In order to evaluate these three levels, seven variables were identified and scored:
1. Breadth of decision-making domain(s): reflects the number of specific distinct fields of
expertise employed by the decision-makers
2. Depth of decision-making domain(s): considers the combination of educational training and
work experience required by decision-makers.
3. Rate of change of decision-making domain(s): quantifies the frequency with which decision-
makers have to renew their knowledge.
4. Decision-making domain penetration: synthesizes the level of computerization of each specific
domain in the computer system.
5. Comprehensiveness of decision outputs: reflects the category of the output, which could be of
the following types: problem diagnosis, recommended actions, actual solutions, hypothesis
testing.
6. Breadth of information inputs: regards the information inputs used by the decision-maker.
7. Required interpretation of information inputs: reflects the level of interpretation the decision-
maker needs to make regarding the information inputs.
89
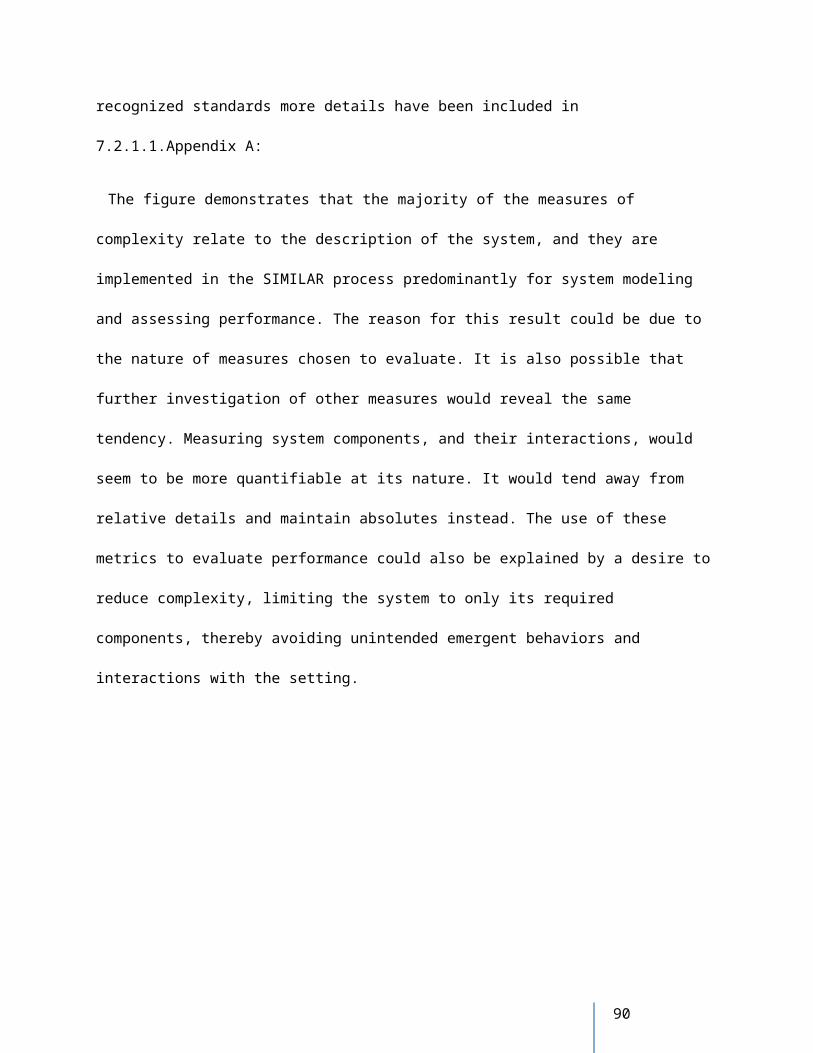
8. REFERENCES
(2009a), Complexity, Merriam-Webster Online Dictionary. [online] Available from: http://www.merriam-webster.com/dictionary/Complexity
(2009b), Complicated, Merriam-Webster Online Dictionary. [online] Available from: http://www.merriam-webster.com/dictionary/Complicated
Abadi, C. D., and A. T. Bahill (2003), The Difficulty in Distinguishing Product from Process, Systems Engineering, 6(2), 106-115.
Adami, C. (2002), What is complexity?, BioEssays, 24, 1085-1094.
Ameri, F., J. D. Summers, G. M. Mocko, and M. Porter (2008), Engineering Design Complexity: An Investigation of Methods and Measures, Res Engineering Design, 19, 161-179.
Arteta, B. M., and R. Giachetti (2004), A Measure of Agility as the Complexity of the Enterprise System, Robotics and Computer Integrated Manufacturing, 20(6), 495-503.
Bahill, A. T., and F. F. Dean (2009), What is Systems Engineering? A Consensus of Senior Systems Engineers, in Proc. 6th Annu. Int. Symp. INCOSE, vol. 1, pp. 503-508 The current version of this consensus is available at http://www.sie.arizona.edu/sysengr/whatis, Boston, MA.
Bahill, A. T., and B. Gissing (1998), Re-evaluating Systems Engineering Concepts Usings Systems Thinking, IEEE Transactions on Systems, Man, and Cybernetics, 28(4), 516-527.
Bahill, A. T., and W. J. Karnavas (2000), Risk Analysis of a Pinewood Derby: A Case Study, Systems Engineering, 3(3), 143-155.
Biemans, F., M. Lankhorst, W. Teeuw, and R. V. D. Wetering (2001), Dealing with the Complexity of Business Systems Architecting, Systems Engineering, 4(2), 118-113.
Birkhoff, G. D. (1933), Aesthetic Measure, Harvard University Press, Cambridge, Massachusetts.
Bjorn Regnell, Richard Berntsson Svensson, and Krysztof Wnuk (2008), Can We Beat the Complexity ofVery Large-Scale Requirements Engineering?, in Requirements Engineering: Foundation for Software Quality, pp. 123-128, Springer Berlin / Heidelberg.
Bloom, B. S., M. D. Engelhart, E. J. Furst, W. H. Hill, and D. R. Krathwohl (1956), The Taxonomy of Educational Objectives, The Classification of Educational Goals, Handbook I: Cognitive Domain, Longman.
90
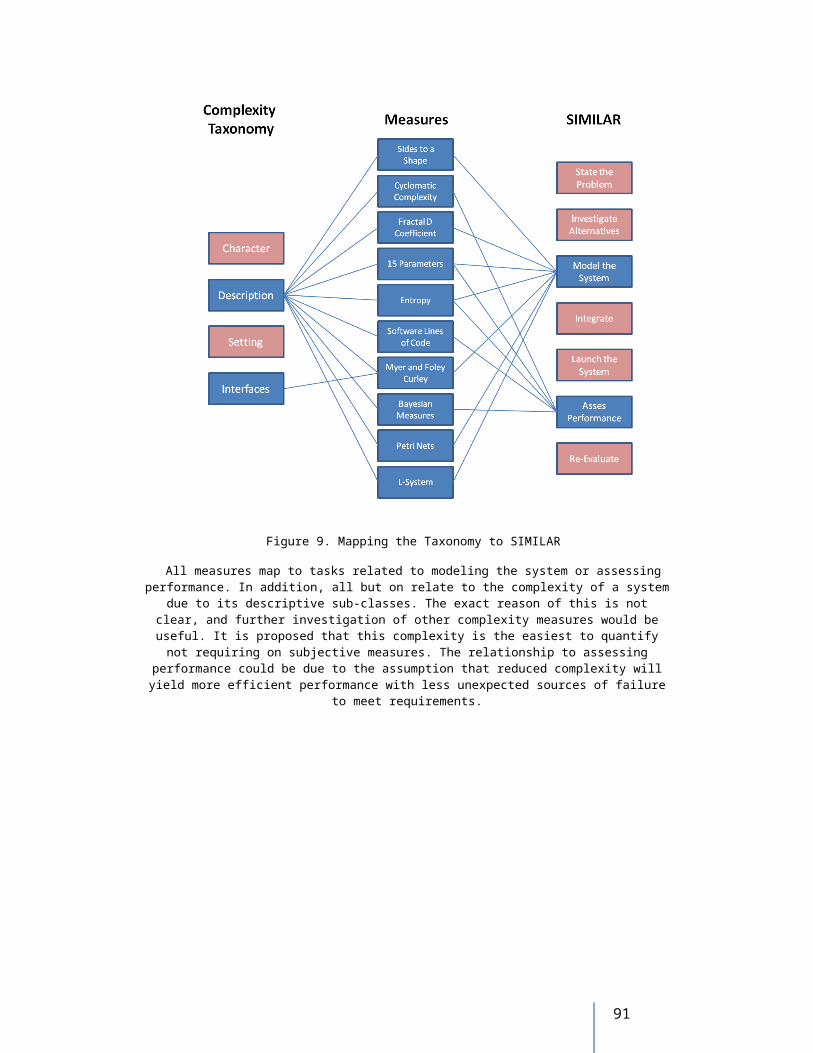
Bonabeau, E., M. Dorigo, and G. Theraulaz (1999), Swarm intelligence: from natural to artificial systems.
Booch, G. (2008), Measuring Architectural Complexity, IEEE Software, 25(4), 14-15.
Botta, R., and A. T. Bahill (2007), A Prioritization Process, Engineering Management Journal, 19(3), 31-38.
Botta, R., Z. Bahill, and A. T. Bahill (2006), When are Observable States Necessary?, Systems Engineering, 9(3), 228-240.
Bowlby, J. (1951), Maternal Care and Mental Health, Bulletin of the World Health Organization, (3), 355-534.
Braha, D., and O. Maimon (1998), The Measurement of a DesignStructural and Functional Complexity, IEEE Transactions on Systems, Man, and Cybernetics, 28(4), 527-535.
Brodu, N. (2009), A Synthesis and a Practical Approach to Complex Systems, Complexity, 15(1), 26-60.
Calinescu, A., J. Efstathiou, J. Schirn, and J. Bermejo (1998), Applying and Assessing Two Methods for Measuring Complexity in Manufacturing, The Journal of Operational Research Society, 49(7), 723-733.
Calvano, C. N., and P. John (2004), Systems Engineering in an Age of Complexity, Systems Engineering, 7(1), 25-34.
Campbell, D. J. (1988), Task Complexity: A Review and Analysis, The Academy of Management Review, 13(1), 40-52.
Casti, J. L. (1979), Connectivity, Complexity, and Catastrophe in Large-Scale Systems, John Wiley and Sons.
Chu, D., R. Strand, and R. Fjelland (2003), Theories of complexity, Complexity, 8(3), 19-30.
Cilliers, P. (1998), Complexity and Postmodernism, Routledge.
Davis, C. (2009), Complexity – Is it in the Eye of the Beholder?, European Journal of Pallative Care, 16(5), 213.
Dorneanu, L. (2007), How to Make an Atomic Bomb, How to Make an Atomic Bomb. [online] Available from: http://news.softpedia.com/news/How-To-Make-An-Atomic-Bomb-53392.shtml
91
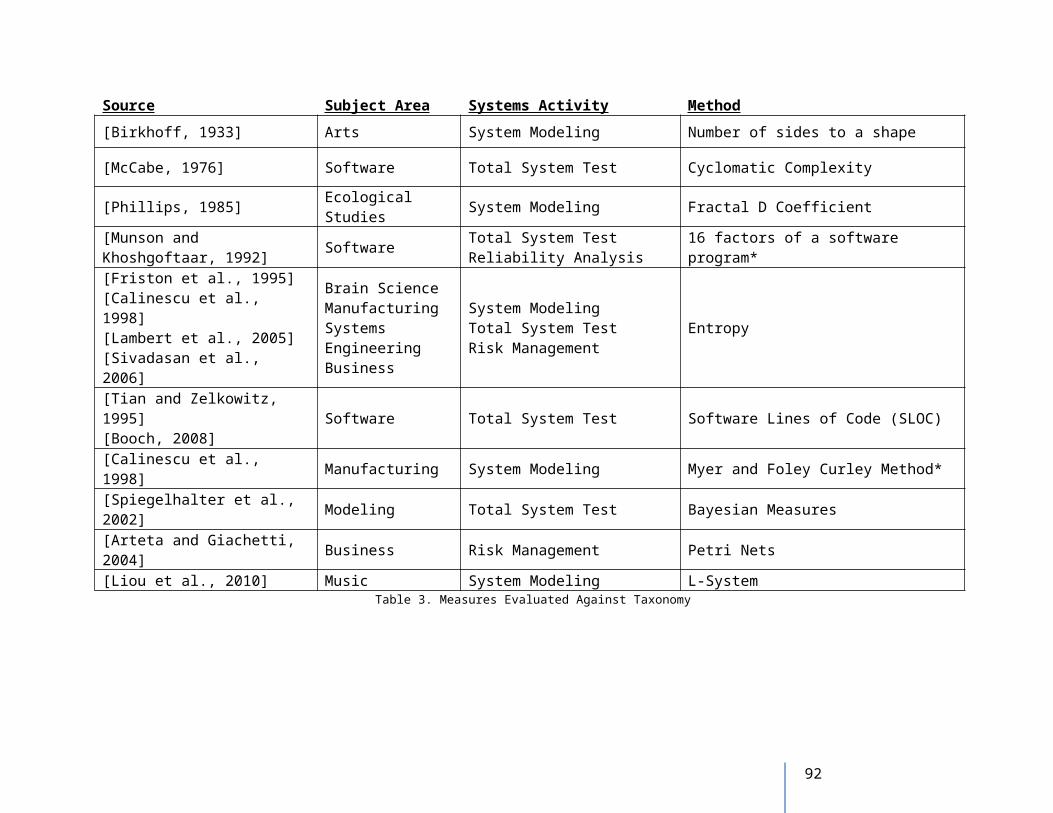
Dromey, R. G. (2005), Genetic Design: Amplifying Our Ability to Deal With Requirements Complexity, in Scenarios: Models, Transformations and Tools, vol. 3466/2005, pp. 95-108, Springer Berlin / Heidelberg.
Early, P. C. (1985), Influence of Information, Choice and Task Complexity UponGoal Acceptance, Performance, and Personal Goals, Journal of Applied Pschology, 70(3), 481-491.
El-Haik, B., and K. Yang (1999), The Components of Complexity in Engineering Design, IEEE Transactions, 31(10), 925-934, doi:10.1080/07408179908969893.
Erdi, P. (2008), Complexity Explained, Springer.
Friston, K., G. Edelman, and G. Tononi (1995), Characterising the Complexityof Neuronal Interactions, Human Brain Mapping, 3, 302-314.
Fromm, J. (2005), Types and Forms of Emergence, arXiv, http://arxiv.org/ftp/nlin/papers/0506/0506028.pdf.
Gell-Mann, M. (1995), What is Complexity?, Complexity, 1(1).
Gemunden, H. G., and J. Hauschildt (1985), Number of Alternatives and Efficiency in Different Types of Top-Management Decisions, European Journal of Operations Research, 22, 178-190.
Hawking, S. (2001), I think the next century will be the century of complexity, Complexity Digest, 10.
Horgan, J. (1996), On Complexity and the End of Science, Complexity, 2(2), 13-15.
Hubler, A. W. (2007), Understanding Complex Systems, Complexity, 12(5), 9-11.
Jacobson, M. J. (2001), Problem Solving, Cognition, and Complex Systems: Differences Between Experts and Novices, Complexity, 6(3), 41-49.
Kauffman, S. (1996), Autonomous Agents, Self-Constructing Biospheres, and Science, Complexity, 2(2), 16-17.
Kolmogorov, A. (1965), Three Approaches to the Quantitative Definition of Information, Problemi Peredachi Informatsii, 1(1), 3-11.
Kosnik, T. J. (1990), Perennial Renaissance: The Merketing Challenge in High Tech Settings, in Managing Complexity in High Technology Organizations, edited by M. A. Von Glinow and S. A. Mohrman, pp. 119-145, Oxford University Press, Ney York.
Lambert, J. H., B. L. Schulte, and P. Sarda (2005), Tracking the Complexity of Interactions
92
Between Risk Incidents and Engineering Systems, Systems Engineering, 8(3), 262-277.
Lewin, R. (1992), Complexity, Macmillan, New York.
Liou, C., T. Wu, and C. Lee (2010), Modeling Complexity in Musical Rhythm, Complexity, Published Online.
Lloyd, S. (2001), Measures of Complexity: A Nonexhaustive List, IEEE Control Systems Magazine, 21(4), 7-8.
Lovasz, L. (1996), Information and complexity: how to measure them, in Proceedings of the Plenary Session of the Pontifical Academy of Sciences, vol. 89, edited by B. Pullman, pp. 65-80, Princeton University Press.
Maslow, A. H. (1943), A Theory of Human Motivation, Psychological Review, (50), 370-396.
McCabe, T. J. (1976), A Complexity Measure, IEEE Transactions on Software Engineering, SE-2(4), 308-320.
McCabe, T. J., and C. W. Butler (1989), Design Complexity Measurement and Testing, Communications of the ACM, 32(12), 1415-1425.
McIntyre, L. (1998), Complexity: A Philosopher's Reflections, Complexity, 3(6), 26-32.
Meyer, M. H., and K. Foley Curley (1995), The Impact of Knowledge and Technology Complexity on Information Systems Development, Expert Systems with Applications, 8(1), 111-134.
Mirel, B. (2004), Interaction Design for Complex Problem Solving, Morgan Kaufmann.
Moody, J. A., W. L. Chapman, F. D. V. Vorhees, and A. T. Bahill (1997), Metric and Case Studies for Evaluating Engineering Designs, Prentice Hall.
Morin, E. (2008), On Complexity, Hampton Press, Inc.
Munson, J. C., and T. M. Khoshgoftaar (1992), Measuring Dynamic Program Complexity, IEEE Software, 9(6), 48-55.
NASB (1995), New American Standard Bible, The Lockman Foundation.
Phillips, J. D. (1985), Measuring Complexity of Environmental Gradients, Vegetatio, (64), 95-102.
Poels, G., and G. Dedene (2000), Measures for Assessing Dynamic Complexity Aspects of Object-Oriented Conceptual Schemes, in Conceptual Modeling - ER 2000, vol. 1920, pp. 499-512, Springer Nerlin / Heidelberg.
93
Ranganathan, A., and R. H. Campbell (2007), What is the Complexity of a Distributed Computing System?, Complexity, 12(6), 37-45.
Ren, C. H. (2003), Expanding the Role of Systems Engineers in the Age of Escalating Complexity, Systems Engineering, 6(2), 116-121.
Schaufelberger, W., and R. Sanz (Eds.) (2001), Control of Complex Systems, Springer.
Schuster, P. (2005), Less is More and the Art of Modeling Complex Phenomena: Simplification May but Need Not be the Key to Handle Large Networks, Complexity, 11(1), 12-15.
Schuster, P. (2006), Untamable Curiosity, Innovation, Discovery, and Bricolage, Complexity, 11(5), 9-11.
Schuster, P. (2008), Are There Recipes for How to Handle Complexity?, Complexity, 14(1), 8-12.
Shannon, C. (1948), A Mathematical Theory of Communication, Bell System Technical Journal, 27, 379-423, 623-656.
Sheard, S. A., and A. Mostashari (2009), Principles of Complex Systems for Systems Engineering, Systems Engineering, 12(4), 295-311.
Shubik, M. (1996), Simulations, Models and Simplicity, Complexity, 2(1), 60.
Simon, H. A. (1962), The Architecture of Complexity, Proceeding of the American Philosophical Society, 106(6), 467-482.
Sivadasan, S., J. Efstathiou, A. Calinescu, and L. Huatuco (2006), Advances on Measuring the Operational Complexity of Supplier Customer Systems, European Journal of Operational Research, 171(1), 208-226.
Smith, E. D., Y. J. Jun Son, M. Piattelli-Palmarini, and A. T. Bahill (2007), Ameliorating Mental Mistakes in Tradeoff Studies, Systems Engineering, 10(3), 222-240.
Sousa, D. (2006), How the Brain Learns, in How the Brain Learns, pp. 258-260, Corwin Press.
Spiegelhalter, D. J., N. G. Best, B. P. Carlin, and A. van der Linde (2002), Bayesian Measures of Model Complexity and Fit, Journal of the Royal Statistical Society, 64(4), 583-639.
Suh, N. P. (2005), Complexity, Oxford University Press.
Tian, J., and M. V. Zelkowitz (1995), Complexity Measure Evaluation and Selection, IEEE Transactions on Software Engineering, 21(8), 641-650.
94
Traub, J. F., and A. G. Werschulz (1998), Complexity and Information, Cambridge University Press.
Umphrey, S. (2002), Complexity and Analysis, Lexington Books.
Uspensky, V. A. (2001), Why Kolmogorov Complexity?, in Complex Systems, edited by S. Martinez and E. Goles, Kluwer Academic Publishers.
Vidal, L., and F. Marle (2008), Understanding Project Complexity: Implications on Project Management, Kybernetes, 37(8), 1094-1110.
Wade, N. (2010), A Decade Later, Genetic Map Yields Few New Cures, New York Times Online. [online] Available from: http://www.nytimes.com/2010/06/13/health/research/13genome.html
Weaver, W. (1948), Science and Complexity, American Scientist, 36, 536-544.
Woodward, M. R., and D. Hedley (1979), A Measure of Control Flow Complexity inProgram Text, IEEE Transactions on Software Engineering, SE-5(1), 45-50.
95