Embed Size (px)
Citation preview
1
A framework for IT performance management
Enabling organizational growth with IT performance management Authors: S. Haanappel, Ernst & Young: dr. R. Drost, prof. dr. F. Harmsen Utrecht University: prof. dr. S. Brinkkemper & dr. ir. J.M Versendaal February 2011 UU-CS-2011-00
2
ISSN: UU-CS-2011-00
Address:
Dept. of Information and Computing Sciences
Utrecht University
P.O. Box 80.089
3508 TB Utrecht
The Netherlands
3
A framework for IT performance management
Enabling organizational growth with IT performance management Authors: S. Haanappel, Ernst & Young: dr. R. Drost, prof. dr. F. Harmsen Utrecht University: prof. dr. S. Brinkkemper & dr. ir. J.M Versendaal
Abstract This research provides insight into how organizations can achieve and optimize the benefits of
IT performance management. The relevance of this research is the importance for
organizations to achieve value from their investments and that there is little scientific
literature available guiding them how to do this. To achieve value from investments a focus on
IT performance management is required that takes care of the removal of non value-adding
activities and processes.
IT performance management can be defined as the area of setting goals, responsibility
accounting and monitoring/ analyzing/ governing and improving the performance of IT.
Benefits of IT performance management are that a focus on the realization of strategic,
financial and non-financial goals is applied and that KPIs are made explicit and measurable. IT
performance management requires effective IT management to meet business objectives. And
an IT performance measurement process needs to be selected. Performance measurement
frameworks need to be balanced, multidimensional, comprehensive and integrated into the
organizational performance measurement framework. Performance measurement
frameworks include metrics and a budgeting approach. Performance metrics are used to
govern measures and need to match the goals of the organization. When they are not well
implemented the planning and control of these metrics is impeded. The goals of budgeting
system development are the development and maintenance of a process for the planning and
management of activities. These activities are deducted from the strategic and tactical plans
and the corresponding benefits and costs are translated into a financially formulated plan.
In addition to a literature research that provided insight into what has been written about IT
performance management a case study research was conducted. In this case study research
organizations participated to provide insight into their IT performance management approach.
Additionally their approaches were compared to determine their IT performance management
maturity.
The results showed that the organizations had very different IT performance management
approaches and maturity levels. The majority of organizations did not seem to use their
performance results when developing IT performance management plans for the next year.
4
However several of the organizations tried to create commitment by making their employees
responsible for key performance indicators. In general it could be said that organizations were
not aware that their IT performance results could be used to improve IT performance
management and/or they did not know how to do this, as it has not been done and there are
no guidelines available. Based on the dataset gather during this research it can be said that
the organizations are not mature enough to optimize their IT performance management
benefits, as they have not yet been able to develop a loop back into the IT performance
management cycle to use the results to their benefit.
Chapter 1 – IT performance management
5
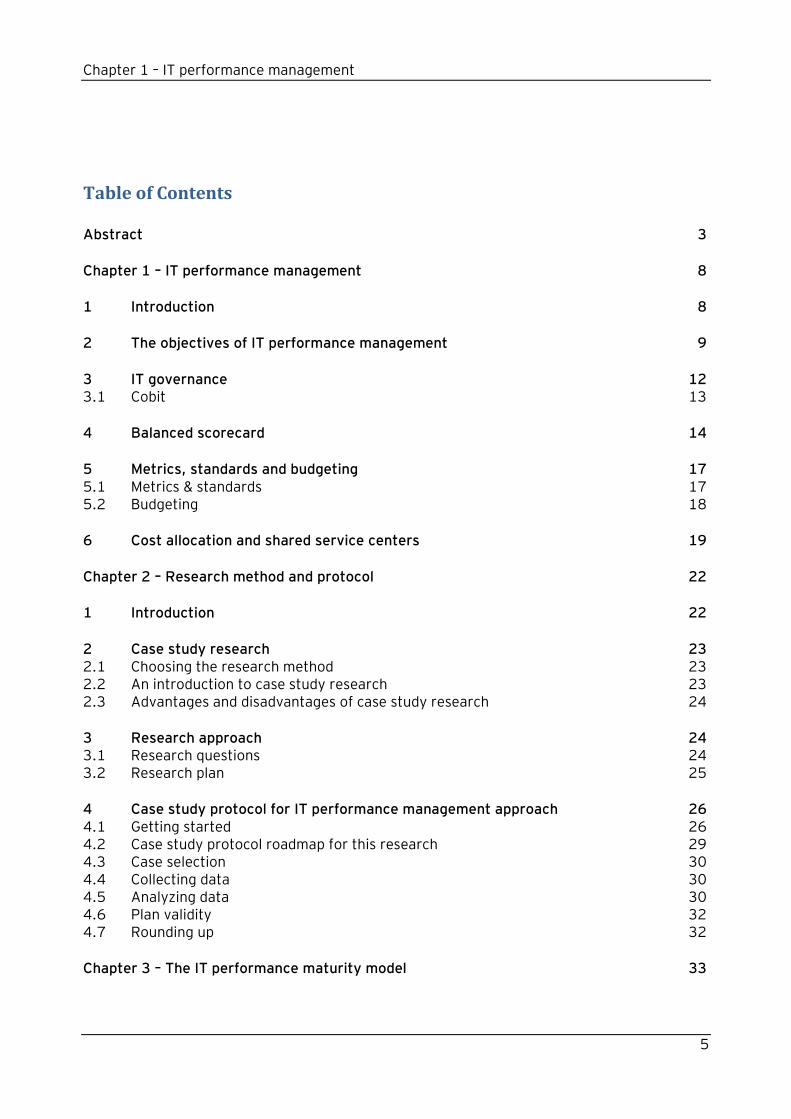
Table of Contents
Abstract 3
Chapter 1 – IT performance management 8
1 Introduction 8
2 The objectives of IT performance management 9
3 IT governance 12 3.1 Cobit 13
4 Balanced scorecard 14
5 Metrics, standards and budgeting 17 5.1 Metrics & standards 17 5.2 Budgeting 18
6 Cost allocation and shared service centers 19
Chapter 2 – Research method and protocol 22
1 Introduction 22
2 Case study research 23 2.1 Choosing the research method 23 2.2 An introduction to case study research 23 2.3 Advantages and disadvantages of case study research 24
3 Research approach 24 3.1 Research questions 24 3.2 Research plan 25
4 Case study protocol for IT performance management approach 26 4.1 Getting started 26 4.2 Case study protocol roadmap for this research 29 4.3 Case selection 30 4.4 Collecting data 30 4.5 Analyzing data 30 4.6 Plan validity 32 4.7 Rounding up 32
Chapter 3 – The IT performance maturity model 33
Chapter 1 – IT performance management
6
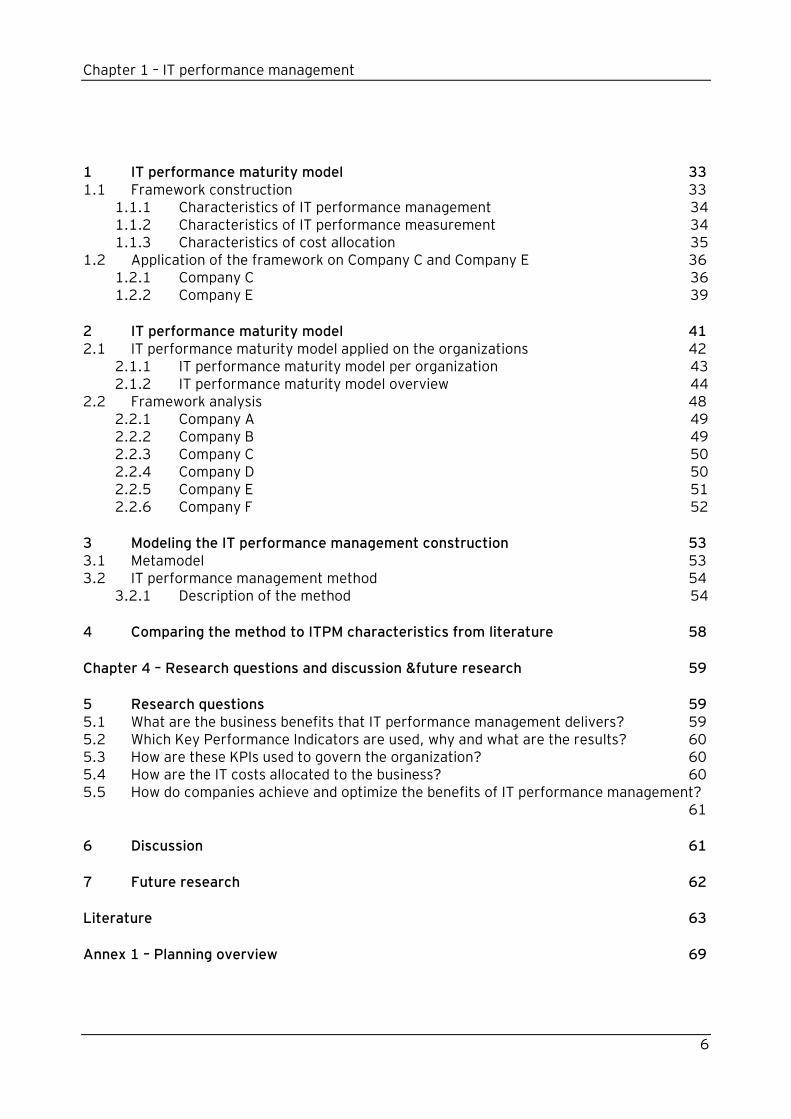
1 IT performance maturity model 33 1.1 Framework construction 33
1.1.1 Characteristics of IT performance management 34 1.1.2 Characteristics of IT performance measurement 34 1.1.3 Characteristics of cost allocation 35
1.2 Application of the framework on Company C and Company E 36 1.2.1 Company C 36 1.2.2 Company E 39
2 IT performance maturity model 41 2.1 IT performance maturity model applied on the organizations 42
2.1.1 IT performance maturity model per organization 43 2.1.2 IT performance maturity model overview 44
2.2 Framework analysis 48 2.2.1 Company A 49 2.2.2 Company B 49 2.2.3 Company C 50 2.2.4 Company D 50 2.2.5 Company E 51 2.2.6 Company F 52
3 Modeling the IT performance management construction 53 3.1 Metamodel 53 3.2 IT performance management method 54
3.2.1 Description of the method 54
4 Comparing the method to ITPM characteristics from literature 58
Chapter 4 – Research questions and discussion &future research 59
5 Research questions 59 5.1 What are the business benefits that IT performance management delivers? 59 5.2 Which Key Performance Indicators are used, why and what are the results? 60 5.3 How are these KPIs used to govern the organization? 60 5.4 How are the IT costs allocated to the business? 60 5.5 How do companies achieve and optimize the benefits of IT performance management?
61
6 Discussion 61
7 Future research 62
Literature 63
Annex 1 – Planning overview 69
Chapter 1 – IT performance management
7
Annex 2: One pager 70
Annex 3: Questionnaire IT Controller 71
Annex 4: Questionnaire CIO 72
Annex 5: Frameworks organization A, B, D and F 73
Chapter 1 – IT performance management
8
Chapter 1 – IT performance management
1 Introduction For organizations it is crucial to receive value for every euro they invest on. This requires a focus on performance management and the removal of non value-adding activities and processes. As the amount of scientific literature available on IT performance management is limited, a definition of IT performance management has been developed by my supervisors for this research. Therefore the definition used during this research is: “IT Performance Management can be defined as the area of setting goals, responsibility accounting and monitoring/ analyzing/ governing and improving the performance of IT.” IT performance management is often an aspect of achieving organizational and strategic goals and also a critical aspect of organizational controls (Kang, Bradley, 2002). However IT investments frequently result in unexpected, uncertain and undesired results (Van Grembergen, Van Bruggen, 1997; Turban, McLean, Wetherbe, 2001; Tuten, 2009, Strassman, 1997; Car, 2004). Therefore appropriate measures are required in order to identify and create metrics for measuring the contribution of IT to the organization‟s value chain (Lomerson and Tuten, 2005). According to Seddon, Graeser and Willcocks (2002) the amounts spend on IT indicate that organizations are capable of identifying which forms of IT expenditure and management are most effective. De Boer (2002) adds to this notion that the management and control of IT is also critical as organizational incomes are under pressure. Evaluating IT investments enables a natural learning process for the organization (Remenyi et al., 2000). Measuring IT results for organizations is complicated as some of the benefits are intangible (Finding, 2004). However, the return on investment is more relevant than before (Dekkers, 2004). The difficulty with measuring IT performance has lead to an increase in the evaluation and assessment of IT investments (Remenyi, Money and Sherwood-Smith, 2000). For IT to be successful in delivering against business requirements, management should put an internal control system or framework into place (IT Governance Institute, 2007). Being serious about implementing IT performance management let organizations to become proactive instead of reactive and chasing non-measurable and sometimes opportunistic IT goals (De Boer, 2002; Lagsten and Goldkuhl, 2008). It also contributes to the creation of value for the company and realizing business cases. Organizations adopt IT performance management in order to achieve specific objectives such as reducing expenses and creating a competitive advantage (Lomerson, Tuten, 2005). The need for organizations to achieve value on their investments and to become proactive requires research in the area of IT performance management. Providing insight into how organizations can benefit from IT performance management responds to the changes organizations face. During this research the scope will be limited to the utility sector, as it has been subject to change and it may lead to interesting findings on the application of IT performance management.
Chapter 1 – IT performance management
9
The main research question of this research is: “How do companies achieve and optimize the benefits of IT Performance Management?” To answer the main question four additional sub-questions need to be answered:
1. Which Key Performance Indicators are used, why, and what are the results? 2. How is the IT Performance governed? 3. How are the IT costs allocated to the business? 4. What are the results (tangible/intangible) that IT Performance Management delivers to a
company? The social and scientific relevance of this research is based on the fact that the area of IT performance management is relatively unexplored. A small amount of literature is available, which makes it difficult to develop an understanding of IT performance management and how an organization can apply it to its benefit. Guidelines on how to achieve advantages of IT performance management seem to be unavailable, even though they could be of great value. The results of this research could be used by organizations who want to use their IT performance results in order to become proactive and improve their IT performance management.
2 The objectives of IT performance management In the context of developing IT performance evaluation methods, researchers have developed a stream of tools, measures and techniques (Tuten, 2009; Renkema, 2000). But performance measures are rarely integrated or aligned with business processes, even though IT performance management requires insight in the functioning of processes and needs to use the performance results to increase performance (De Boer, 2002; Neely 1999). Achieving insight can be difficult as performance management measurements are often intertwined. Having a set of operationally-based objectives generally makes the evaluation process more straightforward (Remenyi et al., 2000). Process assessment enables the organization to determine the value of an innovation/investment (Remenyi et al., 2002; Brynjolfsson, Hitt, 1995; Barua et al, 1995, McKeen et al., 1999; Mooney et al., 1995 ; Vernet et al., 1996). By applying IT performance management, the vision and strategy of an organization are translated into concrete goals and organized based on four points of view: financial, customer, internal organization and learning, and growth abilities of the organization (De Boer, 2002). In order for an organization to gain advantage from IT performance management, it should be executed through planning and control, metrics and measurements, KPIs, financial indicators and service levels (Wiggers, De Boer-de Wit and Kok,2004). Simonson and Johnson (2006) provide additional characteristics to achieve organizational value, such as costing, directing and decision-making concerning the implementation, and use of IT resources within a firm. Andra (2006) defines four areas for which IT performance management is needed. The first area is about connecting IT to the bottom line of the organization. The level of performance is then demonstrated by the ability to present and communicate the value that IT services bring to the company‟s bottom line. Second, IT performance management is needed for business IT alignment. IT needs to be involved in activities that match and support the goals from the
Chapter 1 – IT performance management
10
business plan. Third and fourth, IT performance management is needed for IT efficiency and effectiveness. Some advantages of IT performance management are (De Boer, 2002): Applying a focus on the realization of strategic, financial and non-financial goals Making KPIs explicit and measurable The management of prognosis and action oriented reports The availability of consistent management information on strategic, tactical and
operational level (drill down) Using the results as a guideline for intra organizational communication Fostering a result-oriented culture/climate The possibility to benchmark the organization
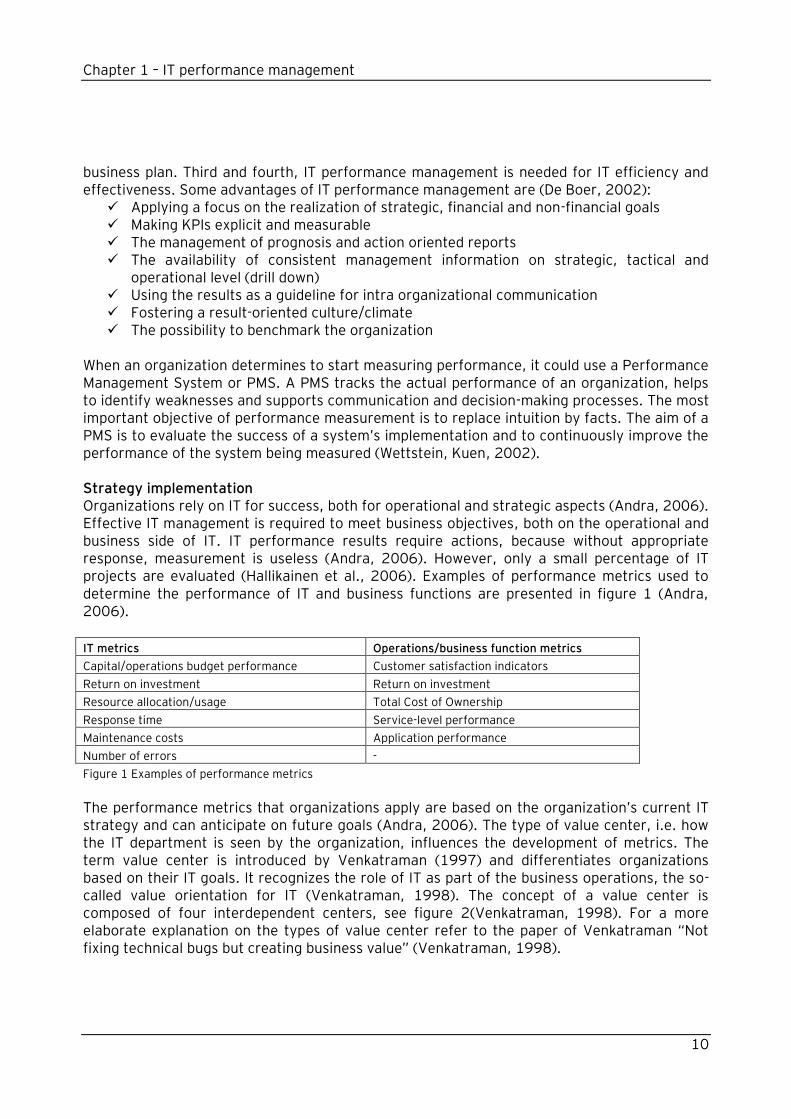
When an organization determines to start measuring performance, it could use a Performance Management System or PMS. A PMS tracks the actual performance of an organization, helps to identify weaknesses and supports communication and decision-making processes. The most important objective of performance measurement is to replace intuition by facts. The aim of a PMS is to evaluate the success of a system‟s implementation and to continuously improve the performance of the system being measured (Wettstein, Kuen, 2002). Strategy implementation Organizations rely on IT for success, both for operational and strategic aspects (Andra, 2006). Effective IT management is required to meet business objectives, both on the operational and business side of IT. IT performance results require actions, because without appropriate response, measurement is useless (Andra, 2006). However, only a small percentage of IT projects are evaluated (Hallikainen et al., 2006). Examples of performance metrics used to determine the performance of IT and business functions are presented in figure 1 (Andra, 2006).
IT metrics Operations/business function metrics
Capital/operations budget performance Customer satisfaction indicators
Return on investment Return on investment
Resource allocation/usage Total Cost of Ownership
Response time Service-level performance
Maintenance costs Application performance
Number of errors -
Figure 1 Examples of performance metrics
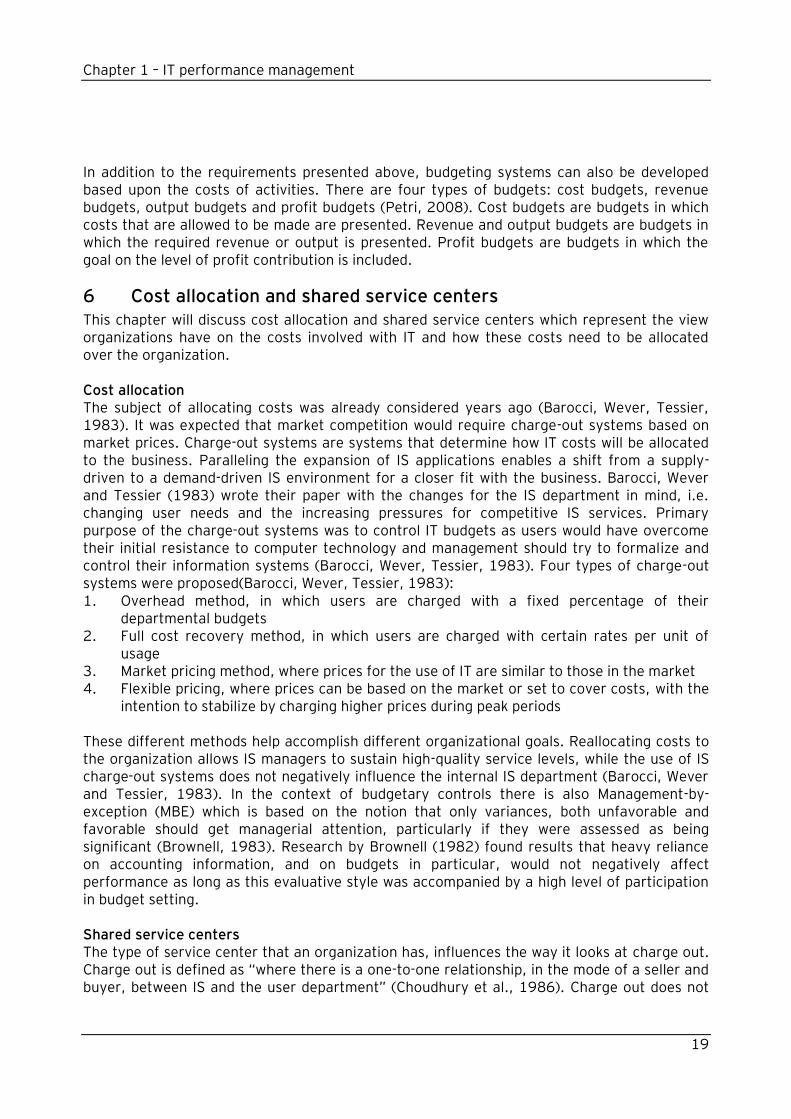
The performance metrics that organizations apply are based on the organization‟s current IT strategy and can anticipate on future goals (Andra, 2006). The type of value center, i.e. how the IT department is seen by the organization, influences the development of metrics. The term value center is introduced by Venkatraman (1997) and differentiates organizations based on their IT goals. It recognizes the role of IT as part of the business operations, the so-called value orientation for IT (Venkatraman, 1998). The concept of a value center is composed of four interdependent centers, see figure 2(Venkatraman, 1998). For a more elaborate explanation on the types of value center refer to the paper of Venkatraman “Not fixing technical bugs but creating business value” (Venkatraman, 1998).

Chapter 1 – IT performance management
11
Figure 2 Types of service centers
According to Sward (2006), IT often loses its significance as a major contributing success factor to the organization‟s strategic objectives. This happens because it is predominantly considered as a non-integral aspect on the process of achieving business objectives. Consequently budgets are squeezed yearly, shifting IT organizations toward the cost center view and making it hard to enable a long-term competitive advantage. But IT management should not be seen in isolation, as it disallows IT to show the profitability of the company it supports. Some reasons for IT performance measurement are (Finding, 2004): - Establish the progress toward achieving our goals - Document organizational IT achievements - Secure financial and other resources - Identify internal improvement opportunities - Improve communication with users IT performance measurement The selection process of a performance measure is crucial. It requires explicit communication about performance priorities and the relationships between the priorities to reveal hidden differences in the state of mind of stakeholders (Neely et al., 2000). There are several requirements to performance methods (Finding, 2004) like reliability, consistency, direct connection to important goals, understandability and that they need to be easily communicated. Measures also need to be agile and developed while being clear who is responsible for the measure and what actions are taken on the results of the measure. Performance measurement frameworks need to be balanced, multidimensional, comprehensive and integrated into the organizational performance measurement framework (Jack, 2002). They should not exist in isolation of performance management techniques and improvement initiatives, but reflect the requirements and goals of the organization (Ballantine and Brignall, 1994 referred to by Jack, 2002). It is this interface between measurement, management and leadership that is crucial in ensuring that performance measures drive value creation (Jack, 2002). Methods for IT measurement can be categorized into two groups; the financial and the organization-based methods (Neely, 2009). Financial measures are
Cost center
•Reflects an operational focus that minimizes risk with a dominant focus on operational efficiency
Service center
•While still minimizing risk, aims to create IT-enabled business capability to support current strategies
Investment center
•Has a longer-term focus and aims to create new IT-based business capabilities
Profit center
•To deliver IT services to the market for incremental revenue and gain learning and experience
Type of value center
Chapter 1 – IT performance management
12
traditionally used to determine the value of IT investments (De Boer, 2002). However it is impossible to capture all types of added value in financial indicators (Martinsons, 2000; Coleman, 1995; Avram, 2001). Instead of just using financial data, non-financial measures consent to a wider perspective on results achieved and increase the value accuracy (Read, 2009; Eccles, 1991) Additional non-financial measures are also better when identifying upcoming trends and possible future results (Andra, 2006). Some reasons why financial measures are not the best solution anymore are: - Financial measures encourage short-terminism, for example delay of capital investment
(Banks, Wheelright, 1979; Hayes and Abernathy, 1980) - Financial measures lack strategic focus and fail to provide data on quality,
responsiveness and flexibility (Skinner, 1974) - Financial measures encourage managers to minimize the variances from standard rather
than seek to improve continually (Schmenner, 1988; Turney, Anderson, 1989) - They fail to provide information on what customers want and how competitors are
performing (Neely, 1999). In addition, traditional financial measures provide no standards for reporting on IT costs, which decreases transparency (Read, 2009). Transparency in investments shows if goals have been met. As budgets are based on for example the previous year‟s percentage of sales or cost, the inability to measure IT value creates problems during the development of organizational budgets (Read, 2009). However the implementation of performance measures needs guidance and should take into consideration the potential impact and consequences (Jack, 2002). Measurement-managed organizations are described as organizations who have adopted a strategic and balanced set of KPIs which they use to plan, implement, operate and monitor the strategies, functions and processes of their organization with (ITPMG, 2006).
3 IT governance IT governance decision-making is mostly strategic oriented, therefore tactical decisions receive less attention. Emphasis is put on understanding the situation at hand prior to decision making and solving practical issues regarding how each decision is carried out, such as assigning decision-making authority, coordinating resources and aligning IT decision-making with external factors (Simonson, Johnson, 2006). Control and governance of IT have become important subjects in organizations. However in a study performed by Son, Weitzel and Laurent (2005), more than 91% of the interviewed CEOs and CIOs were not comfortable with answering questions about governance and IT control. Which is not a good thing as IT governance is a critical element of the organization (Cili, 2003). IT governance is defined as: The leadership and organizational structures, processes and relational mechanisms that ensure that an organization’s IT sustains and extends its strategy and objectives (De Haes and Van Grembergen, 2004; Van Grembergen, De Haes and Moons, 2005). IT governance is about maximizing value within given constraints and contributes to the achievement of a competitive advantage for the organization (Grembergen, 2000; Krakar, Žgela and Tomić Rotim, 2008; Cili, 2003). The focus of IT governance is on realizing a link between business and IT while concentrating on performing and transforming IT to meet both the current and future business demands (De Haes, Van Grembergen, 2004; Cili, 2003). When an organization has an effective IT governance structure it is simpler to acquire value from IT (Weill, Woodham, 2003). Designing an effective IT governance structure requires
Chapter 1 – IT performance management
13
understanding the competing forces in a large organization and creating harmony among business objectives, the governance archetype and business performance goals (Weill, Woodham, 2002). Nevertheless, effective IT governance is one of the best ways to achieve superior returns (Weill, Woodham, 2003). Examples of characteristics required for effective governance are: transparency, actively design governance, when to redesign governance, educate about governance, good governance requires choices and handling exceptions (Weill, Woodham, 2002).
3.1 Cobit
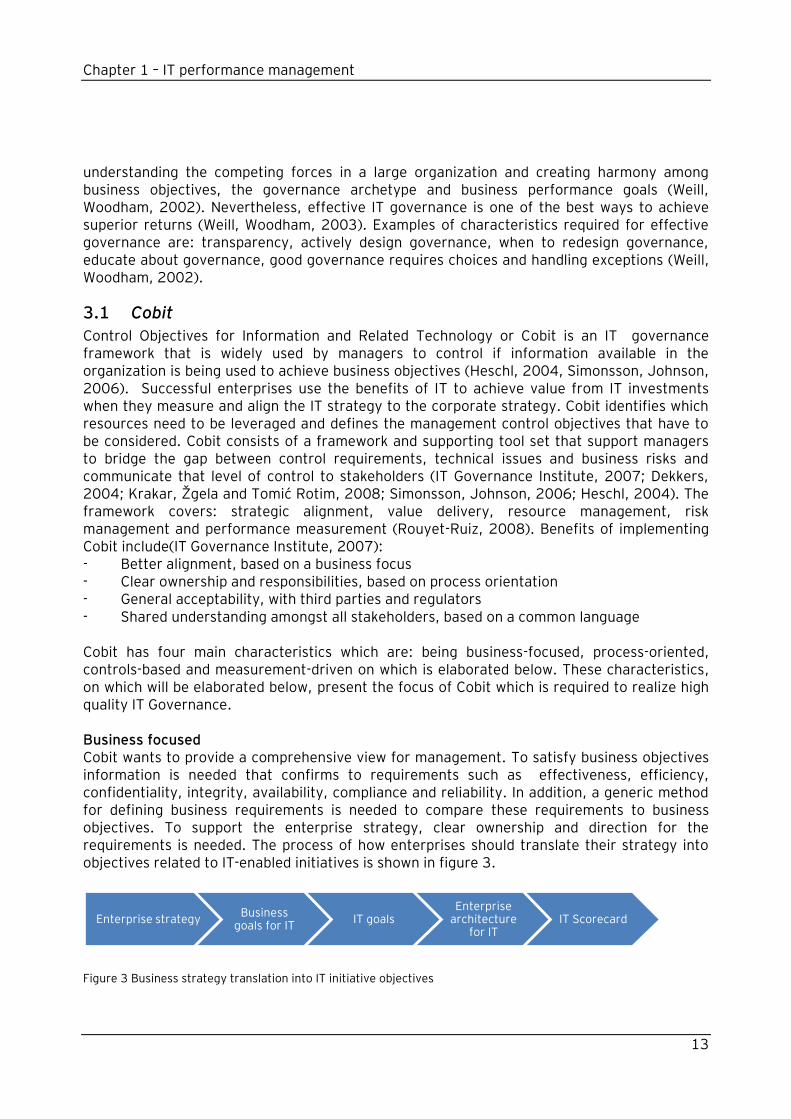
Control Objectives for Information and Related Technology or Cobit is an IT governance framework that is widely used by managers to control if information available in the organization is being used to achieve business objectives (Heschl, 2004, Simonsson, Johnson, 2006). Successful enterprises use the benefits of IT to achieve value from IT investments when they measure and align the IT strategy to the corporate strategy. Cobit identifies which resources need to be leveraged and defines the management control objectives that have to be considered. Cobit consists of a framework and supporting tool set that support managers to bridge the gap between control requirements, technical issues and business risks and communicate that level of control to stakeholders (IT Governance Institute, 2007; Dekkers, 2004; Krakar, Žgela and Tomić Rotim, 2008; Simonsson, Johnson, 2006; Heschl, 2004). The framework covers: strategic alignment, value delivery, resource management, risk management and performance measurement (Rouyet-Ruiz, 2008). Benefits of implementing Cobit include(IT Governance Institute, 2007): - Better alignment, based on a business focus - Clear ownership and responsibilities, based on process orientation - General acceptability, with third parties and regulators - Shared understanding amongst all stakeholders, based on a common language Cobit has four main characteristics which are: being business-focused, process-oriented, controls-based and measurement-driven on which is elaborated below. These characteristics, on which will be elaborated below, present the focus of Cobit which is required to realize high quality IT Governance. Business focused Cobit wants to provide a comprehensive view for management. To satisfy business objectives information is needed that confirms to requirements such as effectiveness, efficiency, confidentiality, integrity, availability, compliance and reliability. In addition, a generic method for defining business requirements is needed to compare these requirements to business objectives. To support the enterprise strategy, clear ownership and direction for the requirements is needed. The process of how enterprises should translate their strategy into objectives related to IT-enabled initiatives is shown in figure 3.
Figure 3 Business strategy translation into IT initiative objectives
Enterprise strategyBusiness
goals for ITIT goals
Enterprise architecture
for ITIT Scorecard
Chapter 1 – IT performance management
14
The IT organization delivers against these objectives with a set of processes to run automated business applications while leveraging business information. Process-oriented Cobit uses a reference process model for the public analysis and management of IT activities. To manage activities and risks there are several interrelated domains: plan and organize, acquire and implement, deliver and support and monitor and evaluate. Together these domains cover the strategy and tactics needed to enable the IT contribution when achieving business objectives. Controls-based From the domains described above, 34 processes are retrieved to provide assurance that the business objectives will be achieved. IT control objectives provide requirements to be considered by management for effective control of each IT process. Management uses these control objectives to select objectives which relate to what has to be measured. Operational management uses processes to organize and manage ongoing IT activities. Measurement-driven Insight into the status of IT systems is necessary to determine what level of management and control the organization needs. Therefore Cobit has maturity models, performance goals and metrics for IT processes, and activity goals in order to provide this insight into the IT system‟s status. Maturity models can be used to scale organizations and related aspects can be identified when performance improvement is needed. Other benefits from using maturity scales are: - Set of requirements and enabling aspects per maturity level - Scale for easy difference measurement - Possibility for pragmatic comparison - Basis for setting as-is and to-be positions - Support for gap analysis to determine what needs to be done to achieve a chosen level - Taken together, a view of how IT is managed in the enterprise.
4 Balanced scorecard The balanced scorecard is a method to determine IT performance management (Kaplan, Norton, 1996; Mulders, 2007) which contains both financial and operational measures as solely using financial measures is not enough anymore (Kaplan, Norton, 1992). The scorecard can be described as an effective tool for performance measurement, organizational assessment and operational alignment (Weinstein, 2009; Mulders, 2007). The balanced scorecard can provide organizations with a measurement and management system that supports the IT governance process through a combination of the business balanced scorecard and the IT balanced scorecard (Van Grembergen, 2000). The balanced scorecard contains financial views and is complemented by operational measures of customer satisfaction, internal processes and the organization‟s innovation. These operational measures are the drivers of future financial performance (Kaplan, Norton, 1992). The use of multiple perspectives is necessary because organizations require managers to control performance in different areas simultaneously (Kaplan, Norton, 1992). For each perspective key factors need to be determined which support the realization of the mission and vision of the organization (Mulders, 2007; De Boer, 2002). These factors are called the critical success factors (CSFs)
Chapter 1 – IT performance management
15
and are made measurable through key performance indicators (KPIs). KPIs express quantitatively to what extent the CSFs are achieved (Mulders, 2007;De Boer, 2002). Information overload is prevented by using a limited amount of measures (Mulders, 2007). The four different views of the balanced scorecard will be shortly explained below. Customer perspective When the organization depends on customer evaluations to define performance measures, it needs to view its performance through the customer‟s eyes (Kaplan and Norton, 1992). The balanced scorecard requires managers to translate their general mission statement on customer service into specific measures. Customer service factors can be divided into four categories: time, quality, performance and cost. The customer perspective, just as the financial perspective, has an outside-in approach (De Boer, 2002). This approach enables the timeline to grow from short term (financial perspective) to the long term (growth and learning perspective). Internal business perspective The customer-based measures, defined in the previous perspective, need to be translated into measures that the organization should execute to meet requirements. Managers need to focus on these critical operations and enable them to satisfy customer needs (Kaplan, Norton, 1992). The measures should be based upon the business processes that have the greatest impact on customer satisfaction, which mostly are factors like time, quality, employee skills and productivity. Kaplan and Norton (1992) state that information systems play an important role in supporting managers to separate the total overview of measures, however when unavailable, they are the soft spots of performance measurement. Innovation and learning perspective The customer-based and internal business process measures on the balanced scorecard identify the parameters that companies consider as the most important for competitive success. The ability of an organization to innovate, improve and learn directly influences the company‟s value (Kaplan, Norton, 1992). Financial perspective Financial performance measures provide insight into the company‟s strategy, implementation and execution contribution to bottom-line improvement. Typical financial goals involve profitability, growth and shareholder value. The measures that the company uses are derived from the company‟s view of the world and its perspective on key success factors. This view is not always correct, which means that a set of scorecard measures does not guarantee a winning strategy.
Chapter 1 – IT performance management
16
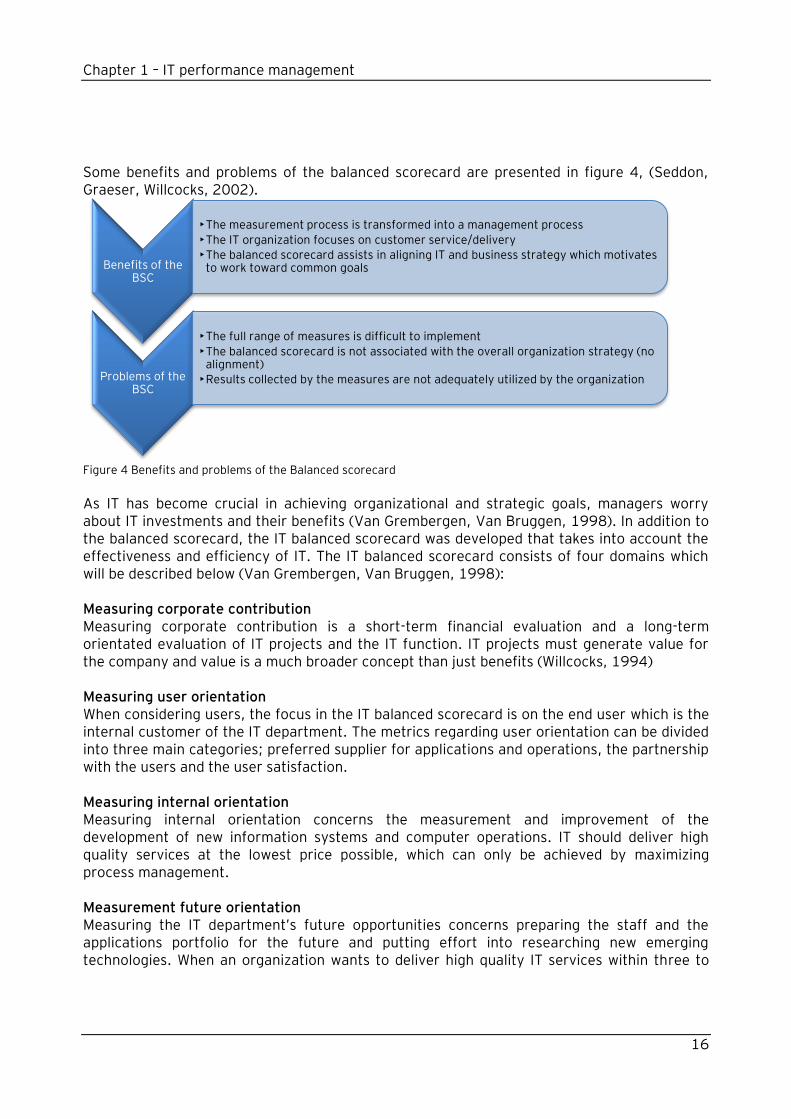
Some benefits and problems of the balanced scorecard are presented in figure 4, (Seddon, Graeser, Willcocks, 2002).
Figure 4 Benefits and problems of the Balanced scorecard
As IT has become crucial in achieving organizational and strategic goals, managers worry about IT investments and their benefits (Van Grembergen, Van Bruggen, 1998). In addition to the balanced scorecard, the IT balanced scorecard was developed that takes into account the effectiveness and efficiency of IT. The IT balanced scorecard consists of four domains which will be described below (Van Grembergen, Van Bruggen, 1998): Measuring corporate contribution Measuring corporate contribution is a short-term financial evaluation and a long-term orientated evaluation of IT projects and the IT function. IT projects must generate value for the company and value is a much broader concept than just benefits (Willcocks, 1994) Measuring user orientation When considering users, the focus in the IT balanced scorecard is on the end user which is the internal customer of the IT department. The metrics regarding user orientation can be divided into three main categories; preferred supplier for applications and operations, the partnership with the users and the user satisfaction. Measuring internal orientation Measuring internal orientation concerns the measurement and improvement of the development of new information systems and computer operations. IT should deliver high quality services at the lowest price possible, which can only be achieved by maximizing process management. Measurement future orientation Measuring the IT department‟s future opportunities concerns preparing the staff and the applications portfolio for the future and putting effort into researching new emerging technologies. When an organization wants to deliver high quality IT services within three to
Benefits of the BSC
•The measurement process is transformed into a management process
•The IT organization focuses on customer service/delivery
•The balanced scorecard assists in aligning IT and business strategy which motivates to work toward common goals
Problems of the BSC
•The full range of measures is difficult to implement
•The balanced scorecard is not associated with the overall organization strategy (no alignment)
•Results collected by the measures are not adequately utilized by the organization
Chapter 1 – IT performance management
17
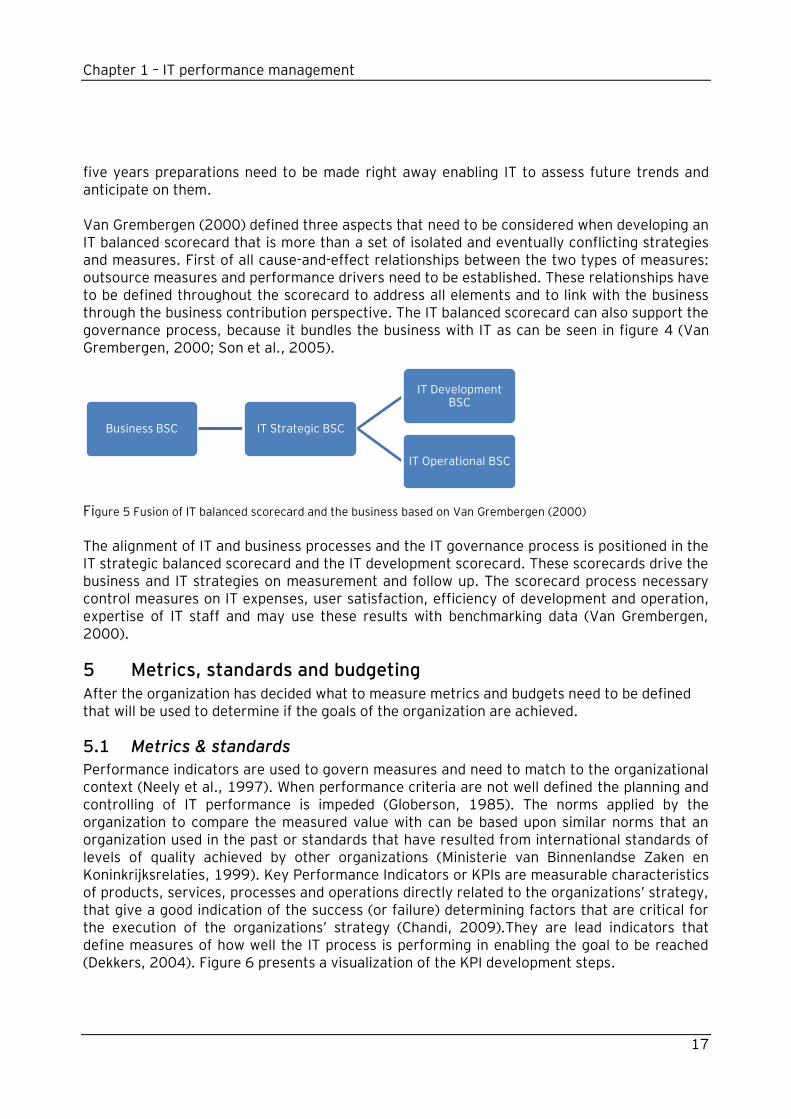
five years preparations need to be made right away enabling IT to assess future trends and anticipate on them. Van Grembergen (2000) defined three aspects that need to be considered when developing an IT balanced scorecard that is more than a set of isolated and eventually conflicting strategies and measures. First of all cause-and-effect relationships between the two types of measures: outsource measures and performance drivers need to be established. These relationships have to be defined throughout the scorecard to address all elements and to link with the business through the business contribution perspective. The IT balanced scorecard can also support the governance process, because it bundles the business with IT as can be seen in figure 4 (Van Grembergen, 2000; Son et al., 2005).
Figure 5 Fusion of IT balanced scorecard and the business based on Van Grembergen (2000) The alignment of IT and business processes and the IT governance process is positioned in the IT strategic balanced scorecard and the IT development scorecard. These scorecards drive the business and IT strategies on measurement and follow up. The scorecard process necessary control measures on IT expenses, user satisfaction, efficiency of development and operation, expertise of IT staff and may use these results with benchmarking data (Van Grembergen, 2000).
5 Metrics, standards and budgeting After the organization has decided what to measure metrics and budgets need to be defined that will be used to determine if the goals of the organization are achieved.
5.1 Metrics & standards
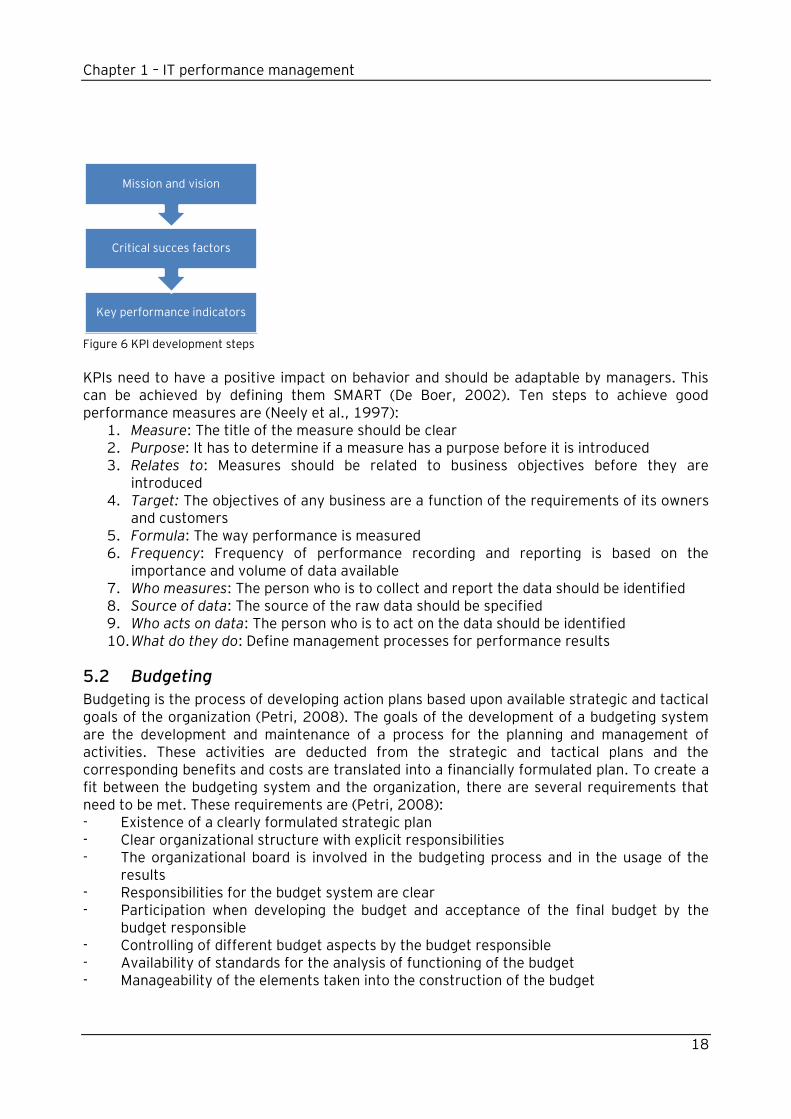
Performance indicators are used to govern measures and need to match to the organizational context (Neely et al., 1997). When performance criteria are not well defined the planning and controlling of IT performance is impeded (Globerson, 1985). The norms applied by the organization to compare the measured value with can be based upon similar norms that an organization used in the past or standards that have resulted from international standards of levels of quality achieved by other organizations (Ministerie van Binnenlandse Zaken en Koninkrijksrelaties, 1999). Key Performance Indicators or KPIs are measurable characteristics of products, services, processes and operations directly related to the organizations‟ strategy, that give a good indication of the success (or failure) determining factors that are critical for the execution of the organizations‟ strategy (Chandi, 2009).They are lead indicators that define measures of how well the IT process is performing in enabling the goal to be reached (Dekkers, 2004). Figure 6 presents a visualization of the KPI development steps.
Business BSC IT Strategic BSC
IT Development BSC
IT Operational BSC
Chapter 1 – IT performance management
18
Figure 6 KPI development steps
KPIs need to have a positive impact on behavior and should be adaptable by managers. This can be achieved by defining them SMART (De Boer, 2002). Ten steps to achieve good performance measures are (Neely et al., 1997):
1. Measure: The title of the measure should be clear 2. Purpose: It has to determine if a measure has a purpose before it is introduced 3. Relates to: Measures should be related to business objectives before they are
introduced 4. Target: The objectives of any business are a function of the requirements of its owners
and customers 5. Formula: The way performance is measured 6. Frequency: Frequency of performance recording and reporting is based on the
importance and volume of data available 7. Who measures: The person who is to collect and report the data should be identified 8. Source of data: The source of the raw data should be specified 9. Who acts on data: The person who is to act on the data should be identified 10. What do they do: Define management processes for performance results
5.2 Budgeting
Budgeting is the process of developing action plans based upon available strategic and tactical goals of the organization (Petri, 2008). The goals of the development of a budgeting system are the development and maintenance of a process for the planning and management of activities. These activities are deducted from the strategic and tactical plans and the corresponding benefits and costs are translated into a financially formulated plan. To create a fit between the budgeting system and the organization, there are several requirements that need to be met. These requirements are (Petri, 2008): - Existence of a clearly formulated strategic plan - Clear organizational structure with explicit responsibilities - The organizational board is involved in the budgeting process and in the usage of the
results - Responsibilities for the budget system are clear - Participation when developing the budget and acceptance of the final budget by the
budget responsible - Controlling of different budget aspects by the budget responsible - Availability of standards for the analysis of functioning of the budget - Manageability of the elements taken into the construction of the budget
Key performance indicators
Critical succes factors
Mission and vision
Chapter 1 – IT performance management
19
In addition to the requirements presented above, budgeting systems can also be developed based upon the costs of activities. There are four types of budgets: cost budgets, revenue budgets, output budgets and profit budgets (Petri, 2008). Cost budgets are budgets in which costs that are allowed to be made are presented. Revenue and output budgets are budgets in which the required revenue or output is presented. Profit budgets are budgets in which the goal on the level of profit contribution is included.
6 Cost allocation and shared service centers This chapter will discuss cost allocation and shared service centers which represent the view organizations have on the costs involved with IT and how these costs need to be allocated over the organization. Cost allocation The subject of allocating costs was already considered years ago (Barocci, Wever, Tessier, 1983). It was expected that market competition would require charge-out systems based on market prices. Charge-out systems are systems that determine how IT costs will be allocated to the business. Paralleling the expansion of IS applications enables a shift from a supply-driven to a demand-driven IS environment for a closer fit with the business. Barocci, Wever and Tessier (1983) wrote their paper with the changes for the IS department in mind, i.e. changing user needs and the increasing pressures for competitive IS services. Primary purpose of the charge-out systems was to control IT budgets as users would have overcome their initial resistance to computer technology and management should try to formalize and control their information systems (Barocci, Wever, Tessier, 1983). Four types of charge-out systems were proposed(Barocci, Wever, Tessier, 1983): 1. Overhead method, in which users are charged with a fixed percentage of their
departmental budgets 2. Full cost recovery method, in which users are charged with certain rates per unit of
usage 3. Market pricing method, where prices for the use of IT are similar to those in the market 4. Flexible pricing, where prices can be based on the market or set to cover costs, with the
intention to stabilize by charging higher prices during peak periods These different methods help accomplish different organizational goals. Reallocating costs to the organization allows IS managers to sustain high-quality service levels, while the use of IS charge-out systems does not negatively influence the internal IS department (Barocci, Wever and Tessier, 1983). In the context of budgetary controls there is also Management-by-exception (MBE) which is based on the notion that only variances, both unfavorable and favorable should get managerial attention, particularly if they were assessed as being significant (Brownell, 1983). Research by Brownell (1982) found results that heavy reliance on accounting information, and on budgets in particular, would not negatively affect performance as long as this evaluative style was accompanied by a high level of participation in budget setting. Shared service centers The type of service center that an organization has, influences the way it looks at charge out. Charge out is defined as “where there is a one-to-one relationship, in the mode of a seller and buyer, between IS and the user department” (Choudhury et al., 1986). Charge out does not
Chapter 1 – IT performance management
20
occur when this relationship is missing (Verner, Toraskar, Brown, 1996). Additionally employees do not feel responsible for the costs of activities of Shared Service Centers (SSC) when they perceive them as uninfluencable (Swager, 2008). Making users responsible for the costs of the IT services they use, motivates them select them with care and to develop commitment to the service (Verner, Toraskar, Brown, 1996). A SSC is a result-oriented unit in the internal organization which delivers services of a specific specialization to other business units based on an agreement and price. The costs made by the SSCs are allocated to the units that use the services, while the elements that together make the costs are placed in a charge model. The activities of the SSCs are categorized into service lines and it is decided if they will be charged one-on-one or based on an activity driver of customer size. The prices determined during the budgeting process are adjusted at the end of the track, when it is clear if units paid too much or too little. By clustering specialists in SSCs it is possible to increase the quality level of services and achieve standardization and economies of scale (Swager, 2008). Examples of IT charge out goals are: cost recovery, resource allocation, effective utilization of IS resources (Verner, Toraskar, Brown, 1996). Cost recovery means that a department can charge other departments who use their services to recover the investment. This approach is often applied as IT is mostly a service provider within the organization. The aim of resource allocation is to enable a fairer way of allocating services. When departments pay for their own needs, it will be the budget and not the manager that determines how much they can buy. Effective utilization of IS resources prevents the usage of unnecessary IT services and forces users to make effective use of IS they already have. The most important advantages of using charge out systems are improved organization wide IS function efficiency, improved communication and planning benefits, improved user accountability, autonomy and motivational benefits. However there are also some problems with charge out systems, for example short-term focus and costs in implementing the charge out system. Swager (2008) listed some elements of SSCs that are important for the functioning of these units. These elements will be presented below and will be accompanied with a short description when necessary: - Structure and organization: for good communication between different business units.
Important aspects are for example hierarchy and responsibilities. Taking care of good coordination between these different parties can prevent potential conflict situations.
- Change process: the involved parties should participate in the business case to create commitment to the changes that will come
- Communication: Remmers et al. (2005) state that the communication structure is a condition expected to guarantee a clear governance structure. Communication channels and committees should be created (Swager, 2008).
- Planning and control: the SSC should be based upon the business planning - Charge model: Swager (2008) refers to Strikwerda (2003) and Carlsson and Schurman
(2004), who both state that charge models are required. Choices for internal allocation are needed to enhance the acceptance and success of the SSC, as this is influenced by the experiences and acceptance of units who use the services (Strikwerda, 2003). Carlsson and Schurmann (2004) agree to this by saying that it is essential for an SSC to have insight into the cost structure to manage the relationship with its customers.
Chapter 1 – IT performance management
21
- Humans: because humans are in many cases responsible for errors made in SSCs. They need sufficient support from the business (Korthals Altes, 2005).
- The element “additional conditions” contains other factors that have to be taken into
account during the development and Construction of SSCs. Examples are the
development of the IT environment architecture and the identification of the activities of
the SSC.
Chapter 2 –Research method and protocol
22
Chapter 2 – Research method and protocol
1 Introduction Research requires a strategy (Maimbo, Pervan, 2005). Two well-known research disciplines are behavioral science and design science (Hevner, March, Park, 2004). Design-science tries to develop and verify theories that explain or predict human/organizational behavior. It is a problem-solving approach that tries to create innovations through which the implementation, management and use of information systems can be effectively and efficiently accomplished (Hevner, March, Park, 2004). Even though this research is not about information systems, the paradigm of design-science can be applied to this research, because is aims at developing a method or set of guidelines that support organizations in achieving benefits of IT performance management. Below the guidelines by Hevner, Mark and Park (2004) for conducting design-science are presented. These guidelines are also interwoven in this research approach. - Design as an artifact: Design-science research must produce a viable artifact in the form
of a construct/model/method or instantiation - Problem relevance: The objective of design-science research is to develop technology-
based solutions to important/relevant business problems - Design evaluation: The utility/quality and efficiency of a design artifact must be
rigorously demonstrated, via well-executed evaluation methods - Research contributions: Effective design-science research must provide clear/verifiable
contributions in the areas of the design artifact/foundations/design methodologies - Research rigor: Design-science research relies upon the application of rigorous methods
in both the construction and evaluation of the design artifact - Design as a search process: The research for an effective artifact requires utilizing
available means to reach desired ends while satisfying laws in the problem environment - Communication of research: Design-science research must be presented effectively both
to technology-oriented as well as management-oriented audiences A reason for the recognition of case study as a research method is the result of researchers “becoming concerned about the limitations of quantitative methods in providing holistic and in-depth explanations of the social and behavioral problems in question” (Zainal, 2007). Case study research (CSR) is a popular research strategy in IS (Cavaye, 1996; De Vries, 2005) that can be used for design-science research (Hevner, March, Park, 2004). It allows for the exploration of complex social phenomena in their natural environment (Yin, 1994; De Vries, 2005). And is widely used qualitative research method in information systems research (ISR) (Darke, Shanks, Broadbent, 1998; De Vries, 2005). Eisenhardt (1989) defines a case study as a research strategy which focuses on understanding the dynamics present within single settings. It allows for the development of, for example, descriptions, test theory or generate theory. Maimbo and Pervan (2005) describe a case study protocol as “a set of comprehensive guidelines that is an integral part of the case research design and contains the procedures for conducting the research, the research instrument itself, and the guidelines for data analysis. Before conducting a CSR, a Case Study Protocol (CSP) has to be developed. A CSP is a set of guidelines that constitute an integral part of the research design and contain the procedures for conducting the research, the research instrument and the guidelines for data analysis
Chapter 2 –Research method and protocol
23
(Maimbo, Pervan, 2005; Brereton, Kitchen, Budgen and Li, 2008). It increases the reliability of case study research and guides the researcher in carrying out the data collection from a single case (Yin, 2009; Eisenhardt, 1989; Maimbo & Pervan, 2005). There are several reasons for using a CSP (Jansen, Brinkkemper, 2008): First of all, it defines the aims of the case study in order to avoid conflict and confusion in the future. Secondly, it is used to convince participants for the usefulness of the research. Finally, it is a useful document to instruct different researchers at different sites and the reuse of research results.
2 Case study research In this chapter the basics of case study research will be introduced and explained.
2.1 Choosing the research method
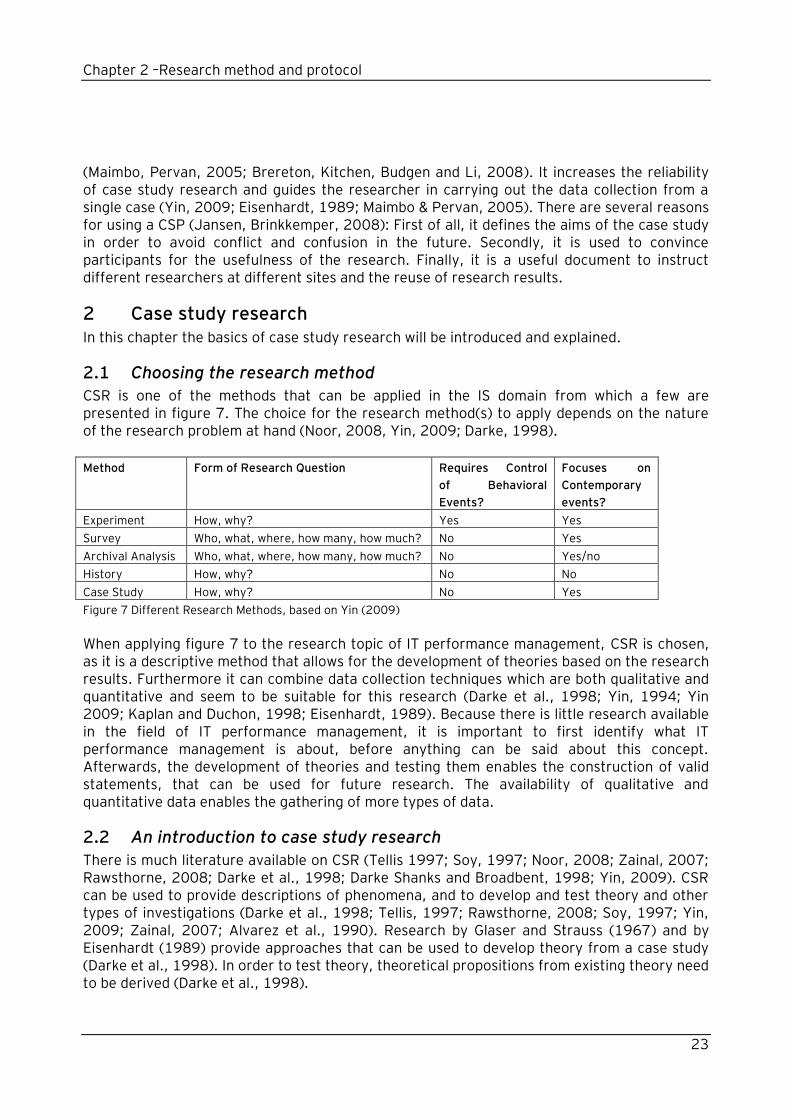
CSR is one of the methods that can be applied in the IS domain from which a few are presented in figure 7. The choice for the research method(s) to apply depends on the nature of the research problem at hand (Noor, 2008, Yin, 2009; Darke, 1998).
Method Form of Research Question Requires Control
of Behavioral
Events?
Focuses on
Contemporary
events?
Experiment How, why? Yes Yes
Survey Who, what, where, how many, how much? No Yes
Archival Analysis Who, what, where, how many, how much? No Yes/no
History How, why? No No
Case Study How, why? No Yes
Figure 7 Different Research Methods, based on Yin (2009)
When applying figure 7 to the research topic of IT performance management, CSR is chosen, as it is a descriptive method that allows for the development of theories based on the research results. Furthermore it can combine data collection techniques which are both qualitative and quantitative and seem to be suitable for this research (Darke et al., 1998; Yin, 1994; Yin 2009; Kaplan and Duchon, 1998; Eisenhardt, 1989). Because there is little research available in the field of IT performance management, it is important to first identify what IT performance management is about, before anything can be said about this concept. Afterwards, the development of theories and testing them enables the construction of valid statements, that can be used for future research. The availability of qualitative and quantitative data enables the gathering of more types of data.
2.2 An introduction to case study research
There is much literature available on CSR (Tellis 1997; Soy, 1997; Noor, 2008; Zainal, 2007; Rawsthorne, 2008; Darke et al., 1998; Darke Shanks and Broadbent, 1998; Yin, 2009). CSR can be used to provide descriptions of phenomena, and to develop and test theory and other types of investigations (Darke et al., 1998; Tellis, 1997; Rawsthorne, 2008; Soy, 1997; Yin, 2009; Zainal, 2007; Alvarez et al., 1990). Research by Glaser and Strauss (1967) and by Eisenhardt (1989) provide approaches that can be used to develop theory from a case study (Darke et al., 1998). In order to test theory, theoretical propositions from existing theory need to be derived (Darke et al., 1998).
Chapter 2 –Research method and protocol
24
Two well known definitions of CSR come from research by Yin (2009) and Cavaye (1996). The definition used by Yin (2009) to describe a case study as a research method is twofold and has a technical point of view. According to the definition, “a case study is an empirical inquiry that investigates a contemporary phenomenon in depth and within its real-life context, especially when the boundaries between phenomenon and context are not clearly evident. As to Cavaye (1996) CSR investigates predefined phenomena but does not involve explicit control or manipulation of variables: the focus is on in-depth understanding of a phenomenon and its context. Yin (2009) states that the execution of CSR is a linear but iterative process that should encompass the following steps: plan, design, prepare, collect, analyze and share. For more information on these steps we refer to Case Study Research – Design and Methods, by Yin (2009). Darke et al. (1998) also have determined steps for the execution of CSR, which resemble the approach of Yin (2009).
2.3 Advantages and disadvantages of case study research
Some advantages of CSR are that variations in approaches (e.g. regarding instruments), allow for both quantitative and qualitative analysis of the data (Zainal, 2007; Darke et al., 1998). In addition, detailed qualitative accounts can help explain complexities of everyday situations which may not be captured through experimental or survey research. However CSR has also been criticized with the assumption that scientific valid research is not possible. Some of the disadvantages named are: - Designing, scoping and collecting the results can be difficult and result in large amounts
of data (Darke et al., 1998; Yin, 1994, p10; Cavaye, 1996; Zainal, 2007). - Difficulties in generalizing research results and subjectivity of the data collection and
analysis processes (Darke et al. 1998; Zainal, 2007). - A frequent criticism of case study methodology is that its dependence on a single case
renders it incapable of providing a generalized conclusion (Tellis, 1997; Zainal, 2007). Overcoming disadvantages in this research During the development and execution of this research, preparations were made to overcome these disadvantages. First of all the research scope was determined and the case studies were conducted within the utility sector, with one exception as this company was retrieved during a personal connection. A maximum of five organizations from the utility sector was involved to prevent data overload. There were two interviews with different people from each participating organization, to overcome subjectivity problems. Next to these two interviews, documentation from the organization was used, in order to compare the interviews with objective data. The focus of the research on the utility sector and the use of multiple case studies also allowed for easier generalization of the research results.
3 Research approach Based on the research method by Yin (2009) the research approach for this research was developed. Here, the research questions and research plan will be introduced.
3.1 Research questions
The research questions are based upon a problem description provided by Ernst and Young, which focused on the pressure on organizations to achieve value for the money they invest in their IT performance management. This resulted in the main question of this research:
Chapter 2 –Research method and protocol
25
How do companies achieve and optimize the benefits of IT performance management? To answer the main question, several sub-questions have to be answered. In order to optimize the benefits that organizations achieve by having IT performance management, we should first make clear what type of business benefits (tangible/intangible) are delivered by IT performance management. This results in the first sub-question.
1) What are the business benefits that IT performance management delivers? KPIs are used to determine the performance of the organization and to see if the goals that the organization has set are being achieved. When they are made explicit organizations can validate if they use the right KPIs to measure what they want to know. Therefore, the second sub-question zooms in on the KPIs that the organization uses.
2) Which Key Performance Indicators are used, why and what are the results?
Once the KPIs are identified it is important to know how they are used to govern the organization. Insight into this process might explain if the organization achieves value from managing their IT performance. Also, insight into how the organization manages its IT performance can be derived from the allocation of the IT costs to the business, or by inspecting in general what their approach to IT costs is, which resulted in the third and fourth sub-question.
3) How are these KPIs used to govern the organization? 4) How are the IT costs allocated to the business?
3.2 Research plan
For the purpose of a structured approach, the research will consist of five different phases; (1) research planning, (2) literature research, (3) case studies, (4) synthesis of performance management approach and (5) the thesis. The planning overview can be found in Appendix 1- Planning overview. Research planning During the first phase, a schedule for the graduation project was made and research questions, scope, milestones and deliverables were determined. Also, the first contacts with the organizations who would participate in the CSR were made. The research planning served as a guideline throughout the process and the deliverables and milestones enable to determine if the process is on track. Literature research After the research plan was made, literature research and case studies were initiated in parallel. During literature research, the available literature on IT performance management was be collected and compared and a description of the different elements of IT performance management was made.
Chapter 2 –Research method and protocol
26
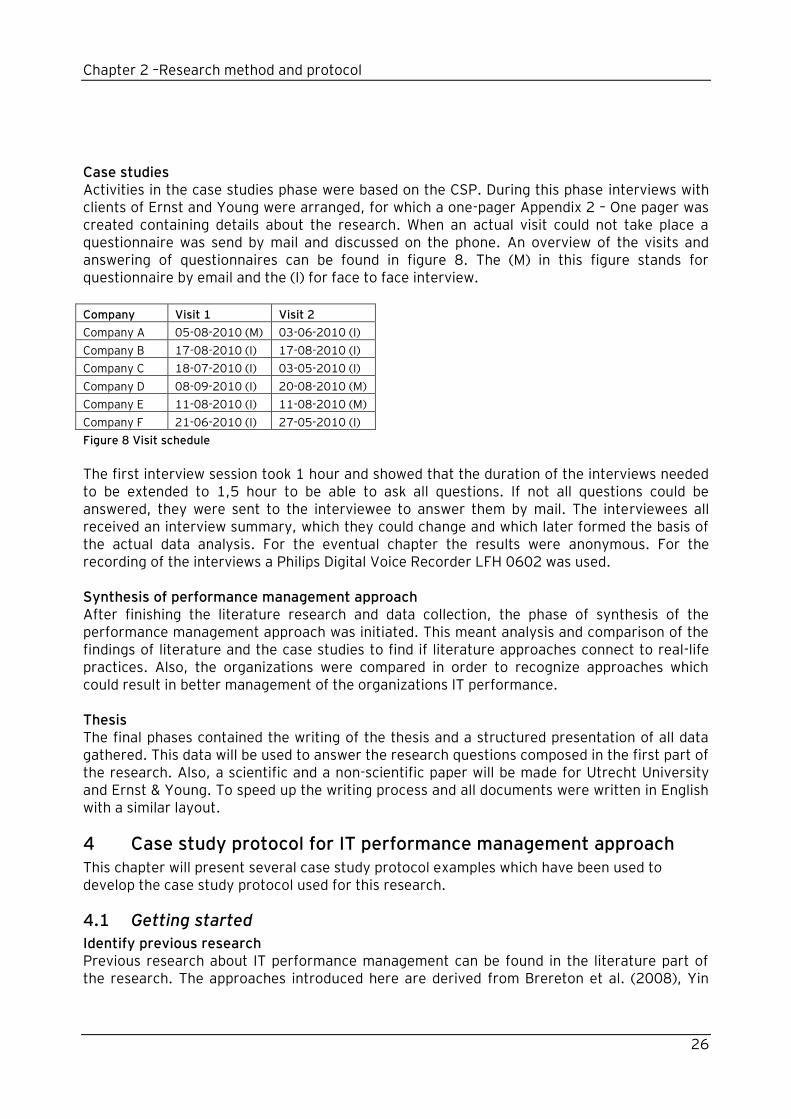
Case studies Activities in the case studies phase were based on the CSP. During this phase interviews with clients of Ernst and Young were arranged, for which a one-pager Appendix 2 – One pager was created containing details about the research. When an actual visit could not take place a questionnaire was send by mail and discussed on the phone. An overview of the visits and answering of questionnaires can be found in figure 8. The (M) in this figure stands for questionnaire by email and the (I) for face to face interview.
Figure 8 Visit schedule
The first interview session took 1 hour and showed that the duration of the interviews needed to be extended to 1,5 hour to be able to ask all questions. If not all questions could be answered, they were sent to the interviewee to answer them by mail. The interviewees all received an interview summary, which they could change and which later formed the basis of the actual data analysis. For the eventual chapter the results were anonymous. For the recording of the interviews a Philips Digital Voice Recorder LFH 0602 was used. Synthesis of performance management approach After finishing the literature research and data collection, the phase of synthesis of the performance management approach was initiated. This meant analysis and comparison of the findings of literature and the case studies to find if literature approaches connect to real-life practices. Also, the organizations were compared in order to recognize approaches which could result in better management of the organizations IT performance. Thesis The final phases contained the writing of the thesis and a structured presentation of all data gathered. This data will be used to answer the research questions composed in the first part of the research. Also, a scientific and a non-scientific paper will be made for Utrecht University and Ernst & Young. To speed up the writing process and all documents were written in English with a similar layout.
4 Case study protocol for IT performance management approach This chapter will present several case study protocol examples which have been used to develop the case study protocol used for this research.
4.1 Getting started
Identify previous research Previous research about IT performance management can be found in the literature part of the research. The approaches introduced here are derived from Brereton et al. (2008), Yin
Company Visit 1 Visit 2
Company A 05-08-2010 (M) 03-06-2010 (I)
Company B 17-08-2010 (I) 17-08-2010 (I)
Company C 18-07-2010 (I) 03-05-2010 (I)
Company D 08-09-2010 (I) 20-08-2010 (M)
Company E 11-08-2010 (I) 11-08-2010 (M)
Company F 21-06-2010 (I) 27-05-2010 (I)
Chapter 2 –Research method and protocol
27
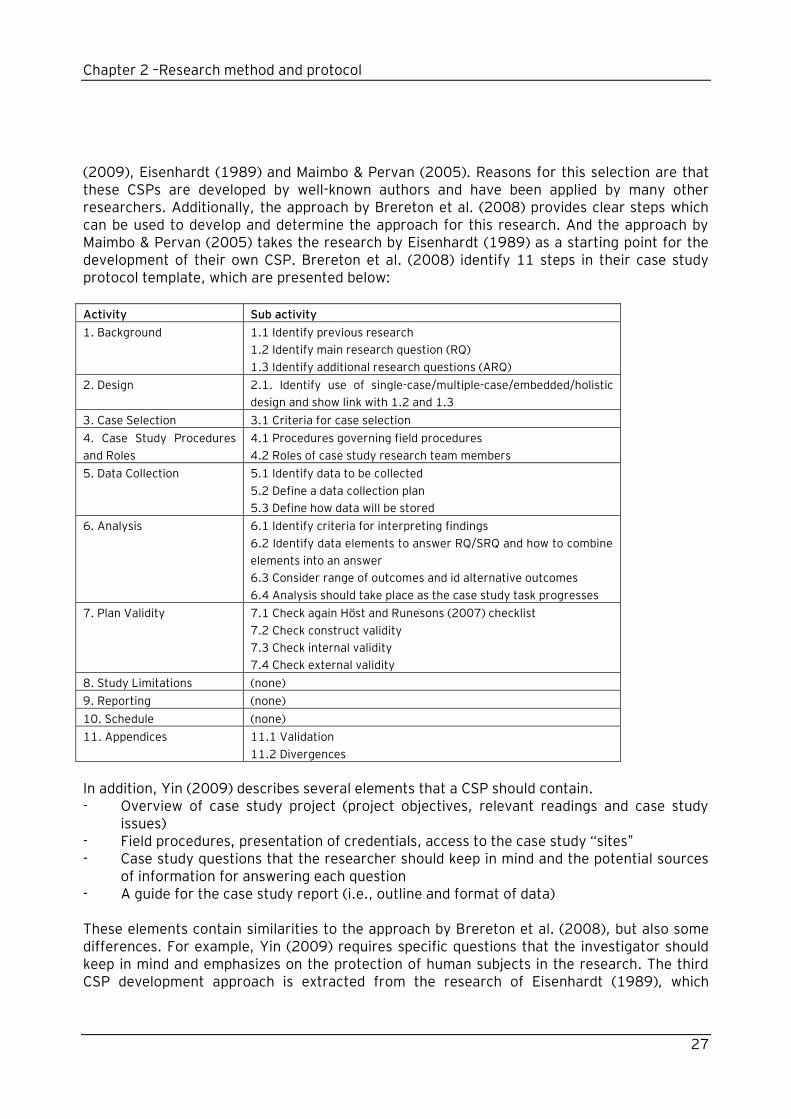
(2009), Eisenhardt (1989) and Maimbo & Pervan (2005). Reasons for this selection are that these CSPs are developed by well-known authors and have been applied by many other researchers. Additionally, the approach by Brereton et al. (2008) provides clear steps which can be used to develop and determine the approach for this research. And the approach by Maimbo & Pervan (2005) takes the research by Eisenhardt (1989) as a starting point for the development of their own CSP. Brereton et al. (2008) identify 11 steps in their case study protocol template, which are presented below:
Activity Sub activity
1. Background
1.1 Identify previous research
1.2 Identify main research question (RQ)
1.3 Identify additional research questions (ARQ)
2. Design 2.1. Identify use of single-case/multiple-case/embedded/holistic
design and show link with 1.2 and 1.3
3. Case Selection 3.1 Criteria for case selection
4. Case Study Procedures
and Roles
4.1 Procedures governing field procedures
4.2 Roles of case study research team members
5. Data Collection
5.1 Identify data to be collected
5.2 Define a data collection plan
5.3 Define how data will be stored
6. Analysis
6.1 Identify criteria for interpreting findings
6.2 Identify data elements to answer RQ/SRQ and how to combine
elements into an answer
6.3 Consider range of outcomes and id alternative outcomes
6.4 Analysis should take place as the case study task progresses
7. Plan Validity
7.1 Check again Höst and Runesons (2007) checklist
7.2 Check construct validity
7.3 Check internal validity
7.4 Check external validity
8. Study Limitations (none)
9. Reporting (none)
10. Schedule (none)
11. Appendices 11.1 Validation
11.2 Divergences
In addition, Yin (2009) describes several elements that a CSP should contain. - Overview of case study project (project objectives, relevant readings and case study
issues) - Field procedures, presentation of credentials, access to the case study “sites” - Case study questions that the researcher should keep in mind and the potential sources
of information for answering each question - A guide for the case study report (i.e., outline and format of data) These elements contain similarities to the approach by Brereton et al. (2008), but also some differences. For example, Yin (2009) requires specific questions that the investigator should keep in mind and emphasizes on the protection of human subjects in the research. The third CSP development approach is extracted from the research of Eisenhardt (1989), which
Chapter 2 –Research method and protocol
28
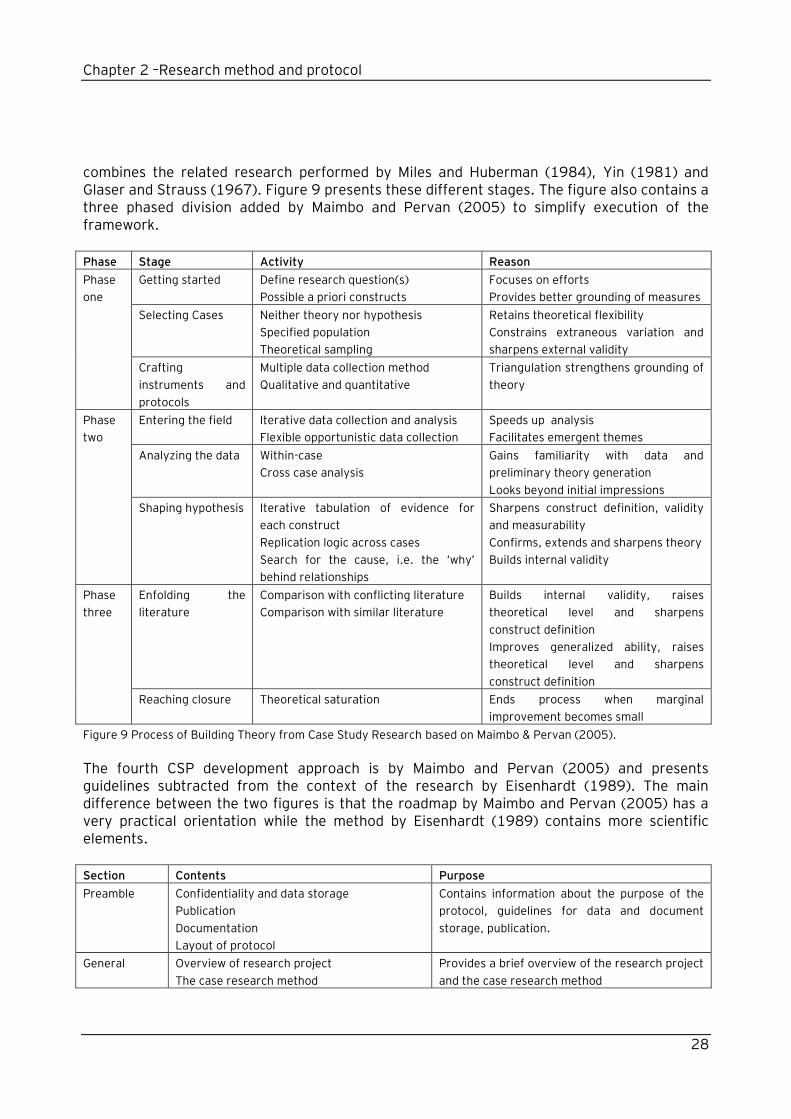
combines the related research performed by Miles and Huberman (1984), Yin (1981) and Glaser and Strauss (1967). Figure 9 presents these different stages. The figure also contains a three phased division added by Maimbo and Pervan (2005) to simplify execution of the framework.
Phase Stage Activity Reason
Phase
one
Getting started Define research question(s)
Possible a priori constructs
Focuses on efforts
Provides better grounding of measures
Selecting Cases Neither theory nor hypothesis
Specified population
Theoretical sampling
Retains theoretical flexibility
Constrains extraneous variation and
sharpens external validity
Crafting
instruments and
protocols
Multiple data collection method
Qualitative and quantitative
Triangulation strengthens grounding of
theory
Phase
two
Entering the field Iterative data collection and analysis
Flexible opportunistic data collection
Speeds up analysis
Facilitates emergent themes
Analyzing the data Within-case
Cross case analysis
Gains familiarity with data and
preliminary theory generation
Looks beyond initial impressions
Shaping hypothesis Iterative tabulation of evidence for
each construct
Replication logic across cases
Search for the cause, i.e. the „why‟
behind relationships
Sharpens construct definition, validity
and measurability
Confirms, extends and sharpens theory
Builds internal validity
Phase
three
Enfolding the
literature
Comparison with conflicting literature
Comparison with similar literature
Builds internal validity, raises
theoretical level and sharpens
construct definition
Improves generalized ability, raises
theoretical level and sharpens
construct definition
Reaching closure Theoretical saturation Ends process when marginal
improvement becomes small
Figure 9 Process of Building Theory from Case Study Research based on Maimbo & Pervan (2005).
The fourth CSP development approach is by Maimbo and Pervan (2005) and presents guidelines subtracted from the context of the research by Eisenhardt (1989). The main difference between the two figures is that the roadmap by Maimbo and Pervan (2005) has a very practical orientation while the method by Eisenhardt (1989) contains more scientific elements.
Section Contents Purpose
Preamble Confidentiality and data storage
Publication
Documentation
Layout of protocol
Contains information about the purpose of the
protocol, guidelines for data and document
storage, publication.
General Overview of research project
The case research method
Provides a brief overview of the research project
and the case research method
Chapter 2 –Research method and protocol
29
Procedures Initial approach to organizations
Scheduling of field visits
Length of sessions
Equipment and stationery
Detailed description of the procedures for
conducting each case to ensure uniformity in the
data collection process and to facilitate both
within case and cross case analyses.
Research
instrument(s)
Research instrument(s) that may either be
qualitative or quantitative
Research instruments developed utilizing
guidelines by Neuman (2000) and Sekaran
(2000).
Data analysis
guidelines
Overview of data analysis processes
Details regarding data triangulation and
convergence
Description of within case/cross sector
analysis process
Data schema
Description of data display used in analysis
A priori list of codes for qualitative analysis
Guidelines for data analysis
Appendix Participation request letter Template letter used to invite participants to
research
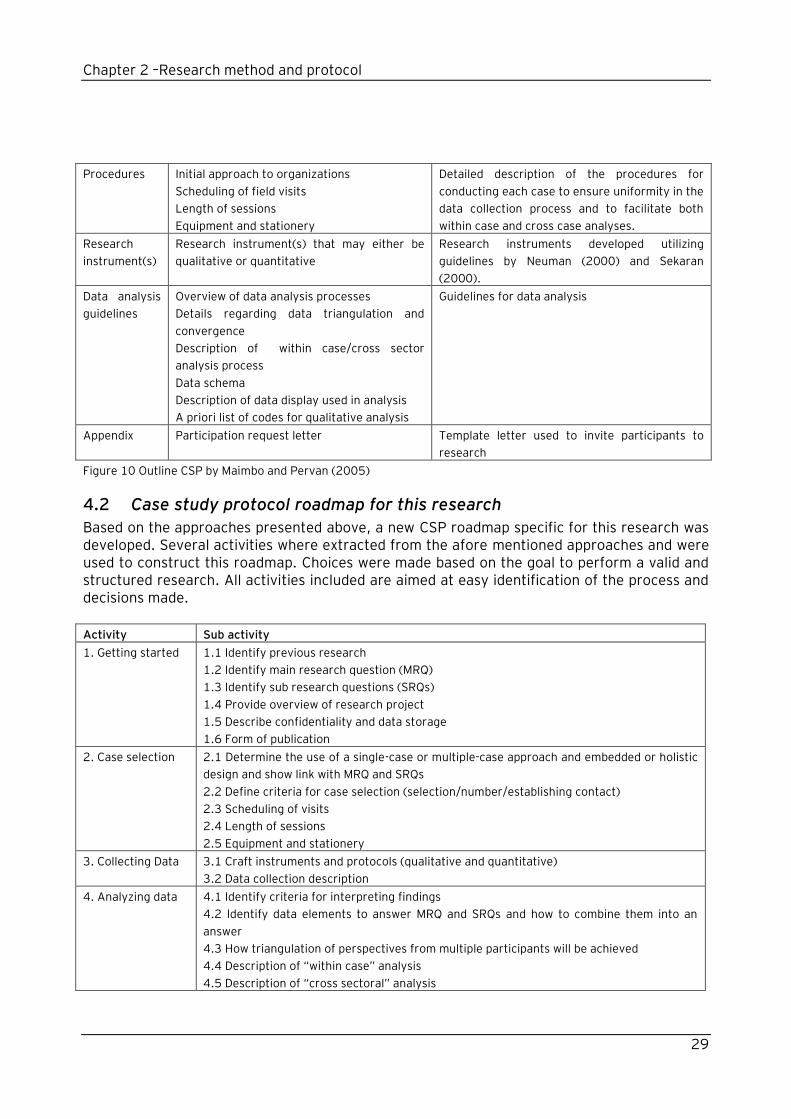
Figure 10 Outline CSP by Maimbo and Pervan (2005)
4.2 Case study protocol roadmap for this research
Based on the approaches presented above, a new CSP roadmap specific for this research was developed. Several activities where extracted from the afore mentioned approaches and were used to construct this roadmap. Choices were made based on the goal to perform a valid and structured research. All activities included are aimed at easy identification of the process and decisions made.
Activity Sub activity
1. Getting started 1.1 Identify previous research
1.2 Identify main research question (MRQ)
1.3 Identify sub research questions (SRQs)
1.4 Provide overview of research project
1.5 Describe confidentiality and data storage
1.6 Form of publication
2. Case selection 2.1 Determine the use of a single-case or multiple-case approach and embedded or holistic
design and show link with MRQ and SRQs
2.2 Define criteria for case selection (selection/number/establishing contact)
2.3 Scheduling of visits
2.4 Length of sessions
2.5 Equipment and stationery
3. Collecting Data 3.1 Craft instruments and protocols (qualitative and quantitative)
3.2 Data collection description
4. Analyzing data 4.1 Identify criteria for interpreting findings
4.2 Identify data elements to answer MRQ and SRQs and how to combine them into an
answer
4.3 How triangulation of perspectives from multiple participants will be achieved
4.4 Description of “within case” analysis
4.5 Description of “cross sectoral” analysis
Chapter 2 –Research method and protocol
30
4.6 Consider range of outcomes and identify alternative outcomes
5. Plan Validity 5.1 Check construct validity
5.2 Check internal validity
5.3 Check external validity
6. Rounding up 6.1 Enfolding literature (compare with conflicting/similar literature)
Limitations
4.3 Case selection
Determine the use of a single-case/ multiple-case approach and embedded/ holistic design and show link with MRQ and SRQs The goal of the research is to make statements about how organizations achieve and optimize the benefits of IT performance management. This requires a multiple-case approach with a holistic design, because the ITPM of the individual companies is going to be observed and the results for the ITPM level of all companies will be compared. This links to the MRQ and SRQs that the MRQ is about companies in general and that the SRQs discuss just one element of the companies, namely the IT performance management.
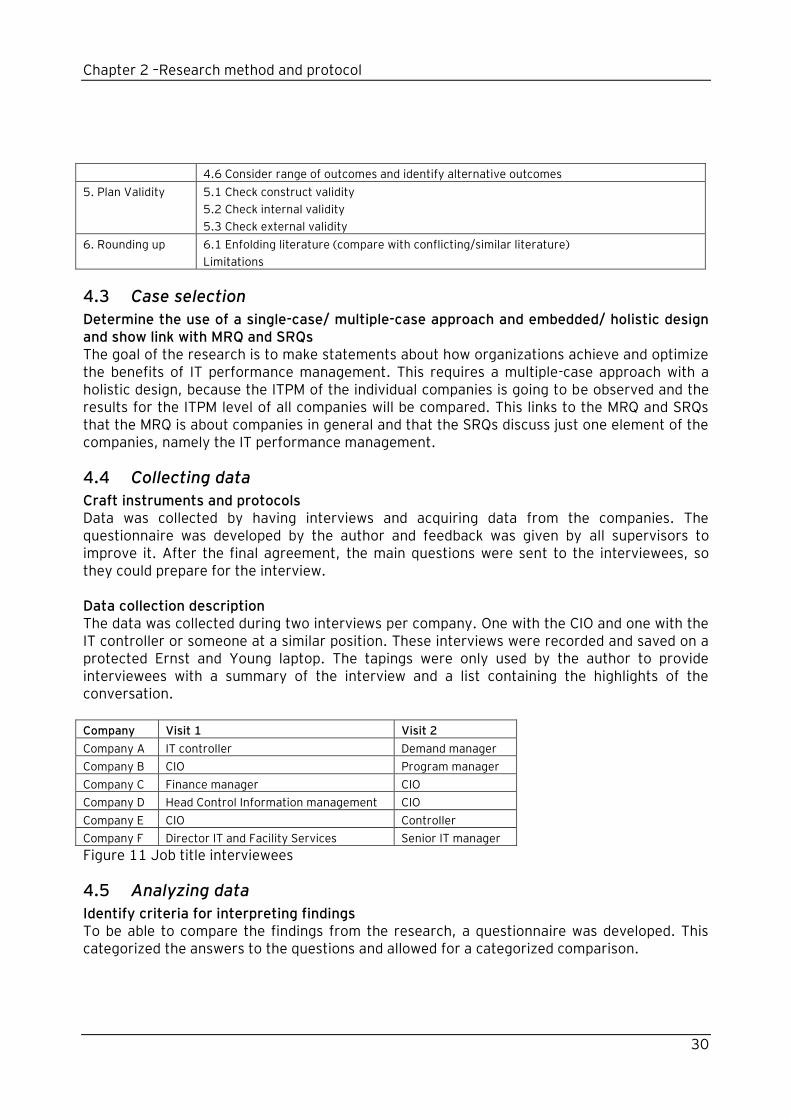
4.4 Collecting data
Craft instruments and protocols Data was collected by having interviews and acquiring data from the companies. The questionnaire was developed by the author and feedback was given by all supervisors to improve it. After the final agreement, the main questions were sent to the interviewees, so they could prepare for the interview. Data collection description The data was collected during two interviews per company. One with the CIO and one with the IT controller or someone at a similar position. These interviews were recorded and saved on a protected Ernst and Young laptop. The tapings were only used by the author to provide interviewees with a summary of the interview and a list containing the highlights of the conversation.
Company Visit 1 Visit 2
Company A IT controller Demand manager
Company B CIO Program manager
Company C Finance manager CIO
Company D Head Control Information management CIO
Company E CIO Controller
Company F Director IT and Facility Services Senior IT manager
Figure 11 Job title interviewees
4.5 Analyzing data
Identify criteria for interpreting findings To be able to compare the findings from the research, a questionnaire was developed. This categorized the answers to the questions and allowed for a categorized comparison.
Chapter 2 –Research method and protocol
31
Identify data elements to answer RQs and how to combine them into an answer The data gathered through the questionnaire was used to answer the research questions. During the case study an adjusted questionnaire for the CIO was used, which left out some of the controller-specific questions. Both questionnaires are added as annexes and the main questions will be used to map the data elements to the RQs. The questionnaire for the IT controller can be found in Annex 3 – Questionnaire IT controller and the questionnaire for the CIO can be found in Annex 4 – Questionnaire CIO. Due to the open character of the interview, the interviewees provided a large amount of information on the approach of their organization which helped to fill out blanks about the research questions. The questionnaire contained the following six main questions:
1. What is the context of IT within the organization? 2. Which goal does the organization want to achieve with IT performance management? 3. Which Key Performance Indicators are used, why and what are the results? 4. How is IT performance management located in the business? 5. How is IT performance management used to govern the organization? 6. How do you make sure that IT is both effective and efficient?
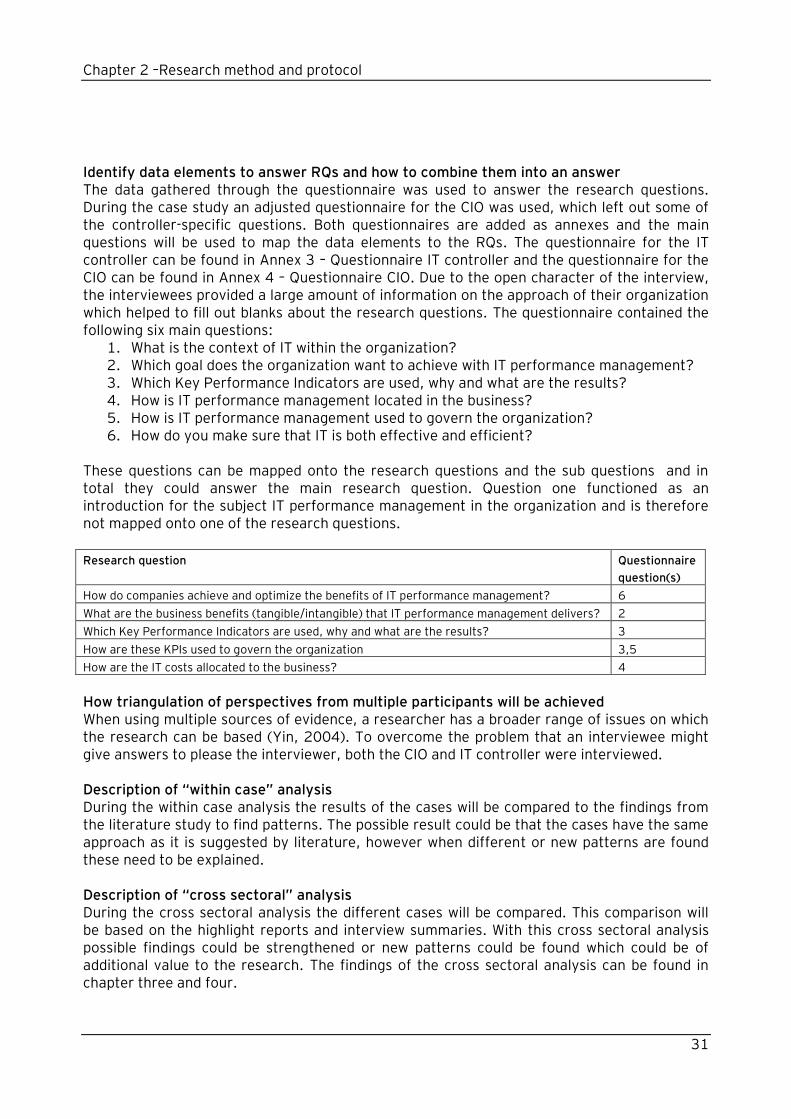
These questions can be mapped onto the research questions and the sub questions and in total they could answer the main research question. Question one functioned as an introduction for the subject IT performance management in the organization and is therefore not mapped onto one of the research questions.
Research question Questionnaire
question(s)
How do companies achieve and optimize the benefits of IT performance management? 6
What are the business benefits (tangible/intangible) that IT performance management delivers? 2
Which Key Performance Indicators are used, why and what are the results? 3
How are these KPIs used to govern the organization 3,5
How are the IT costs allocated to the business? 4
How triangulation of perspectives from multiple participants will be achieved When using multiple sources of evidence, a researcher has a broader range of issues on which the research can be based (Yin, 2004). To overcome the problem that an interviewee might give answers to please the interviewer, both the CIO and IT controller were interviewed. Description of “within case” analysis During the within case analysis the results of the cases will be compared to the findings from the literature study to find patterns. The possible result could be that the cases have the same approach as it is suggested by literature, however when different or new patterns are found these need to be explained. Description of “cross sectoral” analysis During the cross sectoral analysis the different cases will be compared. This comparison will be based on the highlight reports and interview summaries. With this cross sectoral analysis possible findings could be strengthened or new patterns could be found which could be of additional value to the research. The findings of the cross sectoral analysis can be found in chapter three and four.
Chapter 2 –Research method and protocol
32
4.6 Plan validity
Check construct validity Construct validity is satisfied when concepts being studied are operationalized and measured correctly (Jansen, Brinkkemper, 2008). To guarantee construct validity for this research several actions have been taken that were based on the research of Yin (2004). First of all, multiple sources of evidence have been used for the interviews: interviews and data provided by the organizations. As can be derived from this description, two types of triangulation are applied in this research. These types are investigator triangulation and data triangulation (Patton, 2002).In addition to multiple sources of evidence, a chain of evidence will be established for repeatability of the research. Also key informants will review the draft case study report. Check internal validity To check internal validity, the analytic technique of explanation building will be performed, while causal links about the case studies will be developed. Because explanation building requires a careful approach to guarantee validity, the set of iterations by Yin (2004) will be used to guide this process. These steps are: - Making an initial theoretical statement or an initial proposition about policy or social
behavior - Comparing the findings of an initial case against such a statement or proposition - Revising the statement or proposition - Comparing other details of the case against the revision - Comparing the revision to the facts or >= 2 cases - Repeat this process as many times as needed Check external validity External validity is defined as establishing the domain to which the findings of a study can be generalized (Jansen, Brinkkemper, 2008). The cases conducted for this research are found to be representative to the Dutch Utility sector.
4.7 Rounding up
A literature overview can be found in the literature list. Limitations of the research can be found in the discussion in chapter four.
Chapter 3 – The IT performance maturity model
33
Chapter 3 – The IT performance maturity model
Chapter three combines the results from literature and the results from the interviews. The data is used to develop a framework, a meta-model and a Process-data diagram. These deliverables are used to compare the research results.
1 IT performance maturity model
1.1 Framework construction
A framework has been developed to compare the different organizational IT performance management approaches and the characteristics retrieved from literature. The framework is developed by allocating the characteristics over three1 identified elements of performance management which will shortly be explained. - IT performance management can be defined as the area of setting goals, responsibility
accounting and monitoring, analyzing, governing and improving the performance of IT - IT performance measurement is about the development and adoption of a strategic set
of performance metrics and using them to plan, implement, operate and monitor the strategies, functions and processes of the organization with (ITPMG, 2006)
- Cost allocation is the allocation of IT costs to the business Each of the categories of performance management has characteristics that can be divided into a plan, do, check or act phase and will these phases will be explained below (HCI, 2010). All ITPM characteristics have been allocated to one of these phases so they could be more easily compared. The phases are developed by Shewart (1931) and allow for optimizing and improving a single process model (Basili, 1995). - Plan to improve operations by identifying what is going wrong and developing solutions
for these problems - Do implements changes to solve problems. First this is done on a small scale first to
minimize disruption of routine while testing if they really work - Check if the small changes are achieving desired results. Also check key activities to
ensure that the output allows for the identification of new problems when they arise - Act to implement the changes when they show to be successful. This is done by making
them part of your routine. Also involve other parties who are affected by the changes and whose cooperation is necessary to implement the changes on a larger scale and share experiences or lessons learned
1 In the original situation there was a fourth element, budgeting, included in the framework. This aspect has been excluded from
the framework as it was not covered sufficiently in the interviews to determine if characteristics had been applied or not and
therefore would not be able to contribute to the research.
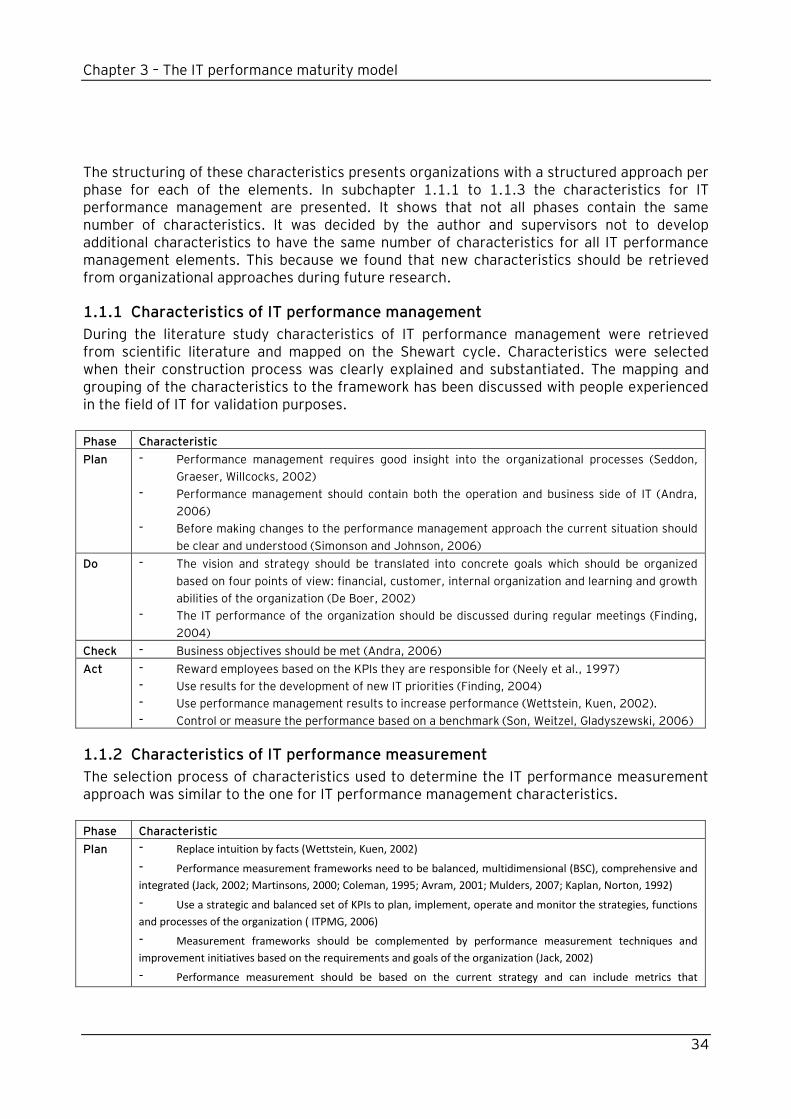
Chapter 3 – The IT performance maturity model
34
The structuring of these characteristics presents organizations with a structured approach per phase for each of the elements. In subchapter 1.1.1 to 1.1.3 the characteristics for IT performance management are presented. It shows that not all phases contain the same number of characteristics. It was decided by the author and supervisors not to develop additional characteristics to have the same number of characteristics for all IT performance management elements. This because we found that new characteristics should be retrieved from organizational approaches during future research.
1.1.1 Characteristics of IT performance management
During the literature study characteristics of IT performance management were retrieved from scientific literature and mapped on the Shewart cycle. Characteristics were selected when their construction process was clearly explained and substantiated. The mapping and grouping of the characteristics to the framework has been discussed with people experienced in the field of IT for validation purposes.
Phase Characteristic
Plan - Performance management requires good insight into the organizational processes (Seddon,
Graeser, Willcocks, 2002)
- Performance management should contain both the operation and business side of IT (Andra,
2006)
- Before making changes to the performance management approach the current situation should
be clear and understood (Simonson and Johnson, 2006)
Do - The vision and strategy should be translated into concrete goals which should be organized
based on four points of view: financial, customer, internal organization and learning and growth
abilities of the organization (De Boer, 2002)
- The IT performance of the organization should be discussed during regular meetings (Finding,
2004)
Check - Business objectives should be met (Andra, 2006)
Act - Reward employees based on the KPIs they are responsible for (Neely et al., 1997)
- Use results for the development of new IT priorities (Finding, 2004)
- Use performance management results to increase performance (Wettstein, Kuen, 2002).
- Control or measure the performance based on a benchmark (Son, Weitzel, Gladyszewski, 2006)
1.1.2 Characteristics of IT performance measurement
The selection process of characteristics used to determine the IT performance measurement approach was similar to the one for IT performance management characteristics.
Phase Characteristic
Plan - Replace intuition by facts (Wettstein, Kuen, 2002)
- Performance measurement frameworks need to be balanced, multidimensional (BSC), comprehensive and
integrated (Jack, 2002; Martinsons, 2000; Coleman, 1995; Avram, 2001; Mulders, 2007; Kaplan, Norton, 1992)
- Use a strategic and balanced set of KPIs to plan, implement, operate and monitor the strategies, functions
and processes of the organization ( ITPMG, 2006)
- Measurement frameworks should be complemented by performance measurement techniques and
improvement initiatives based on the requirements and goals of the organization (Jack, 2002)
- Performance measurement should be based on the current strategy and can include metrics that
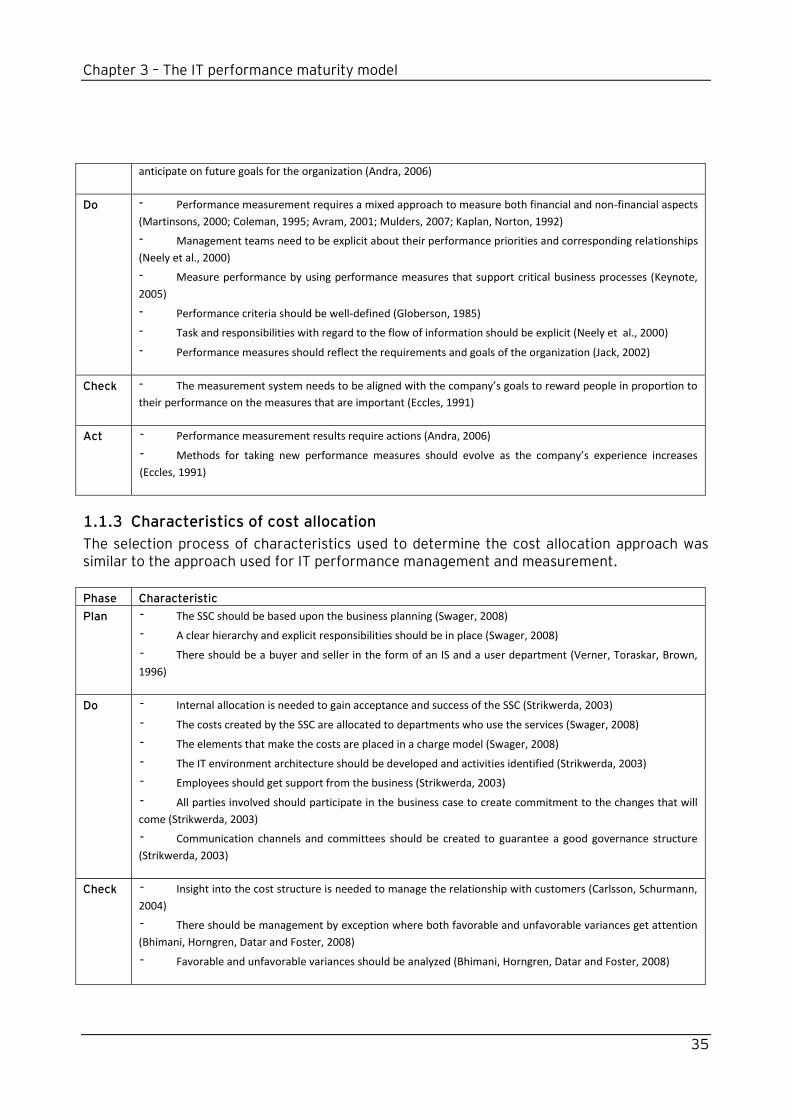
Chapter 3 – The IT performance maturity model
35
anticipate on future goals for the organization (Andra, 2006)
Do - Performance measurement requires a mixed approach to measure both financial and non-financial aspects
(Martinsons, 2000; Coleman, 1995; Avram, 2001; Mulders, 2007; Kaplan, Norton, 1992)
- Management teams need to be explicit about their performance priorities and corresponding relationships
(Neely et al., 2000)
- Measure performance by using performance measures that support critical business processes (Keynote,
2005)
- Performance criteria should be well-defined (Globerson, 1985)
- Task and responsibilities with regard to the flow of information should be explicit (Neely et al., 2000)
- Performance measures should reflect the requirements and goals of the organization (Jack, 2002)
Check - The measurement system needs to be aligned with the company’s goals to reward people in proportion to
their performance on the measures that are important (Eccles, 1991)
Act - Performance measurement results require actions (Andra, 2006)
- Methods for taking new performance measures should evolve as the company’s experience increases
(Eccles, 1991)
1.1.3 Characteristics of cost allocation
The selection process of characteristics used to determine the cost allocation approach was similar to the approach used for IT performance management and measurement.
Phase Characteristic
Plan - The SSC should be based upon the business planning (Swager, 2008)
- A clear hierarchy and explicit responsibilities should be in place (Swager, 2008)
- There should be a buyer and seller in the form of an IS and a user department (Verner, Toraskar, Brown,
1996)
Do - Internal allocation is needed to gain acceptance and success of the SSC (Strikwerda, 2003)
- The costs created by the SSC are allocated to departments who use the services (Swager, 2008)
- The elements that make the costs are placed in a charge model (Swager, 2008)
- The IT environment architecture should be developed and activities identified (Strikwerda, 2003)
- Employees should get support from the business (Strikwerda, 2003)
- All parties involved should participate in the business case to create commitment to the changes that will
come (Strikwerda, 2003)
- Communication channels and committees should be created to guarantee a good governance structure
(Strikwerda, 2003)
Check - Insight into the cost structure is needed to manage the relationship with customers (Carlsson, Schurmann,
2004)
- There should be management by exception where both favorable and unfavorable variances get attention
(Bhimani, Horngren, Datar and Foster, 2008)
- Favorable and unfavorable variances should be analyzed (Bhimani, Horngren, Datar and Foster, 2008)
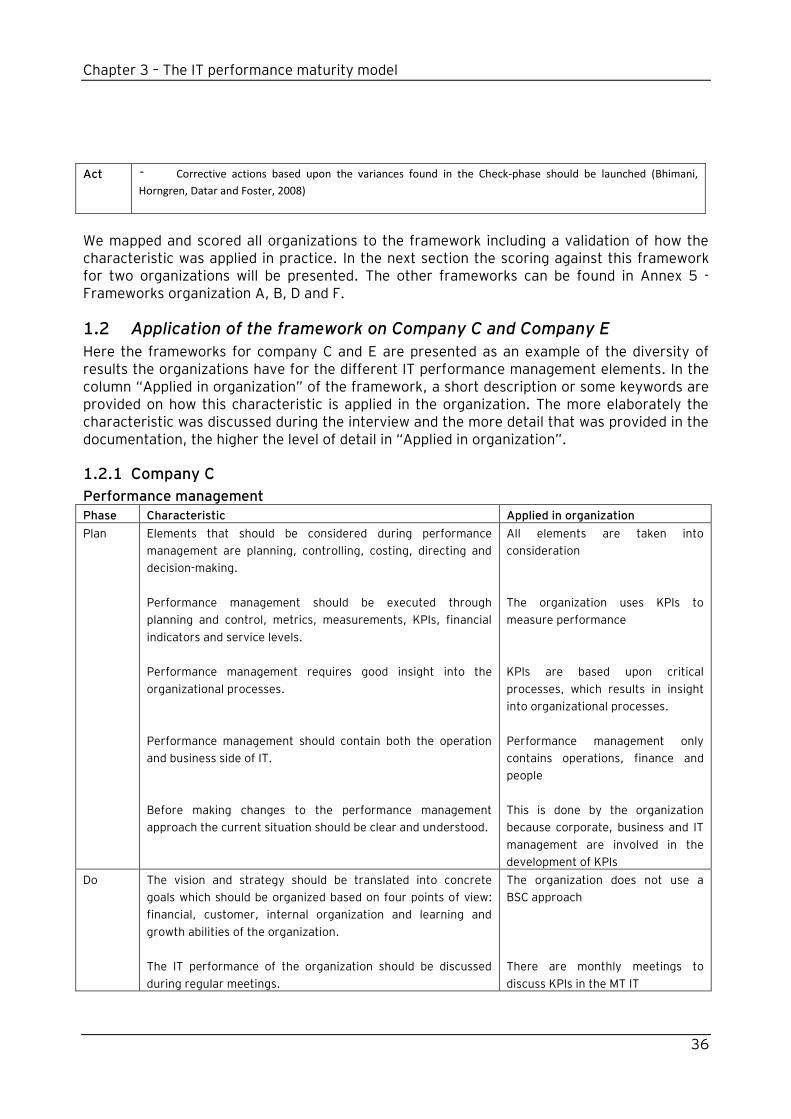
Chapter 3 – The IT performance maturity model
36
Act - Corrective actions based upon the variances found in the Check-phase should be launched (Bhimani,
Horngren, Datar and Foster, 2008)
We mapped and scored all organizations to the framework including a validation of how the characteristic was applied in practice. In the next section the scoring against this framework for two organizations will be presented. The other frameworks can be found in Annex 5 - Frameworks organization A, B, D and F.
1.2 Application of the framework on Company C and Company E
Here the frameworks for company C and E are presented as an example of the diversity of results the organizations have for the different IT performance management elements. In the column “Applied in organization” of the framework, a short description or some keywords are provided on how this characteristic is applied in the organization. The more elaborately the characteristic was discussed during the interview and the more detail that was provided in the documentation, the higher the level of detail in “Applied in organization”.
1.2.1 Company C
Performance management
Phase Characteristic Applied in organization
Plan Elements that should be considered during performance
management are planning, controlling, costing, directing and
decision-making.
Performance management should be executed through
planning and control, metrics, measurements, KPIs, financial
indicators and service levels.
Performance management requires good insight into the
organizational processes.
Performance management should contain both the operation
and business side of IT.
Before making changes to the performance management
approach the current situation should be clear and understood.
All elements are taken into
consideration
The organization uses KPIs to
measure performance
KPIs are based upon critical
processes, which results in insight
into organizational processes.
Performance management only
contains operations, finance and
people
This is done by the organization
because corporate, business and IT
management are involved in the
development of KPIs
Do The vision and strategy should be translated into concrete
goals which should be organized based on four points of view:
financial, customer, internal organization and learning and
growth abilities of the organization.
The IT performance of the organization should be discussed
during regular meetings.
The organization does not use a
BSC approach
There are monthly meetings to
discuss KPIs in the MT IT
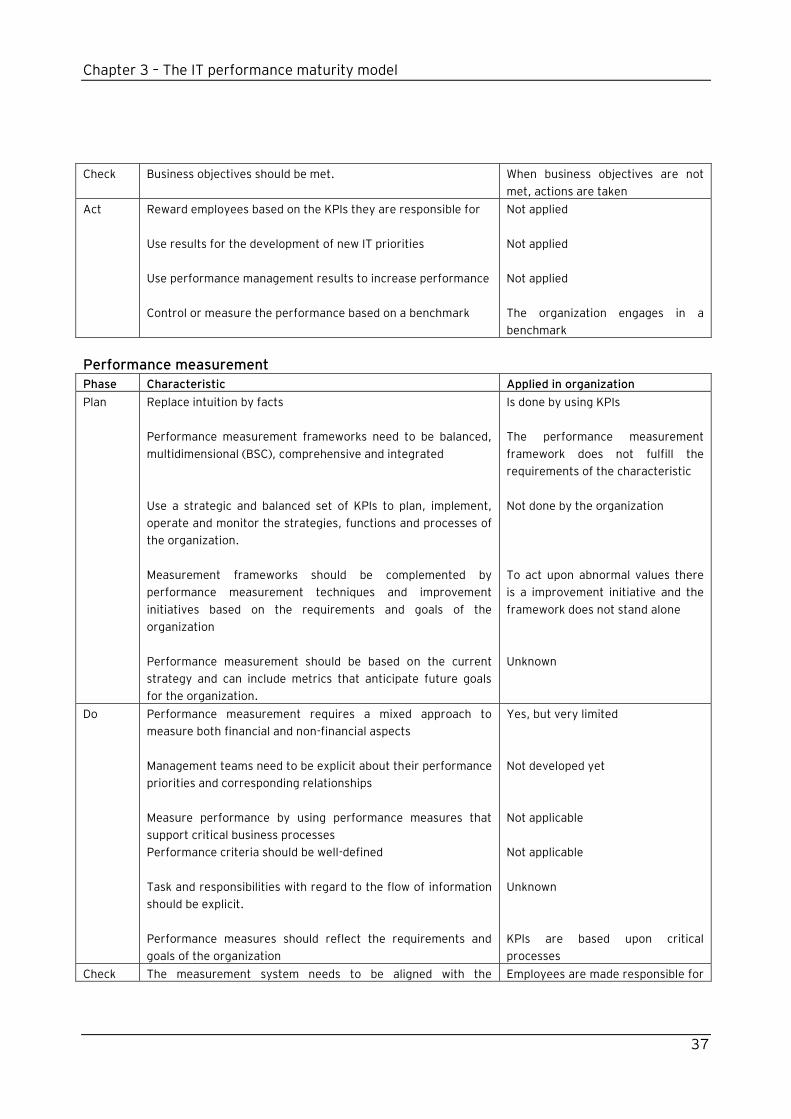
Chapter 3 – The IT performance maturity model
37
Check Business objectives should be met. When business objectives are not
met, actions are taken
Act Reward employees based on the KPIs they are responsible for
Use results for the development of new IT priorities
Use performance management results to increase performance
Control or measure the performance based on a benchmark
Not applied
Not applied
Not applied
The organization engages in a
benchmark
Performance measurement
Phase Characteristic Applied in organization
Plan Replace intuition by facts
Performance measurement frameworks need to be balanced,
multidimensional (BSC), comprehensive and integrated
Use a strategic and balanced set of KPIs to plan, implement,
operate and monitor the strategies, functions and processes of
the organization.
Measurement frameworks should be complemented by
performance measurement techniques and improvement
initiatives based on the requirements and goals of the
organization
Performance measurement should be based on the current
strategy and can include metrics that anticipate future goals
for the organization.
Is done by using KPIs
The performance measurement
framework does not fulfill the
requirements of the characteristic
Not done by the organization
To act upon abnormal values there
is a improvement initiative and the
framework does not stand alone
Unknown
Do Performance measurement requires a mixed approach to
measure both financial and non-financial aspects
Management teams need to be explicit about their performance
priorities and corresponding relationships
Measure performance by using performance measures that
support critical business processes
Performance criteria should be well-defined
Task and responsibilities with regard to the flow of information
should be explicit.
Performance measures should reflect the requirements and
goals of the organization
Yes, but very limited
Not developed yet
Not applicable
Not applicable
Unknown
KPIs are based upon critical
processes
Check The measurement system needs to be aligned with the Employees are made responsible for
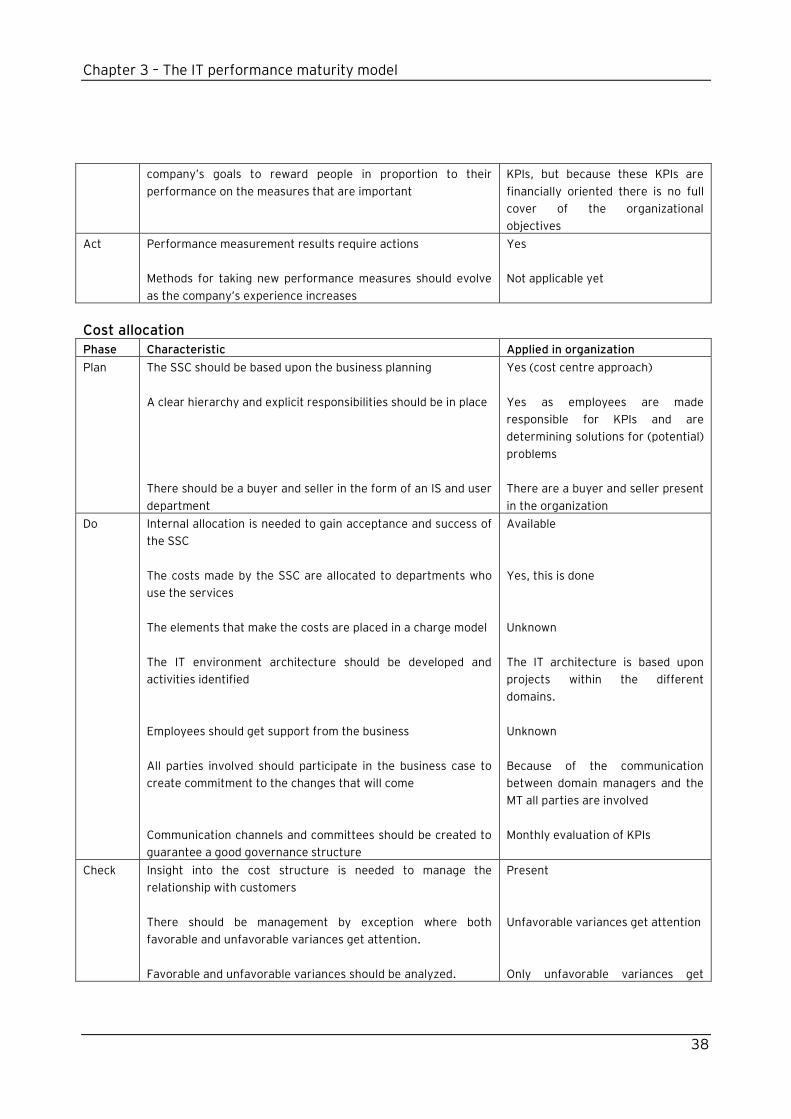
Chapter 3 – The IT performance maturity model
38
company‟s goals to reward people in proportion to their
performance on the measures that are important
KPIs, but because these KPIs are
financially oriented there is no full
cover of the organizational
objectives
Act Performance measurement results require actions
Methods for taking new performance measures should evolve
as the company‟s experience increases
Yes
Not applicable yet
Cost allocation
Phase Characteristic Applied in organization
Plan The SSC should be based upon the business planning
A clear hierarchy and explicit responsibilities should be in place
There should be a buyer and seller in the form of an IS and user
department
Yes (cost centre approach)
Yes as employees are made
responsible for KPIs and are
determining solutions for (potential)
problems
There are a buyer and seller present
in the organization
Do Internal allocation is needed to gain acceptance and success of
the SSC
The costs made by the SSC are allocated to departments who
use the services
The elements that make the costs are placed in a charge model
The IT environment architecture should be developed and
activities identified
Employees should get support from the business
All parties involved should participate in the business case to
create commitment to the changes that will come
Communication channels and committees should be created to
guarantee a good governance structure
Available
Yes, this is done
Unknown
The IT architecture is based upon
projects within the different
domains.
Unknown
Because of the communication
between domain managers and the
MT all parties are involved
Monthly evaluation of KPIs
Check Insight into the cost structure is needed to manage the
relationship with customers
There should be management by exception where both
favorable and unfavorable variances get attention.
Favorable and unfavorable variances should be analyzed.
Present
Unfavorable variances get attention
Only unfavorable variances get
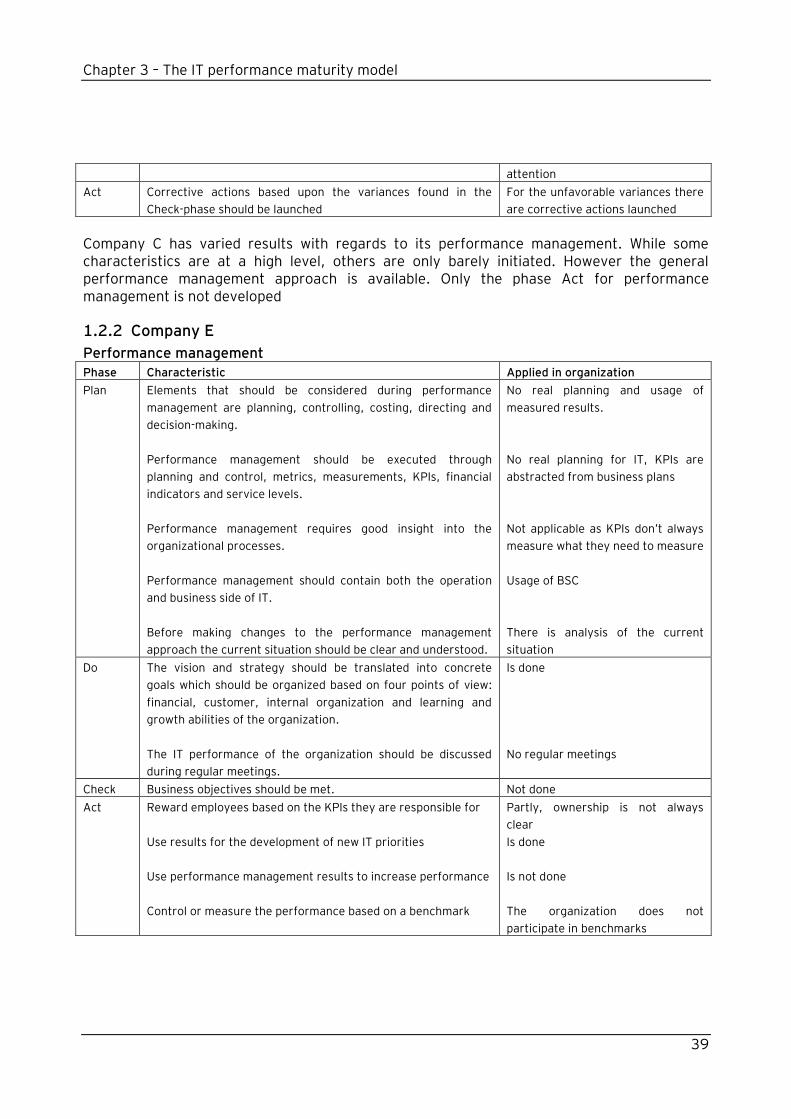
Chapter 3 – The IT performance maturity model
39
attention
Act Corrective actions based upon the variances found in the
Check-phase should be launched
For the unfavorable variances there
are corrective actions launched
Company C has varied results with regards to its performance management. While some characteristics are at a high level, others are only barely initiated. However the general performance management approach is available. Only the phase Act for performance management is not developed
1.2.2 Company E
Performance management
Phase Characteristic Applied in organization
Plan Elements that should be considered during performance
management are planning, controlling, costing, directing and
decision-making.
Performance management should be executed through
planning and control, metrics, measurements, KPIs, financial
indicators and service levels.
Performance management requires good insight into the
organizational processes.
Performance management should contain both the operation
and business side of IT.
Before making changes to the performance management
approach the current situation should be clear and understood.
No real planning and usage of
measured results.
No real planning for IT, KPIs are
abstracted from business plans
Not applicable as KPIs don‟t always
measure what they need to measure
Usage of BSC
There is analysis of the current
situation
Do The vision and strategy should be translated into concrete
goals which should be organized based on four points of view:
financial, customer, internal organization and learning and
growth abilities of the organization.
The IT performance of the organization should be discussed
during regular meetings.
Is done
No regular meetings
Check Business objectives should be met. Not done
Act Reward employees based on the KPIs they are responsible for
Use results for the development of new IT priorities
Use performance management results to increase performance
Control or measure the performance based on a benchmark
Partly, ownership is not always
clear
Is done
Is not done
The organization does not
participate in benchmarks
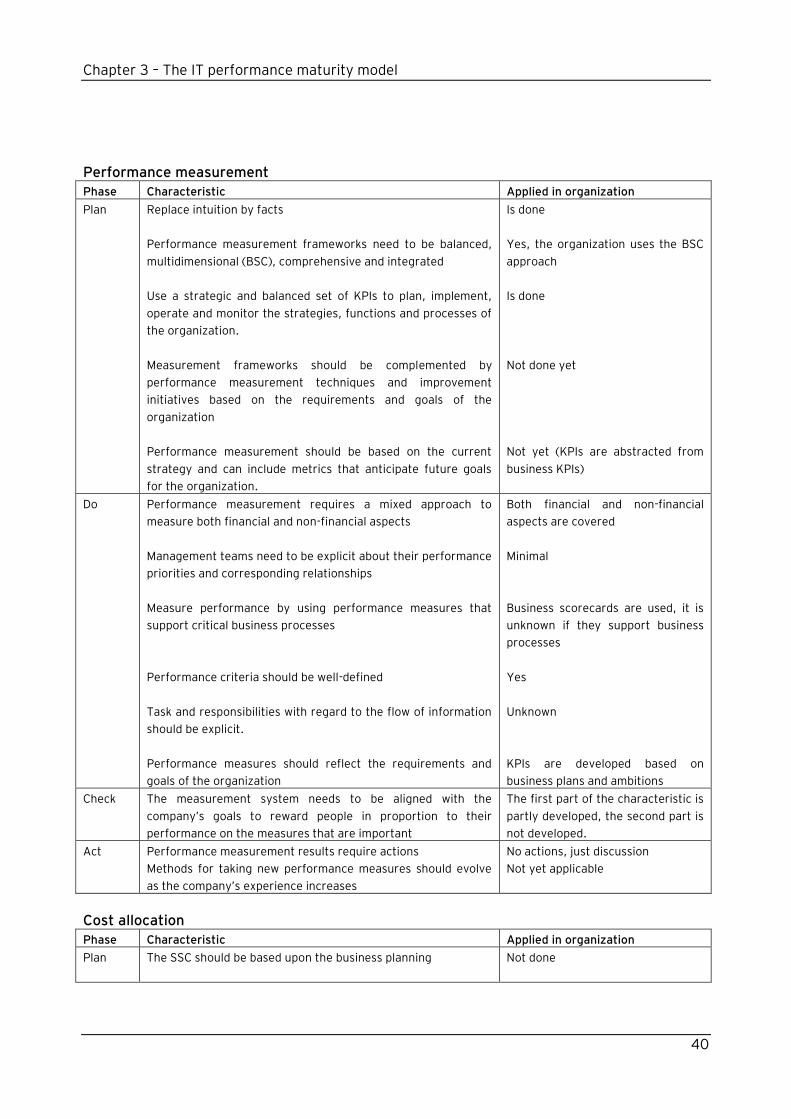
Chapter 3 – The IT performance maturity model
40
Performance measurement
Phase Characteristic Applied in organization
Plan Replace intuition by facts
Performance measurement frameworks need to be balanced,
multidimensional (BSC), comprehensive and integrated
Use a strategic and balanced set of KPIs to plan, implement,
operate and monitor the strategies, functions and processes of
the organization.
Measurement frameworks should be complemented by
performance measurement techniques and improvement
initiatives based on the requirements and goals of the
organization
Performance measurement should be based on the current
strategy and can include metrics that anticipate future goals
for the organization.
Is done
Yes, the organization uses the BSC
approach
Is done
Not done yet
Not yet (KPIs are abstracted from
business KPIs)
Do Performance measurement requires a mixed approach to
measure both financial and non-financial aspects
Management teams need to be explicit about their performance
priorities and corresponding relationships
Measure performance by using performance measures that
support critical business processes
Performance criteria should be well-defined
Task and responsibilities with regard to the flow of information
should be explicit.
Performance measures should reflect the requirements and
goals of the organization
Both financial and non-financial
aspects are covered
Minimal
Business scorecards are used, it is
unknown if they support business
processes
Yes
Unknown
KPIs are developed based on
business plans and ambitions
Check The measurement system needs to be aligned with the
company‟s goals to reward people in proportion to their
performance on the measures that are important
The first part of the characteristic is
partly developed, the second part is
not developed.
Act Performance measurement results require actions
Methods for taking new performance measures should evolve
as the company‟s experience increases
No actions, just discussion
Not yet applicable
Cost allocation
Phase Characteristic Applied in organization
Plan The SSC should be based upon the business planning
Not done
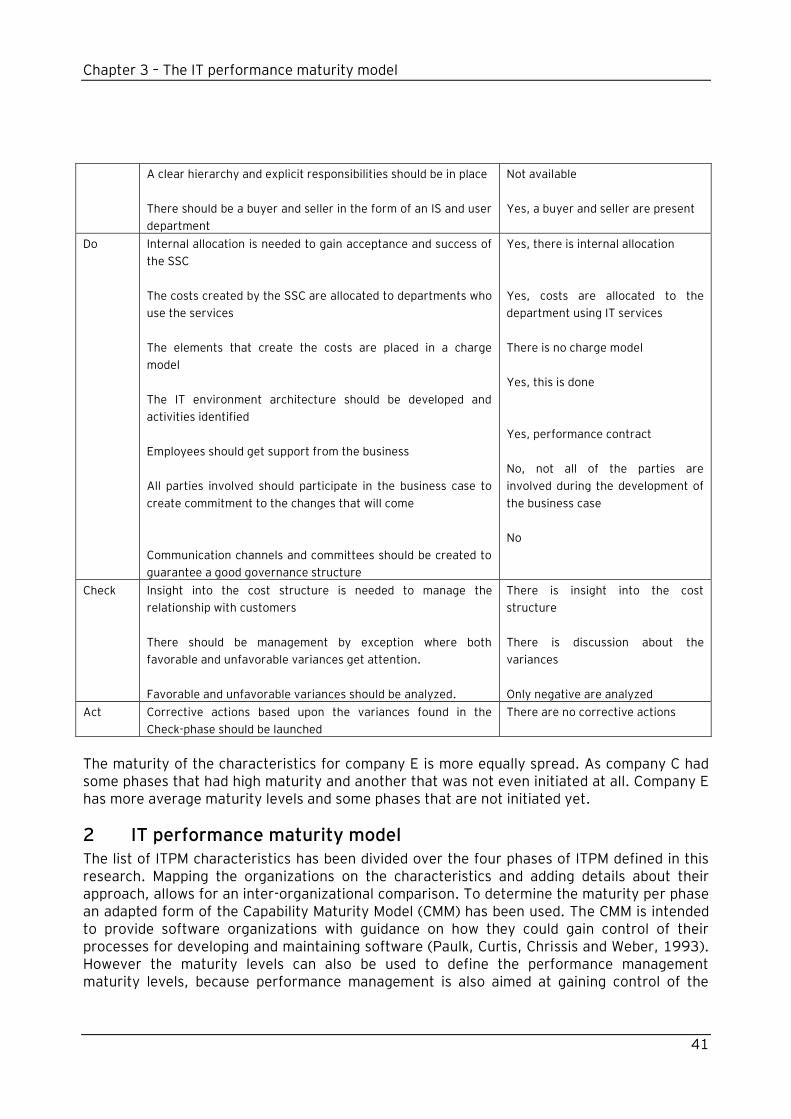
Chapter 3 – The IT performance maturity model
41
A clear hierarchy and explicit responsibilities should be in place
There should be a buyer and seller in the form of an IS and user
department
Not available
Yes, a buyer and seller are present
Do Internal allocation is needed to gain acceptance and success of
the SSC
The costs created by the SSC are allocated to departments who
use the services
The elements that create the costs are placed in a charge
model
The IT environment architecture should be developed and
activities identified
Employees should get support from the business
All parties involved should participate in the business case to
create commitment to the changes that will come
Communication channels and committees should be created to
guarantee a good governance structure
Yes, there is internal allocation
Yes, costs are allocated to the
department using IT services
There is no charge model
Yes, this is done
Yes, performance contract
No, not all of the parties are
involved during the development of
the business case
No
Check Insight into the cost structure is needed to manage the
relationship with customers
There should be management by exception where both
favorable and unfavorable variances get attention.
Favorable and unfavorable variances should be analyzed.
There is insight into the cost
structure
There is discussion about the
variances
Only negative are analyzed
Act Corrective actions based upon the variances found in the
Check-phase should be launched
There are no corrective actions
The maturity of the characteristics for company E is more equally spread. As company C had some phases that had high maturity and another that was not even initiated at all. Company E has more average maturity levels and some phases that are not initiated yet.
2 IT performance maturity model The list of ITPM characteristics has been divided over the four phases of ITPM defined in this research. Mapping the organizations on the characteristics and adding details about their approach, allows for an inter-organizational comparison. To determine the maturity per phase an adapted form of the Capability Maturity Model (CMM) has been used. The CMM is intended to provide software organizations with guidance on how they could gain control of their processes for developing and maintaining software (Paulk, Curtis, Chrissis and Weber, 1993). However the maturity levels can also be used to define the performance management maturity levels, because performance management is also aimed at gaining control of the
Chapter 3 – The IT performance maturity model
42
process. Like CMM performance management is also about continuous improvement of the process. The framework defines five maturity levels that form the foundation for continuous process improvement (Paulk, Curtis, Chrissis and Weber, 1993). In this research the description of maturity levels by Paulk et al (1993) will be adapted to fit the scope of the research. Maturity levels can be defined as evolutionary plateaus toward achieving a mature performance management process. Each of the levels comprises a set of process goals that, when satisfied, stabilize an important component of the performance management process (Paulk et al., 1993). Below an introduction of the five maturity levels for IT performance maturity is provided.
1. Initial: The IT performance management process is characterized as ad hoc, and occasionally even chaotic. Few processes are defined, and success depends on individual effort. During this phase the employees are struggling against the process, or inventing it as they go along (Dymond, 1997).
2. Repeatable: Basic IT performance management processes are established to measure and manage IT performance and to identify related IT costs created throughout the organization. The necessary process discipline is in place to repeat earlier successes with the measuring and management of IT and identifying the IT costs.
3. Defined: The IT performance management process for measurement, management and cost allocating is documented, standardized, and integrated into a standard IT performance management process for the organization. This standard IT performance management process is used every time an activity related to measurement, management and cost allocating is performed.
4. Managed: Following the Defined level, the organization-wide process used at level three has been instrumented so that it is quantitatively understood and controlled (Dymond, 1997). Detailed measures of the IT performance measurement, IT management process and cost allocation are collected. All elements are understood and controlled.
5. Optimizing: At this level, the organizations IT performance management processes operate as a matter of routine and stimulate people to focus on continuous improvement (Dymond, 1997). Continuous IT performance management improvement is enabled by quantitative feedback from the process and from piloting innovative ideas and technologies.
2.1 IT performance maturity model applied on the organizations
To be able to compare the organizations based on their maturity, each characteristic for all IT performance management aspects has been granted a value, namely: (1) satisfied, (2) partially satisfied or (3) not satisfied. These values have different weights. Value 1 has weight of one, value 2 weighs half and value 3 weighs zero. Per phase these values are added and divided by the number of characteristics for that phase. The value that results from this calculation will determine the actual IT performance maturity level. When this value is one, which means that all characteristics are satisfied the characteristic will get a level five. When 50% of the characteristic is satisfied the phase will get a level three and when none of the characteristics are satisfied the phase will get the maturity value level one.
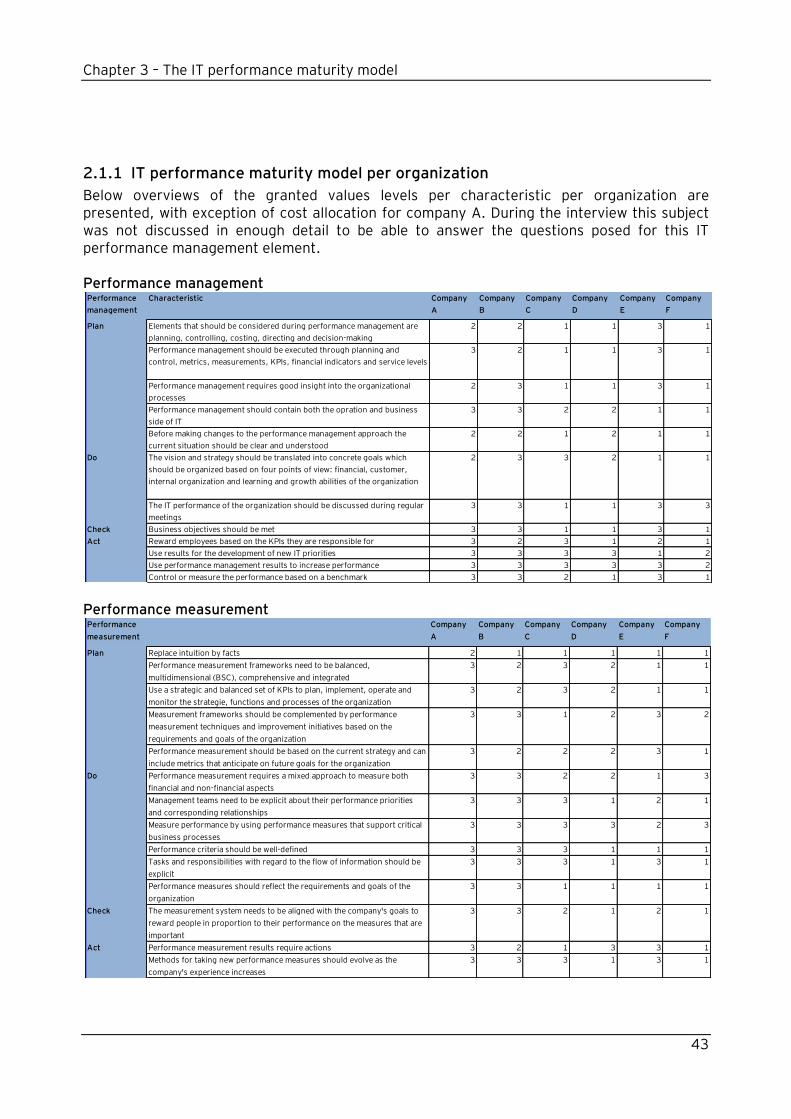
Chapter 3 – The IT performance maturity model
43
2.1.1 IT performance maturity model per organization
Below overviews of the granted values levels per characteristic per organization are presented, with exception of cost allocation for company A. During the interview this subject was not discussed in enough detail to be able to answer the questions posed for this IT performance management element. Performance management
Performance measurement
Performance
management
Characteristic Company
A
Company
B
Company
C
Company
D
Company
E
Company
F
Plan Elements that should be considered during performance management are
planning, controlling, costing, directing and decision-making
2 2 1 1 3 1
Performance management should be executed through planning and
control, metrics, measurements, KPIs, financial indicators and service levels
3 2 1 1 3 1
Performance management requires good insight into the organizational
processes
2 3 1 1 3 1
Performance management should contain both the opration and business
side of IT
3 3 2 2 1 1
Before making changes to the performance management approach the
current situation should be clear and understood
2 2 1 2 1 1
Do The vision and strategy should be translated into concrete goals which
should be organized based on four points of view: financial, customer,
internal organization and learning and growth abilities of the organization
2 3 3 2 1 1
The IT performance of the organization should be discussed during regular
meetings
3 3 1 1 3 3
Check Business objectives should be met 3 3 1 1 3 1
Act Reward employees based on the KPIs they are responsible for 3 2 3 1 2 1
Use results for the development of new IT priorities 3 3 3 3 1 2
Use performance management results to increase performance 3 3 3 3 3 2
Control or measure the performance based on a benchmark 3 3 2 1 3 1
Performance
measurement
Company
A
Company
B
Company
C
Company
D
Company
E
Company
F
Plan Replace intuition by facts 2 1 1 1 1 1
Performance measurement frameworks need to be balanced,
multidimensional (BSC), comprehensive and integrated
3 2 3 2 1 1
Use a strategic and balanced set of KPIs to plan, implement, operate and
monitor the strategie, functions and processes of the organization
3 2 3 2 1 1
Measurement frameworks should be complemented by performance
measurement techniques and improvement initiatives based on the
requirements and goals of the organization
3 3 1 2 3 2
Performance measurement should be based on the current strategy and can
include metrics that anticipate on future goals for the organization
3 2 2 2 3 1
Do Performance measurement requires a mixed approach to measure both
financial and non-financial aspects
3 3 2 2 1 3
Management teams need to be explicit about their performance priorities
and corresponding relationships
3 3 3 1 2 1
Measure performance by using performance measures that support critical
business processes
3 3 3 3 2 3
Performance criteria should be well-defined 3 3 3 1 1 1
Tasks and responsibilities with regard to the flow of information should be
explicit
3 3 3 1 3 1
Performance measures should reflect the requirements and goals of the
organization
3 3 1 1 1 1
Check The measurement system needs to be aligned with the company's goals to
reward people in proportion to their performance on the measures that are
important
3 3 2 1 2 1
Act Performance measurement results require actions 3 2 1 3 3 1
Methods for taking new performance measures should evolve as the
company's experience increases
3 3 3 1 3 1
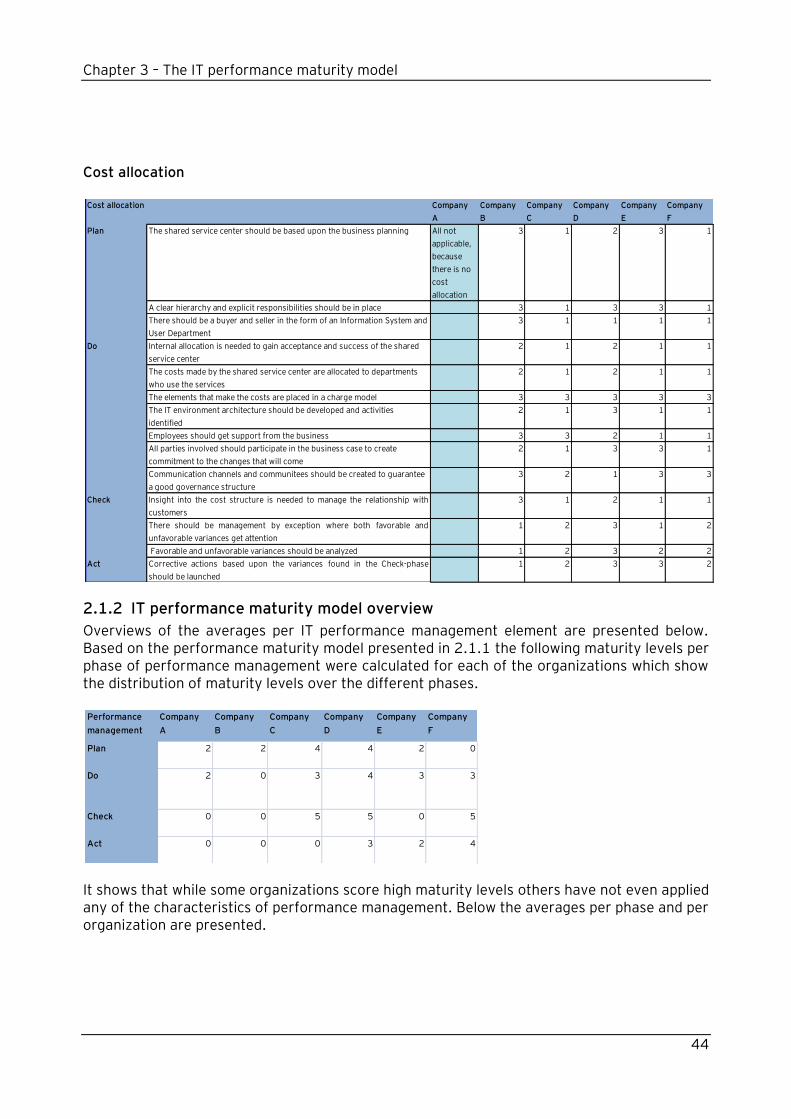
Chapter 3 – The IT performance maturity model
44
Cost allocation
2.1.2 IT performance maturity model overview
Overviews of the averages per IT performance management element are presented below. Based on the performance maturity model presented in 2.1.1 the following maturity levels per phase of performance management were calculated for each of the organizations which show the distribution of maturity levels over the different phases.
It shows that while some organizations score high maturity levels others have not even applied any of the characteristics of performance management. Below the averages per phase and per organization are presented.
Cost allocation Company
A
Company
B
Company
C
Company
D
Company
E
Company
F
Plan The shared service center should be based upon the business planning All not
applicable,
because
there is no
cost
allocation
3 1 2 3 1
A clear hierarchy and explicit responsibilities should be in place 3 1 3 3 1
There should be a buyer and seller in the form of an Information System and
User Department
3 1 1 1 1
Do Internal allocation is needed to gain acceptance and success of the shared
service center
2 1 2 1 1
The costs made by the shared service center are allocated to departments
who use the services
2 1 2 1 1
The elements that make the costs are placed in a charge model 3 3 3 3 3
The IT environment architecture should be developed and activities
identified
2 1 3 1 1
Employees should get support from the business 3 3 2 1 1
All parties involved should participate in the business case to create
commitment to the changes that will come
2 1 3 3 1
Communication channels and communitees should be created to guarantee
a good governance structure
3 2 1 3 3
Check Insight into the cost structure is needed to manage the relationship with
customers
3 1 2 1 1
There should be management by exception where both favorable and
unfavorable variances get attention
1 2 3 1 2
Favorable and unfavorable variances should be analyzed 1 2 3 2 2
Act Corrective actions based upon the variances found in the Check-phase
should be launched
1 2 3 3 2
Performance
management
Company
A
Company
B
Company
C
Company
D
Company
E
Company
F
Plan 2 2 4 4 2 0
Do 2 0 3 4 3 3
Check 0 0 5 5 0 5
Act 0 0 0 3 2 4
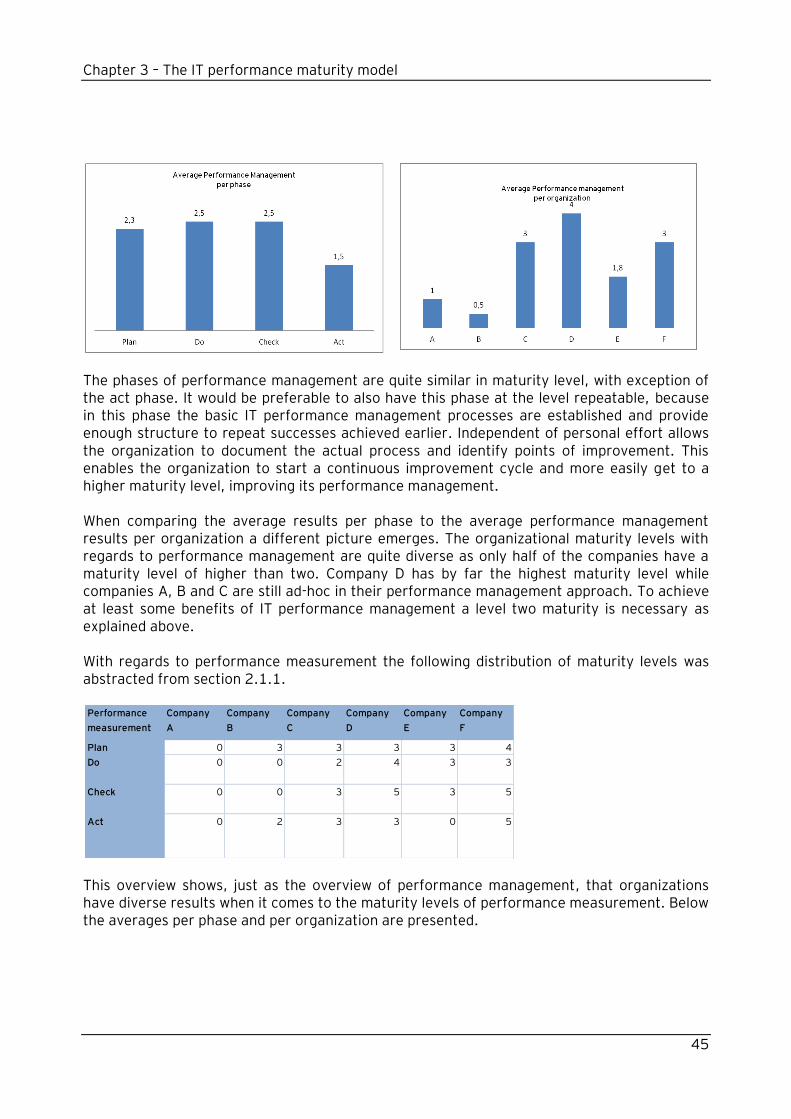
Chapter 3 – The IT performance maturity model
45
The phases of performance management are quite similar in maturity level, with exception of the act phase. It would be preferable to also have this phase at the level repeatable, because in this phase the basic IT performance management processes are established and provide enough structure to repeat successes achieved earlier. Independent of personal effort allows the organization to document the actual process and identify points of improvement. This enables the organization to start a continuous improvement cycle and more easily get to a higher maturity level, improving its performance management. When comparing the average results per phase to the average performance management results per organization a different picture emerges. The organizational maturity levels with regards to performance management are quite diverse as only half of the companies have a maturity level of higher than two. Company D has by far the highest maturity level while companies A, B and C are still ad-hoc in their performance management approach. To achieve at least some benefits of IT performance management a level two maturity is necessary as explained above. With regards to performance measurement the following distribution of maturity levels was abstracted from section 2.1.1.
This overview shows, just as the overview of performance management, that organizations have diverse results when it comes to the maturity levels of performance measurement. Below the averages per phase and per organization are presented.
Performance
measurement
Company
A
Company
B
Company
C
Company
D
Company
E
Company
F
Plan 0 3 3 3 3 4
Do 0 0 2 4 3 3
Check 0 0 3 5 3 5
Act 0 2 3 3 0 5
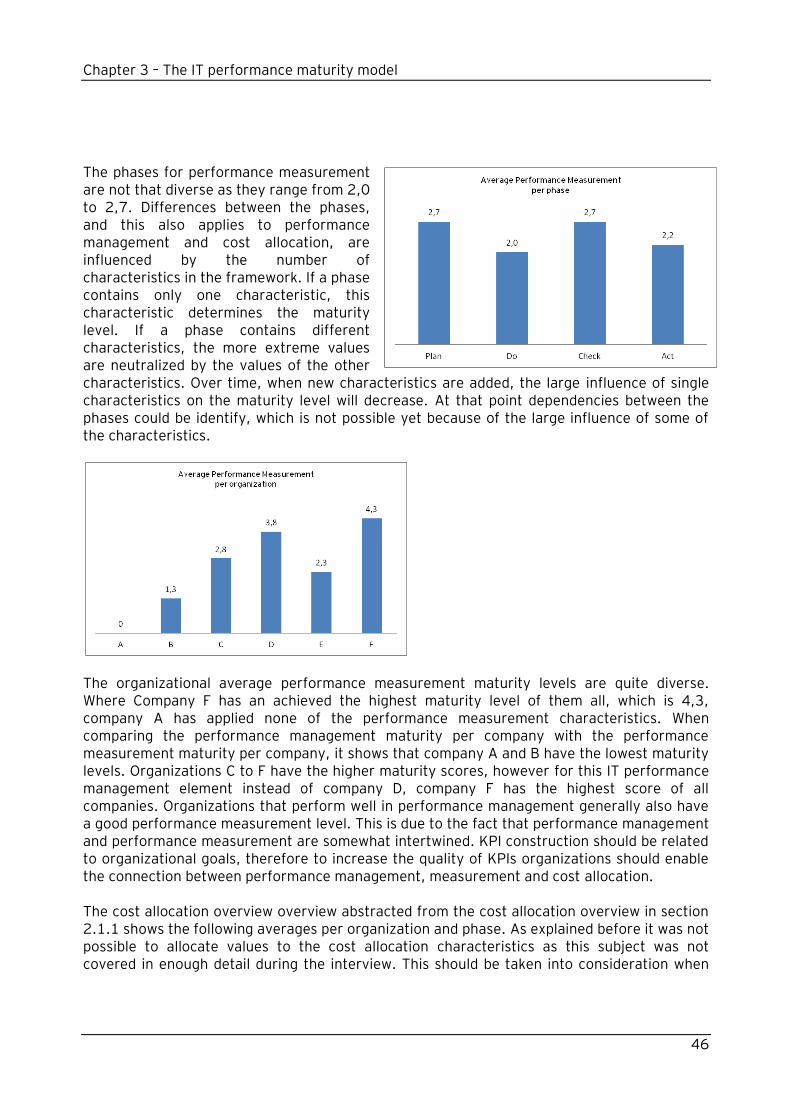
Chapter 3 – The IT performance maturity model
46
The phases for performance measurement are not that diverse as they range from 2,0 to 2,7. Differences between the phases, and this also applies to performance management and cost allocation, are influenced by the number of characteristics in the framework. If a phase contains only one characteristic, this characteristic determines the maturity level. If a phase contains different characteristics, the more extreme values are neutralized by the values of the other characteristics. Over time, when new characteristics are added, the large influence of single characteristics on the maturity level will decrease. At that point dependencies between the phases could be identify, which is not possible yet because of the large influence of some of the characteristics.
The organizational average performance measurement maturity levels are quite diverse. Where Company F has an achieved the highest maturity level of them all, which is 4,3, company A has applied none of the performance measurement characteristics. When comparing the performance management maturity per company with the performance measurement maturity per company, it shows that company A and B have the lowest maturity levels. Organizations C to F have the higher maturity scores, however for this IT performance management element instead of company D, company F has the highest score of all companies. Organizations that perform well in performance management generally also have a good performance measurement level. This is due to the fact that performance management and performance measurement are somewhat intertwined. KPI construction should be related to organizational goals, therefore to increase the quality of KPIs organizations should enable the connection between performance management, measurement and cost allocation. The cost allocation overview overview abstracted from the cost allocation overview in section 2.1.1 shows the following averages per organization and phase. As explained before it was not possible to allocate values to the cost allocation characteristics as this subject was not covered in enough detail during the interview. This should be taken into consideration when
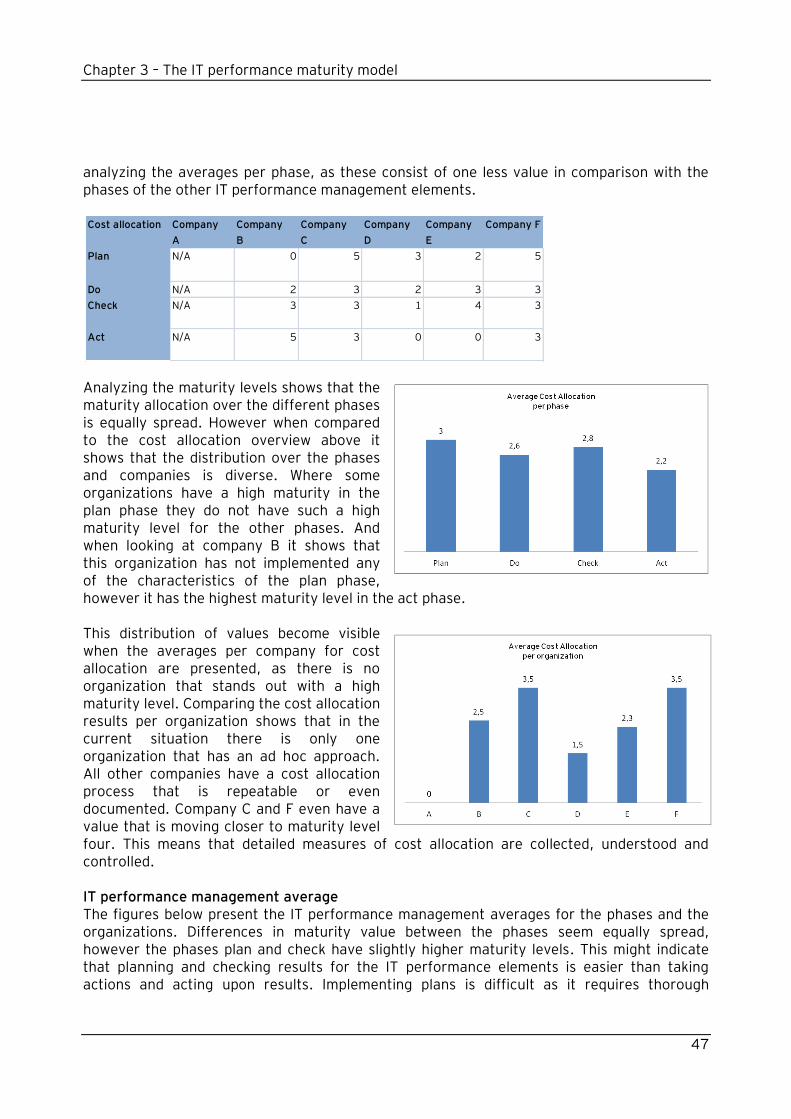
Chapter 3 – The IT performance maturity model
47
analyzing the averages per phase, as these consist of one less value in comparison with the phases of the other IT performance management elements.
Analyzing the maturity levels shows that the maturity allocation over the different phases is equally spread. However when compared to the cost allocation overview above it shows that the distribution over the phases and companies is diverse. Where some organizations have a high maturity in the plan phase they do not have such a high maturity level for the other phases. And when looking at company B it shows that this organization has not implemented any of the characteristics of the plan phase, however it has the highest maturity level in the act phase. This distribution of values become visible when the averages per company for cost allocation are presented, as there is no organization that stands out with a high maturity level. Comparing the cost allocation results per organization shows that in the current situation there is only one organization that has an ad hoc approach. All other companies have a cost allocation process that is repeatable or even documented. Company C and F even have a value that is moving closer to maturity level four. This means that detailed measures of cost allocation are collected, understood and controlled. IT performance management average The figures below present the IT performance management averages for the phases and the organizations. Differences in maturity value between the phases seem equally spread, however the phases plan and check have slightly higher maturity levels. This might indicate that planning and checking results for the IT performance elements is easier than taking actions and acting upon results. Implementing plans is difficult as it requires thorough
Cost allocation Company
A
Company
B
Company
C
Company
D
Company
E
Company F
Plan N/A 0 5 3 2 5
Do N/A 2 3 2 3 3
Check N/A 3 3 1 4 3
Act N/A 5 3 0 0 3
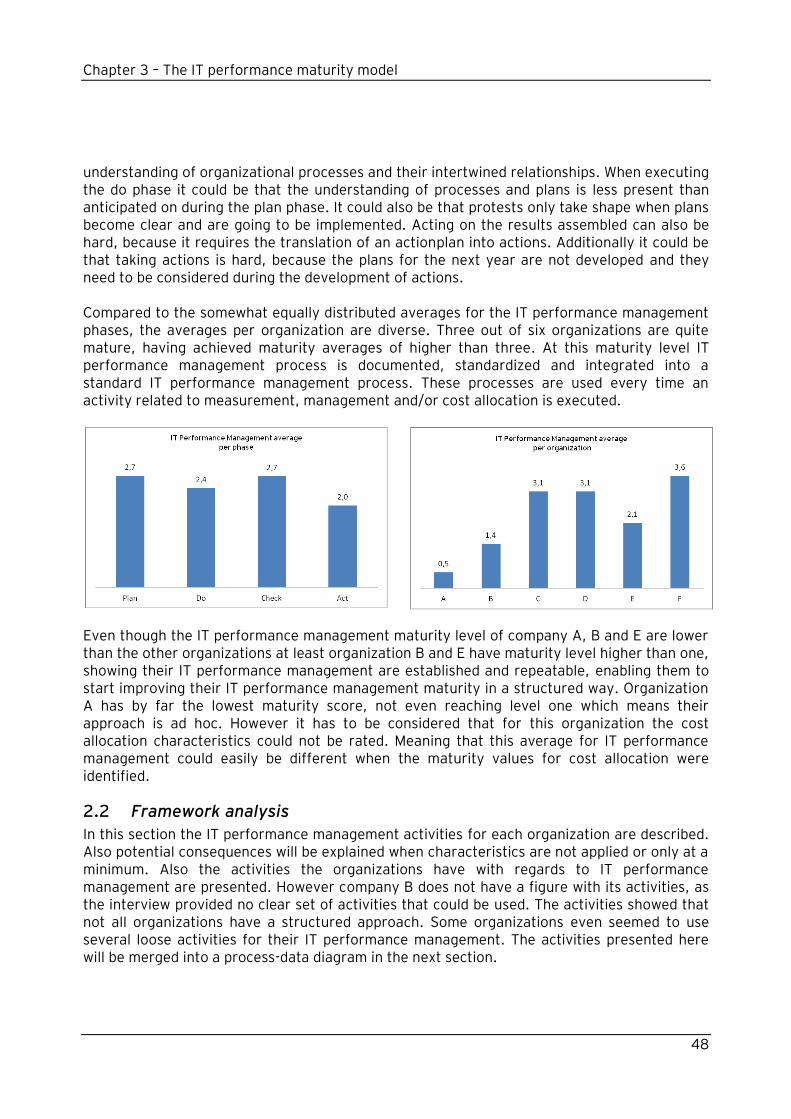
Chapter 3 – The IT performance maturity model
48
understanding of organizational processes and their intertwined relationships. When executing the do phase it could be that the understanding of processes and plans is less present than anticipated on during the plan phase. It could also be that protests only take shape when plans become clear and are going to be implemented. Acting on the results assembled can also be hard, because it requires the translation of an actionplan into actions. Additionally it could be that taking actions is hard, because the plans for the next year are not developed and they need to be considered during the development of actions. Compared to the somewhat equally distributed averages for the IT performance management phases, the averages per organization are diverse. Three out of six organizations are quite mature, having achieved maturity averages of higher than three. At this maturity level IT performance management process is documented, standardized and integrated into a standard IT performance management process. These processes are used every time an activity related to measurement, management and/or cost allocation is executed.
Even though the IT performance management maturity level of company A, B and E are lower than the other organizations at least organization B and E have maturity level higher than one, showing their IT performance management are established and repeatable, enabling them to start improving their IT performance management maturity in a structured way. Organization A has by far the lowest maturity score, not even reaching level one which means their approach is ad hoc. However it has to be considered that for this organization the cost allocation characteristics could not be rated. Meaning that this average for IT performance management could easily be different when the maturity values for cost allocation were identified.
2.2 Framework analysis
In this section the IT performance management activities for each organization are described. Also potential consequences will be explained when characteristics are not applied or only at a minimum. Also the activities the organizations have with regards to IT performance management are presented. However company B does not have a figure with its activities, as the interview provided no clear set of activities that could be used. The activities showed that not all organizations have a structured approach. Some organizations even seemed to use several loose activities for their IT performance management. The activities presented here will be merged into a process-data diagram in the next section.
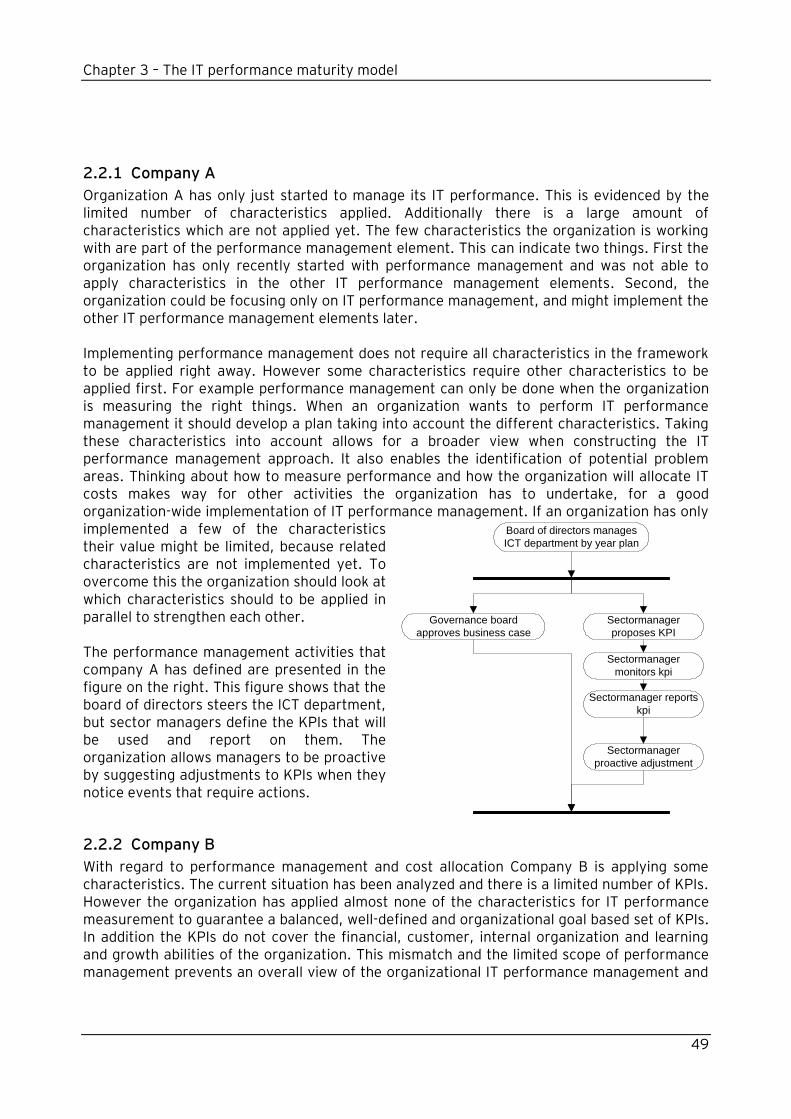
Chapter 3 – The IT performance maturity model
49
2.2.1 Company A
Organization A has only just started to manage its IT performance. This is evidenced by the limited number of characteristics applied. Additionally there is a large amount of characteristics which are not applied yet. The few characteristics the organization is working with are part of the performance management element. This can indicate two things. First the organization has only recently started with performance management and was not able to apply characteristics in the other IT performance management elements. Second, the organization could be focusing only on IT performance management, and might implement the other IT performance management elements later. Implementing performance management does not require all characteristics in the framework to be applied right away. However some characteristics require other characteristics to be applied first. For example performance management can only be done when the organization is measuring the right things. When an organization wants to perform IT performance management it should develop a plan taking into account the different characteristics. Taking these characteristics into account allows for a broader view when constructing the IT performance management approach. It also enables the identification of potential problem areas. Thinking about how to measure performance and how the organization will allocate IT costs makes way for other activities the organization has to undertake, for a good organization-wide implementation of IT performance management. If an organization has only implemented a few of the characteristics their value might be limited, because related characteristics are not implemented yet. To overcome this the organization should look at which characteristics should to be applied in parallel to strengthen each other. The performance management activities that company A has defined are presented in the figure on the right. This figure shows that the board of directors steers the ICT department, but sector managers define the KPIs that will be used and report on them. The organization allows managers to be proactive by suggesting adjustments to KPIs when they notice events that require actions.
2.2.2 Company B
With regard to performance management and cost allocation Company B is applying some characteristics. The current situation has been analyzed and there is a limited number of KPIs. However the organization has applied almost none of the characteristics for IT performance measurement to guarantee a balanced, well-defined and organizational goal based set of KPIs. In addition the KPIs do not cover the financial, customer, internal organization and learning and growth abilities of the organization. This mismatch and the limited scope of performance management prevents an overall view of the organizational IT performance management and
Board of directors manages
ICT department by year plan
Governance board
approves business case
Sectormanager
proposes KPI
Sectormanager
monitors kpi
Sectormanager reports
kpi
Sectormanager
proactive adjustment
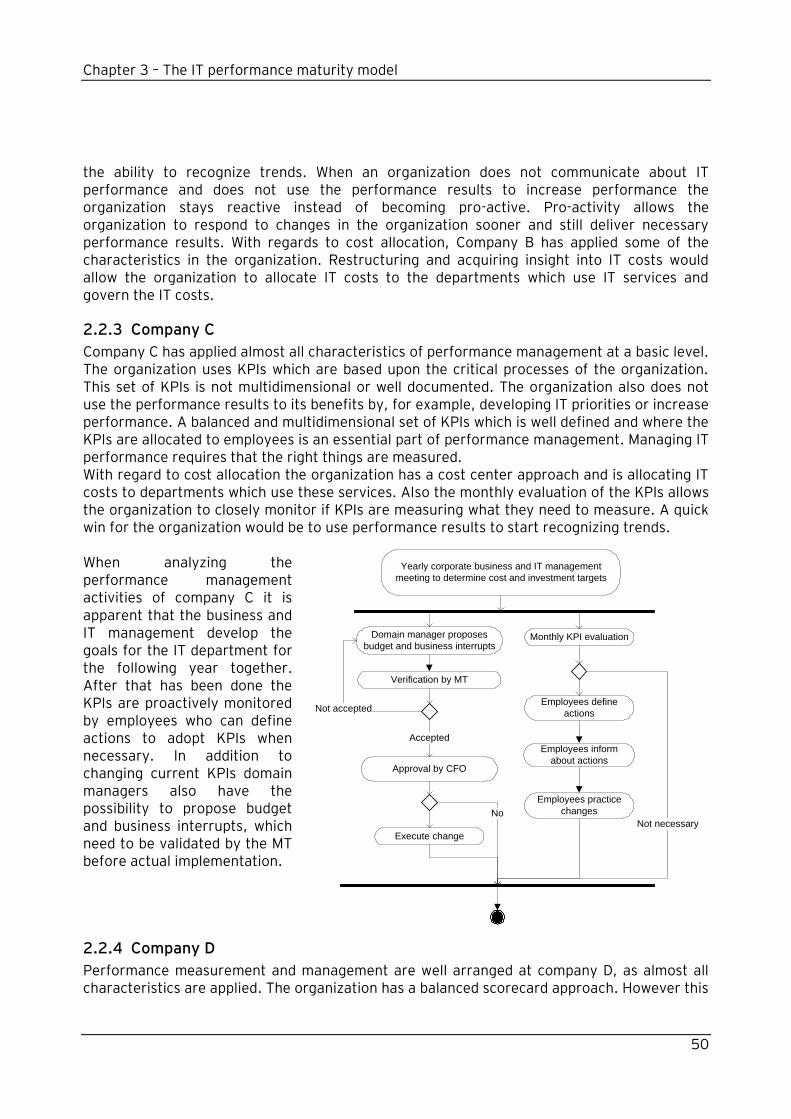
Chapter 3 – The IT performance maturity model
50
the ability to recognize trends. When an organization does not communicate about IT performance and does not use the performance results to increase performance the organization stays reactive instead of becoming pro-active. Pro-activity allows the organization to respond to changes in the organization sooner and still deliver necessary performance results. With regards to cost allocation, Company B has applied some of the characteristics in the organization. Restructuring and acquiring insight into IT costs would allow the organization to allocate IT costs to the departments which use IT services and govern the IT costs.
2.2.3 Company C
Company C has applied almost all characteristics of performance management at a basic level. The organization uses KPIs which are based upon the critical processes of the organization. This set of KPIs is not multidimensional or well documented. The organization also does not use the performance results to its benefits by, for example, developing IT priorities or increase performance. A balanced and multidimensional set of KPIs which is well defined and where the KPIs are allocated to employees is an essential part of performance management. Managing IT performance requires that the right things are measured. With regard to cost allocation the organization has a cost center approach and is allocating IT costs to departments which use these services. Also the monthly evaluation of the KPIs allows the organization to closely monitor if KPIs are measuring what they need to measure. A quick win for the organization would be to use performance results to start recognizing trends. When analyzing the performance management activities of company C it is apparent that the business and IT management develop the goals for the IT department for the following year together. After that has been done the KPIs are proactively monitored by employees who can define actions to adopt KPIs when necessary. In addition to changing current KPIs domain managers also have the possibility to propose budget and business interrupts, which need to be validated by the MT before actual implementation.
2.2.4 Company D
Performance measurement and management are well arranged at company D, as almost all characteristics are applied. The organization has a balanced scorecard approach. However this
Yearly corporate business and IT management
meeting to determine cost and investment targets
Domain manager proposes
budget and business interrupts
Verification by MT
Approval by CFO
Accepted
Not accepted
Execute change
No
Employees define
actions
Employees inform
about actions
Employees practice
changes
Monthly KPI evaluation
Not necessary
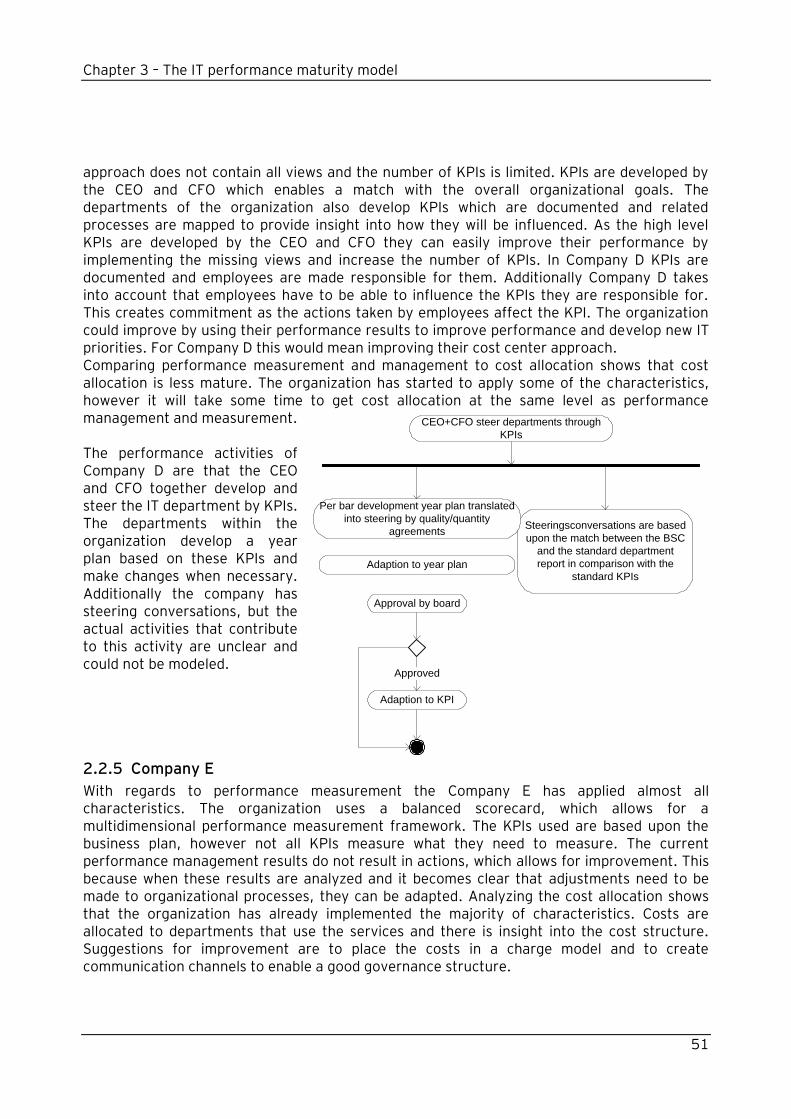
Chapter 3 – The IT performance maturity model
51
approach does not contain all views and the number of KPIs is limited. KPIs are developed by the CEO and CFO which enables a match with the overall organizational goals. The departments of the organization also develop KPIs which are documented and related processes are mapped to provide insight into how they will be influenced. As the high level KPIs are developed by the CEO and CFO they can easily improve their performance by implementing the missing views and increase the number of KPIs. In Company D KPIs are documented and employees are made responsible for them. Additionally Company D takes into account that employees have to be able to influence the KPIs they are responsible for. This creates commitment as the actions taken by employees affect the KPI. The organization could improve by using their performance results to improve performance and develop new IT priorities. For Company D this would mean improving their cost center approach. Comparing performance measurement and management to cost allocation shows that cost allocation is less mature. The organization has started to apply some of the characteristics, however it will take some time to get cost allocation at the same level as performance management and measurement. The performance activities of Company D are that the CEO and CFO together develop and steer the IT department by KPIs. The departments within the organization develop a year plan based on these KPIs and make changes when necessary. Additionally the company has steering conversations, but the actual activities that contribute to this activity are unclear and could not be modeled.
2.2.5 Company E
With regards to performance measurement the Company E has applied almost all characteristics. The organization uses a balanced scorecard, which allows for a multidimensional performance measurement framework. The KPIs used are based upon the business plan, however not all KPIs measure what they need to measure. The current performance management results do not result in actions, which allows for improvement. This because when these results are analyzed and it becomes clear that adjustments need to be made to organizational processes, they can be adapted. Analyzing the cost allocation shows that the organization has already implemented the majority of characteristics. Costs are allocated to departments that use the services and there is insight into the cost structure. Suggestions for improvement are to place the costs in a charge model and to create communication channels to enable a good governance structure.
CEO+CFO steer departments through
KPIs
Steeringsconversations are based
upon the match between the BSC
and the standard department
report in comparison with the
standard KPIs
Per bar development year plan translated
into steering by quality/quantity
agreements
Adaption to year plan
Approval by board
Adaption to KPI
Approved
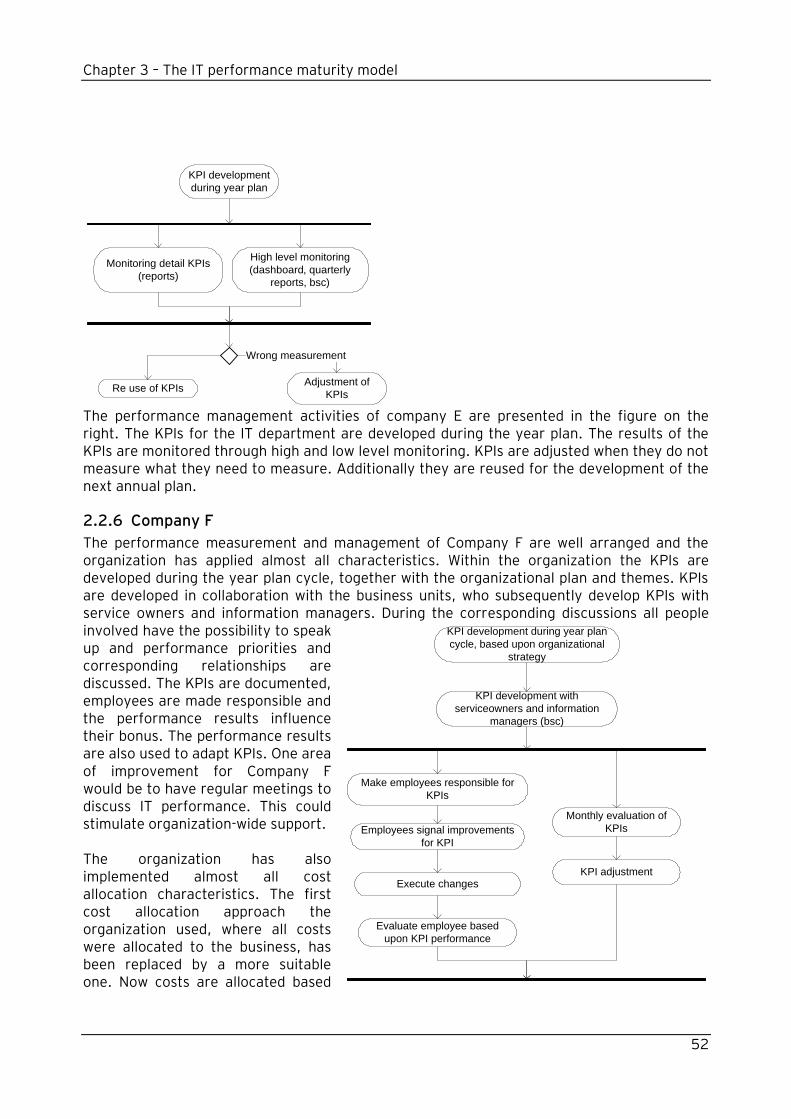
Chapter 3 – The IT performance maturity model
52
The performance management activities of company E are presented in the figure on the right. The KPIs for the IT department are developed during the year plan. The results of the KPIs are monitored through high and low level monitoring. KPIs are adjusted when they do not measure what they need to measure. Additionally they are reused for the development of the next annual plan.
2.2.6 Company F
The performance measurement and management of Company F are well arranged and the organization has applied almost all characteristics. Within the organization the KPIs are developed during the year plan cycle, together with the organizational plan and themes. KPIs are developed in collaboration with the business units, who subsequently develop KPIs with service owners and information managers. During the corresponding discussions all people involved have the possibility to speak up and performance priorities and corresponding relationships are discussed. The KPIs are documented, employees are made responsible and the performance results influence their bonus. The performance results are also used to adapt KPIs. One area of improvement for Company F would be to have regular meetings to discuss IT performance. This could stimulate organization-wide support. The organization has also implemented almost all cost allocation characteristics. The first cost allocation approach the organization used, where all costs were allocated to the business, has been replaced by a more suitable one. Now costs are allocated based
KPI development
during year plan
Monitoring detail KPIs
(reports)
High level monitoring
(dashboard, quarterly
reports, bsc)
Adjustment of
KPIsRe use of KPIs
Wrong measurement
KPI development during year plan
cycle, based upon organizational
strategy
Monthly evaluation of
KPIs
KPI adjustment
KPI development with
serviceowners and information
managers (bsc)
Make employees responsible for
KPIs
Employees signal improvements
for KPI
Execute changes
Evaluate employee based
upon KPI performance
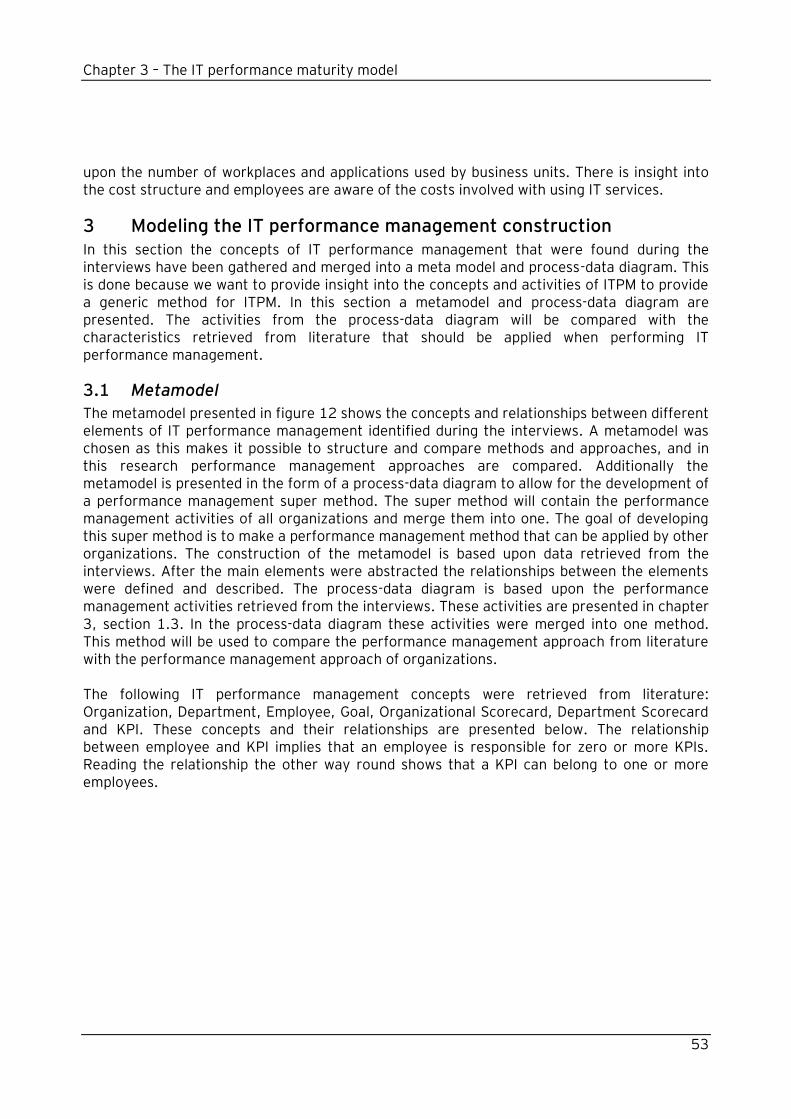
Chapter 3 – The IT performance maturity model
53
upon the number of workplaces and applications used by business units. There is insight into the cost structure and employees are aware of the costs involved with using IT services.
3 Modeling the IT performance management construction In this section the concepts of IT performance management that were found during the interviews have been gathered and merged into a meta model and process-data diagram. This is done because we want to provide insight into the concepts and activities of ITPM to provide a generic method for ITPM. In this section a metamodel and process-data diagram are presented. The activities from the process-data diagram will be compared with the characteristics retrieved from literature that should be applied when performing IT performance management.
3.1 Metamodel
The metamodel presented in figure 12 shows the concepts and relationships between different elements of IT performance management identified during the interviews. A metamodel was chosen as this makes it possible to structure and compare methods and approaches, and in this research performance management approaches are compared. Additionally the metamodel is presented in the form of a process-data diagram to allow for the development of a performance management super method. The super method will contain the performance management activities of all organizations and merge them into one. The goal of developing this super method is to make a performance management method that can be applied by other organizations. The construction of the metamodel is based upon data retrieved from the interviews. After the main elements were abstracted the relationships between the elements were defined and described. The process-data diagram is based upon the performance management activities retrieved from the interviews. These activities are presented in chapter 3, section 1.3. In the process-data diagram these activities were merged into one method. This method will be used to compare the performance management approach from literature with the performance management approach of organizations. The following IT performance management concepts were retrieved from literature: Organization, Department, Employee, Goal, Organizational Scorecard, Department Scorecard and KPI. These concepts and their relationships are presented below. The relationship between employee and KPI implies that an employee is responsible for zero or more KPIs. Reading the relationship the other way round shows that a KPI can belong to one or more employees.
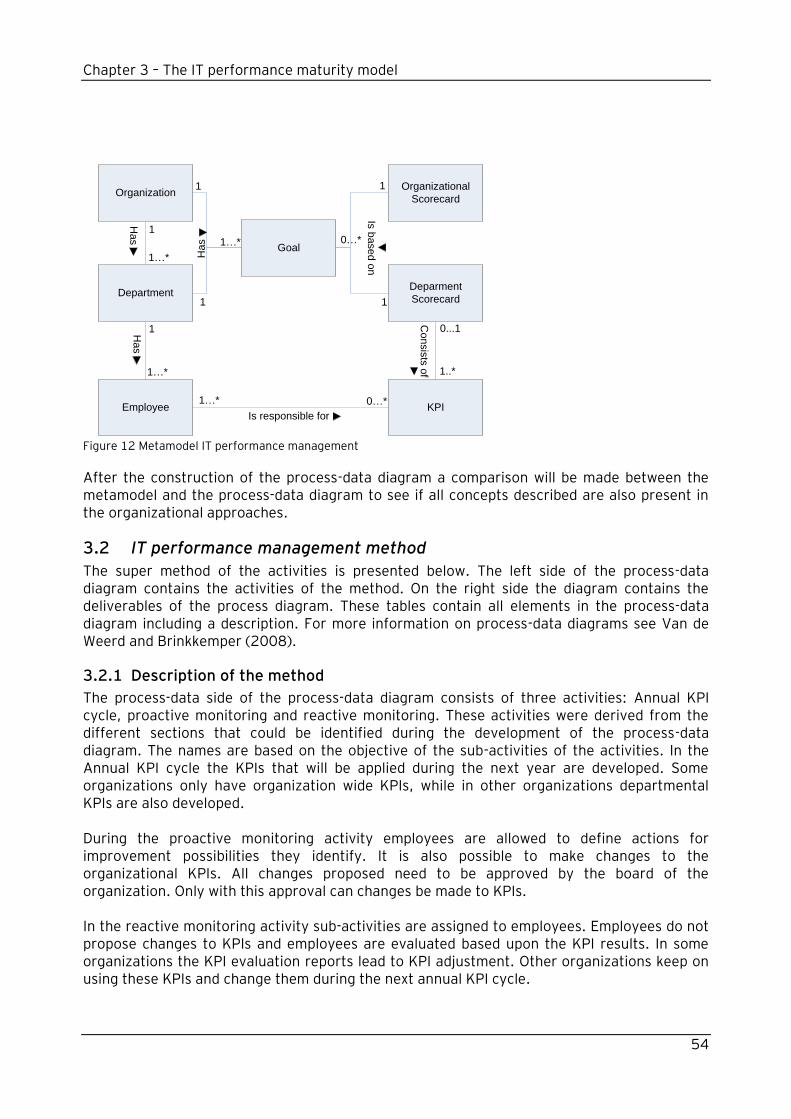
Chapter 3 – The IT performance maturity model
54
Figure 12 Metamodel IT performance management
After the construction of the process-data diagram a comparison will be made between the metamodel and the process-data diagram to see if all concepts described are also present in the organizational approaches.
3.2 IT performance management method
The super method of the activities is presented below. The left side of the process-data diagram contains the activities of the method. On the right side the diagram contains the deliverables of the process diagram. These tables contain all elements in the process-data diagram including a description. For more information on process-data diagrams see Van de Weerd and Brinkkemper (2008).
3.2.1 Description of the method
The process-data side of the process-data diagram consists of three activities: Annual KPI cycle, proactive monitoring and reactive monitoring. These activities were derived from the different sections that could be identified during the development of the process-data diagram. The names are based on the objective of the sub-activities of the activities. In the Annual KPI cycle the KPIs that will be applied during the next year are developed. Some organizations only have organization wide KPIs, while in other organizations departmental KPIs are also developed. During the proactive monitoring activity employees are allowed to define actions for improvement possibilities they identify. It is also possible to make changes to the organizational KPIs. All changes proposed need to be approved by the board of the organization. Only with this approval can changes be made to KPIs. In the reactive monitoring activity sub-activities are assigned to employees. Employees do not propose changes to KPIs and employees are evaluated based upon the KPI results. In some organizations the KPI evaluation reports lead to KPI adjustment. Other organizations keep on using these KPIs and change them during the next annual KPI cycle.
Organizational
Scorecard
Deparment
ScorecardDepartment
Organization
Employee KPI
Goal
0…*1…*
1…*
1
1..*
0...1
1…*
1
1
1
1
1
0…*1…*
Is responsible for
Ha
sH
as
Co
nsis
ts o
f
Is b
ase
d o
n
Ha
s
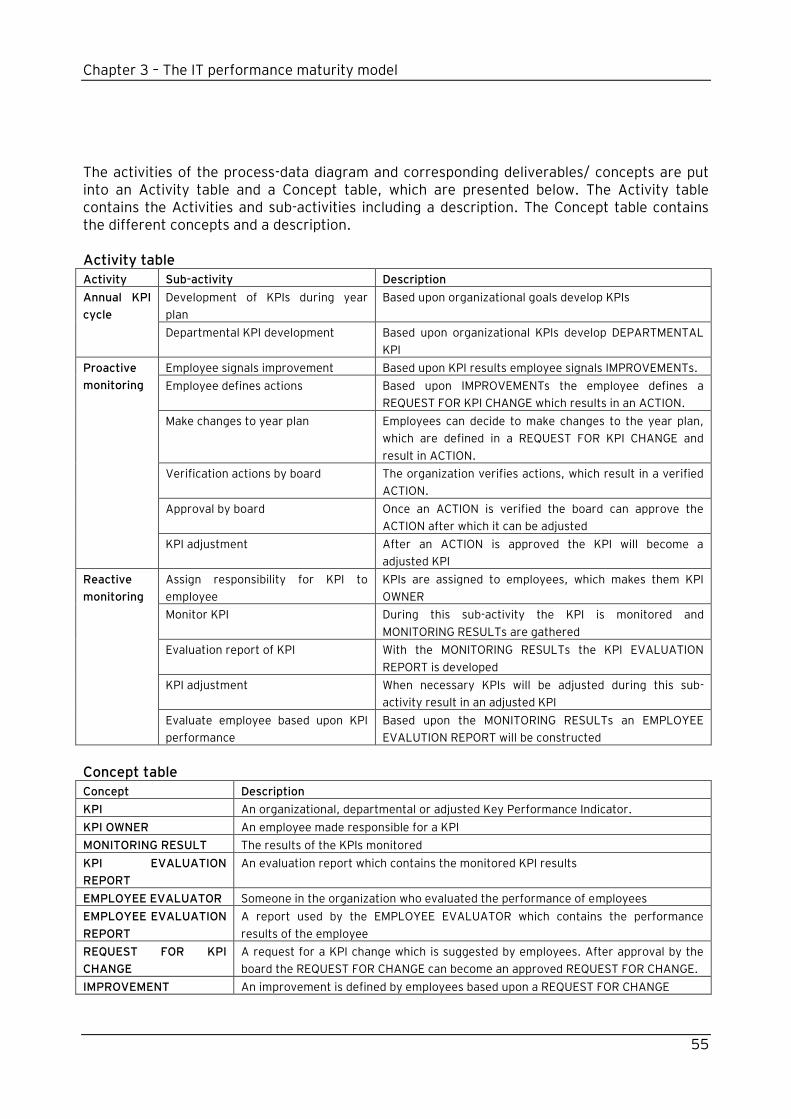
Chapter 3 – The IT performance maturity model
55
The activities of the process-data diagram and corresponding deliverables/ concepts are put into an Activity table and a Concept table, which are presented below. The Activity table contains the Activities and sub-activities including a description. The Concept table contains the different concepts and a description. Activity table
Activity Sub-activity Description
Annual KPI
cycle
Development of KPIs during year
plan
Based upon organizational goals develop KPIs
Departmental KPI development Based upon organizational KPIs develop DEPARTMENTAL
KPI
Proactive
monitoring
Employee signals improvement Based upon KPI results employee signals IMPROVEMENTs.
Employee defines actions Based upon IMPROVEMENTs the employee defines a
REQUEST FOR KPI CHANGE which results in an ACTION.
Make changes to year plan Employees can decide to make changes to the year plan,
which are defined in a REQUEST FOR KPI CHANGE and
result in ACTION.
Verification actions by board The organization verifies actions, which result in a verified
ACTION.
Approval by board Once an ACTION is verified the board can approve the
ACTION after which it can be adjusted
KPI adjustment After an ACTION is approved the KPI will become a
adjusted KPI
Reactive
monitoring
Assign responsibility for KPI to
employee
KPIs are assigned to employees, which makes them KPI
OWNER
Monitor KPI During this sub-activity the KPI is monitored and
MONITORING RESULTs are gathered
Evaluation report of KPI With the MONITORING RESULTs the KPI EVALUATION
REPORT is developed
KPI adjustment When necessary KPIs will be adjusted during this sub-
activity result in an adjusted KPI
Evaluate employee based upon KPI
performance
Based upon the MONITORING RESULTs an EMPLOYEE
EVALUTION REPORT will be constructed
Concept table
Concept Description
KPI An organizational, departmental or adjusted Key Performance Indicator.
KPI OWNER An employee made responsible for a KPI
MONITORING RESULT The results of the KPIs monitored
KPI EVALUATION
REPORT
An evaluation report which contains the monitored KPI results
EMPLOYEE EVALUATOR Someone in the organization who evaluated the performance of employees
EMPLOYEE EVALUATION
REPORT
A report used by the EMPLOYEE EVALUATOR which contains the performance
results of the employee
REQUEST FOR KPI
CHANGE
A request for a KPI change which is suggested by employees. After approval by the
board the REQUEST FOR CHANGE can become an approved REQUEST FOR CHANGE.
IMPROVEMENT An improvement is defined by employees based upon a REQUEST FOR CHANGE
Chapter 3 – The IT performance maturity model
56
ACTION An ACTION is based on an approved REQUEST FOR CHANGE and results in an
adjusted KPI
Comparing the metamodel to the activities and concepts of the process-data diagram shows that the concepts organization and department are not present in the process-data diagram. This is because the organization and department are the executing parties for the activity “Development of KPIs during year plan” and “Departmental KPI development”. Owners of sub-activities are not modeled in a process-data diagram. The organization and department are also the subject of some concepts, but based on data retrieved from the interviews no activities were identified in which the organization and department played an active role.
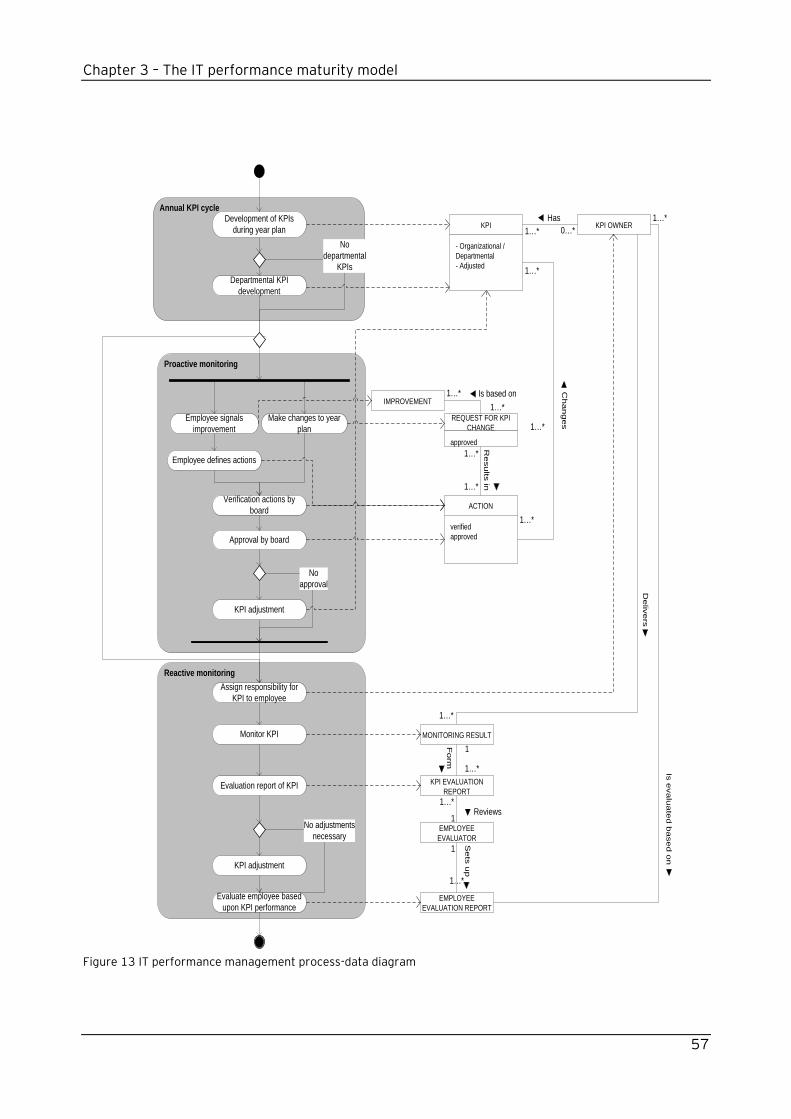
Chapter 3 – The IT performance maturity model
57
Figure 13 IT performance management process-data diagram
Annual KPI cycleDevelopment of KPIs
during year plan
Departmental KPI
development
No
departmental
KPIs
Proactive monitoring
Reactive monitoring
Assign responsibility for
KPI to employee
Monitor KPI
Evaluation report of KPI
KPI adjustment
Evaluate employee based
upon KPI performance
No adjustments
necessary
Make changes to year
plan
Approval by board
Employee signals
improvement
Employee defines actions
Verification actions by
board
KPI adjustment
No
approval
KPI
- Organizational /
Departmental
- Adjusted
KPI OWNER
EMPLOYEE
EVALUATOR
KPI EVALUATION
REPORT
EMPLOYEE
EVALUATION REPORT
REQUEST FOR KPI
CHANGE
approved
ACTION
verified
approved
IMPROVEMENT
MONITORING RESULT
1…*
Has
0…*
1…*
1…*
Is based on
Re
su
lts in
1…*
1…*
1…*
1…*
1…*
Ch
an
ge
s1…*
1…*
De
live
rs
1…*
1
Se
ts u
p
1…*
1
Fo
rm
1…*
1Reviews
Is e
va
lua
ted
ba
se
d o
n
Chapter 3 – The IT performance maturity model
58
4 Comparing the method to ITPM characteristics from literature Comparing the process-data diagram and the ITPM characteristics results in two remarkable findings. First of all the process-data diagram consists of three activities, which are Annual KPI cycle, Proactive monitoring and Reactive monitoring. Mapping these on the findings from literature it is apparent that organizations structure their IT performance management process differently. Literature suggests that the IT performance management process consists of the areas IT performance management, IT performance measurement and cost allocation. This difference may result from the fact that there is little scientific literature available on IT performance management approaches and there is only a very limited amount of guidelines available for organizations on how to structure their IT performance management approach. Second, even though the process-data diagram contains several characteristics from literature most of the characteristics are not applied. This could be due to the fact that literature analysis characteristics come from a scientific point of view and organizations have a more practical approach. There could be additional factors influencing the organizational IT performance management approach that were not considered in scientific research. Additionally in literature is it possible to have two totally separate phases, while in practice there often is a grey area in which phases overlap. Another possibility is that the processes and organizations do not have a high maturity level and therefore have not implemented all characteristics, as some might not be applicable for lower maturity levels.
Chapter 4 - Research questions and discussion &future research
59
Chapter 4 – Research questions and discussion &future research
In this chapter the research questions will be answered based on the results presented in the previous chapters. First the sub-questions will be answered, after which those answers will be used to answer the main research question. After that the discussion and future research will be presented.
5 Research questions
5.1 What are the business benefits that IT performance management delivers?
IT performance management allows for the governing of the organization. Applying IT performance management allows for the translation of the mission, vision and strategy of an organization into explicit goals that are organized into four points of view: financial, customer, internal organization and learning and growth abilities of the organization (De Boer, 2002). These four points of view, along with a limited amount of KPIs which address these points of view, result in the benefit of a balanced and multidimensional framework. As the goals are based on the vision and strategy of the organization the framework will also be integrated in the organization (Jack, 2002). Additionally the evaluation of IT performance results provides the business with the benefit of insight into the functioning of processes. This can be used to improve the measurement process and increase performance. Other benefits for the organization are (De Boer, 2002): - Applying a focus on the realization of strategic, financial and non-financial goals - Making KPIs explicit and measurable - The management of prognosis and action oriented reports - The availability of consistent management information on strategic, tactical and operational level (drill down) - Using the results as a guideline for intra organizational communication - Fostering a result-oriented culture/climate - The possibility to benchmark the organization Business benefits to be achieved with IT performance management according to the interviewed organizations are the following. Evaluation of performance allows for the recognition of trends which allows organizations to become proactive instead of reactive. Cost allocation enables organizations to create an awareness among its employees about the costs involved with IT activities. Cost allocation results can also be used when determining new budgets. As costs become transparent, organizations can more easily identify where improvements can be made and determine goals for the next year. Additionally organizations acknowledge benchmarking as a benefit that can be obtained when IT performance management is applied.
Chapter 4 - Research questions and discussion &future research
60
5.2 Which Key Performance Indicators are used, why and what are the results?
With regards to KPIs three organizations use a balanced scorecard approach, albeit partially developed. One organization uses no balanced scorecard approach but developed its own set of KPIs. The other two organizations had no KPIs developed yet. As the KPIs are confidential and make identification of the involved organizations very simple they are not added to this research. However the exact formulation of KPIs is not relevant for this research. It is the elements they cover that are relevant. The organizations that use the balanced scorecard approach explain that they use this approach because they want an overall view of the IT performance results. The results of using a balanced scorecard are an overall view of the IT performance management elements. It is this complete view which allows for good steering.
5.3 How are these KPIs used to govern the organization?
The literature study showed that KPI measurement results should lead to actions when abnormal variances, both positive and negative, are registered. Based on these variances actions should be taken and additionally the results should be used to develop new IT priorities. The data gathered during the interviews indicated that not all organizations collect KPI results and register both the positive and negative variances and take corrective actions for these variances. Additionally the majority of the organizations does not use the results to develop new IT priorities. The organizations that do collect the data use it to change KPIs when they do not measure what they need to measure or when they need to be adapted because of changes to the organizational plans. However the results are not used to govern the organization. Therefore with this dataset it has to be concluded that KPIs are almost not used at all to govern the organization. Even though the organizations do not use the KPIs to steer the organization, some of them make employees responsible for KPIs to create commitment at the employees to their KPIs. When an employee is made responsible and when this KPI potentially will influence his/her bonus the employee will closely monitor the KPI. When employees are made responsible and constantly monitor their KPI they can recognize trends and propose necessary adaptions / solutions. This flexible and ad hoc approach can be used by organizations to govern the organization and making it flexible and minimize response time with regard to changes.
5.4 How are the IT costs allocated to the business?
The dataset retrieved with the interviews showed that cost allocation has diverse implementation levels. Several of the organizations who engaged in the research have not developed their cost allocation approach and/or have only recently started thinking about how their organization could benefit from cost allocation. In the other organizations cost allocation is applied differently. One organization that recently started with cost allocation is only allocating costs for one role, while another organization that has been applying allocation costs for longer has revised its current approach and moved on to one that is better fitting. The cost allocation approach this organization applied first allocated all costs throughout the business and made employees aware of the costs involved when using IT services. However this approach was overdone and became harmful for the organization as disagreements evolved about prices and services were acquired outside the organization. The new approach the organization has suits the organization much better, but this is also based on the fact that employees are already aware of the costs involved when they use IT services, making them
Chapter 4 - Research questions and discussion &future research
61
use these services more consciously. The other organizations apply cost allocation by using an approach where costs are allocated based on cost price or on the usage of applications and number of workplaces a department has. This allows for the easy recognition of costs, including potentially hidden costs or the location of expensive processes and optimization of them to reduce costs.
5.5 How do companies achieve and optimize the benefits of IT performance management?
The process-data diagram, shown in figure 13, presents the approach organizations use to achieve and optimize the benefits of IT performance management. This process-data diagram shows that only a few of the organizations use their performance results of the previous year when developing their new year plan. Even though using performance results could be of use to the organization to identify problem areas or processes that could be improved. Using performance results is done to achieve and optimize the benefits of IT performance management. Benefits of IT performance management could also be achieved when organizations use their performance results to develop new IT priorities, however currently none of the organizations use these results to increase their performance. It seems that organizations are not aware that these results could also be used to improve IT performance management, or they do not know how to as it has not yet been done. Organizations also try to achieve benefits from IT performance management by letting making employees responsible for KPIs and letting them identify and suggest improvements and adaptions to KPIs. These improvements and adaptions are always approved by the board of the organization to make sure they match with the organizational approach. Also cost allocation is used to achieve benefits of IT performance management by making employees aware of the costs involved with IT. Also cost allocation can contribute to the benefit of IT performance management as budgets are allocated to departments forcing them to think about what IT can mean to their department and the plan required to realize these potential benefits. Based on the dataset gather during this research it can be said that the organizations are not mature enough to optimize their IT performance management benefits, as they have not yet been able to develop a loop back into the IT performance management cycle to use the results to their benefit.
6 Discussion When looking critically at the research there are some points that require attention. First of all as the literature study and interviews were conducted in parallel some characteristics from literature were not mentioned sufficiently during the interviews to be able to provide a description of how they were implemented. This was the case with the budgeting characteristics, which were insufficiently covered during the interviews and therefore had to be excluded from the framework. This risk was known at the beginning of the research and a measure was taken to have an elaborate interview to cover as much detail as possible. However it turned out that even this elaborate interview did not cover all elements in detail. As the response time of several of the companies was long it was decided not to send out additional questionnaires. The second point of attention is the processing of the interviews. The time span of 1,5 hours proved to be too short to answer all questions. A measure was taken to prevent that research
Chapter 4 - Research questions and discussion &future research
62
questions had to be answered with an incomplete set of answers by sending the questionnaire back with the request to answer the remaining questions, however this was not successful. A solution to this situation would be a combination of the answer to the previous point. In this situation the interviewer first develops the questionnaire and engages in more interviews at the participating organizations. This would prevent dependence on the participating organizations to return the questionnaire and would speed up the process.
7 Future research The deliverables of this research are the starting point for follow-up research in the area of IT performance management. We recommend that future research addresses the development and identification of new IT performance management characteristics for more accurate determination of how organizations achieve and optimize the benefits of IT performance management. Additionally the IT performance management framework should be updated, so it can serve as a checklist for organizations to determine their IT performance management maturity level. This could be done by conducting more interviews with companies. However the amount of research and commitment with regards to the interviews needs to be made more explicit to the participating companies. When this is clear to all parties involved the participating organizations would understand better what the timely response of required data would mean to the research. As the framework and super method are based on the results retrieved from these interviews. With more interviews the framework can be supplemented with characteristics applied by organizations that have proven to be of value for the IT performance management process. This data can also be used to determine whether the characteristics from literature are applicable in real life situations, or only in situations presented in literature where there are no environmental factors that have an influence. If necessary characteristics from the framework may need to be removed. The data retrieved from more interviews can also be used to supplement the super method that was developed during this research. New activities can be identified and merged into the process-data diagram. Subsequently the process-data diagram can be improved by deleting activities that prevent a good IT performance management approach. The combination of the IT performance management framework and the IT performance maturity model could be used as the basis for a quantitative study to identify relations between the maturity scores of the different elements of the framework.
Literature
63
Literature Alvarez, M., Binkley, E., Bivens, J., Highers, P., Poole, C., Walker, P. (1990). Case-based instructing and learning: An interdisciplinary project. Proceedings of 34yth Annual Conference, 2-18, College Reading Association. Reprint. Andra, S. (2006). Action-Oriented Metrics for IT Performance Management. Cutter IT Journal, 19(4), 17-21. Banks, R.L., Wheelwright, S.C. (1979). Operations versus strategy – trading tomorrow for today, Harvard Business Review, 112-120. Barocci, T.A., Wever, K.R., Tessier, D.A. (1983). I/S charge-out systems: options and personnel implications, Working paper (Sloan School of Management), 1479-1483. Basili, V. (1995). The Experience Factory and its Relationship to other Quality Approaches, Advances in Computers, 41, Academic Press Bhimani, A., Horngren, C.T., Datar, S.M., Foster, G. (2008). Management and cost accounting. Essex: Pearson Education Limited. Brereton, P., Kitchenham, B., Budgen, D., Li, Z. (2008) Using a Protocol Template for Case Study Planning, Conference Proceedings of EASE 2008 Business Excellence, Vol. 5 No 2, p. 6-12. Brownell, P. (1983). The motivational impact of management-by-exception in a budgetary context. Journal of Accounting Research, 21, 456-472. Brynjolfsson, E., Hitt, L. (1995). “Information Technology as a Factor of Production: The Role of Differences Among Firms.” Economics of Innovation and New Technology. 3(4), 183–200. Camp, R.C. (1989). Benchmarking – the search for Industry Best Practices that Lead to Superior Performance, Milwaukee: ASQS Quality Press. Carlsson, E., Schurmman, A. (2004). Management control in Shared Service Centers – How to influence people in the striving towards organizational goals, Zweden: Linköpings University. Cavaye, A.L.M. (1996). Case study research: a multi-faced research approach for IS. Information Systems Journal, 6(3), 227-242 Chandi, R. (2009). Key Performance Indicators – Measuring Performance in the Oil and Gas EPC Industry. Delft: Delft University of Technology. Darke, P., Shanks, G., Broadbent M. (1998) Successfully completing case study research: combining rigour, relevance and pragmatism. Information Systems Journal, 8(4), 273-289.
Literature
64
De Boer, J.C. (2002). Het dashboard van de ICT-manager, Compact 2002/3, 9-15. De Haes, S., Van Grembergen, W. (2004). IT Governance and Its Mechanisms, Information Systems Control Journal, 1. Dekkers, T. (2004) IT Governance requires performance measurement, Kwaliteit Op Maat retrieved on 25-06-2010 from http://www.kwaliteitopmaat.nl/Images/PSQT2004%20IT%20Governance%20requires%20performance%20measurement_tcm158-35896.pdf Dymond, K.M. (1997). A Guide to the CMM. Maryland: Process Inc US. Eccles, R.G. (1991). The Performance Measurement Manifesto, Harvard Business Review, January-February, 131-137. Eisenhardt, K.M. (1989) Building theories from case study research. Academy of Management Review, 14(4), 532-550. Finding, K. (2004). Measuring IT Performance. IT Alignment in Higher Education, volume 3, 103-114. Glaser, B.G., Strauss, A. (1967) The Discovery of Grounded Theory: Strategies of Qualitative Research. London: Weidenfeld &Nicholson. Globerson, S. (1985). Issues in developing a performance criteria system for an organisation, International Journal of Production Research, 23(4), 639-646. Hallikainen, P., Frisk, E., Eikebrokk, T.R., Hu, Q., Päivärinta, T., Nurmi, A. (2006). The Use of Formal It Investment Evaluation Methods in Organizations: A Survey of European Countries. Proceedings of the Twelfth America Conference on Information Systems, Mexico, 528-535. Hayes, R.H., Abernathy, W.J. (1980), Managing our way to economic decline, Harvard Business Review, 67-77. HCI (2010), Retrieved from http://www.hci.com.au/hcisite3/toolkit/pdcacycl.htm#Plan-Do-Check-Act on 09-12-2010 Heschl, J. (2004). CobiT in Relation to Other International Standards, Information systems control journal, 4, 37-40. Hevner, A.R., March, S.T., Park, J. (2004). Design Science in Information Systems Research, MIS Quarterly, 28(1), 75-105. IT Governance Institute. (2007) CobiT 4.1, ITGI, retrieved on 25-06-2010 from http://www.isaca.org/Knowledge-Center/cobit/Pages/Downloads.aspx ITPMG (2006). IT Performance Management – What is your IT organization‟s readiness?, IT Performance Management Group, Conneticut.
Literature
65
Jack, A.T (2002). ValueMapping-A second generation performance measurement and performance management solution”, Conference paper, Performance Measurement Association, Boston. Jansen, S., Brinkkemper, S. (2008). Applied Multi-Case Research in a Mixed-Method Research Project: Customer Configuration Updating Improvement. In A.C. Steel & L.A. Hakim (Eds.), Information Systems Research Methods, Epistemology and Applications. Kang, H., Bradley, G. (2002). Measuring the performance of IT services: An assessment of SERVQUAL, International Journal of Accounting Information Systems, 3(3), 151-164. Kaplan, B., Duchon, D. (1988). Combining Qualitative and Quantitative Methods in Information Systems Research: A Case Study. MIS Quarterly, 12(4), 571-586. Kaplan, R., Norton, D. (1996). The balanced scorecard: translating a strategy into action. Boston: Harvard Business School press. Kaplan, R.S., Norton, D.P. (1992). The balanced scorecard – measures that drive performance, Hardvard Business Review, 71-79. Keynote (2005). Score High on Business Scorecards. Monitor What Matters. Keynote. Retrieved June 28, 2010, from http://www.keynote.com/docs/whitepapers/ScoreHighBusScore_MonitorwhatMatters.pdf Korthals Altes, A. (2005) Meer dan zomaar centraliseren, fiNext Wrup Up, najaar 2005. Krakar, Z., Žgela, M., Tomić Rotim, S. (2008). CobIT – Framework for IT Governance – Analysis and experience, FOI, retrieved 25-06-2010 from www.foi.hr/CMS_home/znan_strucni_rad/konferencije/IIS/2007/papers/T03_05.pdf Lagsten, J., Goldkuhl, G. (2008). Interpretative IS Evaluation: Results and Uses, Electronic Journal of Information Systems Evaluation, 11(2), 97-108. Lomerson, W.L., Tuten, P.M. (2005). Examining Evaluation Across the IT Value Chain. Proceedings of the 2005 Southern Association of Information Systems Conference, Savannah, GA, USA, 124-129. Maimbo, H., Pervan, G.: Designing a case study protocol for application in IS research. In Chau, P., ed.: Proceedings of the Ninth Pacic Asia Conference on Information Systems (PACIS'05), Hong Kong (2005) 1281- 1292. Martinsons, M., Davison, R., Tse, D. (1999). The balanced scorecard: a foundation for the strategic management of information systems. Decision Support Systems, 25(1), 71-88. Miles, M., Huberman, A.M. (1984). Qualitative data analsysis. Beverly Hills CA: Sage Publications.
Literature
66
Miles, M., Huberman, A.M. (1994). Qualitative data analsysis: An Expanded Source Book. 2nd edn, Ministerie van Binnenlandse Zaken en Koninkrijksrelaties, december 1999, Waarom prestatie-indicatoren falen (Handreikingen externe verzelfstandiging), Den Haag Mulders, M. (2007). 75 Managementmodellen. Groningen/Houten: Wolteres-Noordhoff. Neely A., Adams C. and Crowe P., (2001), "The Performance Prism in Practice”, Measuring Neely, A (1999). Performance measurement revolution: why now and what next?, International Journal of Operations & Productions Management, 19(2), 205-228. Neely, A., Richards, H., Mills, J., PLatts, K, Bourne, M. (1997), Designing Performance Measures: a Structured Approach, in International Journal Neely, A.D., Gregory, M., Platts, K. (1995). Performance measurement system design: a literature review and research agenda, International Journal of OPerations and Production Management, 15(4), 80-116. Noor, H.B.M. (2008) Case Study: A Strategic Research Methodology, American Journal of Applied Sciences, 5(11), 1602-1604. Patton, M.Q. (2002). Qualitative research and evaluation (3rd ed.). Thousand Oaks, CA: Sage. Paulk, M.C., Curtis, B., Chrissis, M.B., Weber, C.V. (1993). Capability Maturity Model, Version 1.1., IEEE Software, 10(4), 18-27. Petri, R. (2008). Budgettering. Rawsthorne, P. (2008) Case Study Research – as important now than ever. Rawsthorne. Retrieved April 13, 2010, from: http://www.rawsthorne.org/bit/medit/ed6610/docs/PeterRawsthorne.CaseStudyReseach.pdf Read, T. (2009). The IT value network – from IT investment to stakeholder value.New Jersey: Hoboken. Remenyi, D., Money, A., Sherwood-Smith, M. (2000). The effective measurement and management of IT costs and benefits, Oxford: Butterworth-Heinemann Remmers, W., de Jager-de Windt, N. (2005). Labels en Shared Service Center op Gespannen Voet?, Whitepaper Magnitude Consulting Rouyet-Ruiz, J. (2008). COBIT as a Tool for IT Governance: between Auditing and IT Governance, Upgrade – The European Journal for the Informatics Professional, 9(1), 40-43. Schmenner, R.W. (1988). Escaping the black holes of cost accounting, Business Horizons, 66-72.
Literature
67
Seddon, P.B., Graeser, V., Willcocks, L.P. (2002). Measuring Organizational IS Effectiveness: An Overview and Update of Senior Management Perspectives, The DATA BASE for Advances in Information Systems, 33(2), 11-28. Shewhart, W.A. (1931). Economic control of quality of manufactured product. Simonsson, M., Johnson, P., (2006). Assessment of IT Governance – A prioritization of Cobit-, Proceedings of the Conference on Systems Engineering Research, Los Angeles, USA. Skinner, W. (1974). The decline, fall and renewal of manufacturing, Industrial Engineering, 32-38. Son, S., Weitzel, T., Gladyszewski, T. (2006). Assessing the influence of management control on IT performance – An empirical analysis. LSE Department of Information Systems, Retrieved June 28, 2010, from http://is2.lse.ac.uk/asp/aspecis/20060086.pdf Son, S., Weitzel, T., Laurent, F. (2005). Designing a Process-Oriented Framework for IT Performance Management Systems. The Electronic Journal Information Systems Evaluation, 8(3), 219-228. Soy, S. (1997) The Case Study as a Research Method, Ischool, Retrieved April 21, 2010, from http://www.ischool.utexas.edu/~ssoy/usesusers/l391d1b.htm Strikwerde, J. (2003). Shared Service Centers. Van kostenbesparing naar waardecreatie. Den Haag: Van Gorcum/SMS. Swager, J. (2008). Shared Service Center Charges – Een onderzoek naar het verantwoordelijkheidsgevoel van de business voor Shared Service Center Charge, Handboek Management Accounting. (pp c1425-c1425-33). Tellis, W. (1997) Introduction to Case Study. The Qualitative Report, 3(2). Available: http://www.nova.edu/ssss/QR/QR3-2/tellis.html. Turban, E., McLean, E., Wetherbe, J. (2001). Information Technology for Management – Making Connections for Strategic Advantage. USA: John Wiley & Sons, Inc. Turney, P.B.B., Anderson, B. (1989) Accounting for continuous improvement, Sloan Management Review, 30(2), 37-48. Tuten, P.M. (2009). A Model for the Evaluation of IS/IT investments, dissertation. Van Grembergen, W. (2000). The balanced scorecard and IT governance, Information Systems Control Journal (previously IS Audit & Control Journal), 2, 40-43. Van Grembergen, W., De Haes, S., Moons, J. (2005). Linking Business Goals to IT Goals and CobiT Processes, Information Systems Control Journal, 4.
Literature
68
Van Grembergen, W., Van Bruggen, R. (1998): Measuring and improving corporate information technology through the balanced scorecard, Electronic Journal of Information Systems Evaluation, 1(1). Van Grembergen, W., Van Bruggen, R., (1997). Measuring and improving corporate information technology through the balanced scorecard technique, Proceedings of the Fourth European Conference on the Evaluation of Information Technology, Delft, October, 163-171. Venkatraman, N. (1997). Beyond Outsourcing: Managing IT Resources as a Value Center. MIT Sloan Management Review, 38(3), 51-64. Venkatraman, N. (1998) Not fixing technical bugs but creating business value. European Management Journal, 16(5), 573-585. Verner, J.M., Toraskar, K.V., Brown, R. (1996). Information systems chargeout: a review of current approaches and future challenges, Journal of Information Technology, 11(2), 101-117. Weerd, I. van de, Brinkkemper, S. (2008). Meta-modeling for situational analysis and design methods. In M.R. Syed and S.N. Syed (Eds.), Handbook of Research on Modern Systems Analysis and Design Technologies and Applications (pp. 38-58). Hershey: Idea Group Publishing. Weill, P., Woodham, R. (2002). Don’t Just Lead, Govern: Implementing Effective IT Governance (4237-02). Cambridge USA, MIT Sloan School of Management. Weill, P., Woodham, R. (2003) Don't Just Lead, Govern: Implementing Effective IT Governance, MIT Sloan School of Management Working Paper; 4237-02, 326. Wettstein, T; Kueng, P. (2002). A Maturity Model For Performance Measurement Systems, Management Information Systems, 113-122. Wiggers, P., Kok, H., de Boer – de Wit., M. (2004). IT performance management, Burlington: Elsevier Butterworth-Heinenmann. Willcoks, L. (1994) Information management – The Evaluation of Information Systems, London: Chapman and Hall. Yin, R.K. (1994). Case Study Research: Design and Methods, 2nd edn. Thousand Oaks: Sage Publications, Thousand Oaks. Yin, R.K. (2009). Case Study Research – Design and Methods. Thousand Oaks: SAGE Publications. Zainal, Z. (2007). Case study as a research method. Jurnal Kemanusiaan, 9, 1-6. Zee, H. van der (1996) In search of the value of Information Technology, Disseration
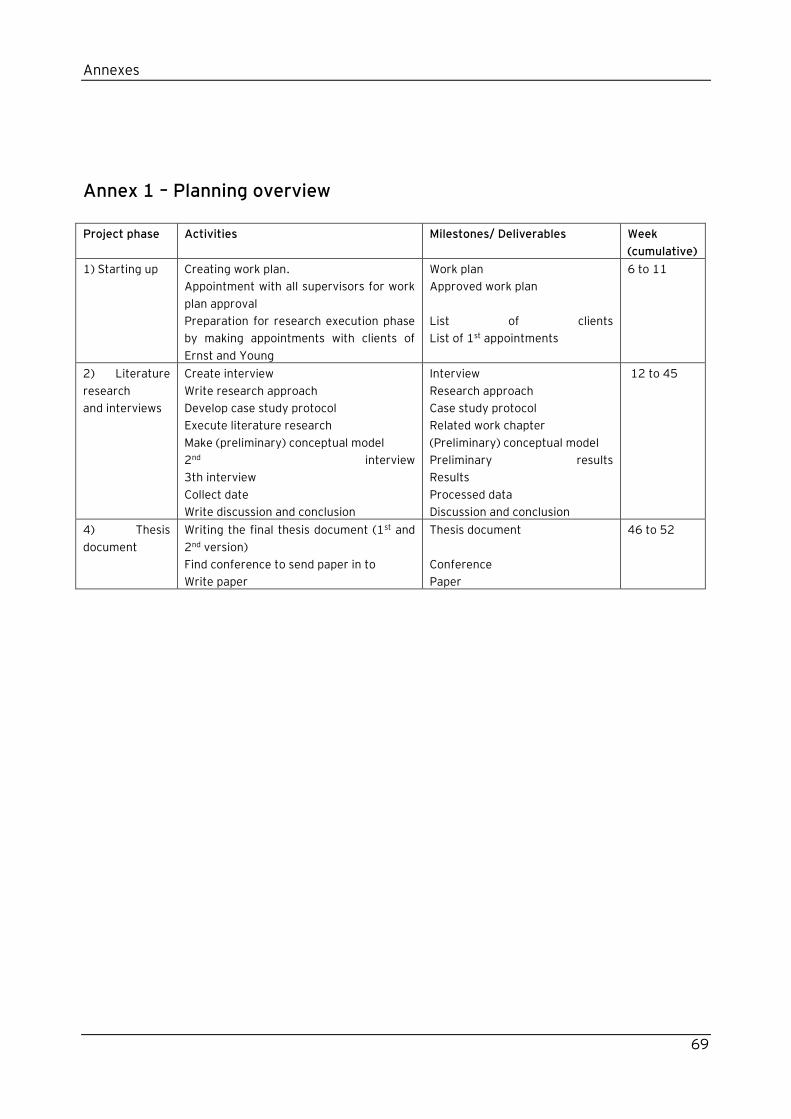
Annexes
69
Annex 1 – Planning overview
Project phase Activities Milestones/ Deliverables Week
(cumulative)
1) Starting up Creating work plan.
Appointment with all supervisors for work
plan approval
Preparation for research execution phase
by making appointments with clients of
Ernst and Young
Work plan
Approved work plan
List of clients
List of 1st appointments
6 to 11
2) Literature
research
and interviews
Create interview
Write research approach
Develop case study protocol
Execute literature research
Make (preliminary) conceptual model
2nd interview
3th interview
Collect date
Write discussion and conclusion
Interview
Research approach
Case study protocol
Related work chapter
(Preliminary) conceptual model
Preliminary results
Results
Processed data
Discussion and conclusion
12 to 45
4) Thesis
document
Writing the final thesis document (1st and
2nd version)
Find conference to send paper in to
Write paper
Thesis document
Conference
Paper
46 to 52
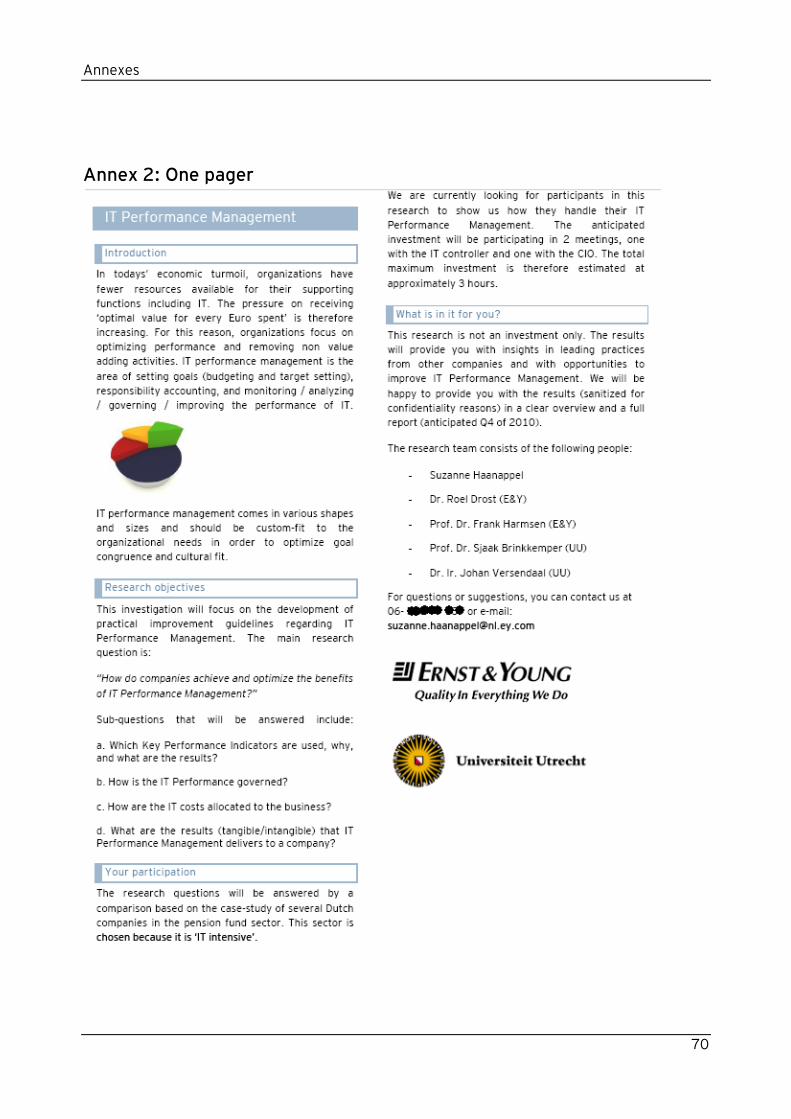
Annexes
70
Annex 2: One pager
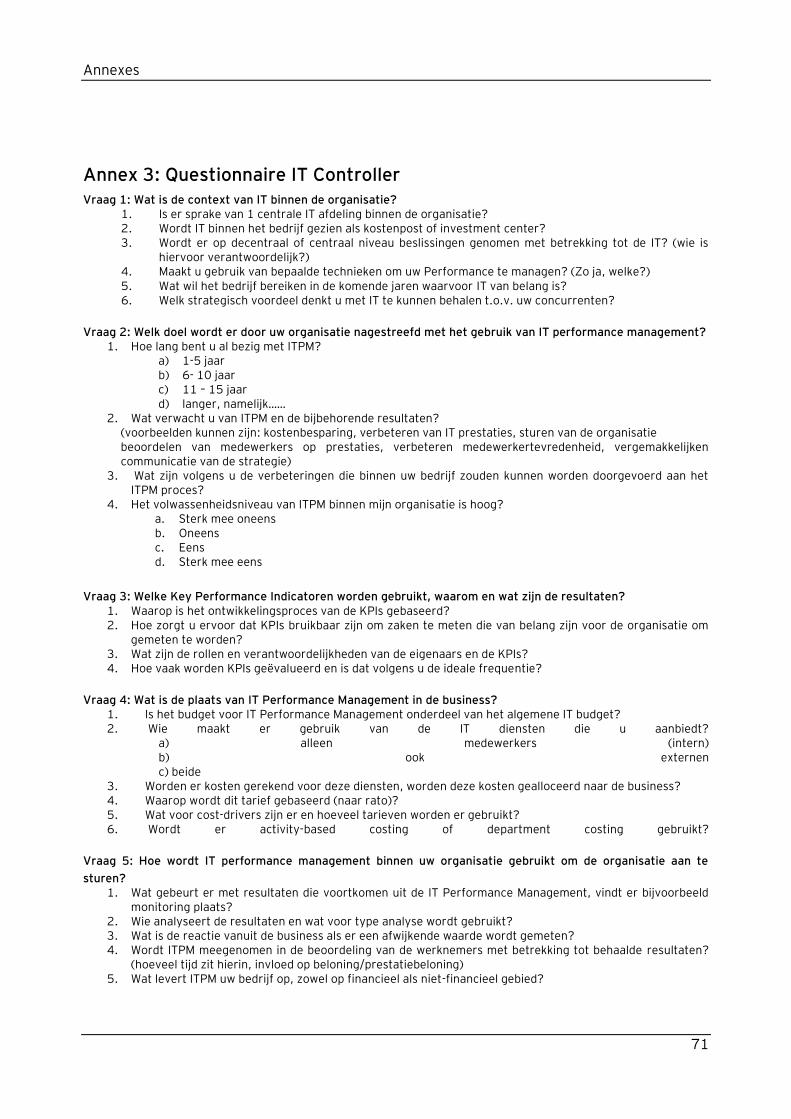
Annexes
71
Annex 3: Questionnaire IT Controller Vraag 1: Wat is de context van IT binnen de organisatie?
1. Is er sprake van 1 centrale IT afdeling binnen de organisatie? 2. Wordt IT binnen het bedrijf gezien als kostenpost of investment center? 3. Wordt er op decentraal of centraal niveau beslissingen genomen met betrekking tot de IT? (wie is
hiervoor verantwoordelijk?) 4. Maakt u gebruik van bepaalde technieken om uw Performance te managen? (Zo ja, welke?) 5. Wat wil het bedrijf bereiken in de komende jaren waarvoor IT van belang is? 6. Welk strategisch voordeel denkt u met IT te kunnen behalen t.o.v. uw concurrenten?
Vraag 2: Welk doel wordt er door uw organisatie nagestreefd met het gebruik van IT performance management? 1. Hoe lang bent u al bezig met ITPM?
a) 1-5 jaar b) 6- 10 jaar c) 11 – 15 jaar d) langer, namelijk……
2. Wat verwacht u van ITPM en de bijbehorende resultaten? (voorbeelden kunnen zijn: kostenbesparing, verbeteren van IT prestaties, sturen van de organisatie beoordelen van medewerkers op prestaties, verbeteren medewerkertevredenheid, vergemakkelijken communicatie van de strategie)
3. Wat zijn volgens u de verbeteringen die binnen uw bedrijf zouden kunnen worden doorgevoerd aan het ITPM proces?
4. Het volwassenheidsniveau van ITPM binnen mijn organisatie is hoog? a. Sterk mee oneens b. Oneens c. Eens d. Sterk mee eens
Vraag 3: Welke Key Performance Indicatoren worden gebruikt, waarom en wat zijn de resultaten? 1. Waarop is het ontwikkelingsproces van de KPIs gebaseerd? 2. Hoe zorgt u ervoor dat KPIs bruikbaar zijn om zaken te meten die van belang zijn voor de organisatie om
gemeten te worden? 3. Wat zijn de rollen en verantwoordelijkheden van de eigenaars en de KPIs? 4. Hoe vaak worden KPIs geëvalueerd en is dat volgens u de ideale frequentie?
Vraag 4: Wat is de plaats van IT Performance Management in de business? 1. Is het budget voor IT Performance Management onderdeel van het algemene IT budget? 2. Wie maakt er gebruik van de IT diensten die u aanbiedt?
a) alleen medewerkers (intern) b) ook externen c) beide
3. Worden er kosten gerekend voor deze diensten, worden deze kosten gealloceerd naar de business? 4. Waarop wordt dit tarief gebaseerd (naar rato)? 5. Wat voor cost-drivers zijn er en hoeveel tarieven worden er gebruikt? 6. Wordt er activity-based costing of department costing gebruikt?
Vraag 5: Hoe wordt IT performance management binnen uw organisatie gebruikt om de organisatie aan te
sturen? 1. Wat gebeurt er met resultaten die voortkomen uit de IT Performance Management, vindt er bijvoorbeeld
monitoring plaats? 2. Wie analyseert de resultaten en wat voor type analyse wordt gebruikt? 3. Wat is de reactie vanuit de business als er een afwijkende waarde wordt gemeten? 4. Wordt ITPM meegenomen in de beoordeling van de werknemers met betrekking tot behaalde resultaten?
(hoeveel tijd zit hierin, invloed op beloning/prestatiebeloning) 5. Wat levert ITPM uw bedrijf op, zowel op financieel als niet-financieel gebied?
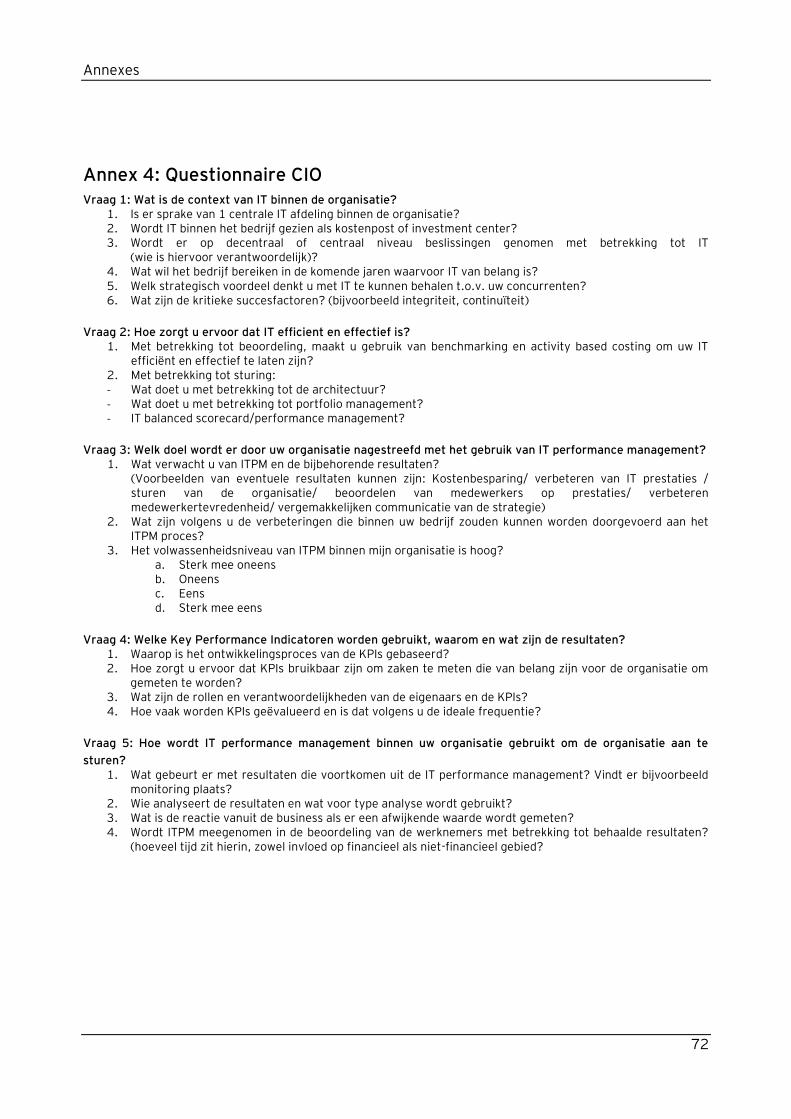
Annexes
72
Annex 4: Questionnaire CIO Vraag 1: Wat is de context van IT binnen de organisatie?
1. Is er sprake van 1 centrale IT afdeling binnen de organisatie? 2. Wordt IT binnen het bedrijf gezien als kostenpost of investment center? 3. Wordt er op decentraal of centraal niveau beslissingen genomen met betrekking tot IT
(wie is hiervoor verantwoordelijk)? 4. Wat wil het bedrijf bereiken in de komende jaren waarvoor IT van belang is? 5. Welk strategisch voordeel denkt u met IT te kunnen behalen t.o.v. uw concurrenten? 6. Wat zijn de kritieke succesfactoren? (bijvoorbeeld integriteit, continuïteit)
Vraag 2: Hoe zorgt u ervoor dat IT efficient en effectief is? 1. Met betrekking tot beoordeling, maakt u gebruik van benchmarking en activity based costing om uw IT
efficiënt en effectief te laten zijn? 2. Met betrekking tot sturing: - Wat doet u met betrekking tot de architectuur? - Wat doet u met betrekking tot portfolio management? - IT balanced scorecard/performance management?
Vraag 3: Welk doel wordt er door uw organisatie nagestreefd met het gebruik van IT performance management? 1. Wat verwacht u van ITPM en de bijbehorende resultaten?
(Voorbeelden van eventuele resultaten kunnen zijn: Kostenbesparing/ verbeteren van IT prestaties / sturen van de organisatie/ beoordelen van medewerkers op prestaties/ verbeteren medewerkertevredenheid/ vergemakkelijken communicatie van de strategie)
2. Wat zijn volgens u de verbeteringen die binnen uw bedrijf zouden kunnen worden doorgevoerd aan het ITPM proces?
3. Het volwassenheidsniveau van ITPM binnen mijn organisatie is hoog? a. Sterk mee oneens b. Oneens c. Eens d. Sterk mee eens
Vraag 4: Welke Key Performance Indicatoren worden gebruikt, waarom en wat zijn de resultaten? 1. Waarop is het ontwikkelingsproces van de KPIs gebaseerd? 2. Hoe zorgt u ervoor dat KPIs bruikbaar zijn om zaken te meten die van belang zijn voor de organisatie om
gemeten te worden? 3. Wat zijn de rollen en verantwoordelijkheden van de eigenaars en de KPIs? 4. Hoe vaak worden KPIs geëvalueerd en is dat volgens u de ideale frequentie?
Vraag 5: Hoe wordt IT performance management binnen uw organisatie gebruikt om de organisatie aan te
sturen? 1. Wat gebeurt er met resultaten die voortkomen uit de IT performance management? Vindt er bijvoorbeeld
monitoring plaats? 2. Wie analyseert de resultaten en wat voor type analyse wordt gebruikt? 3. Wat is de reactie vanuit de business als er een afwijkende waarde wordt gemeten? 4. Wordt ITPM meegenomen in de beoordeling van de werknemers met betrekking tot behaalde resultaten?
(hoeveel tijd zit hierin, zowel invloed op financieel als niet-financieel gebied?
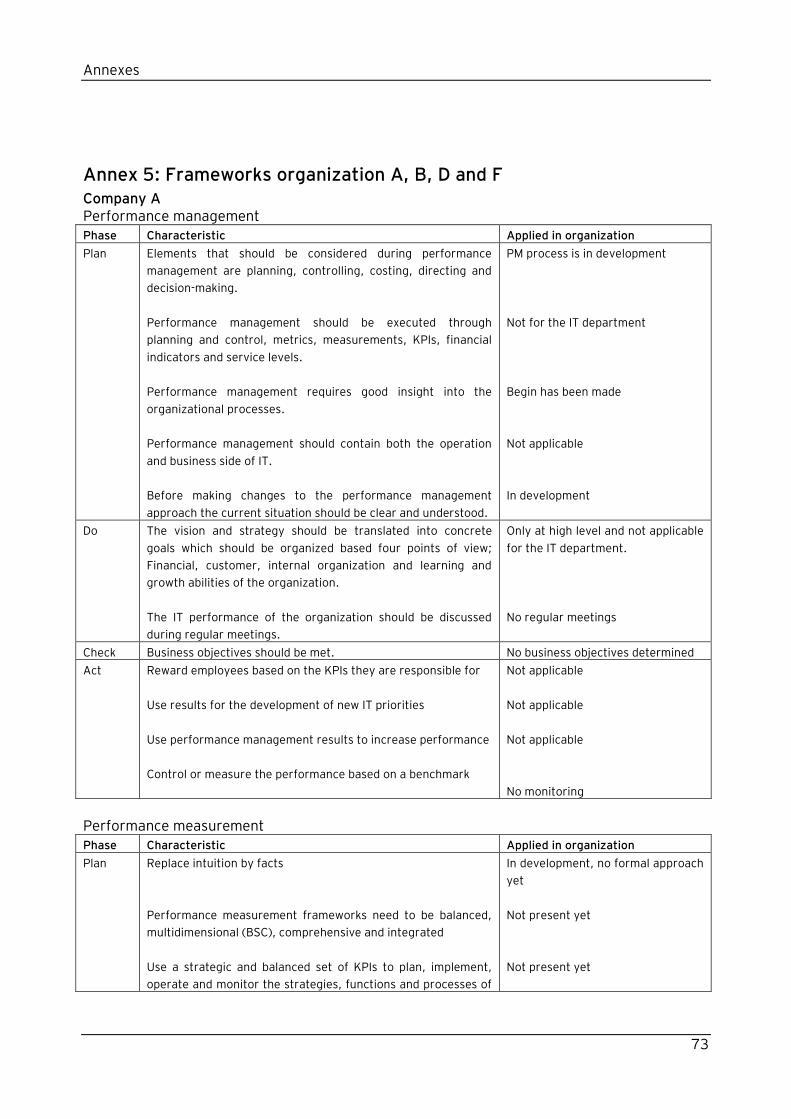
Annexes
73
Annex 5: Frameworks organization A, B, D and F Company A Performance management
Phase Characteristic Applied in organization
Plan Elements that should be considered during performance
management are planning, controlling, costing, directing and
decision-making.
Performance management should be executed through
planning and control, metrics, measurements, KPIs, financial
indicators and service levels.
Performance management requires good insight into the
organizational processes.
Performance management should contain both the operation
and business side of IT.
Before making changes to the performance management
approach the current situation should be clear and understood.
PM process is in development
Not for the IT department
Begin has been made
Not applicable
In development
Do The vision and strategy should be translated into concrete
goals which should be organized based four points of view;
Financial, customer, internal organization and learning and
growth abilities of the organization.
The IT performance of the organization should be discussed
during regular meetings.
Only at high level and not applicable
for the IT department.
No regular meetings
Check Business objectives should be met. No business objectives determined
Act Reward employees based on the KPIs they are responsible for
Use results for the development of new IT priorities
Use performance management results to increase performance
Control or measure the performance based on a benchmark
Not applicable
Not applicable
Not applicable
No monitoring
Performance measurement
Phase Characteristic Applied in organization
Plan Replace intuition by facts
Performance measurement frameworks need to be balanced,
multidimensional (BSC), comprehensive and integrated
Use a strategic and balanced set of KPIs to plan, implement,
operate and monitor the strategies, functions and processes of
In development, no formal approach
yet
Not present yet
Not present yet
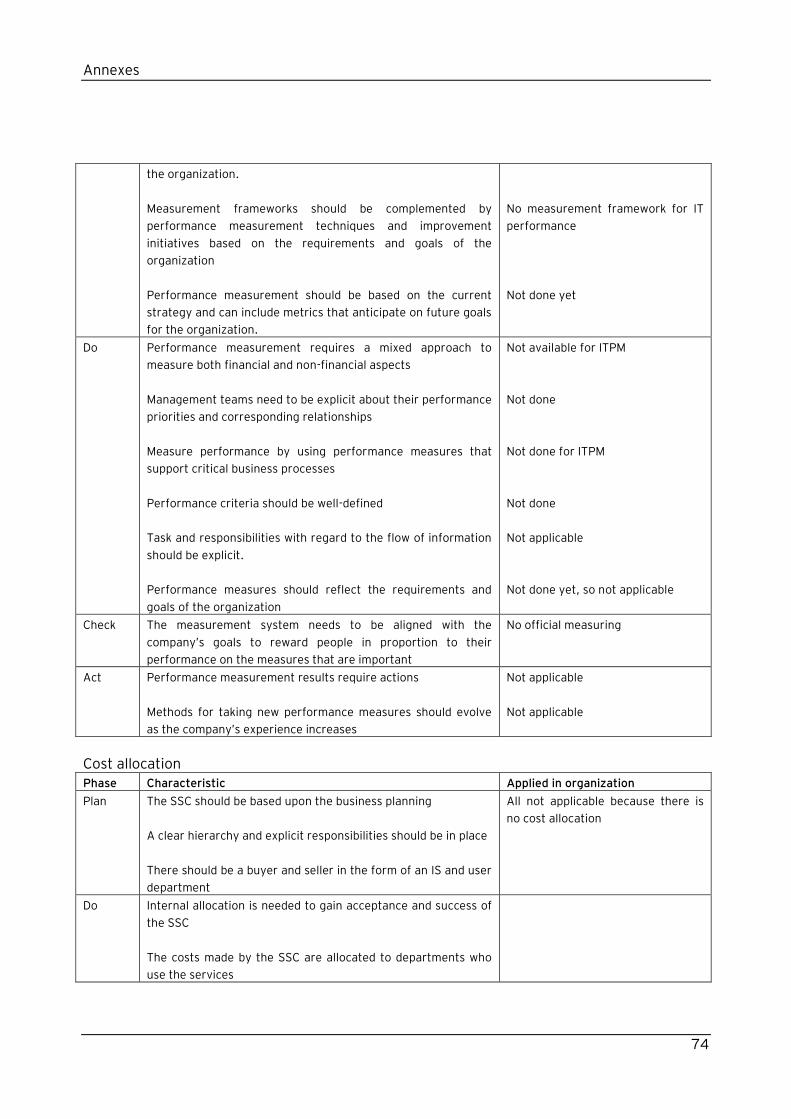
Annexes
74
the organization.
Measurement frameworks should be complemented by
performance measurement techniques and improvement
initiatives based on the requirements and goals of the
organization
Performance measurement should be based on the current
strategy and can include metrics that anticipate on future goals
for the organization.
No measurement framework for IT
performance
Not done yet
Do Performance measurement requires a mixed approach to
measure both financial and non-financial aspects
Management teams need to be explicit about their performance
priorities and corresponding relationships
Measure performance by using performance measures that
support critical business processes
Performance criteria should be well-defined
Task and responsibilities with regard to the flow of information
should be explicit.
Performance measures should reflect the requirements and
goals of the organization
Not available for ITPM
Not done
Not done for ITPM
Not done
Not applicable
Not done yet, so not applicable
Check The measurement system needs to be aligned with the
company‟s goals to reward people in proportion to their
performance on the measures that are important
No official measuring
Act Performance measurement results require actions
Methods for taking new performance measures should evolve
as the company‟s experience increases
Not applicable
Not applicable
Cost allocation
Phase Characteristic Applied in organization
Plan The SSC should be based upon the business planning
A clear hierarchy and explicit responsibilities should be in place
There should be a buyer and seller in the form of an IS and user
department
All not applicable because there is
no cost allocation
Do Internal allocation is needed to gain acceptance and success of
the SSC
The costs made by the SSC are allocated to departments who
use the services
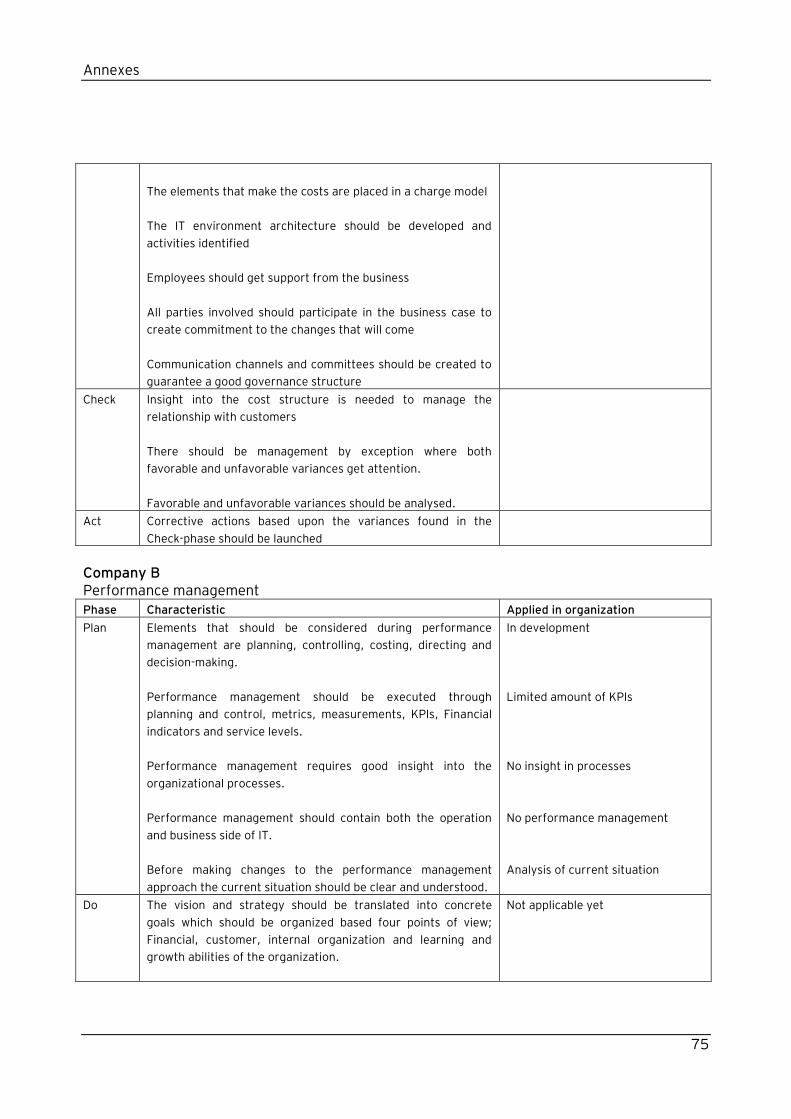
Annexes
75
The elements that make the costs are placed in a charge model
The IT environment architecture should be developed and
activities identified
Employees should get support from the business
All parties involved should participate in the business case to
create commitment to the changes that will come
Communication channels and committees should be created to
guarantee a good governance structure
Check Insight into the cost structure is needed to manage the
relationship with customers
There should be management by exception where both
favorable and unfavorable variances get attention.
Favorable and unfavorable variances should be analysed.
Act Corrective actions based upon the variances found in the
Check-phase should be launched
Company B Performance management
Phase Characteristic Applied in organization
Plan Elements that should be considered during performance
management are planning, controlling, costing, directing and
decision-making.
Performance management should be executed through
planning and control, metrics, measurements, KPIs, Financial
indicators and service levels.
Performance management requires good insight into the
organizational processes.
Performance management should contain both the operation
and business side of IT.
Before making changes to the performance management
approach the current situation should be clear and understood.
In development
Limited amount of KPIs
No insight in processes
No performance management
Analysis of current situation
Do The vision and strategy should be translated into concrete
goals which should be organized based four points of view;
Financial, customer, internal organization and learning and
growth abilities of the organization.
Not applicable yet
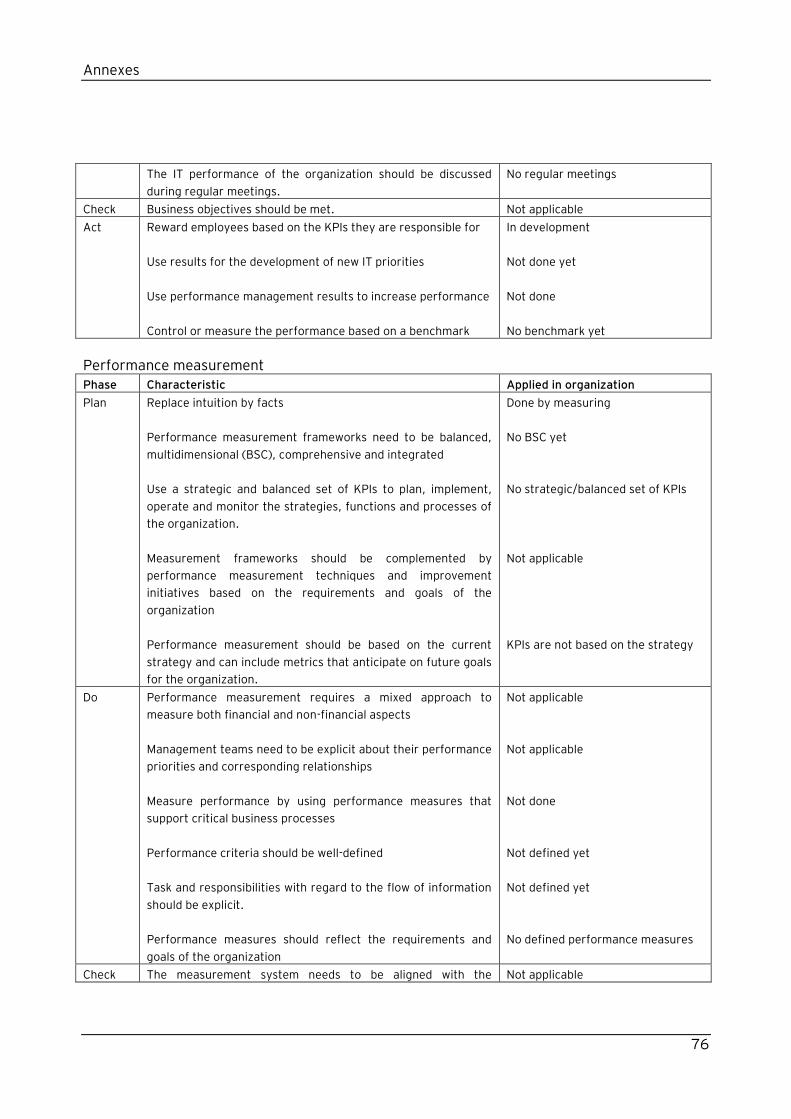
Annexes
76
The IT performance of the organization should be discussed
during regular meetings.
No regular meetings
Check Business objectives should be met. Not applicable
Act Reward employees based on the KPIs they are responsible for
Use results for the development of new IT priorities
Use performance management results to increase performance
Control or measure the performance based on a benchmark
In development
Not done yet
Not done
No benchmark yet
Performance measurement
Phase Characteristic Applied in organization
Plan Replace intuition by facts
Performance measurement frameworks need to be balanced,
multidimensional (BSC), comprehensive and integrated
Use a strategic and balanced set of KPIs to plan, implement,
operate and monitor the strategies, functions and processes of
the organization.
Measurement frameworks should be complemented by
performance measurement techniques and improvement
initiatives based on the requirements and goals of the
organization
Performance measurement should be based on the current
strategy and can include metrics that anticipate on future goals
for the organization.
Done by measuring
No BSC yet
No strategic/balanced set of KPIs
Not applicable
KPIs are not based on the strategy
Do Performance measurement requires a mixed approach to
measure both financial and non-financial aspects
Management teams need to be explicit about their performance
priorities and corresponding relationships
Measure performance by using performance measures that
support critical business processes
Performance criteria should be well-defined
Task and responsibilities with regard to the flow of information
should be explicit.
Performance measures should reflect the requirements and
goals of the organization
Not applicable
Not applicable
Not done
Not defined yet
Not defined yet
No defined performance measures
Check The measurement system needs to be aligned with the Not applicable
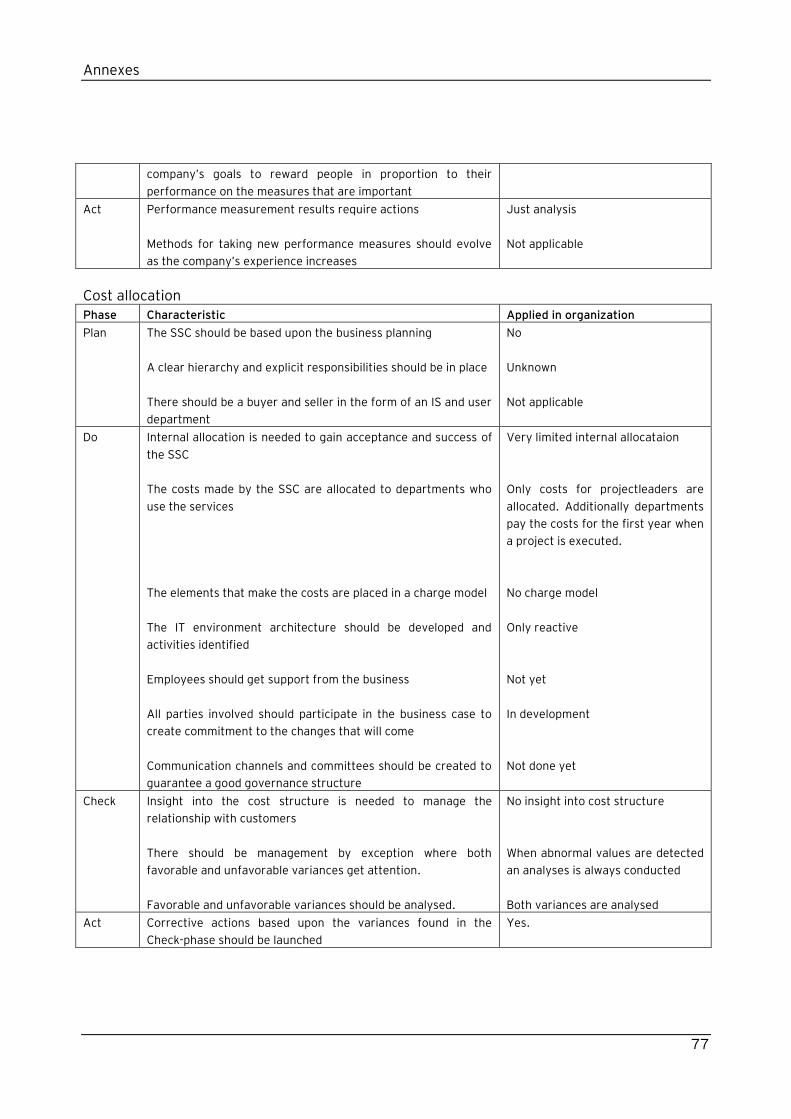
Annexes
77
company‟s goals to reward people in proportion to their
performance on the measures that are important
Act Performance measurement results require actions
Methods for taking new performance measures should evolve
as the company‟s experience increases
Just analysis
Not applicable
Cost allocation
Phase Characteristic Applied in organization
Plan The SSC should be based upon the business planning
A clear hierarchy and explicit responsibilities should be in place
There should be a buyer and seller in the form of an IS and user
department
No
Unknown
Not applicable
Do Internal allocation is needed to gain acceptance and success of
the SSC
The costs made by the SSC are allocated to departments who
use the services
The elements that make the costs are placed in a charge model
The IT environment architecture should be developed and
activities identified
Employees should get support from the business
All parties involved should participate in the business case to
create commitment to the changes that will come
Communication channels and committees should be created to
guarantee a good governance structure
Very limited internal allocataion
Only costs for projectleaders are
allocated. Additionally departments
pay the costs for the first year when
a project is executed.
No charge model
Only reactive
Not yet
In development
Not done yet
Check Insight into the cost structure is needed to manage the
relationship with customers
There should be management by exception where both
favorable and unfavorable variances get attention.
Favorable and unfavorable variances should be analysed.
No insight into cost structure
When abnormal values are detected
an analyses is always conducted
Both variances are analysed
Act Corrective actions based upon the variances found in the
Check-phase should be launched
Yes.
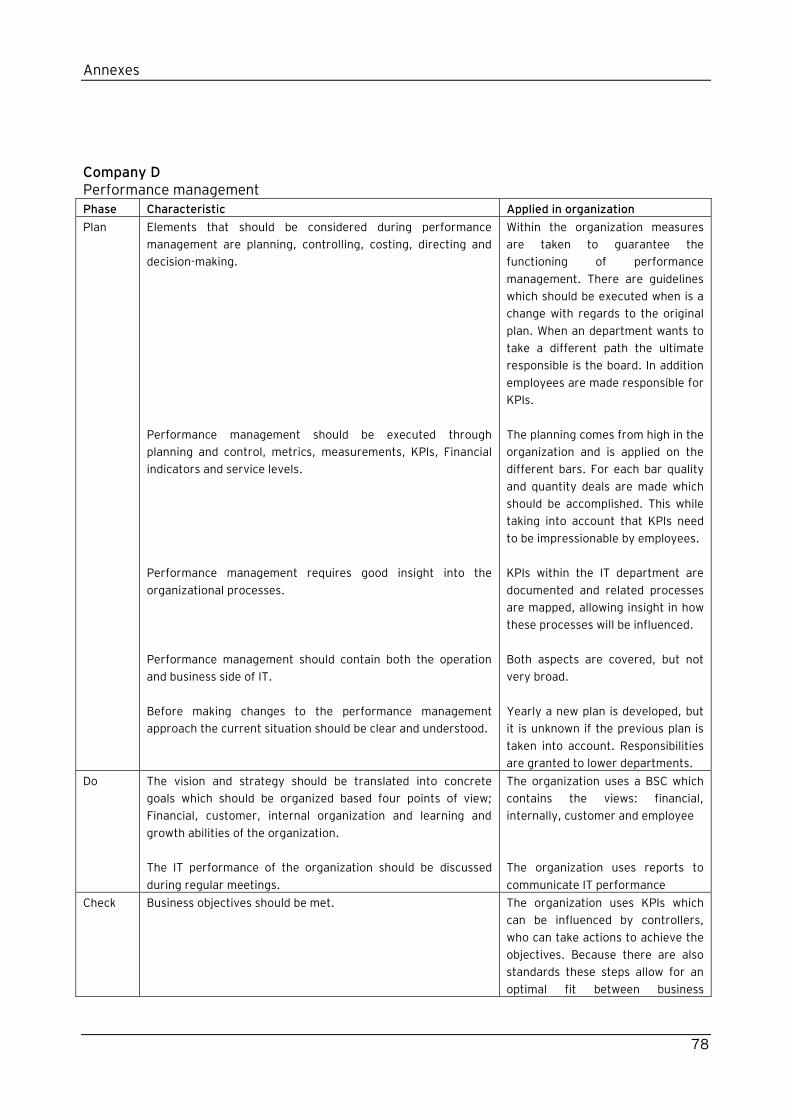
Annexes
78
Company D Performance management
Phase Characteristic Applied in organization
Plan Elements that should be considered during performance
management are planning, controlling, costing, directing and
decision-making.
Performance management should be executed through
planning and control, metrics, measurements, KPIs, Financial
indicators and service levels.
Performance management requires good insight into the
organizational processes.
Performance management should contain both the operation
and business side of IT.
Before making changes to the performance management
approach the current situation should be clear and understood.
Within the organization measures
are taken to guarantee the
functioning of performance
management. There are guidelines
which should be executed when is a
change with regards to the original
plan. When an department wants to
take a different path the ultimate
responsible is the board. In addition
employees are made responsible for
KPIs.
The planning comes from high in the
organization and is applied on the
different bars. For each bar quality
and quantity deals are made which
should be accomplished. This while
taking into account that KPIs need
to be impressionable by employees.
KPIs within the IT department are
documented and related processes
are mapped, allowing insight in how
these processes will be influenced.
Both aspects are covered, but not
very broad.
Yearly a new plan is developed, but
it is unknown if the previous plan is
taken into account. Responsibilities
are granted to lower departments.
Do The vision and strategy should be translated into concrete
goals which should be organized based four points of view;
Financial, customer, internal organization and learning and
growth abilities of the organization.
The IT performance of the organization should be discussed
during regular meetings.
The organization uses a BSC which
contains the views: financial,
internally, customer and employee
The organization uses reports to
communicate IT performance
Check Business objectives should be met. The organization uses KPIs which
can be influenced by controllers,
who can take actions to achieve the
objectives. Because there are also
standards these steps allow for an
optimal fit between business

Annexes
79
objectives and ITPM, which
facilitates realization.
Act Reward employees based on the KPIs they are responsible for
Use results for the development of new IT priorities
Use performance management results to increase performance
Control or measure the performance based on a benchmark
Employees are responsible for KPIs
which they can influence
These results are not used for the
development of new IT priorities
Results are not used to adjust the
system
KPIs are used to measure
performance
Performance measurement
Phase Characteristic Applied in organization
Plan Replace intuition by facts
Performance measurement frameworks need to be balanced,
multidimensional (BSC), comprehensive and integrated
Use a strategic and balanced set of KPIs to plan, implement,
operate and monitor the strategies, functions and processes of
the organization.
Measurement frameworks should be complemented by
performance measurement techniques and improvement
initiatives based on the requirements and goals of the
organization
Performance measurement should be based on the current
strategy and can include metrics that anticipate on future goals
for the organization.
Is done
The BSC does not contain all views.
The views contain a minimum of
KPIs.
The board steers the bars on fixed
KPIs. The board steers executing
departments primary on the
achievement of efficiency goals,
while the assigner steers on the
achievement of made
quality/quantiy deals.
Currently there is a measurement
framework and is performance
measured, this should become more
pro-active instead of reactive
The organizational approach is
based on cost saving approach. It is
unknown if results of the framework
are used for improvement
initiatives.
Do Performance measurement requires a mixed approach to
measure both Financial and non-financial aspects
Management teams need to be explicit about their performance
priorities and corresponding relationships
There is a BSC approach, without
learning aspect.
The board steers executing
departments on the achievement of
efficiencygoals. The lower
departments develop agreements
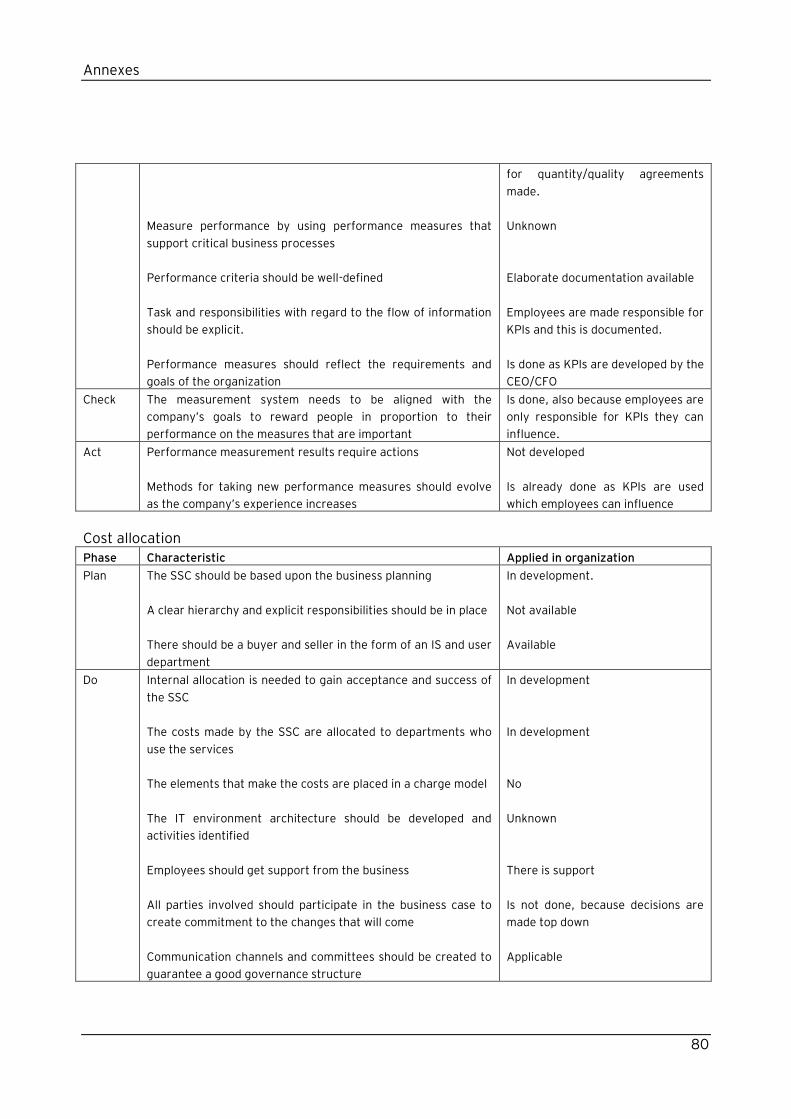
Annexes
80
Measure performance by using performance measures that
support critical business processes
Performance criteria should be well-defined
Task and responsibilities with regard to the flow of information
should be explicit.
Performance measures should reflect the requirements and
goals of the organization
for quantity/quality agreements
made.
Unknown
Elaborate documentation available
Employees are made responsible for
KPIs and this is documented.
Is done as KPIs are developed by the
CEO/CFO
Check The measurement system needs to be aligned with the
company‟s goals to reward people in proportion to their
performance on the measures that are important
Is done, also because employees are
only responsible for KPIs they can
influence.
Act Performance measurement results require actions
Methods for taking new performance measures should evolve
as the company‟s experience increases
Not developed
Is already done as KPIs are used
which employees can influence
Cost allocation
Phase Characteristic Applied in organization
Plan The SSC should be based upon the business planning
A clear hierarchy and explicit responsibilities should be in place
There should be a buyer and seller in the form of an IS and user
department
In development.
Not available
Available
Do Internal allocation is needed to gain acceptance and success of
the SSC
The costs made by the SSC are allocated to departments who
use the services
The elements that make the costs are placed in a charge model
The IT environment architecture should be developed and
activities identified
Employees should get support from the business
All parties involved should participate in the business case to
create commitment to the changes that will come
Communication channels and committees should be created to
guarantee a good governance structure
In development
In development
No
Unknown
There is support
Is not done, because decisions are
made top down
Applicable
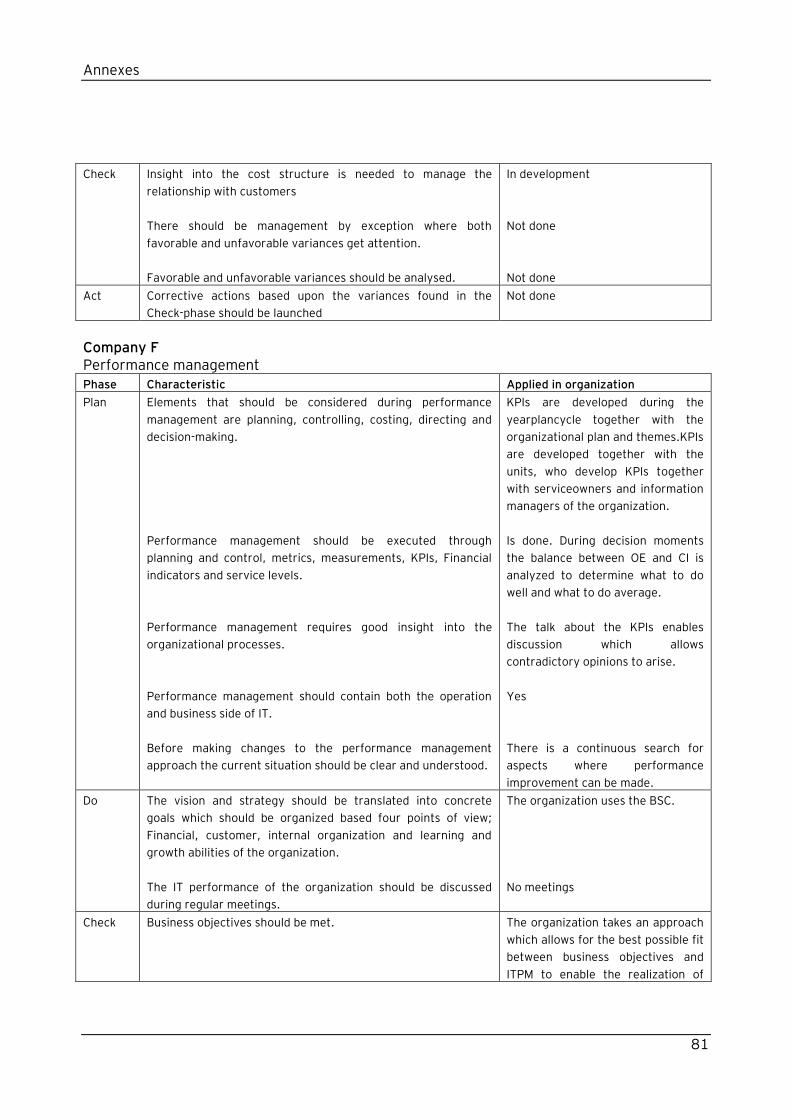
Annexes
81
Check Insight into the cost structure is needed to manage the
relationship with customers
There should be management by exception where both
favorable and unfavorable variances get attention.
Favorable and unfavorable variances should be analysed.
In development
Not done
Not done
Act Corrective actions based upon the variances found in the
Check-phase should be launched
Not done
Company F Performance management
Phase Characteristic Applied in organization
Plan Elements that should be considered during performance
management are planning, controlling, costing, directing and
decision-making.
Performance management should be executed through
planning and control, metrics, measurements, KPIs, Financial
indicators and service levels.
Performance management requires good insight into the
organizational processes.
Performance management should contain both the operation
and business side of IT.
Before making changes to the performance management
approach the current situation should be clear and understood.
KPIs are developed during the
yearplancycle together with the
organizational plan and themes.KPIs
are developed together with the
units, who develop KPIs together
with serviceowners and information
managers of the organization.
Is done. During decision moments
the balance between OE and CI is
analyzed to determine what to do
well and what to do average.
The talk about the KPIs enables
discussion which allows
contradictory opinions to arise.
Yes
There is a continuous search for
aspects where performance
improvement can be made.
Do The vision and strategy should be translated into concrete
goals which should be organized based four points of view;
Financial, customer, internal organization and learning and
growth abilities of the organization.
The IT performance of the organization should be discussed
during regular meetings.
The organization uses the BSC.
No meetings
Check Business objectives should be met. The organization takes an approach
which allows for the best possible fit
between business objectives and
ITPM to enable the realization of
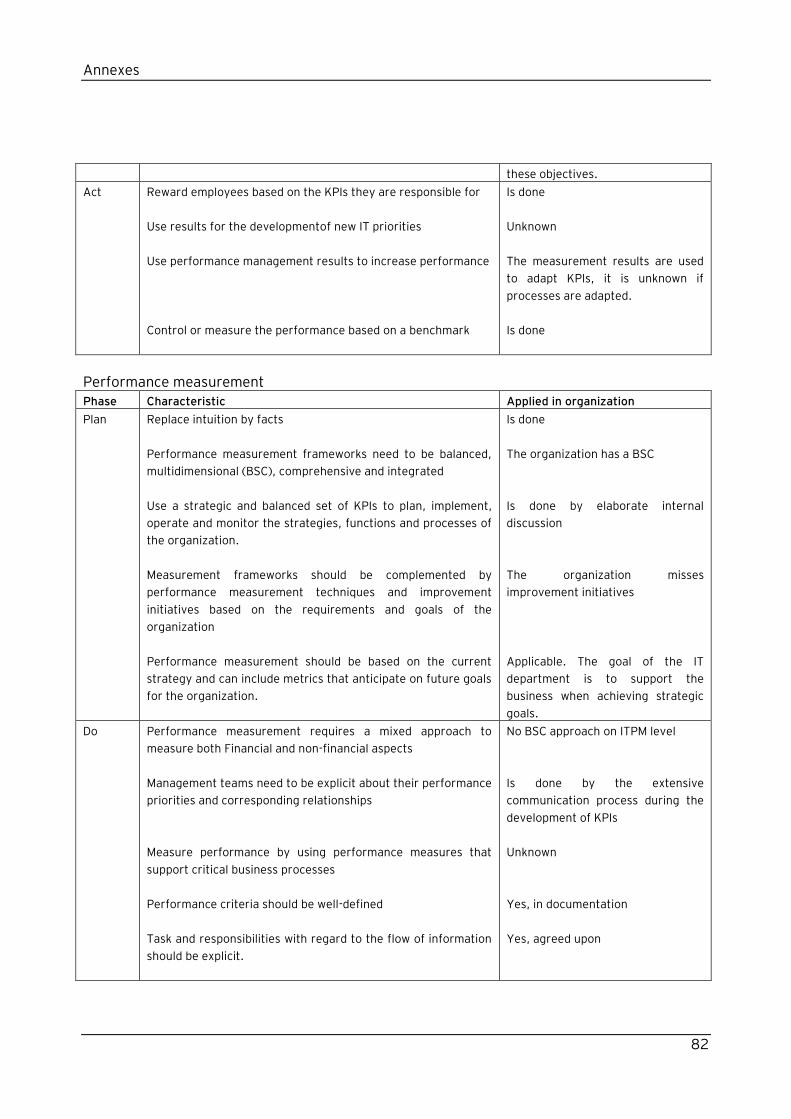
Annexes
82
these objectives.
Act Reward employees based on the KPIs they are responsible for
Use results for the developmentof new IT priorities
Use performance management results to increase performance
Control or measure the performance based on a benchmark
Is done
Unknown
The measurement results are used
to adapt KPIs, it is unknown if
processes are adapted.
Is done
Performance measurement
Phase Characteristic Applied in organization
Plan Replace intuition by facts
Performance measurement frameworks need to be balanced,
multidimensional (BSC), comprehensive and integrated
Use a strategic and balanced set of KPIs to plan, implement,
operate and monitor the strategies, functions and processes of
the organization.
Measurement frameworks should be complemented by
performance measurement techniques and improvement
initiatives based on the requirements and goals of the
organization
Performance measurement should be based on the current
strategy and can include metrics that anticipate on future goals
for the organization.
Is done
The organization has a BSC
Is done by elaborate internal
discussion
The organization misses
improvement initiatives
Applicable. The goal of the IT
department is to support the
business when achieving strategic
goals.
Do Performance measurement requires a mixed approach to
measure both Financial and non-financial aspects
Management teams need to be explicit about their performance
priorities and corresponding relationships
Measure performance by using performance measures that
support critical business processes
Performance criteria should be well-defined
Task and responsibilities with regard to the flow of information
should be explicit.
No BSC approach on ITPM level
Is done by the extensive
communication process during the
development of KPIs
Unknown
Yes, in documentation
Yes, agreed upon
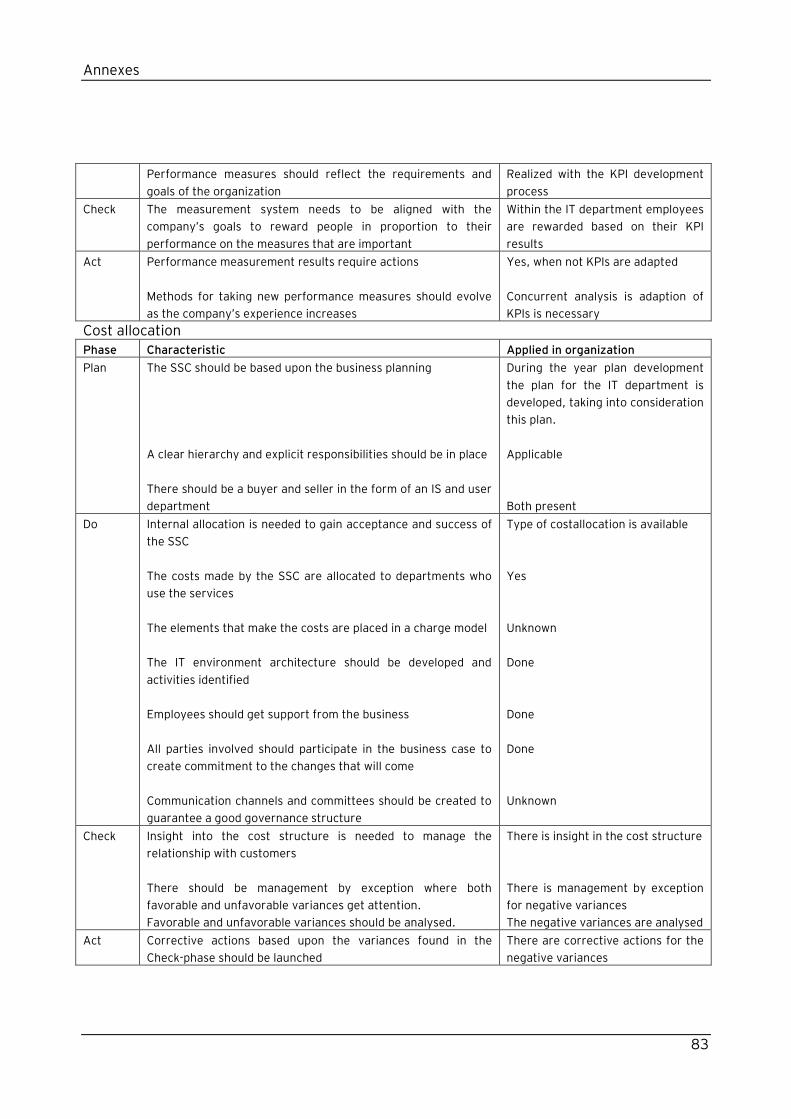
Annexes
83
Performance measures should reflect the requirements and
goals of the organization
Realized with the KPI development
process
Check The measurement system needs to be aligned with the
company‟s goals to reward people in proportion to their
performance on the measures that are important
Within the IT department employees
are rewarded based on their KPI
results
Act Performance measurement results require actions
Methods for taking new performance measures should evolve
as the company‟s experience increases
Yes, when not KPIs are adapted
Concurrent analysis is adaption of
KPIs is necessary
Cost allocation
Phase Characteristic Applied in organization
Plan The SSC should be based upon the business planning
A clear hierarchy and explicit responsibilities should be in place
There should be a buyer and seller in the form of an IS and user
department
During the year plan development
the plan for the IT department is
developed, taking into consideration
this plan.
Applicable
Both present
Do Internal allocation is needed to gain acceptance and success of
the SSC
The costs made by the SSC are allocated to departments who
use the services
The elements that make the costs are placed in a charge model
The IT environment architecture should be developed and
activities identified
Employees should get support from the business
All parties involved should participate in the business case to
create commitment to the changes that will come
Communication channels and committees should be created to
guarantee a good governance structure
Type of costallocation is available
Yes
Unknown
Done
Done
Done
Unknown
Check Insight into the cost structure is needed to manage the
relationship with customers
There should be management by exception where both
favorable and unfavorable variances get attention.
Favorable and unfavorable variances should be analysed.
There is insight in the cost structure
There is management by exception
for negative variances
The negative variances are analysed
Act Corrective actions based upon the variances found in the
Check-phase should be launched
There are corrective actions for the
negative variances