Embed Size (px)
Citation preview
University of Central Florida University of Central Florida
STARS STARS
Electronic Theses and Dissertations
2018
A Framework for Prioritizing Opportunities of Improvement in the A Framework for Prioritizing Opportunities of Improvement in the
Context of Business Excellence Model in Healthcare Organization Context of Business Excellence Model in Healthcare Organization
Alia Aldarmaki University of Central Florida
Part of the Industrial Engineering Commons
Find similar works at: https://stars.library.ucf.edu/etd
University of Central Florida Libraries http://library.ucf.edu
This Doctoral Dissertation (Open Access) is brought to you for free and open access by STARS. It has been accepted
for inclusion in Electronic Theses and Dissertations by an authorized administrator of STARS. For more information,
please contact [email protected].
STARS Citation STARS Citation Aldarmaki, Alia, "A Framework for Prioritizing Opportunities of Improvement in the Context of Business Excellence Model in Healthcare Organization" (2018). Electronic Theses and Dissertations. 6163. https://stars.library.ucf.edu/etd/6163
A FRAMEWORK FOR PRIORITIZING OPPORTUNITIES OF
IMPROVEMENT IN THE CONTEXT OF BUSINESS
EXCELLENCE MODEL IN HEALTHCARE ORGANIZATION
by
ALIA HAMAD ALDARMAKI
B.S. Electrical Engineering, United Arab Emirates University, United Arab Emirates, 2011
M.S. Engineering Management, University of Central Florida, USA, 2014
A dissertation submitted in partial fulfillment of the requirements
for the degree of Doctor of Philosophy
in the Department of Industrial Engineering and Management Systems
in the College of Engineering and Computer Science
at the University of Central Florida
Orlando, Florida
Fall Term
2018
Major professor: Ahmad Elshennawy

ii
© 2018 Alia Aldarmaki
iii
ABSTRACT
In today’s world, the healthcare sector is facing challenges to improve the efficiency and
effectiveness of its operations. More and more improvement projects are being adopted to
enhance healthcare services, making it more patient-centric, and enabling better cost control.
Healthcare organizations strive to identify and carry out such improvement initiatives to sustain
their businesses and gain competitive advantage. Seeking to reach a higher operational level of
excellence, healthcare organizations utilize business excellence criteria to conduct assessment
and identify organizational strengths and weaknesses. However, while such assessments
routinely identify numerous areas for potential improvement, it is not feasible to conduct all
improvement projects simultaneously due to limitations in time, capital, and personnel, as well as
conflict with other organization’s projects or strategic objectives. An effective prioritization and
selection approach is valuable in that it can assist the organization to optimize its available
resources and outcomes. This study attempts to enable such an approach by developing a
framework to prioritize improvement opportunities in healthcare in the context of the business
excellence model through the integration of the Fuzzy Delphi Method and Fuzzy Interface
System.
To carry out the evaluation process, the framework consists of two phases. The first
phase utilizes Fuzzy Delphi Method to identify the most significant factors that should be
considered in healthcare for electing the improvement projects. The FDM is employed to handle
the subjectivity of human assessment. The research identifies potential factors for evaluating
projects, then utilizes FDM to capture expertise knowledge. The first round in FDM is intended
to validate the identified list of factors from experts; which includes collecting additional factors
iv
from experts that the literature might have overlooked. When an acceptable level of consensus
has been reached, a second round is conducted to obtain experts’ and other related stakeholders’
opinions on the appropriate weight of each factor’s importance. Finally, FDM analyses eliminate
or retain the criteria to produce a final list of critical factors to select improvement projects.
The second phase in the framework attempts to prioritize improvement initiatives using
the Hierarchical Fuzzy Interface System. The Fuzzy Interface System combines the experts’
ratings for each improvement opportunity with respect to the factors deemed critical to compute
the priority index. In the process of calculating the priority index, the framework allows the
estimation of other intermediate indices including: social, financial impact, strategical,
operational feasibility, and managerial indices. These indices bring an insight into the
improvement opportunities with respect to each framework’s dimensions. The framework allows
for a reduction of the bias in the assessment by developing a knowledge based on the
perspectives of multiple experts.

v
To
My beloved father and mother,
For their prayers and support, which made who I am.
To
My beloved kids, Maitha and Saeed,
For the happiness you bring to my life.
To
My husband, Ali Aldhaheri,
For his support, sacrifice, constant encouragement, and unconditional love
This effort is dedicated to you all
vi
ACKNOWLEDGMENTS
In the name of Allah, the most gracious, the most merciful
First, I would like to express my deepest appreciation for my committee chair, Professor
Ahmad Elshennawy. Without his patient, support, encouragement, and guidance this research
would not have been possible. I couldn’t imagine a better advisor. Thank you, Professor
Elshennawy.
My profound gratitude goes to the dissertation committee, Prof. Luis Rabelo, Dr.Gene
Lee, Dr. Mohammad Darwish, and all of the faculty and staff in the Department of Industrial
Engineering and Management Systems at the University of Central Florida for providing me
with such a rich intellectual research experience.
A special thanks goes to Abu Dhabi Health Services Company (SEHA) and Dubai Health
Authority (DHA) for facilitating the data collection process. A special thanks to Dr. Aisha Kouri,
Shamsa Almuhairi, and Alnoud Alkaabi for their support. My thanks also extends to all of the
participants in this research, your input made this study possible
Last but not least, I am grateful to the General Secretariat of the Executive Council
(GSEC), Abu Dhabi for supporting my education.
TABLE OF CONTENTS
ABSTRACT ................................................................................................................................... iii
ACKNOWLEDGMENTS ............................................................................................................. vi
TABLE OF CONTENTS .............................................................................................................. vii
LIST OF FIGURES ....................................................................................................................... xi
LIST OF TABLES ....................................................................................................................... xiv
LIST OF ABBREVIATIONS ....................................................................................................... xx
CHAPTER 1: INTRODUCTION .............................................................................................. 1
1.1 Overview ......................................................................................................................... 1
1.2 Research Problem statement ........................................................................................... 6
1.3 Research Objectives ........................................................................................................ 7
1.4 Research Questions ......................................................................................................... 8
1.5 Research Contribution .................................................................................................... 9
1.6 Organization of the Dissertation ..................................................................................... 9
CHAPTER 2: LITERATURE REVIEW ................................................................................. 11
2.1 Introduction ................................................................................................................... 11
2.2 Total Quality Management ........................................................................................... 12
2.3 Business Excellence ...................................................................................................... 15
2.3.1 European Foundation for Quality Management (EFQM) ......................................... 17
2.3.2 MBNQA model ......................................................................................................... 23
viii
2.3.3 Comparison of EFQM and MBNQA ........................................................................ 25
2.4 Project prioritization and selection ............................................................................... 27
2.4.1 Prioritizing improvement initiatives ......................................................................... 29
2.4.2 Available prioritization models for business excellence .......................................... 31
2.5 Healthcare ..................................................................................................................... 52
2.5.1 Quality initiative challenges in healthcare ................................................................ 56
2.5.2 Business excellence models in healthcare ................................................................ 59
2.5.3 The benefits BEMs can bring to healthcare .............................................................. 65
2.5.4 Decision making in healthcare .................................................................................. 69
2.6 Proposed approaches ..................................................................................................... 70
2.6.1 Stakeholder involvement .......................................................................................... 70
2.6.2 Fuzzy Delphi method ................................................................................................ 72
2.6.3 Fuzzy logic ................................................................................................................ 74
2.6.4 Fuzzy VIKOR ........................................................................................................... 77
2.7 Literature review summary ........................................................................................... 80
2.8 Research Gap analysis .................................................................................................. 81
CHAPTER 3: RESEARCH METHODOLOGY...................................................................... 85
3.1 Introduction ................................................................................................................... 85
3.2 Research Methodology ................................................................................................. 85
3.3 Research idea ................................................................................................................ 87
3.4 Literature review ........................................................................................................... 89
3.5 Gap analysis .................................................................................................................. 89
ix
3.6 Case Study Design ........................................................................................................ 92
3.7 Conclusion .................................................................................................................... 93
3.8 Future research .............................................................................................................. 94
3.9 Summary ....................................................................................................................... 94
CHAPTER 4: FRAMEWORK DESIGN ................................................................................. 96
4.1 Introduction ................................................................................................................... 96
4.2 Framework outline ........................................................................................................ 96
4.2.1 Phase 1: Selecting the key evaluation factors ........................................................... 99
4.2.2 Phase 2: Fuzzy Interface System ............................................................................ 114
4.2.3 Reliability and Validation ....................................................................................... 130
4.3 Summery ..................................................................................................................... 132
CHAPTER 5: IMPLEMENTATION AND RESULTS ......................................................... 133
5.1 Introduction ................................................................................................................. 133
5.2 Case studies ................................................................................................................. 133
5.3 Results of stakeholders’ identification ........................................................................ 134
5.4 Results of Fuzzy Delphi Method ................................................................................ 139
5.4.1 Results for hospital A.............................................................................................. 144
5.4.2 Results for Hospital B ............................................................................................. 156
5.5 FIS Preparedness ......................................................................................................... 167
5.5.1 Results of expert knowledge acquisition ................................................................ 168
5.6 Results of Fuzzy Interface System .............................................................................. 192
5.6.1 Results for Hospital A ............................................................................................. 193
x
5.6.2 Results for Hospital B ............................................................................................. 214
5.7 Reliability and Validation test .................................................................................... 227
5.8 Concluding remarks .................................................................................................... 234
CHAPTER 6: CONCLUSION AND FUTURE RESEARCH ............................................... 238
6.1 Conclusion .................................................................................................................. 238
6.2 Research Limitations .................................................................................................. 241
6.3 Future work ................................................................................................................. 242
APPENDIX A: EFQM AND MBNQA DETAILED CRITERIA AND SUB-CRITERIA ........ 244
APPENDIX B: UCF IRB APPROVAL ..................................................................................... 248
APPENDIX C: SEHA APPROVAL .......................................................................................... 250
APPENDIX D: DUBAI HEALTH AUTHORITY APPROVAL ............................................... 253
APPENDIX E: ETHIC COMMITTEE APPROVAL ................................................................ 255
APPENDIX F: STAKEHOLDERS’ ANALYSIS ...................................................................... 259
APPENDIX G: FUZZY DELPHI SURVEYS ........................................................................... 261
APPENDIX H: BEM’s SUB-CRITERIA RATING................................................................... 270
APPENDIX I: EXPERT KNOWLEDGE ACQUISITION ........................................................ 275
APPENDIX J: FUZZY DELPHI METHOD MACROSCODE ................................................. 278
LIST OF REFERENCES ............................................................................................................ 281
xi
LIST OF FIGURES
Figure 1-1:Malcolm Baldrige National Quality Award applicants and award recipients .............. 3
Figure 1-2: Recognized healthcare service organizations in EFQM (2010-2016) ......................... 4
Figure 1-3: The recognized healthcare service categories in EFQM (2010-2016) ......................... 5
Figure 2-1: EFQM model.............................................................................................................. 18
Figure.2-2: RADAR logic cycle ................................................................................................... 22
Figure 2-3: MBNQA framework .................................................................................................. 25
Figure 2-4: Dodangeh and Yusuff (2011) algorithm for areas of improvement selection ........... 34
Figure 2-5: Ezzabadi et al. (2015) hierarchal structure ................................................................. 43
Figure 2-6: Herat et al. (2012) network structure ......................................................................... 49
Figure 2-7: Healthcare key stakeholders ....................................................................................... 52
Figure 2-8: Roles and responsibilities in quality improvement .................................................... 56
Figure 2-9: Power/Interest matrix. ................................................................................................ 72
Figure 2-10: Typical architecture of Fuzzy Inference System ...................................................... 75
Figure 3-1: High level research methodology .............................................................................. 87
Figure 3-2: Case study method. .................................................................................................... 93
Figure 4-1: The proposed framework. .......................................................................................... 98
Figure 4-2: Procedure for selecting the key evaluation factors. ................................................. 100
Figure 4-3: Membership function used in stakeholders’ analysis. ............................................. 106
Figure 4-4: Stakeholders’ analysis scheme. ................................................................................ 108
Figure 4-5: Importance weights membership function for the evaluation factors ..................... 110
Figure 4-6: Standard vs. Hierarchical Fuzzy System................................................................. 115
xii
Figure 4-7: The proposed Hierarchical Fuzzy System ............................................................... 116
Figure 4-8: The model FIS subsystem ........................................................................................ 117
Figure 4-9: The proposed model architecture ............................................................................. 119
Figure 4-10: TFN of alternatives expected performance ............................................................ 122
Figure 4-11: Regions of membership function ........................................................................... 124
Figure.4-12 : Membership function for dimensions layer’s outputs .......................................... 125
Figure 5-1: Power/necessity of involvement matrix. .................................................................. 139
Figure 5-2: Venn Diagram for selected factors of the four groups. ............................................ 155
Figure 5-3: Venn Diagram for selected factors of the four groups. ............................................ 166
Figure 5-4: Patient’s satisfaction membership function ............................................................. 170
Figure 5-5: Health and Safety membership function .................................................................. 172
Figure 5-6: Reputational image membership function. .............................................................. 174
Figure 5-7: Sustainability membership function......................................................................... 176
Figure 5-8: Resource and information availability membership function .................................. 178
Figure 5-9: Top management commitment membership function ............................................. 180
Figure 5-10: Evidence based membership function.................................................................... 182
Figure 5-11: Critical to quality membership function ................................................................ 184
Figure 5-12: Ethical implication membership function .............................................................. 186
Figure 5-13: Creativity and innovation membership function .................................................... 188
Figure 5-14: Improvement classification membership function ................................................. 190
Figure 5-15: Implementation of the ranking model using Simulink for Hospital A .................. 206
Figure 5-16: Surface of the FIS-L1-1 ......................................................................................... 207
Figure 5-17: Surface of the FIS-L1-2 ......................................................................................... 208
xiii
Figure 5-18: Surface of the FIS-L1-3 ......................................................................................... 209
Figure 5-19: Surface of the FIS-L1-4 ......................................................................................... 210
Figure 5-20: Surface of the FIS-L1-5 ......................................................................................... 210
Figure 5-21: Surface of the FIS-L2 ............................................................................................. 211
Figure 5-22: Surface of the FIS-L3 ............................................................................................. 212
Figure 5-23: Implementation of the ranking model using Simulink- Hospital B ....................... 223
Figure 5-24: FIS-L1-3 Surface plot- Hospital B ........................................................................ 224
Figure 5-25: FIS-L1-4 Surface plot- Hospital B ........................................................................ 225
xiv
LIST OF TABLES
Table 2-1: EFQM vs. MBNQA criteria ........................................................................................ 26
Table 2-2: Methods in the literature to prioritize improvement initiatives in various industries . 29
Table 2-3: Summary of the available models ............................................................................... 51
Table 2-4: Challenges to implementing quality initiatives in healthcare ..................................... 59
Table 2-5: Business excellence in healthcare ............................................................................... 64
Table 2-6: Impact of business excellence in healthcare and related indices ................................. 68
Table 2-7: Factors affecting decision making in healthcare ......................................................... 70
Table 2-8: The difference between experts and stakeholder knowledge ...................................... 71
Table 2-9: Gap analysis ................................................................................................................ 84
Table 3-1 Comparison between potential techniques ................................................................... 92
Table 4-1: Categorization of related works for key evaluation factors for selecting improvement
opportunities ....................................................................................................................... 102
Table 4-2: Potential stakeholders’ groups ................................................................................... 105
Table 4-3: Linguistic variables and the corresponding fuzzy number used in stakeholders’
analysis ................................................................................................................................ 105
Table 4-4: Importance weights linguistic variables and fuzzy numbers. .................................... 110
Table 4-5: Linguistic variables and Fuzzy set values for the alternatives’ expected performance
............................................................................................................................................. 121
Table 4-6: The linguistic terms and fuzzy numbers for dimensions layer’s outputs. ................. 125
Table 4-7: Evaluation factors based on the types of quality characteristics ............................... 127
Table 4-8: Fuzzy rules matrix in level 1 ..................................................................................... 128
xv
Table 4-9: Fuzzy rules matrix for the intermediate layer ........................................................... 129
Table 4-10: Fuzzy rules matrix for the integration layer ............................................................ 129
Table 5-1: Expert ratings for stakeholders based on necessity of stakeholder involvement ...... 135
Table 5-2: Expert ratings for stakeholders based on stakeholder power .................................... 135
Table 5-3 : Fuzzy weights, average fuzzy weights and crisp values for necessity of stakeholder
involvement......................................................................................................................... 136
Table 5-4 : Fuzzy weight, average fuzzy weight and crisp value for stakeholder’s Power ........ 137
Table 5-5 : Fuzzy weight, average fuzzy weight and crisp value for power index .................... 138
Table 5-6: List of framework’s dimensions, evaluation factors, and descriptions ..................... 140
Table 5-7: Results of the Fuzzy Delphi validation phase ........................................................... 141
Table 5-8: Revised list of framework’s and evaluation factors after Fuzzy Delphi round 1 ...... 142
Table 5-9: Sample size from each hospital ................................................................................. 143
Table 5-10: Responses from each hospital ................................................................................. 144
Table 5-11: Experts’ evaluation of factors’ importance in Hospital A ....................................... 145
Table 5-12: Fuzzy number and average fuzzy weight for each evaluation factors based on
experts’ rating in Hospital A ............................................................................................... 145
Table 5-13: Experts’ results for the three conditions and the final decision in Hospital A ........ 146
Table 5-14: Physicians’ evaluation of factors’ importance in Hospital A .................................. 147
Table 5-15: Fuzzy number and average fuzzy weight for the factors based on physicians’ rating
in hospital A ........................................................................................................................ 148
Table 5-16: Physicians’ result for the three conditions and the final decision in hospital A ..... 149
Table 5-17: Nurses’ evaluation for factors’ importance in Hospital A ...................................... 150
xvi
Table 5-18: Fuzzy number and average fuzzy weight for the factors based on nurses’ rating in
hospital A ............................................................................................................................ 150
Table 5-19: Nurses’ results for the three conditions and the final decision in Hospital A ......... 151
Table 5-20: Managers and administrators’ evaluation of factors’ importance in Hospital A .... 152
Table 5-21: Fuzzy number and average fuzzy weight for the factors based on Managers and
administrators’ rating in Hospital A ................................................................................... 152
Table 5-22: Managers and administrators’ results for the three conditions and the final decision
in Hospital A ....................................................................................................................... 153
Table 5-23: Retained factors from each group ........................................................................... 154
Table 5-24: Factors selected for Hospital A ............................................................................... 155
Table 5-25: Experts’ evaluation for factors’ importance in Hospital B...................................... 156
Table 5-26: Fuzzy number and average fuzzy weight for the factors from experts’ perspectives in
Hospital B ........................................................................................................................... 157
Table 5-27: Physicians’ evaluation for factors’ importance in hospital B .................................. 157
Table 5-28: Fuzzy number and average fuzzy weight for the factors from physicians’
perspectives in Hospital B .................................................................................................. 158
Table 5-29: Nurses’ evaluation for factors’ importance in Hospital B ....................................... 158
Table 5-30: Fuzzy number and average fuzzy weight for the factors from nurses’ perspectives in
Hospital B ........................................................................................................................... 159
Table 5-31: Managers and administrators’ evaluation for factors’ importance in Hospital B ... 159
Table 5-32: Fuzzy number and average fuzzy weight for the factors from managers and
administrators’ perspectives in Hospital B ......................................................................... 160
Table 5-33: Experts’ result for the three conditions and the final decision in Hospital B .......... 161
xvii
Table 5-34: Physicians’ result for the three conditions and the final decision in Hospital B ..... 162
Table 5-35: Nurses’ result for the three conditions and the final decision in Hospital B ........... 163
Table 5-36: Managers and administrators’ result for the three conditions and the final decision in
Hospital B ........................................................................................................................... 164
Table 5-37: Retained factors from each group in Hospital B. .................................................... 165
Table 5-38: Factors selected for hospital B ................................................................................ 166
Table 5-39: Interval assignment for patient’s satisfaction .......................................................... 169
Table 5-40: Interval assignment for health and safety ................................................................ 171
Table 5-41: Interval assignment for reputational image ............................................................. 173
Table 5-42: Interval assignment for sustainability...................................................................... 175
Table 5-43: Interval assignment for resource and information availability ................................ 177
Table 5-44: Interval assignment for top management commitment ........................................... 179
Table 5-45: Interval assignment for evidence-based criterion .................................................... 181
Table 5-46: Interval assignment for critical to quality ................................................................ 183
Table 5-47: Interval assignment for ethical implications ........................................................... 185
Table 5-48: Interval assignment for creativity and innovation ................................................... 187
Table 5-49: Interval assignment for improvement classification. .............................................. 189
Table 5-50: Linguistic class and the corresponding fuzzy number for the factors ..................... 191
Table 5-51: EFQM sub-criteria ratings subject to the patient satisfaction factor for Hospital A 195
Table 5-52: EFQM sub-criteria ratings subject to the health and safety factor for Hospital A .. 196
Table 5-53: EFQM sub-criteria ratings subject to the reputational image factor for Hospital A 197
Table 5-54: EFQM sub-criteria ratings subject to the sustainability factor for Hospital A ........ 198
Table 5-55: EFQM sub-criteria ratings subject to the evidence-based factor. ........................... 199
xviii
Table 5-56: EFQM sub-criteria ratings subject to the critical to quality factor for Hospital A .. 200
Table 5-57: EFQM sub-criteria ratings subject to the top management commitment factor for
Hospital A ........................................................................................................................... 201
Table 5-58: EFQM sub-criteria rating subject to ethical implications factor for Hospital A ..... 202
Table 5-59: Fuzzy numbers for improvement’s expected performance for each factor for Hospital
A .......................................................................................................................................... 203
Table 5-60: Crisp values for improvements’ expected performance for Hospital A .................. 204
Table 5-61: Improvements’ expected performance after normalization for Hospital A ............ 205
Table 5-62: Simulink results for each alternative for Hospital A ............................................... 213
Table 5-63: EFQM sub-criteria ratings subject to the reputational image factor for Hospital B.
............................................................................................................................................. 215
Table 5-64: EFQM sub-criteria ratings subject to the health and safety factor for Hospital B. . 216
Table 5-65: EFQM sub-criteria ratings subject to the sustainability factor for Hospital B. ....... 217
Table 5-66: EFQM sub-criteria rating subject to the patient satisfaction factor for Hospital B. 218
Table 5-67: EFQM sub-criteria ratings subject to the creativity and innovation factor for hospital
B. ......................................................................................................................................... 219
Table 5-68: EFQM sub-criteria ratings subject to the resource and information availability factor
for Hospital B. ..................................................................................................................... 220
Table 5-69: Improvements’ expected performance crisp values for Hospital B. ....................... 221
Table 5-70: Improvements’ expected performance after normalization for Hospital B. ............ 222
Table 5-71: Simulink’s result for each alternative for Hospital B. ............................................. 226
Table 5-72: Reliability analysis and factor analysis. .................................................................. 228
Table 5-73: FVIKOR performance matrix after normalization for Hospital A .......................... 230

xix
Table 5-74: FVIKOR indices and alternatives ranking for Hospital A ...................................... 231
Table 5-75: FVIKOR performance matrix after normalization for Hospital B .......................... 233
Table 5-76: FVIKOR indices and alternatives ranking For Hospital B...................................... 234
xx
LIST OF ABBREVIATIONS
AHP Analytical Hierarchical Process
ANP Analytic Network Process
ASQ American Society for Quality
BEMs Business Excellence Models
CFS Critical Success Factors
CITC Corrected Item Total Correlation
COG Center of Gravity
DEMATEL Decision Making Trial and Evaluation Laboratory
EFA Exploratory Factor Analysis
EFQM European Foundation for Quality Management
FDM Fuzzy DELPHI Method
FIS Fuzzy Interface System
FRBS Fuzzy Rule Based System
FMEA Failure Mode and Effect Analysis
HFS Hierarchical Fuzzy System
JCI Joint Commission International
KMO Kaiser Meyer Olkin
LSS Lean Six Sigma
LoS Length of Stay
MADM Multiple Attribute Decision Making
xxi
MAUT Multi Attribute Utility Theory
MBNQA Malcolm Baldrige National Quality Award
MCDM Multiple Criteria Decision Making
MOCM Multiple Objective Criteria Making
NIST National Institute of Standards and Technology
NRM Network Relation Map
OD Outpatient Department
PAM Process Activity Mapping
PCA Principal Component Analysis
PDCA Plan-Do-Check-Act
QFD Qualify Function Deployment
RADAR Approach, Deploy, Assess, and Refine
SAW Simple Additive Weighting
SS Six Sigma
SPSS Statistical Packages Social Sciences
TQM Total Quality Management
TOPSIS Technique for Order Preference by Similarity to Ideal Solution
VIKOR VlseKriterijumska Optimizacija I Kompromisno Resenje
WHO World Health Organization
1
CHAPTER 1: INTRODUCTION
1.1 Overview
Competition in the twenty- first century obligates organizations to continuously improve
performance and achieve excellence (Foster, Johnson, Nelson, & Batalden, 2007). The use of
Business Excellence Models (BEMs) is one popular method to achieve excellence nowadays in a
variety of sectors (Mohammad, Mann, Grigg, & Wagner, 2009). BEMs offer a set of dimensions
and criteria to asset current performance and shed light on an organization’s weaknesses (Foster
et al., 2007). Specifically, the criteria pose questions to let the organization determine how they
address situations, which yields to identifying its performance gaps.
The literature highlighted BEMs numerus benefits to any organization. According to
Brown (2000), BEM criteria assist an organization to improve its performance and its end
results. They also permit best practices sharing and benchmarking among different corporations
and industries around the globe (Mann & Grigg, 2004). These criteria serve as a guideline to
understand organization performance in order to cope with the stakeholders’ requirements and
achieve the targeted objectives (Flynn & Saladin, 2001). BEMs also create a common language,
promoting easier communication across an organization (Stahr, 2001). Moreover, it facilitates
long-term growth and organizational learning (Dutt, Biswas, Arora, & Kar, 2012; Escrig & De
Menezes, 2015; Martin-Castilla, 2002).
In today’s complex world, the healthcare sector is facing multi-factorial challenges and
growing pressure to improve efficiency and effectiveness, be patient-centric, have more cost
control, and improve public results. In 2014, a report by The National Health Expenditure
2
Accounts announced that U.S. healthcare occupied 17.5% of the Gross Domestic Product,
equaling 3 trillion US dollars in total; with 5.3% growth and a cost of $9,523 per person (NHEA,
2014). Regardless of this enormous expenditure, most consumers still consider the service’s
delivery of healthcare and treatment is inefficient and not patient-friendly (Fleiszer, Semenic,
Ritchie, Richer, & Denis, 2015; Herzlinger, 2006). Thus, the healthcare sector requires further
novel initiatives to accelerate its transformation.
BEMs are widely accepted frameworks to enhance healthcare performance and
effectiveness (Foster et al., 2007). There has been a noticeable growth in the adoption of BEMs
in healthcare systems worldwide and applying for its awards. According to the National Institute
of Standards and Technology (NIST), applicants for the Malcolm Baldrige National Quality
Award (MBNQA) in healthcare have increased since the first introduction of healthcare specific
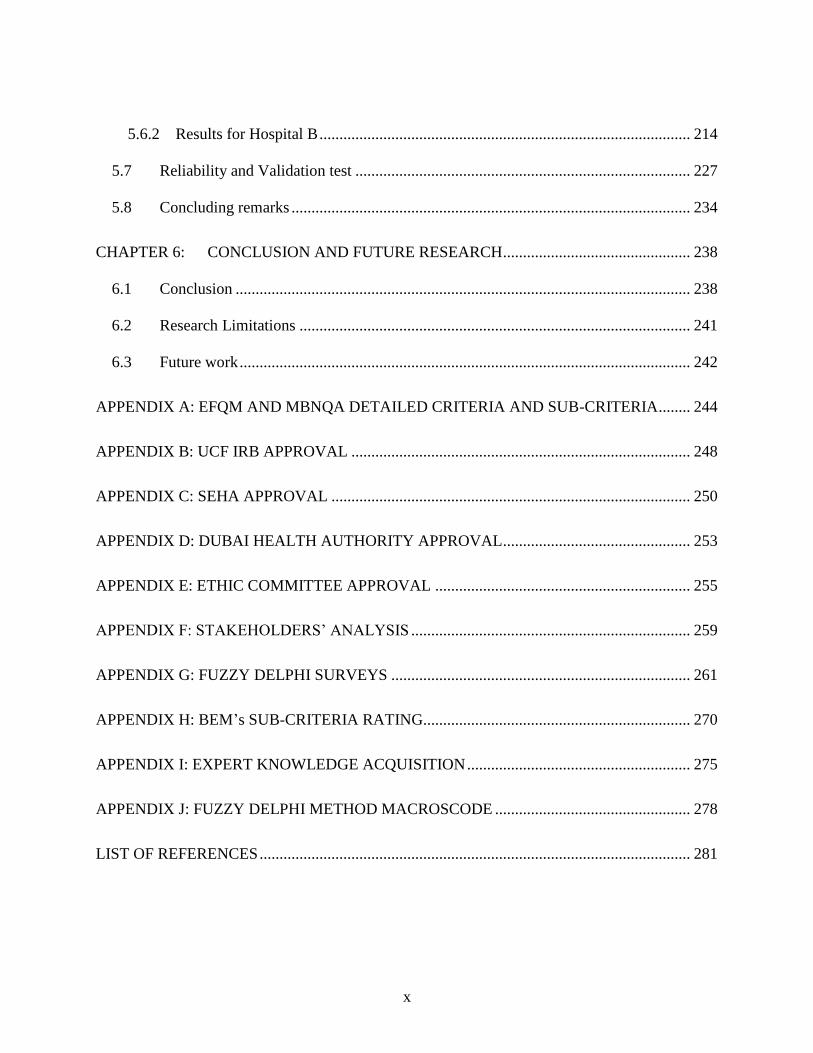
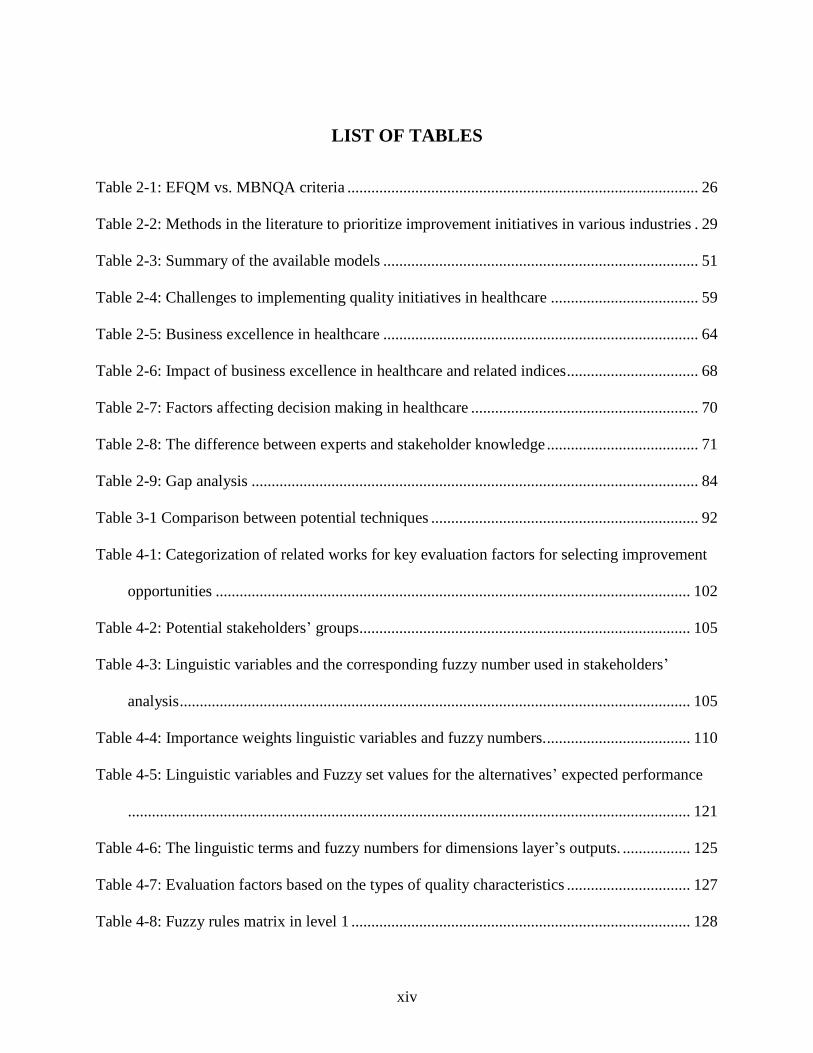
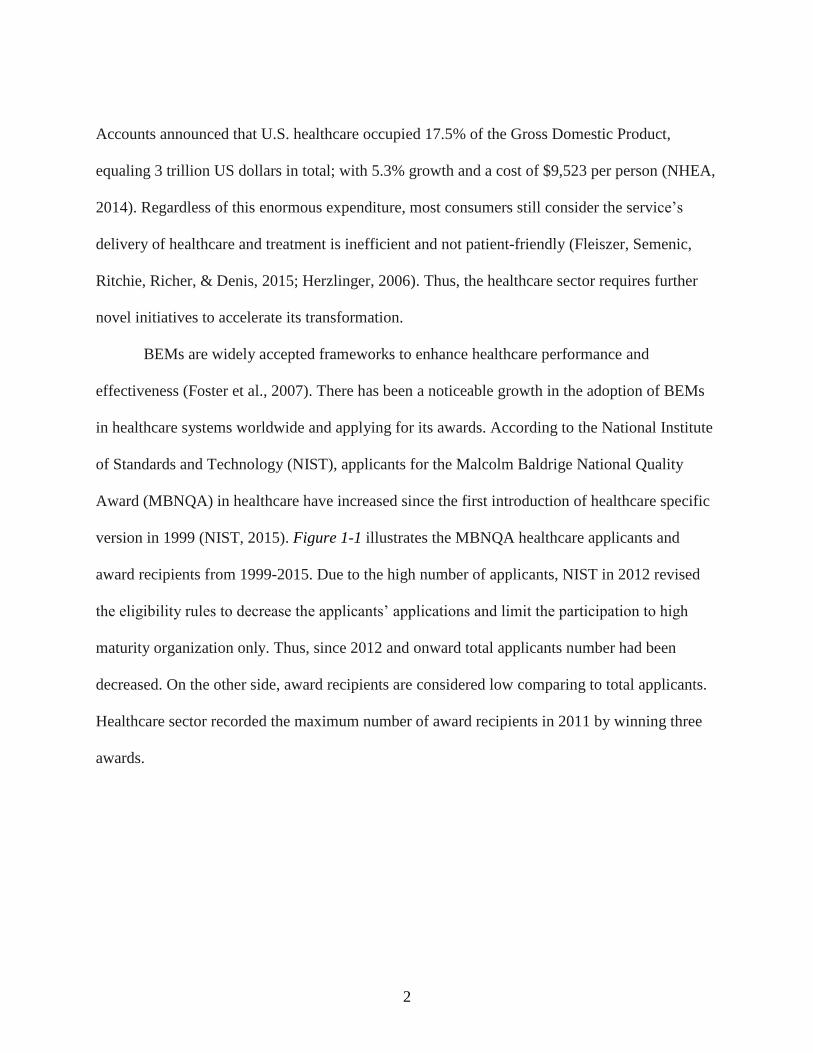
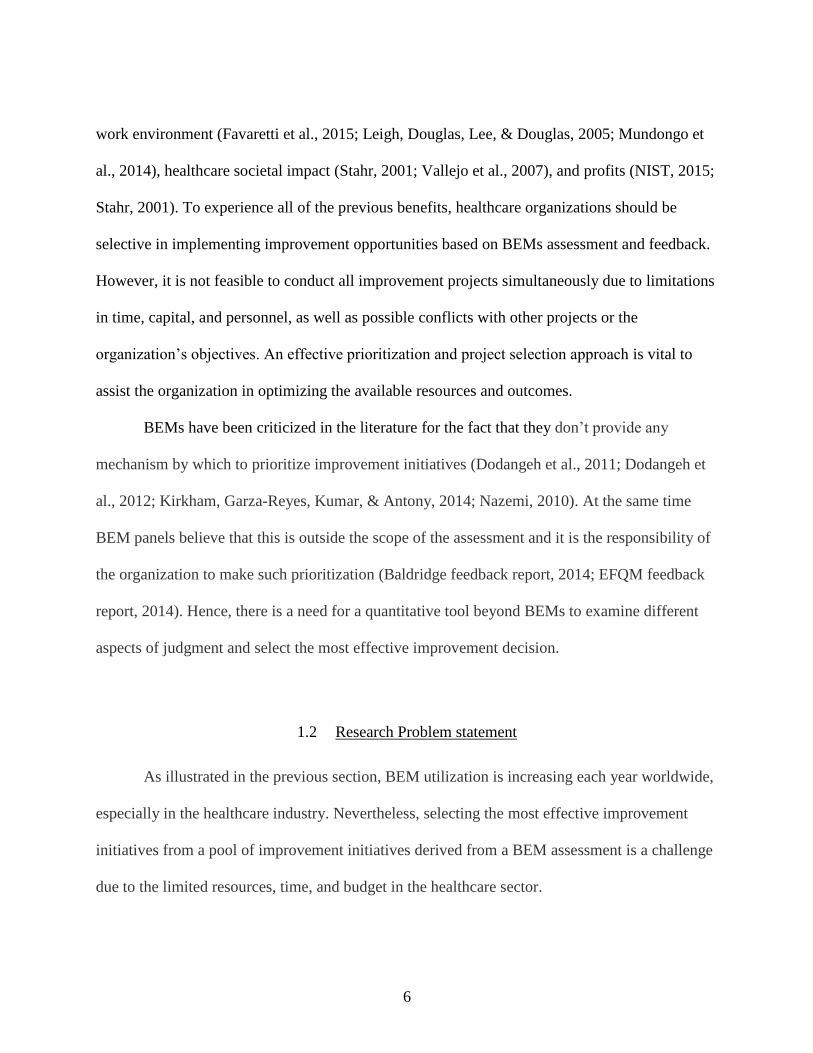
version in 1999 (NIST, 2015). Figure 1-1 illustrates the MBNQA healthcare applicants and
award recipients from 1999-2015. Due to the high number of applicants, NIST in 2012 revised
the eligibility rules to decrease the applicants’ applications and limit the participation to high
maturity organization only. Thus, since 2012 and onward total applicants number had been
decreased. On the other side, award recipients are considered low comparing to total applicants.
Healthcare sector recorded the maximum number of award recipients in 2011 by winning three
awards.
3
Figure 1-1:Malcolm Baldrige National Quality Award applicants and award recipients
in healthcare (1999-2015)
Source: National Institute of Standards and Technology (NIST)
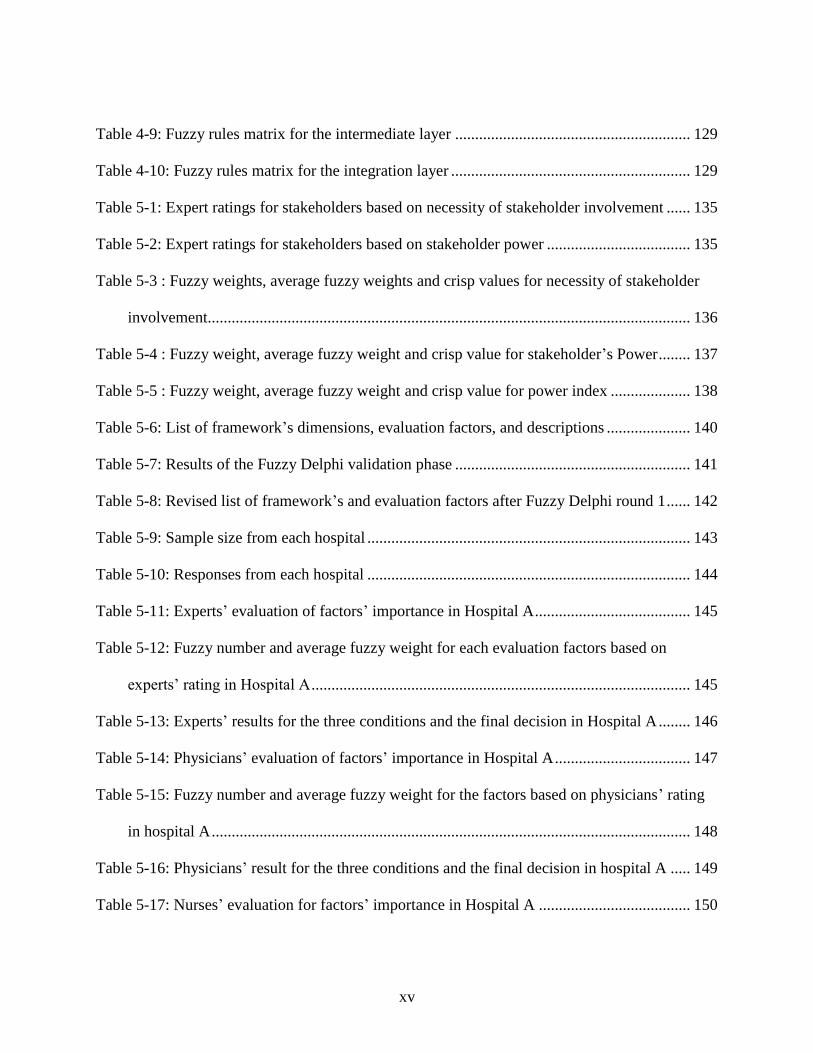
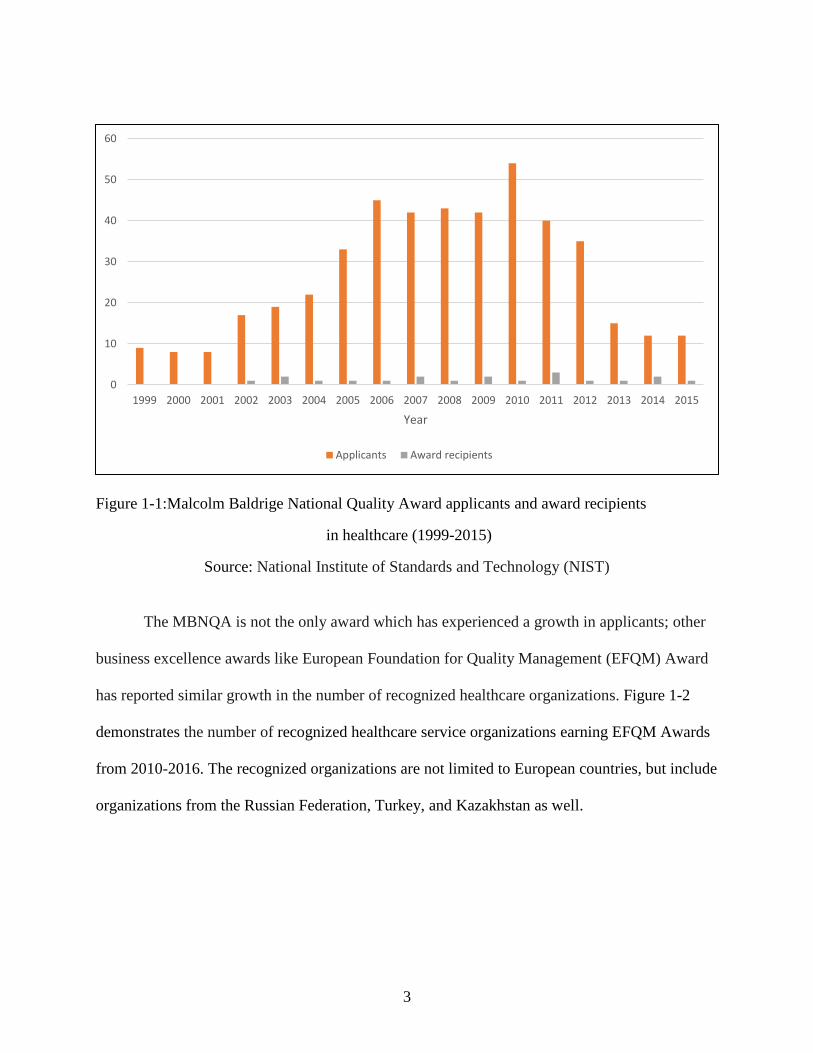
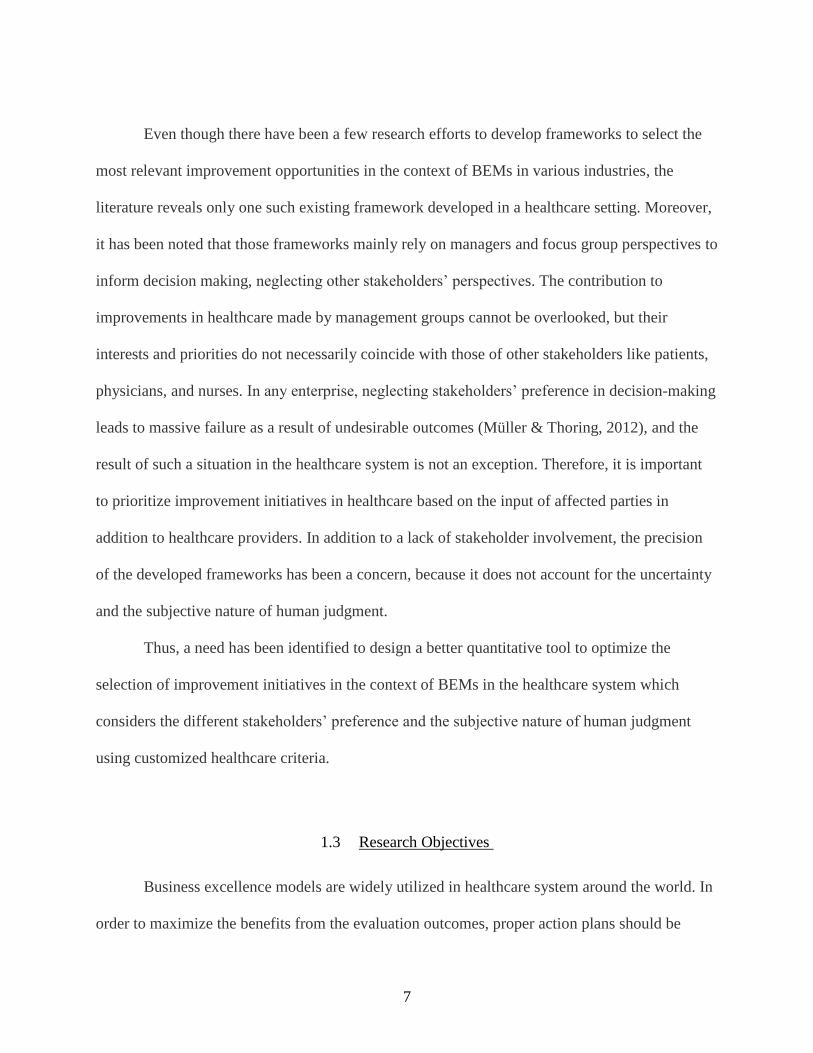
The MBNQA is not the only award which has experienced a growth in applicants; other
business excellence awards like European Foundation for Quality Management (EFQM) Award
has reported similar growth in the number of recognized healthcare organizations. Figure 1-2
demonstrates the number of recognized healthcare service organizations earning EFQM Awards
from 2010-2016. The recognized organizations are not limited to European countries, but include
organizations from the Russian Federation, Turkey, and Kazakhstan as well.
0
10
20
30
40
50
60
1999 2000 2001 2002 2003 2004 2005 2006 2007 2008 2009 2010 2011 2012 2013 2014 2015
Year
Applicants Award recipients
4
Figure 1-2: Recognized healthcare service organizations in EFQM (2010-2016)
Source: European Foundation for Quality Management recongnstion database
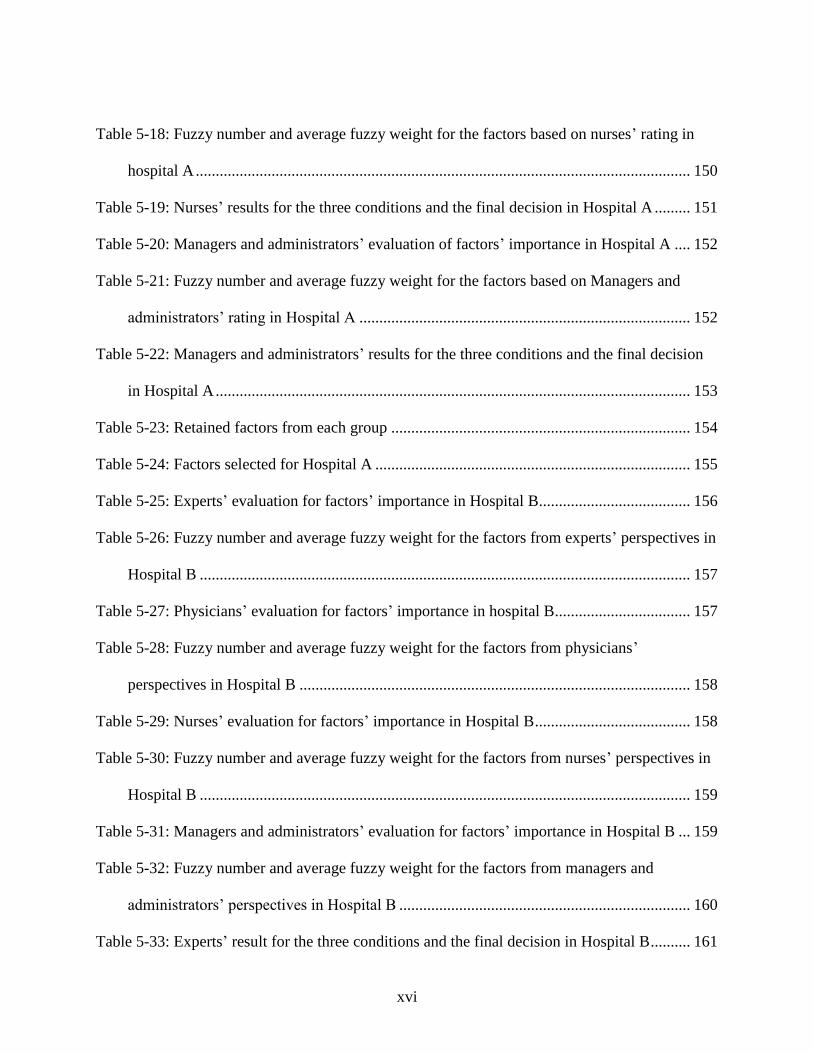
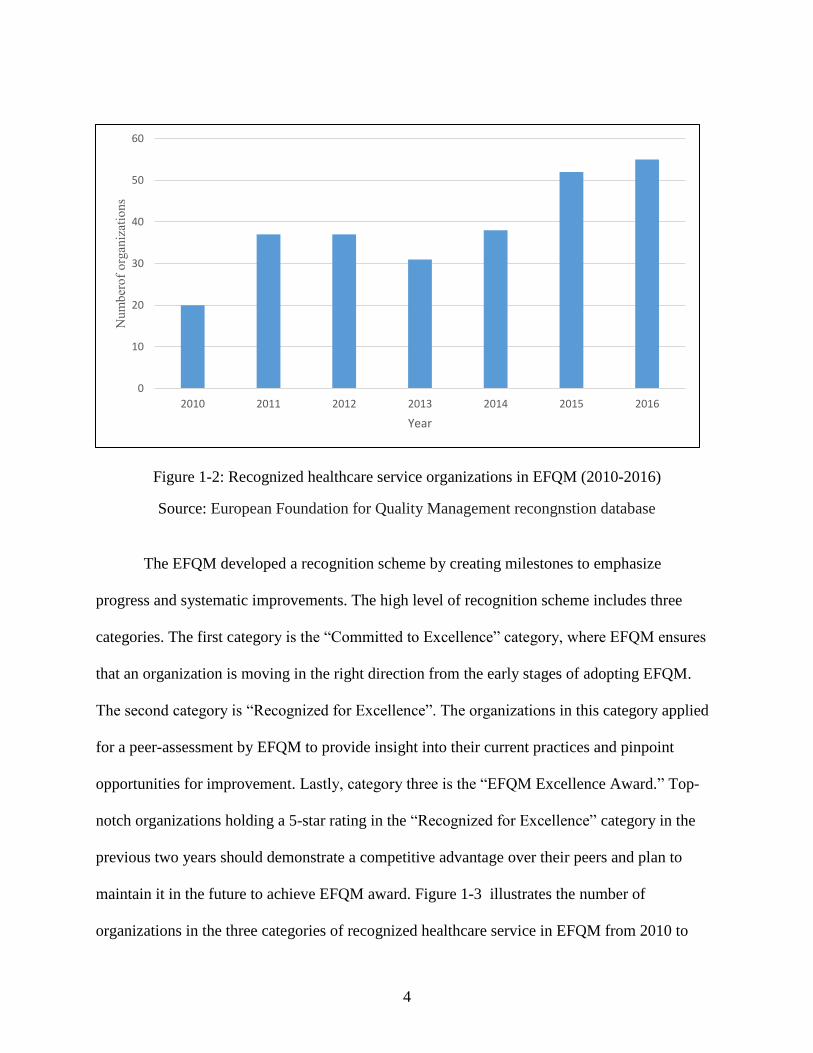
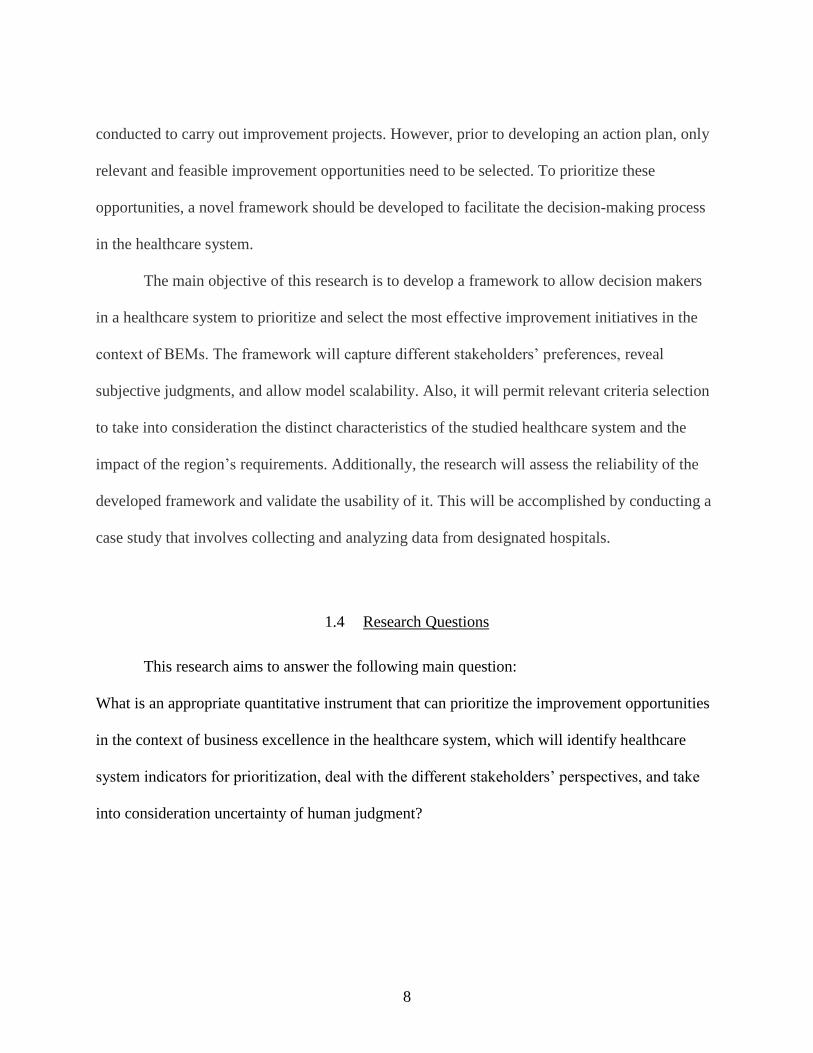
The EFQM developed a recognition scheme by creating milestones to emphasize
progress and systematic improvements. The high level of recognition scheme includes three
categories. The first category is the “Committed to Excellence” category, where EFQM ensures
that an organization is moving in the right direction from the early stages of adopting EFQM.
The second category is “Recognized for Excellence”. The organizations in this category applied
for a peer-assessment by EFQM to provide insight into their current practices and pinpoint
opportunities for improvement. Lastly, category three is the “EFQM Excellence Award.” Top-
notch organizations holding a 5-star rating in the “Recognized for Excellence” category in the
previous two years should demonstrate a competitive advantage over their peers and plan to
maintain it in the future to achieve EFQM award. Figure 1-3 illustrates the number of
organizations in the three categories of recognized healthcare service in EFQM from 2010 to
0
10
20
30
40
50
60
2010 2011 2012 2013 2014 2015 2016
Num
ber
of
org
aniz
atio
ns
Year
5
2016. It is evident from the figure that the number of the recognized healthcare organizations in
each category has increased throughout the years. In 2015 there were healthcare organizations in
the third category for the first time. This proves that healthcare communities have a growing
interest in enhancing business excellence.
Figure 1-3: The recognized healthcare service categories in EFQM (2010-2016)
Source: European Foundation for Quality Management recongnstion database
The literature has interpreted that the growing interest in using a business excellence
model is due to the tangible benefits that healthcare systems can gain from this adoption
(Dehnavieh et al., 2012; Mundongo, Ditend, VanCaillie, & Malonga, 2014). In healthcare, BEMs
have been shown to enhance patient satisfaction (Favaretti et al., 2015; Sanchez et al., 2006),
clinical and non-clinical operations (Sanchez et al., 2006; Stahr, 2001; Vallejo et al., 2007), the
0
5
10
15
20
25
30
35
40
45
2010 2011 2012 2013 2014 2015 2016
Committed to excellence Recognised for excellence EFQM excellence award
6
work environment (Favaretti et al., 2015; Leigh, Douglas, Lee, & Douglas, 2005; Mundongo et
al., 2014), healthcare societal impact (Stahr, 2001; Vallejo et al., 2007), and profits (NIST, 2015;
Stahr, 2001). To experience all of the previous benefits, healthcare organizations should be
selective in implementing improvement opportunities based on BEMs assessment and feedback.
However, it is not feasible to conduct all improvement projects simultaneously due to limitations
in time, capital, and personnel, as well as possible conflicts with other projects or the
organization’s objectives. An effective prioritization and project selection approach is vital to
assist the organization in optimizing the available resources and outcomes.
BEMs have been criticized in the literature for the fact that they don’t provide any
mechanism by which to prioritize improvement initiatives (Dodangeh et al., 2011; Dodangeh et
al., 2012; Kirkham, Garza-Reyes, Kumar, & Antony, 2014; Nazemi, 2010). At the same time
BEM panels believe that this is outside the scope of the assessment and it is the responsibility of
the organization to make such prioritization (Baldridge feedback report, 2014; EFQM feedback
report, 2014). Hence, there is a need for a quantitative tool beyond BEMs to examine different
aspects of judgment and select the most effective improvement decision.
1.2 Research Problem statement
As illustrated in the previous section, BEM utilization is increasing each year worldwide,
especially in the healthcare industry. Nevertheless, selecting the most effective improvement
initiatives from a pool of improvement initiatives derived from a BEM assessment is a challenge
due to the limited resources, time, and budget in the healthcare sector.
7
Even though there have been a few research efforts to develop frameworks to select the
most relevant improvement opportunities in the context of BEMs in various industries, the
literature reveals only one such existing framework developed in a healthcare setting. Moreover,
it has been noted that those frameworks mainly rely on managers and focus group perspectives to
inform decision making, neglecting other stakeholders’ perspectives. The contribution to
improvements in healthcare made by management groups cannot be overlooked, but their
interests and priorities do not necessarily coincide with those of other stakeholders like patients,
physicians, and nurses. In any enterprise, neglecting stakeholders’ preference in decision-making
leads to massive failure as a result of undesirable outcomes (Müller & Thoring, 2012), and the
result of such a situation in the healthcare system is not an exception. Therefore, it is important
to prioritize improvement initiatives in healthcare based on the input of affected parties in
addition to healthcare providers. In addition to a lack of stakeholder involvement, the precision
of the developed frameworks has been a concern, because it does not account for the uncertainty
and the subjective nature of human judgment.
Thus, a need has been identified to design a better quantitative tool to optimize the
selection of improvement initiatives in the context of BEMs in the healthcare system which
considers the different stakeholders’ preference and the subjective nature of human judgment
using customized healthcare criteria.
1.3 Research Objectives
Business excellence models are widely utilized in healthcare system around the world. In
order to maximize the benefits from the evaluation outcomes, proper action plans should be
8
conducted to carry out improvement projects. However, prior to developing an action plan, only
relevant and feasible improvement opportunities need to be selected. To prioritize these
opportunities, a novel framework should be developed to facilitate the decision-making process
in the healthcare system.
The main objective of this research is to develop a framework to allow decision makers
in a healthcare system to prioritize and select the most effective improvement initiatives in the
context of BEMs. The framework will capture different stakeholders’ preferences, reveal
subjective judgments, and allow model scalability. Also, it will permit relevant criteria selection
to take into consideration the distinct characteristics of the studied healthcare system and the
impact of the region’s requirements. Additionally, the research will assess the reliability of the
developed framework and validate the usability of it. This will be accomplished by conducting a
case study that involves collecting and analyzing data from designated hospitals.
1.4 Research Questions
This research aims to answer the following main question:
What is an appropriate quantitative instrument that can prioritize the improvement opportunities
in the context of business excellence in the healthcare system, which will identify healthcare
system indicators for prioritization, deal with the different stakeholders’ perspectives, and take
into consideration uncertainty of human judgment?
9
1.5 Research Contribution
This research will contribute to the existing body of knowledge by developing a
framework for prioritizing and selecting the most effective improvement initiatives in the context
of BEMs in a healthcare system. The purpose of the framework is to involve different
stakeholders in healthcare in decision making while accounting for various aspects of the system
and decision-making process that might assist healthcare system boards to make a robust and
more effective decision. The proposed framework is unique in various ways. First, it proposes
using a hybrid method of Fuzzy DELPHI and Fuzzy Interface System. The Fuzzy DELPHI has
the ability to capture participants’ perspectives, while Fuzzy Interface System prioritizes
alternatives to select the optimal ones. Second, the developed framework allows for not only
prioritizing of improvement initiatives, but also consideration of multiple stakeholders, thereby
overcoming the problem of improvement selection based on management group preferences
only. The framework’s results can be used by the leading stakeholders to ultimately make
optimized decisions. In addition, this research provides insight into the factors related to
prioritizing healthcare improvements, which can serve as valuable input for future studies. The
end result may also be utilized by other researchers to measure the effectiveness of prioritizing
and implementing the improvement initiatives on the overall results of applying BEMs in
healthcare settings.
1.6 Organization of the Dissertation
The rest of this document is organized as follows. Chapter two provides a detailed review
of the relevant literature to clarify the different areas associated with the research objectives.
10
This chapter first presents business excellence concepts and reviews the most popular models
around the globe. Then it explores project selection and prioritization methods and elaborates in-
depth on the existing academic work that has been done to select and prioritize improvement
initiatives in the context of business excellence. Chapter two also investigates current trends,
contemporary challenges, and the process of decision making in the healthcare system. The last
section of chapter two synthesizes the previous information in performing a gap analysis to
reveal a literature gap.
Chapter three describes the research methodology implemented in this research. It
presents a detailed plan, from problem definitions to results and recommendations. This chapter
introduces a preliminary framework to optimize prioritization and selection of improvement
opportunities of a business excellence model in healthcare. chapter Four describes the
constructed framework and the related conceptual and technical aspects. The first part of the
chapter includes the FDM algorithm to identify the key evaluation factors, the methods of
eliciting experts and stakeholder, and the procedure of indicators assessment. The second part of
this chapter expands on the process of building the FIS scheme and describes its architecture in
detail. Chapter five demonstrates the process of implementing the proposed framework and
analyzes the obtained results. Additionally, reliability and initial and invalidation tests are
discussed. Finally, chapter Six concludes the research by highlighting the major findings and
discussing the research contribution. Research limitation and recommendation for future research
are discussed.
11
CHAPTER 2: LITERATURE REVIEW
2.1 Introduction
Business excellence for more than a decade has provided a set of criteria for different
organizations in a variety of industries to conduct assessment and identify areas needing
improvement. In the healthcare system, business excellence is widely accepted as a rubout
framework for evaluation and design (Foster et al., 2007). It plays a role in allowing an
organization to gain a competitive advantage among other competitors. Healthcare systems are
currently experiencing radical changes, an accelerating rate of transformation, and an uncertain
future. Simultaneously, they are facing various challenges such as limited resources, increasing
operational costs, a high demand for services and pressure to meet external requirements from
government, health authority, and insurance companies (Hochenedel & Kleiner, 2016).
Therefore, healthcare systems need to adopt an agile approach to appropriately select the most
effective and efficient improvement initiatives in the context of business excellence.
The objective of this chapter is to examine the existing and the diverse academic studies
that have been done in this area to provide an overview of the topic and offer insight into
creating a novel work. To achieve these objectives this chapter first provides an overview of
Total Quality Management (TQM): its definition, its promising benefits, successful factors in
TQM implementation and the current shift to business excellence. Then it reviews the relevant
literature on business excellence models. Moreover, the review includes projects’ prioritization,
definition, impact and models available to prioritize improvement. This chapter goes on to
discuss in detail the business excellence models available to prioritize improvement
12
opportunities to assess their applicability, reliability, and validity. In addition, the chapter also
describes aspects related to the healthcare setting, quality initiatives in healthcare, and the
utilization of the business model in healthcare. Finally, chapter two provides a background on the
tools used in the developed framework such as the Fuzzy Delphi, fuzzy logic system, and their
applications in the literature.
2.2 Total Quality Management
The seeds of Total Quality Management (TQM) were derived by American quality gurus
like Deming, Juran, and Feigenbaum. Its principles revolted Japan economics to be one of the
best global economies after World War II (Evans & Lindsay, 2005; Imai, 1986). TQM allows
firms to reduce the defect and error rate, reduce waste, improve productivity and sales, improve
market position including profit and market share, improve the supply chain and increase
workforce and customer satisfaction (Brah, Tee, & Rao, 2002; Mashal & Ahmed, 2015; Mellat-
Parast, 2013) Firms in the USA and UK began to take serious notice of TQM during the 1980s
and 1990s (Powell, 1995; Psychogios & Wilkinson, 2007). The pressure from international
competition and the increase in quality awareness among customers facilitated a substantial
popularity of TQM (Willborn & Cheng, 1994).
The literature defines TQM as a comprehensive philosophy to continuously enhance
business performance through a set of practices and the participation of the entire organization
(Claver-Cortes, Pereira-Moliner, Tari, & Molina-Azorin, 2008; Mellat-Parast, 2013; Powell,
1995; Wali, Deshmukh, & Gupta, 2003). Dean and Bowen (1994) argue that most of what had
13
been written about TQM to that point explicitly or implicitly evolved around three main
principles: customer focus, continuous improvement and teamwork.
There is an enormous amount of literature present on TQM’s application in various
regions and industries. For example, Durlabhji and Fusilier (1999) proved that TQM is not
restricted to a manufacturing setting. This study reviewed the results of applying TQM in
academia, particularly among business school administrators and faculty. They report a high
reduction in application processing time and the time needed to hand in grades as a result of
TQM adoption. Al-Marsumi (2007) investigated the impact of TQM application in five hospitals
in Jordan. Despite the variation in each hospitals’ application, the results indicated a direct and
positive correlation between the overall application and the chosen performance indicators.
Siddiqui and Rahman (2007) evaluated the role of TQM in Information Systems (Bernardino et
al.). Through the analysis of questionnaire-based survey data, the scholars were able to quantify
top management’s support for implementing TQM, the relation between TQM and IS, and
realize TQMs benefits to IS. The researchers believed that the results might facilitate introducing
TQM to IS firms to enhance end-product quality. In Hong Kong, Lau, Tang, and Li (2015)
studied the level of TQM application by construction contractors. The study illustrated a high
level of TQM’s principles adoption. However, the result suggested that contractors should focus
on two major principles, organizational learning and supplier management, to sustain long-term
business.
Although many studies have demonstrated the potential of TQM to improve outcomes,
several studies have also reported that TQM may also fail to produce the targeted benefits and
only slightly improve the productivity by 20-30% (Eskildson, 1994; Schonberger, 1992; Tata &
Prasad, 1998). Brown (1993) and Bak (1992) reported a failure rate of 70-80% for TQM
14
program. These unsatisfying results have motivated several scholars to study TQM and its
Critical Success Factors (CSF). Hietschold, Reinhardt, and Gurtner (2014) in their analysis of
145 studies classified CSFs into eleven dimensions associated with successful TQM
implementation, listed below.
• HRM/Recognition/ Teamwork
• Top management commitment and leadership
• Process management
• Customer focus and satisfaction
• Supplier partnership
• Training and learning
• Information/ analysis/ data
• Strategic quality planning
• Culture and communication
• Benchmarking
• Social and environmental responsibility
Despite all of the researches of TQM adoption and evidence of its benefits, there is an
ongoing debate among scholars about the current existence of TQM and the question is raising if
TQM did fade during the quality movement? Bernardino et al. (2016) and Su Mi (2011) believed
that TQM lost it attractiveness in the early 2000s and the current evidence indicates that
organizations began to substitute for it with the business excellence approach, even though both
approaches have common characteristics and the business excellence model is based on TQM’s
framework. In fact, Dotun (2001) argued that the reason behind TQM’s fade in popularity was
15
the wide acceptance of BEMs. However, scholars like (Dale, 2000) claimed that business
excellence is only a change in terminology. Kiauta (2012) argued that the new terminology is an
expansion of quality, moving beyond the understanding of quality as related to product and
services to quality as a way of maximizing business effectiveness to meet or exceed customer
value. He defined business excellence as achieving the highest level of quality.
2.3 Business Excellence
The literature reveals two approaches on the adoption of business excellence models in
an organization. The first one performs as a tool to quantify current performance and achieved
results (Jayamaha, Grigg, & Mann, 2009). The second acts as improvement guideline to achieve
stakeholder targeted results (Flynn & Saladin, 2001). There is a significant amount of
literature that establishes a link between investing in excellence/quality programs and improving
the organization's performance (Dow, Samson, & Ford, 1999; Easton & Jarrell, 1998; Martínez-
Costa & Jimenez-Jimenez, 2008).
Several developed and developing countries have established National Quality Awards,
or business performance excellence awards based on BEMs (Dotun, 2001) to effectively promote
excellence and improve quality dimensions awareness (Anil & Balvir, 2007; Vassilios, Sophia,
& Constantine, 2007). By adopting business excellence models, various awards participants
stated a noticeable improvement in customer satisfaction, employee engagement, supplier
relations, market share, revenue, and processes (Anil & Balvir, 2007). Winners get an enormous
reputation and outperform other non-winning organizations (Boulter, Bendell, & Dahlgaard,
2013).The impact of the awards extended far beyond the award’s recipients or participants only
16
(Flynn & Saladin, 2001). The awards impose knowledge and sharing best practices to promote
self-assessment, benchmarking, and re-shape top management approaches for participants or
non-participants (Mann & Grigg, 2004). Nevertheless, winning the award is not the end solution
for the organization’s issues or an evidence of perfection (Anil & Balvir, 2007; Talwar, 2011).
Accordingly, the literature argues that adopting a business excellence model does not assure
long-term success (Evans, Ford, Masterson, & Hertz, 2012; Fisher, Dauterive, & Barfield, 2001).
In 2011, Talwar (2011) identified hundreds of excellence awards used by countries
around the globe, and the number has grown even more since that time. However, the Deming
Prize in Japan, the Malcolm Baldrige National Quality Award (MBNQA) in United States, and
the European Foundation for Quality Management (EFQM) Excellence Award in Europe are the
most prominent, and they are the reference for various awards (Anil & Balvir, 2007; Boulter et
al., 2013; Talwar, 2011). According to Lee and Lee (2013), 42.1% of quality awards in the world
are based on the EFQM model, 25.2 % are using the MBNQA model and 7.5% are based on the
Deming Prize, while the other 25.2% are using other quality models.
Each award has its own unique system and culture, but all articulate TQM principles
(Bou-Llusar, Escrig-Tena, Roca-Puig, & Beltrán-Martín, 2009; Dotun, 2001; A Ghobadian & H.
S. Woo, 1996; Abby Ghobadian & Hong Seng Woo, 1996). In general, applying for any award
involves extensive assessment process of records examination, top management/employee
interviews, and site visits (Mann & Grigg, 2004). Independent assessors execute the process by
evaluating the organization’s performance against the BEMs categories using scoring guidelines
(Jayamaha et al., 2009).
17
2.3.1 European Foundation for Quality Management (EFQM)
The EFQM was established in 1988 to promote quality standards in European companies
and share knowledge and best practices. In Brussels, Fourteen European multinational
companies were involved at that time: NV Philips’ Gloeilampenfabrieken; Ing. C. Olivetti & C.
SpA; Robert Bosch GmbH; Volkswagen AG; British Telecommunications plc; Bull SA; Ciba-
Geigy AG; Avions Marcel Dessault-Breguet Aviation; Regie Nationale des Usines Renault; AB
Electrolux, Fiat Auto SpA; Koninklijke Luchtvaart Maatschappji N.V.; Nestle SA; and Gebr.
Sulzer AG (Conti, 2007; Vassilios et al., 2007). It is a nonprofit, membership-based organization
and (Lee & Lee, 2013). EFQM developed the EFQM model to introduce self-assessment
principles. The first European Quality Award Program was launched in 1992 (Conti, 2007;
Moeller & Sonntag, 2001).
The lietatures demostrates several advantages of EFQM adoption. For example, Dutt et
al. (2012) examined the usage of the EFQM model in an Indian company and discussed four
different ways to utilize the model. First, the model supports developing realistic and measurable
goals. Second, it enables the organization to understand their business systematically. Third, it
allows the organization to measure its performance. Finally, successful application can lead to
winning the EFQM award. Mann and Grigg (2004) studied EFQM as way of benchmarking and
sharing best practices. In addition, the model creates a common language and enables
communication across the organization (Stahr, 2001). Overall, it seems that adopting the EFQM
facilitates continous improvement and secure long-term growth through identifying area of
improvements (Dutt et al., 2012; Escrig & De Menezes, 2015; Martin-Castilla, 2002).
18
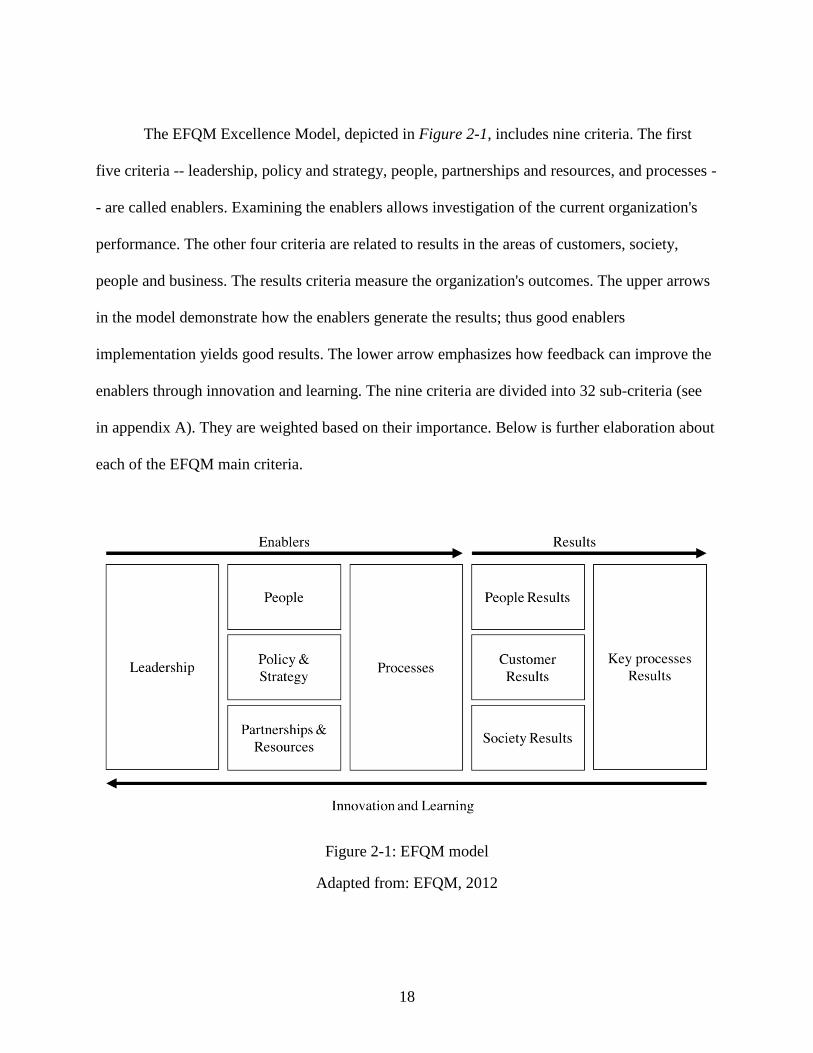
The EFQM Excellence Model, depicted in Figure 2-1, includes nine criteria. The first
five criteria -- leadership, policy and strategy, people, partnerships and resources, and processes -
- are called enablers. Examining the enablers allows investigation of the current organization's
performance. The other four criteria are related to results in the areas of customers, society,
people and business. The results criteria measure the organization's outcomes. The upper arrows
in the model demonstrate how the enablers generate the results; thus good enablers
implementation yields good results. The lower arrow emphasizes how feedback can improve the
enablers through innovation and learning. The nine criteria are divided into 32 sub-criteria (see
in appendix A). They are weighted based on their importance. Below is further elaboration about
each of the EFQM main criteria.
Figure 2-1: EFQM model
Adapted from: EFQM, 2012
19
Leadership
Excellent organizations have a visionary leadership and persist in developing and
achieving the organization’s mission and vision (Dodangeh et al., 2011). They represent the
organization’s values and ethics and show visible support to quality at all levels (Dean Jr &
Bowen, 1994). Excellent leaders are involved in cultural change and invest in workforces and
resources to support development (Ahire, Golhar, & Waller, 1996). They are flexible and enable
sustainable organizational success and achievement of long-term targets through their actions
(EFQM, 2012; Savić, Djordjević, Nikolić, Mihajlović, & Živkovic, 2014)
People
Managing the workforce is the cornerstone of a successful organization (Ahmad &
Schroeder, 2002). Thus, an excellent organization is able to manage and develop the individual
or team-based capabilities of its workforce. It supports fairness and motivates achieving
organizational and personal goals simultaneously (EFQM, 2012; Savić et al., 2014). Excellent
organizations create a positive environment by utilizing suitable workforce selection, a
bidirectional communication system (Zink & Schmidt, 1995), reward and recognition (Dodangeh
et al., 2011), training and acquiring new skills (OsseoAsare & Longbottom, 2002).
Policy and strategy
Excellent organizations enact practical policies and strategies. Excellent organizations
deploy and apply processes, policies, goals, and plans to execute strategy. They develop a
stakeholder-oriented strategy to fulfill their vision and mission (EFQM, 2012). Ravichandran and
Rai (1999) emphasize the importance of integrating quality policies and strategies into an
organization’s policies and strategies.
20
Partnership and resources
Excellent organizations effectively support operations, policies, and strategies through
planning and leveraging internal resources, suppliers, and partnerships since appropriate
partnership management promotes process governance (Safari, Abdollahi, & Ghasemi, 2012).
The criterion includes assessing the organization’s current and future needs, social impact, and
environmental impact (EFQM, 2012).
Process
OsseoAsare and Longbottom (2002) defined key processes as ones with a significant
influence on the organization’s results. Excellent organizations raise customer and stakeholder
satisfaction through efficient planning, management, and improvements in their processes,
services, or products (EFQM, 2012).
Customer results
According to Calvo-Mora, Leal, and Roldán (2005), achieving better customer
satisfaction yields an improvement in the EFQM final result. A service or product's excellence
is mainly determined by customers' perceptions. Thus, an excellent organization works to
achieve or exceed customer expectations (EFQM, 2012).
People results
Logically, satisfied workers perform better in their jobs (Calvo-Mora et al., 2005).
Therefore, with respect to their workforces, excellent organizations periodically measure results
in areas such as occupational satisfaction, responsibility ratio, absence rate, and occupational
accidents (Safari et al., 2012; Savić et al., 2014) and work to improve or sustain the measured
values (EFQM, 2012).
21
Society results
The EFQM measures organizational contributions to the local and national communities
(Savić et al., 2014), because excellent organizations actively participate in social events. They
accomplish and maintain excellent results in this category (EFQM, 2012)
Business Results
The main purpose of establishing organizations is to generate outcomes, financial and
non-financial. Excellent organizations comprehensively utilize indicators to develop a solid
understanding of their businesses to predict and improve their key outcomes. Excellent
organizations also achieve or exceed their stakeholders' expectations sustainably (EFQM, 2012)
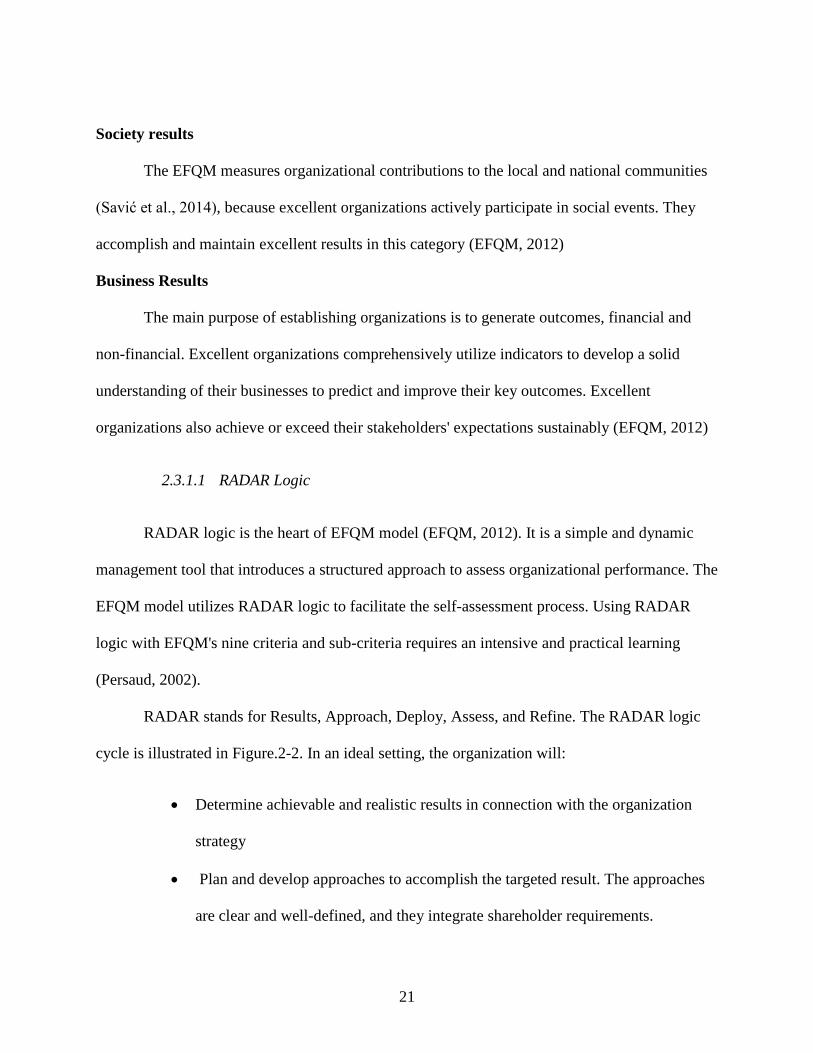
2.3.1.1 RADAR Logic
RADAR logic is the heart of EFQM model (EFQM, 2012). It is a simple and dynamic
management tool that introduces a structured approach to assess organizational performance. The
EFQM model utilizes RADAR logic to facilitate the self-assessment process. Using RADAR
logic with EFQM's nine criteria and sub-criteria requires an intensive and practical learning
(Persaud, 2002).
RADAR stands for Results, Approach, Deploy, Assess, and Refine. The RADAR logic
cycle is illustrated in Figure.2-2. In an ideal setting, the organization will:
• Determine achievable and realistic results in connection with the organization
strategy
• Plan and develop approaches to accomplish the targeted result. The approaches
are clear and well-defined, and they integrate shareholder requirements.
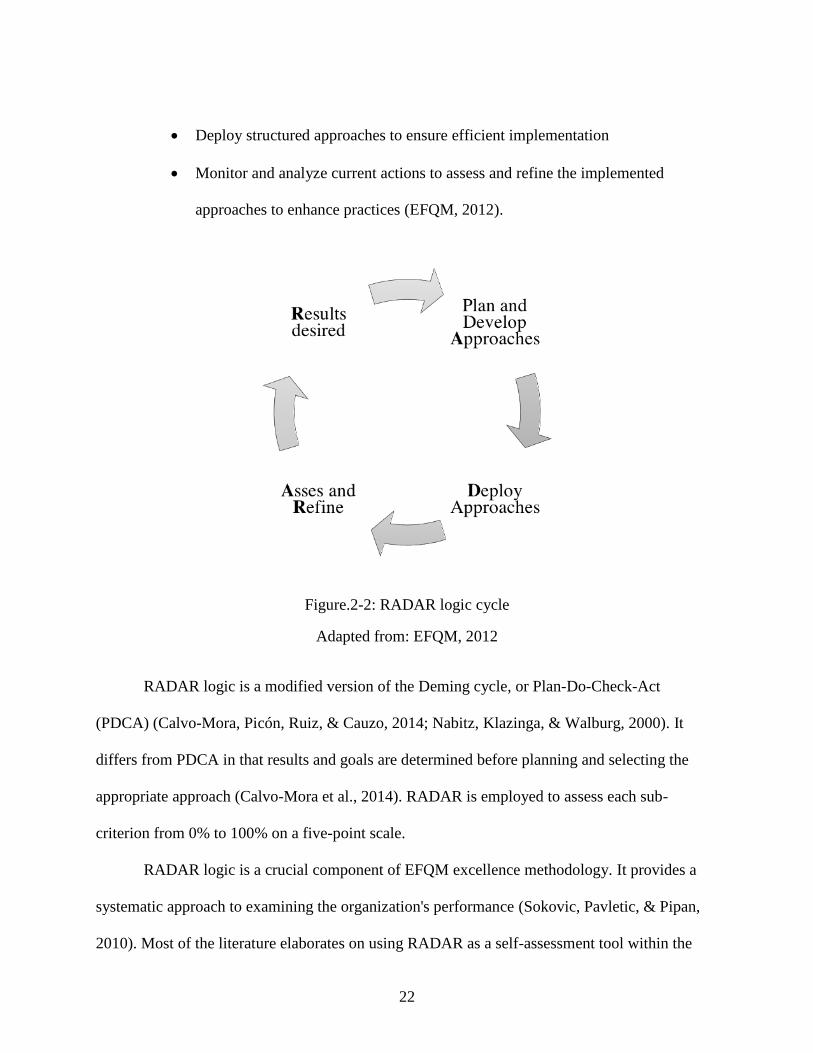
22
• Deploy structured approaches to ensure efficient implementation
• Monitor and analyze current actions to assess and refine the implemented
approaches to enhance practices (EFQM, 2012).
Figure.2-2: RADAR logic cycle
Adapted from: EFQM, 2012
RADAR logic is a modified version of the Deming cycle, or Plan-Do-Check-Act
(PDCA) (Calvo-Mora, Picón, Ruiz, & Cauzo, 2014; Nabitz, Klazinga, & Walburg, 2000). It
differs from PDCA in that results and goals are determined before planning and selecting the
appropriate approach (Calvo-Mora et al., 2014). RADAR is employed to assess each sub-
criterion from 0% to 100% on a five-point scale.
RADAR logic is a crucial component of EFQM excellence methodology. It provides a
systematic approach to examining the organization's performance (Sokovic, Pavletic, & Pipan,
2010). Most of the literature elaborates on using RADAR as a self-assessment tool within the
23
EFQM model. Favaretti et al. (2015) evaluated the merit of adopting the EFQM as a self-
assessment tool in a large healthcare system in Italy. This study showed there was a significant
gain in the organization's excellence between 2001 and 2008, where the organization scored 290
out of 1000 in 2001 and improved to 610 in 2008. A similar study of a German healthcare
organization described RADAR logic being used as an approach to quantify the organization's
outcomes and level of success. The study showed that RADAR logic helped them to gain a
competitive advantage (Moeller & Sonntag, 2001).
RADAR as a self-assessment tool is not restricted to use on the macro level, such as in a
healthcare system or hospital. It can also be utilized at a micro level, such as in a department or
program. Ana I Marques et al. (2011) adopted EFQM self-assessment for use in an elderly
physical activity program. The program assessment helped the organization to understand the
business, improve services, and ultimately reflect on total hospital performance.
RADAR logic supports the EFQM award scoring technique and various assessment
schemes (Sokovic et al., 2010). It is a common measuring scheme across various industries and
numerous countries worldwide; this allows for easy comparison of current practices with
excellent organization practices and benchmarking (Stahr, 2001).
2.3.2 MBNQA model
The MBNQA was launched in 1987 by the US government to promote quality awareness,
improve organizational performance, recognize organizations with top practices, and share best
practices strategies and benefits (Anil & Balvir, 2007; Lee, Zuckweiler, & Trimi, 2006; Talwar,
2011). NIST manages the MBNQA with the assistance of the American Society for Quality
(Velasquez & Hester) (Islam, 2007; Velasquez & Hester). According to MBNQA, quality is a
24
customer-driven approach; thus it emphasizes establishing customer satisfaction as a way to
achieve excellence (Talwar, 2011).
Since the MBNQA was established, its criteria have been revised at various times to
match contemporary concepts of quality and adopt to the shift in business to a global level (Lee
& Lee, 2013). Due to manufacturing competition between the U.S. and Japan in the 80s, the
early criteria focused on quality engineering concepts like quality assurance standards, rework,
and reduction of scrap. However, Lee et al. (2006) stated that those concepts had disappeared by
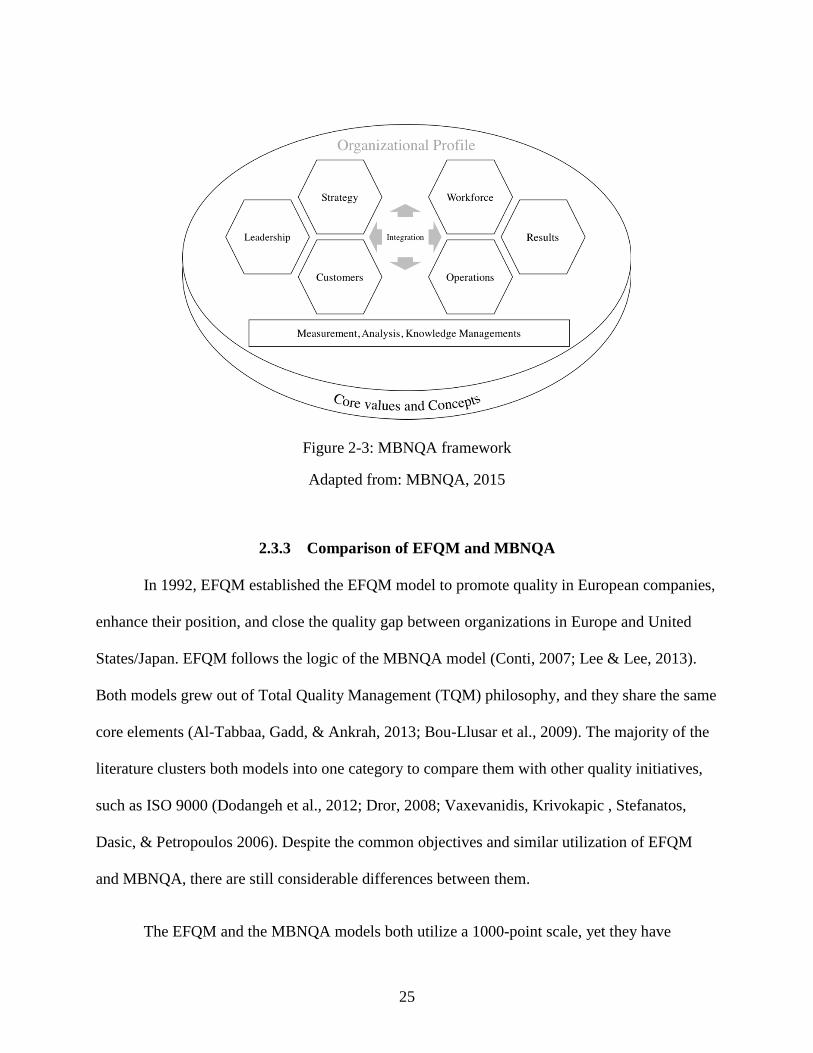
1997, with the criteria shifting to reflect more strategic approaches. Recent MBNQA consists of
seven categories (Figure 2-3): leadership, strategic planning, customer focus, measurement,
analysis, knowledge management, workforce focus, operations focus, and results. The seven
categories are weighted differently based on their relative importance and divided into 17 criteria
items and areas to address (Sun, 2011) (seen in Appendix A). The organizational profile at the
top of the figure is not a part of the evaluation process, but it sets the organizational context. In
general, the framework emphasizes integration of the different categories. The horizontal arrow
in the center illustrates the linkage between (leadership, strategic planning, customer focus) and
(workforce focus, operations focus, results) while the vertical arrow represents the information
sharing between the key processes and the system’s foundation (MBNQA, 2015).
25
Figure 2-3: MBNQA framework
Adapted from: MBNQA, 2015
2.3.3 Comparison of EFQM and MBNQA
In 1992, EFQM established the EFQM model to promote quality in European companies,
enhance their position, and close the quality gap between organizations in Europe and United
States/Japan. EFQM follows the logic of the MBNQA model (Conti, 2007; Lee & Lee, 2013).
Both models grew out of Total Quality Management (TQM) philosophy, and they share the same
core elements (Al-Tabbaa, Gadd, & Ankrah, 2013; Bou-Llusar et al., 2009). The majority of the
literature clusters both models into one category to compare them with other quality initiatives,
such as ISO 9000 (Dodangeh et al., 2012; Dror, 2008; Vaxevanidis, Krivokapic , Stefanatos,
Dasic, & Petropoulos 2006). Despite the common objectives and similar utilization of EFQM
and MBNQA, there are still considerable differences between them.
The EFQM and the MBNQA models both utilize a 1000-point scale, yet they have
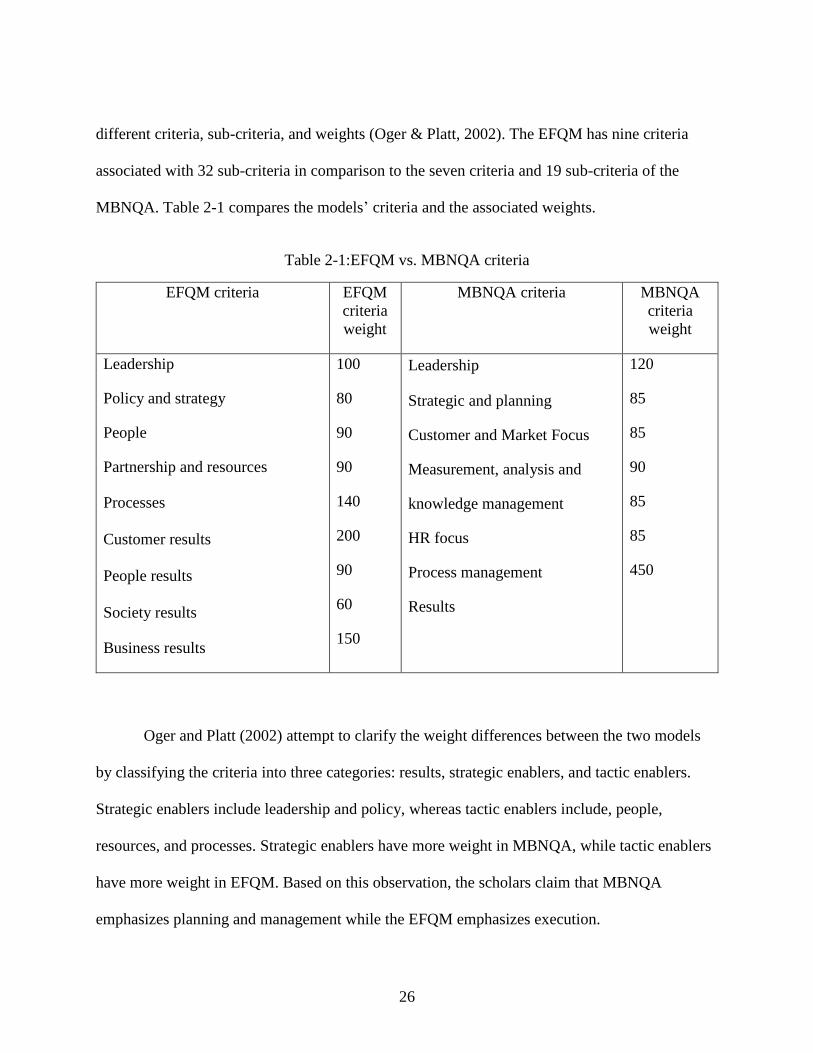
26
different criteria, sub-criteria, and weights (Oger & Platt, 2002). The EFQM has nine criteria
associated with 32 sub-criteria in comparison to the seven criteria and 19 sub-criteria of the
MBNQA. Table 2-1 compares the models’ criteria and the associated weights.
Table 2-1:EFQM vs. MBNQA criteria
EFQM criteria EFQM
criteria
weight
MBNQA criteria MBNQA
criteria
weight
Leadership
Policy and strategy
People
Partnership and resources
Processes
Customer results
People results
Society results
Business results
100
80
90
90
140
200
90
60
150
Leadership
Strategic and planning
Customer and Market Focus
Measurement, analysis and
knowledge management
HR focus
Process management
Results
120
85
85
90
85
85
450
Oger and Platt (2002) attempt to clarify the weight differences between the two models
by classifying the criteria into three categories: results, strategic enablers, and tactic enablers.
Strategic enablers include leadership and policy, whereas tactic enablers include, people,
resources, and processes. Strategic enablers have more weight in MBNQA, while tactic enablers
have more weight in EFQM. Based on this observation, the scholars claim that MBNQA
emphasizes planning and management while the EFQM emphasizes execution.
27
The literature credits the heavier weight on customer results, people results and society
results in the EFQM model to the extensive workplace, social, and environmental regulation in
Europe. The MBNQA, on the other hand, is credited with emphasizing business results as a
result of American companies’ interest in financial results (Lee et al., 2006; Oger & Platt, 2002).
Another major difference between the two models is the assessment tool or scoring
system used. The EFQM utilizes RADAR logic (Results, Approach, Deployment, Assessment,
and Refine) to evaluate each sub-criteria (Moeller & Sonntag, 2001). The last four steps of
RADAR are associated with measuring the enablers (Savić et al., 2014). The MBNQA uses two
evaluation dimensions in the scoring system: first, the ADLI (Approach, Deployment, Learning,
and Integration) to evaluate processes from category one to six, and the LeTCI (Levels, Trends,
Comparisons, and Integration) to assess category seven only (MBNQA, 2015)
2.4 Project prioritization and selection
Organizations strive to identify and carry out improvement initiatives to gain or sustain a
competitive advantage (Kirkham et al., 2014). Seeking to reach a higher operational excellence
level, they routinely identify numerous areas for potential improvement. (Pyzdek, 2014).
Selecting one project or portfolio of projects to focus on out of a pool of alternatives is a difficult
task (Jung & Sang-Gyu, 2007), because there are various limitations and uncertainties associated
with each project in terms of time, capital, and personnel, as well as possible conflicts with other
projects or the organization’s objectives. Thus, it is not feasible to conduct all improvement
initiatives simultaneously (Marriott, Garza-Reyes, Soriano-Meier, & Antony, 2013).
28
According to Pyzdek (2014), prioritization is a method of arranging and dealing with
projects according to their importance. Jung and Sang-Gyu (2007); (F. K. Wang, C. H. Hsu, &
G. H. Tzeng, 2014) and F. K. Wang et al. (2014) described project selection as a process of
selecting the optimum alternative using the most vital criteria. Different scholars emphasize that
appropriate project prioritization and selection is likely to increase the success rate of operations
improvement projects (Abbasianjahromi & Rajaie, 2013; Water & Vries, 2006). In fact, some
scholars even argue that it is a key factor for improvement program success (Hsieh, Huang, &
Wang, 2012; Marriott et al., 2013).
Effective prioritization and selection assist an organization to find the balance between
costs, risks, and potential benefits while constructing an investment portfolio (Abbasianjahromi
& Rajaie, 2013; Phillips & Bana e Costa, 2007). They also ensure correct allocation and
optimization of available resources (LePrevost & Mazur, 2005; Marriott et al., 2013; Phillips &
Bana e Costa, 2007). Correspondingly, it reduces the failure risk (Vinodh & Swarnakar, 2015) by
avoiding having to deal with multiple conflicting objectives, insufficient details, and
inappropriate resource allocation (Phillips & Bana e Costa, 2007). Davis (2003) claimed that
prioritization outcomes not only affect the level of improvement activities but could extend to
affect an organization’s competitiveness in the market.
Although there are numerous methods to select and prioritize improvement initiatives,
such as Pareto analysis (Larson, 2003), project selection matrix (Pande, Cavanagh, & Neuman,
2000), Quality Function Deployment (QFD) (LePrevost & Mazur, 2005), AHP (Kırış, 2014),
cost-benefit analysis, cause-effect matrix, Pareto priority index (Marriott et al., 2013), and
Theory Of Constraints (Mariscal, Herrero, & Toca Otero; Pyzdek, 2014), some decision makers
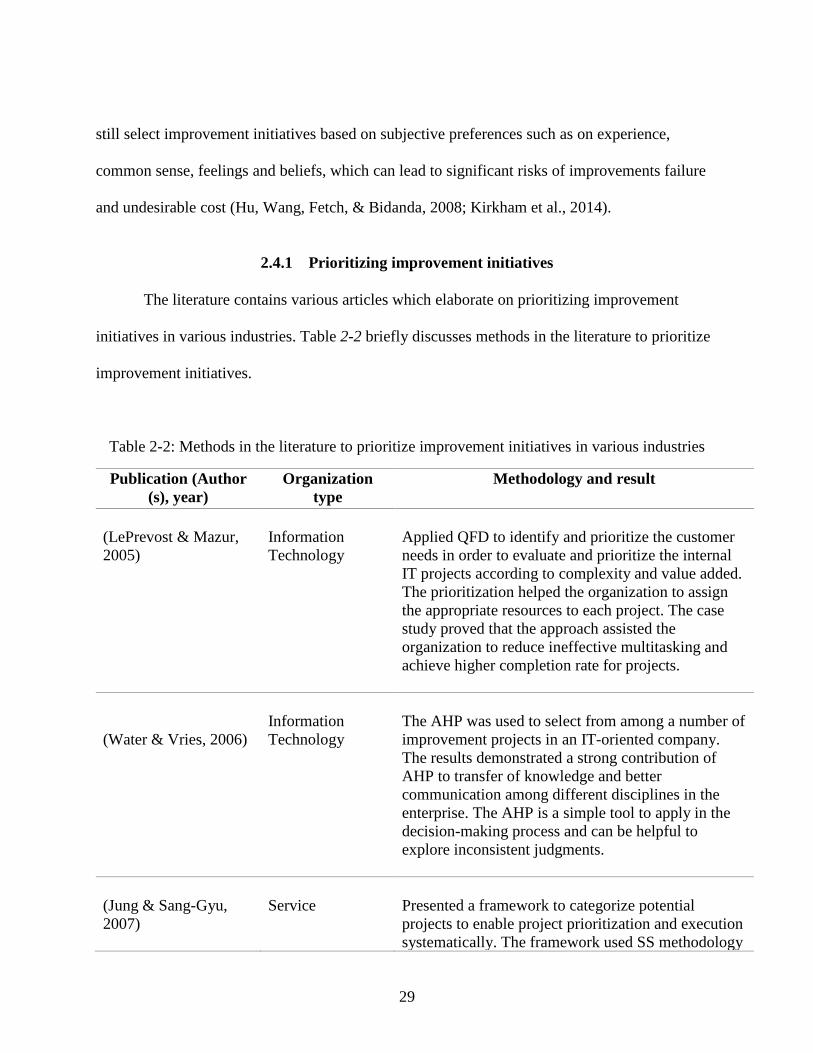
29
still select improvement initiatives based on subjective preferences such as on experience,
common sense, feelings and beliefs, which can lead to significant risks of improvements failure
and undesirable cost (Hu, Wang, Fetch, & Bidanda, 2008; Kirkham et al., 2014).
2.4.1 Prioritizing improvement initiatives
The literature contains various articles which elaborate on prioritizing improvement
initiatives in various industries. Table 2-2 briefly discusses methods in the literature to prioritize
improvement initiatives.
Table 2-2: Methods in the literature to prioritize improvement initiatives in various industries
Publication (Author
(s), year)
Organization
type
Methodology and result
(LePrevost & Mazur,
2005)
Information
Technology
Applied QFD to identify and prioritize the customer
needs in order to evaluate and prioritize the internal
IT projects according to complexity and value added.
The prioritization helped the organization to assign
the appropriate resources to each project. The case
study proved that the approach assisted the
organization to reduce ineffective multitasking and
achieve higher completion rate for projects.
(Water & Vries, 2006)
Information
Technology
The AHP was used to select from among a number of
improvement projects in an IT-oriented company.
The results demonstrated a strong contribution of
AHP to transfer of knowledge and better
communication among different disciplines in the
enterprise. The AHP is a simple tool to apply in the
decision-making process and can be helpful to
explore inconsistent judgments.
(Jung & Sang-Gyu,
2007)
Service
Presented a framework to categorize potential
projects to enable project prioritization and execution
systematically. The framework used SS methodology
30
Publication (Author
(s), year)
Organization
type
Methodology and result
to map the projects in term of process capability and
process controllability measure. The framework was
validated through a case study of the customer
satisfaction improvement program.
(Hsieh et al., 2012)
Service
The study utilized AHP and Failure Mode and Effect
Analysis (FMEA) to rank the project to select SS
projects. It includes: project identification, project
value assessments, project complexity assessments,
and prioritization. The framework evaluated the
projects based on its value and complexity. The value
criteria consisted of costs, financial returns, and
impact on workforce behavior. While the complexity
criteria consist of: data availability, scope, and
potential risk.
(Marriott et al., 2013)
Manufacturing
The research proposed integrating two commonly
used approaches in the industry, Process Activity
Mapping (PAM) and FMEA, and developed a
methodology to prioritize improvement projects,
activities or initiatives in low volume-high integrity
product manufacturing based on two business
objectives: cost reduction and high product quality.
The results of the case study validated the
effectiveness of the methodology in dealing with the
complexity of selecting and prioritizing feasible
improvement projects.
(Eghtesady, Brar, &
Hall, 2013)
Healthcare
Developed objective prioritization approach to
prioritize improvement initiatives in pediatric
cardiology and cardiac surgery. The approach
accounts for frequency and relative contribution of
quality measurement of morbidity in a low mortality
setting. Data collection and analysis was conducted
in 35 hospitals. A prioritization scheme was
developed based on procedure’s ranking using four
metrics: Mortality, any adverse event, readmission
and length of the stay.
31
Publication (Author
(s), year)
Organization
type
Methodology and result
(Abbasianjahromi &
Rajaie, 2013)
Construction
The research presented a hybrid methodology to
select a project in construction environments. It
applied fuzzy case-based reasoning to pre-screen the
project before adding it to the existing portfolio then
select the most suitable project using zero-one linear
goal programming.
(F. K. Wang et al.,
2014)
Film printing
Developed a hybrid framework by integrating
DEMATEL, ANP and VIKOR to select Six Sigma
(SS) improvement projects. Applicability of the
framework was proved using a case study in a
Taiwan film printing industry. The framework
enabled the scholars to analyze the current gap
between performance and targeted level based on
influential network relation map and improving the
gap in each dimension
(Vinodh & Swarnakar,
2015)
Manufacturing
Employed a hybrid fuzzy MCDM approach to select
the optimal Lean Six Sigma (LSS) project in an
Indian automotive manufacturing components
organization. The methodology combined fuzzy
DEMATEL, ANP, and TOPSIS to prioritize LSS
projects and choose the optimal project. A case study
validated the practicality of the methodology to
reduce the risk of failure.
(Holmes, Jenicke, &
Hempel, 2015)
Education
The study presented a framework to select among SS
opportunities in an academic setting. It suggested
using the weighted scorecard approach to choose the
most efficient project in utilizing time and campus’s
resources.
2.4.2 Available prioritization models for business excellence
This section reviews the literature regarding improvement opportunities prioritization in
32
business excellence models. It provides an analysis and insight into their applicability,
reliability, and validity in a healthcare setting.
2.4.2.1 Prioritization Model 1
Dodangeh and Yusuff (2011) developed a model to prioritize and choose EFQM areas for
improvement using Multi Attribute Decision Making (MADM). MADM is a Multi-Criteria
Decision Making (MCDM), or Multiple Criteria Decision Analysis (MCDA), approach. MCDM
mainly works to facilitate the solving of conflict decision problems with multiple constraints
(Winston, 1994). It is a holistic framework that starts with problem structuring and knowledge
exchange, identifying of criteria preferences and importance, and then evaluation of the
alternatives. MCDM’s results enable decision makers to select the optimal alternative (Santos,
Belton, & Howick, 2002; Tavana & Sodenkamp, 2010). The literature demonstrates an extensive
use of MCDM approaches in practice (Atici, Simsek, Ulucan, & Tosun, 2015; Broekhuizen,
Groothuis-Oudshoorn, Til, Hummel, & Ijzerman, 2015; Canas, Ferreira, & Meidutė-
Kavaliauskienė, 2015). MCDM methods assist decision-makers in selecting, ranking, sorting, or
describing alternatives (Atici & Ulucan, 2011); however, the challenge is to select appropriate
methods from the wide range available (Marsh, Lanitis, Neasham, Orfanos, & Caro, 2014).
MCDM problems can be aligned into two categories:
• Multiple Objective Criteria Making (MOCM)
• Multiple Attribute Decision Making (MADM)
The MOCM approach aims to select the best alternatives that satisfy the objective function under
certain constraints in continuous space (Farahani, SteadieSeifi, & Asgari, 2010). The literature
frequently mentions goal programming and multi-objective optimization as the most popular
33
tools to solve MOCM problems (Herath & Prato, 2006). MADM, on the other hand, focuses on
selecting the best alternatives in discreet space. It is frequently used in prioritization and
criteria’s interaction (Dodangeh & Yusuff, 2011; Farahani et al., 2010). Some of the most
popular MADM techniques are Analytical Hierarchical Process (AHP), Analytic Network
Process (ANP), Simple Additive Weighting (Akyürek, Sawalha, & Ide), and Multi Attribute
Utility Theory (MAUT) and Technique for Order Preference by Similarity to Ideal Solution
(TOPSIS) (Farahani et al., 2010).
Dodangeh and Yusuff (2011) developed a method to evaluate and prioritize areas for
improvement in an EFQM model. Figure 4-2 illustrates the algorithm they used.
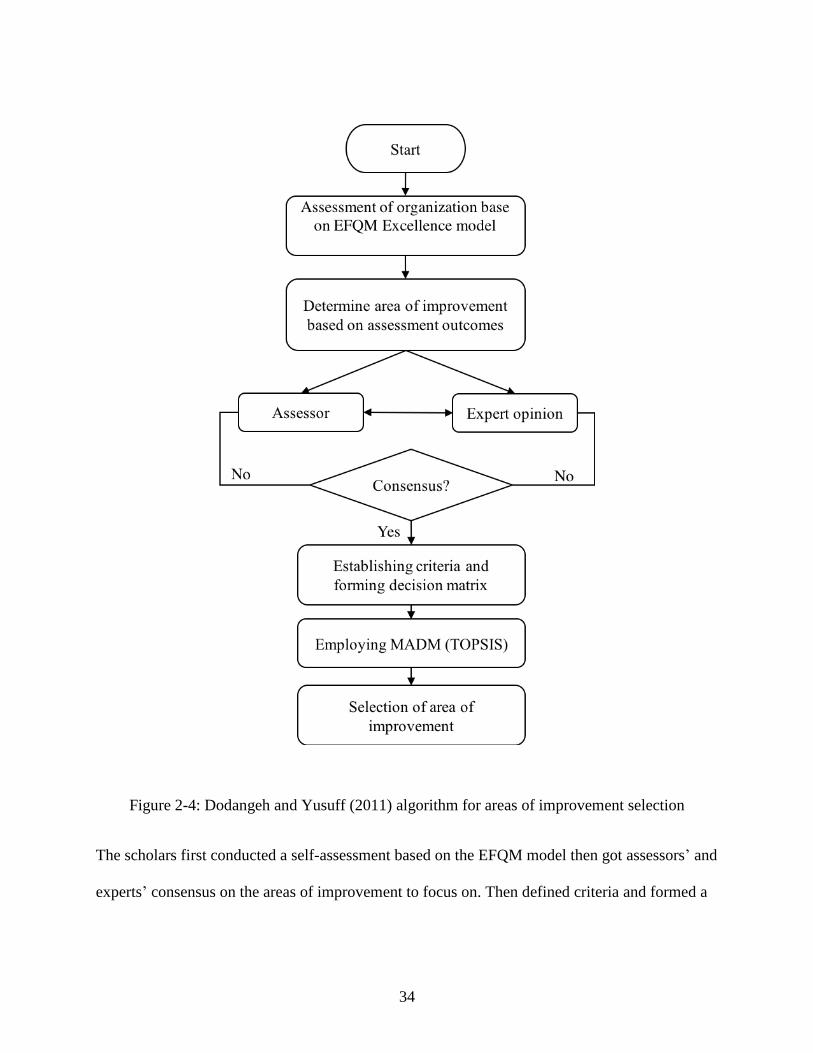
34
Figure 2-4: Dodangeh and Yusuff (2011) algorithm for areas of improvement selection
The scholars first conducted a self-assessment based on the EFQM model then got assessors’ and
experts’ consensus on the areas of improvement to focus on. Then defined criteria and formed a
35
decision matrix. The researchers established the following four criteria to evaluate the
alternatives:
1. Importance: this criterion involves the degree of importance the improvement has to the
organization.
2. Cost: the criterion lets the experts evaluate if the area of improvement is within the
organization’s budget and financial resources.
3. Time: this criterion considers the required time to perform the area of improvement since
a shorter time can allow the organization to achieve its objectives faster.
4. Gap: this criterion represents the difference between the current state and the desired
state. In the research, they calculated it by finding the difference between the assessment
score and the perfect score in the EFQM model
The scholars conducted a case study in mega car manufacturing. The board of expert
included the directors of marketing and sales, engineering, logistics, production, and
management while the panel of assessors consisted of three assessors. The experts and the
assessors defined the area of improvements. After evaluating each area of improvement based on
the four criteria above a decision matrix was constructed; then the TOPSIS technique was
applied to rank the areas of improvement.
TOPSIS is a quantitative approach to identify the closest alternative to an ideal solution
and the farthest to an anti-ideal solution (Deng, Yeh, & Willis, 2000). Hwang and Yoon
introduced this technique in 1995 (García-Cascales & Lamata, 2012). It can be used to find the
optimal solution or to rank alternatives (Deng et al., 2000; Mehralian, Nazari, Rasekh, &
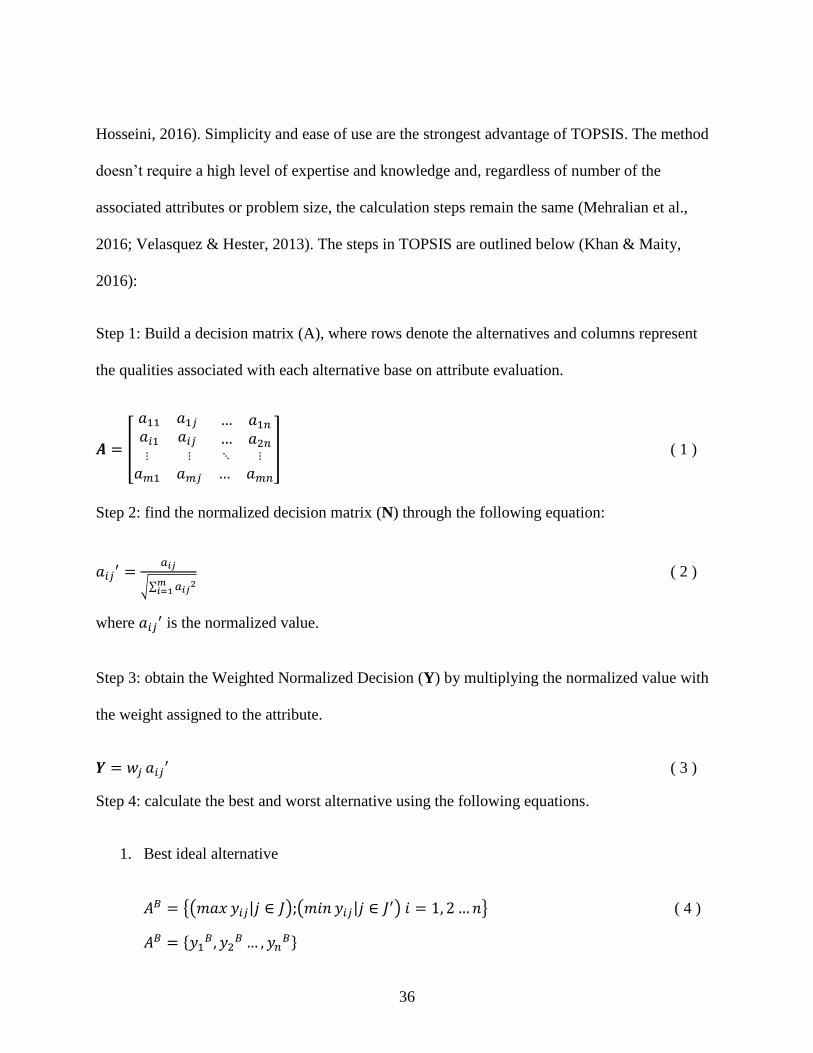
36
Hosseini, 2016). Simplicity and ease of use are the strongest advantage of TOPSIS. The method
doesn’t require a high level of expertise and knowledge and, regardless of number of the
associated attributes or problem size, the calculation steps remain the same (Mehralian et al.,
2016; Velasquez & Hester, 2013). The steps in TOPSIS are outlined below (Khan & Maity,
2016):
Step 1: Build a decision matrix (A), where rows denote the alternatives and columns represent
the qualities associated with each alternative base on attribute evaluation.
𝑨 = [
𝑎11 𝑎1𝑗𝑎𝑖1 𝑎𝑖𝑗⋮ ⋮
𝑎𝑚1 𝑎𝑚𝑗
… 𝑎1𝑛… 𝑎2𝑛 ⋱ ⋮
… 𝑎𝑚𝑛
] ( 1 )
Step 2: find the normalized decision matrix (N) through the following equation:
𝑎𝑖𝑗′ =
𝑎𝑖𝑗
√∑ 𝑎𝑖𝑗2𝑚
𝑖=1
( 2 )
where 𝑎𝑖𝑗′ is the normalized value.
Step 3: obtain the Weighted Normalized Decision (Y) by multiplying the normalized value with
the weight assigned to the attribute.
𝒀 = 𝑤𝑗 𝑎𝑖𝑗′ ( 3 )
Step 4: calculate the best and worst alternative using the following equations.
1. Best ideal alternative
𝐴𝐵 = {(𝑚𝑎𝑥 𝑦𝑖𝑗|𝑗 ∈ 𝐽);(𝑚𝑖𝑛 𝑦𝑖𝑗|𝑗 ∈ 𝐽′) 𝑖 = 1, 2…𝑛} ( 4 )
𝐴𝐵 = {𝑦1𝐵, 𝑦2
𝐵… , 𝑦𝑛𝐵}
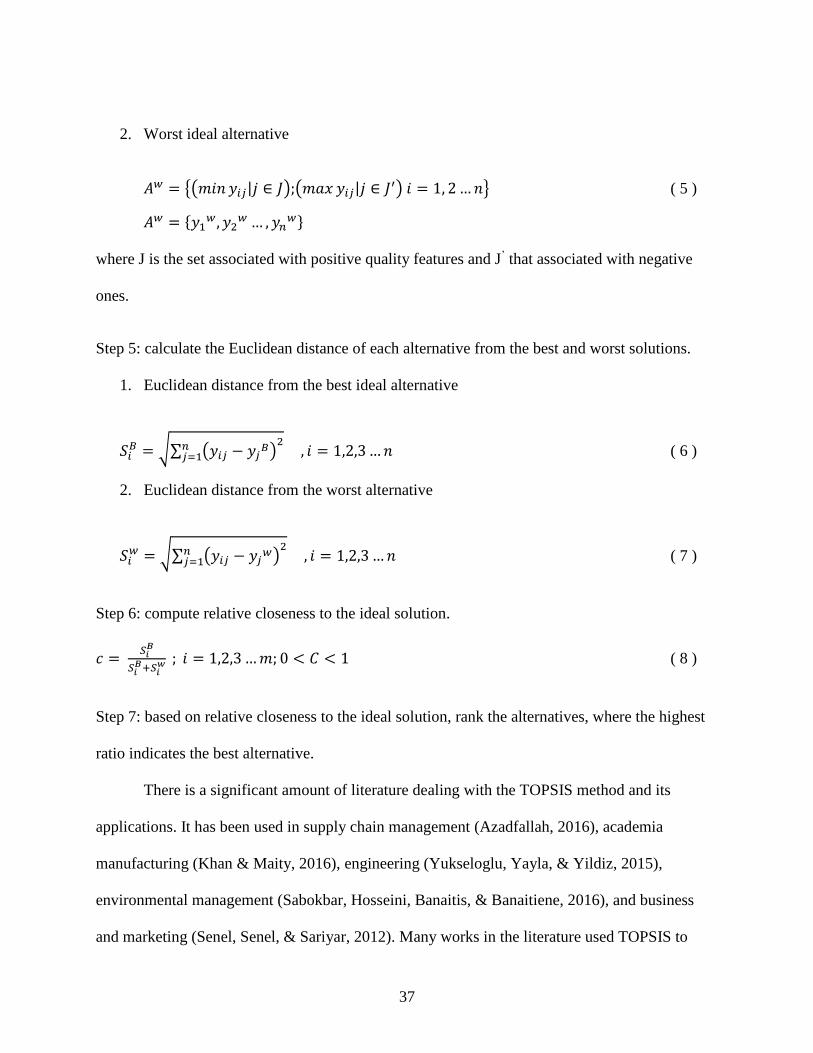
37
2. Worst ideal alternative
𝐴𝑤 = {(𝑚𝑖𝑛 𝑦𝑖𝑗|𝑗 ∈ 𝐽);(𝑚𝑎𝑥 𝑦𝑖𝑗|𝑗 ∈ 𝐽′) 𝑖 = 1, 2…𝑛} ( 5 )
𝐴𝑤 = {𝑦1𝑤, 𝑦2
𝑤 … , 𝑦𝑛𝑤}
where J is the set associated with positive quality features and J’ that associated with negative
ones.
Step 5: calculate the Euclidean distance of each alternative from the best and worst solutions.
1. Euclidean distance from the best ideal alternative
𝑆𝑖𝐵 = √∑ (𝑦𝑖𝑗 − 𝑦𝑗𝐵)
2𝑛𝑗=1 , 𝑖 = 1,2,3…𝑛 ( 6 )
2. Euclidean distance from the worst alternative
𝑆𝑖𝑤 = √∑ (𝑦𝑖𝑗 − 𝑦𝑗𝑤)
2𝑛𝑗=1 , 𝑖 = 1,2,3…𝑛 ( 7 )
Step 6: compute relative closeness to the ideal solution.
𝑐 = 𝑆𝑖𝐵
𝑆𝑖𝐵+𝑆𝑖
𝑤 ; 𝑖 = 1,2,3…𝑚; 0 < 𝐶 < 1 ( 8 )
Step 7: based on relative closeness to the ideal solution, rank the alternatives, where the highest
ratio indicates the best alternative.
There is a significant amount of literature dealing with the TOPSIS method and its
applications. It has been used in supply chain management (Azadfallah, 2016), academia
manufacturing (Khan & Maity, 2016), engineering (Yukseloglu, Yayla, & Yildiz, 2015),
environmental management (Sabokbar, Hosseini, Banaitis, & Banaitiene, 2016), and business
and marketing (Senel, Senel, & Sariyar, 2012). Many works in the literature used TOPSIS to
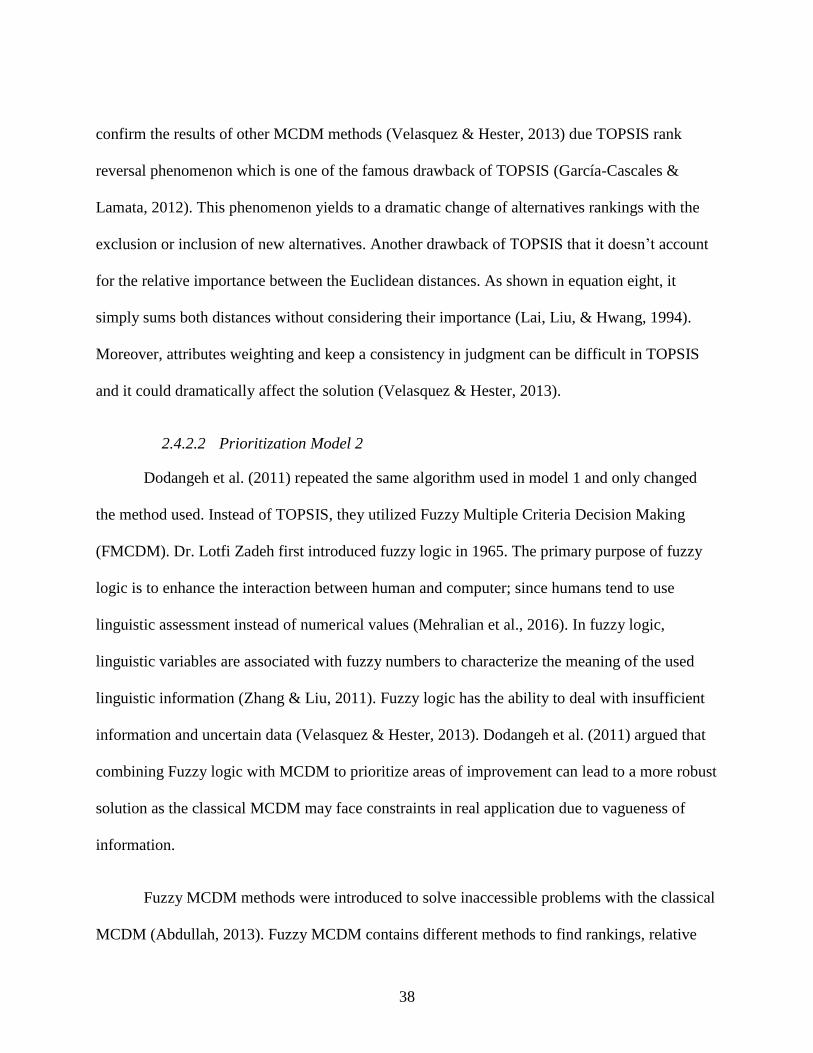
38
confirm the results of other MCDM methods (Velasquez & Hester, 2013) due TOPSIS rank
reversal phenomenon which is one of the famous drawback of TOPSIS (García-Cascales &
Lamata, 2012). This phenomenon yields to a dramatic change of alternatives rankings with the
exclusion or inclusion of new alternatives. Another drawback of TOPSIS that it doesn’t account
for the relative importance between the Euclidean distances. As shown in equation eight, it
simply sums both distances without considering their importance (Lai, Liu, & Hwang, 1994).
Moreover, attributes weighting and keep a consistency in judgment can be difficult in TOPSIS
and it could dramatically affect the solution (Velasquez & Hester, 2013).
2.4.2.2 Prioritization Model 2
Dodangeh et al. (2011) repeated the same algorithm used in model 1 and only changed
the method used. Instead of TOPSIS, they utilized Fuzzy Multiple Criteria Decision Making
(FMCDM). Dr. Lotfi Zadeh first introduced fuzzy logic in 1965. The primary purpose of fuzzy
logic is to enhance the interaction between human and computer; since humans tend to use
linguistic assessment instead of numerical values (Mehralian et al., 2016). In fuzzy logic,
linguistic variables are associated with fuzzy numbers to characterize the meaning of the used
linguistic information (Zhang & Liu, 2011). Fuzzy logic has the ability to deal with insufficient
information and uncertain data (Velasquez & Hester, 2013). Dodangeh et al. (2011) argued that
combining Fuzzy logic with MCDM to prioritize areas of improvement can lead to a more robust
solution as the classical MCDM may face constraints in real application due to vagueness of
information.
Fuzzy MCDM methods were introduced to solve inaccessible problems with the classical
MCDM (Abdullah, 2013). Fuzzy MCDM contains different methods to find rankings, relative
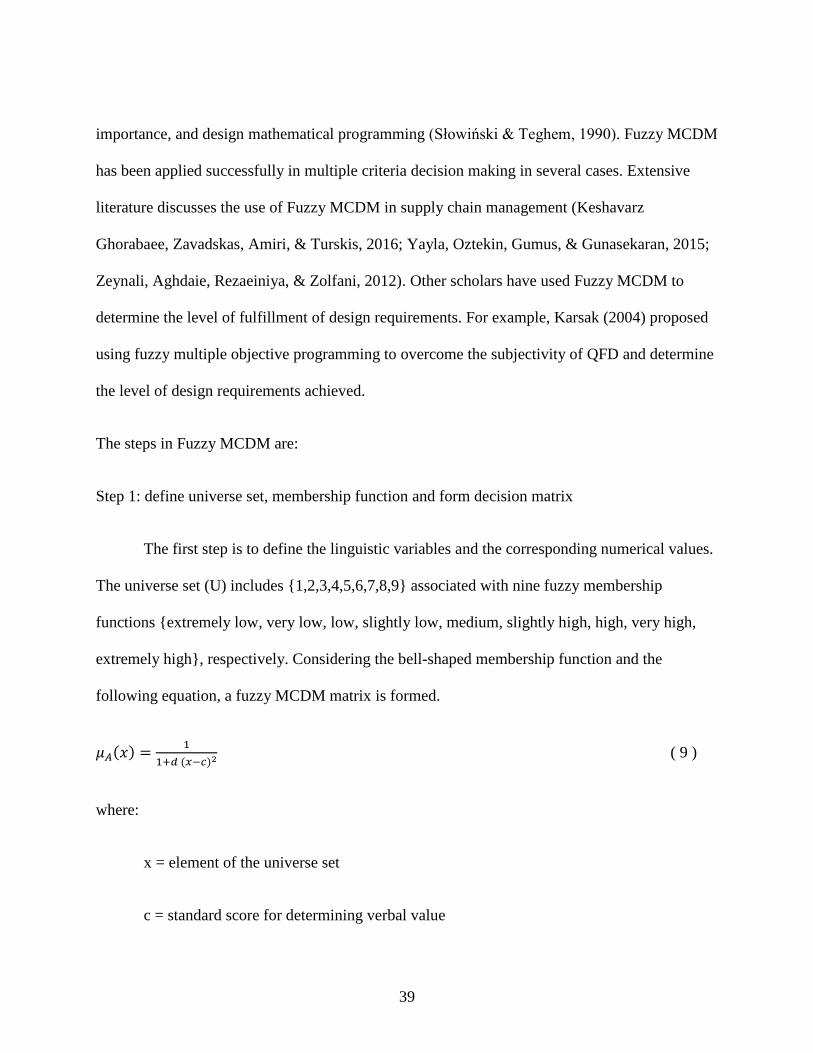
39
importance, and design mathematical programming (Słowiński & Teghem, 1990). Fuzzy MCDM
has been applied successfully in multiple criteria decision making in several cases. Extensive
literature discusses the use of Fuzzy MCDM in supply chain management (Keshavarz
Ghorabaee, Zavadskas, Amiri, & Turskis, 2016; Yayla, Oztekin, Gumus, & Gunasekaran, 2015;
Zeynali, Aghdaie, Rezaeiniya, & Zolfani, 2012). Other scholars have used Fuzzy MCDM to
determine the level of fulfillment of design requirements. For example, Karsak (2004) proposed
using fuzzy multiple objective programming to overcome the subjectivity of QFD and determine
the level of design requirements achieved.
The steps in Fuzzy MCDM are:
Step 1: define universe set, membership function and form decision matrix
The first step is to define the linguistic variables and the corresponding numerical values.
The universe set (U) includes {1,2,3,4,5,6,7,8,9} associated with nine fuzzy membership
functions {extremely low, very low, low, slightly low, medium, slightly high, high, very high,
extremely high}, respectively. Considering the bell-shaped membership function and the
following equation, a fuzzy MCDM matrix is formed.
𝜇𝐴(𝑥) =1
1+𝑑 (𝑥−𝑐)2 ( 9 )
where:
x = element of the universe set
c = standard score for determining verbal value
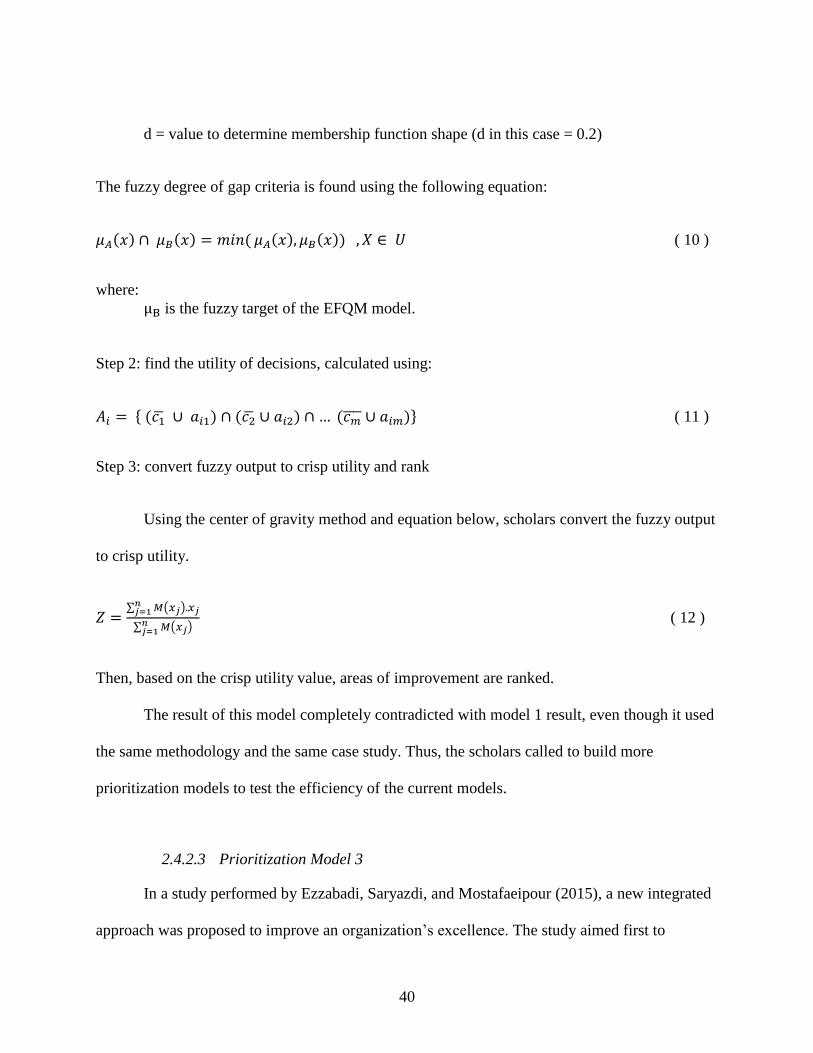
40
d = value to determine membership function shape (d in this case = 0.2)
The fuzzy degree of gap criteria is found using the following equation:
𝜇𝐴(𝑥) ∩ 𝜇𝐵(𝑥) = 𝑚𝑖𝑛( 𝜇𝐴(𝑥), 𝜇𝐵(𝑥)) , 𝑋 ∈ 𝑈 ( 10 )
where:
μB is the fuzzy target of the EFQM model.
Step 2: find the utility of decisions, calculated using:
𝐴𝑖 = { (𝑐1 ∪ 𝑎𝑖1) ∩ (𝑐2 ∪ 𝑎𝑖2) ∩ … (𝑐𝑚 ∪ 𝑎𝑖𝑚)} ( 11 )
Step 3: convert fuzzy output to crisp utility and rank
Using the center of gravity method and equation below, scholars convert the fuzzy output
to crisp utility.
𝑍 =∑ 𝑀(𝑥𝑗).𝑛𝑗=1 𝑥𝑗
∑ 𝑀(𝑥𝑗)𝑛𝑗=1
( 12 )
Then, based on the crisp utility value, areas of improvement are ranked.
The result of this model completely contradicted with model 1 result, even though it used
the same methodology and the same case study. Thus, the scholars called to build more
prioritization models to test the efficiency of the current models.
2.4.2.3 Prioritization Model 3
In a study performed by Ezzabadi, Saryazdi, and Mostafaeipour (2015), a new integrated
approach was proposed to improve an organization’s excellence. The study aimed first to
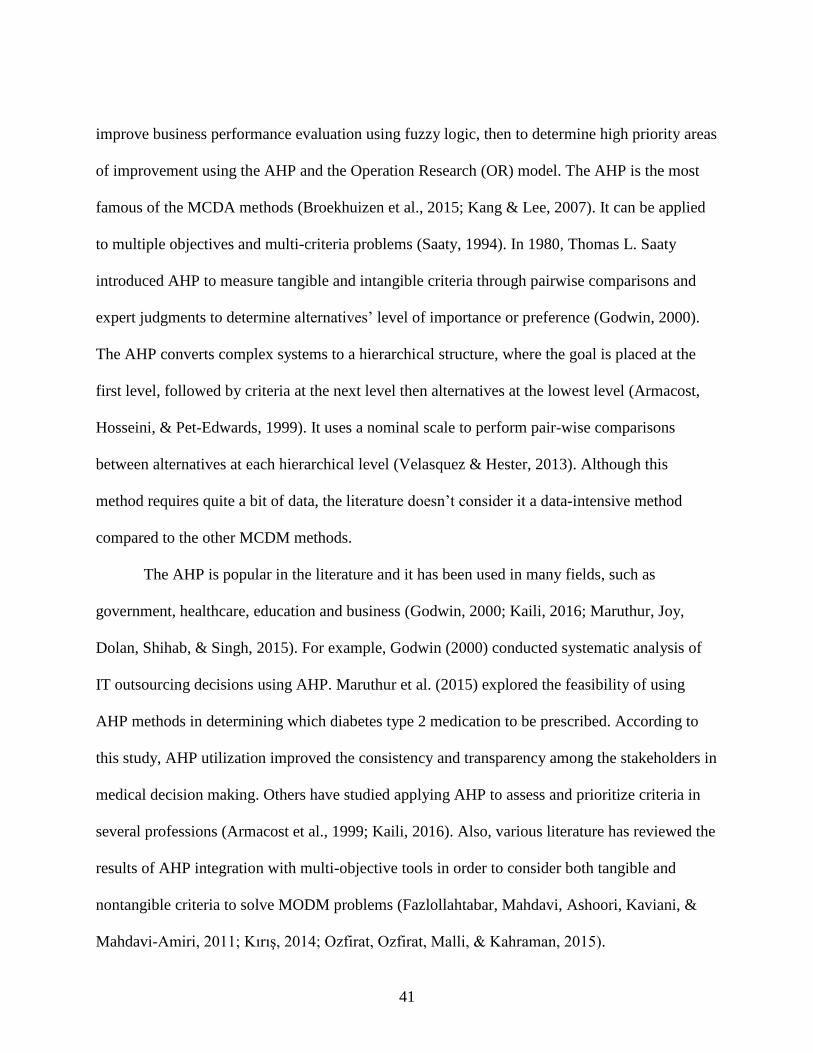
41
improve business performance evaluation using fuzzy logic, then to determine high priority areas
of improvement using the AHP and the Operation Research (OR) model. The AHP is the most
famous of the MCDA methods (Broekhuizen et al., 2015; Kang & Lee, 2007). It can be applied
to multiple objectives and multi-criteria problems (Saaty, 1994). In 1980, Thomas L. Saaty
introduced AHP to measure tangible and intangible criteria through pairwise comparisons and
expert judgments to determine alternatives’ level of importance or preference (Godwin, 2000).
The AHP converts complex systems to a hierarchical structure, where the goal is placed at the
first level, followed by criteria at the next level then alternatives at the lowest level (Armacost,
Hosseini, & Pet-Edwards, 1999). It uses a nominal scale to perform pair-wise comparisons
between alternatives at each hierarchical level (Velasquez & Hester, 2013). Although this
method requires quite a bit of data, the literature doesn’t consider it a data-intensive method
compared to the other MCDM methods.
The AHP is popular in the literature and it has been used in many fields, such as
government, healthcare, education and business (Godwin, 2000; Kaili, 2016; Maruthur, Joy,
Dolan, Shihab, & Singh, 2015). For example, Godwin (2000) conducted systematic analysis of
IT outsourcing decisions using AHP. Maruthur et al. (2015) explored the feasibility of using
AHP methods in determining which diabetes type 2 medication to be prescribed. According to
this study, AHP utilization improved the consistency and transparency among the stakeholders in
medical decision making. Others have studied applying AHP to assess and prioritize criteria in
several professions (Armacost et al., 1999; Kaili, 2016). Also, various literature has reviewed the
results of AHP integration with multi-objective tools in order to consider both tangible and
nontangible criteria to solve MODM problems (Fazlollahtabar, Mahdavi, Ashoori, Kaviani, &
Mahdavi-Amiri, 2011; Kırış, 2014; Ozfirat, Ozfirat, Malli, & Kahraman, 2015).
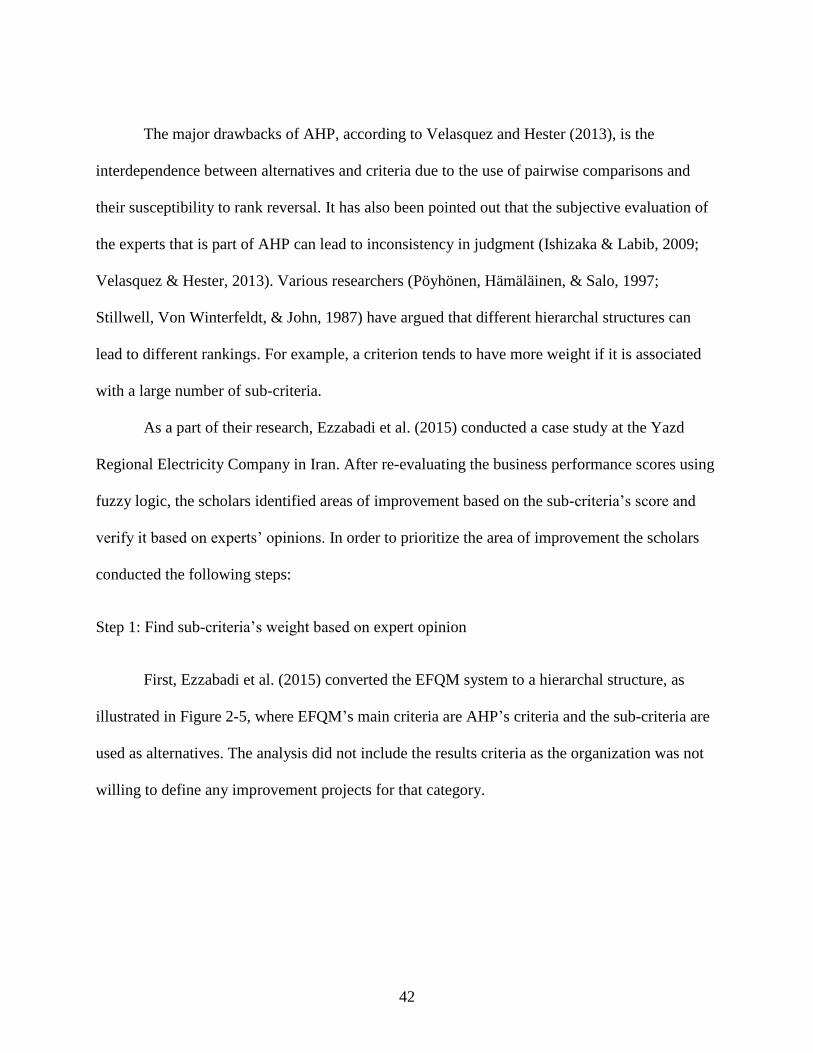
42
The major drawbacks of AHP, according to Velasquez and Hester (2013), is the
interdependence between alternatives and criteria due to the use of pairwise comparisons and
their susceptibility to rank reversal. It has also been pointed out that the subjective evaluation of
the experts that is part of AHP can lead to inconsistency in judgment (Ishizaka & Labib, 2009;
Velasquez & Hester, 2013). Various researchers (Pöyhönen, Hämäläinen, & Salo, 1997;
Stillwell, Von Winterfeldt, & John, 1987) have argued that different hierarchal structures can
lead to different rankings. For example, a criterion tends to have more weight if it is associated
with a large number of sub-criteria.
As a part of their research, Ezzabadi et al. (2015) conducted a case study at the Yazd
Regional Electricity Company in Iran. After re-evaluating the business performance scores using
fuzzy logic, the scholars identified areas of improvement based on the sub-criteria’s score and
verify it based on experts’ opinions. In order to prioritize the area of improvement the scholars
conducted the following steps:
Step 1: Find sub-criteria’s weight based on expert opinion
First, Ezzabadi et al. (2015) converted the EFQM system to a hierarchal structure, as
illustrated in Figure 2-5, where EFQM’s main criteria are AHP’s criteria and the sub-criteria are
used as alternatives. The analysis did not include the results criteria as the organization was not
willing to define any improvement projects for that category.
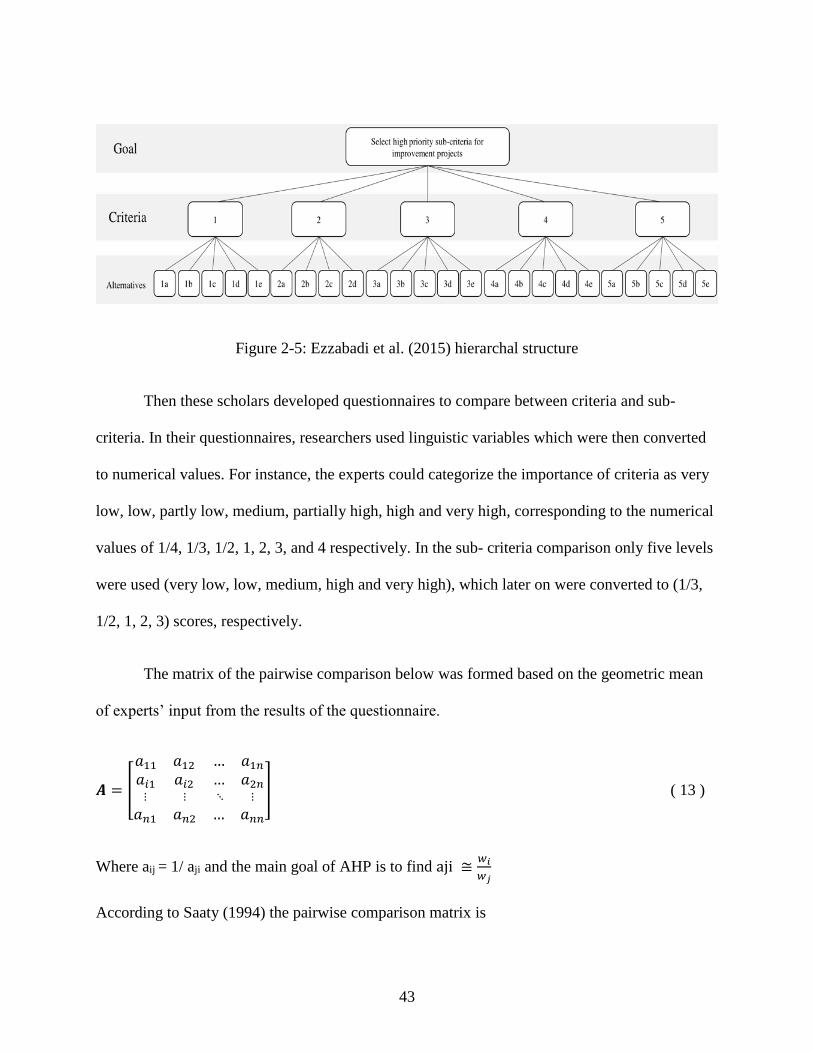
43
Figure 2-5: Ezzabadi et al. (2015) hierarchal structure
Then these scholars developed questionnaires to compare between criteria and sub-
criteria. In their questionnaires, researchers used linguistic variables which were then converted
to numerical values. For instance, the experts could categorize the importance of criteria as very
low, low, partly low, medium, partially high, high and very high, corresponding to the numerical
values of 1/4, 1/3, 1/2, 1, 2, 3, and 4 respectively. In the sub- criteria comparison only five levels
were used (very low, low, medium, high and very high), which later on were converted to (1/3,
1/2, 1, 2, 3) scores, respectively.
The matrix of the pairwise comparison below was formed based on the geometric mean
of experts’ input from the results of the questionnaire.
𝑨 = [
𝑎11 𝑎12𝑎𝑖1 𝑎𝑖2⋮ ⋮
𝑎𝑛1 𝑎𝑛2
… 𝑎1𝑛… 𝑎2𝑛 ⋱ ⋮
… 𝑎𝑛𝑛
] ( 13 )
Where aij = 1/ aji and the main goal of AHP is to find aji ≅𝑤𝑖
𝑤𝑗
According to Saaty (1994) the pairwise comparison matrix is
44
𝑾 =
[ 𝑤1
𝑤1…
𝑤𝑖
𝑤1…
⋮ 𝑤𝑛
𝑤1…
𝑤1
𝑤𝑗𝑤𝑖
𝑤𝑗
⋮𝑤𝑛
𝑤𝑗
…𝑤1
𝑤𝑛
…𝑤𝑖
𝑤𝑛 ⋱ ⋮
…𝑤𝑛
𝑤𝑛]
( 14 )
By solving the next equation as an eigenvalue problem, the relative weight of the sub-criteria’s
weight can be found.
𝐖×𝐰 =
[ w1 w1⁄ …
wi w1⁄ …⋮
wn w1⁄ …
w1 wj⁄
wi wj⁄
⋮wn wj⁄
… w1 wn⁄
… wi wn⁄ ⋱ ⋮… wn wn⁄ ]
[
w1wi⋮wn
]
Step 2: Find the distance between the current and targeted score
Next Ezzabadi et al. (2015) calculated the target function (Z), which is the total sum of
multiplication of weight given by organizational experts (Wi’) with the sub-criterion variable
(JúNIOR & ASANO) as shown in the following equation.
𝑍 = ∑ 𝑤𝑖′ × 𝑆𝐶𝑖
24𝑖=1 ( 15 )
Note that 24 is the number of sub-criteria of the enabler section in the EFQM model, which was
only included in the analysis.
Step 3: Sub-criteria prioritization
The final step was the computational procedure to find the index for each sub-criteria.
The scholars used the following equations:
𝐹𝑤 = 𝑊𝑚 ×𝑊𝐸 ( 16 )
45
where Wm is the sub-criterion weight from the model, WE the sub-criterion weight given by the
expert from step 1 (using AHP), and FW the final weight of the sub-criterion.
𝐼𝑛𝑑𝑒𝑥 = 𝐷𝑂𝑅 × 𝐹𝑤 ( 17 )
Where DOR is the distance between the current score and the target score obtained in step 2.
Based on the sub-criterion’s index, the scholars were able to prioritize the sub-criteria where a
high index is an indication of high priority.
2.4.2.4 Prioritization Model 4
In Iran, Herat, Noorossana, parsa, and Serkani (2012) developed a model to select an
improvement project in the healthcare sector. The research utilized a hybrid algorithm of the
Decision Making Trial and Evaluation Laboratory (DEMATEL) and the Analytical Network
Process (ANP). The scholars first gave experts a questionnaire to determine the causal
relationship between the EFQM nine criteria in healthcare; then, based on those relations, they
ranked the improvement projects using ANP. Fifteen experts participated in the questionnaire to
draw the causal relation between the nine criteria.
DEMATEL was introduced by Battelle Memorial Institute in Geneva research center
between 1971 and 1972 (Gabus & Fontela, 1972) to identify a mutual relationship in a complex
system. It also illustrates the interdependencies between criteria and identifies the main causal
factors which have a substantial effect on the rest of the system (Bacudio et al., 2016; Lin, 2013).
In recent years, DEMATEL has been employed to identify the interrelationships among factors.
For example, Lin (2013) used it to investigate the influential factors in green supply chain
management. Bacudio et al. (2016) identified the barriers to implementing industrial symbiosis
46
networks in Laguna, Philippines. In this case, DEMATEL permitted the scholars to analyze the
barriers of implementation by studying the cause and effect relationship between the barriers.
Govindan and Chaudhuri (2016) also applied DEMATEL to evaluate the interconnectedness
between risk factors faced by third party logistics service providers.
The ANP is an extension of AHP (Saaty, 2006). The AHP builds hierarchal structure and
assumes independence between elements, but in real cases elements are dependent and
interact with others. Thus, Saaty (2006) developed ANP to overcome this shortcoming
(Wudhikarn, Chakpitak, & Neubert, 2015). ANP has a nonlinear form and network structure to
handle both feedback and dependency (Velasquez & Hester, 2013). Numerous studies have
applied ANP in the decision-making process. Abdi (2012) applied ANP to select product family
formation while considering market and manufacturing requirements. Lee, Kim, Cho, and Park
(2009) employed ANP to identify the core technologies in network technology and the relative
importance and impact of the used technologies on each other. In other studies, ANP was used in
combination with other methods. Wang (2012) combined ANP with DEMATEL to consider
dependence and feedback in selecting the appropriate interactive trade strategy. This scholar
applied the hybrid framework to international business practices in Taiwan. However, despite its
apparent usefulness, a few researchers have criticized ANP for not including uncertainty and
probability information, which they claim may lead to inappropriate conclusions (Hsu & Pan,
2009; Wey, 2008). Thus, various research has proposed integrating ANP with methods that
account for uncertainty to overcome this drawback. In their work to choose between newly
developed formula for roof tiles, Wudhikarn et al. (2015) suggest using Monte Carlo analysis
with inputs before applying ANP in order to consider uncertainty inherited from the input data.
47
Herat et al. (2012) developed a methodology to investigate interdependencies between
EFQM criteria in healthcare using the DEMATEL technique, and then they incorporated ANP to
prioritize ten improvement projects. Below, the DEMATEL steps to establish the network
relationship are presented; then the method for applying ANP to obtain the prioritization is
presented.
The DEMATEL analysis consists of six step according to Lee, Huang, Chang, and Cheng
(2011):
Step 1: scale of evaluation identification
This step involves examining the degree of participants’ perceptions of the impact of a particular
dimension through pairwise comparisons between dimensions. The scholars used a scale of
0,1,2,3, and 4 to represent no impact, low impact, medium impact, high impact, and extremely
high impact, respectively.
Step 2: direct-influence matrix Z construction
Based on the output of step 1, a direct-influence matrix Z is constructed to represent the
degree of influence of factor i on factor j.
𝒁 = [
𝑧11 𝑧1𝑗𝑧𝑖1 𝑧𝑖j⋮ ⋮𝑧𝑛1 𝑧𝑛j
… 𝑧1𝑛… 𝑧j𝑛 ⋱ ⋮… 𝑧𝑛𝑛
]
Step 3: normalized direct-relation matrix X construction
Using the following equations, the direct-relation matrix X is found.
𝑿 = 𝑠 . 𝒁 ( 18 )
𝑠 = 𝑚𝑖𝑛 (1
𝑚𝑎𝑥1<𝑖<𝑛
∑ |𝑧𝑖𝑗|𝑛𝑗=1
,1
𝑚𝑎𝑥1<𝑗<𝑛
∑ |𝑧𝑖𝑗|𝑛𝑖=1
) 𝑖, 𝑗 = 1,2,… , 𝑛 ( 19 )
48
Step 4: total-influence matrix T construction
𝑻 = 𝑋 + 𝑋2 + 𝑋3 +⋯+ 𝑋𝑚 = 𝑋(𝐼 − 𝑋)−1 ( 20 )
where I is the identity matrix
Step 5: relation and prominence identification
This step involves summing T rows and columns to obtain the relation and prominence
using the following equation, where di represents the direct and indirect influence over the other
criteria, which indicates factors impacting the others. Then rj represents the other criteria degree
of impact, indicating factors that are influenced by others. The di + rj values called prominence
and indicate the strength of the relationship between the factors, whereas the di - rj values are
called relations and indicate the strength of the impact among factors.
𝑫 = [𝑑𝑖]𝑛×1 = (∑ 𝑡𝑖𝑗𝑛𝑗=1 )
𝑛×1 ( 21 )
𝑹 = [𝑟𝑗]′
1×𝑛= (∑ 𝑡𝑖𝑗
𝑛𝑗=1 )
′
1×𝑛 ( 22 )
Step 6: Network Relation Map (NRM) construction
NRM is a graphical representation to illustrate the interdependencies and relations
between factors. Herat et al. (2012) in his model set a threshold value for the criteria’s effect to
reduce the complexity of NRM.
The ANP technique is performed in four basic steps (Herat et al., 2012; Lee et al., 2011;
Saaty, 2006)
Step1: network structure formation
This step involves constructing a network to represent interrelationships between clusters and
within elements. Herat et al. (2012) obtained their network structure (Figure 2-6) through the
decisions makers brainstorming session to define the criteria, sub-criteria, and alternatives.
49
Figure 2-6: Herat et al. (2012) network structure
Step 2: pair-wise comparison
The pair-wise comparison is performed with respect to criteria and between elements in a
cluster to determine the importance weight of each factor. Similar to in AHP, decision makers
use a scale of nine points to form the pair comparison matrix and factors’ weight vector.
Step 3: super matrix formation
The super matrix concept is similar to the Markov chain process in queuing theory
matrix. It can be expressed as a parallel to Markov chain process in queuing theory (Saaty,
1996). The super matrix aims to find global prioritization within the system taking into
consideration the interdependent influences.
Step 4: best alternative selection
50
The best alternative or prioritization of alternatives can be determined using the weight of
importance of each alternative obtained in the super matrix.
2.4.2.5 Prioritization Model 5
In their research to assess the safety culture in the Spanish nuclear industry, Mariscal et
al. (2012) carried out an assessment using staff evaluation and a RADAR matrix to identify the
main areas of improvement needed and quantify the safety culture’s dimensions. The scholars
believed that this quantification could be used as a reference to develop a mechanism to
prioritize future improvements.
51
Table 2-3: Summary of the available models
(Author,
year)
Organization
type
Method Basis of the
evaluation
Entities involved
in decision making
Quantifying
the impact
of
uncertainty
Defining
criteria
Hea
lth
care
Man
ufa
ctu
rin
g
Ser
vic
e
TO
PS
IS
Fu
zzy
MC
DM
RA
DA
R
mat
rix
AH
P/A
NP
Op
erat
ion
Res
earc
h
DE
MA
TE
L
Sel
f-
asse
ssm
ent
Ex
tern
al
Ass
essm
ent
Managers
and
Focus
group
Other
stakehol
-ders
No Yes No Yes
(Dodangeh &
Yusuff, 2011)
X X X X Y Y
(Dodangeh et
al., 2011)
X X X X N Y
(Ezzabadi et
al., 2015)
X X X X X N N
(Herat et al.,
2012)
X X X X X N N
(Mariscal et
al., 2012)
X X X X N N
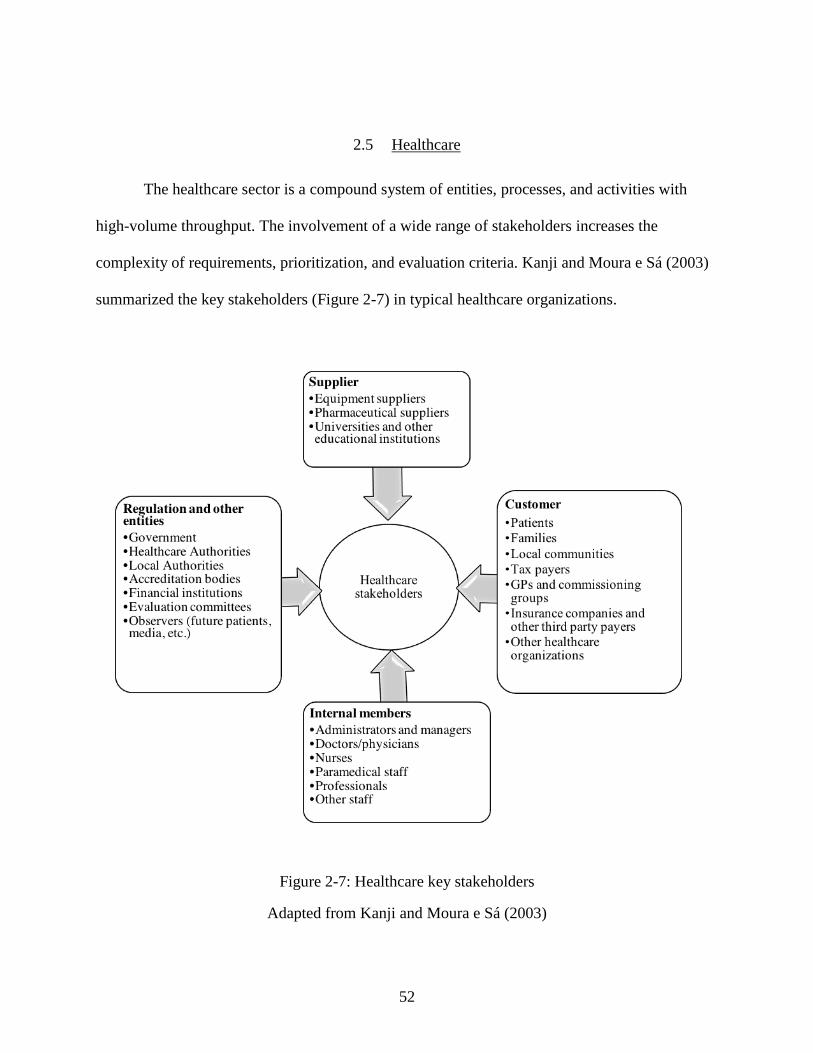
52
2.5 Healthcare
The healthcare sector is a compound system of entities, processes, and activities with
high-volume throughput. The involvement of a wide range of stakeholders increases the
complexity of requirements, prioritization, and evaluation criteria. Kanji and Moura e Sá (2003)
summarized the key stakeholders (Figure 2-7) in typical healthcare organizations.
Figure 2-7: Healthcare key stakeholders
Adapted from Kanji and Moura e Sá (2003)
53
In addition to having to deal with a diversity of stakeholders, healthcare providers are
encountering growing pressure in the form of rising costs of health care delivery, financial
constraints, difficulty of retaining and recruiting good professionals, and escalating standards of
education and living. The former factors yield to high patient’s expectations, medical
breakthroughs, stronger competition, availability of alternative providers, stricter laws and
government regulations, public and private monitoring, information availability, and easier
accessibility (Cheng Lim & Tang, 2000; Kunst & Lemmink, 2000; Lin, 1995; Rivers, 1999;
Short, 1995; Theodorakioglou & Tsiotras, 2000).
Accordingly, the healthcare industry has undergone a profound transformation in the last
two decades (Smith, 2013) and worldwide restructuring to improve service efficiency and cope
with patients' high expectations (Say Yen & Shun, 2015). An internal reformation is taking place
rather than addition of new facilities. The new services delivery focus on the improving
healthcare culture, organizational learning, staff behavior adjustment, and workforce engagement
(Smith, 2013). The Institute of Medicine in 2001 established six characteristics to improve the
healthcare sector: improve the system's effectiveness, improve safety, provide patient-centered
services, increase efficiency, deliver equitable services, and deliver timely services. Among these
six characteristics, delivering patient-centered services has been the driving force behind
numerous healthcare reengineering efforts. The main objective of patient-centered services is to
design valuable, practical and desirable services from a patient's perspective as the patients and
their experiences are the core values of healthcare system (Lee, 2011). Therefore, various quality
initiatives improvements were carried to achieve these objectives
54
2.5.1 Quality initiatives in healthcare
Over the years, the healthcare industry has adopted several manufacturing approaches to
enhance service performance and the patient experience. Methodologies like lean thinking, Six
Sigma (SS), TQM, and business process reengineering, continuous improvement has been
deployed to improve healthcare quality and its operational excellence (Crossland, Janamian, &
Jackson, 2014; Macinati, 2008; Ovretveit & Staines, 2007). Recent literature has focused on
studying the advantages of adopting quality initiatives in healthcare.
According to Jayasinha (2016), the LSS can help improve the patient experience.
Jayasinha implemented LSS in a pediatric clinic to eliminate waste and non-value added
processes in order to decrease the clinical cycle time to 90 minutes and raise patient satisfaction
from 87% to 95%. In Taiwan, Yeh, Lin, Su, and Wang (2011) analyzed LSS’s impact on the
medical process of acute myocardial infarction. The LSS decreased door-to-balloon (D2B); D2B
is the interval time of patient arrival to emergency cardiac care until the first balloon inflation in
the primary percutaneous coronary intervention; by 58.4% and increased efficiency by 1.6%.
Also, it reduced the average inpatient stay by three days. A similar case study was conducted in
the UAE by Ellahham, Aljabbari, Harold , Raji, and AlZubaidi (2015). Here, the D2B process
decreased from 75.9 to 60.1 minutes and the percentage of patients who were treated within 90
minutes increased to 96% comparing to 73% before the improvement
In their review, Mason, Nicolay, and Darzi (2015) assessed the utilization of Lean and
Six Sigma in surgery; 88% of the studies demonstrated an enhancement in pre-operation,
operation, and in-patient settings. The enhancements included operative complication reduction,
ward-based harm reduction, mortality reduction, outpatient efficiency optimization, cost
55
reduction, and decreased length of stay. Nevertheless, the scholars promoted conducting further
studies to understand the bias. Huang, Li, Wilck, and Berg (2012) claim that hospitals can reduce
their costs via LSS. They support their hypothesis through presenting several case studies of
hospitals around the world which had adopted LSS. In general, each healthcare facility reported a
reduction in operational costs, improvements in service quality, and an increased profit margin.
In Italy, Macinati (2008) validated the relation between adopting TQM system and Italian
healthcare performance.
Many scholars have concluded that LSS can reduce waste to allow for faster and better
processes in various divisions in the healthcare system. Gijo and Antony (2013) addressed
resolving the issue of long wait times in the Outpatient Department (OD) using LSS. Their
application of LSS in this setting decreased the average waiting time to 24.5 minutes (SD=9.27
min) as compared to 57 minutes (SD=31.15 min) before LSS adoption. Agarwal et al. (2016)
demonstrate that LSS can positively impact the cardiac catheterization laboratory's process. This
study applied LSS to improve on-time patient arrival, on-time physician arrival, optimal turn-
time to 56.6% from 43.6% in 2009, on-time start to 62.8% comparing to 41.7% in 2009,
and optimal physician downtime to less than 35 minutes.
Patient-centered services are uniquely essential in healthcare to increase patient
satisfaction. Scholars like Otani, Waterman, Faulkner, Boslaugh, and Dunagan (2010) found a
proportional relation between patient satisfaction and willingness to return to the same provider
and to recommend the provider to a family or a friend. The same study concluded that patient
satisfaction has a great influence on healing and recovery. Adopting quality initiatives can
improve the patient experience (Jayasinha, 2016), raise market competitiveness (Yeh et al.,
2011), reduce costs, and increase the profit margin (Huang et al., 2012).
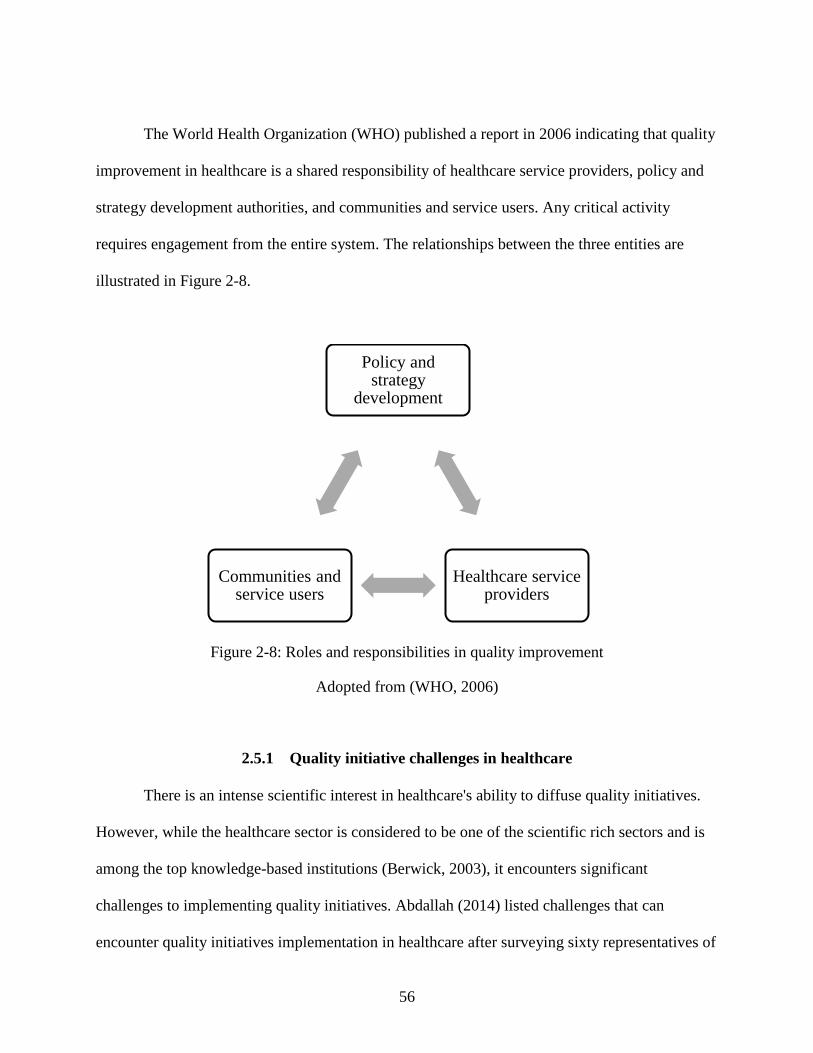
56
The World Health Organization (WHO) published a report in 2006 indicating that quality
improvement in healthcare is a shared responsibility of healthcare service providers, policy and
strategy development authorities, and communities and service users. Any critical activity
requires engagement from the entire system. The relationships between the three entities are
illustrated in Figure 2-8.
Figure 2-8: Roles and responsibilities in quality improvement
Adopted from (WHO, 2006)
2.5.1 Quality initiative challenges in healthcare
There is an intense scientific interest in healthcare's ability to diffuse quality initiatives.
However, while the healthcare sector is considered to be one of the scientific rich sectors and is
among the top knowledge-based institutions (Berwick, 2003), it encounters significant
challenges to implementing quality initiatives. Abdallah (2014) listed challenges that can
encounter quality initiatives implementation in healthcare after surveying sixty representatives of
Policy and strategy
development
Healthcare service providers
Communities and service users
57
eighteen hospitals in Jordan and compare it with literature. The study revealed challenges related
to the healthcare system, medical staff education and training, manager and physician impact,
law and system's regulation, and culture resistance.
Regardless of the promising benefits healthcare can experience from adopting quality
initiatives, various studies have reported less than successful scenarios and some factors,
consistently identified as ‘challenges,’ prevent wider adoption and may explain the failure of
quality initiatives in healthcare. See Table 2-4 for a summary.
The majority of scholars declare that hospital culture is the main challenge for quality
initiative implementation. According to Pocha (2010) getting different stakeholders to “buy into”
the approach is the toughest part because quality initiative changes their daily routines and
introduce new delivery methods. Bhat, Gijo, and Jnanesh (2014) showed that manager and
employee resistance are the main challenges for improving registration process in Indian
hospitals. The resistance is due to the lack of knowledge and education about quality initiative
methodology.
Abdallah (2014) indicate that medical staff believe that managers and physicians are a
possible barrier to quality initiatives. In hospitals, physicians have more authority and power
than other employees. Hence, insufficient physician involvement is a major obstacle to
successful quality initiatives implementation (Pocha, 2010). In her research, Mosadeghrad
(2015) concluded that Iranian healthcare has a medium TQM success due to lack of quality
management systems and a low level of workforce engagement.
Radnor and Boaden (2008) argued that hospital systems complexity and stakeholder
involvement are significant challenges. Patients in hospitals are significantly involved in the
majority of the processes while customers in the manufacturing sector only assess the final
58
products. Hence, quality improvements in hospital are associated with more human elements, has
more variability, and it is complex to adopt (Bandyopadhyay & Coppens 2015). Also, due to
hospital complexity, it is not easy to identify processes and indicators or define the defect to be
measured (Bhat, Gijo, & Jnanesh, 2016; Laureani, Brady, & Antony, 2013).
Another challenge is the medical staff education and training. Insufficient background
knowledge of industrial engineering tools can limit quality initiative adoption (Bhat et al., 2016).
The literature revealed that physicians and nurses showed a significant appreciation for statistics
as a problem-solving tool, but they lack the interest to utilize it in their routines (Chiarini &
Bracci, 2013). Also, even though nurses are considered to be a significant quality asset, black
belt training is only available for physicians (Abdallah, 2014; Chiarini & Bracci, 2013).
After studying two public healthcare organizations in Italy, Chiarini and Bracci (2013)
revealed that quality initiative implementation could also be restricted by laws and regulations.
In many countries, including Italy, politicians impact the strategic planning in public healthcare,
which can influence quality initiatives adopting. Also, quality initiatives projects are partially
cost-reduction–driven, but public hospitals are not required to link their improvement projects to
financial results.
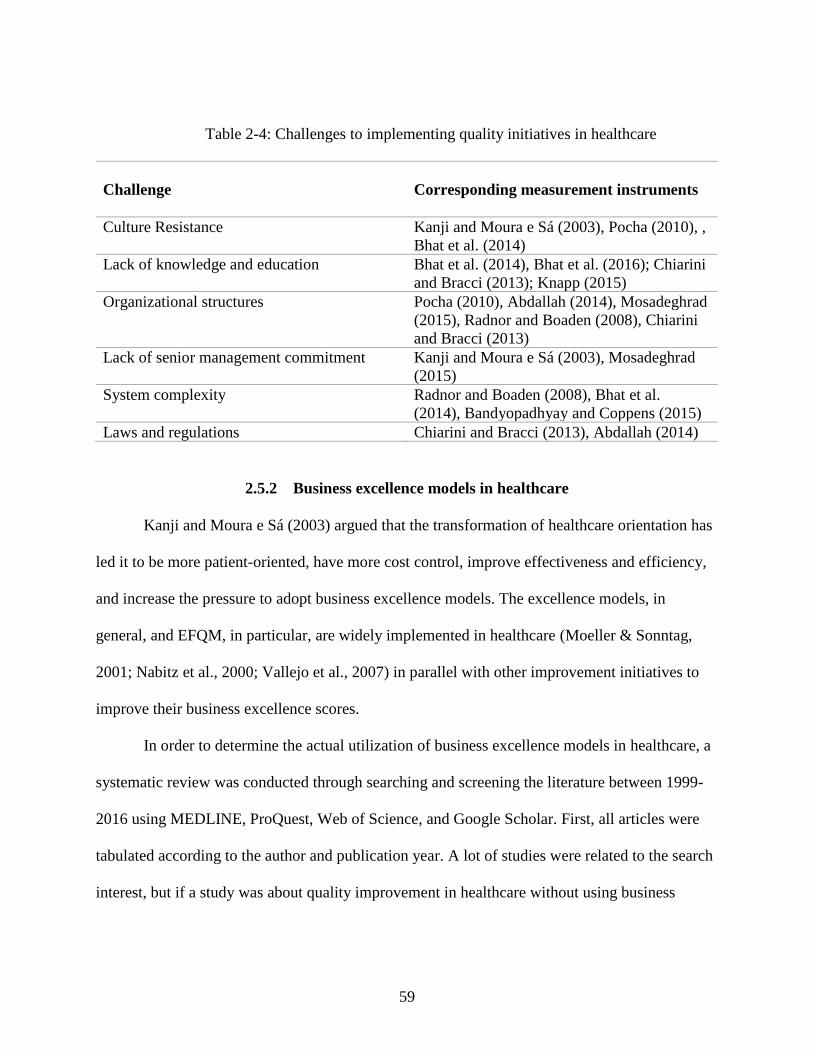
59
Table 2-4: Challenges to implementing quality initiatives in healthcare
Challenge
Corresponding measurement instruments
Culture Resistance Kanji and Moura e Sá (2003), Pocha (2010), ,
Bhat et al. (2014)
Lack of knowledge and education Bhat et al. (2014), Bhat et al. (2016); Chiarini
and Bracci (2013); Knapp (2015)
Organizational structures Pocha (2010), Abdallah (2014), Mosadeghrad
(2015), Radnor and Boaden (2008), Chiarini
and Bracci (2013)
Lack of senior management commitment Kanji and Moura e Sá (2003), Mosadeghrad
(2015)
System complexity
Radnor and Boaden (2008), Bhat et al.
(2014), Bandyopadhyay and Coppens (2015)
Laws and regulations Chiarini and Bracci (2013), Abdallah (2014)
2.5.2 Business excellence models in healthcare
Kanji and Moura e Sá (2003) argued that the transformation of healthcare orientation has
led it to be more patient-oriented, have more cost control, improve effectiveness and efficiency,
and increase the pressure to adopt business excellence models. The excellence models, in
general, and EFQM, in particular, are widely implemented in healthcare (Moeller & Sonntag,
2001; Nabitz et al., 2000; Vallejo et al., 2007) in parallel with other improvement initiatives to
improve their business excellence scores.
In order to determine the actual utilization of business excellence models in healthcare, a
systematic review was conducted through searching and screening the literature between 1999-
2016 using MEDLINE, ProQuest, Web of Science, and Google Scholar. First, all articles were
tabulated according to the author and publication year. A lot of studies were related to the search
interest, but if a study was about quality improvement in healthcare without using business
60
excellence it was eliminated. The evaluation and analysis of the context of the articles led to
them being grouped into five categories, presented in Table 2-5.
with the related literature. Note that the search used ‘business excellence’ in general as a
keyword and then another search was conducted using the three major excellence models as
search terms. Some keywords were helpful as synonyms for healthcare to broaden the search and
get more results, including ‘hospitals’, ‘medical’, ‘pharmacy’, ‘dental’, ‘therapy’. The five main
categories are:
1- Category 1: Literature discussing applications of BEMs in healthcare
The articles discuss the experience of implementing excellence models in the entire
organization, department or even at the project level as an assessment tool or a guideline to
prepare plans and strategies. Those articles also demonstrate whether the models were able
generate noticeable outcomes in healthcare. For example, Moeller and Sonntag (2001) illustrated
the German health services experience gained through evaluating their system against EFQM.
The article shared best practices, success factors, limitation, barriers and lessons learned. The
scholar concluded that the model is generic enough to cover all areas in healthcare. Vallejo et al.
(2007) described the implementation of EFQM in a psychiatric hospital ward. The study proved
the possibility of its implementation and cited a positive impact on clinical personal
communication and involvement. Sabella, Kashou, and Omran (2015) assessed the quality of
management practices in 51 hospitals in Palestine using the MBNQA model. The study reported
that the hospitals got an excellent score in administration practices and lower scores in areas like
human resources, information analysis, and performance results.
2- Category 2: Literature examining the suitability and reliability of BEMs for
healthcare environment
61
The articles in this category focus on conducting an investigation to examine whether
BEMs are suitable for the healthcare environment; they analyze the reliability and applicability
of the models. For instance, Gené-Badia, Jodar-Solà, Peguero-Rodríguez, Contel-Segura, and
Moliner-Molins (2001) explored the applicability and reliability of EFQM in primary healthcare
systems in Spain. Their results supported the hypothesis of applicability and reliability and
showed approximately similar result of self-evaluation and external evaluation. In the UK,
Stewart (2003) tested whether EFQM was a suitable model within the pharmacy department at
Salford Royal Hospitals. The study demonstrated that EFQM could enhance the quality of
service and provide a structured approach within the pharmacy department. Abdallah, Haddadin,
Al-Atiyat, Haddad, and Al-Sharif (2013) investigated the applicability of EFQM in the Jordanian
healthcare organization. The Scholars noted that once. The study proved that EFQM is an
applicable model in Jordanian hospitals, but hospital personnel should have proper training.
3- Category 3: Literature comparing BEMs with existing programs and systems in
healthcare
The articles in this category attempt to compare excellence models with existing
healthcare systems and accreditation programs to ensure no conflicts occur between both.
Donahue and vanOstenberg (2000) compared Joint Commission International (JCI) with four
quality models, including EFQM. The study points out that both JCI and other quality models
employ standards and external reviewers in the evaluation process. The JCI program and EFQM
are both cited as frameworks for quality management and empowering quality leadership.
However, the JCI is shown to allow international comparison, which is not the case for
excellence models due to model variation between countries. Foster et al. (2007) compared
MBNQA with the existing clinical microsystem in USA. The study aimed to discover if both
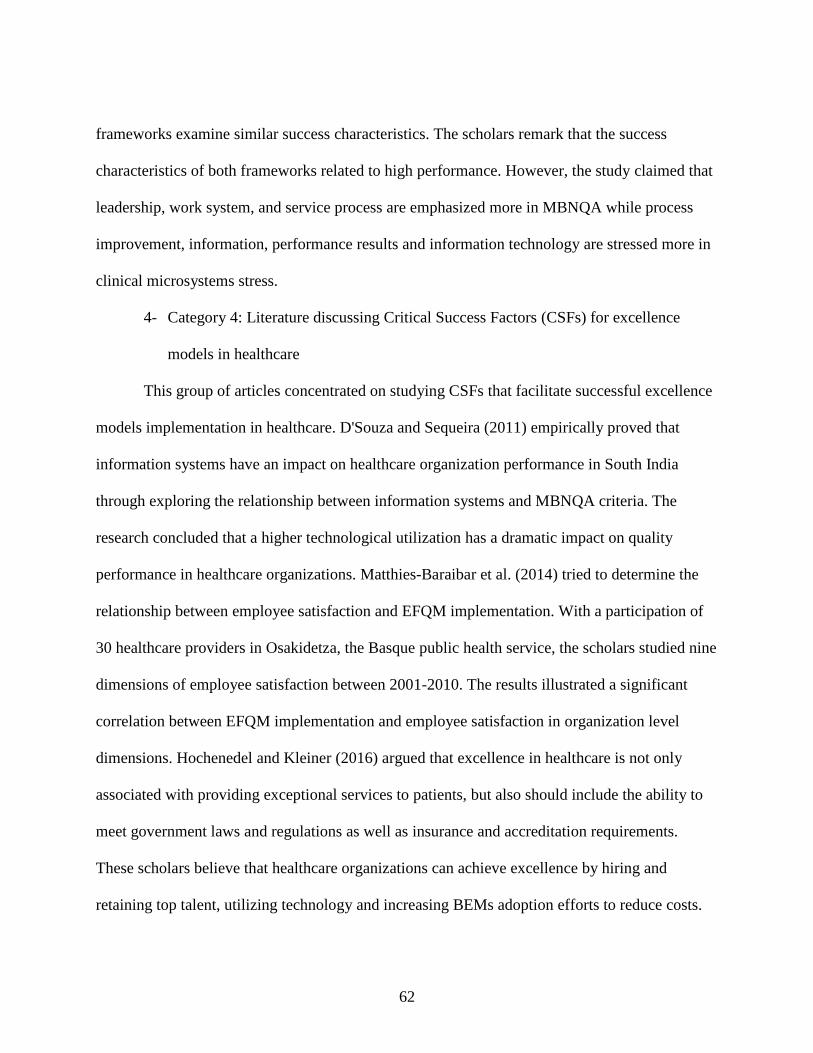
62
frameworks examine similar success characteristics. The scholars remark that the success
characteristics of both frameworks related to high performance. However, the study claimed that
leadership, work system, and service process are emphasized more in MBNQA while process
improvement, information, performance results and information technology are stressed more in
clinical microsystems stress.
4- Category 4: Literature discussing Critical Success Factors (CSFs) for excellence
models in healthcare
This group of articles concentrated on studying CSFs that facilitate successful excellence
models implementation in healthcare. D'Souza and Sequeira (2011) empirically proved that
information systems have an impact on healthcare organization performance in South India
through exploring the relationship between information systems and MBNQA criteria. The
research concluded that a higher technological utilization has a dramatic impact on quality
performance in healthcare organizations. Matthies-Baraibar et al. (2014) tried to determine the
relationship between employee satisfaction and EFQM implementation. With a participation of
30 healthcare providers in Osakidetza, the Basque public health service, the scholars studied nine
dimensions of employee satisfaction between 2001-2010. The results illustrated a significant
correlation between EFQM implementation and employee satisfaction in organization level
dimensions. Hochenedel and Kleiner (2016) argued that excellence in healthcare is not only
associated with providing exceptional services to patients, but also should include the ability to
meet government laws and regulations as well as insurance and accreditation requirements.
These scholars believe that healthcare organizations can achieve excellence by hiring and
retaining top talent, utilizing technology and increasing BEMs adoption efforts to reduce costs.
63
5- Category 5: Literature discussing the Integration/modification of BEMs to suit the
requirements of healthcare.
Although the excellence models can bring outstanding benefits to healthcare, various
scholars still argue that excellence models are too generic for healthcare and question their
ability to cover all clinical aspects. The literature in this category includes that in which scholars
propose a modification or integration with other models to overcome those shortcomings. This
category also include articles that discuss the use of EFQM to enhance an existing program.
Vallejo et al. (2006), for example, proposed using the Performance Assessment Tool for quality
improvement in Hospitals (PATH) conceptual framework, developed by the WHO Regional
Office for Europe, to develop an EFQM specific healthcare framework. Kim and Oh (2012)
established mental healthcare evaluation criteria based on MBNQA and verified the evaluation
model causality. In Spain, López-Viñas et al. (2014) illustrates how an adaptation of the EFQM
and the accreditation model of acute care hospitals yielded a higher degree of compliance with
standards, smoother communication between accreditation organizations and accredited centers,
and greater professionalism of the audit process.
6- Prioritizing business excellence’s improvement initiatives in the context of healthcare
This topic was only covered by only one study conducted by Herat et al. (2012). This
model was discussed in detail in section 2.4.2.
64
Table 2-5: Business excellence in healthcare
The use of Business excellence models in
healthcare system
Related literature
Business excellence’s applications in
healthcare
Naylor (1999), Nabitz et al. (2000), Jackson
(2000), Moeller and Sonntag (2001), Sanchez
et al. (2006), Del Rio et al. (2006), Usha,
Bhimaraya, and Shalini (2007); Vallejo et al.
(2007), Foster and Pitts (2009); Vernero,
Nabitz, Bragonzi, Rebelli, and Molinari
(2007), Mena Mateo, de la Fuente, Cañada
Dorado, and Villamor Borrego (2009), Foster
and Pitts (2009), Ana I. Marques et al. (2011),
Rowland-Jones (2012), Dehnavieh et al.
(2012), Mundongo et al. (2014), Favaretti et
al. (2015), Sabella et al. (2015)
Business excellence’s suitability for
healthcare
Gené-Badia et al. (2001), Moeller and
Sonntag (2001), Stewart (2003), Abdallah et
al. (2013), Van Schoten, De Blok,
Spreeuwenberg, Groenewegen, and Wagner
(2016)
Business excellence in comparison to
healthcare programs and systems
Donahue and vanOstenberg (2000), Foster et
al. (2007)
Business excellence CSFs in healthcare
Jackson (2000), Fraser and Olsen (2002),
Kanji and Moura e Sá (2003), Studer (2004),
Stuart-Kregor (2006), Zimring, Augenbroe,
Malone, and Sadler (2008), Matthies-Baraibar
et al. (2014), Hochenedel and Kleiner (2016)
Business excellence model
modification/integration to suit healthcare
requirements
Holland and Fennell (2000), Vallejo et al.
(2006), Kim and Oh (2012), Moreno-
Rodrı´guez, Cabrerizo, Pérez, and Martı´nez
(2013), López-Viñas et al. (2014), Tekic,
Majstorovic, and Markovic (2015)
Prioritizing Business excellence improvement
initiatives in healthcare
Herat et al., 2012
65
2.5.3 The benefits BEMs can bring to healthcare
The BEMs can bring enormous benefits to healthcare performance (Dehnavieh et al.,
2012; Mundongo et al., 2014). Thus, it is essential to evaluate the impact on healthcare
performance and illustrate the associated index(es). Table 2-6 presents a summary of a
systematic review of the literature related to Business Excellence’s impact on the healthcare
system.
According to the literature, the dominant reason for adopting a business excellence model
in healthcare is to increase patient satisfaction. This increase has been shown in several studies.
For example, Sanchez et al. (2006) showed an increase in patient satisfaction rate from 93.1% to
96.2% in the emergency department and outpatient clinics after applying an EFQM model in
Basque Health Service. In Trento Healthcare Trust, Favaretti et al. (2015) reported 94% patient
satisfaction with physicians and nurses, an increase of 6% in 2009 when compared to results
from a 2002 survey. An increase in overall patient satisfaction rate was also found, to 89% and
84% for inpatient and outpatient care, respectively, compared to 77% and 70% in 2002.
Business excellence affects various clinical and non-clinical processes. Vallejo et al.
(2007) showed an increase in the admission rates in the psychiatric ward from 282 in 2003 to
297 in 2005 and an increase of 12.5% in scheduled admissions (17% in 2003 and 29.5% in
2005). The same study reported a decrease in emergency re-admissions from 20 to 12 after
adopting EFQM. Different studies have examined the Length of Stay (LoS) rate before and after
business excellence implementation and reported a rate reduction. Vallejo et al. (2007) showed a
reduction in average LoS from to 14.8 days in 2003 to 13.8 days in 2005. Sanchez et al. (2006)
also reported a reduction in LoS, from 6.1 day in 2000 to 5.9 days in 2003. Stahr (2001)
66
indicated an average of one day of LoS for dedicated hernia services in Salford Royal Hospitals
NHS Trust compared to an average of 3.6 days before the improvement project was
implemented. Another index is service accessibility, which is the time it takes to receive care
services. Sanchez et al. (2006) found that the length of time on the surgical waiting list in Basque
Health Service was reduced to 53.8 days in 2003 comparing to 57.1 days in 2001. The scholars
also reported a reduction in patient wait times to receive specialized care to 61.1% comparing to
63.1%. Stahr (2001) also assessed the average time for patients to access surgical spinal services
and reported that patients had to wait less than three weeks after a BEM was implemented,
comparing to a wait of up to 2.5 years previously. The researchers also reported a massive
improvement in the time needed for acute stroke patients to access a rehabilitation bed, moving
from less than 72 hours as compared to up to ten weeks before the improvement. Favaretti et al.
(2015) stated that with the adoption of BEM in the Trento Healthcare Trust, 85% of the patients
in the emergency room received care in an hour and increased the consultations duration and the
time physicians spent with the patients. Sanchez et al. (2006) observed that primary care medical
consultation duration increased from 7.4 in 2001 min to 8.5 min in 2003.
The impact of BEM extends to the healthcare system work environment. In general,
improvement initiatives based on business excellence have been shown to enhance employees’
satisfaction index (Favaretti et al., 2015). In the Congo, Mundongo et al. (2014) stated that more
than 50% of the employees in a laboratory were satisfied after excellence implementation, an
increase of 11% compared to 2005. Leigh et al. (2005) concluded that business excellence
improved the qualified nurses’ retention rate and increased the level of confidence and
competence among newly qualified nurses. Moreover, the new environment led to further
scientific and Congress involvement. Vallejo et al. (2007) reported that using EFQM in the
67
psychiatric ward enabled the hospitals to increase the number of scientific papers published from
six in 2003 to nine in 2005; moreover, 52 posters and presentations were presented at Congresses
in 2005 comparing to only nine in 2003. A similar result was presented by Stahr (2001); the
number of Salford Royal Hospitals NHS Trust peer-reviewed research publications increased
from 148 a year to 185 a year.
In addition, hospitals with business excellence adoption allow more emphasis on creating
a learning environment. Vallejo et al. (2007) stated that the number of training courses received
or given by professional staff increased after business excellence implementation; the received
courses increased from 12 to 35 and given courses from 17 to 23. In the healthcare system,
personal safety is a top priority, and with business excellence adoption occupational injuries
recorded a reduction of 53.7 per 1000 staff in 2009 comparing to 69.2 in 2003 (Favaretti et al.,
2015). On the communication side, Stahr (2001) reported better communication throughout the
Salford Royal Hospitals NHS, with an increase of 40% (before 40% and 80% after the
improvement) and easier accessibility to a manager with an enhancement of 82% comparing to
46%.
Business excellence has also been shown to influence the relationship between the
healthcare system and the surrounding environment. Favaretti et al. (2015) found that the Trento
Healthcare Trust was able to reduce hospital waste to 1.39 kg per day in 2009 versus 2.04 kg per
day in 2003 after introducing a BEM. Stahr (2001) and Vallejo et al. (2007) studied the
correlation between business excellence adoption in healthcare and positive media reports. Stahr
(2001) reported 81% positive reports after adoption in contrast to 76% before. In addition,
Vallejo et al. (2007) noticed an improvement in the daily average website hits and increase in the
appearance in the media after business excellence adoption.
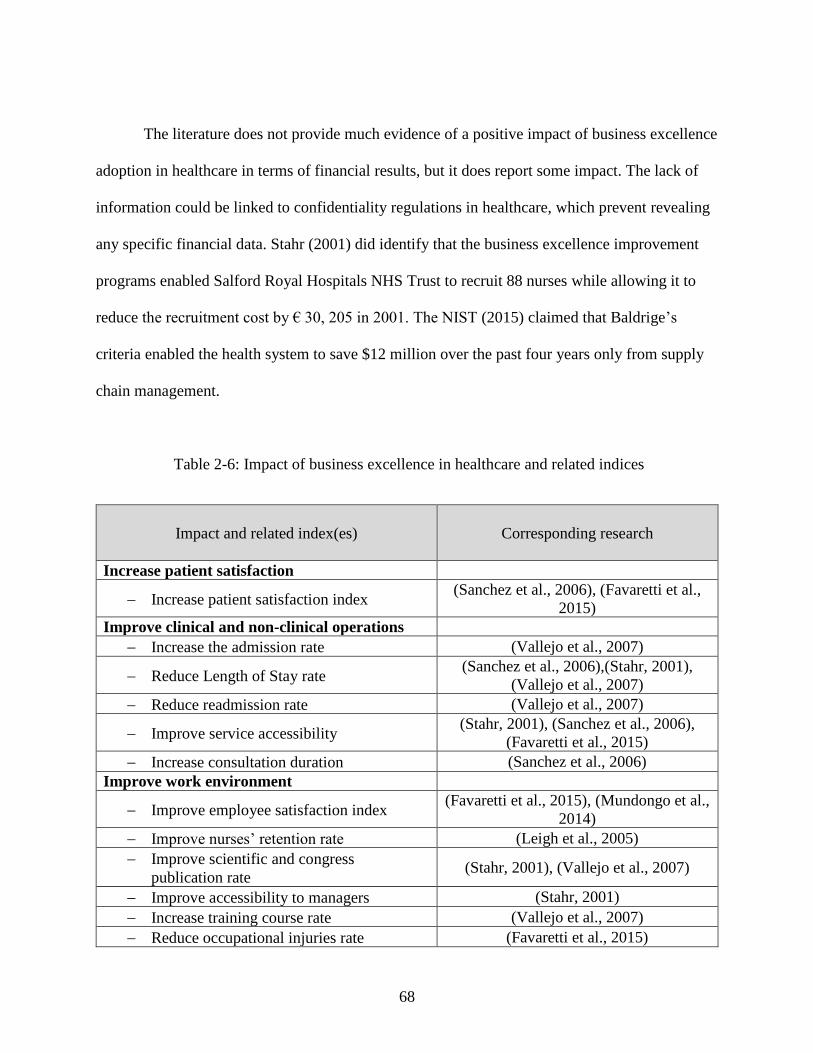
68
The literature does not provide much evidence of a positive impact of business excellence
adoption in healthcare in terms of financial results, but it does report some impact. The lack of
information could be linked to confidentiality regulations in healthcare, which prevent revealing
any specific financial data. Stahr (2001) did identify that the business excellence improvement
programs enabled Salford Royal Hospitals NHS Trust to recruit 88 nurses while allowing it to
reduce the recruitment cost by € 30, 205 in 2001. The NIST (2015) claimed that Baldrige’s
criteria enabled the health system to save $12 million over the past four years only from supply
chain management.
Table 2-6: Impact of business excellence in healthcare and related indices
Impact and related index(es)
Corresponding research
Increase patient satisfaction
− Increase patient satisfaction index (Sanchez et al., 2006), (Favaretti et al.,
2015)
Improve clinical and non-clinical operations
− Increase the admission rate (Vallejo et al., 2007)
− Reduce Length of Stay rate (Sanchez et al., 2006),(Stahr, 2001),
(Vallejo et al., 2007)
− Reduce readmission rate (Vallejo et al., 2007)
− Improve service accessibility (Stahr, 2001), (Sanchez et al., 2006),
(Favaretti et al., 2015)
− Increase consultation duration (Sanchez et al., 2006)
Improve work environment
− Improve employee satisfaction index (Favaretti et al., 2015), (Mundongo et al.,
2014)
− Improve nurses’ retention rate (Leigh et al., 2005)
− Improve scientific and congress
publication rate (Stahr, 2001), (Vallejo et al., 2007)
− Improve accessibility to managers (Stahr, 2001)
− Increase training course rate (Vallejo et al., 2007)
− Reduce occupational injuries rate (Favaretti et al., 2015)
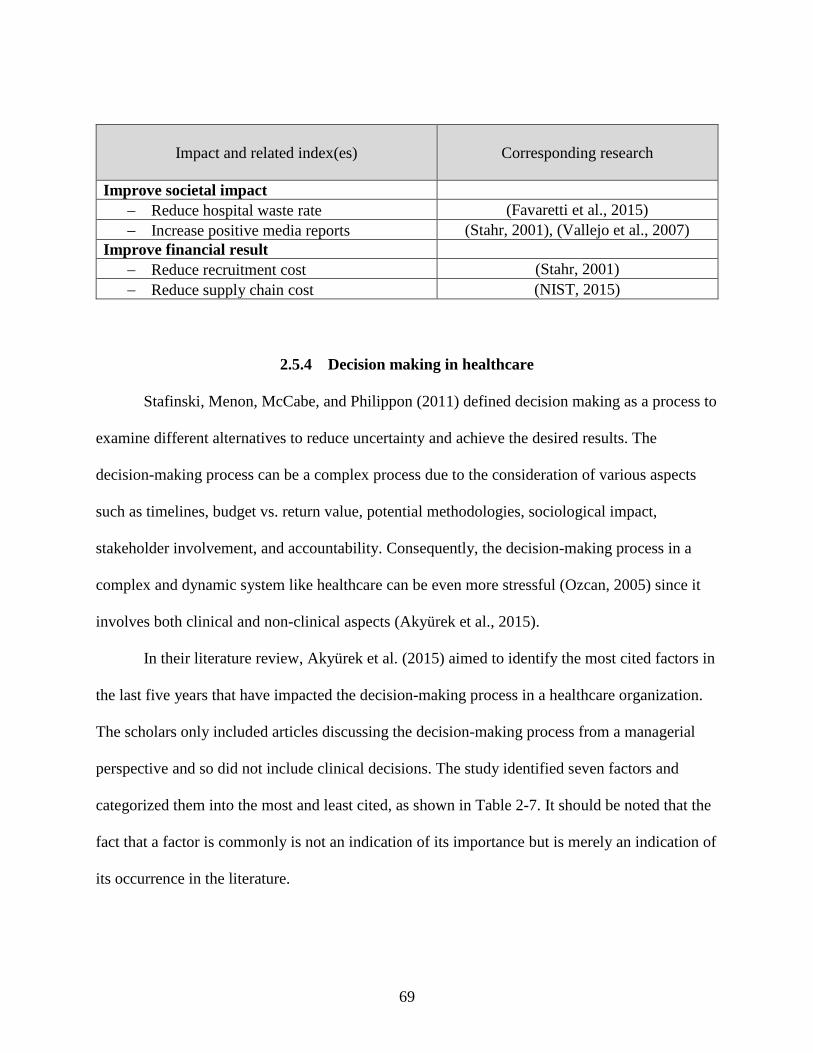
69
Impact and related index(es)
Corresponding research
Improve societal impact
− Reduce hospital waste rate (Favaretti et al., 2015)
− Increase positive media reports (Stahr, 2001), (Vallejo et al., 2007)
Improve financial result
− Reduce recruitment cost (Stahr, 2001)
− Reduce supply chain cost (NIST, 2015)
2.5.4 Decision making in healthcare
Stafinski, Menon, McCabe, and Philippon (2011) defined decision making as a process to
examine different alternatives to reduce uncertainty and achieve the desired results. The
decision-making process can be a complex process due to the consideration of various aspects
such as timelines, budget vs. return value, potential methodologies, sociological impact,
stakeholder involvement, and accountability. Consequently, the decision-making process in a
complex and dynamic system like healthcare can be even more stressful (Ozcan, 2005) since it
involves both clinical and non-clinical aspects (Akyürek et al., 2015).
In their literature review, Akyürek et al. (2015) aimed to identify the most cited factors in
the last five years that have impacted the decision-making process in a healthcare organization.
The scholars only included articles discussing the decision-making process from a managerial
perspective and so did not include clinical decisions. The study identified seven factors and
categorized them into the most and least cited, as shown in Table 2-7. It should be noted that the
fact that a factor is commonly is not an indication of its importance but is merely an indication of
its occurrence in the literature.
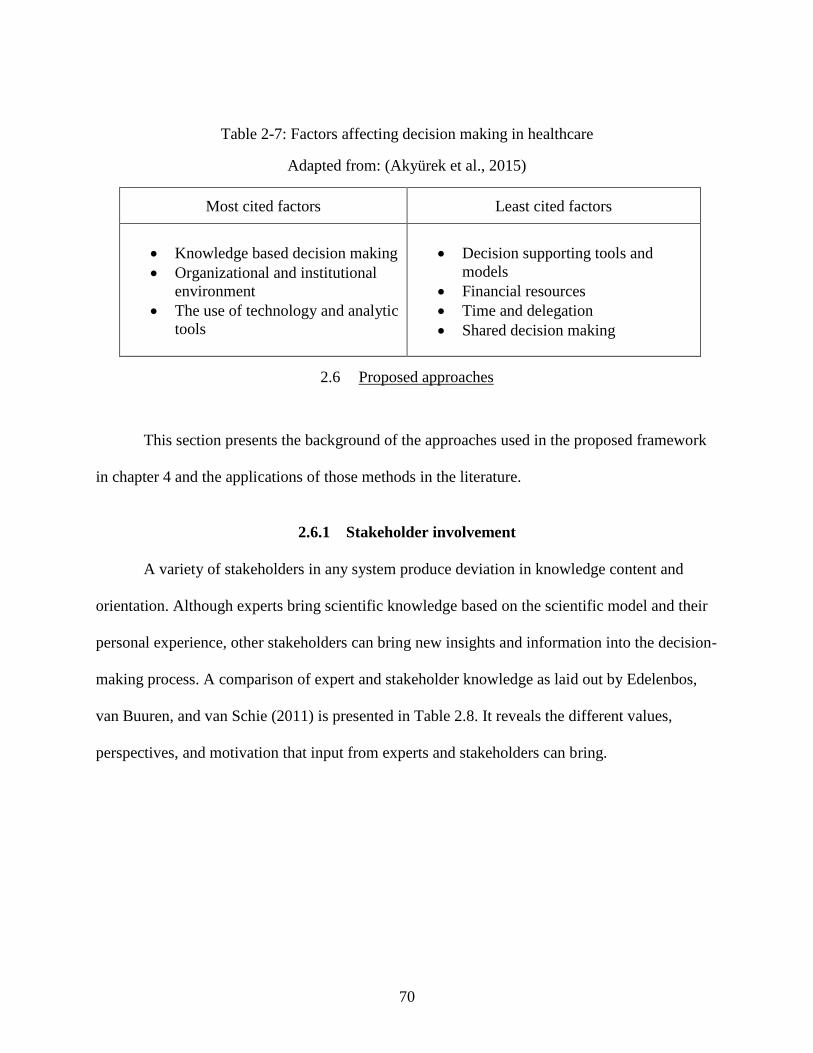
70
Table 2-7: Factors affecting decision making in healthcare
Adapted from: (Akyürek et al., 2015)
Most cited factors Least cited factors
• Knowledge based decision making
• Organizational and institutional
environment
• The use of technology and analytic
tools
• Decision supporting tools and
models
• Financial resources
• Time and delegation
• Shared decision making
2.6 Proposed approaches
This section presents the background of the approaches used in the proposed framework
in chapter 4 and the applications of those methods in the literature.
2.6.1 Stakeholder involvement
A variety of stakeholders in any system produce deviation in knowledge content and
orientation. Although experts bring scientific knowledge based on the scientific model and their
personal experience, other stakeholders can bring new insights and information into the decision-
making process. A comparison of expert and stakeholder knowledge as laid out by Edelenbos,
van Buuren, and van Schie (2011) is presented in Table 2.8. It reveals the different values,
perspectives, and motivation that input from experts and stakeholders can bring.
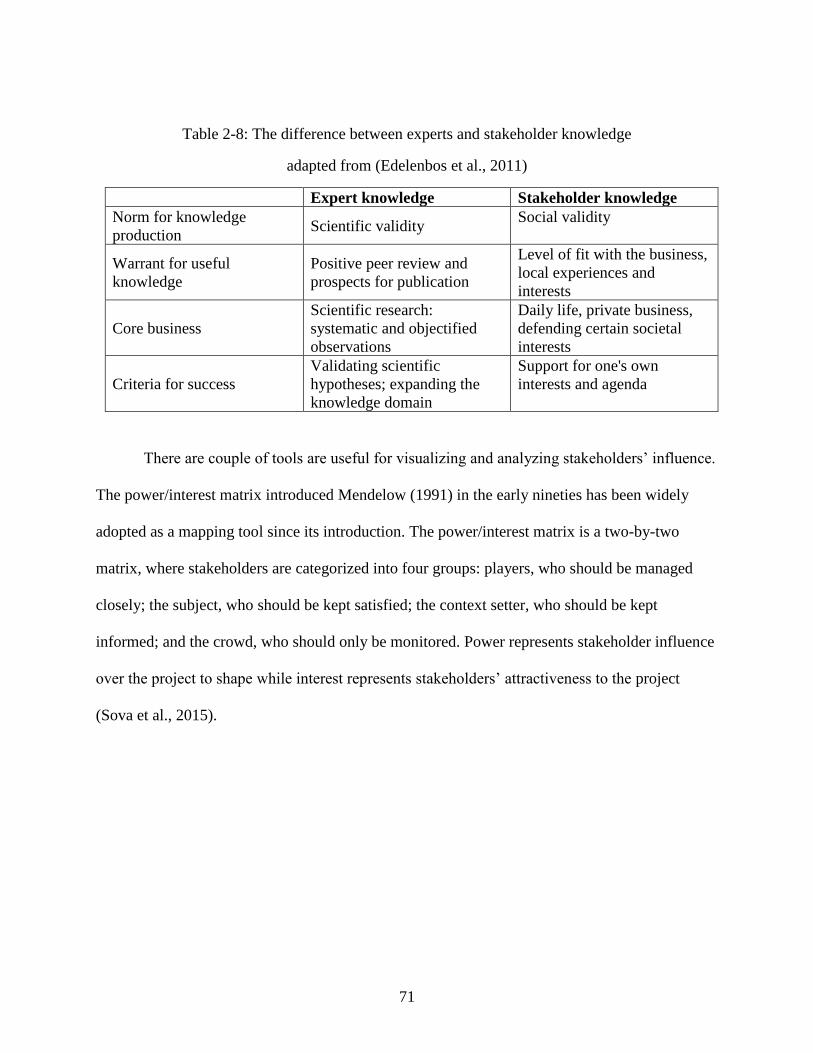
71
Table 2-8: The difference between experts and stakeholder knowledge
adapted from (Edelenbos et al., 2011)
Expert knowledge Stakeholder knowledge
Norm for knowledge
production Scientific validity
Social validity
Warrant for useful
knowledge
Positive peer review and
prospects for publication
Level of fit with the business,
local experiences and
interests
Core business
Scientific research:
systematic and objectified
observations
Daily life, private business,
defending certain societal
interests
Criteria for success
Validating scientific
hypotheses; expanding the
knowledge domain
Support for one's own
interests and agenda
There are couple of tools are useful for visualizing and analyzing stakeholders’ influence.
The power/interest matrix introduced Mendelow (1991) in the early nineties has been widely
adopted as a mapping tool since its introduction. The power/interest matrix is a two-by-two
matrix, where stakeholders are categorized into four groups: players, who should be managed
closely; the subject, who should be kept satisfied; the context setter, who should be kept
informed; and the crowd, who should only be monitored. Power represents stakeholder influence
over the project to shape while interest represents stakeholders’ attractiveness to the project
(Sova et al., 2015).
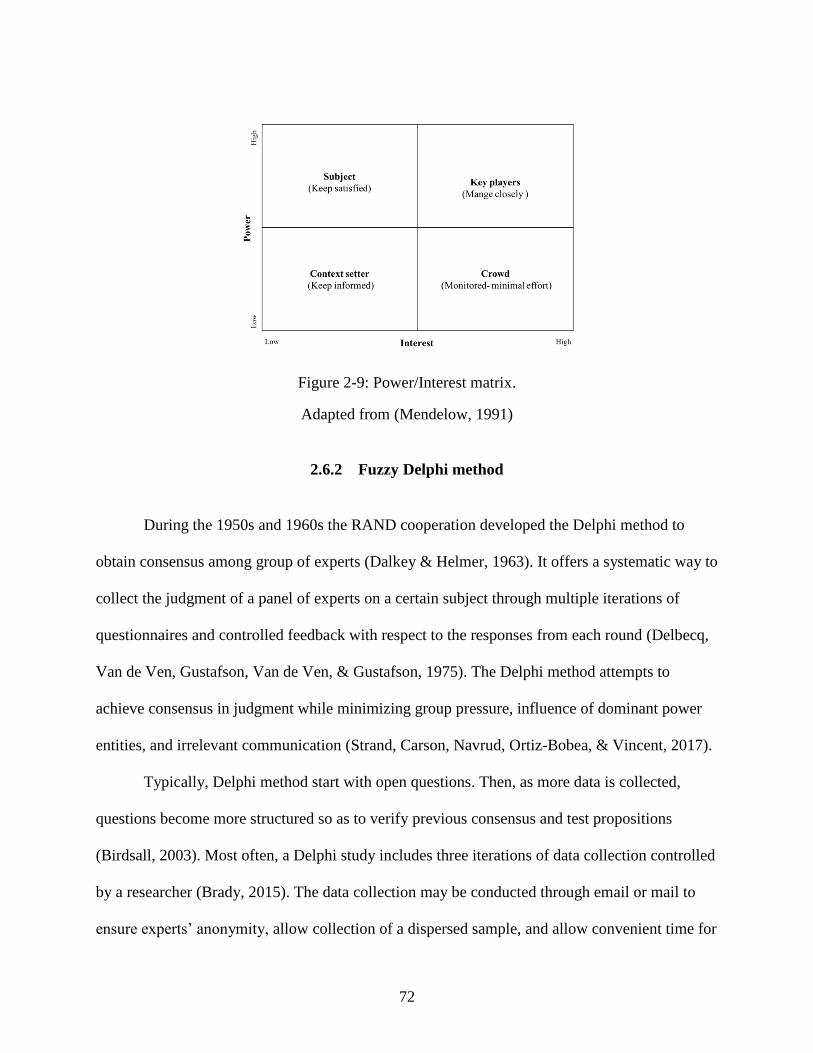
72
Figure 2-9: Power/Interest matrix.
Adapted from (Mendelow, 1991)
2.6.2 Fuzzy Delphi method
During the 1950s and 1960s the RAND cooperation developed the Delphi method to
obtain consensus among group of experts (Dalkey & Helmer, 1963). It offers a systematic way to
collect the judgment of a panel of experts on a certain subject through multiple iterations of
questionnaires and controlled feedback with respect to the responses from each round (Delbecq,
Van de Ven, Gustafson, Van de Ven, & Gustafson, 1975). The Delphi method attempts to
achieve consensus in judgment while minimizing group pressure, influence of dominant power
entities, and irrelevant communication (Strand, Carson, Navrud, Ortiz-Bobea, & Vincent, 2017).
Typically, Delphi method start with open questions. Then, as more data is collected,
questions become more structured so as to verify previous consensus and test propositions
(Birdsall, 2003). Most often, a Delphi study includes three iterations of data collection controlled
by a researcher (Brady, 2015). The data collection may be conducted through email or mail to
ensure experts’ anonymity, allow collection of a dispersed sample, and allow convenient time for
73
response (Cavana, Delahaye, & Sekaran, 2001). After each iteration, researchers analyze the
responses and provide feedback to the participants (Birdsall, 2003; Dalkey & Helmer, 1963).
Additional iteration is sometimes required if consensus has not been reached (Brady, 2015).
The Delphi method has a wide variety of applications in various fields. For example,
Feiming Chen and Yuqing Liu (2016) investigated the key risk factors in developing mobile e-
commerce in China using eDelphi methods. Henderson, Johnson, and Moodie (2016) developed
a conceptual framework of parent-to-parent support for parents raising a child with hearing
problems. The scholars employed Delphi method to obtain stakeholders’ opinions and feedback
and achieve consensus on the framework components. Strand et al. (2017) applied the Delphi
method as a tool for environmental valuation. In the study, more than 200 experts from 37
countries participated to estimate the willingness-to-pay value per each country to protect the
Amazon rainforest.
Ishikawa et al. (1993) proposed the Fuzzy Delphi Method (FDM) by deriving the method
from fuzzy set theory and the conventional Delphi technique. Although the Delphi method is an
effective method for capturing expert opinion, Ishikawa et al. (1993) indicated that to reach
acceptable consensus level it may take several repetitive surveys, which probably will reduce the
response rate and increase survey cost and time. The researchers suggested integrating a fuzzy
set with the conventional Delphi Method to resolve the fuzziness of common understanding,
based on expert judgements (Noorderhaben, 1995), thereby reducing the number of surveys
rounds required. This makes the process more time- and cost-effective (Ishikawa et al., 1993;
Kuo & Chen, 2008), as the process can handle multi-level and multi-solution decision problems
and perform simple calculations (Kuo & Chen, 2008).
74
Since FDM’s introduction, various scholars have evolved the technique and utilized it in
different applications. For example, Kuo and Chen (2008) obtained the key performance
indicators for service industry mobility in Taiwan through applying FDM. Hsu, Lee, and Kreng
(2010) established a systematic approach to selecting among proposed technologies. These
scholars employed FDM to identify critical factors to selecting among different waste lubricant
recycling technologies by interviewing experts in the field. Tahriri, Mousavi, Haghighi, and
Dawal (2014) developed a conceptual framework for an effective supplier selection process. Gil-
Lafuente, Merigó, and Vizuete (2014) applied the FDM to understand the luxury resort hotel
industry in Taiwan and Macao and build an assessment system. The FDM enabled these scholars
to obtain the importance of each evaluation criteria based on a group decision.
The literature demonstrates that there are different approaches used in FDM to aggregate
experts’ knowledge, execute deffuzzification, and reach a consensus. Those approaches depend
on the application and the researcher’s objectives (Habibi, Jahantigh, & Sarafrazi, 2015).
2.6.3 Fuzzy logic
Dr. Zadeh introduced the fuzzy set concepts in the mid-1960s as a way to consider
classes with uncertain boundaries. Fuzzy logic was derived from fuzzy set theory (Zadeh, 1965).
Unlike classical methods, which use binary variables for evaluation, the fuzzy logic approach
combines linguistic variables with numerical data to enhance the interaction between human and
computers while accounting for uncertainty in judgment (Mehralian et al., 2016; Velasquez &
Hester, 2013). The advantage of using fuzzy logic is the ability to take linguistic variables, which
are vague and difficult to interpret, and convert them to numerical data. This capability enables
researchers to create a mathematical model based on human subjective judgment (Fuli, Yandong,
75
Yun, Xu, & Lin, 2016).
Typical fuzzy interface system architecture is comprised of four main modules: a
fuzzifier, an inference engine, a fuzzy knowledge base, and a defuzzifier. Figure 2-10 illustrates
fuzzy inference architecture and its main components (Shin & Xu, 2009).
Figure 2-10: Typical architecture of Fuzzy Inference System
Sources: (Shin & Xu, 2009).
Crisp input (numerical data) is fed into the first component of the system, the fuzzifier,
which translates the numerical data (crisp) into a fuzzy value. Fuzzy values are characterized by
linguistic variables, like “very low”, “low”, “moderate”, “high”, “very high” and so on. Each of
these linguistic terms has a certain level associated with the membership function. The
membership function implies the degree of certainty that an element belongs to a fuzzy set. Most
often, the membership function has the shape of a triangle, trapezoid or Gaussian function
(Shang & Hossen, 2013). The fuzzy inference engine, the second component in the system, then
maps the fuzzy input into fuzzy output based on the rules stored in the knowledge base. A fuzzy
knowledge base is basically a database that contains rules to establish the relationship between
different variables (Shin & Xu, 2009). In general, the rules are expressed using either a Mamdani
76
model or a Takagi-Sugeno model (Dodangeh et al., 2011). Lastly, the defuzzifier converts the
fuzzy output into crisp output using the same membership function used in the fuzzifier (Shin &
Xu, 2009). There are various techniques for defuzzification, such as centroid-based Euclidean
distance, left and right fuzzy ranking, bisector of an area, and mean of maximum (Fuli et al.,
2016).
Because fuzzy logic can be used to represent human judgments, , it enjoys widespread
use in many industries and contexts. For example, in their recent work Danladi, Puwu, Michael,
and Garkida (2016) utilized fuzzy logic to build a load forecasting guide for electrical power
generation, transmission, and distribution to investigate the parameter impact on electrical load.
In another recent work, Ahmed, Elkhatib, Adly, and Ragai (2016) proposed using fuzzy logic to
improve the detection algorithm of wireless sensor network accuracy in sensitive facilities.
Fuzzy logic is commonly used to enhance the selection process in diverse situations. Al-
Hawari, Khrais, Al-Araidah, and Al-Dwairi (2011) proposed using fuzzy logic to select scanner
among different model of laser scanners. The fuzzy set and fuzzy rules were used to convert
linguistic experts’ opinions into assessment ratings to reduce the effect of bias and subjective
judgments. Khrais, Al-Hawari, and Al-Araidah (2011) also used fuzzy logic to select the best
prototyping techniques for use in prototype production, where the highest overall efficiency is
based on both static and dynamic factors. In an enterprise setting, Zandi and Tavana (2012)
introduced a novel fuzzy group multi-criteria model to evaluate and select among different
enterprise architectures to capture multiple decision makers’ intuitive preferences.
In the healthcare domain, Idowu, Ajibola, Balogun, and Ogunlade (2015) developed a
77
fuzzy logic model to monitor heart failure risk through assessing risk indicators using patients
assessment. In breast cancer research, a fuzzy logic-based model was developed in breast cancer
patient management to identify the gene and validate its signatures to allow personalized
medicine (Kempowsky-Hamon et al., 2015). In the context of healthcare management, Pan
(2011) studied the patients’ perceived values to enhance patients’ satisfaction and loyalty. The
researchers developed a fuzzy logic-based model to capture the patients’ perceptions toward the
hospital. The model discovered that patients’ top values are quality of provided care and
physician competence.
2.6.4 Fuzzy VIKOR
Fuzzy VIKOR is the integration between traditional VIKOR and Fuzzy set. The
traditional VIKOR is an MCDM technique. It stands for VlseKriterijumska Optimizacija I Kom-
promisno Resenje in the Serbian language, which means multiple criteria optimization
(Babashamsi, Golzadfar, Yusoff, Ceylan, & Nor, 2016). Real problems are often characterized
by non-commensurable and conflicting criteria and there a possibility that no solution can satisfy
all the criteria at once (Yang, Shieh, & Tzeng, 2013). Thus, Serafim Opricovic in 1998
developed VIKOR to take decisions associated with non-commensurable and conflicting criteria
problems in a discrete environment to find compromise solutions and derive a compromise
ranking list based on closeness to the ideal solution (Opricovic, 1998).
The steps of the Fuzzy VIKOR method are described below (Zhu, Hu, Qi, Gu, & Peng,
2015).
Step 1: Find the best ideal solution fi* and worst solution fi
− values of all criterion function, where
i = 1,2,3…n.
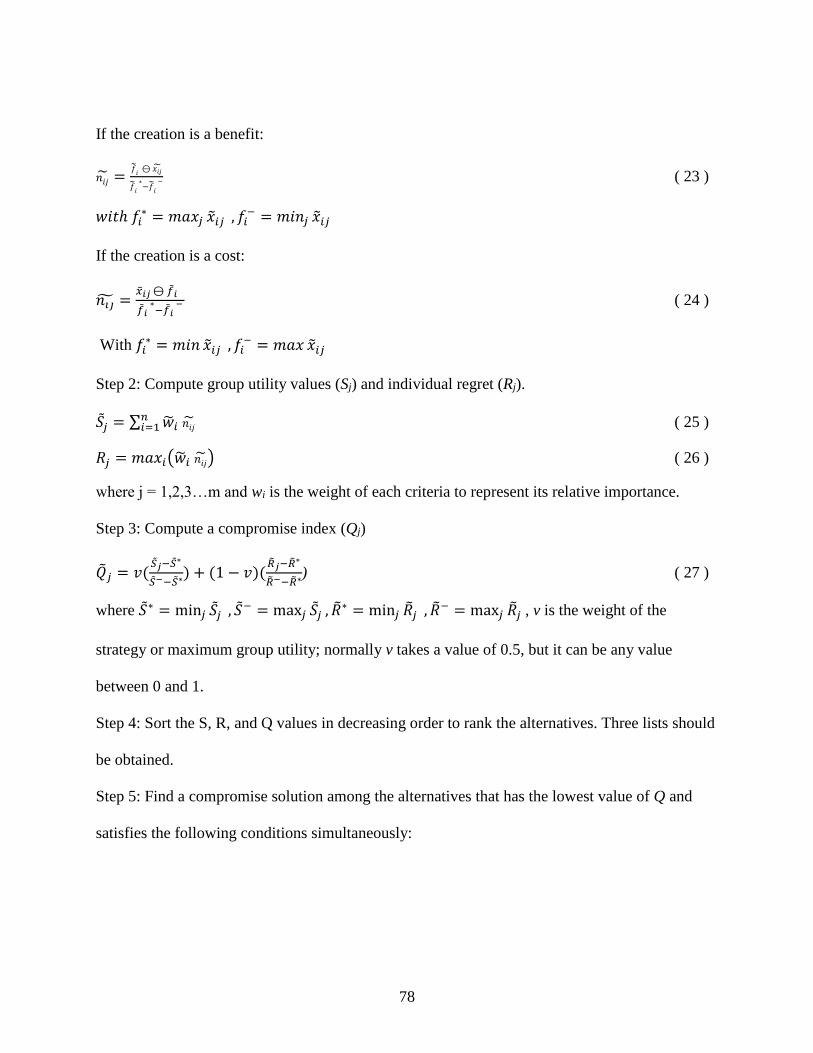
78
If the creation is a benefit:
𝑛𝑖�� =��𝑖 ⊖ 𝑥𝑖��
��𝑖
∗−��
𝑖
− ( 23 )
𝑤𝑖𝑡ℎ 𝑓𝑖∗ = 𝑚𝑎𝑥𝑗 ��𝑖𝑗
, 𝑓𝑖− = 𝑚𝑖𝑛𝑗 ��𝑖𝑗
If the creation is a cost:
𝑛𝑖�� =��𝑖𝑗 ⊖ ��𝑖
��𝑖 ∗−��𝑖
− ( 24 )
With 𝑓𝑖∗ = 𝑚𝑖𝑛 ��𝑖𝑗
, 𝑓𝑖− = 𝑚𝑎𝑥 ��𝑖𝑗
Step 2: Compute group utility values (Sj) and individual regret (Rj).
��𝑗 = ∑ ��𝑖 𝑛𝑖��
𝑛𝑖=1 ( 25 )
𝑅𝑗 = 𝑚𝑎𝑥𝑖(��𝑖 𝑛𝑖��) ( 26 )
where j = 1,2,3…m and wi is the weight of each criteria to represent its relative importance.
Step 3: Compute a compromise index (Qj)
��𝑗 = 𝑣(��𝑗−��
∗
��−−��∗) + (1 − 𝑣)(
��𝑗−��∗
��−−��∗) ( 27 )
where �� ∗ = min𝑗 ��𝑗
, �� − = max𝑗 ��𝑗
, �� ∗ = min𝑗 ��𝑗
, �� − = max𝑗 ��𝑗
, v is the weight of the
strategy or maximum group utility; normally v takes a value of 0.5, but it can be any value
between 0 and 1.
Step 4: Sort the S, R, and Q values in decreasing order to rank the alternatives. Three lists should
be obtained.
Step 5: Find a compromise solution among the alternatives that has the lowest value of Q and
satisfies the following conditions simultaneously:
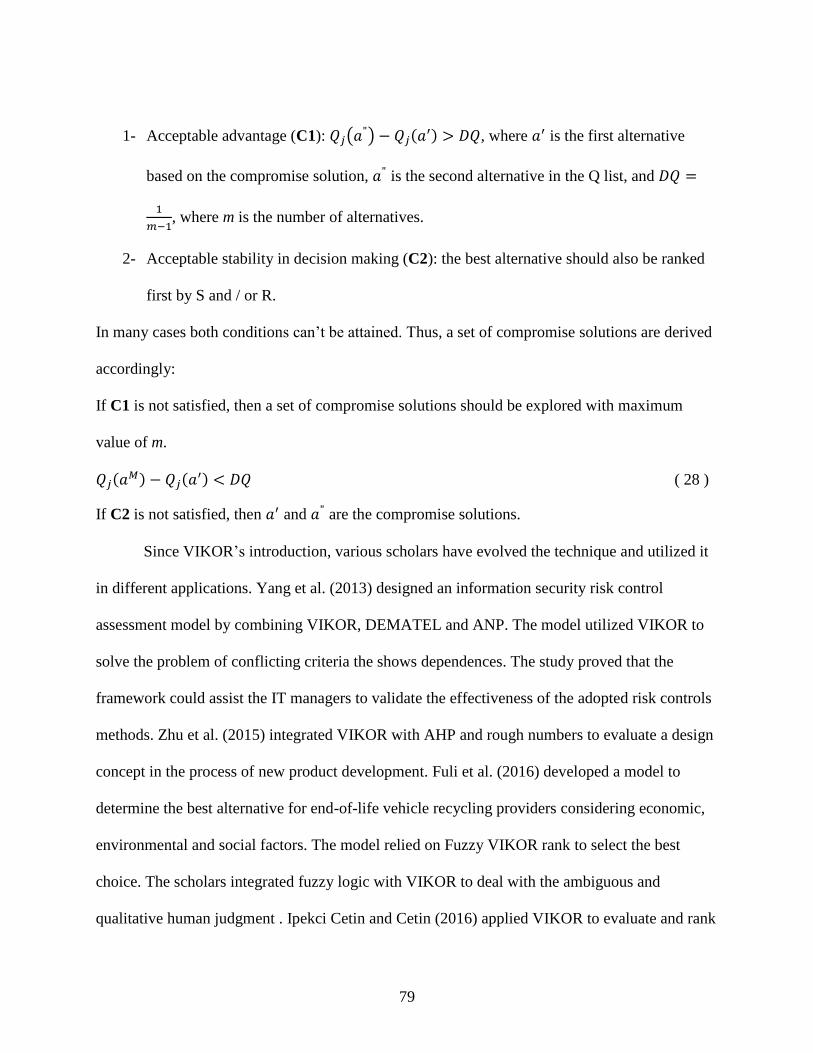
79
1- Acceptable advantage (C1): 𝑄𝑗(𝑎") − 𝑄𝑗(𝑎
′) > 𝐷𝑄, where 𝑎′ is the first alternative
based on the compromise solution, 𝑎" is the second alternative in the Q list, and 𝐷𝑄 =
1
𝑚−1, where m is the number of alternatives.
2- Acceptable stability in decision making (C2): the best alternative should also be ranked
first by S and / or R.
In many cases both conditions can’t be attained. Thus, a set of compromise solutions are derived
accordingly:
If C1 is not satisfied, then a set of compromise solutions should be explored with maximum
value of m.
𝑄𝑗(𝑎𝑀) − 𝑄𝑗(𝑎
′) < 𝐷𝑄 ( 28 )
If C2 is not satisfied, then 𝑎′ and 𝑎" are the compromise solutions.
Since VIKOR’s introduction, various scholars have evolved the technique and utilized it
in different applications. Yang et al. (2013) designed an information security risk control
assessment model by combining VIKOR, DEMATEL and ANP. The model utilized VIKOR to
solve the problem of conflicting criteria the shows dependences. The study proved that the
framework could assist the IT managers to validate the effectiveness of the adopted risk controls
methods. Zhu et al. (2015) integrated VIKOR with AHP and rough numbers to evaluate a design
concept in the process of new product development. Fuli et al. (2016) developed a model to
determine the best alternative for end-of-life vehicle recycling providers considering economic,
environmental and social factors. The model relied on Fuzzy VIKOR rank to select the best
choice. The scholars integrated fuzzy logic with VIKOR to deal with the ambiguous and
qualitative human judgment . Ipekci Cetin and Cetin (2016) applied VIKOR to evaluate and rank
80
the European Union and candidate countries with respect to women’s education and
employment.
In the literature, VIKOR is frequently compared to TOPSIS (Hacioglu & Dincer, 2015;
Opricovic & Tzeng, 2004; Tzeng & Huang, 2011) which is another method of multi-criteria
optimization. However, the comparisons reveal that both techniques have different approaches in
the normalization and aggregation functions (Babashamsi et al., 2016; Tzeng & Huang, 2011).
As stated before in this chapter, TOPSIS solutions should be the closest to the best alternative
and the farthest from the worst alternative. However, this calculation doesn’t consider the
importance of the distances (Lai et al., 1994). In contrast, VIKOR introduces an aggregation
function to represent the distance from the ideal solution. It aggregates the criteria and relative
importance of the criteria and finds the balance between individual and total satisfaction (Tzeng
& Huang, 2011). Also, Babashamsi et al. (2016) believed that TOPSIS is more suitable for a
risk-averse decision maker.
2.7 Literature review summary
In review, this chapter presents a view of the literature conducted by other researchers
directly related to the area of study. It introduces the definitions of Total Quality Management
(TQM), its promising benefits, and the factors necessary for successful TQM implementation. It
then discusses business excellence models and the global trend to move from TQM to business
excellence. The chapter examines topics like project prioritization and its impact and presents
findings from previous studies regarding prioritizing improvement project techniques. In
addition, the literature review presents in detail the available models to prioritize improvement
opportunities in the context of BEMs in different industries and compares their approaches. The
81
review also discusses the processes involved in quality improvement, decision making, and
business excellence models in healthcare. The chapter ends by reviewing Delphi methods, the
fuzzy logic system and VIKOR and their application in the literature.
2.8 Research Gap analysis
Five existing models were developed by Dodangeh et al. (2011); Dodangeh and Yusuff
(2011); Ezzabadi et al. (2015); Herat et al. (2012); Mariscal et al. (2012) to prioritize
performance excellence model areas for improvement
In the Dodangeh and Yusuff (2011) model, the scholars used MADM and the TOPSIS
technique to prioritize BEM areas for improvement. The scholars defined four general criteria:
improvement importance, cost, time, and the gap between the current and ideal score. Internal
experts evaluated the area for improvements based on the four criteria, which were determined
by internal self-assessment. Dodangeh et al. (2011) repeated the the previous methodology again
and change the used technique to Fuzzy MCDM (See Table 2-9). The research results
contracdicted those of Dodangeh and Yusuff (2011) and the new study concluded that it is
necessary to develop other models to priotrize area of improvements and compare thier
efficiency. Mariscal et al. (2012), in their model of assessing the safety culture in the nuclear
indsutry, used RADAR matrix scores as a reference for prioritizing future actions. Ezzabadi,
Saryazdi, and Mostafaeipour (2015) prioritized sub-criteria using a hybrid technique of AHP and
Operations Research. The scholars selected experts and developed questionairres to compare
criteria and sub-criteria.
Despite the extensive interest in performance excellence in healthcare, the literature
shows that the Herat et al. (2012) model is the only model available to prioritize performance
82
excellence areas for improvements in the healthcare setting. However, this model has some
drawbacks. It does not include the stakeholders’ preferences in decision-making, mainly relying
on the opinions of experts and focus groups. Also, it does not consider the subjective judgment
and uncertainty that exists in the process of decision-making. Consequently, there is a lack of a
standard or a tool to prioritize areas of improvement in healthcare in the context of business
excellence that can consider the perspective of different stakeholders such as patients, or the
input of internal members as well as experts.
Several reports around the globe have emphasized the importance of engaging different
stakeholders in quality improvement initiatives and incorporating their preferences to improve
the healthcare efficiency and outcomes. In 2006, the annual WHO report highlighted the
importance of determining who the relevant stakeholders are in healthcare and how they will be
involved in quality improvement projects. Mühlbacher and Kaczynski (2016) linked healthcare
improvement success to optimal decisions and considering different stakeholders’ preferences.
Vahdat, Hamzehgardeshi, Hessam, and Hamzehgardeshi (2014) illustrated the necessity of
including patients’ views of healthcare system improvements. At the same time, the literature
shows a decent willingness from healthcare stakeholders to be involved in healthcare priority-
setting. In a study conducted by Wiseman, Mooney, Berry, and Tang (2003) in Australia about
public involvement in healthcare priority-setting, 80% of participants’ supported the usage of
public preferences in healthcare priority-setting. Litva et al. (2002) conducted a similar study in
England; results showed a strong desire on the part of healthcare users to be involved in resource
allocation and service areas decision making. Regardless of this trend of support from the public,
the literature reveals that actual stakeholder involvement in healthcare decision making is limited
83
(Gallego, Taylor, & Brien, 2011) and that there is a scarcity of formal evaluation of their
involvement (RAND, 2010).
Accordingly, with the increased pressure to achieve excellence in healthcare and the
growing demand to meet government regulations, insurance company requirements, and
accreditation body requirements and to provide effective patient services as well (Hochenedel &
Kleiner, 2016), it is crucial to incorporate different stakeholders’ preferences in improvement
initiatives. Given the limited resources, time, and money in the healthcare context, it is
impossible to implement all improvements simultaneously. Thus, there is a need to develop a
framework to prioritize areas for improvement in the context of BEMs and consider different
stakeholders’ preferences when setting priorities.
Considering different stakeholders’ perspectives in addition to expert judgments could
yield more favorable and efficient outcomes. Nevertheless, it most probably would bring in
conflict criteria due to the different interests and perspectives they would add to the process.
Also, each healthcare system’s particular characteristics differ from country to country and from
one healthcare system to another (Kanji & Moura e Sá, 2003), and there are no universal criteria
to prioritize healthcare problems (De Belvis et al., 2014). Thus, a framework is needed that can
handle the special characteristics of the healthcare environment.
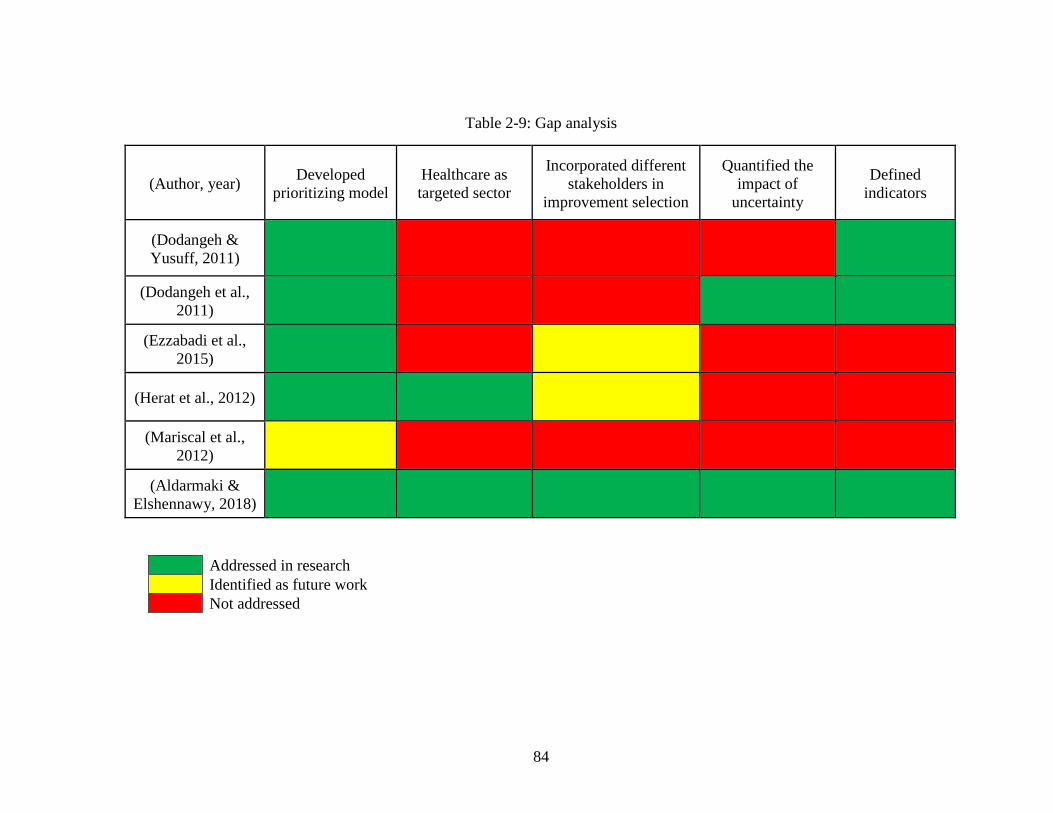
84
Table 2-9: Gap analysis
(Author, year) Developed
prioritizing model
Healthcare as
targeted sector
Incorporated different
stakeholders in
improvement selection
Quantified the
impact of
uncertainty
Defined
indicators
(Dodangeh &
Yusuff, 2011)
(Dodangeh et al.,
2011)
(Ezzabadi et al.,
2015)
(Herat et al., 2012)
(Mariscal et al.,
2012)
(Aldarmaki &
Elshennawy, 2018)
Addressed in research
Identified as future work
Not addressed
85
CHAPTER 3: RESEARCH METHODOLOGY
3.1 Introduction
The aim of research methodology in scientific research is to map out the process that will
be applied to achieve the research objectives. It is a systematic planning for conducting the
research. It details all research stages, from problem identification to framework development
and validation. This chapter describes the research methodology which will be implemented in
this dissertation in order to achieve the intended contribution in the area of study.
3.2 Research Methodology
The research originated with the concerns about the process following business
performance assessment and actions taken after receiving feedback reports, especially about
dealing with the system’s weaknesses and defining improvement plans. Then, the focus was
narrowed down to a specific industry, the healthcare system, as it has experienced a dramatic
transformation in recent years and shows great interest in adopting a BEMs. Moreover, because
the complexity of the healthcare system increases the impact of quality improvement decisions
both horizontally and vertically, selecting the appropriate improvement plan is crucial. Review of
a variety of peer-reviewed articles and technical reports revealing the drawbacks of famous
business performance models to providing guidelines to prioritize quality improvement
initiatives also contributed to the development of this study’s focus.
Once the focus of the study was a bit sharper, an intensive review of literature on the
86
general topic as well as to find the current efforts was conducted to identify any gaps within the
context of the research area to identify the shortcomings and opportunities for contribution.
Relevant literature about business excellence models popularly utilized by different industries
was examined and in-depth analysis was carried out to determine the existing conceptual models
to prioritize improvement opportunities in the context of business excellence models. Literature
on business excellence and decision making in the healthcare system was also reviewed.
The literature review revealed a lack of reliability of the available models for use in
healthcare. Thus, a research gap existed in the form of development of a novel framework to
prioritize improvement initiatives in the context of business excellence in healthcare, one that
can address various factors such as different stakeholders’ perspectives, judgment uncertainty,
and scalability. Consequently, the initial idea was refined to prioritize business excellence’s
improvement initiatives in the healthcare system and bridge the gap of the previous models by
considering different healthcare stakeholders’ preferences in quality improvement initiatives.
The next phase of methodology is to identify the initial framework architecture
components. The preliminary framework architecture consists of several methods to achieve the
targeted goal, including the Fuzzy Delphi method to define the prioritization criteria, Fuzzy logic
to deal with human judgment and to prioritize the alternatives. After framework development, a
case study will be conducted to validate the proposed framework. Conclusions,
recommendations and future research will be presented depending on the results obtained. Figure
3-1 displays the in-depth process the research methodology has followed/will follow to tackle the
research problem.
87
Figure 3-1: High level research methodology
3.3 Research idea
One of the main instructions in the Baldridge feedback’s report is to:
“Prioritize your opportunities for improvement. You can’t do everything at once. Think
about what’s most important for your organization at this time and decide which things to
work on first”.
Moreover, EFQM feedback report shares the same view:
88
“We have deliberately avoided making specific recommendations on potential
approaches to secure improvement, this is outside the scope of our feedback. Neither the
EFQM nor its Assessors will provide advice or recommendation for specific actions as
result of this feedback, as we consider this your responsibility.”
Improvement plans in any organization are restricted by several factors: time, budget, resources,
and more. Hence, they can’t all be implemented at once. Several scholars have expressed doubt
about the ability of a performance excellence model to prioritize areas of improvement or
opportunities for improvement in Baldridge. Nazemi (2010) concludes his research with
“…the EFQM Excellence Model is appropriately structured to perform the identification
of area for improvement, but the model does not offer any specific guidelines on
improvement plan and result orientation.”
Dodangeh et al. (2011) included in their research that
“The current EFQM model has some drawbacks and problems which are not able to
identify the priorities in Area for Improvement for organizations with limitations of time,
budget and resources and cannot implement all the AFI, some standards or indexes and
limitations should be defined for prioritizing and choosing the Area for Improvement”.
Kirkham et al. (2014) express that
“Due to the nature of EFQM and its assessment criteria, this method does not encourage
organizations to objectively prioritize improvement activities. However, the adoption of
this initiative may cause an organization to question its methods when reviewing the
organizational performance in the self-assessment stage. It is evident that limited research
is available in relation to their ability to influence an organization to use factual and
structured methods towards the prioritization of improvement projects.”
The former quotes were the basis for starting a scientific literature review to investigate
and gain broader understanding to overcome this shortcoming and find a mechanism to optimize
selection and prioritization of improvement initiatives in the context of business excellence.
However, this is a very wide topic since various industries employ business excellence.
Healthcare was identified as the target sector due to its recent massive transformation and new
89
orientation, of which business excellence is a crucial part.
3.4 Literature review
The literature review was conducted to gain knowledge of the fundamental concepts
related to different business excellence models and enable a comparison among them. The
academic work related to project prioritization and selection, its definitions, and its financial
impact, risk avoidance, and organizational competitiveness were also examined. The literature
review shed light on the existing frameworks that have been developed to prioritize improvement
projects in the context of Business Excellence Models in detail, explore the utilized approaches,
targeted industry, entities involved in decision-making process, and compare the obtained results.
In addition, the healthcare system and its new orientation to adopt innovative approaches to
enhance the patient experience, raise market competitiveness, and increase the profit margin was
reviewed. The literature presents the academic work done to illustrate the utilization of business
excellence models in healthcare and the impact it has had on the system performance. Lastly,
factors and challenges facing the decision-making process in healthcare were reviewed. Based on
the intensive literature review and the various approaches scholars have developed to build
frameworks, a gap analysis was performed that identified the need to find a mechanism to
properly prioritize improvement initiatives of business excellence in healthcare organizations.
3.5 Gap analysis
The literature review of this study started with the simple questions: What are the
approaches available to prioritize improvement initiatives in the context of BEMs? Is there any
practical framework for use in the healthcare system? Four approaches were identified to
90
prioritize improvement initiatives in the context of BEMs in different industries (Dodangeh et
al., 2011; Dodangeh & Yusuff, 2011; Ezzabadi et al., 2015; Mariscal et al., 2012), with only one
framework having been designed for use in a healthcare system (Herat et al., 2012). In addition,
the literature review revealed that there has been a global shift to healthcare systems’
emphasizing engaging different stakeholders in quality improvement initiatives and
incorporating their preferences to improve the healthcare efficiency and outcomes. The literature
also showed a decent amount of willingness from healthcare stakeholders to be involved in
healthcare priority setting, however, actual stakeholder involvement being scarce. Hence, an
extensive review of each framework to prioritize improvement initiatives in the context of BEMs
was conducted to identify the used approaches and their validity to serve the current trend in the
healthcare system to encompass different stakeholders’ preferences in quality improvement
initiatives decision making.
Based on the initial review, the next question became: Which stakeholders’ preferences
are incorporated in selecting the quality improvement initiatives in the context of BEMs in
healthcare and how is this done? The literature showed that the available frameworks in general
relied on managers and focus group inputs without considering different stakeholders’
preferences, which could lead to failure and undesirable outcomes (Müller & Thoring, 2012).
The gap indicates that although different frameworks have been created to prioritize
improvement initiatives in the context of BEMs, none encompass different stakeholders’
preferences in selecting improvement initiatives, which might affect the accuracy and validity of
improvement ranking. According to Mühlbacher and Kaczynski (2016), it essential to consider
stakeholders’ preferences in the decision-making process to improve healthcare efficiency.
However, current research considers stakeholders involvement in decision making is limited.
91
(Gallego et al., 2011). Also, in quality improvement change it is important to determine the key
stakeholders and how they are involved (WHO, 2006). Thus, there is a need to develop an
appropriate framework that could help to prioritize improvement initiatives in the context of
BEMs in the healthcare system which takes different stakeholders’ preferences into account.
The next question is: How can we identify the indicators that are important when
evaluating alternatives? The FDM is an appropriate approach because first, it performs content
validity for the obtained indicators from the other industries and acquires additional indicators
from subject matter experts, and second, it synthesizes experts’ ratings to obtain the most critical
indicators.
The next critical questions were: What method can deal with the uncertainty and
ambiguity in human judgments? and Which methods can best prioritize quality improvement
initiatives? The literature shows that Fuzzy logic is a robust method to deal with vagueness, use
linguistics variables and convert subjective judgment into mathematical models. Fuzzy logic was
selected as a potential approach since it satisfies all the properties necessary to build the
framework, including being able to deal with subjective judgment, uses linguistic variables, has a
statistical basis, and allows scalability. Table 3-1 illustrates a comparison among potential
techniques, Fuzzy logic system is the most appropriate method to serve the objectives of this
study.
Accordingly, a hybrid method including Fuzzy Delphi and Fuzzy Interface System has
the potential to serve the objective of the research.
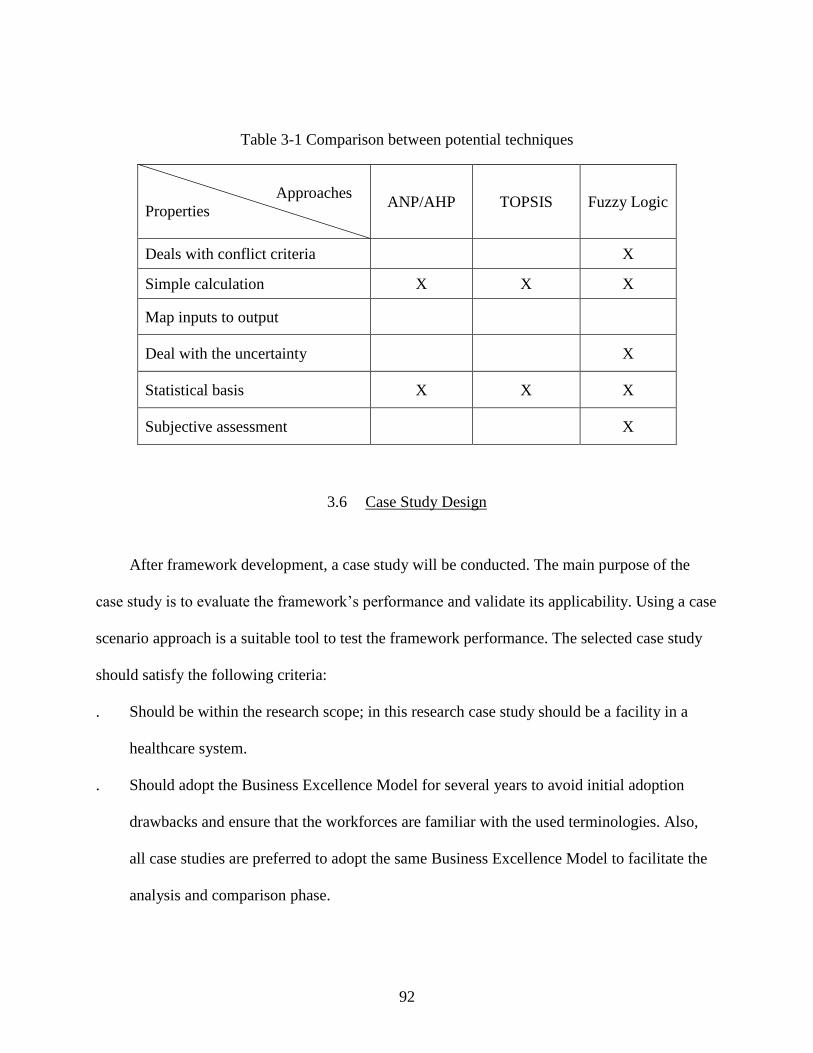
92
Table 3-1 Comparison between potential techniques
Approaches
Properties
ANP/AHP TOPSIS Fuzzy Logic
Deals with conflict criteria X
Simple calculation X X X
Map inputs to output
Deal with the uncertainty X
Statistical basis X X X
Subjective assessment X
3.6 Case Study Design
After framework development, a case study will be conducted. The main purpose of the
case study is to evaluate the framework’s performance and validate its applicability. Using a case
scenario approach is a suitable tool to test the framework performance. The selected case study
should satisfy the following criteria:
. Should be within the research scope; in this research case study should be a facility in a
healthcare system.
. Should adopt the Business Excellence Model for several years to avoid initial adoption
drawbacks and ensure that the workforces are familiar with the used terminologies. Also,
all case studies are preferred to adopt the same Business Excellence Model to facilitate the
analysis and comparison phase.
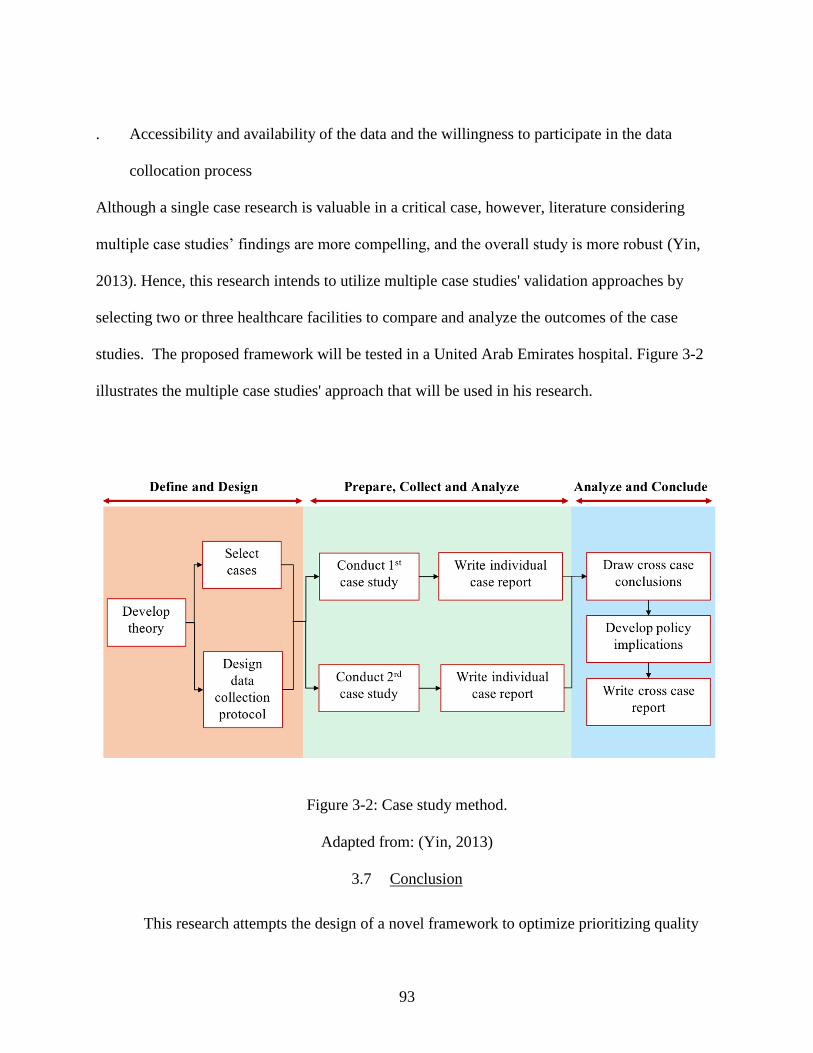
93
. Accessibility and availability of the data and the willingness to participate in the data
collocation process
Although a single case research is valuable in a critical case, however, literature considering
multiple case studies’ findings are more compelling, and the overall study is more robust (Yin,
2013). Hence, this research intends to utilize multiple case studies' validation approaches by
selecting two or three healthcare facilities to compare and analyze the outcomes of the case
studies. The proposed framework will be tested in a United Arab Emirates hospital. Figure 3-2
illustrates the multiple case studies' approach that will be used in his research.
Figure 3-2: Case study method.
Adapted from: (Yin, 2013)
3.7 Conclusion
This research attempts the design of a novel framework to optimize prioritizing quality
94
improvement initiatives in the context of a business excellence model in healthcare that takes
into consideration different stakeholders’ preferences, accounts for uncertainty, and select the
most relevant criteria for healthcare improvement initiatives. If the proposed framework achieves
an acceptable level of validity, it will enhance the decision-making process in healthcare, thereby
optimizing healthcare resources, anticipating an improvement in next result of a BEMs scores.
Moreover, it would provide future researchers with a fundamental framework in healthcare to
further build upon.
3.8 Future research
As a first research attempt to identify relevant factors to prioritizing quality improvement
initiatives in the context of a business excellence model in healthcare and engage different
stakeholders in the selection process, the proposed framework will expose new opportunities to
the subsequent researchers in the business excellence and healthcare domains. Potential future
research could focus on identifying priority factors in other healthcare settings and test the
existence of general patterns or divergence between different countries or healthcare systems.
3.9 Summary
In review, this chapter provided an overview of the proposed methodology for this study.
First, it mapped out the research flow to achieve the stated objectives. Then it described the
origins of the research idea and the intensive literature review conducted to identify the research
gap. Subsequently, a detailed gap analysis was discussed to validate the need for the study within
the context of a healthcare system. This chapter also shed light on the proposed preliminary
framework and the technical details of each component. Moreover, it described the planned

95
validation study and the method to be used to examine the framework’s accuracy. Finally,
potential future research areas were briefly discussed.
96
CHAPTER 4: FRAMEWORK DESIGN
4.1 Introduction
This chapter describes the constructed framework and expands on its components. First,
an overview of the framework is outlined to clarify the relation between its components. Then
the methods and procedures used in phase one to identify the key evaluation factors are
described, including: determining potential factors through a review of the literature review and
relevant research, the process of identifying the vital stakeholder groups, and finally using the
FDM algorithm to capture experts’ and vital stakeholders’ perceptions. The second part of this
chapter expands on the process of building the FIS scheme. First, it presents a justification of
adopting the HFS vs. the standards logic system and describes the process of defining and rating
the alternatives. Then it describes the architecture of FIS in detail, including the FIS subsystems,
inputs, outputs and relation between the various subsystems. Also, the fuzzy rules and database
development in the knowledge base is explored.
4.2 Framework outline
Based on the conducted literature review and gap analysis, a framework for prioritizing
areas of improvement in a healthcare system in the context of the business excellence model was
developed. The main objective of this research is to optimize prioritization of quality
improvement initiatives of BEMs in a healthcare organization. Such an objective can be achieved
97
through the framework proposed in Figure 4-1. This framework encompasses two different
phases. The first phase aims at selection of the key evaluation factors; this process involves
identifying potential evaluation factors and defining the vital stakeholders. The identified
potential factors are then rated using FDM. The goal of the second phase is to prioritize
improvement initiatives and obtain a priority index using a fuzzy interface system. The figure
illustrates the relationship between the phases by showing the inputs and the targeted outputs.
This framework considers different stakeholders’ preferences in addition to expert knowledge
and utilizes FDM to define the critical factors for the needs of an individual healthcare system,
which makes this framework novel. The following section elaborates on each phase’s objective,
inputs, outputs, and tools used.
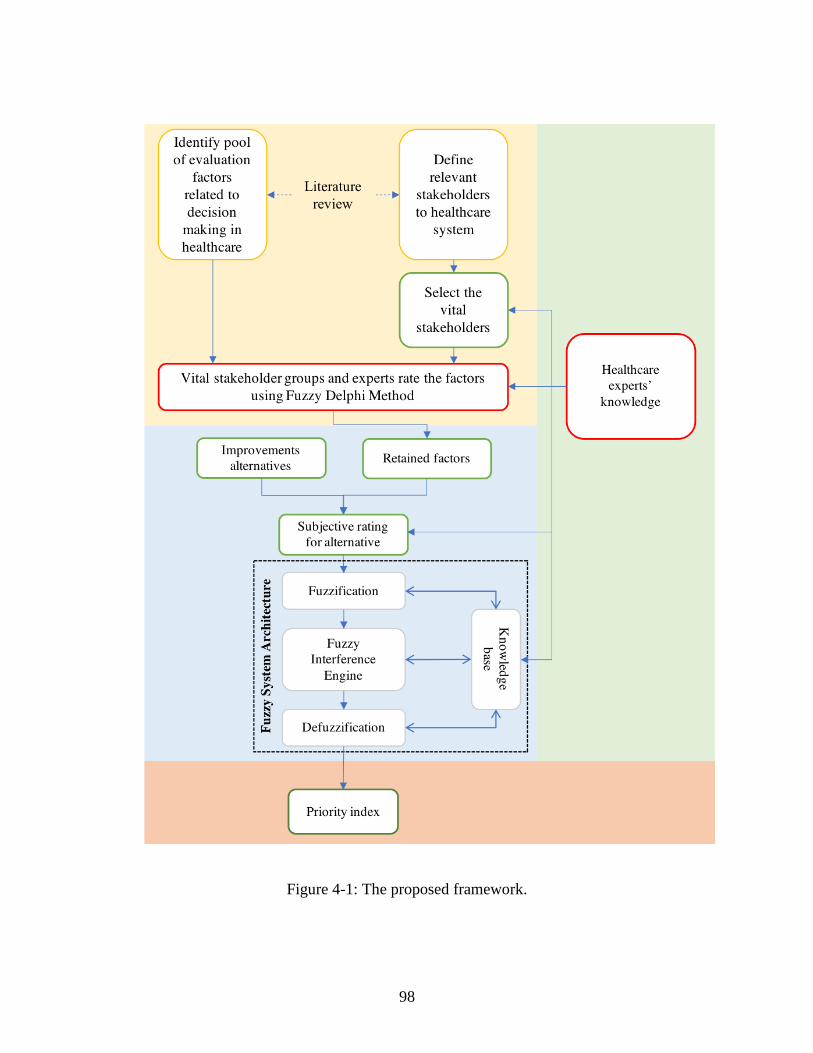
98
Figure 4-1: The proposed framework.
99
4.2.1 Phase 1: Selecting the key evaluation factors
There are various factors that can influence a healthcare system; however, a healthcare
system’s characteristics, preferences, and priorities differ from country to country and even from
one healthcare system to another (Kanji & Moura e Sá, 2003) Also, according to the literature,
there are no universal factors to prioritize healthcare problems (De Belvis et al., 2014). Hence,
the framework permits selecting the best evaluation factors to cope with the characteristics and
objectives of the healthcare system being studied.
The objective of this phase is to identify the most significant evaluation factors to
consider in healthcare for selecting improvement projects using FDM. Prior to implementing
FDM, a literature review was conducted to identify potential evaluation factors related to project
improvement. Then FDM was utilized to obtain a weight for the evaluation factors using experts’
knowledge and different stakeholders’ inputs to select the most important ones. The FDM is
mainly employed to handle the subjectivity of the human assessment. Figure 4-2 illustrates the
FDM procedure.
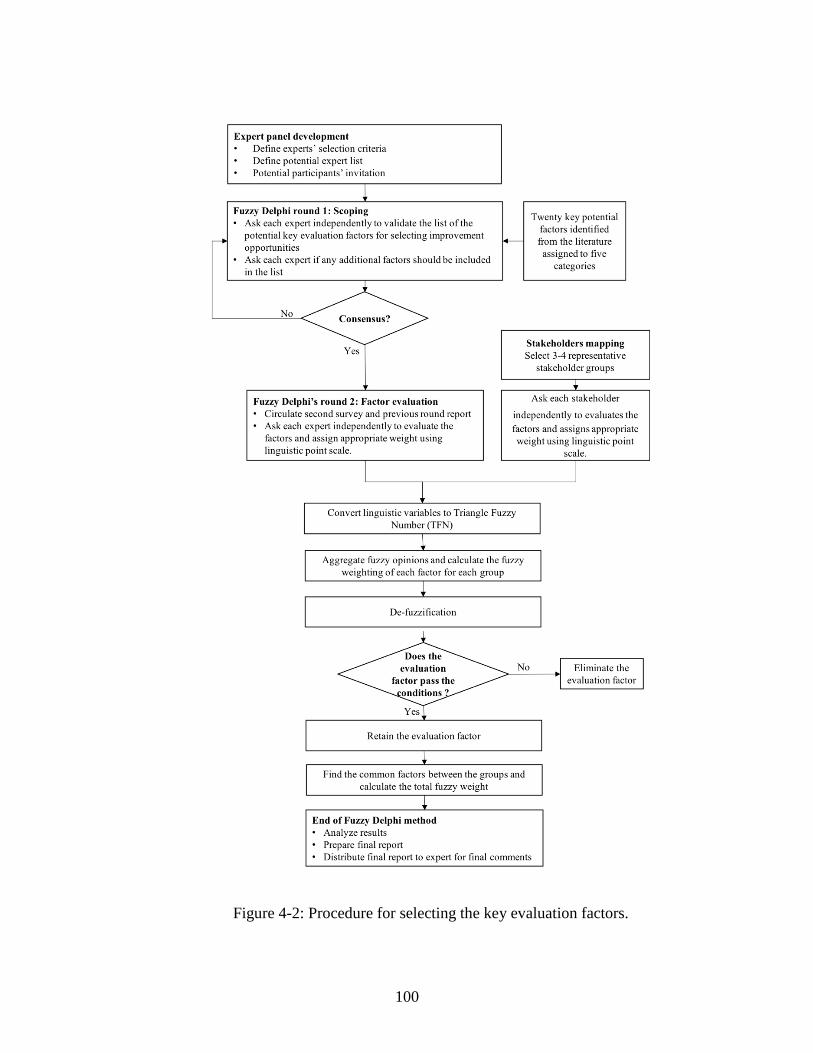
100
Figure 4-2: Procedure for selecting the key evaluation factors.
101
4.2.1.1 Determination of the improvement opportunities selection indicators
The identification of key evaluation factors for selecting improvement opportunities is
the first step in the developed framework. According to the literature review there was no known
study that identified such factors for the healthcare industry. Thus, the study surveyed the
literature to establish a list of “potential key evaluation factors for selecting improvement
opportunities” through compiling and investigating factors from other industries. Twenty
potential key factors were identified. These factors were then assigned to one of five categories:
operational feasibility, financial impact, social, strategical, and managerial, as shown Table 4-1.
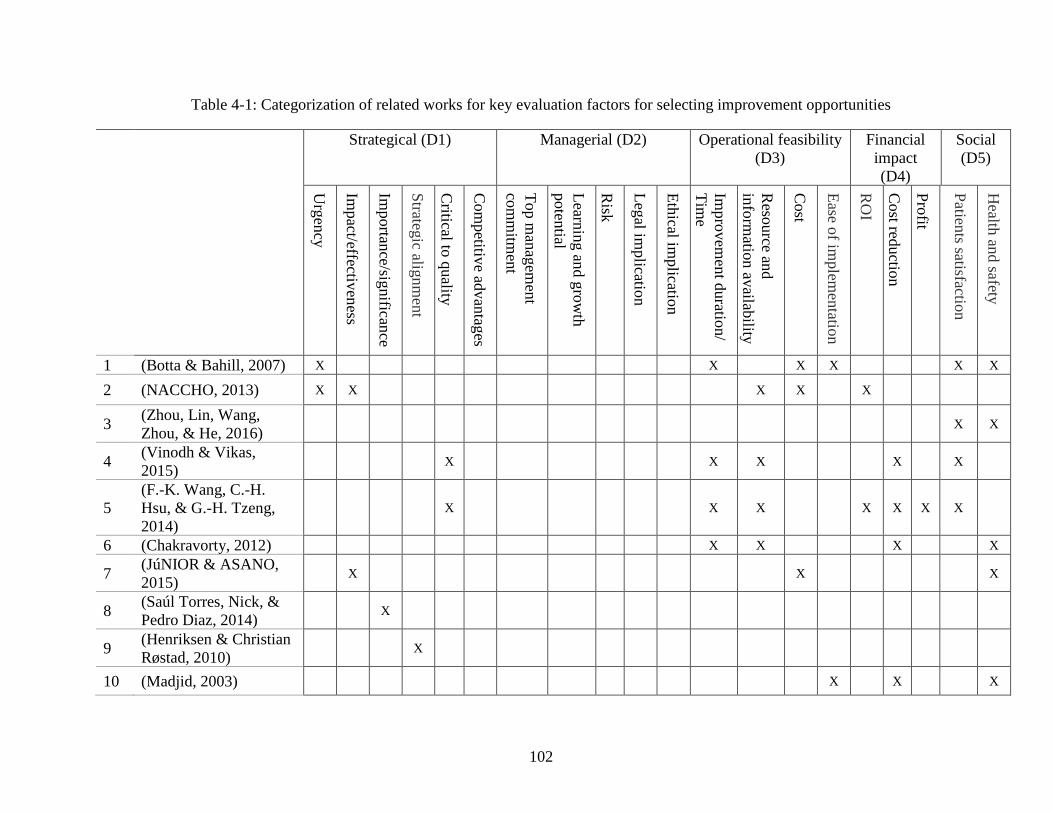
102
Table 4-1: Categorization of related works for key evaluation factors for selecting improvement opportunities
Strategical (D1) Managerial (D2) Operational feasibility
(D3)
Financial
impact
(D4)
Social
(D5)
Urg
ency
Impact/effectiv
eness
Importan
ce/significan
ce
Strateg
ic alignm
ent
Critical to
quality
Com
petitiv
e advan
tages
Top m
anag
emen
t
com
mitm
ent
Learn
ing an
d g
row
th
poten
tial
Risk
Leg
al implicatio
n
Eth
ical implicatio
n
Impro
vem
ent d
uratio
n/
Tim
e
Reso
urce an
d
info
rmatio
n av
ailability
Cost
Ease o
f implem
entatio
n
RO
I
Cost red
uctio
n
Pro
fit
Patien
ts satisfaction
Health
and safety
1 (Botta & Bahill, 2007) X X X X X X
2 (NACCHO, 2013) X X
X X X
3 (Zhou, Lin, Wang,
Zhou, & He, 2016)
X X
4 (Vinodh & Vikas,
2015) X
X X X X
5
(F.-K. Wang, C.-H.
Hsu, & G.-H. Tzeng,
2014)
X
X X X X X X
6 (Chakravorty, 2012) X X X X
7 (JúNIOR & ASANO,
2015) X
X X
8 (Saúl Torres, Nick, &
Pedro Diaz, 2014) X
9 (Henriksen & Christian
Røstad, 2010) X
10 (Madjid, 2003)
X X X
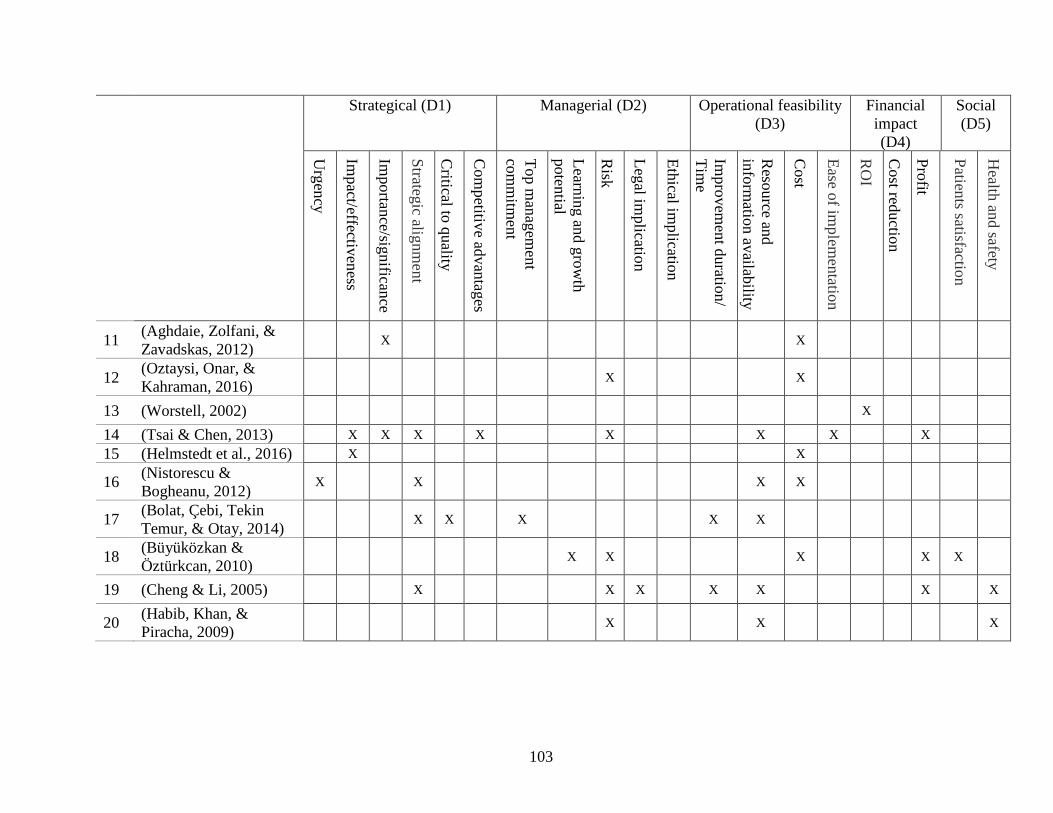
103
Strategical (D1) Managerial (D2) Operational feasibility
(D3)
Financial
impact
(D4)
Social
(D5)
Urg
ency
Impact/effectiv
eness
Importan
ce/significan
ce
Strateg
ic alignm
ent
Critical to
quality
Com
petitiv
e advan
tages
Top m
anag
emen
t
com
mitm
ent
Learn
ing an
d g
row
th
poten
tial
Risk
Leg
al implicatio
n
Eth
ical implicatio
n
Impro
vem
ent d
uratio
n/
Tim
e
Reso
urce an
d
info
rmatio
n av
ailability
Cost
Ease o
f implem
entatio
n
RO
I
Cost red
uctio
n
Pro
fit
Patien
ts satisfaction
Health
and safety
11 (Aghdaie, Zolfani, &
Zavadskas, 2012) X X
12 (Oztaysi, Onar, &
Kahraman, 2016) X X
13 (Worstell, 2002) X
14 (Tsai & Chen, 2013) X X X X X X X X
15 (Helmstedt et al., 2016) X X
16 (Nistorescu &
Bogheanu, 2012) X X X X
17 (Bolat, Çebi, Tekin
Temur, & Otay, 2014) X X X X X
18 (Büyüközkan &
Öztürkcan, 2010) X X X X X
19 (Cheng & Li, 2005) X X X X X X X
20 (Habib, Khan, &
Piracha, 2009) X X X
104
4.2.1.2 Stakeholder identification
This step aims to identify the stakeholders relevant to improvement initiatives to enable
their preferences to be incorporated into the decision making. The proposed framework attempts
to incorporate different stakeholders’ preference for priority setting by collecting the relative
importance of the selected factors from the stakeholders’ perspectives. The inclusion of
stakeholders’ perspectives is intended to enhance stakeholders’ engagement and improve
transparency throughout the decision process. The literature review defined a wide range of
stakeholders for a healthcare system in general. Among those stakeholders, only the ones related
to the improvement process will be included in the study. Thus, a stakeholder analysis was
conducted to select the vital stakeholders. Kanji and Moura e Sá (2003) was used as a basis to
identify all the possible stakeholders; nevertheless some stakeholders were merged in order to
allow the list to be applicable to all healthcare systems, no matter what the structure, as shown in
Table 4-2. Then a potential stakeholder list was sent to the top management, who were informed
of the purpose of this step and asked to evaluate each group based on two criteria: stakeholder
power (P) and necessity of stakeholder involvement (InV) (Appendix F). Stakeholder power
represents the amount of influence the stakeholder has on shaping healthcare improvement and
guiding its direction whereas necessity of stakeholder involvement denotes the level of
importance of including the stakeholder’s input in the study.
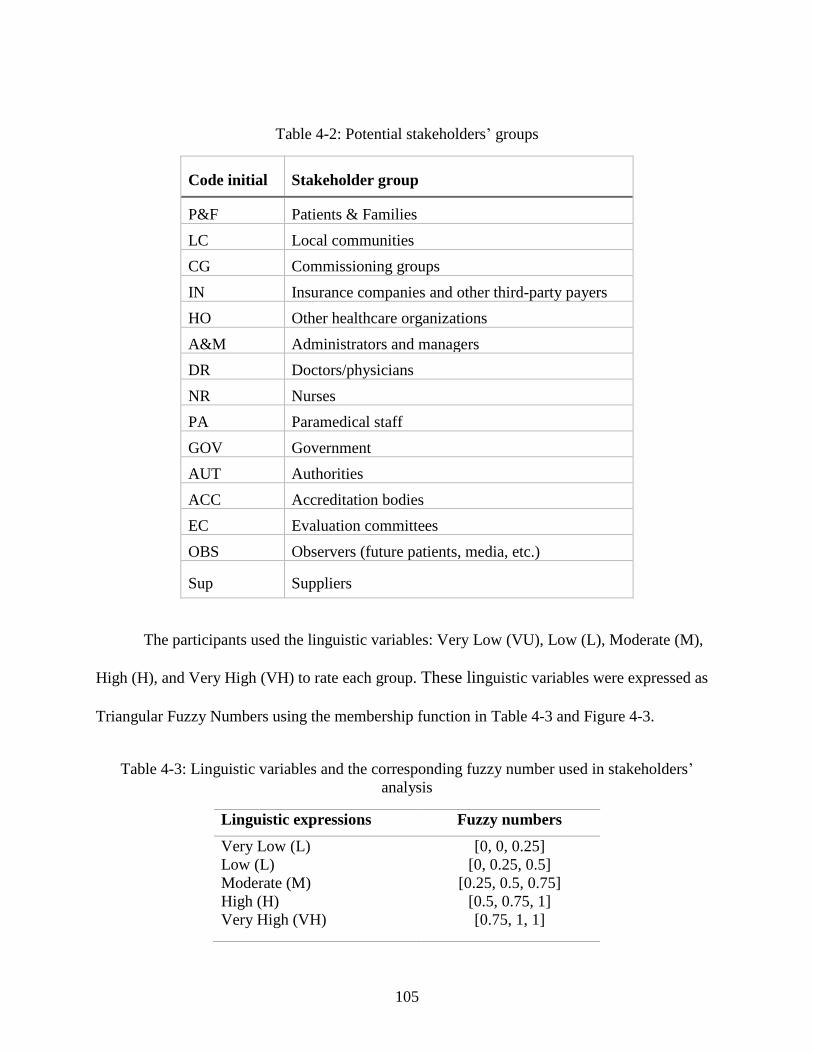
105
Table 4-2: Potential stakeholders’ groups
Code initial Stakeholder group
P&F Patients & Families
LC Local communities
CG Commissioning groups
IN Insurance companies and other third-party payers
HO Other healthcare organizations
A&M Administrators and managers
DR Doctors/physicians
NR Nurses
PA Paramedical staff
GOV Government
AUT Authorities
ACC Accreditation bodies
EC Evaluation committees
OBS Observers (future patients, media, etc.)
Sup Suppliers
The participants used the linguistic variables: Very Low (VU), Low (L), Moderate (M),
High (H), and Very High (VH) to rate each group. These linguistic variables were expressed as
Triangular Fuzzy Numbers using the membership function in Table 4-3 and Figure 4-3.
Table 4-3: Linguistic variables and the corresponding fuzzy number used in stakeholders’
analysis
Linguistic expressions Fuzzy numbers
Very Low (L)
Low (L)
Moderate (M)
High (H)
Very High (VH)
[0, 0, 0.25]
[0, 0.25, 0.5]
[0.25, 0.5, 0.75]
[0.5, 0.75, 1]
[0.75, 1, 1]
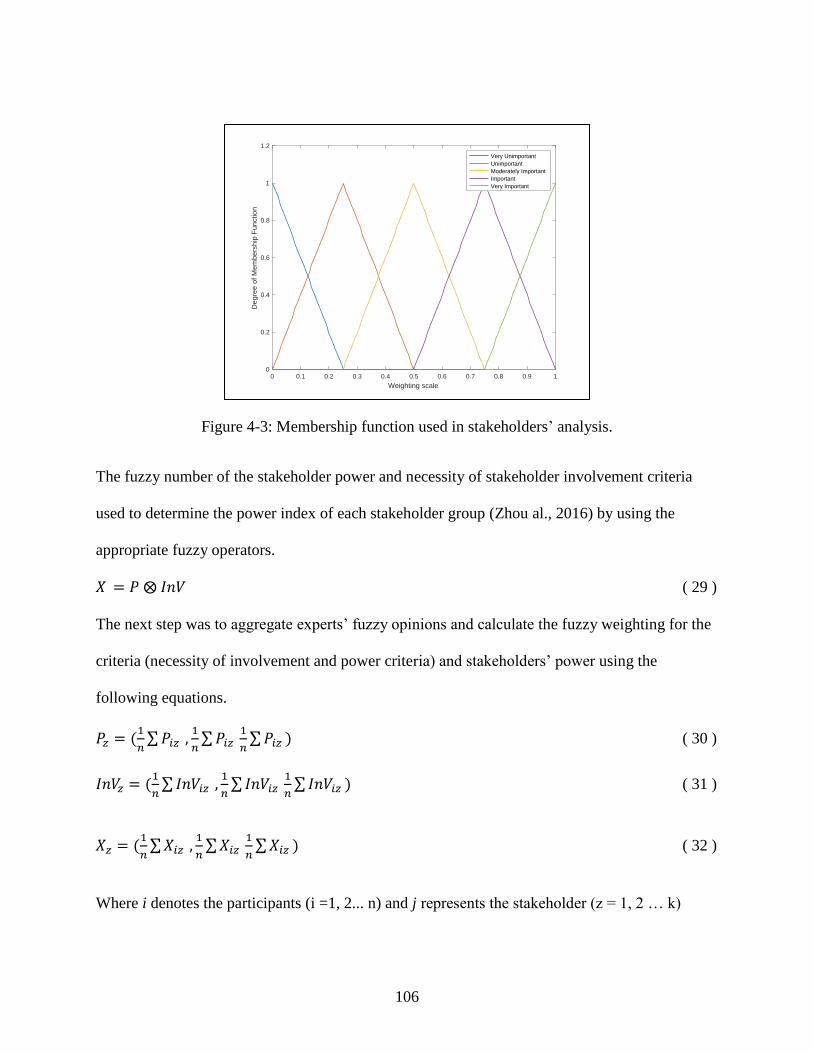
106
Figure 4-3: Membership function used in stakeholders’ analysis.
The fuzzy number of the stakeholder power and necessity of stakeholder involvement criteria
used to determine the power index of each stakeholder group (Zhou al., 2016) by using the
appropriate fuzzy operators.
𝑋 = 𝑃 ⨂ 𝐼𝑛𝑉 ( 29 )
The next step was to aggregate experts’ fuzzy opinions and calculate the fuzzy weighting for the
criteria (necessity of involvement and power criteria) and stakeholders’ power using the
following equations.
𝑃𝑧 = (1
𝑛∑𝑃𝑖𝑧 ,
1
𝑛∑𝑃𝑖𝑧
1
𝑛∑𝑃𝑖𝑧 ) ( 30 )
𝐼𝑛𝑉𝑧 = (1
𝑛∑ 𝐼𝑛𝑉𝑖𝑧 ,
1
𝑛∑𝐼𝑛𝑉𝑖𝑧
1
𝑛∑𝐼𝑛𝑉𝑖𝑧 ) ( 31 )
𝑋𝑧 = (1
𝑛∑𝑋𝑖𝑧 ,
1
𝑛∑𝑋𝑖𝑧
1
𝑛∑𝑋𝑖𝑧 ) ( 32 )
Where i denotes the participants (i =1, 2... n) and j represents the stakeholder (z = 1, 2 … k)
0 0.1 0.2 0.3 0.4 0.5 0.6 0.7 0.8 0.9 1
Weighting scale
0
0.2
0.4
0.6
0.8
1
1.2
Deg
ree
of M
em
bers
hip
Fun
ctio
n
Very Unimportant
Unimportant
Moderately Important
Important
Very Important
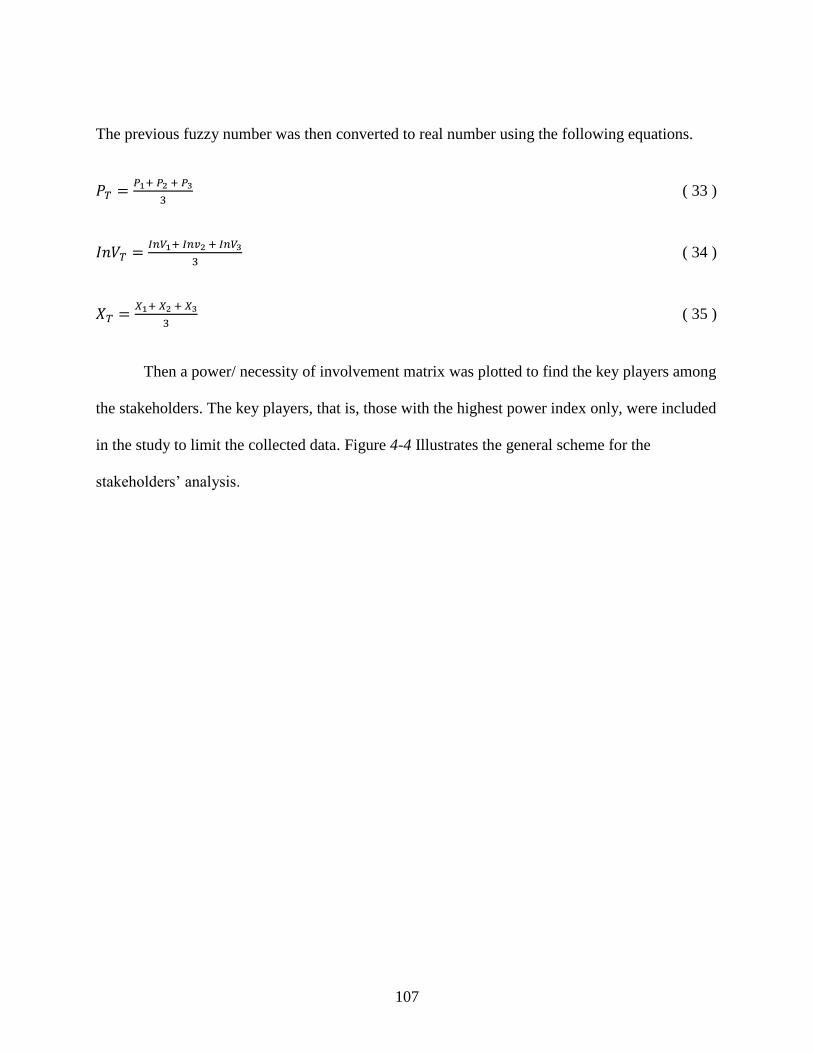
107
The previous fuzzy number was then converted to real number using the following equations.
𝑃𝑇 =𝑃1+ 𝑃2 + 𝑃3
3 ( 33 )
𝐼𝑛𝑉𝑇 =𝐼𝑛𝑉1+ 𝐼𝑛𝑣2 + 𝐼𝑛𝑉3
3 ( 34 )
𝑋𝑇 =𝑋1+ 𝑋2 + 𝑋3
3 ( 35 )
Then a power/ necessity of involvement matrix was plotted to find the key players among
the stakeholders. The key players, that is, those with the highest power index only, were included
in the study to limit the collected data. Figure 4-4 Illustrates the general scheme for the
stakeholders’ analysis.
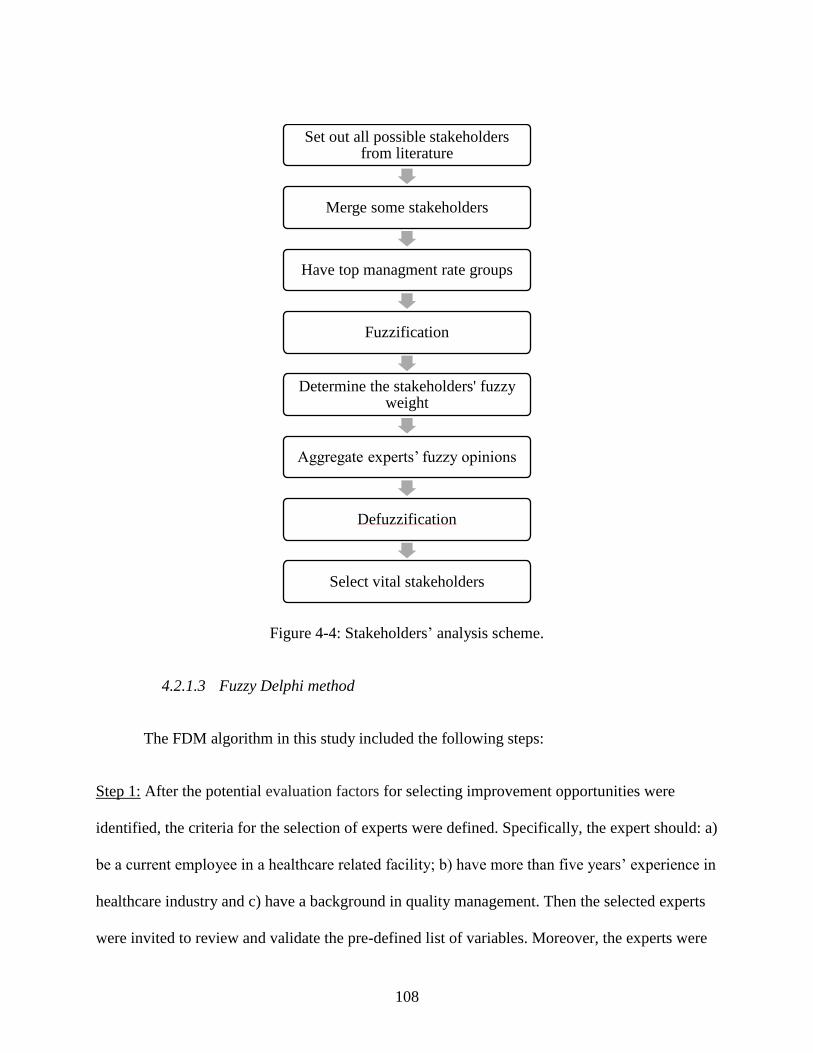
108
Figure 4-4: Stakeholders’ analysis scheme.
4.2.1.3 Fuzzy Delphi method
The FDM algorithm in this study included the following steps:
Step 1: After the potential evaluation factors for selecting improvement opportunities were
identified, the criteria for the selection of experts were defined. Specifically, the expert should: a)
be a current employee in a healthcare related facility; b) have more than five years’ experience in
healthcare industry and c) have a background in quality management. Then the selected experts
were invited to review and validate the pre-defined list of variables. Moreover, the experts were
Set out all possible stakeholders from literature
Merge some stakeholders
Have top managment rate groups
Fuzzification
Determine the stakeholders' fuzzy weight
Aggregate experts’ fuzzy opinions
Defuzzification
Select vital stakeholders
109
asked to suggest any possible missing variables. Step 1 had the potential to be repeated if major
changes were recommended (English and Arabic versions of the surveys in Appendix G).
Step 2: The selected experts’ opinions were collected through fuzzy questionnaires, that is, a
committee of n experts evaluated m criteria and assigned an appropriate weight to each factor
based on its importance. The experts selected linguistic terms for each factor. A 3, 5, 7, or 9
linguistic point scale can be used for the evaluation, as the number of linguistic scale levels must
be odd. Higher linguistics scales can provide more accurate data (Kamarulzaman, Jomhari, Raus,
& Yusoff, 2015). In this research, five fuzzy sets were utilized in this study in the form of
linguistic weighting variables, including: Very Unimportant (VU), Unimportant (U), Moderately
Important (MI), Important (I), and Very Important (VI).
Step 3: Each linguistic term was converted to a Fuzzy Number, using the triangle fuzzy
membership function, the most commonly used membership function in FDM. The triangle
fuzzy number of each linguistic term can be presented as follows:
𝐴𝑖𝑗 = (𝑎𝑖𝑗, 𝑏𝑖𝑗 , 𝑐𝑖𝑗)
Where i is an individual expert’s notation (i =1, 2... n) and j represents the evaluation factor (j =
1, 2 … m)
Figure 4-5 illustrates the membership function for importance weights and Table 4-4 presents
the linguistic variables and their corresponding fuzzy number.
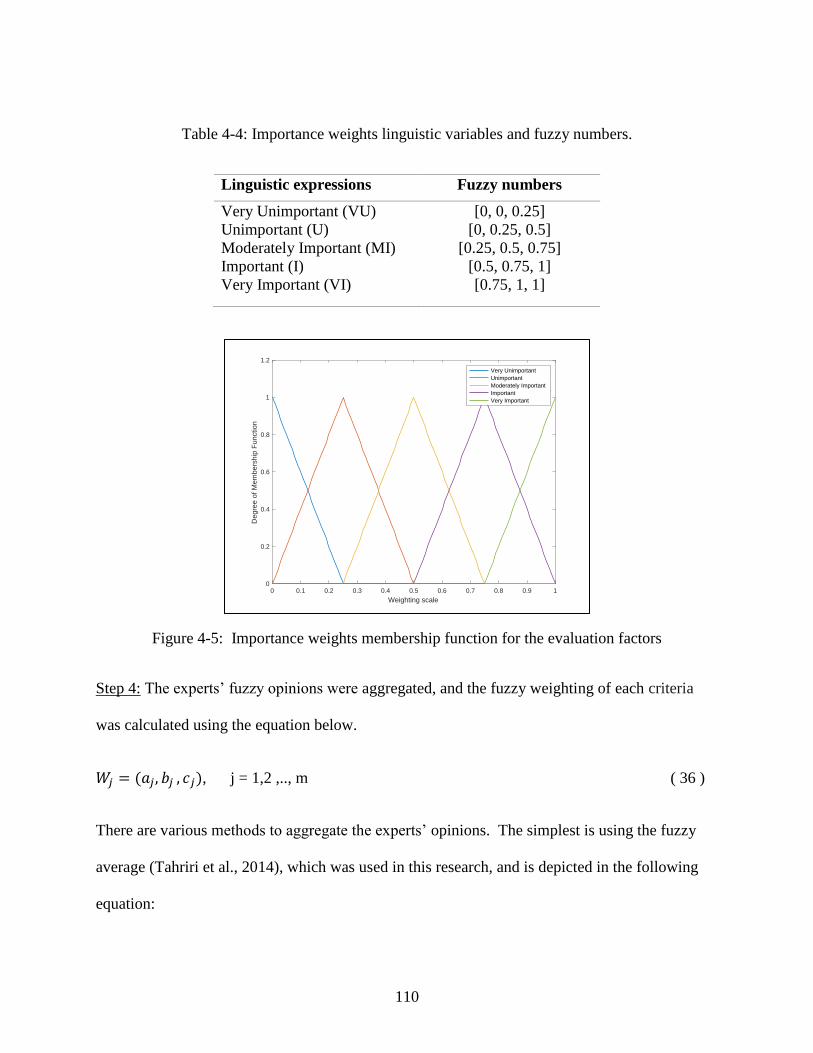
110
Table 4-4: Importance weights linguistic variables and fuzzy numbers.
Linguistic expressions Fuzzy numbers
Very Unimportant (VU)
Unimportant (U)
Moderately Important (MI)
Important (I)
Very Important (VI)
[0, 0, 0.25]
[0, 0.25, 0.5]
[0.25, 0.5, 0.75]
[0.5, 0.75, 1]
[0.75, 1, 1]
Figure 4-5: Importance weights membership function for the evaluation factors
Step 4: The experts’ fuzzy opinions were aggregated, and the fuzzy weighting of each criteria
was calculated using the equation below.
𝑊𝑗 = (𝑎𝑗, 𝑏𝑗 , 𝑐𝑗), j = 1,2 ,.., m ( 36 )
There are various methods to aggregate the experts’ opinions. The simplest is using the fuzzy
average (Tahriri et al., 2014), which was used in this research, and is depicted in the following
equation:
0 0.1 0.2 0.3 0.4 0.5 0.6 0.7 0.8 0.9 1
Weighting scale
0
0.2
0.4
0.6
0.8
1
1.2
Deg
ree
of M
em
bers
hip
Fun
ctio
n
Very Unimportant
Unimportant
Moderately Important
Important
Very Important
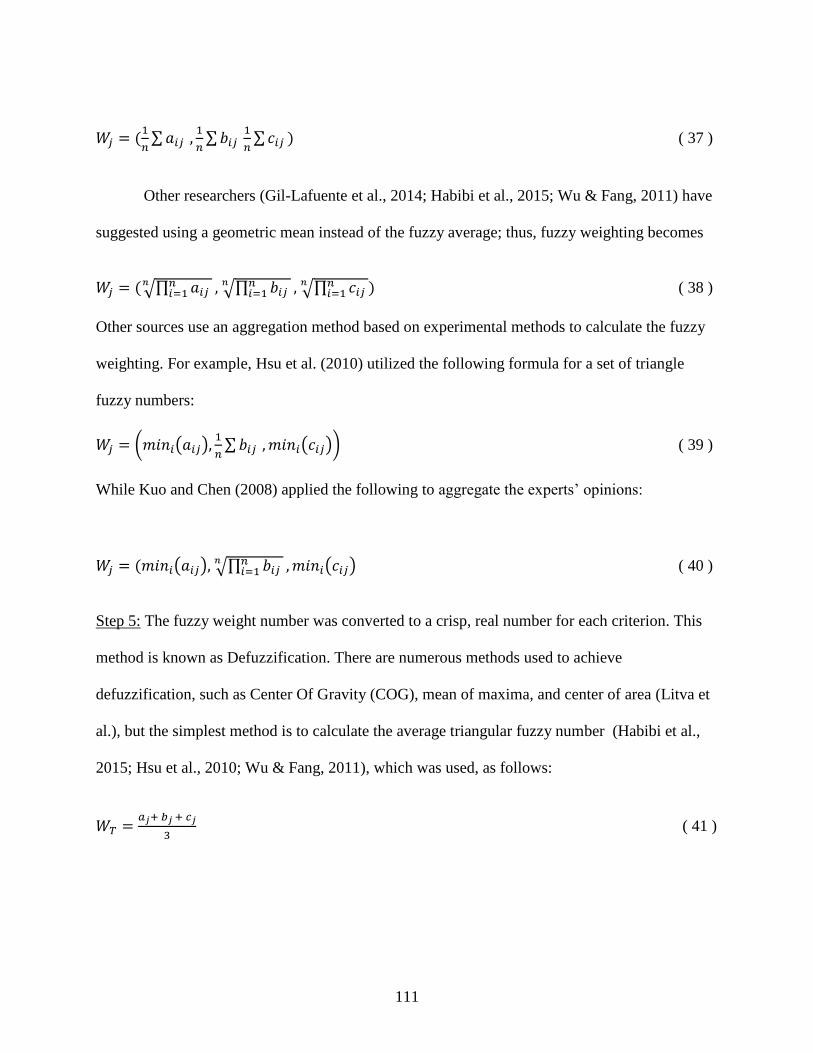
111
𝑊𝑗 = (1
𝑛∑𝑎𝑖𝑗 ,
1
𝑛∑𝑏𝑖𝑗
1
𝑛∑𝑐𝑖𝑗 ) ( 37 )
Other researchers (Gil-Lafuente et al., 2014; Habibi et al., 2015; Wu & Fang, 2011) have
suggested using a geometric mean instead of the fuzzy average; thus, fuzzy weighting becomes
𝑊𝑗 = (√∏ 𝑎𝑖𝑗 𝑛𝑖=1
𝑛 , √∏ 𝑏𝑖𝑗 𝑛𝑖=1
𝑛 , √∏ 𝑐𝑖𝑗 𝑛𝑖=1
𝑛 ) ( 38 )
Other sources use an aggregation method based on experimental methods to calculate the fuzzy
weighting. For example, Hsu et al. (2010) utilized the following formula for a set of triangle
fuzzy numbers:
𝑊𝑗 = (𝑚𝑖𝑛𝑖(𝑎𝑖𝑗),1
𝑛∑𝑏𝑖𝑗 , 𝑚𝑖𝑛𝑖(𝑐𝑖𝑗)) ( 39 )
While Kuo and Chen (2008) applied the following to aggregate the experts’ opinions:
𝑊𝑗 = (𝑚𝑖𝑛𝑖(𝑎𝑖𝑗), √∏ 𝑏𝑖𝑗 𝑛𝑖=1
𝑛 , 𝑚𝑖𝑛𝑖(𝑐𝑖𝑗) ( 40 )
Step 5: The fuzzy weight number was converted to a crisp, real number for each criterion. This
method is known as Defuzzification. There are numerous methods used to achieve
defuzzification, such as Center Of Gravity (COG), mean of maxima, and center of area (Litva et
al.), but the simplest method is to calculate the average triangular fuzzy number (Habibi et al.,
2015; Hsu et al., 2010; Wu & Fang, 2011), which was used, as follows:
𝑊𝑇 =𝑎𝑗+ 𝑏𝑗 + 𝑐𝑗
3 ( 41 )
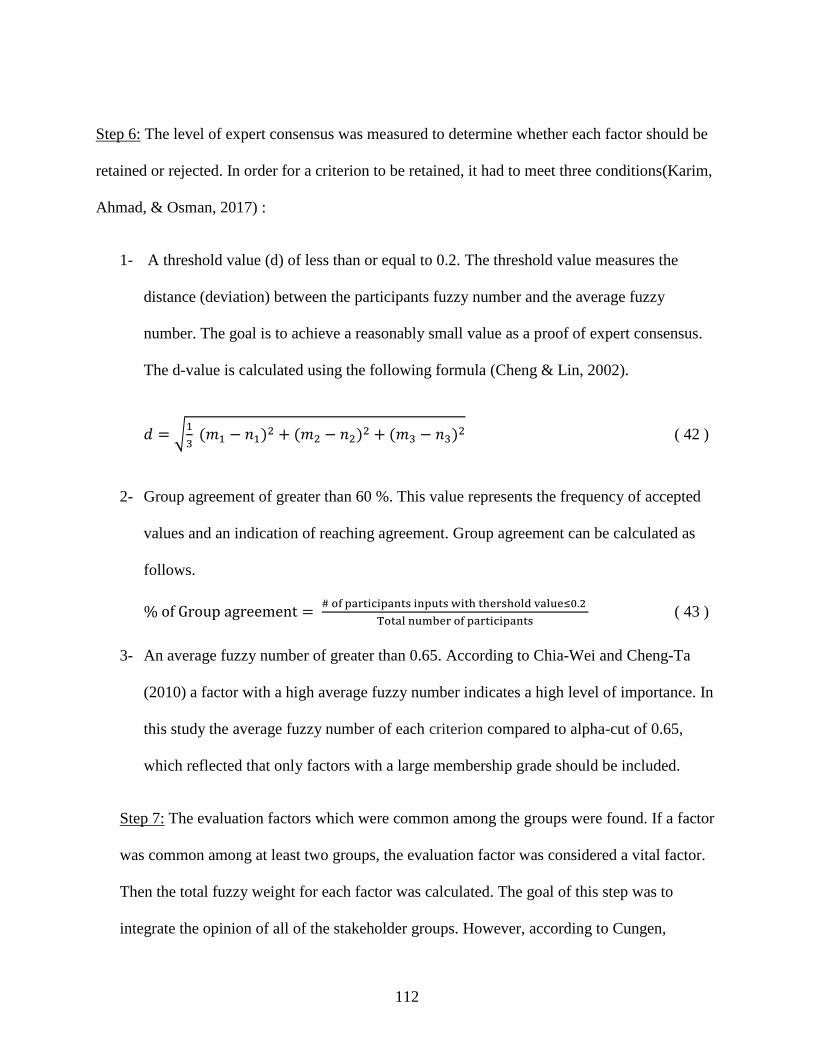
112
Step 6: The level of expert consensus was measured to determine whether each factor should be
retained or rejected. In order for a criterion to be retained, it had to meet three conditions(Karim,
Ahmad, & Osman, 2017) :
1- A threshold value (d) of less than or equal to 0.2. The threshold value measures the
distance (deviation) between the participants fuzzy number and the average fuzzy
number. The goal is to achieve a reasonably small value as a proof of expert consensus.
The d-value is calculated using the following formula (Cheng & Lin, 2002).
𝑑 = √1
3 (𝑚1 − 𝑛1)2 + (𝑚2 − 𝑛2)2 + (𝑚3 − 𝑛3)2 ( 42 )
2- Group agreement of greater than 60 %. This value represents the frequency of accepted
values and an indication of reaching agreement. Group agreement can be calculated as
follows.
% of Group agreement = # of participants inputs with thershold value≤0.2
Total number of participants ( 43 )
3- An average fuzzy number of greater than 0.65. According to Chia-Wei and Cheng-Ta
(2010) a factor with a high average fuzzy number indicates a high level of importance. In
this study the average fuzzy number of each criterion compared to alpha-cut of 0.65,
which reflected that only factors with a large membership grade should be included.
Step 7: The evaluation factors which were common among the groups were found. If a factor
was common among at least two groups, the evaluation factor was considered a vital factor.
Then the total fuzzy weight for each factor was calculated. The goal of this step was to
integrate the opinion of all of the stakeholder groups. However, according to Cungen,
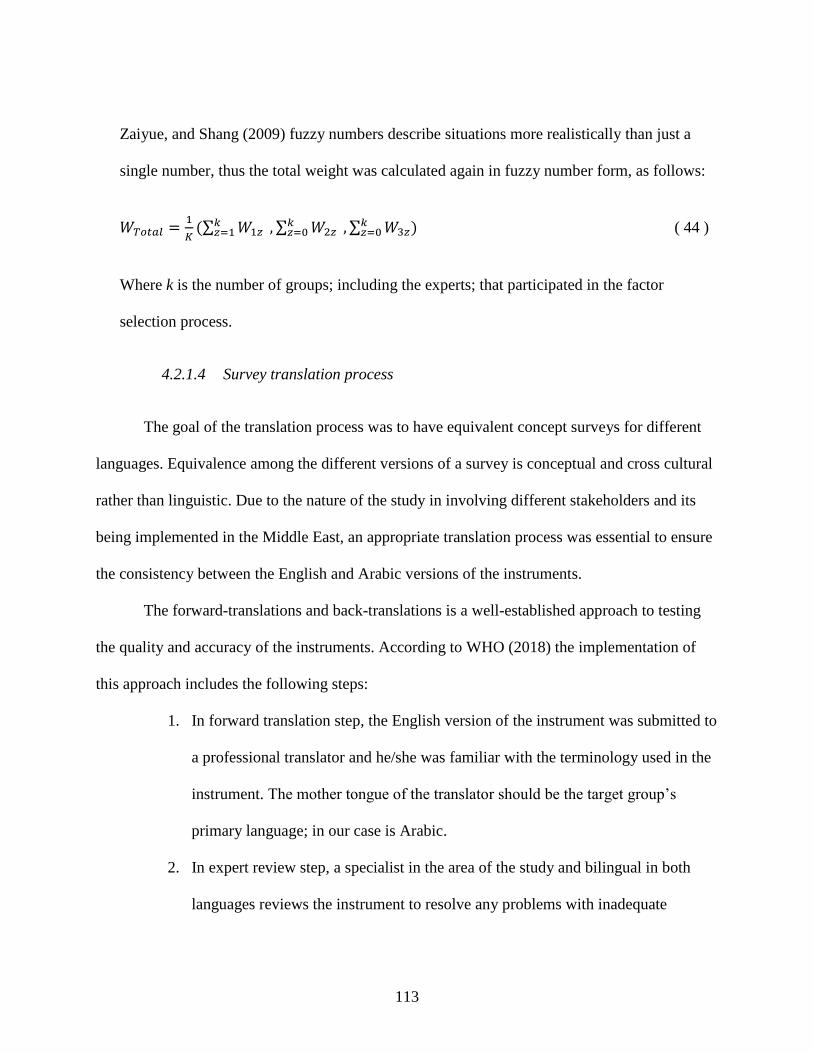
113
Zaiyue, and Shang (2009) fuzzy numbers describe situations more realistically than just a
single number, thus the total weight was calculated again in fuzzy number form, as follows:
𝑊𝑇𝑜𝑡𝑎𝑙 =1
𝐾(∑ 𝑊1𝑧
𝑘𝑧=1 , ∑ 𝑊2𝑧
𝑘𝑧=0 , ∑ 𝑊3𝑧
𝑘𝑧=0 ) ( 44 )
Where k is the number of groups; including the experts; that participated in the factor
selection process.
4.2.1.4 Survey translation process
The goal of the translation process was to have equivalent concept surveys for different
languages. Equivalence among the different versions of a survey is conceptual and cross cultural
rather than linguistic. Due to the nature of the study in involving different stakeholders and its
being implemented in the Middle East, an appropriate translation process was essential to ensure
the consistency between the English and Arabic versions of the instruments.
The forward-translations and back-translations is a well-established approach to testing
the quality and accuracy of the instruments. According to WHO (2018) the implementation of
this approach includes the following steps:
1. In forward translation step, the English version of the instrument was submitted to
a professional translator and he/she was familiar with the terminology used in the
instrument. The mother tongue of the translator should be the target group’s
primary language; in our case is Arabic.
2. In expert review step, a specialist in the area of the study and bilingual in both
languages reviews the instrument to resolve any problems with inadequate
114
concepts due to the translation. This step will result in a complete Arabic
version of the survey.
3. In back-translation step, an independent translator and native speaker of
English translates the instrument produced from the last step back into English.
The aim was to compare the result with the original instrument to evaluate the
equivalence of both.
4. In pre-testing and final version step, the instrument was tested on a sample
with a minimum of ten responses. An additional section was added to the
instrument asking the participants for their feedback about the instrument’s
language, unacceptable expressions, areas lacking clarity. Based on the
feedback, a final version of the instrument is produced
4.2.2 Phase 2: Fuzzy Interface System
The second phase in the framework attempts to prioritize improvement initiatives, mainly
using the Fuzzy Interface System. Mühlbacher and Kaczynski (2016) point out that most MCDM
research of healthcare systems does not assess the impact of uncertainty. The developed
framework attempts to resolve the problem of uncertainty and vagueness of preferences in
practice utilizing the fuzzy logic system.
Hierarchical Fuzzy Systems (HFSs) are utilized in the implementation of the fuzzy
interface system, as HFSs reduce the total number of fuzzy rules needed. For instance, if a
standard fuzzy system has six crisp variables, and each variable includes five fuzzy sets, the total
number of fuzzy rules equal 56 = 15,626 rules whereas if an HFS has six crisp variables, with
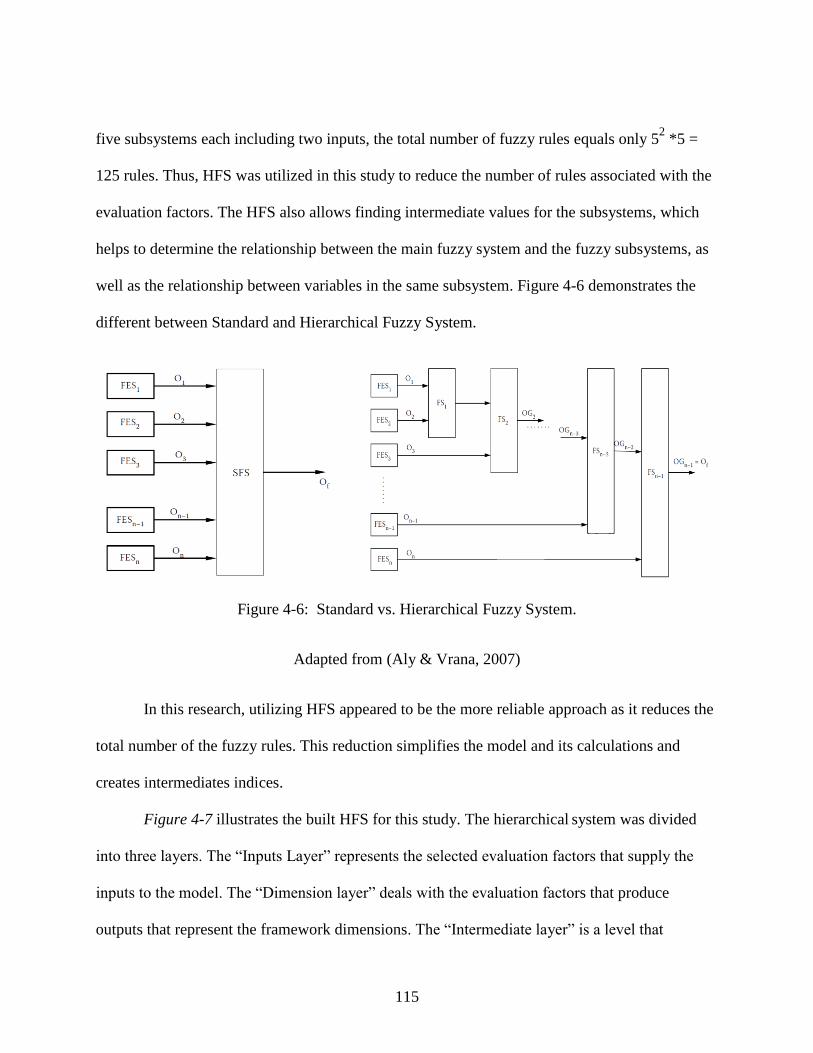
115
five subsystems each including two inputs, the total number of fuzzy rules equals only 52 *5 =
125 rules. Thus, HFS was utilized in this study to reduce the number of rules associated with the
evaluation factors. The HFS also allows finding intermediate values for the subsystems, which
helps to determine the relationship between the main fuzzy system and the fuzzy subsystems, as
well as the relationship between variables in the same subsystem. Figure 4-6 demonstrates the
different between Standard and Hierarchical Fuzzy System.
Figure 4-6: Standard vs. Hierarchical Fuzzy System.
Adapted from (Aly & Vrana, 2007)
In this research, utilizing HFS appeared to be the more reliable approach as it reduces the
total number of the fuzzy rules. This reduction simplifies the model and its calculations and
creates intermediates indices.
Figure 4-7 illustrates the built HFS for this study. The hierarchical system was divided
into three layers. The “Inputs Layer” represents the selected evaluation factors that supply the
inputs to the model. The “Dimension layer” deals with the evaluation factors that produce
outputs that represent the framework dimensions. The “Intermediate layer” is a level that
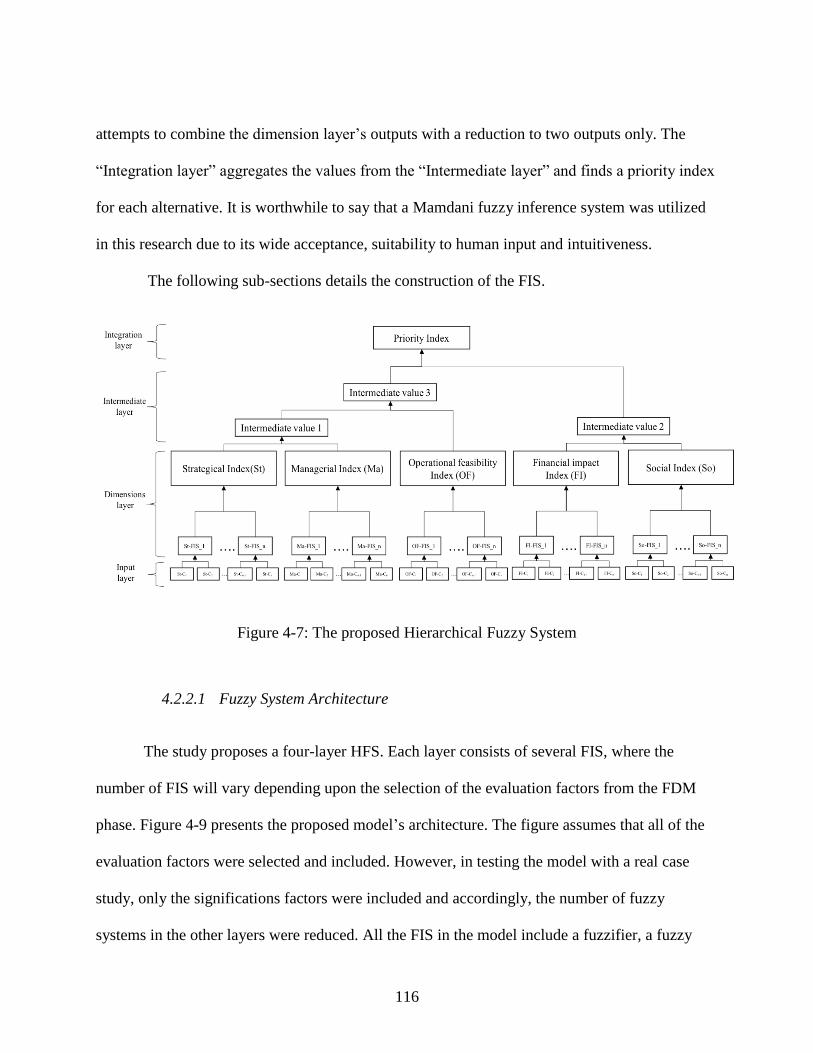
116
attempts to combine the dimension layer’s outputs with a reduction to two outputs only. The
“Integration layer” aggregates the values from the “Intermediate layer” and finds a priority index
for each alternative. It is worthwhile to say that a Mamdani fuzzy inference system was utilized
in this research due to its wide acceptance, suitability to human input and intuitiveness.
The following sub-sections details the construction of the FIS.
Figure 4-7: The proposed Hierarchical Fuzzy System
4.2.2.1 Fuzzy System Architecture
The study proposes a four-layer HFS. Each layer consists of several FIS, where the
number of FIS will vary depending upon the selection of the evaluation factors from the FDM
phase. Figure 4-9 presents the proposed model’s architecture. The figure assumes that all of the
evaluation factors were selected and included. However, in testing the model with a real case
study, only the significations factors were included and accordingly, the number of fuzzy
systems in the other layers were reduced. All the FIS in the model include a fuzzifier, a fuzzy
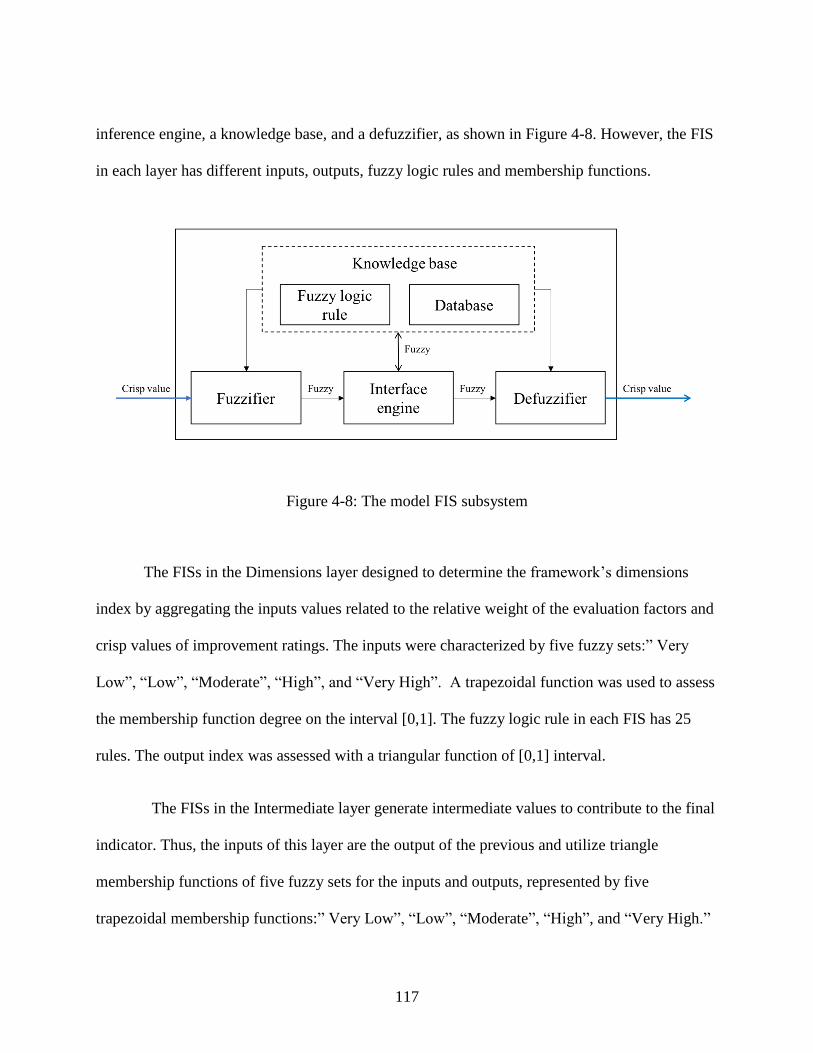
117
inference engine, a knowledge base, and a defuzzifier, as shown in Figure 4-8. However, the FIS
in each layer has different inputs, outputs, fuzzy logic rules and membership functions.
Figure 4-8: The model FIS subsystem
The FISs in the Dimensions layer designed to determine the framework’s dimensions
index by aggregating the inputs values related to the relative weight of the evaluation factors and
crisp values of improvement ratings. The inputs were characterized by five fuzzy sets:” Very
Low”, “Low”, “Moderate”, “High”, and “Very High”. A trapezoidal function was used to assess
the membership function degree on the interval [0,1]. The fuzzy logic rule in each FIS has 25
rules. The output index was assessed with a triangular function of [0,1] interval.
The FISs in the Intermediate layer generate intermediate values to contribute to the final
indicator. Thus, the inputs of this layer are the output of the previous and utilize triangle
membership functions of five fuzzy sets for the inputs and outputs, represented by five
trapezoidal membership functions:” Very Low”, “Low”, “Moderate”, “High”, and “Very High.”
118
These assess on the interval [0,1]. There are 25 fuzzy rules in each FIS in the Intermediate layer.
The final layer, the “Integration Layer”, combines all of the previous indicators to
generate a priority index for each alternative. The input of this layer is the output of the previous
layer, which is the intermediate variables while the output is a priority index, represented by
three membership functions: “Weakly Preferred”, “Moderately Preferred”, and “Strongly
Preferred”. It is assessed on a trapezoidal membership function with the interval [0, 1]. The last
FIS on the model has 25 logical rules.
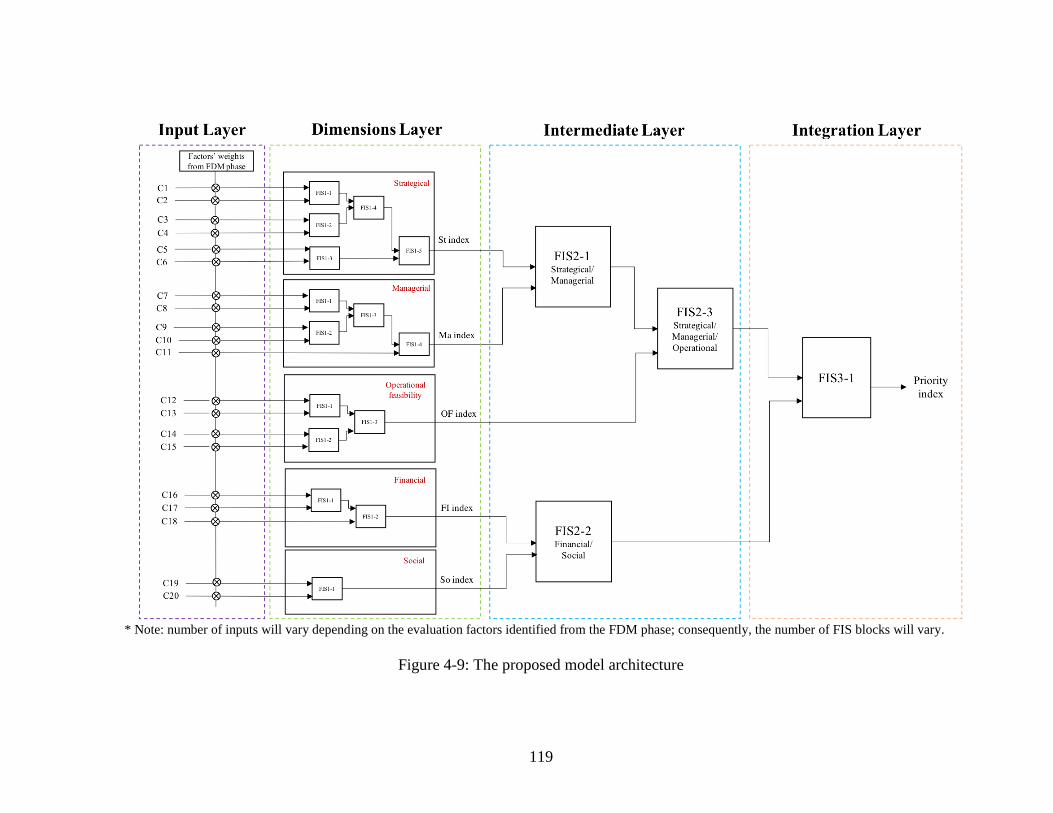
119
* Note: number of inputs will vary depending on the evaluation factors identified from the FDM phase; consequently, the number of FIS blocks will vary.
Figure 4-9: The proposed model architecture
120
4.2.2.2 Alternatives definition and rating
This section defines the alternatives to be prioritized by the model. Conventional models
would require defining specific improvement projects as alternatives when implementing in a
specific hospital, which this framework also requires. However, the main objective of this model
is to prioritize improvement projects in the context of BEMs since improvement project
performance depends on defining high priority area of improvements. In this respect, alternatives
in this study will be BEM sub-criteria. BEM sub-criteria are a common platform in most
hospitals, which enables a comparison among different hospitals’ interests with regards to
improvements. In this research EFQM sub-criteria were used as alternatives since all of the
hospitals in the UAE follow the EFQM model (Appendix A).
In addition to the criteria required to select experts in the previous phase, the expert for
this phase must be EFQM-certified in order to be familiar with the sub-criteria. Survey 2
(Appendix H) was sent for experts to rate the expected performance of each EFQM sub-criteria
with respect to the critical evaluation factors using the linguistic terms:
1- Very Low (VL) (0%): expected performance is very low with respect to the factor as
there is no direct relation between the sub-criteria and the evaluation factor.
2- Low (L) (25%): expected performance is low with respect to the factor as there is a
limited relationship between the sub-criteria and the evaluation factor.
3- Moderate (M) (50%): expected performance is moderate with respect to the factor as
there is a reasonable relationship between the sub-criteria and the evaluation factor.
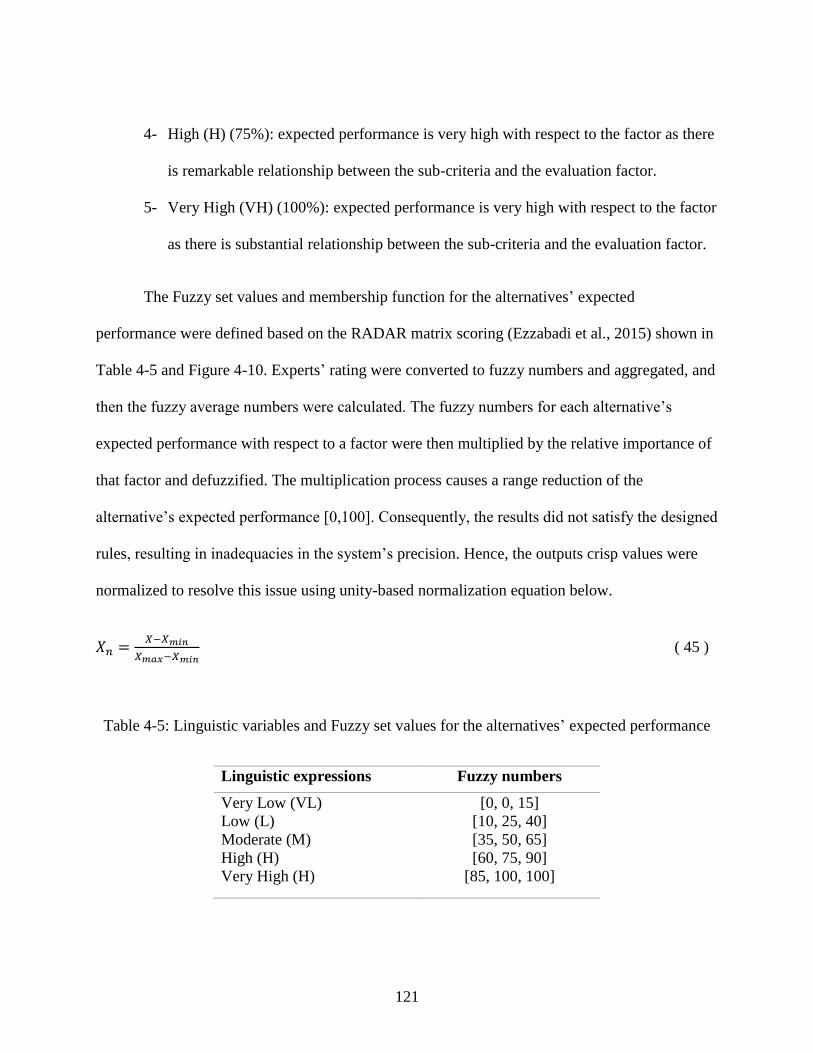
121
4- High (H) (75%): expected performance is very high with respect to the factor as there
is remarkable relationship between the sub-criteria and the evaluation factor.
5- Very High (VH) (100%): expected performance is very high with respect to the factor
as there is substantial relationship between the sub-criteria and the evaluation factor.
The Fuzzy set values and membership function for the alternatives’ expected
performance were defined based on the RADAR matrix scoring (Ezzabadi et al., 2015) shown in
Table 4-5 and Figure 4-10. Experts’ rating were converted to fuzzy numbers and aggregated, and
then the fuzzy average numbers were calculated. The fuzzy numbers for each alternative’s
expected performance with respect to a factor were then multiplied by the relative importance of
that factor and defuzzified. The multiplication process causes a range reduction of the
alternative’s expected performance [0,100]. Consequently, the results did not satisfy the designed
rules, resulting in inadequacies in the system’s precision. Hence, the outputs crisp values were
normalized to resolve this issue using unity-based normalization equation below.
𝑋𝑛 =𝑋−𝑋𝑚𝑖𝑛
𝑋𝑚𝑎𝑥−𝑋𝑚𝑖𝑛 ( 45 )
Table 4-5: Linguistic variables and Fuzzy set values for the alternatives’ expected performance
Linguistic expressions Fuzzy numbers
Very Low (VL)
Low (L)
Moderate (M)
High (H)
Very High (H)
[0, 0, 15]
[10, 25, 40]
[35, 50, 65]
[60, 75, 90]
[85, 100, 100]
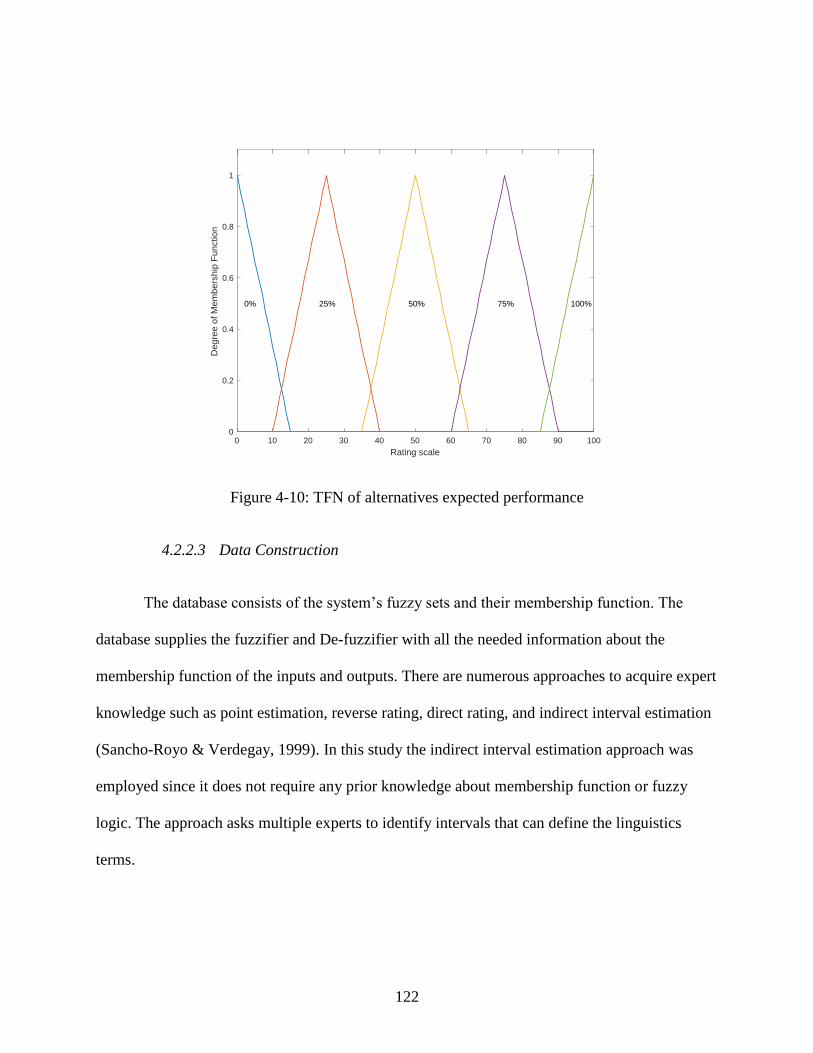
122
Figure 4-10: TFN of alternatives expected performance
4.2.2.3 Data Construction
The database consists of the system’s fuzzy sets and their membership function. The
database supplies the fuzzifier and De-fuzzifier with all the needed information about the
membership function of the inputs and outputs. There are numerous approaches to acquire expert
knowledge such as point estimation, reverse rating, direct rating, and indirect interval estimation
(Sancho-Royo & Verdegay, 1999). In this study the indirect interval estimation approach was
employed since it does not require any prior knowledge about membership function or fuzzy
logic. The approach asks multiple experts to identify intervals that can define the linguistics
terms.
0 10 20 30 40 50 60 70 80 90 100
Rating scale
0
0.2
0.4
0.6
0.8
1
Deg
ree
of M
em
bers
hip
Fun
ctio
n
0% 25% 50% 75% 100%
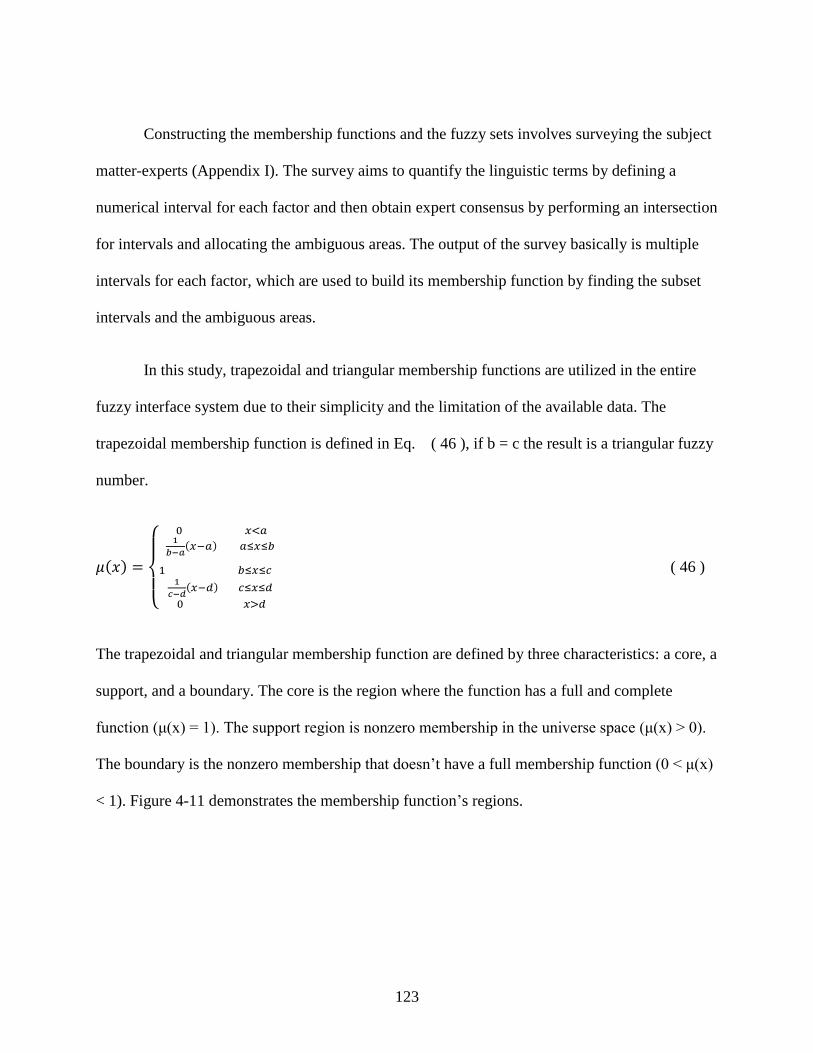
123
Constructing the membership functions and the fuzzy sets involves surveying the subject
matter-experts (Appendix I). The survey aims to quantify the linguistic terms by defining a
numerical interval for each factor and then obtain expert consensus by performing an intersection
for intervals and allocating the ambiguous areas. The output of the survey basically is multiple
intervals for each factor, which are used to build its membership function by finding the subset
intervals and the ambiguous areas.
In this study, trapezoidal and triangular membership functions are utilized in the entire
fuzzy interface system due to their simplicity and the limitation of the available data. The
trapezoidal membership function is defined in Eq. ( 46 ), if b = c the result is a triangular fuzzy
number.
𝜇(𝑥) =
{
0 𝑥<𝑎1
𝑏−𝑎(𝑥−𝑎) 𝑎≤𝑥≤𝑏
1 𝑏≤𝑥≤𝑐
1
𝑐−𝑑(𝑥−𝑑) 𝑐≤𝑥≤𝑑
0 𝑥>𝑑
( 46 )
The trapezoidal and triangular membership function are defined by three characteristics: a core, a
support, and a boundary. The core is the region where the function has a full and complete
function (μ(x) = 1). The support region is nonzero membership in the universe space (μ(x) > 0).
The boundary is the nonzero membership that doesn’t have a full membership function (0 < μ(x)
< 1). Figure 4-11 demonstrates the membership function’s regions.
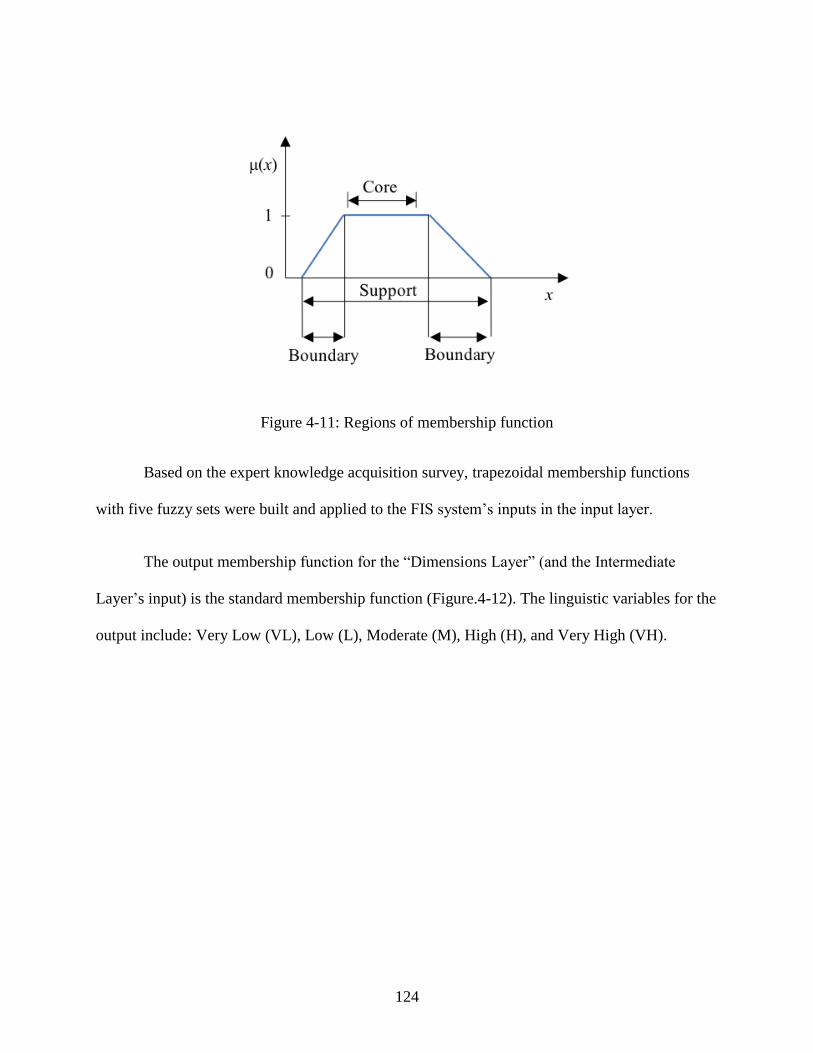
124
Figure 4-11: Regions of membership function
Based on the expert knowledge acquisition survey, trapezoidal membership functions
with five fuzzy sets were built and applied to the FIS system’s inputs in the input layer.
The output membership function for the “Dimensions Layer” (and the Intermediate
Layer’s input) is the standard membership function (Figure.4-12). The linguistic variables for the
output include: Very Low (VL), Low (L), Moderate (M), High (H), and Very High (VH).
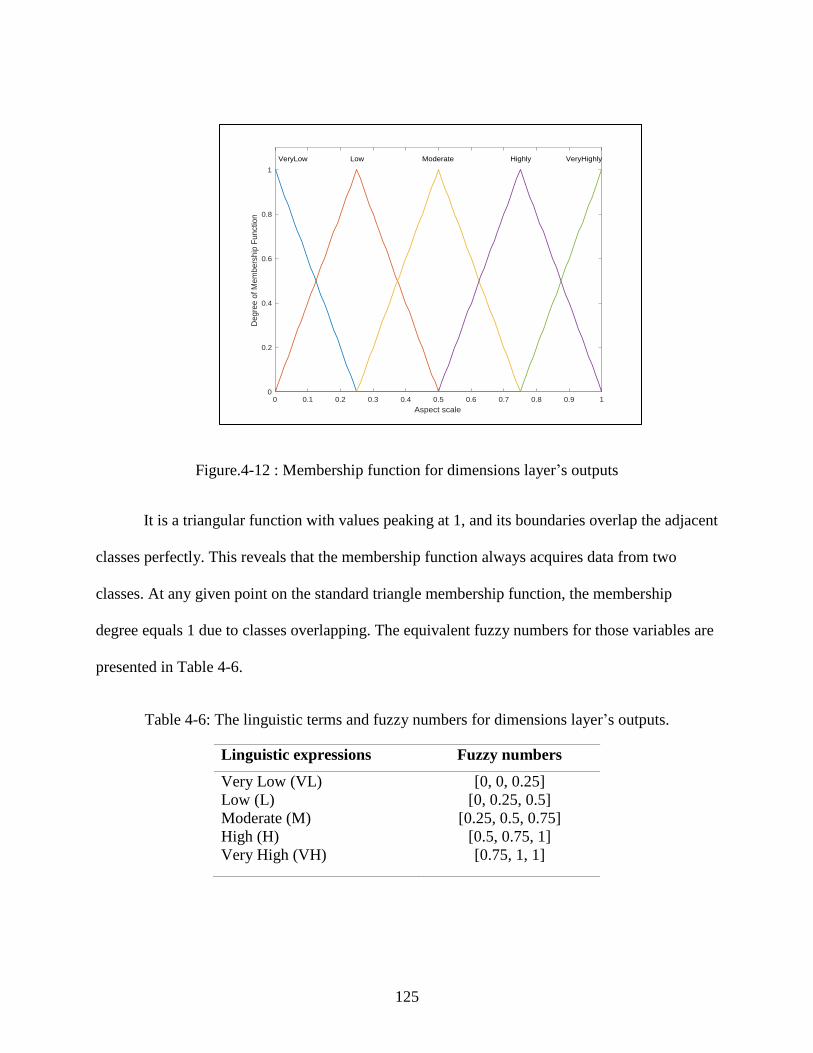
125
Figure.4-12 : Membership function for dimensions layer’s outputs
It is a triangular function with values peaking at 1, and its boundaries overlap the adjacent
classes perfectly. This reveals that the membership function always acquires data from two
classes. At any given point on the standard triangle membership function, the membership
degree equals 1 due to classes overlapping. The equivalent fuzzy numbers for those variables are
presented in Table 4-6.
Table 4-6: The linguistic terms and fuzzy numbers for dimensions layer’s outputs.
Linguistic expressions Fuzzy numbers
Very Low (VL)
Low (L)
Moderate (M)
High (H)
Very High (VH)
[0, 0, 0.25]
[0, 0.25, 0.5]
[0.25, 0.5, 0.75]
[0.5, 0.75, 1]
[0.75, 1, 1]
0 0.1 0.2 0.3 0.4 0.5 0.6 0.7 0.8 0.9 1
Aspect scale
0
0.2
0.4
0.6
0.8
1
Deg
ree
of M
em
bers
hip
Fun
ctio
n
VeryLow Low Moderate Highly VeryHighly
126
In the “Intermediate Layer”, the same tringle membership function with five fuzzy sets
used in dimensions layer is used for FIS outputs.
In the “Integration Layer”, the membership functions of the five fuzzy sets, which is the
output of the Intermediate Layer, is considered as input and membership functions of three fuzzy
sets were the FIS’s output. The linguistic variables of the outputs are: Weakly Preferred (WP),
Moderately Preferred (MP), and Strongly Preferred. The membership function and fuzzy set of
the integration layer were also constructed from acquiring experts’ knowledge (Appendix I).
4.2.2.4 Fuzzy rules construction
In order to design the fuzzy rule, evaluation factors were arranged into two categories
using two types of quality characteristics: smaller is better and larger is better, as shown in Table
4-7.
127
Table 4-7: Evaluation factors based on the types of quality characteristics
Smaller is better Larger is better
1- Improvement duration/Time
2- Cost
3- Risk
4- Legal implications
5- Ethical implications
1- Resource and information availability
2- ROI
3- Ease of implementation
4- Cost reduction
5- Profit
6- Patients satisfaction
7- Health and safety
8- Urgency
9- Impact/effectiveness
10- Importance/significant
11- Strategic alignment
12- Critical to quality
13- Competitive advantages
14- Top management commitment
15- Learning and growth potential
The FIS systems are multi-input and single output; thus a Fuzzy Rule Based System
(FRBS) is used in the format of IF X=A and Y= B then Z=C. The rules were designed using the
average of the two inputs. For example, if a sub-criterion has “High” expected performance from
a cost perspective and “Low” expected performance from a time perspective, then the FIS output
is “Moderate.”
The inputs of the “Dimensions layer” are the different evaluation factors, and as indicated
above, each factor belongs to one of the two types of quality characteristics. Thus, three matrices
should be developed: in cases where both inputs are from “the smaller the better”, where both
inputs are from “the larger the better”, or in cases where the inputs are from different groups, one
from “the smaller the better” and the other from “the larger the better”. However, to be consistent
and to use the same fuzzy rules, complements for all the evaluation factors in “the smaller the
128
better” group are found (A= (1-A’)). In cases where both variables are from “the smaller the
better” group, complements of both are found.
The rules were constructed (Table 4-8) based on the average of both inputs. If the average
was found to be between two variables, the larger value was selected (the larger the better)
Table 4-8: Fuzzy rules matrix in level 1
Input 1 Input 2
VL L M H VH
VL VL L L M M
L L L M M H
M L M M H H
H M M H H VH
VH M H H VH VH
In the Intermediate layer, a fuzzy rules matrix was designed to aggregate the framework’s
dimensions, and sub-criteria with higher value of dimensions indices (operational feasibility,
financial impact, social, strategical, Managerial) were preferred. The Integration Layer aims to
aggregate the inputs of the previous level to rank the alternatives, the inputs to the layer are VL,
L, M, H, and VH, but the outputs are Weakly Preferred (WP), Moderately Preferred (MP),
Strongly Preferred. The goal is to select an improvement project that has the highest expected
performance from each dimension. Thus, the following conditions were considered to construct
the rules for the intermediate layer and the integration layer:
▪ Any improvement scoring VL in any dimension was categorized as weakly
preferred
▪ Any improvement scoring L in more than half of the dimensions was categorized
as weakly preferred
129
▪ The improvement should score at least H or VH in half of the dimensions and a
minimum score of M in the rest of the dimensions to be strongly preferred.
To satisfy the previous conditions, the fuzzy rules matrices in Table 4-9 and Table 4-10
were constructed for the intermediate layer and the integration layer, respectively.
Table 4-9: Fuzzy rules matrix for the intermediate layer
Input 1 Input 2
VL L M H VH
VL VL VL VL VL VL
L VL L M M H
M VL M M H H
H VL M H H VH
VH VL H H VH VH
Table 4-10: Fuzzy rules matrix for the integration layer
Input 1 Input 2
VL L M H VH
VL WP WP WP WP WP
L WP WP WP WP WP
M WP WP MP MP MP
H WP WP MP SP SP
VH WP WP MP SP SP
4.2.2.5 Fuzzification
The fuzzifier converts the crisp value into fuzzy values based on fuzzy rules and the
defined membership function obtained from the database by determining the degree of belonging
to the membership function. In the FIS, the input to the first fuzzifiers in the input layer are the
alternatives rating in respect to each evaluation factor, whereas the input for the other layers is
130
the output value of the previous FIS. The output of all fuzzifiers is a membership degree, which
is used to test the degree of satisfying each rule.
4.2.2.6 De-Fuzzification
De-Fuzzification is the last step in the FIS to convert the fuzzy number back into a crisp
value, which is the desired result of the system. The defuzzifiers also obtain a membership
function degree and type from the knowledge base. There are several methods of defuzzification,
but this research deployed a centroid method.
4.2.3 Reliability and Validation
The Statistical Packages Social Sciences (SPSS) Statistical software tools was used to test
the reliability of the questionnaire. The Cronbach’s alpha was carried out to measure the internal
consistency with a minimum acceptable level of 0.7. According to Sri Yogi (2015) the Corrected
Item Total Correlation (CITC) and Cronbach’s alpha if an item is deleted are important
measures to test the item reliability and importance to the questionnaire. The CITC indicates the
correlation of each item with the score of the overall questionnaire. An item shouldn’t be
included if its CITC value is less than 0.30. As the name suggests, Cronbach’s alpha is calculated
again when each item removed. The item was critical if the Cronbach’s alpha value of the
instrument decreased; this means the item should be retained. If the alpha value increased by
deleting the item, the item would be removed to increase the questionnaire’s reliability.
Validity is the degree of accuracy to measure a concept. The study utilizes three types of
validation: face, contents and construct validity. Face validity was assessed by interviewing
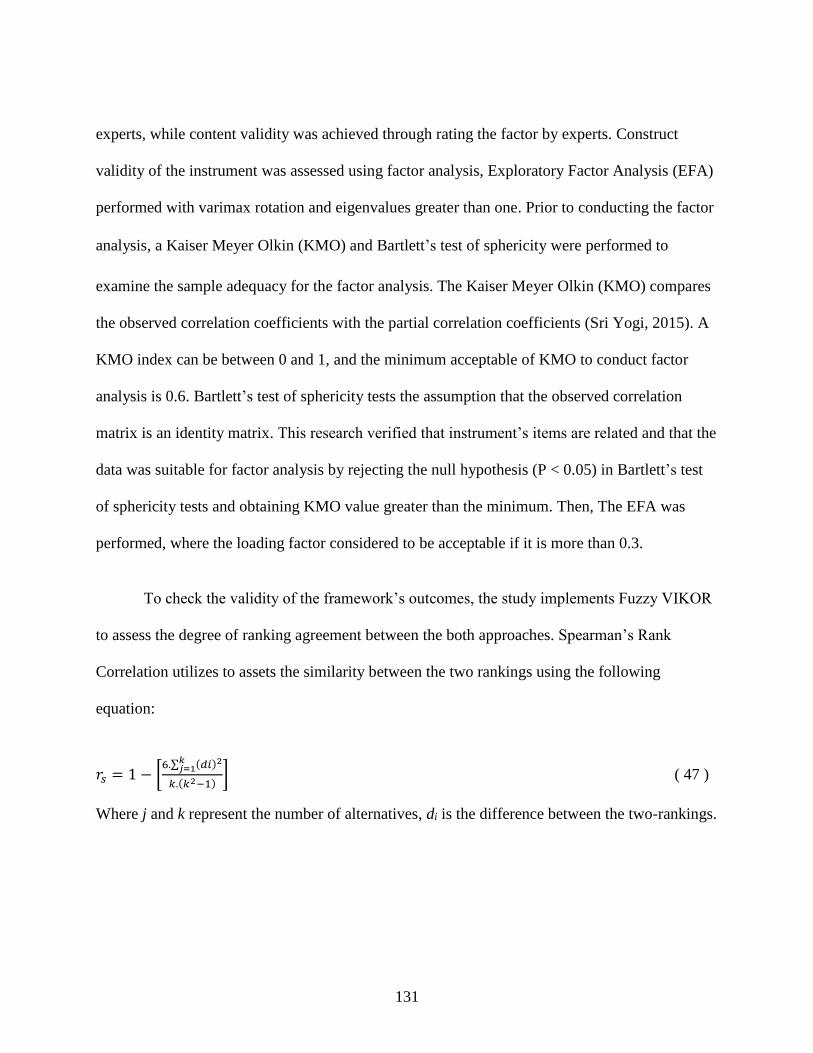
131
experts, while content validity was achieved through rating the factor by experts. Construct
validity of the instrument was assessed using factor analysis, Exploratory Factor Analysis (EFA)
performed with varimax rotation and eigenvalues greater than one. Prior to conducting the factor
analysis, a Kaiser Meyer Olkin (KMO) and Bartlett’s test of sphericity were performed to
examine the sample adequacy for the factor analysis. The Kaiser Meyer Olkin (KMO) compares
the observed correlation coefficients with the partial correlation coefficients (Sri Yogi, 2015). A
KMO index can be between 0 and 1, and the minimum acceptable of KMO to conduct factor
analysis is 0.6. Bartlett’s test of sphericity tests the assumption that the observed correlation
matrix is an identity matrix. This research verified that instrument’s items are related and that the
data was suitable for factor analysis by rejecting the null hypothesis (P < 0.05) in Bartlett’s test
of sphericity tests and obtaining KMO value greater than the minimum. Then, The EFA was
performed, where the loading factor considered to be acceptable if it is more than 0.3.
To check the validity of the framework’s outcomes, the study implements Fuzzy VIKOR
to assess the degree of ranking agreement between the both approaches. Spearman’s Rank
Correlation utilizes to assets the similarity between the two rankings using the following
equation:
𝑟𝑠 = 1 − [6.∑ (𝑑𝑖)2𝑘
𝑗=1
𝑘.(𝑘2−1)] ( 47 )
Where j and k represent the number of alternatives, di is the difference between the two-rankings.
132
4.3 Summery
Chapter four of this dissertation expands on the development of the framework for
prioritizing areas of improvement in a healthcare system in the context of the business excellence
model. The framework development involved two phases; the first phase aimed to identify the
vital stakeholders through a stakeholder analysis and evaluation factors selection using FDM. In
phase two, the HFS scheme was chosen to build FIS over other schemes due to its ability to
reduce the number of fuzzy rules utilized in the database, in addition to being able to determine
the relation between the main fuzzy system and the fuzzy subsystems. The HFS consists of four
layers: an input layer, an dimensions layer, an intermediate layer, and an integration layer. The
number of inputs fed to the input layer depended on the number of the evaluation factors selected
in the first phase. The knowledge base construction, including database and fuzzy rules, depend
on acquiring knowledge from healthcare expert to quantify the linguistic terms and allocate
ambiguous areas. The next chapter illustrates the results of implementing the framework.
133
CHAPTER 5: IMPLEMENTATION AND RESULTS
5.1 Introduction
To validate the proposed framework, two case studies were conducted to measure its
potential. This chapter of the dissertation presents the process of implementing the proposed
framework and analyzes the obtained results.
First, the results of the stakeholders’ identification and selection are discussed. Then, the
results of the FDM phase are presented, including the results from the content validity round, the
experts’ and stakeholders’ selection, and the analysis to elicit the critical factors. Also, this
section examines the reliability and validity of the FDM results. Next, the fuzzy system interface
development is discussed. The development of FIS included the expert knowledge acquisition
step to construct the membership functions and the detailed structure of the FIS model. Each
subsystem in the FIS is analyzed and its surface plot is plotted to present the input and output
relationships. Finally, a Simulink model was run to compute a priority index and dimensions
indices for each improvement opportunity.
5.2 Case studies
The proposed framework tested in two public hospitals in United Arab Emirates. Hospital
A is a well-known public hospital located in Abu Dhabi, UAE and offers healthcare in all
specialties. It is a 412 acute care medical facility with more than 35 medical departments. The
hospital's emergency room and trauma center annually serve around 130,000 patients. Also,
more than 18,500 in-patients and 300,000 out-patients annually visit the specialty hospital
clinics. The hospital is accredited by the Joint Commission International (JCI).
134
Hospital B is a specialized public hospital provides care for women and children in
Dubai, UAE. It offers specialized medical services including anesthesia and ICU, pediatric
surgery, and pediatric medical. Based on the 2017 statistic, the hospital has 468 beds, 60,000
patients were seen in the emergency room, 25,914 in-patients, and 149,640 outpatients. The JCl
accredited the hospital in 2007.
5.3 Results of stakeholders’ identification
This section details the results of the stakeholders’ identification. In order to create a
general pattern and select the same stakeholders for the hospitals, two persons from each hospital
with different experience and background were involved in the stakeholders’ analysis. The
participants were from top management and operations authority. An “HCT-k” assigned code
was used for each participant, where HCT stands for Healthcare Top Management and k stands
for the participant number. The participants were asked to rate the stakeholders based on the
necessity of stakeholder involvement (InV) and stakeholder power (P) using the linguistic
variables: Very Low (VL), Low (L), Moderate (M), High (H), Very High (VH).
Table 5-1and Table 5-2 contain participants’ ratings for stakeholders based on necessity
of stakeholder involvement and the stakeholder power, respectively.
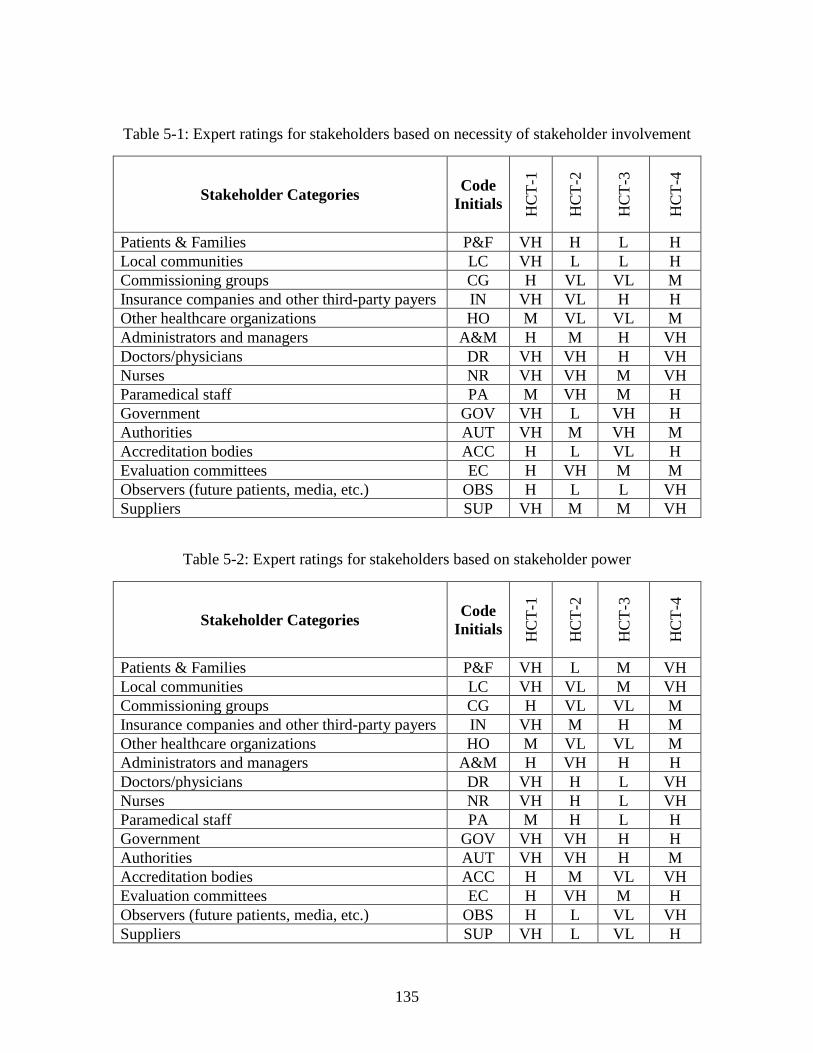
135
Table 5-1: Expert ratings for stakeholders based on necessity of stakeholder involvement
Stakeholder Categories Code
Initials
HC
T-1
HC
T-2
HC
T-3
HC
T-4
Patients & Families P&F VH H L H
Local communities LC VH L L H
Commissioning groups CG H VL VL M
Insurance companies and other third-party payers IN VH VL H H
Other healthcare organizations HO M VL VL M
Administrators and managers A&M H M H VH
Doctors/physicians DR VH VH H VH
Nurses NR VH VH M VH
Paramedical staff PA M VH M H
Government GOV VH L VH H
Authorities AUT VH M VH M
Accreditation bodies ACC H L VL H
Evaluation committees EC H VH M M
Observers (future patients, media, etc.) OBS H L L VH
Suppliers SUP VH M M VH
Table 5-2: Expert ratings for stakeholders based on stakeholder power
Stakeholder Categories Code
Initials
HC
T-1
HC
T-2
HC
T-3
HC
T-4
Patients & Families P&F VH L M VH
Local communities LC VH VL M VH
Commissioning groups CG H VL VL M
Insurance companies and other third-party payers IN VH M H M
Other healthcare organizations HO M VL VL M
Administrators and managers A&M H VH H H
Doctors/physicians DR VH H L VH
Nurses NR VH H L VH
Paramedical staff PA M H L H
Government GOV VH VH H H
Authorities AUT VH VH H M
Accreditation bodies ACC H M VL VH
Evaluation committees EC H VH M H
Observers (future patients, media, etc.) OBS H L VL VH
Suppliers SUP VH L VL H
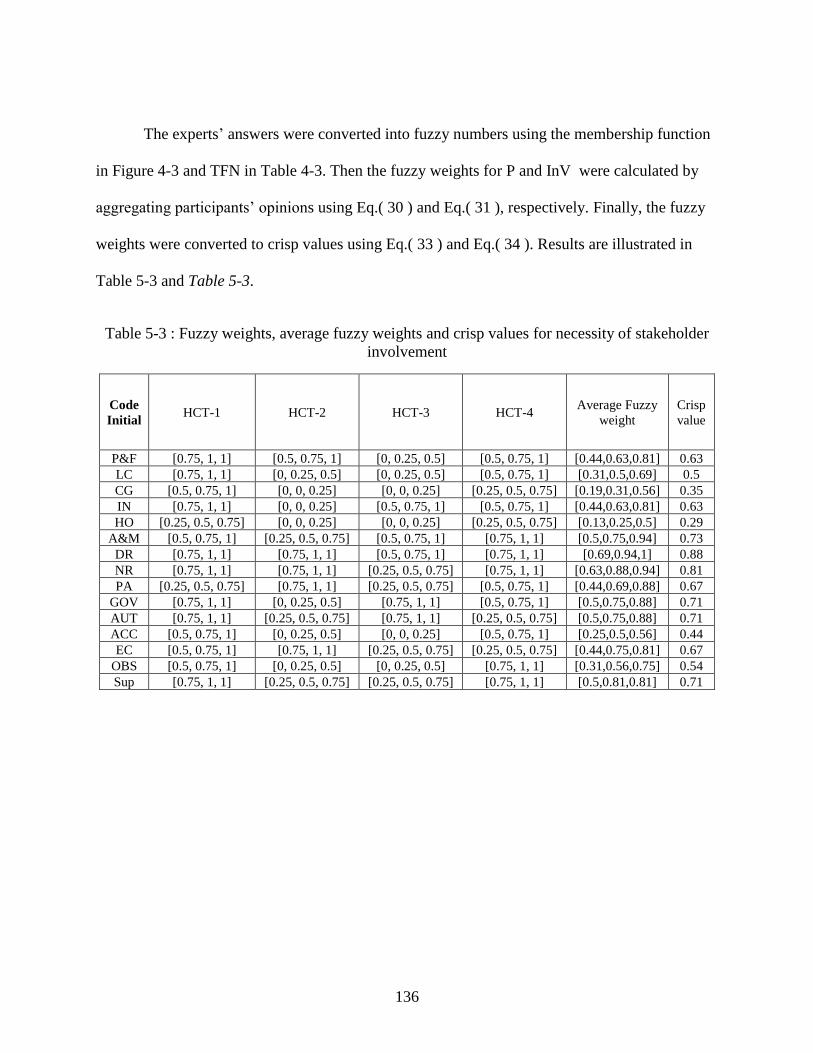
136
The experts’ answers were converted into fuzzy numbers using the membership function
in Figure 4-3 and TFN in Table 4-3. Then the fuzzy weights for P and InV were calculated by
aggregating participants’ opinions using Eq.( 30 ) and Eq.( 31 ), respectively. Finally, the fuzzy
weights were converted to crisp values using Eq.( 33 ) and Eq.( 34 ). Results are illustrated in
Table 5-3 and Table 5-3.
Table 5-3 : Fuzzy weights, average fuzzy weights and crisp values for necessity of stakeholder
involvement
Code
Initial HCT-1 HCT-2 HCT-3 HCT-4
Average Fuzzy
weight
Crisp
value
P&F [0.75, 1, 1] [0.5, 0.75, 1] [0, 0.25, 0.5] [0.5, 0.75, 1] [0.44,0.63,0.81] 0.63
LC [0.75, 1, 1] [0, 0.25, 0.5] [0, 0.25, 0.5] [0.5, 0.75, 1] [0.31,0.5,0.69] 0.5
CG [0.5, 0.75, 1] [0, 0, 0.25] [0, 0, 0.25] [0.25, 0.5, 0.75] [0.19,0.31,0.56] 0.35
IN [0.75, 1, 1] [0, 0, 0.25] [0.5, 0.75, 1] [0.5, 0.75, 1] [0.44,0.63,0.81] 0.63
HO [0.25, 0.5, 0.75] [0, 0, 0.25] [0, 0, 0.25] [0.25, 0.5, 0.75] [0.13,0.25,0.5] 0.29
A&M [0.5, 0.75, 1] [0.25, 0.5, 0.75] [0.5, 0.75, 1] [0.75, 1, 1] [0.5,0.75,0.94] 0.73
DR [0.75, 1, 1] [0.75, 1, 1] [0.5, 0.75, 1] [0.75, 1, 1] [0.69,0.94,1] 0.88
NR [0.75, 1, 1] [0.75, 1, 1] [0.25, 0.5, 0.75] [0.75, 1, 1] [0.63,0.88,0.94] 0.81
PA [0.25, 0.5, 0.75] [0.75, 1, 1] [0.25, 0.5, 0.75] [0.5, 0.75, 1] [0.44,0.69,0.88] 0.67
GOV [0.75, 1, 1] [0, 0.25, 0.5] [0.75, 1, 1] [0.5, 0.75, 1] [0.5,0.75,0.88] 0.71
AUT [0.75, 1, 1] [0.25, 0.5, 0.75] [0.75, 1, 1] [0.25, 0.5, 0.75] [0.5,0.75,0.88] 0.71
ACC [0.5, 0.75, 1] [0, 0.25, 0.5] [0, 0, 0.25] [0.5, 0.75, 1] [0.25,0.5,0.56] 0.44
EC [0.5, 0.75, 1] [0.75, 1, 1] [0.25, 0.5, 0.75] [0.25, 0.5, 0.75] [0.44,0.75,0.81] 0.67
OBS [0.5, 0.75, 1] [0, 0.25, 0.5] [0, 0.25, 0.5] [0.75, 1, 1] [0.31,0.56,0.75] 0.54
Sup [0.75, 1, 1] [0.25, 0.5, 0.75] [0.25, 0.5, 0.75] [0.75, 1, 1] [0.5,0.81,0.81] 0.71
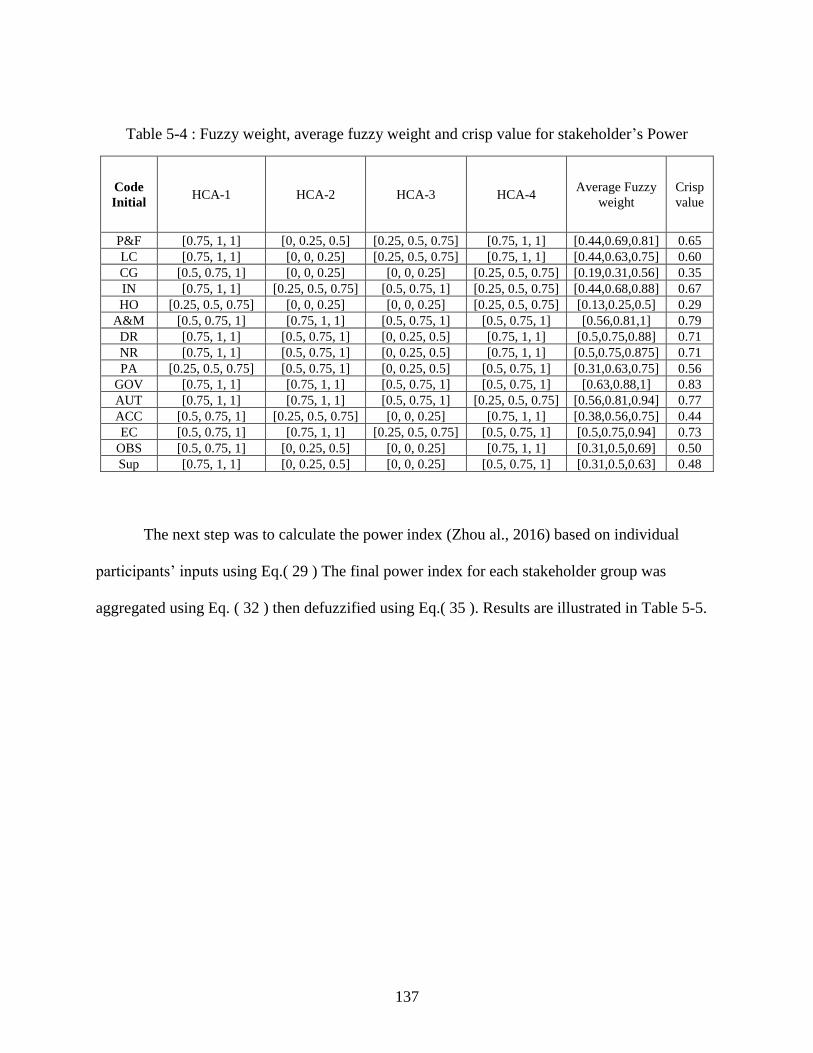
137
Table 5-4 : Fuzzy weight, average fuzzy weight and crisp value for stakeholder’s Power
Code
Initial HCA-1 HCA-2 HCA-3 HCA-4
Average Fuzzy
weight
Crisp
value
P&F [0.75, 1, 1] [0, 0.25, 0.5] [0.25, 0.5, 0.75] [0.75, 1, 1] [0.44,0.69,0.81] 0.65
LC [0.75, 1, 1] [0, 0, 0.25] [0.25, 0.5, 0.75] [0.75, 1, 1] [0.44,0.63,0.75] 0.60
CG [0.5, 0.75, 1] [0, 0, 0.25] [0, 0, 0.25] [0.25, 0.5, 0.75] [0.19,0.31,0.56] 0.35
IN [0.75, 1, 1] [0.25, 0.5, 0.75] [0.5, 0.75, 1] [0.25, 0.5, 0.75] [0.44,0.68,0.88] 0.67
HO [0.25, 0.5, 0.75] [0, 0, 0.25] [0, 0, 0.25] [0.25, 0.5, 0.75] [0.13,0.25,0.5] 0.29
A&M [0.5, 0.75, 1] [0.75, 1, 1] [0.5, 0.75, 1] [0.5, 0.75, 1] [0.56,0.81,1] 0.79
DR [0.75, 1, 1] [0.5, 0.75, 1] [0, 0.25, 0.5] [0.75, 1, 1] [0.5,0.75,0.88] 0.71
NR [0.75, 1, 1] [0.5, 0.75, 1] [0, 0.25, 0.5] [0.75, 1, 1] [0.5,0.75,0.875] 0.71
PA [0.25, 0.5, 0.75] [0.5, 0.75, 1] [0, 0.25, 0.5] [0.5, 0.75, 1] [0.31,0.63,0.75] 0.56
GOV [0.75, 1, 1] [0.75, 1, 1] [0.5, 0.75, 1] [0.5, 0.75, 1] [0.63,0.88,1] 0.83
AUT [0.75, 1, 1] [0.75, 1, 1] [0.5, 0.75, 1] [0.25, 0.5, 0.75] [0.56,0.81,0.94] 0.77
ACC [0.5, 0.75, 1] [0.25, 0.5, 0.75] [0, 0, 0.25] [0.75, 1, 1] [0.38,0.56,0.75] 0.44
EC [0.5, 0.75, 1] [0.75, 1, 1] [0.25, 0.5, 0.75] [0.5, 0.75, 1] [0.5,0.75,0.94] 0.73
OBS [0.5, 0.75, 1] [0, 0.25, 0.5] [0, 0, 0.25] [0.75, 1, 1] [0.31,0.5,0.69] 0.50
Sup [0.75, 1, 1] [0, 0.25, 0.5] [0, 0, 0.25] [0.5, 0.75, 1] [0.31,0.5,0.63] 0.48
The next step was to calculate the power index (Zhou al., 2016) based on individual
participants’ inputs using Eq.( 29 ) The final power index for each stakeholder group was
aggregated using Eq. ( 32 ) then defuzzified using Eq.( 35 ). Results are illustrated in Table 5-5.
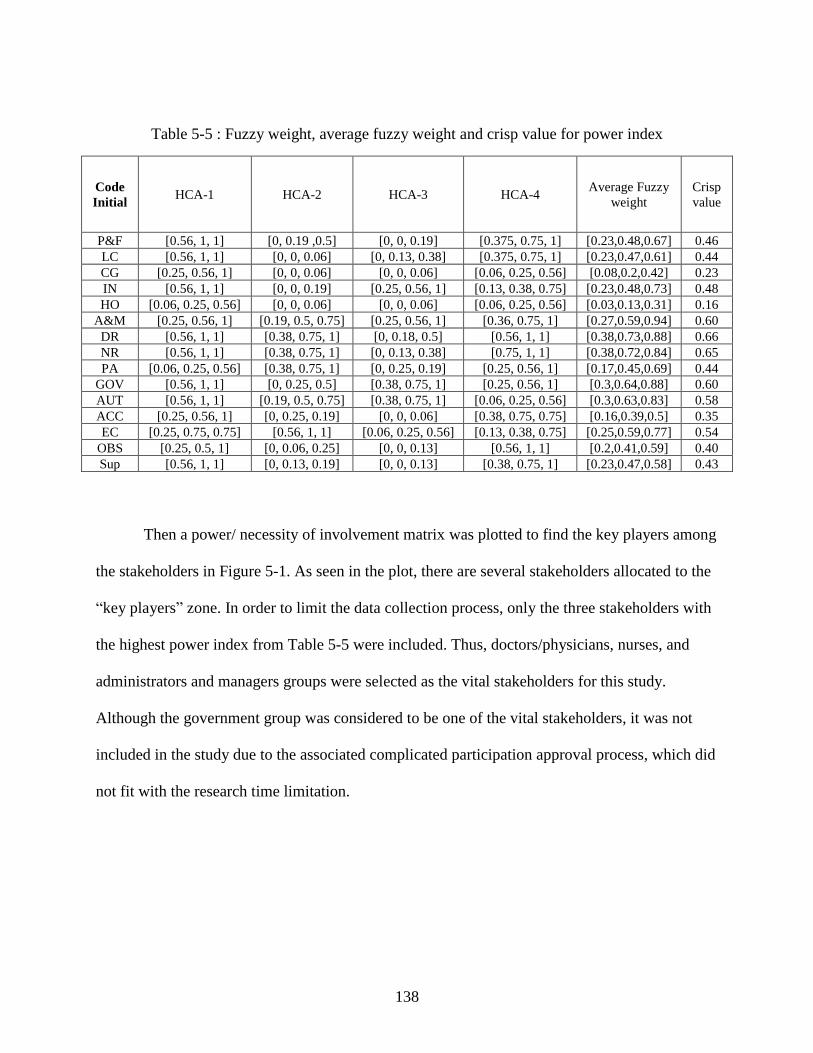
138
Table 5-5 : Fuzzy weight, average fuzzy weight and crisp value for power index
Code
Initial HCA-1 HCA-2 HCA-3 HCA-4
Average Fuzzy
weight
Crisp
value
P&F [0.56, 1, 1] [0, 0.19 ,0.5] [0, 0, 0.19] [0.375, 0.75, 1] [0.23,0.48,0.67] 0.46
LC [0.56, 1, 1] [0, 0, 0.06] [0, 0.13, 0.38] [0.375, 0.75, 1] [0.23,0.47,0.61] 0.44
CG [0.25, 0.56, 1] [0, 0, 0.06] [0, 0, 0.06] [0.06, 0.25, 0.56] [0.08,0.2,0.42] 0.23
IN [0.56, 1, 1] [0, 0, 0.19] [0.25, 0.56, 1] [0.13, 0.38, 0.75] [0.23,0.48,0.73] 0.48
HO [0.06, 0.25, 0.56] [0, 0, 0.06] [0, 0, 0.06] [0.06, 0.25, 0.56] [0.03,0.13,0.31] 0.16
A&M [0.25, 0.56, 1] [0.19, 0.5, 0.75] [0.25, 0.56, 1] [0.36, 0.75, 1] [0.27,0.59,0.94] 0.60
DR [0.56, 1, 1] [0.38, 0.75, 1] [0, 0.18, 0.5] [0.56, 1, 1] [0.38,0.73,0.88] 0.66
NR [0.56, 1, 1] [0.38, 0.75, 1] [0, 0.13, 0.38] [0.75, 1, 1] [0.38,0.72,0.84] 0.65
PA [0.06, 0.25, 0.56] [0.38, 0.75, 1] [0, 0.25, 0.19] [0.25, 0.56, 1] [0.17,0.45,0.69] 0.44
GOV [0.56, 1, 1] [0, 0.25, 0.5] [0.38, 0.75, 1] [0.25, 0.56, 1] [0.3,0.64,0.88] 0.60
AUT [0.56, 1, 1] [0.19, 0.5, 0.75] [0.38, 0.75, 1] [0.06, 0.25, 0.56] [0.3,0.63,0.83] 0.58
ACC [0.25, 0.56, 1] [0, 0.25, 0.19] [0, 0, 0.06] [0.38, 0.75, 0.75] [0.16,0.39,0.5] 0.35
EC [0.25, 0.75, 0.75] [0.56, 1, 1] [0.06, 0.25, 0.56] [0.13, 0.38, 0.75] [0.25,0.59,0.77] 0.54
OBS [0.25, 0.5, 1] [0, 0.06, 0.25] [0, 0, 0.13] [0.56, 1, 1] [0.2,0.41,0.59] 0.40
Sup [0.56, 1, 1] [0, 0.13, 0.19] [0, 0, 0.13] [0.38, 0.75, 1] [0.23,0.47,0.58] 0.43
Then a power/ necessity of involvement matrix was plotted to find the key players among
the stakeholders in Figure 5-1. As seen in the plot, there are several stakeholders allocated to the
“key players” zone. In order to limit the data collection process, only the three stakeholders with
the highest power index from Table 5-5 were included. Thus, doctors/physicians, nurses, and
administrators and managers groups were selected as the vital stakeholders for this study.
Although the government group was considered to be one of the vital stakeholders, it was not
included in the study due to the associated complicated participation approval process, which did
not fit with the research time limitation.
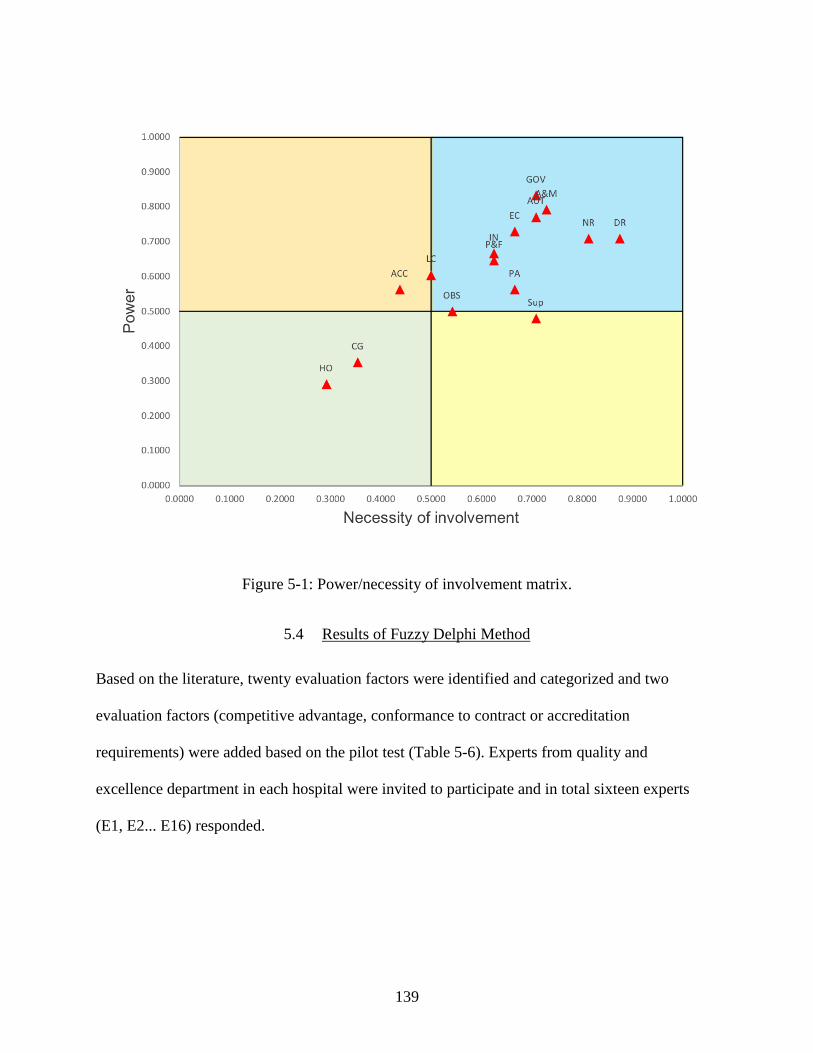
139
Figure 5-1: Power/necessity of involvement matrix.
5.4 Results of Fuzzy Delphi Method
Based on the literature, twenty evaluation factors were identified and categorized and two
evaluation factors (competitive advantage, conformance to contract or accreditation
requirements) were added based on the pilot test (Table 5-6). Experts from quality and
excellence department in each hospital were invited to participate and in total sixteen experts
(E1, E2... E16) responded.
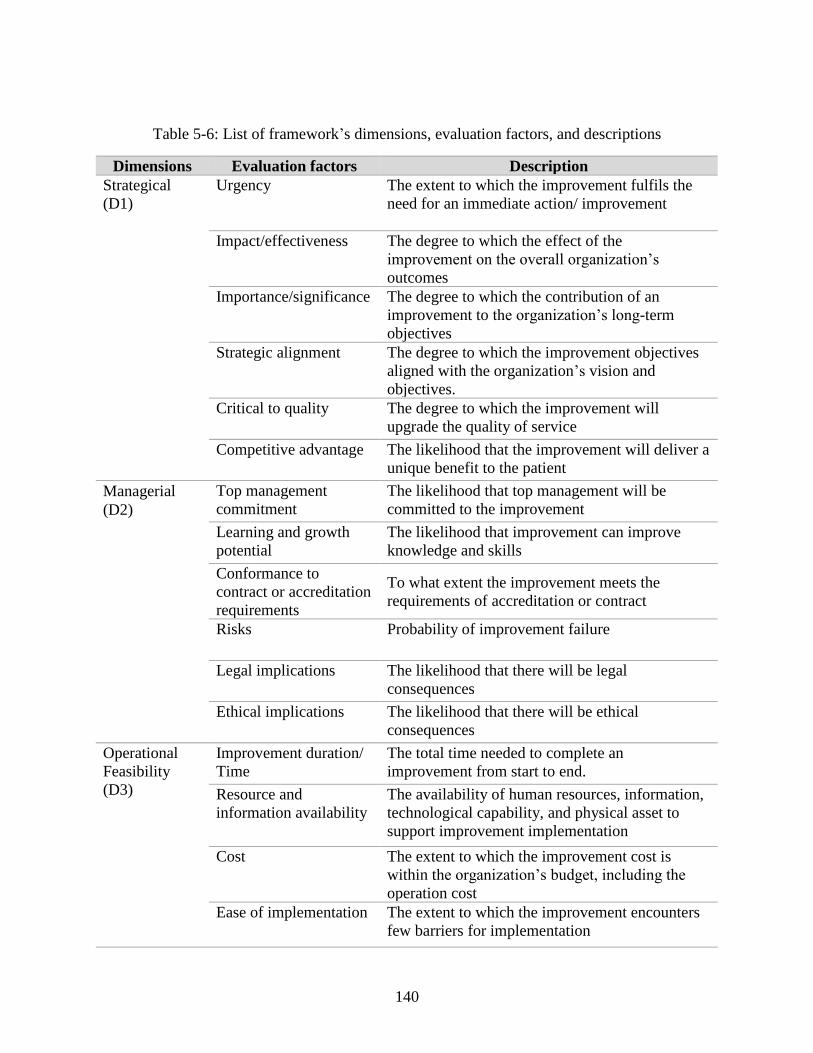
140
Table 5-6: List of framework’s dimensions, evaluation factors, and descriptions
Dimensions Evaluation factors Description
Strategical
(D1)
Urgency The extent to which the improvement fulfils the
need for an immediate action/ improvement
Impact/effectiveness The degree to which the effect of the
improvement on the overall organization’s
outcomes
Importance/significance The degree to which the contribution of an
improvement to the organization’s long-term
objectives
Strategic alignment The degree to which the improvement objectives
aligned with the organization’s vision and
objectives.
Critical to quality The degree to which the improvement will
upgrade the quality of service
Competitive advantage The likelihood that the improvement will deliver a
unique benefit to the patient
Managerial
(D2)
Top management
commitment
The likelihood that top management will be
committed to the improvement
Learning and growth
potential
The likelihood that improvement can improve
knowledge and skills
Conformance to
contract or accreditation
requirements
To what extent the improvement meets the
requirements of accreditation or contract
Risks Probability of improvement failure
Legal implications The likelihood that there will be legal
consequences
Ethical implications The likelihood that there will be ethical
consequences
Operational
Feasibility
(D3)
Improvement duration/
Time
The total time needed to complete an
improvement from start to end.
Resource and
information availability
The availability of human resources, information,
technological capability, and physical asset to
support improvement implementation
Cost The extent to which the improvement cost is
within the organization’s budget, including the
operation cost
Ease of implementation The extent to which the improvement encounters
few barriers for implementation
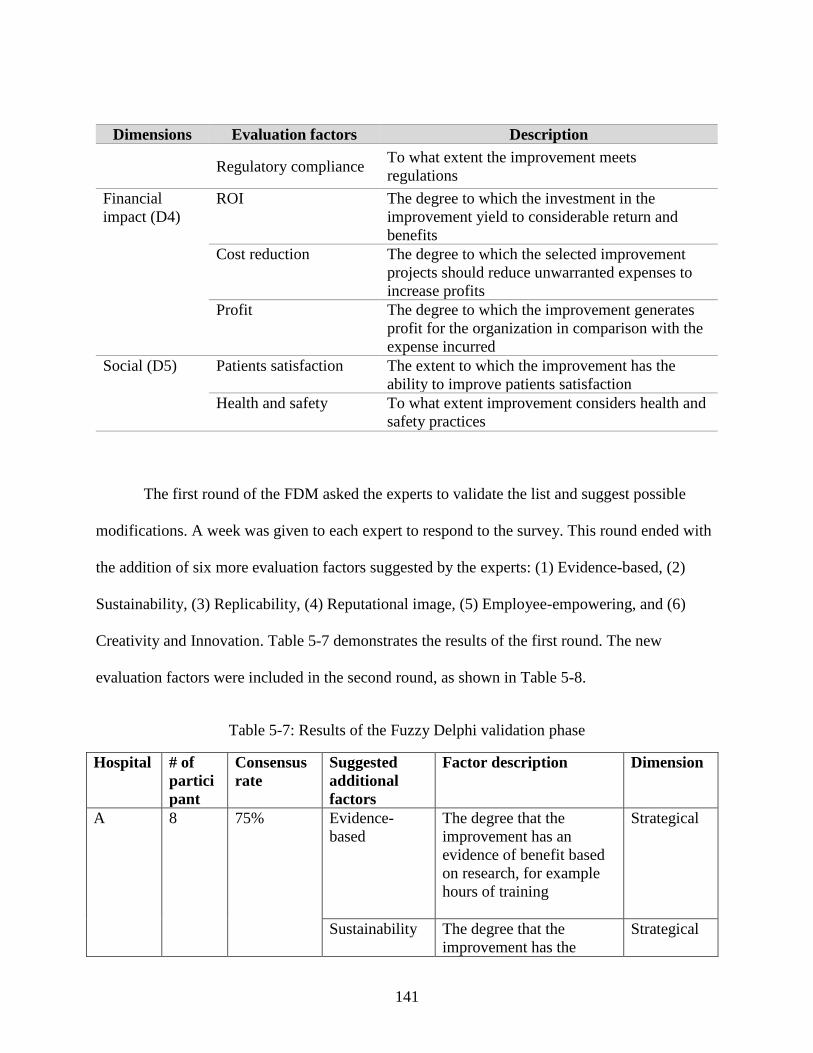
141
Dimensions Evaluation factors Description
Regulatory compliance To what extent the improvement meets
regulations
Financial
impact (D4)
ROI The degree to which the investment in the
improvement yield to considerable return and
benefits
Cost reduction The degree to which the selected improvement
projects should reduce unwarranted expenses to
increase profits
Profit The degree to which the improvement generates
profit for the organization in comparison with the
expense incurred
Social (D5) Patients satisfaction The extent to which the improvement has the
ability to improve patients satisfaction
Health and safety To what extent improvement considers health and
safety practices
The first round of the FDM asked the experts to validate the list and suggest possible
modifications. A week was given to each expert to respond to the survey. This round ended with
the addition of six more evaluation factors suggested by the experts: (1) Evidence-based, (2)
Sustainability, (3) Replicability, (4) Reputational image, (5) Employee-empowering, and (6)
Creativity and Innovation. Table 5-7 demonstrates the results of the first round. The new
evaluation factors were included in the second round, as shown in Table 5-8.
Table 5-7: Results of the Fuzzy Delphi validation phase
Hospital # of
partici
pant
Consensus
rate
Suggested
additional
factors
Factor description Dimension
A 8 75% Evidence-
based
The degree that the
improvement has an
evidence of benefit based
on research, for example
hours of training
Strategical
Sustainability The degree that the
improvement has the
Strategical
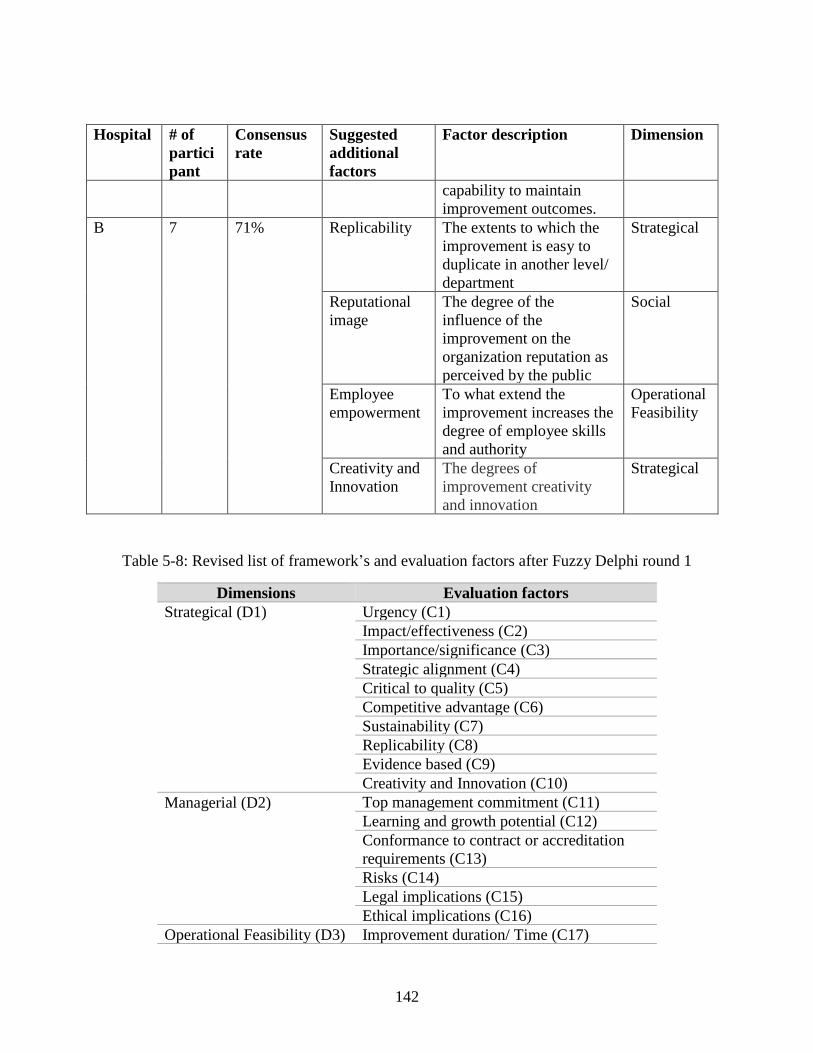
142
Hospital # of
partici
pant
Consensus
rate
Suggested
additional
factors
Factor description Dimension
capability to maintain
improvement outcomes.
B 7 71% Replicability The extents to which the
improvement is easy to
duplicate in another level/
department
Strategical
Reputational
image
The degree of the
influence of the
improvement on the
organization reputation as
perceived by the public
Social
Employee
empowerment
To what extend the
improvement increases the
degree of employee skills
and authority
Operational
Feasibility
Creativity and
Innovation
The degrees of
improvement creativity
and innovation
Strategical
Table 5-8: Revised list of framework’s and evaluation factors after Fuzzy Delphi round 1
Dimensions Evaluation factors
Strategical (D1) Urgency (C1)
Impact/effectiveness (C2)
Importance/significance (C3)
Strategic alignment (C4)
Critical to quality (C5)
Competitive advantage (C6)
Sustainability (C7)
Replicability (C8)
Evidence based (C9)
Creativity and Innovation (C10)
Managerial (D2)
Top management commitment (C11)
Learning and growth potential (C12)
Conformance to contract or accreditation
requirements (C13)
Risks (C14)
Legal implications (C15)
Ethical implications (C16)
Operational Feasibility (D3) Improvement duration/ Time (C17)
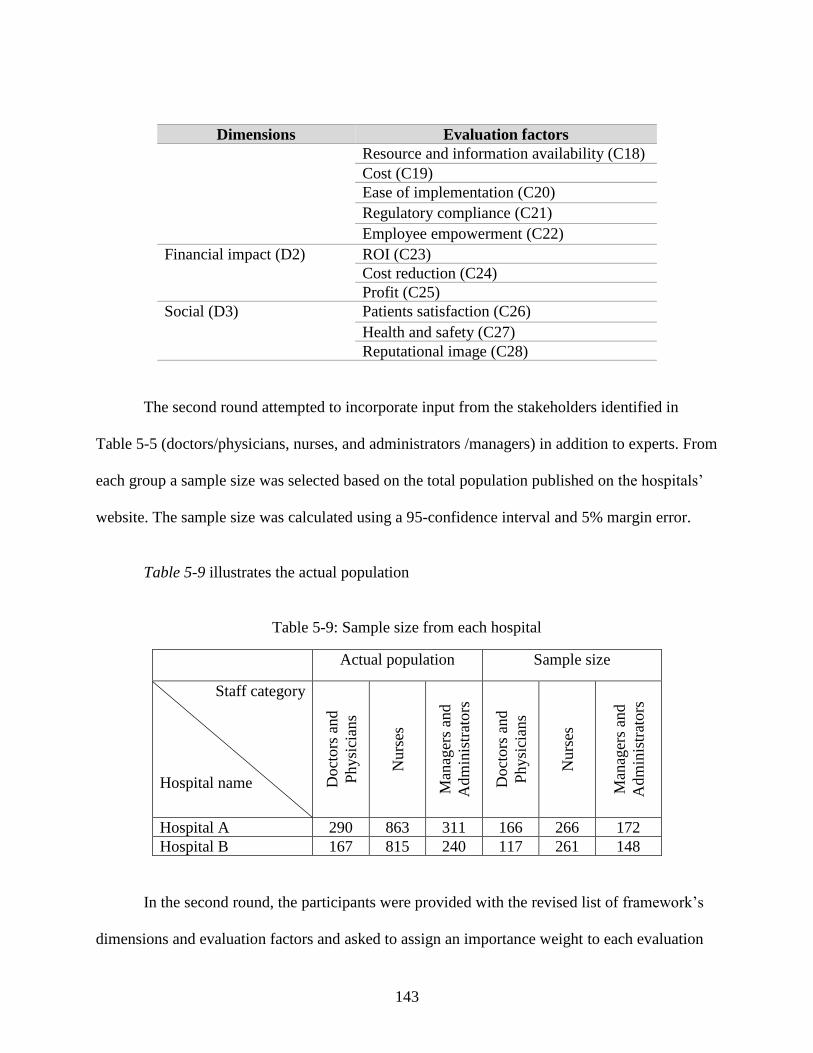
143
Dimensions Evaluation factors
Resource and information availability (C18)
Cost (C19)
Ease of implementation (C20)
Regulatory compliance (C21)
Employee empowerment (C22)
Financial impact (D2) ROI (C23)
Cost reduction (C24)
Profit (C25)
Social (D3) Patients satisfaction (C26)
Health and safety (C27)
Reputational image (C28)
The second round attempted to incorporate input from the stakeholders identified in
Table 5-5 (doctors/physicians, nurses, and administrators /managers) in addition to experts. From
each group a sample size was selected based on the total population published on the hospitals’
website. The sample size was calculated using a 95-confidence interval and 5% margin error.
Table 5-9 illustrates the actual population
Table 5-9: Sample size from each hospital
Actual population Sample size
Staff category
Hospital name Doct
ors
and
Physi
cian
s
Nurs
es
Man
ager
s an
d
Adm
inis
trat
ors
Doct
ors
and
Physi
cian
s
Nurs
es
Man
ager
s an
d
Adm
inis
trat
ors
Hospital A 290 863 311 166 266 172
Hospital B 167 815 240 117 261 148
In the second round, the participants were provided with the revised list of framework’s
dimensions and evaluation factors and asked to assign an importance weight to each evaluation
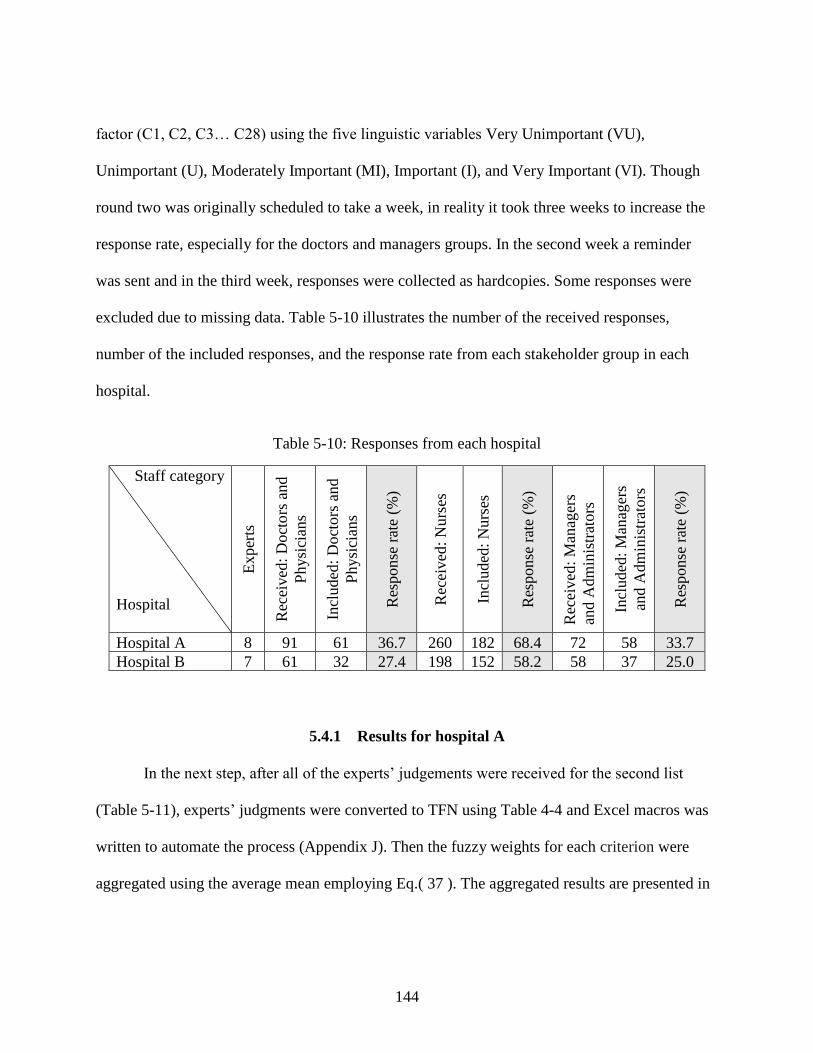
144
factor (C1, C2, C3… C28) using the five linguistic variables Very Unimportant (VU),
Unimportant (U), Moderately Important (MI), Important (I), and Very Important (VI). Though
round two was originally scheduled to take a week, in reality it took three weeks to increase the
response rate, especially for the doctors and managers groups. In the second week a reminder
was sent and in the third week, responses were collected as hardcopies. Some responses were
excluded due to missing data. Table 5-10 illustrates the number of the received responses,
number of the included responses, and the response rate from each stakeholder group in each
hospital.
Table 5-10: Responses from each hospital
Staff category
Hospital
Exper
ts
Rec
eived
: D
oct
ors
and
Physi
cian
s
Incl
uded
: D
oct
ors
and
Physi
cian
s
Res
ponse
rat
e (%
)
Rec
eived
: N
urs
es
Incl
uded
: N
urs
es
Res
ponse
rat
e (%
)
Rec
eived
: M
anag
ers
and A
dm
inis
trat
ors
Incl
uded
: M
anag
ers
and A
dm
inis
trat
ors
Res
ponse
rat
e (%
)
Hospital A 8 91 61 36.7 260 182 68.4 72 58 33.7
Hospital B 7 61 32 27.4 198 152 58.2 58 37 25.0
5.4.1 Results for hospital A
In the next step, after all of the experts’ judgements were received for the second list
(Table 5-11), experts’ judgments were converted to TFN using Table 4-4 and Excel macros was
written to automate the process (Appendix J). Then the fuzzy weights for each criterion were
aggregated using the average mean employing Eq.( 37 ). The aggregated results are presented in
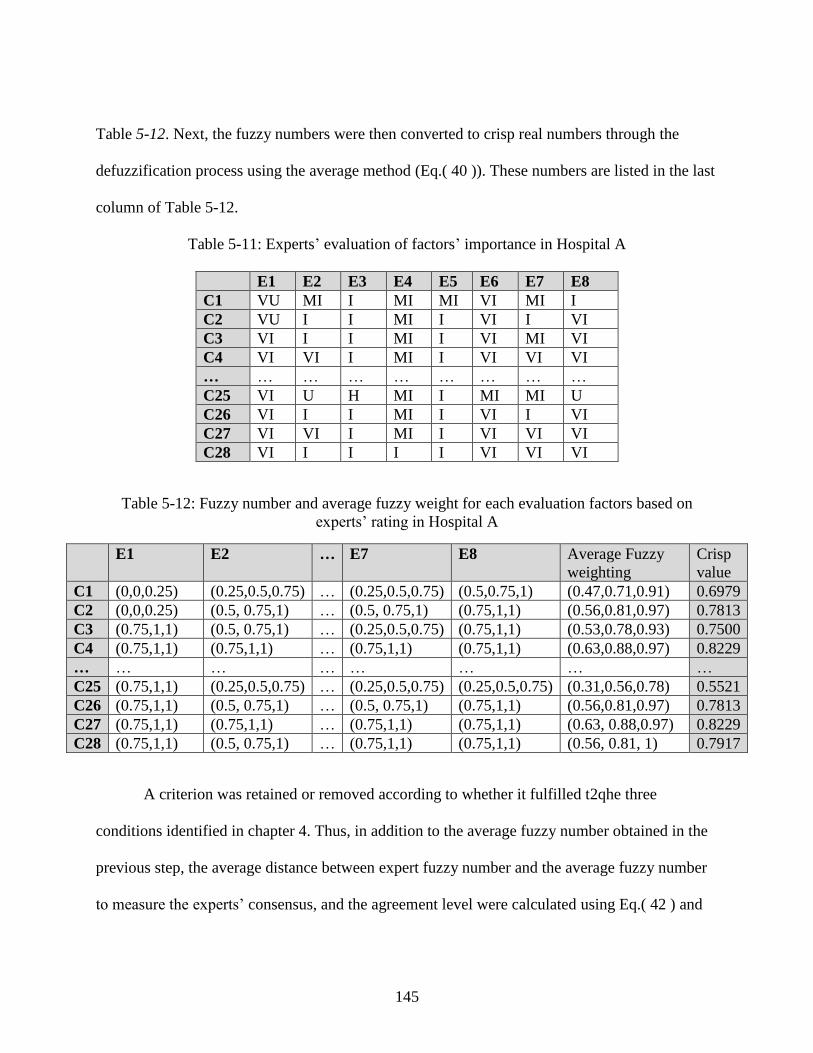
145
Table 5-12. Next, the fuzzy numbers were then converted to crisp real numbers through the
defuzzification process using the average method (Eq.( 40 )). These numbers are listed in the last
column of Table 5-12.
Table 5-11: Experts’ evaluation of factors’ importance in Hospital A
E1 E2 E3 E4 E5 E6 E7 E8
C1 VU MI I MI MI VI MI I
C2 VU I I MI I VI I VI
C3 VI I I MI I VI MI VI
C4 VI VI I MI I VI VI VI
… … … … … … … … …
C25 VI U H MI I MI MI U
C26 VI I I MI I VI I VI
C27 VI VI I MI I VI VI VI
C28 VI I I I I VI VI VI
Table 5-12: Fuzzy number and average fuzzy weight for each evaluation factors based on
experts’ rating in Hospital A
E1 E2 … E7 E8 Average Fuzzy
weighting
Crisp
value
C1 (0,0,0.25) (0.25,0.5,0.75) … (0.25,0.5,0.75) (0.5,0.75,1) (0.47,0.71,0.91) 0.6979
C2 (0,0,0.25) (0.5, 0.75,1) … (0.5, 0.75,1) (0.75,1,1) (0.56,0.81,0.97) 0.7813
C3 (0.75,1,1) (0.5, 0.75,1) … (0.25,0.5,0.75) (0.75,1,1) (0.53,0.78,0.93) 0.7500
C4 (0.75,1,1) (0.75,1,1) … (0.75,1,1) (0.75,1,1) (0.63,0.88,0.97) 0.8229
… … … … … … … …
C25 (0.75,1,1) (0.25,0.5,0.75) … (0.25,0.5,0.75) (0.25,0.5,0.75) (0.31,0.56,0.78) 0.5521
C26 (0.75,1,1) (0.5, 0.75,1) … (0.5, 0.75,1) (0.75,1,1) (0.56,0.81,0.97) 0.7813
C27 (0.75,1,1) (0.75,1,1) … (0.75,1,1) (0.75,1,1) (0.63, 0.88,0.97) 0.8229
C28 (0.75,1,1) (0.5, 0.75,1) … (0.75,1,1) (0.75,1,1) (0.56, 0.81, 1) 0.7917
A criterion was retained or removed according to whether it fulfilled t2qhe three
conditions identified in chapter 4. Thus, in addition to the average fuzzy number obtained in the
previous step, the average distance between expert fuzzy number and the average fuzzy number
to measure the experts’ consensus, and the agreement level were calculated using Eq.( 42 ) and
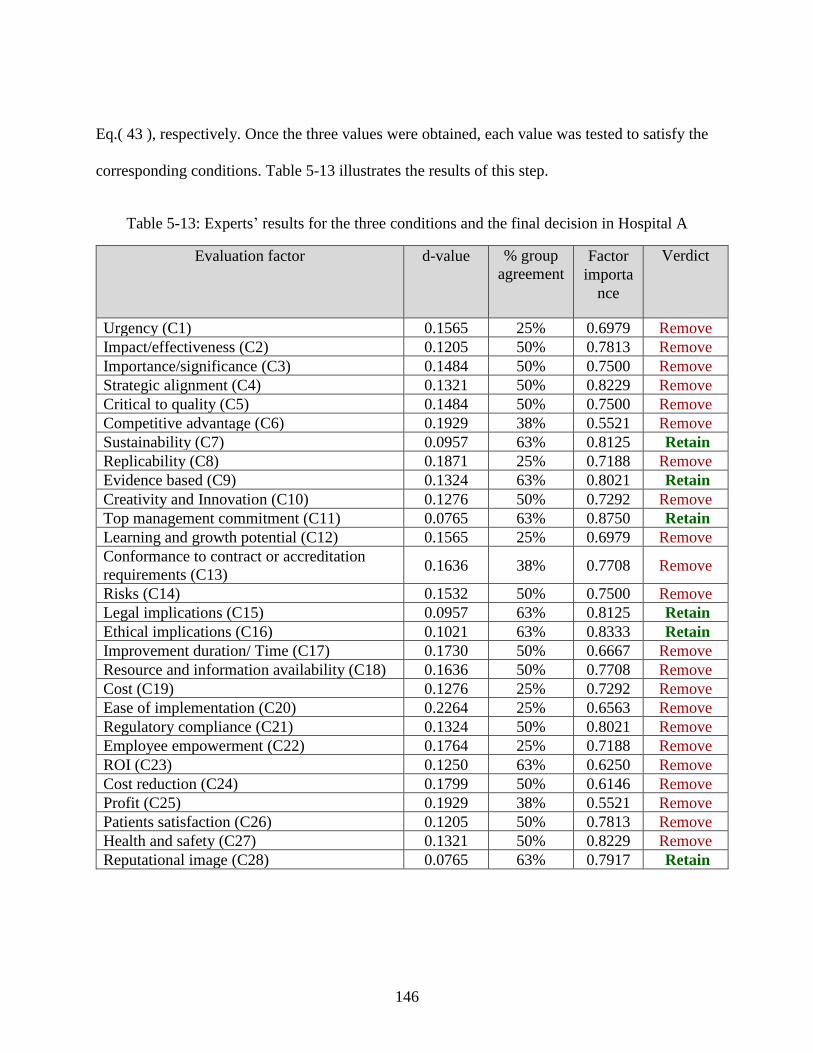
146
Eq.( 43 ), respectively. Once the three values were obtained, each value was tested to satisfy the
corresponding conditions. Table 5-13 illustrates the results of this step.
Table 5-13: Experts’ results for the three conditions and the final decision in Hospital A
Evaluation factor d-value % group
agreement Factor
importa
nce
Verdict
Urgency (C1) 0.1565 25% 0.6979 Remove
Impact/effectiveness (C2) 0.1205 50% 0.7813 Remove
Importance/significance (C3) 0.1484 50% 0.7500 Remove
Strategic alignment (C4) 0.1321 50% 0.8229 Remove
Critical to quality (C5) 0.1484 50% 0.7500 Remove
Competitive advantage (C6) 0.1929 38% 0.5521 Remove
Sustainability (C7) 0.0957 63% 0.8125 Retain
Replicability (C8) 0.1871 25% 0.7188 Remove
Evidence based (C9) 0.1324 63% 0.8021 Retain
Creativity and Innovation (C10) 0.1276 50% 0.7292 Remove
Top management commitment (C11) 0.0765 63% 0.8750 Retain
Learning and growth potential (C12) 0.1565 25% 0.6979 Remove
Conformance to contract or accreditation
requirements (C13) 0.1636 38% 0.7708 Remove
Risks (C14) 0.1532 50% 0.7500 Remove
Legal implications (C15) 0.0957 63% 0.8125 Retain
Ethical implications (C16) 0.1021 63% 0.8333 Retain
Improvement duration/ Time (C17) 0.1730 50% 0.6667 Remove
Resource and information availability (C18) 0.1636 50% 0.7708 Remove
Cost (C19) 0.1276 25% 0.7292 Remove
Ease of implementation (C20) 0.2264 25% 0.6563 Remove
Regulatory compliance (C21) 0.1324 50% 0.8021 Remove
Employee empowerment (C22) 0.1764 25% 0.7188 Remove
ROI (C23) 0.1250 63% 0.6250 Remove
Cost reduction (C24) 0.1799 50% 0.6146 Remove
Profit (C25) 0.1929 38% 0.5521 Remove
Patients satisfaction (C26) 0.1205 50% 0.7813 Remove
Health and safety (C27) 0.1321 50% 0.8229 Remove
Reputational image (C28) 0.0765 63% 0.7917 Retain
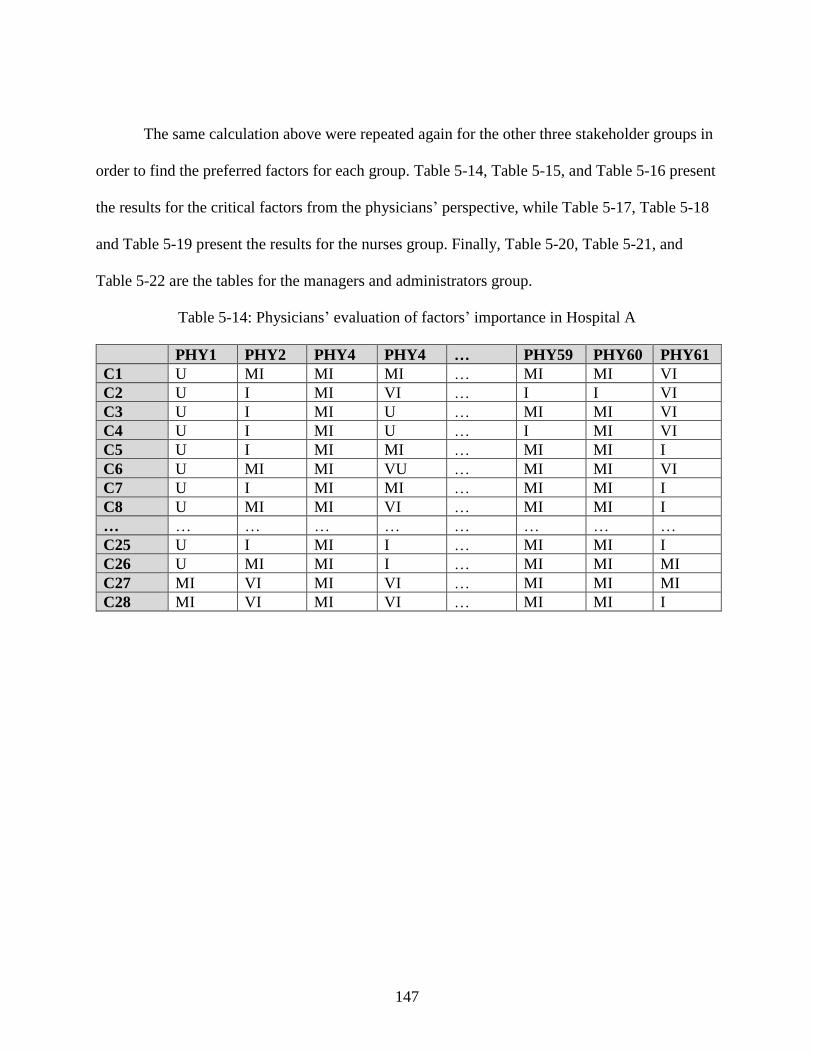
147
The same calculation above were repeated again for the other three stakeholder groups in
order to find the preferred factors for each group. Table 5-14, Table 5-15, and Table 5-16 present
the results for the critical factors from the physicians’ perspective, while Table 5-17, Table 5-18
and Table 5-19 present the results for the nurses group. Finally, Table 5-20, Table 5-21, and
Table 5-22 are the tables for the managers and administrators group.
Table 5-14: Physicians’ evaluation of factors’ importance in Hospital A
PHY1 PHY2 PHY4 PHY4 … PHY59 PHY60 PHY61
C1 U MI MI MI … MI MI VI
C2 U I MI VI … I I VI
C3 U I MI U … MI MI VI
C4 U I MI U … I MI VI
C5 U I MI MI … MI MI I
C6 U MI MI VU … MI MI VI
C7 U I MI MI … MI MI I
C8 U MI MI VI … MI MI I
… … … … … … … … …
C25 U I MI I … MI MI I
C26 U MI MI I … MI MI MI
C27 MI VI MI VI … MI MI MI
C28 MI VI MI VI … MI MI I
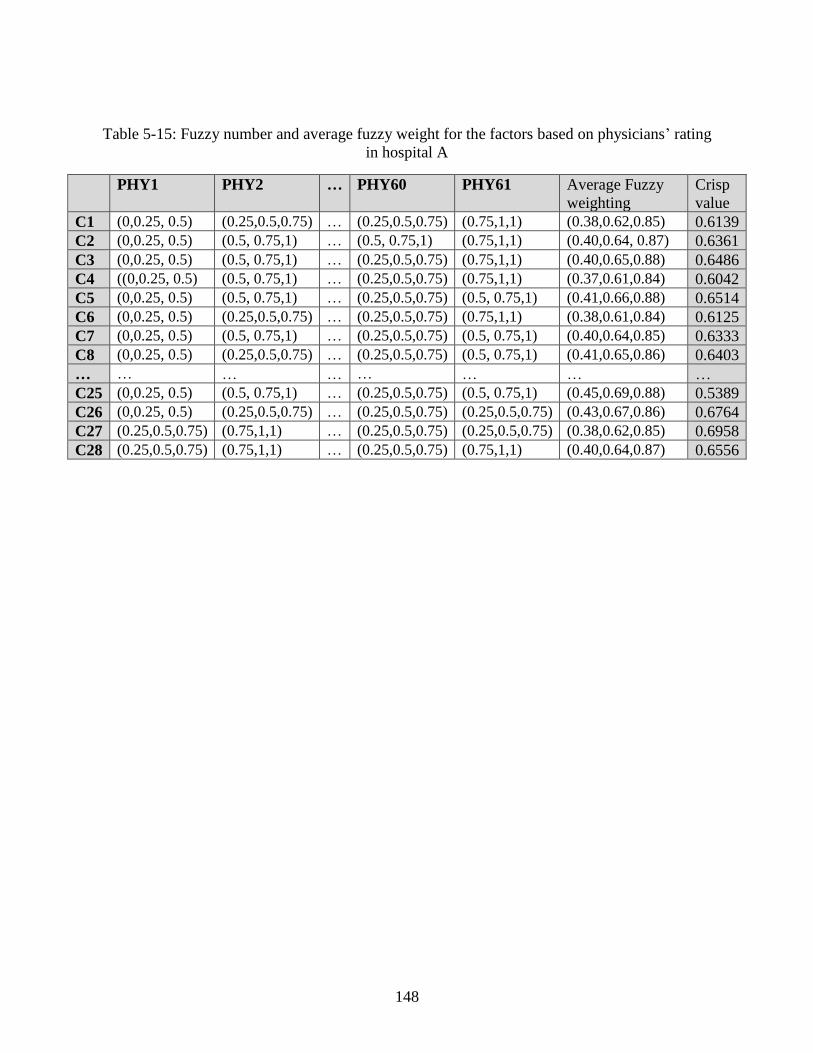
148
Table 5-15: Fuzzy number and average fuzzy weight for the factors based on physicians’ rating
in hospital A
PHY1 PHY2 … PHY60 PHY61 Average Fuzzy
weighting
Crisp
value
C1 (0,0.25, 0.5) (0.25,0.5,0.75) … (0.25,0.5,0.75) (0.75,1,1) (0.38,0.62,0.85) 0.6139
C2 (0,0.25, 0.5) (0.5, 0.75,1) … (0.5, 0.75,1) (0.75,1,1) (0.40,0.64, 0.87) 0.6361
C3 (0,0.25, 0.5) (0.5, 0.75,1) … (0.25,0.5,0.75) (0.75,1,1) (0.40,0.65,0.88) 0.6486
C4 ((0,0.25, 0.5) (0.5, 0.75,1) … (0.25,0.5,0.75) (0.75,1,1) (0.37,0.61,0.84) 0.6042
C5 (0,0.25, 0.5) (0.5, 0.75,1) … (0.25,0.5,0.75) (0.5, 0.75,1) (0.41,0.66,0.88) 0.6514
C6 (0,0.25, 0.5) (0.25,0.5,0.75) … (0.25,0.5,0.75) (0.75,1,1) (0.38,0.61,0.84) 0.6125
C7 (0,0.25, 0.5) (0.5, 0.75,1) … (0.25,0.5,0.75) (0.5, 0.75,1) (0.40,0.64,0.85) 0.6333
C8 (0,0.25, 0.5) (0.25,0.5,0.75) … (0.25,0.5,0.75) (0.5, 0.75,1) (0.41,0.65,0.86) 0.6403
… … … … … … … …
C25 (0,0.25, 0.5) (0.5, 0.75,1) … (0.25,0.5,0.75) (0.5, 0.75,1) (0.45,0.69,0.88) 0.5389
C26 (0,0.25, 0.5) (0.25,0.5,0.75) … (0.25,0.5,0.75) (0.25,0.5,0.75) (0.43,0.67,0.86) 0.6764
C27 (0.25,0.5,0.75) (0.75,1,1) … (0.25,0.5,0.75) (0.25,0.5,0.75) (0.38,0.62,0.85) 0.6958
C28 (0.25,0.5,0.75) (0.75,1,1) … (0.25,0.5,0.75) (0.75,1,1) (0.40,0.64,0.87) 0.6556

149
Table 5-16: Physicians’ result for the three conditions and the final decision in hospital A
Evaluation factor d-value % group
agreement Factor
importa
nce
Verdict
Urgency (C1) 0.1864 72% 0.6139 Remove
Impact/effectiveness (C2) 0.1700 78% 0.6361 Remove
Importance/significance (C3) 0.1595 80% 0.6486 Remove
Strategic alignment (C4) 0.1696 82% 0.6042 Remove
Critical to quality (C5) 0.1769 72% 0.6514 Retain
Competitive advantage (C6) 0.1931 72% 0.6125 Remove
Sustainability (C7) 0.1877 72% 0.6333 Remove
Replicability (C8) 0.1962 63% 0.6403 Remove
Evidence based (C9) 0.1969 68% 0.6056 Remove
Creativity and Innovation (C10) 0.1924 70% 0.6292 Remove
Top management commitment (C11) 0.1860 73% 0.6278 Remove
Learning and growth potential (C12) 0.1971 70% 0.6236 Remove
Conformance to contract or accreditation
requirements (C13) 0.1608 85% 0.6181 Remove
Risks (C14) 0.1887 72% 0.6208 Remove
Legal implications (C15) 0.1877 68% 0.6403 Remove
Ethical implications (C16) 0.2140 63% 0.6083 Remove
Improvement duration/ Time (C17) 0.1673 83% 0.5833 Remove
Resource and information availability
(C18) 0.1761 82% 0.6153
Remove
Cost (C19) 0.1836 77% 0.5917 Remove
Ease of implementation (C20) 0.1816 77% 0.6222 Remove
Regulatory compliance (C21) 0.1693 78% 0.6278 Remove
Employee empowerment (C22) 0.2082 65% 0.5792 Remove
ROI (C23) 0.1575 82% 0.5819 Remove
Cost reduction (C24) 0.1490 78% 0.5528 Remove
Profit (C25) 0.1597 47% 0.5389 Remove
Patients satisfaction (C26) 0.1826 67% 0.6764 Retain
Health and safety (C27) 0.1656 67% 0.6958 Retain
Reputational image (C28) 0.1878 67% 0.6556 Retain
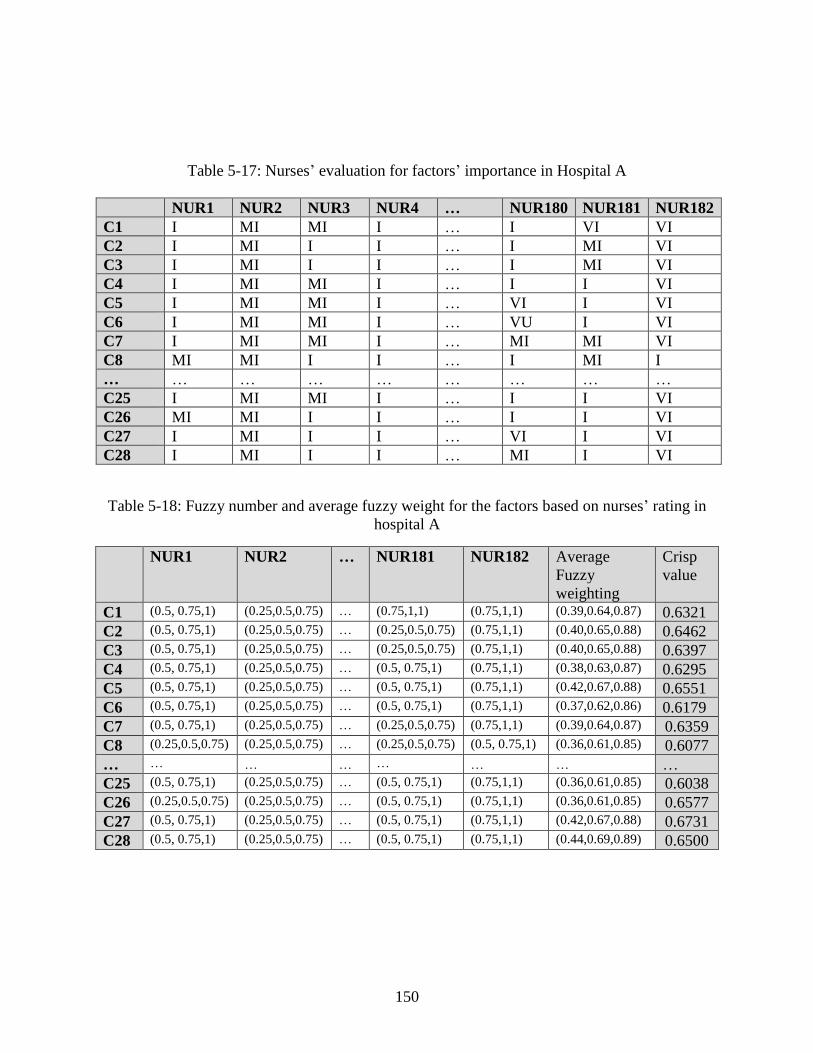
150
Table 5-17: Nurses’ evaluation for factors’ importance in Hospital A
NUR1 NUR2 NUR3 NUR4 … NUR180 NUR181 NUR182
C1 I MI MI I … I VI VI
C2 I MI I I … I MI VI
C3 I MI I I … I MI VI
C4 I MI MI I … I I VI
C5 I MI MI I … VI I VI
C6 I MI MI I … VU I VI
C7 I MI MI I … MI MI VI
C8 MI MI I I … I MI I
… … … … … … … … …
C25 I MI MI I … I I VI
C26 MI MI I I … I I VI
C27 I MI I I … VI I VI
C28 I MI I I … MI I VI
Table 5-18: Fuzzy number and average fuzzy weight for the factors based on nurses’ rating in
hospital A
NUR1 NUR2 … NUR181 NUR182 Average
Fuzzy
weighting
Crisp
value
C1 (0.5, 0.75,1) (0.25,0.5,0.75) … (0.75,1,1) (0.75,1,1) (0.39,0.64,0.87) 0.6321
C2 (0.5, 0.75,1) (0.25,0.5,0.75) … (0.25,0.5,0.75) (0.75,1,1) (0.40,0.65,0.88) 0.6462
C3 (0.5, 0.75,1) (0.25,0.5,0.75) … (0.25,0.5,0.75) (0.75,1,1) (0.40,0.65,0.88) 0.6397
C4 (0.5, 0.75,1) (0.25,0.5,0.75) … (0.5, 0.75,1) (0.75,1,1) (0.38,0.63,0.87) 0.6295
C5 (0.5, 0.75,1) (0.25,0.5,0.75) … (0.5, 0.75,1) (0.75,1,1) (0.42,0.67,0.88) 0.6551
C6 (0.5, 0.75,1) (0.25,0.5,0.75) … (0.5, 0.75,1) (0.75,1,1) (0.37,0.62,0.86) 0.6179
C7 (0.5, 0.75,1) (0.25,0.5,0.75) … (0.25,0.5,0.75) (0.75,1,1) (0.39,0.64,0.87) 0.6359
C8 (0.25,0.5,0.75) (0.25,0.5,0.75) … (0.25,0.5,0.75) (0.5, 0.75,1) (0.36,0.61,0.85) 0.6077
… … … … … … … …
C25 (0.5, 0.75,1) (0.25,0.5,0.75) … (0.5, 0.75,1) (0.75,1,1) (0.36,0.61,0.85) 0.6038
C26 (0.25,0.5,0.75) (0.25,0.5,0.75) … (0.5, 0.75,1) (0.75,1,1) (0.36,0.61,0.85) 0.6577
C27 (0.5, 0.75,1) (0.25,0.5,0.75) … (0.5, 0.75,1) (0.75,1,1) (0.42,0.67,0.88) 0.6731
C28 (0.5, 0.75,1) (0.25,0.5,0.75) … (0.5, 0.75,1) (0.75,1,1) (0.44,0.69,0.89) 0.6500
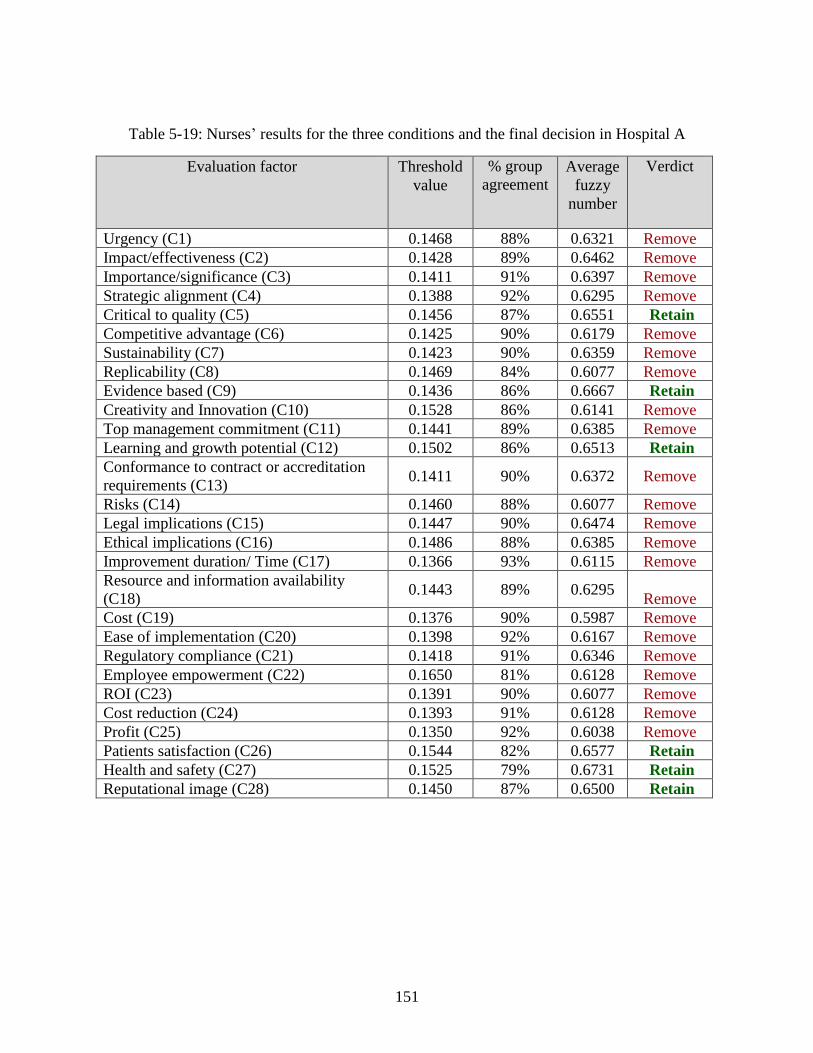
151
Table 5-19: Nurses’ results for the three conditions and the final decision in Hospital A
Evaluation factor Threshold
value
% group
agreement Average
fuzzy
number
Verdict
Urgency (C1) 0.1468 88% 0.6321 Remove
Impact/effectiveness (C2) 0.1428 89% 0.6462 Remove
Importance/significance (C3) 0.1411 91% 0.6397 Remove
Strategic alignment (C4) 0.1388 92% 0.6295 Remove
Critical to quality (C5) 0.1456 87% 0.6551 Retain
Competitive advantage (C6) 0.1425 90% 0.6179 Remove
Sustainability (C7) 0.1423 90% 0.6359 Remove
Replicability (C8) 0.1469 84% 0.6077 Remove
Evidence based (C9) 0.1436 86% 0.6667 Retain
Creativity and Innovation (C10) 0.1528 86% 0.6141 Remove
Top management commitment (C11) 0.1441 89% 0.6385 Remove
Learning and growth potential (C12) 0.1502 86% 0.6513 Retain
Conformance to contract or accreditation
requirements (C13) 0.1411 90% 0.6372 Remove
Risks (C14) 0.1460 88% 0.6077 Remove
Legal implications (C15) 0.1447 90% 0.6474 Remove
Ethical implications (C16) 0.1486 88% 0.6385 Remove
Improvement duration/ Time (C17) 0.1366 93% 0.6115 Remove
Resource and information availability
(C18) 0.1443 89% 0.6295
Remove
Cost (C19) 0.1376 90% 0.5987 Remove
Ease of implementation (C20) 0.1398 92% 0.6167 Remove
Regulatory compliance (C21) 0.1418 91% 0.6346 Remove
Employee empowerment (C22) 0.1650 81% 0.6128 Remove
ROI (C23) 0.1391 90% 0.6077 Remove
Cost reduction (C24) 0.1393 91% 0.6128 Remove
Profit (C25) 0.1350 92% 0.6038 Remove
Patients satisfaction (C26) 0.1544 82% 0.6577 Retain
Health and safety (C27) 0.1525 79% 0.6731 Retain
Reputational image (C28) 0.1450 87% 0.6500 Retain
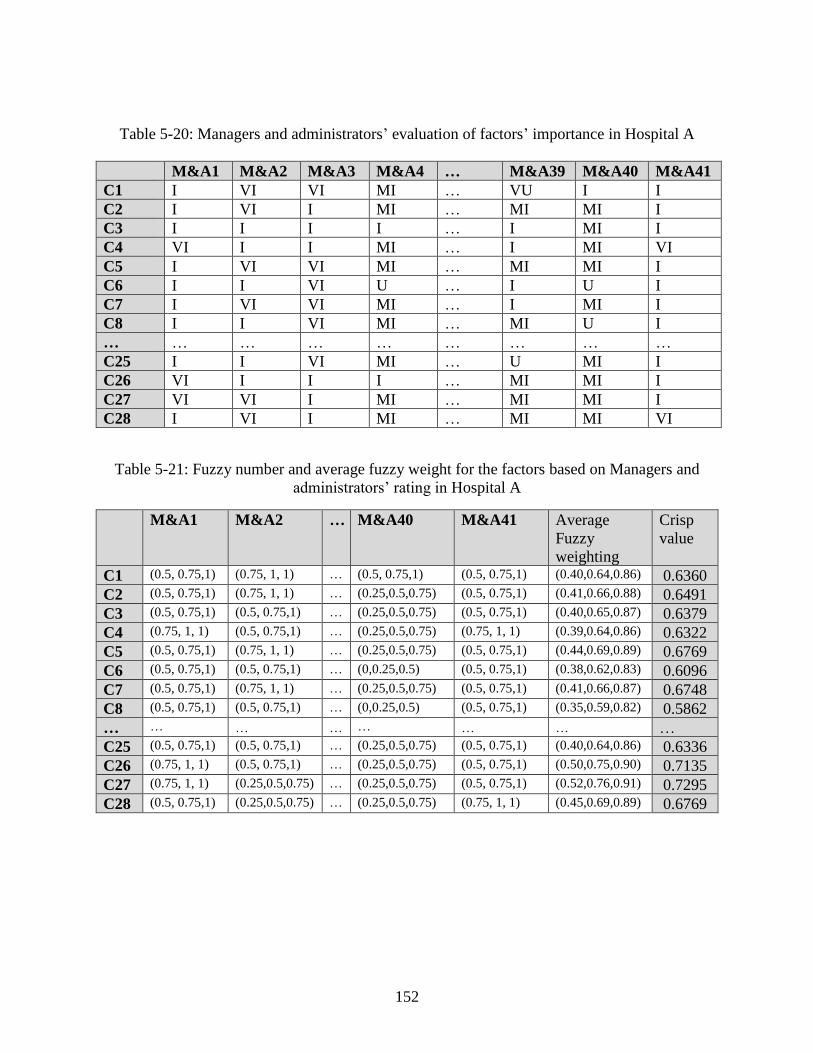
152
Table 5-20: Managers and administrators’ evaluation of factors’ importance in Hospital A
M&A1 M&A2 M&A3 M&A4 … M&A39 M&A40 M&A41
C1 I VI VI MI … VU I I
C2 I VI I MI … MI MI I
C3 I I I I … I MI I
C4 VI I I MI … I MI VI
C5 I VI VI MI … MI MI I
C6 I I VI U … I U I
C7 I VI VI MI … I MI I
C8 I I VI MI … MI U I
… … … … … … … … …
C25 I I VI MI … U MI I
C26 VI I I I … MI MI I
C27 VI VI I MI … MI MI I
C28 I VI I MI … MI MI VI
Table 5-21: Fuzzy number and average fuzzy weight for the factors based on Managers and
administrators’ rating in Hospital A
M&A1 M&A2 … M&A40 M&A41 Average
Fuzzy
weighting
Crisp
value
C1 (0.5, 0.75,1) (0.75, 1, 1) … (0.5, 0.75,1) (0.5, 0.75,1) (0.40,0.64,0.86) 0.6360
C2 (0.5, 0.75,1) (0.75, 1, 1) … (0.25,0.5,0.75) (0.5, 0.75,1) (0.41,0.66,0.88) 0.6491
C3 (0.5, 0.75,1) (0.5, 0.75,1) … (0.25,0.5,0.75) (0.5, 0.75,1) (0.40,0.65,0.87) 0.6379
C4 (0.75, 1, 1) (0.5, 0.75,1) … (0.25,0.5,0.75) (0.75, 1, 1) (0.39,0.64,0.86) 0.6322
C5 (0.5, 0.75,1) (0.75, 1, 1) … (0.25,0.5,0.75) (0.5, 0.75,1) (0.44,0.69,0.89) 0.6769
C6 (0.5, 0.75,1) (0.5, 0.75,1) … (0,0.25,0.5) (0.5, 0.75,1) (0.38,0.62,0.83) 0.6096
C7 (0.5, 0.75,1) (0.75, 1, 1) … (0.25,0.5,0.75) (0.5, 0.75,1) (0.41,0.66,0.87) 0.6748
C8 (0.5, 0.75,1) (0.5, 0.75,1) … (0,0.25,0.5) (0.5, 0.75,1) (0.35,0.59,0.82) 0.5862
… … … … … … … …
C25 (0.5, 0.75,1) (0.5, 0.75,1) … (0.25,0.5,0.75) (0.5, 0.75,1) (0.40,0.64,0.86) 0.6336
C26 (0.75, 1, 1) (0.5, 0.75,1) … (0.25,0.5,0.75) (0.5, 0.75,1) (0.50,0.75,0.90) 0.7135
C27 (0.75, 1, 1) (0.25,0.5,0.75) … (0.25,0.5,0.75) (0.5, 0.75,1) (0.52,0.76,0.91) 0.7295
C28 (0.5, 0.75,1) (0.25,0.5,0.75) … (0.25,0.5,0.75) (0.75, 1, 1) (0.45,0.69,0.89) 0.6769
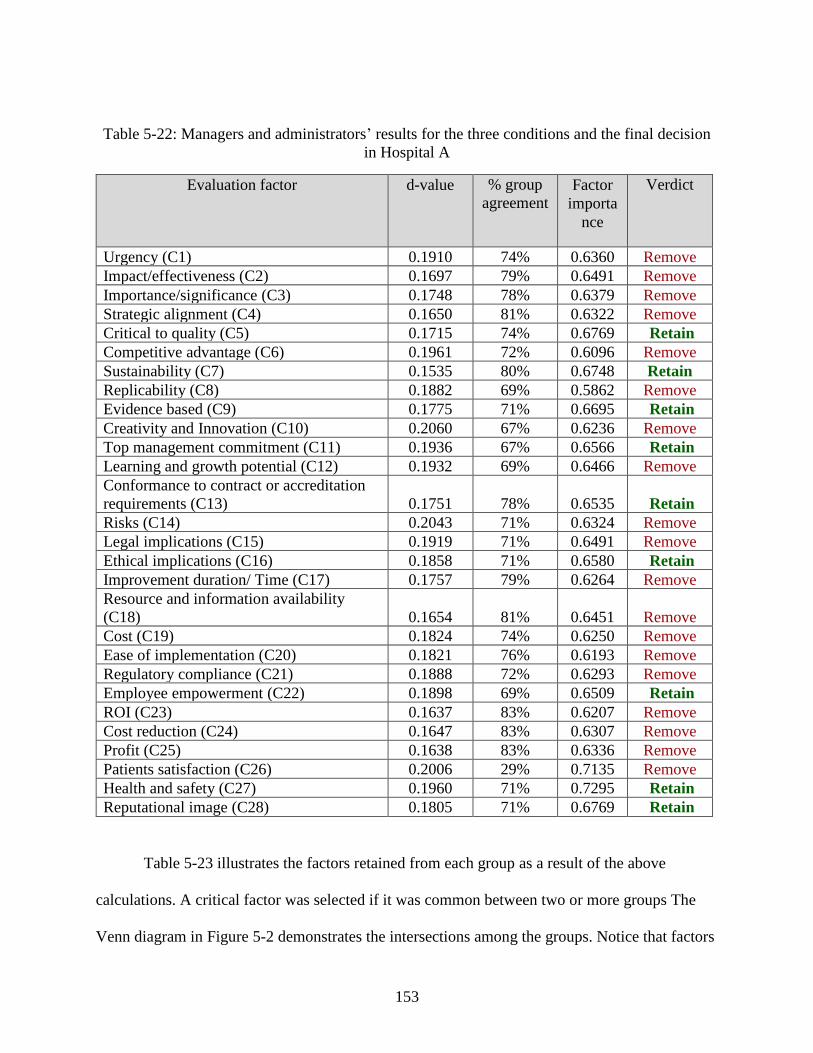
153
Table 5-22: Managers and administrators’ results for the three conditions and the final decision
in Hospital A
Evaluation factor d-value % group
agreement Factor
importa
nce
Verdict
Urgency (C1) 0.1910 74% 0.6360 Remove
Impact/effectiveness (C2) 0.1697 79% 0.6491 Remove
Importance/significance (C3) 0.1748 78% 0.6379 Remove
Strategic alignment (C4) 0.1650 81% 0.6322 Remove
Critical to quality (C5) 0.1715 74% 0.6769 Retain
Competitive advantage (C6) 0.1961 72% 0.6096 Remove
Sustainability (C7) 0.1535 80% 0.6748 Retain
Replicability (C8) 0.1882 69% 0.5862 Remove
Evidence based (C9) 0.1775 71% 0.6695 Retain
Creativity and Innovation (C10) 0.2060 67% 0.6236 Remove
Top management commitment (C11) 0.1936 67% 0.6566 Retain
Learning and growth potential (C12) 0.1932 69% 0.6466 Remove
Conformance to contract or accreditation
requirements (C13) 0.1751 78% 0.6535 Retain
Risks (C14) 0.2043 71% 0.6324 Remove
Legal implications (C15) 0.1919 71% 0.6491 Remove
Ethical implications (C16) 0.1858 71% 0.6580 Retain
Improvement duration/ Time (C17) 0.1757 79% 0.6264 Remove
Resource and information availability
(C18) 0.1654 81% 0.6451 Remove
Cost (C19) 0.1824 74% 0.6250 Remove
Ease of implementation (C20) 0.1821 76% 0.6193 Remove
Regulatory compliance (C21) 0.1888 72% 0.6293 Remove
Employee empowerment (C22) 0.1898 69% 0.6509 Retain
ROI (C23) 0.1637 83% 0.6207 Remove
Cost reduction (C24) 0.1647 83% 0.6307 Remove
Profit (C25) 0.1638 83% 0.6336 Remove
Patients satisfaction (C26) 0.2006 29% 0.7135 Remove
Health and safety (C27) 0.1960 71% 0.7295 Retain
Reputational image (C28) 0.1805 71% 0.6769 Retain
Table 5-23 illustrates the factors retained from each group as a result of the above
calculations. A critical factor was selected if it was common between two or more groups The
Venn diagram in Figure 5-2 demonstrates the intersections among the groups. Notice that factors
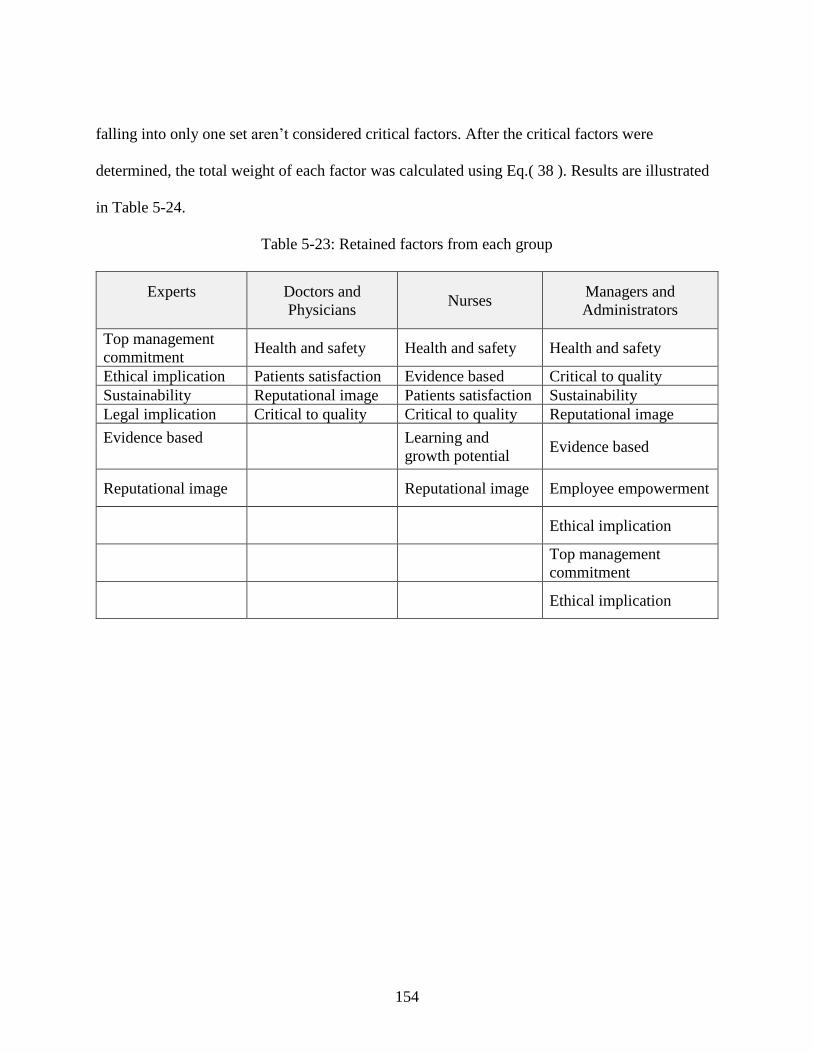
154
falling into only one set aren’t considered critical factors. After the critical factors were
determined, the total weight of each factor was calculated using Eq.( 38 ). Results are illustrated
in Table 5-24.
Table 5-23: Retained factors from each group
Experts Doctors and
Physicians Nurses
Managers and
Administrators
Top management
commitment Health and safety Health and safety Health and safety
Ethical implication Patients satisfaction Evidence based Critical to quality
Sustainability Reputational image Patients satisfaction Sustainability
Legal implication Critical to quality Critical to quality Reputational image
Evidence based
Learning and
growth potential Evidence based
Reputational image
Reputational image Employee empowerment
Ethical implication
Top management
commitment
Ethical implication
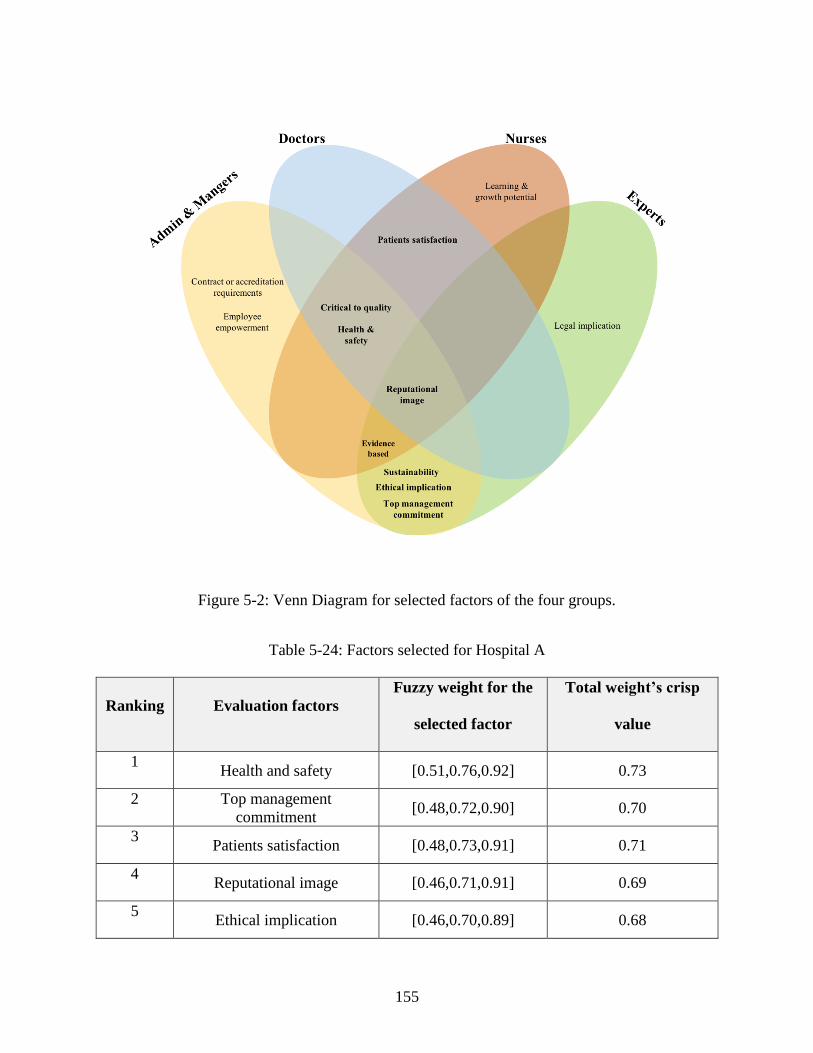
155
Figure 5-2: Venn Diagram for selected factors of the four groups.
Table 5-24: Factors selected for Hospital A
Ranking Evaluation factors
Fuzzy weight for the
selected factor
Total weight’s crisp
value
1 Health and safety [0.51,0.76,0.92] 0.73
2 Top management
commitment [0.48,0.72,0.90] 0.70
3 Patients satisfaction [0.48,0.73,0.91] 0.71
4 Reputational image [0.46,0.71,0.91] 0.69
5 Ethical implication [0.46,0.70,0.89] 0.68
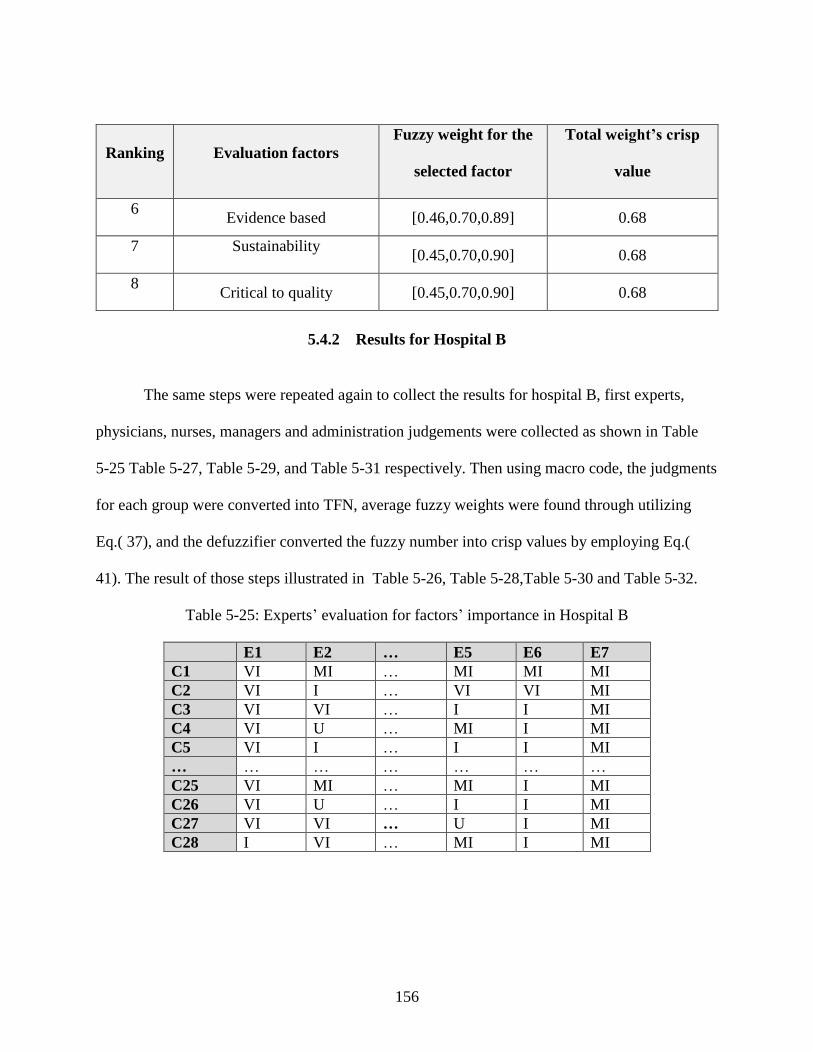
156
Ranking Evaluation factors
Fuzzy weight for the
selected factor
Total weight’s crisp
value
6 Evidence based [0.46,0.70,0.89] 0.68
7 Sustainability [0.45,0.70,0.90] 0.68
8 Critical to quality [0.45,0.70,0.90] 0.68
5.4.2 Results for Hospital B
The same steps were repeated again to collect the results for hospital B, first experts,
physicians, nurses, managers and administration judgements were collected as shown in Table
5-25 Table 5-27, Table 5-29, and Table 5-31 respectively. Then using macro code, the judgments
for each group were converted into TFN, average fuzzy weights were found through utilizing
Eq.( 37), and the defuzzifier converted the fuzzy number into crisp values by employing Eq.(
41). The result of those steps illustrated in Table 5-26, Table 5-28,Table 5-30 and Table 5-32.
Table 5-25: Experts’ evaluation for factors’ importance in Hospital B
E1 E2 … E5 E6 E7
C1 VI MI … MI MI MI
C2 VI I … VI VI MI
C3 VI VI … I I MI
C4 VI U … MI I MI
C5 VI I … I I MI
… … … … … … …
C25 VI MI … MI I MI
C26 VI U … I I MI
C27 VI VI … U I MI
C28 I VI … MI I MI
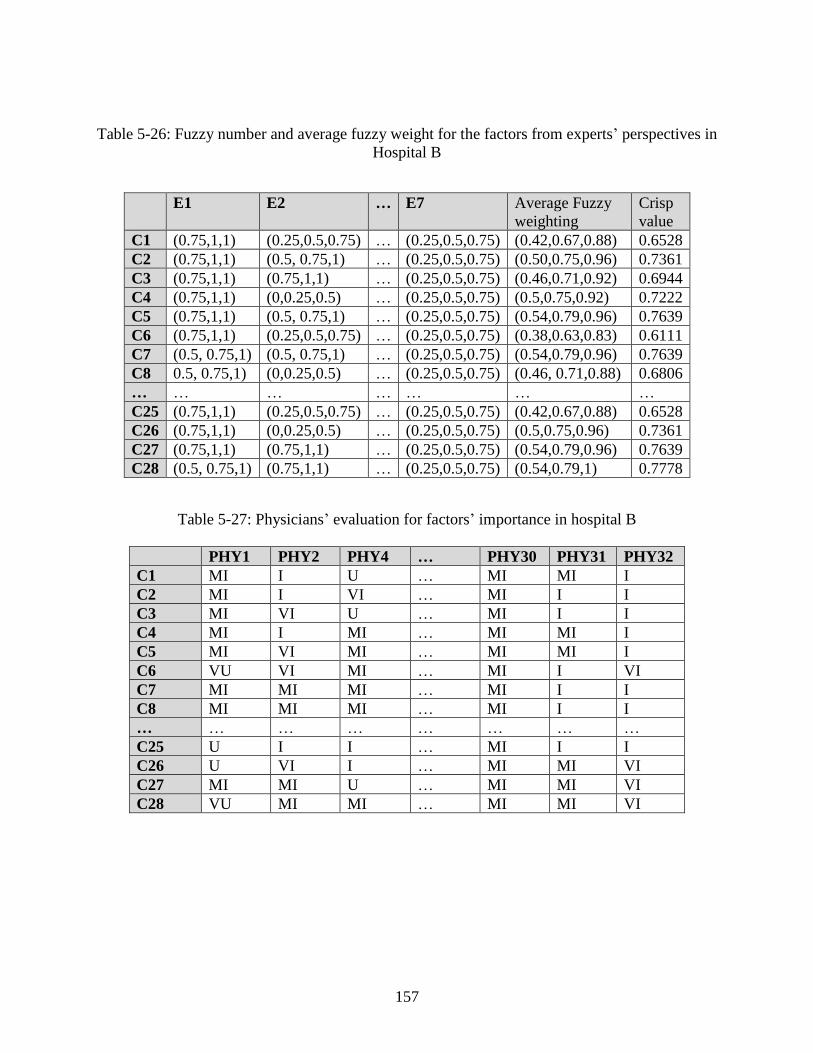
157
Table 5-26: Fuzzy number and average fuzzy weight for the factors from experts’ perspectives in
Hospital B
E1 E2 … E7 Average Fuzzy
weighting
Crisp
value
C1 (0.75,1,1) (0.25,0.5,0.75) … (0.25,0.5,0.75) (0.42,0.67,0.88) 0.6528
C2 (0.75,1,1) (0.5, 0.75,1) … (0.25,0.5,0.75) (0.50,0.75,0.96) 0.7361
C3 (0.75,1,1) (0.75,1,1) … (0.25,0.5,0.75) (0.46,0.71,0.92) 0.6944
C4 (0.75,1,1) (0,0.25,0.5) … (0.25,0.5,0.75) (0.5,0.75,0.92) 0.7222
C5 (0.75,1,1) (0.5, 0.75,1) … (0.25,0.5,0.75) (0.54,0.79,0.96) 0.7639
C6 (0.75,1,1) (0.25,0.5,0.75) … (0.25,0.5,0.75) (0.38,0.63,0.83) 0.6111
C7 (0.5, 0.75,1) (0.5, 0.75,1) … (0.25,0.5,0.75) (0.54,0.79,0.96) 0.7639
C8 0.5, 0.75,1) (0,0.25,0.5) … (0.25,0.5,0.75) (0.46, 0.71,0.88) 0.6806
… … … … … … …
C25 (0.75,1,1) (0.25,0.5,0.75) … (0.25,0.5,0.75) (0.42,0.67,0.88) 0.6528
C26 (0.75,1,1) (0,0.25,0.5) … (0.25,0.5,0.75) (0.5,0.75,0.96) 0.7361
C27 (0.75,1,1) (0.75,1,1) … (0.25,0.5,0.75) (0.54,0.79,0.96) 0.7639
C28 (0.5, 0.75,1) (0.75,1,1) … (0.25,0.5,0.75) (0.54,0.79,1) 0.7778
Table 5-27: Physicians’ evaluation for factors’ importance in hospital B
PHY1 PHY2 PHY4 … PHY30 PHY31 PHY32
C1 MI I U … MI MI I
C2 MI I VI … MI I I
C3 MI VI U … MI I I
C4 MI I MI … MI MI I
C5 MI VI MI … MI MI I
C6 VU VI MI … MI I VI
C7 MI MI MI … MI I I
C8 MI MI MI … MI I I
… … … … … … … …
C25 U I I … MI I I
C26 U VI I … MI MI VI
C27 MI MI U … MI MI VI
C28 VU MI MI … MI MI VI
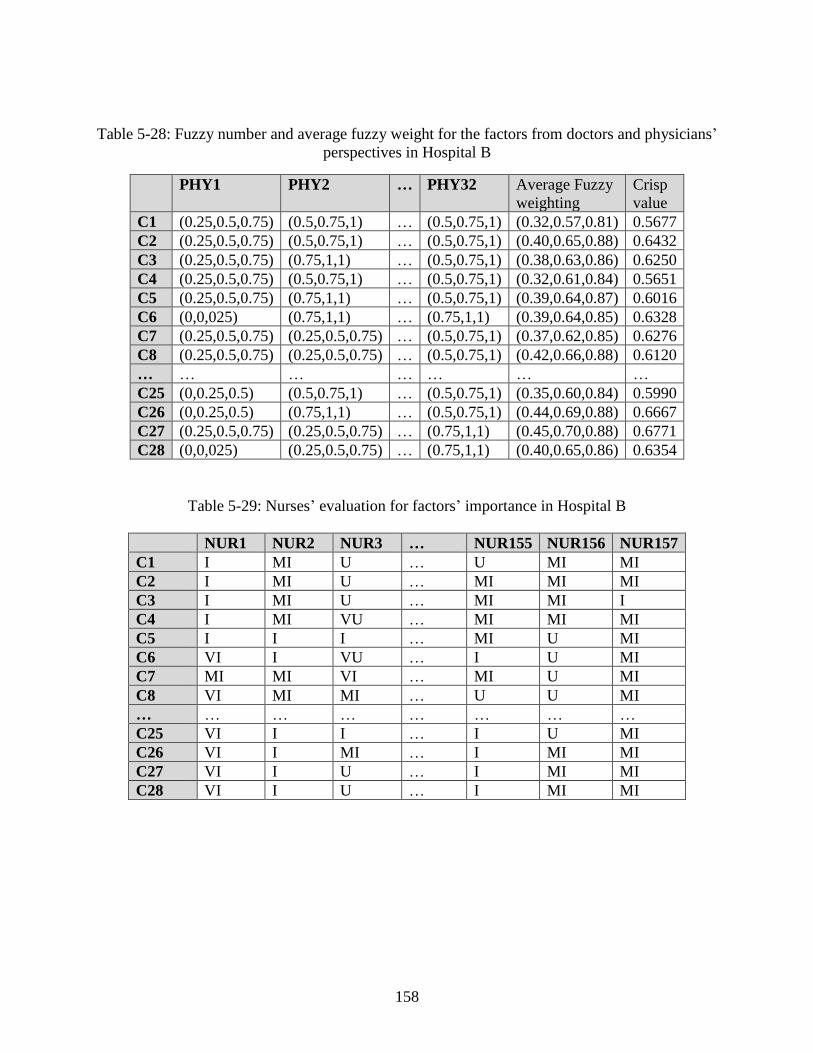
158
Table 5-28: Fuzzy number and average fuzzy weight for the factors from doctors and physicians’
perspectives in Hospital B
PHY1 PHY2 … PHY32 Average Fuzzy
weighting
Crisp
value
C1 (0.25,0.5,0.75) (0.5,0.75,1) … (0.5,0.75,1) (0.32,0.57,0.81) 0.5677
C2 (0.25,0.5,0.75) (0.5,0.75,1) … (0.5,0.75,1) (0.40,0.65,0.88) 0.6432
C3 (0.25,0.5,0.75) (0.75,1,1) … (0.5,0.75,1) (0.38,0.63,0.86) 0.6250
C4 (0.25,0.5,0.75) (0.5,0.75,1) … (0.5,0.75,1) (0.32,0.61,0.84) 0.5651
C5 (0.25,0.5,0.75) (0.75,1,1) … (0.5,0.75,1) (0.39,0.64,0.87) 0.6016
C6 (0,0,025) (0.75,1,1) … (0.75,1,1) (0.39,0.64,0.85) 0.6328
C7 (0.25,0.5,0.75) (0.25,0.5,0.75) … (0.5,0.75,1) (0.37,0.62,0.85) 0.6276
C8 (0.25,0.5,0.75) (0.25,0.5,0.75) … (0.5,0.75,1) (0.42,0.66,0.88) 0.6120
… … … … … … …
C25 (0,0.25,0.5) (0.5,0.75,1) … (0.5,0.75,1) (0.35,0.60,0.84) 0.5990
C26 (0,0.25,0.5) (0.75,1,1) … (0.5,0.75,1) (0.44,0.69,0.88) 0.6667
C27 (0.25,0.5,0.75) (0.25,0.5,0.75) … (0.75,1,1) (0.45,0.70,0.88) 0.6771
C28 (0,0,025) (0.25,0.5,0.75) … (0.75,1,1) (0.40,0.65,0.86) 0.6354
Table 5-29: Nurses’ evaluation for factors’ importance in Hospital B
NUR1 NUR2 NUR3 … NUR155 NUR156 NUR157
C1 I MI U … U MI MI
C2 I MI U … MI MI MI
C3 I MI U … MI MI I
C4 I MI VU … MI MI MI
C5 I I I … MI U MI
C6 VI I VU … I U MI
C7 MI MI VI … MI U MI
C8 VI MI MI … U U MI
… … … … … … … …
C25 VI I I … I U MI
C26 VI I MI … I MI MI
C27 VI I U … I MI MI
C28 VI I U … I MI MI
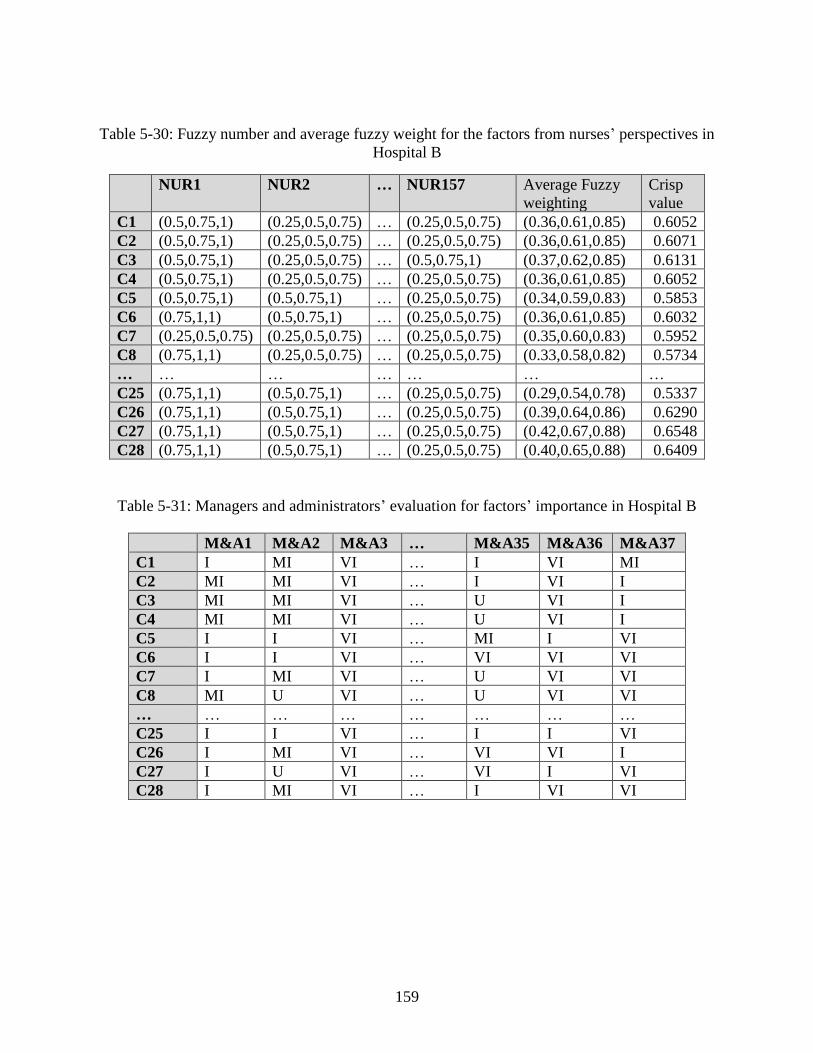
159
Table 5-30: Fuzzy number and average fuzzy weight for the factors from nurses’ perspectives in
Hospital B
NUR1 NUR2 … NUR157 Average Fuzzy
weighting
Crisp
value
C1 (0.5,0.75,1) (0.25,0.5,0.75) … (0.25,0.5,0.75) (0.36,0.61,0.85) 0.6052
C2 (0.5,0.75,1) (0.25,0.5,0.75) … (0.25,0.5,0.75) (0.36,0.61,0.85) 0.6071
C3 (0.5,0.75,1) (0.25,0.5,0.75) … (0.5,0.75,1) (0.37,0.62,0.85) 0.6131
C4 (0.5,0.75,1) (0.25,0.5,0.75) … (0.25,0.5,0.75) (0.36,0.61,0.85) 0.6052
C5 (0.5,0.75,1) (0.5,0.75,1) … (0.25,0.5,0.75) (0.34,0.59,0.83) 0.5853
C6 (0.75,1,1) (0.5,0.75,1) … (0.25,0.5,0.75) (0.36,0.61,0.85) 0.6032
C7 (0.25,0.5,0.75) (0.25,0.5,0.75) … (0.25,0.5,0.75) (0.35,0.60,0.83) 0.5952
C8 (0.75,1,1) (0.25,0.5,0.75) … (0.25,0.5,0.75) (0.33,0.58,0.82) 0.5734
… … … … … … …
C25 (0.75,1,1) (0.5,0.75,1) … (0.25,0.5,0.75) (0.29,0.54,0.78) 0.5337
C26 (0.75,1,1) (0.5,0.75,1) … (0.25,0.5,0.75) (0.39,0.64,0.86) 0.6290
C27 (0.75,1,1) (0.5,0.75,1) … (0.25,0.5,0.75) (0.42,0.67,0.88) 0.6548
C28 (0.75,1,1) (0.5,0.75,1) … (0.25,0.5,0.75) (0.40,0.65,0.88) 0.6409
Table 5-31: Managers and administrators’ evaluation for factors’ importance in Hospital B
M&A1 M&A2 M&A3 … M&A35 M&A36 M&A37
C1 I MI VI … I VI MI
C2 MI MI VI … I VI I
C3 MI MI VI … U VI I
C4 MI MI VI … U VI I
C5 I I VI … MI I VI
C6 I I VI … VI VI VI
C7 I MI VI … U VI VI
C8 MI U VI … U VI VI
… … … … … … … …
C25 I I VI … I I VI
C26 I MI VI … VI VI I
C27 I U VI … VI I VI
C28 I MI VI … I VI VI
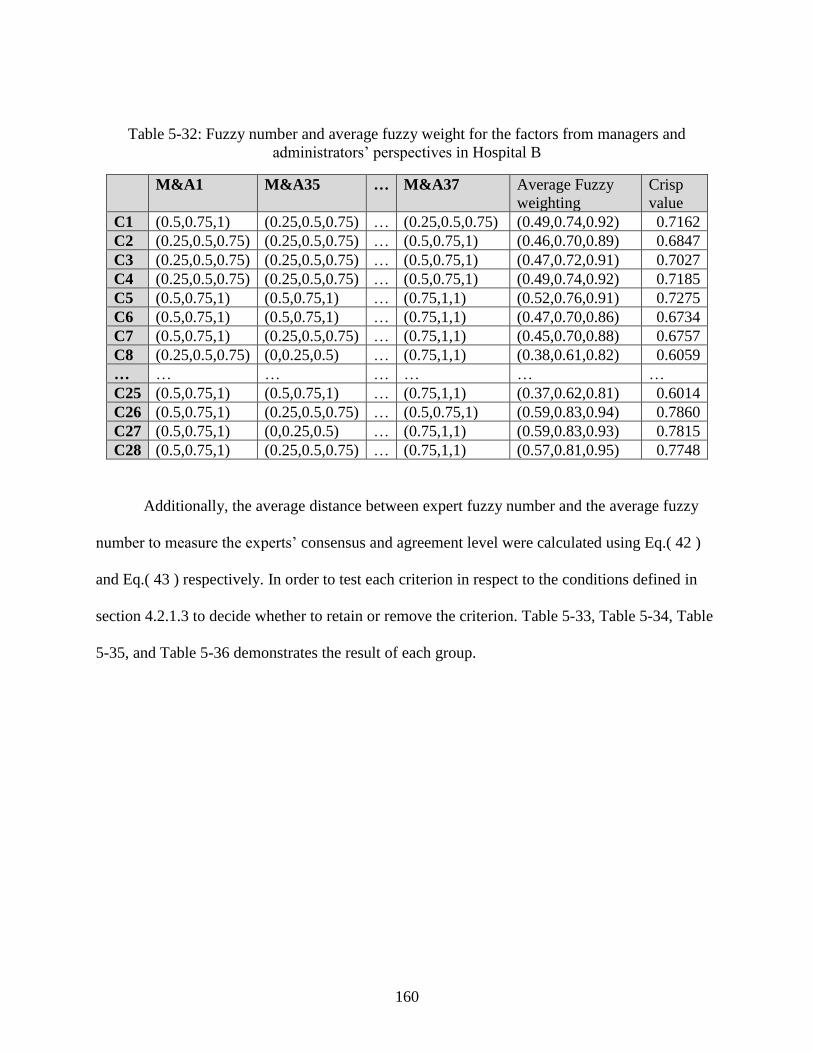
160
Table 5-32: Fuzzy number and average fuzzy weight for the factors from managers and
administrators’ perspectives in Hospital B
M&A1 M&A35 … M&A37 Average Fuzzy
weighting
Crisp
value
C1 (0.5,0.75,1) (0.25,0.5,0.75) … (0.25,0.5,0.75) (0.49,0.74,0.92) 0.7162
C2 (0.25,0.5,0.75) (0.25,0.5,0.75) … (0.5,0.75,1) (0.46,0.70,0.89) 0.6847
C3 (0.25,0.5,0.75) (0.25,0.5,0.75) … (0.5,0.75,1) (0.47,0.72,0.91) 0.7027
C4 (0.25,0.5,0.75) (0.25,0.5,0.75) … (0.5,0.75,1) (0.49,0.74,0.92) 0.7185
C5 (0.5,0.75,1) (0.5,0.75,1) … (0.75,1,1) (0.52,0.76,0.91) 0.7275
C6 (0.5,0.75,1) (0.5,0.75,1) … (0.75,1,1) (0.47,0.70,0.86) 0.6734
C7 (0.5,0.75,1) (0.25,0.5,0.75) … (0.75,1,1) (0.45,0.70,0.88) 0.6757
C8 (0.25,0.5,0.75) (0,0.25,0.5) … (0.75,1,1) (0.38,0.61,0.82) 0.6059
… … … … … … …
C25 (0.5,0.75,1) (0.5,0.75,1) … (0.75,1,1) (0.37,0.62,0.81) 0.6014
C26 (0.5,0.75,1) (0.25,0.5,0.75) … (0.5,0.75,1) (0.59,0.83,0.94) 0.7860
C27 (0.5,0.75,1) (0,0.25,0.5) … (0.75,1,1) (0.59,0.83,0.93) 0.7815
C28 (0.5,0.75,1) (0.25,0.5,0.75) … (0.75,1,1) (0.57,0.81,0.95) 0.7748
Additionally, the average distance between expert fuzzy number and the average fuzzy
number to measure the experts’ consensus and agreement level were calculated using Eq.( 42 )
and Eq.( 43 ) respectively. In order to test each criterion in respect to the conditions defined in
section 4.2.1.3 to decide whether to retain or remove the criterion. Table 5-33, Table 5-34, Table
5-35, and Table 5-36 demonstrates the result of each group.
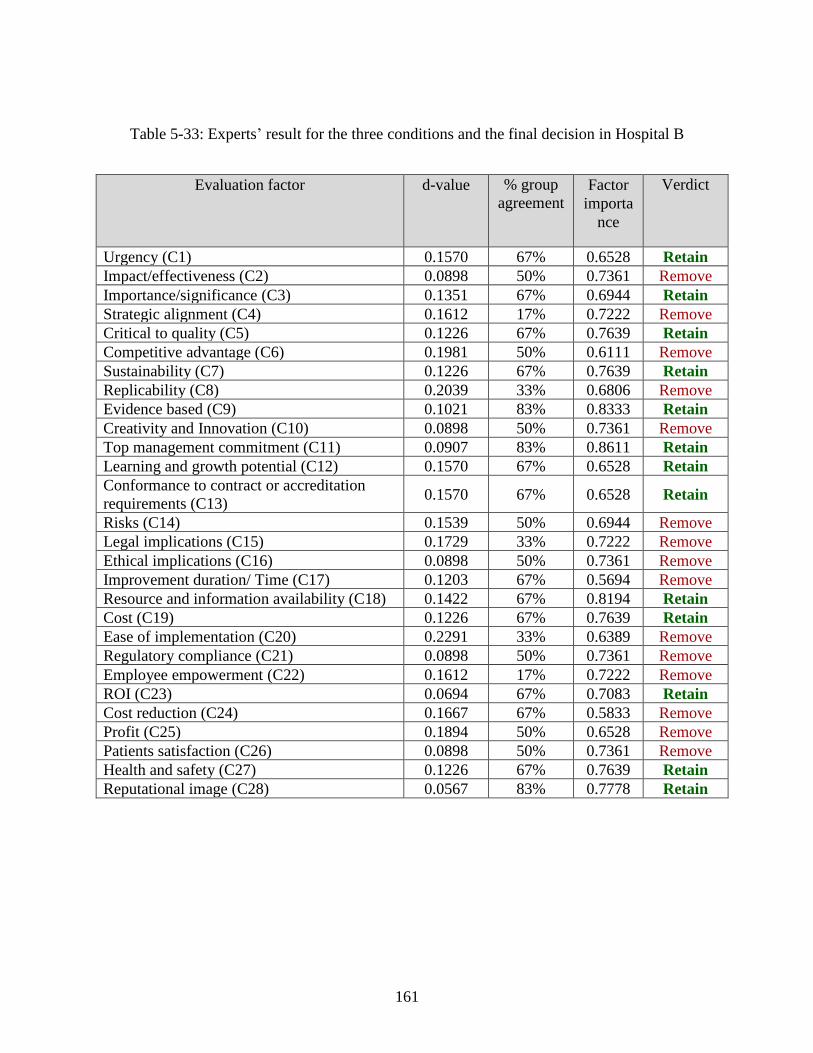
161
Table 5-33: Experts’ result for the three conditions and the final decision in Hospital B
Evaluation factor d-value % group
agreement Factor
importa
nce
Verdict
Urgency (C1) 0.1570 67% 0.6528 Retain
Impact/effectiveness (C2) 0.0898 50% 0.7361 Remove
Importance/significance (C3) 0.1351 67% 0.6944 Retain
Strategic alignment (C4) 0.1612 17% 0.7222 Remove
Critical to quality (C5) 0.1226 67% 0.7639 Retain
Competitive advantage (C6) 0.1981 50% 0.6111 Remove
Sustainability (C7) 0.1226 67% 0.7639 Retain
Replicability (C8) 0.2039 33% 0.6806 Remove
Evidence based (C9) 0.1021 83% 0.8333 Retain
Creativity and Innovation (C10) 0.0898 50% 0.7361 Remove
Top management commitment (C11) 0.0907 83% 0.8611 Retain
Learning and growth potential (C12) 0.1570 67% 0.6528 Retain
Conformance to contract or accreditation
requirements (C13) 0.1570 67% 0.6528 Retain
Risks (C14) 0.1539 50% 0.6944 Remove
Legal implications (C15) 0.1729 33% 0.7222 Remove
Ethical implications (C16) 0.0898 50% 0.7361 Remove
Improvement duration/ Time (C17) 0.1203 67% 0.5694 Remove
Resource and information availability (C18) 0.1422 67% 0.8194 Retain
Cost (C19) 0.1226 67% 0.7639 Retain
Ease of implementation (C20) 0.2291 33% 0.6389 Remove
Regulatory compliance (C21) 0.0898 50% 0.7361 Remove
Employee empowerment (C22) 0.1612 17% 0.7222 Remove
ROI (C23) 0.0694 67% 0.7083 Retain
Cost reduction (C24) 0.1667 67% 0.5833 Remove
Profit (C25) 0.1894 50% 0.6528 Remove
Patients satisfaction (C26) 0.0898 50% 0.7361 Remove
Health and safety (C27) 0.1226 67% 0.7639 Retain
Reputational image (C28) 0.0567 83% 0.7778 Retain
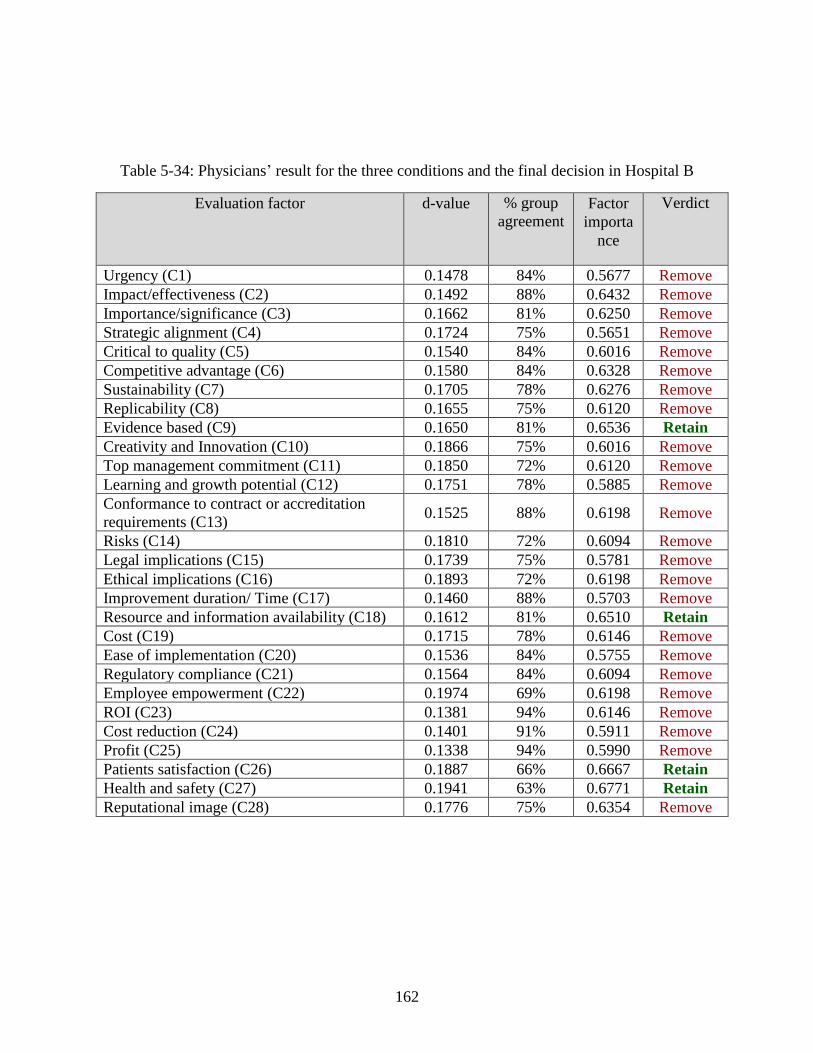
162
Table 5-34: Physicians’ result for the three conditions and the final decision in Hospital B
Evaluation factor d-value % group
agreement Factor
importa
nce
Verdict
Urgency (C1) 0.1478 84% 0.5677 Remove
Impact/effectiveness (C2) 0.1492 88% 0.6432 Remove
Importance/significance (C3) 0.1662 81% 0.6250 Remove
Strategic alignment (C4) 0.1724 75% 0.5651 Remove
Critical to quality (C5) 0.1540 84% 0.6016 Remove
Competitive advantage (C6) 0.1580 84% 0.6328 Remove
Sustainability (C7) 0.1705 78% 0.6276 Remove
Replicability (C8) 0.1655 75% 0.6120 Remove
Evidence based (C9) 0.1650 81% 0.6536 Retain
Creativity and Innovation (C10) 0.1866 75% 0.6016 Remove
Top management commitment (C11) 0.1850 72% 0.6120 Remove
Learning and growth potential (C12) 0.1751 78% 0.5885 Remove
Conformance to contract or accreditation
requirements (C13) 0.1525 88% 0.6198 Remove
Risks (C14) 0.1810 72% 0.6094 Remove
Legal implications (C15) 0.1739 75% 0.5781 Remove
Ethical implications (C16) 0.1893 72% 0.6198 Remove
Improvement duration/ Time (C17) 0.1460 88% 0.5703 Remove
Resource and information availability (C18) 0.1612 81% 0.6510 Retain
Cost (C19) 0.1715 78% 0.6146 Remove
Ease of implementation (C20) 0.1536 84% 0.5755 Remove
Regulatory compliance (C21) 0.1564 84% 0.6094 Remove
Employee empowerment (C22) 0.1974 69% 0.6198 Remove
ROI (C23) 0.1381 94% 0.6146 Remove
Cost reduction (C24) 0.1401 91% 0.5911 Remove
Profit (C25) 0.1338 94% 0.5990 Remove
Patients satisfaction (C26) 0.1887 66% 0.6667 Retain
Health and safety (C27) 0.1941 63% 0.6771 Retain
Reputational image (C28) 0.1776 75% 0.6354 Remove
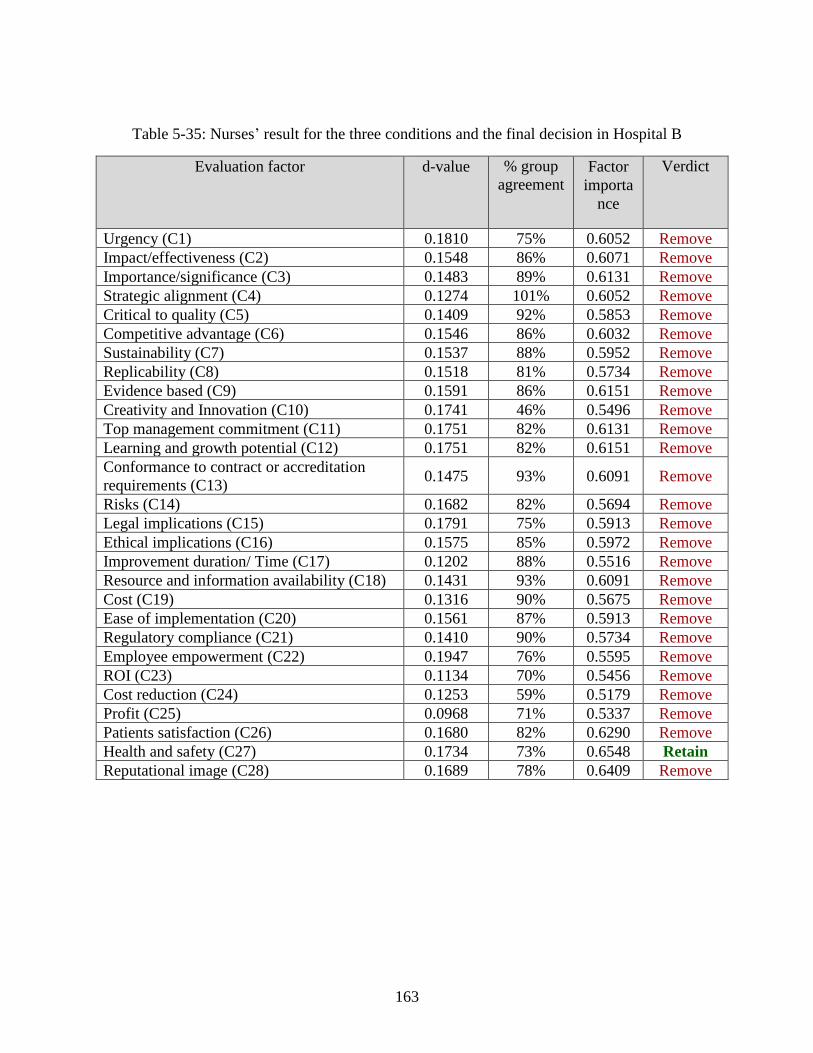
163
Table 5-35: Nurses’ result for the three conditions and the final decision in Hospital B
Evaluation factor d-value % group
agreement Factor
importa
nce
Verdict
Urgency (C1) 0.1810 75% 0.6052 Remove
Impact/effectiveness (C2) 0.1548 86% 0.6071 Remove
Importance/significance (C3) 0.1483 89% 0.6131 Remove
Strategic alignment (C4) 0.1274 101% 0.6052 Remove
Critical to quality (C5) 0.1409 92% 0.5853 Remove
Competitive advantage (C6) 0.1546 86% 0.6032 Remove
Sustainability (C7) 0.1537 88% 0.5952 Remove
Replicability (C8) 0.1518 81% 0.5734 Remove
Evidence based (C9) 0.1591 86% 0.6151 Remove
Creativity and Innovation (C10) 0.1741 46% 0.5496 Remove
Top management commitment (C11) 0.1751 82% 0.6131 Remove
Learning and growth potential (C12) 0.1751 82% 0.6151 Remove
Conformance to contract or accreditation
requirements (C13) 0.1475 93% 0.6091 Remove
Risks (C14) 0.1682 82% 0.5694 Remove
Legal implications (C15) 0.1791 75% 0.5913 Remove
Ethical implications (C16) 0.1575 85% 0.5972 Remove
Improvement duration/ Time (C17) 0.1202 88% 0.5516 Remove
Resource and information availability (C18) 0.1431 93% 0.6091 Remove
Cost (C19) 0.1316 90% 0.5675 Remove
Ease of implementation (C20) 0.1561 87% 0.5913 Remove
Regulatory compliance (C21) 0.1410 90% 0.5734 Remove
Employee empowerment (C22) 0.1947 76% 0.5595 Remove
ROI (C23) 0.1134 70% 0.5456 Remove
Cost reduction (C24) 0.1253 59% 0.5179 Remove
Profit (C25) 0.0968 71% 0.5337 Remove
Patients satisfaction (C26) 0.1680 82% 0.6290 Remove
Health and safety (C27) 0.1734 73% 0.6548 Retain
Reputational image (C28) 0.1689 78% 0.6409 Remove

164
Table 5-36: Managers and administrators’ result for the three conditions and the final decision in
Hospital B
Evaluation factor d-value % group
agreement Factor
importa
nce
Verdict
Urgency (C1) 0.1512 46% 0.7162 Remove
Impact/effectiveness (C2) 0.1770 68% 0.6847 Retain
Importance/significance (C3) 0.1534 43% 0.7027 Remove
Strategic alignment (C4) 0.1555 41% 0.7185 Remove
Critical to quality (C5) 0.1852 32% 0.7275 Remove
Competitive advantage (C6) 0.2177 57% 0.6734 Remove
Sustainability (C7) 0.1861 68% 0.6757 Retain
Replicability (C8) 0.2028 65% 0.6059 Remove
Evidence based (C9) 0.0000 0% 0.0000 Remove
Creativity and Innovation (C10) 0.1683 73% 0.6824 Retain
Top management commitment (C11) 0.1828 38% 0.7050 Remove
Learning and growth potential (C12) 0.1668 46% 0.7050 Remove
Conformance to contract or accreditation
requirements (C13) 0.2167 51% 0.6914 Remove
Risks (C14) 0.2051 65% 0.6599 Remove
Legal implications (C15) 0.2167 51% 0.6914 Remove
Ethical implications (C16) 0.2170 24% 0.6959 Remove
Improvement duration/ Time (C17) 0.1951 24% 0.7230 Remove
Resource and information availability (C18) 0.1880 73% 0.7387 Retain
Cost (C19) 0.2178 19% 0.7185 Remove
Ease of implementation (C20) 0.2011 57% 0.6869 Remove
Regulatory compliance (C21) 0.1637 35% 0.7275 Remove
Employee empowerment (C22) 0.1507 76% 0.7410 Retain
ROI (C23) 0.2000 54% 0.6937 Remove
Cost reduction (C24) 0.1709 78% 0.6059 Remove
Profit (C25) 0.2070 59% 0.6014 Remove
Patients satisfaction (C26) 0.1658 84% 0.7860 Retain
Health and safety (C27) 0.1831 81% 0.7815 Retain
Reputational image (C28) 0.1518 86% 0.7748 Retain
Table 5-37 demonstrates the retained factors from each group. Consequently, Venn
diagram in Figure 5-3 clarifies the common factors between the groups, where a factor
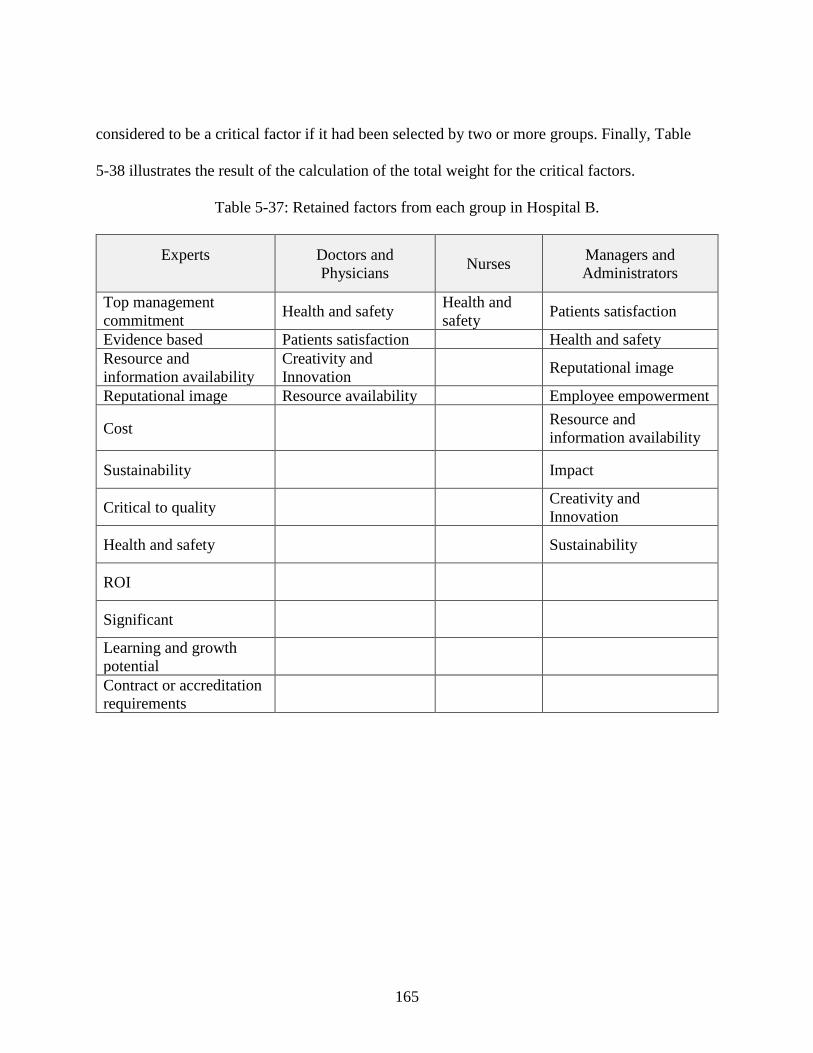
165
considered to be a critical factor if it had been selected by two or more groups. Finally, Table
5-38 illustrates the result of the calculation of the total weight for the critical factors.
Table 5-37: Retained factors from each group in Hospital B.
Experts Doctors and
Physicians Nurses
Managers and
Administrators
Top management
commitment Health and safety
Health and
safety Patients satisfaction
Evidence based Patients satisfaction Health and safety
Resource and
information availability
Creativity and
Innovation Reputational image
Reputational image Resource availability Employee empowerment
Cost Resource and
information availability
Sustainability
Impact
Critical to quality
Creativity and
Innovation
Health and safety
Sustainability
ROI
Significant
Learning and growth
potential
Contract or accreditation
requirements
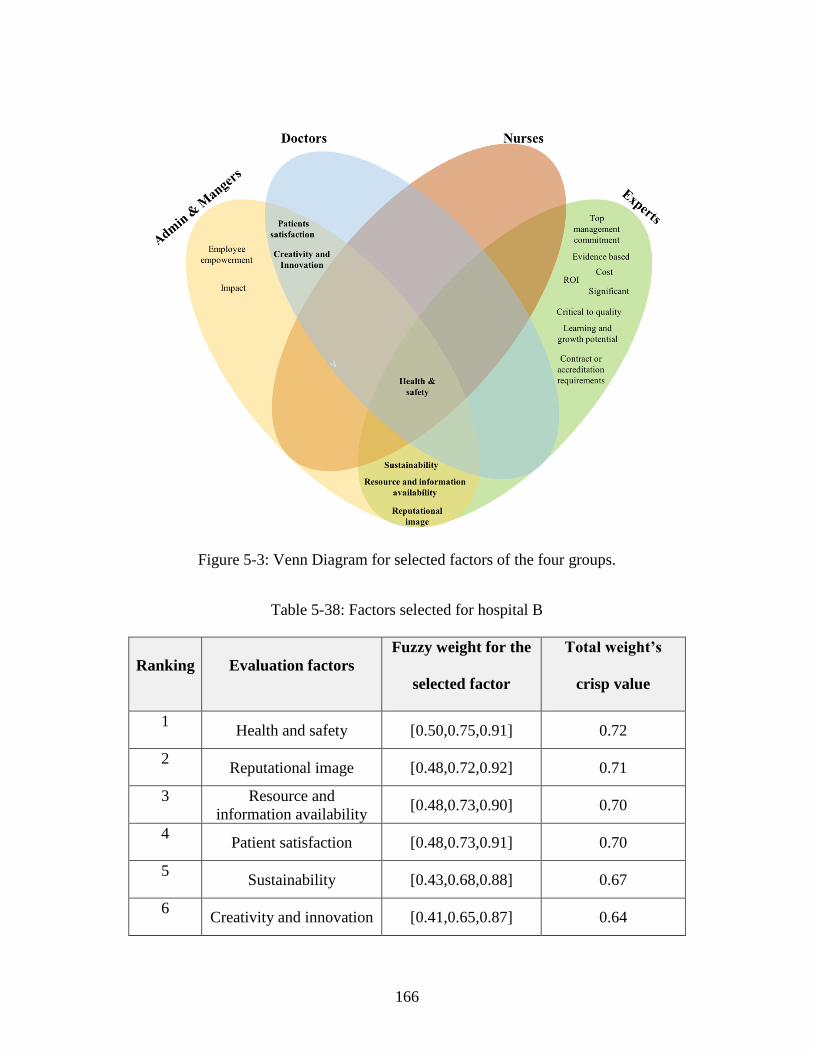
166
Figure 5-3: Venn Diagram for selected factors of the four groups.
Table 5-38: Factors selected for hospital B
Ranking Evaluation factors
Fuzzy weight for the
selected factor
Total weight’s
crisp value
1 Health and safety [0.50,0.75,0.91] 0.72
2 Reputational image [0.48,0.72,0.92] 0.71
3 Resource and
information availability [0.48,0.73,0.90] 0.70
4 Patient satisfaction [0.48,0.73,0.91] 0.70
5 Sustainability [0.43,0.68,0.88] 0.67
6 Creativity and innovation [0.41,0.65,0.87] 0.64
167
5.5 FIS Preparedness
In order to construct the membership function, knowledge was sought from fourteen
experts. HE-k was assigned for each expert, where HE stands for Healthcare Expert and k for the
expert number. All of the experts from the healthcare authority cooperate office, since they deal
with projects and management on a daily basis and they were chosen to have different
backgrounds to get various point of views. The expert’s occupation and experience are described
below:
▪ HE-1: Chief Clinical Officer with 12 years of experience in healthcare, M.S. in
healthcare management
▪ HE-2: Excellence &Innovation Manager with 18 years of experience in
healthcare, Ph.D. candidate in Healthcare Management
▪ HE-3: Senior clinical system analyst & physician with 17 years of experience in
healthcare.
▪ HE-4: Quality director & physician with 10 years of experience in healthcare.
▪ HE-5: Quality officer & dental assistance with 9 years of experience in
healthcare.
▪ HE-6: Clinical service manager & physician with 27 years of experience in
healthcare.
▪ HE-7: Senior safety officer with 20 years of experience in healthcare.
▪ HE-8: Risk officer with more than 6 years of experience in healthcare
▪ HE-9: Safety officer & nurse with 14 years of experience in healthcare
168
▪ HE-10: Senior Quality officer & physician with 10 years of experience in
healthcare
▪ HE-11: Quality officer with 6 years of experience in healthcare
▪ HE-12: Senior safety officer with 20 years of experience in healthcare
▪ HE-13: Senior performance officer with 11 years of experience in healthcare
▪ HE-14: Healthcare consultant & physician with 34 years of experience in
healthcare.
5.5.1 Results of expert knowledge acquisition
Subject matter experts quantified the linguistic terms associated with each criterion using
an indirect interval estimation to construct membership functions. Each expert was asked to
assign one of five linguistic terms for each of the ten criteria: “Very low”, “Low”, “Moderate”,
“High”, and “Very High”. They chose from three linguistic terms for improvement classification:
“Weakly preferred”, “Moderately preferred”, and “Strongly preferred”. They used ranges
between 0 and 100, providing 53 intervals from each expert and a total of 742 intervals.
Table 5-39 contains the experts’ quantification for patient’s satisfaction subset intervals.
Variation among all intervals can be observed and that explain the overlap between the different
intervals. A trapezoidal membership function (Figure 5-4) was structured according to the data in
Table 5-39. Note that all the values were divided by 100 to convert the numbers into ratios. The
upper value for the “Very Low” class interval is 0.35 and the interval core is between [0,0.05].
The “Low” interval is between [0.06, 0.7] where the core exists between [0.2,0.4] with the lower
boundary between 0.4 and 0.7. The “Moderate” class overlaps with the “Low” class between
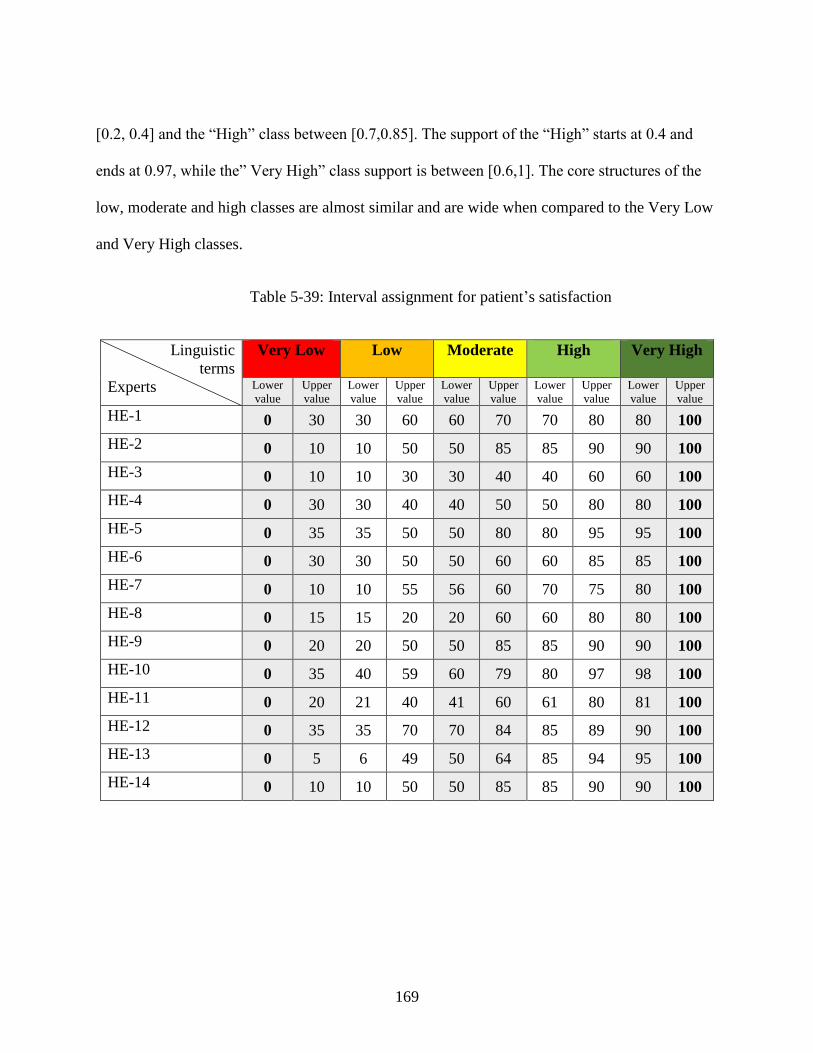
169
[0.2, 0.4] and the “High” class between [0.7,0.85]. The support of the “High” starts at 0.4 and
ends at 0.97, while the” Very High” class support is between [0.6,1]. The core structures of the
low, moderate and high classes are almost similar and are wide when compared to the Very Low
and Very High classes.
Table 5-39: Interval assignment for patient’s satisfaction
Linguistic
terms
Experts
Very Low Low
Moderate
High
Very High
Lower
value
Upper
value
Lower
value
Upper
value
Lower
value
Upper
value
Lower
value
Upper
value
Lower
value
Upper
value
HE-1 0 30 30 60 60 70 70 80 80 100
HE-2 0 10 10 50 50 85 85 90 90 100
HE-3 0 10 10 30 30 40 40 60 60 100
HE-4 0 30 30 40 40 50 50 80 80 100
HE-5 0 35 35 50 50 80 80 95 95 100
HE-6 0 30 30 50 50 60 60 85 85 100
HE-7 0 10 10 55 56 60 70 75 80 100
HE-8 0 15 15 20 20 60 60 80 80 100
HE-9 0 20 20 50 50 85 85 90 90 100
HE-10 0 35 40 59 60 79 80 97 98 100
HE-11 0 20 21 40 41 60 61 80 81 100
HE-12 0 35 35 70 70 84 85 89 90 100
HE-13 0 5 6 49 50 64 85 94 95 100
HE-14 0 10 10 50 50 85 85 90 90 100
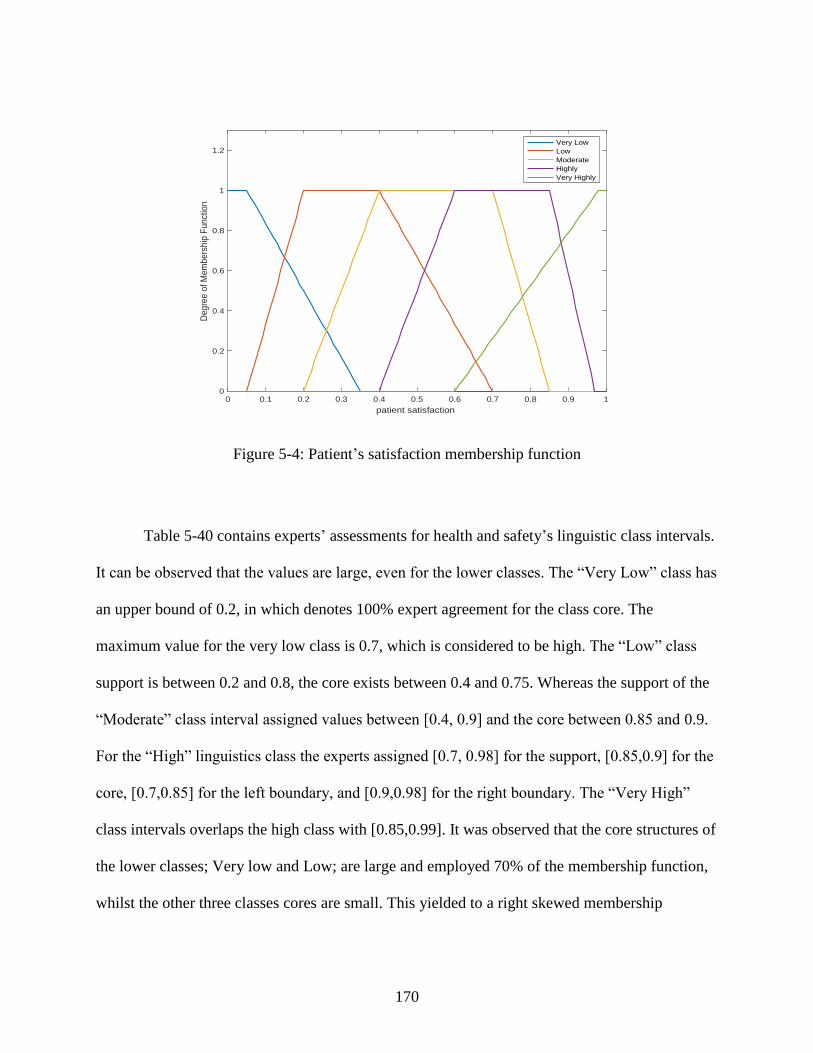
170
Figure 5-4: Patient’s satisfaction membership function
Table 5-40 contains experts’ assessments for health and safety’s linguistic class intervals.
It can be observed that the values are large, even for the lower classes. The “Very Low” class has
an upper bound of 0.2, in which denotes 100% expert agreement for the class core. The
maximum value for the very low class is 0.7, which is considered to be high. The “Low” class
support is between 0.2 and 0.8, the core exists between 0.4 and 0.75. Whereas the support of the
“Moderate” class interval assigned values between [0.4, 0.9] and the core between 0.85 and 0.9.
For the “High” linguistics class the experts assigned [0.7, 0.98] for the support, [0.85,0.9] for the
core, [0.7,0.85] for the left boundary, and [0.9,0.98] for the right boundary. The “Very High”
class intervals overlaps the high class with [0.85,0.99]. It was observed that the core structures of
the lower classes; Very low and Low; are large and employed 70% of the membership function,
whilst the other three classes cores are small. This yielded to a right skewed membership
0 0.1 0.2 0.3 0.4 0.5 0.6 0.7 0.8 0.9 1
patient satisfaction
0
0.2
0.4
0.6
0.8
1
1.2
Deg
ree
of M
em
bers
hip
Fun
ctio
n
Very Low
Low
Moderate
Highly
Very Highly
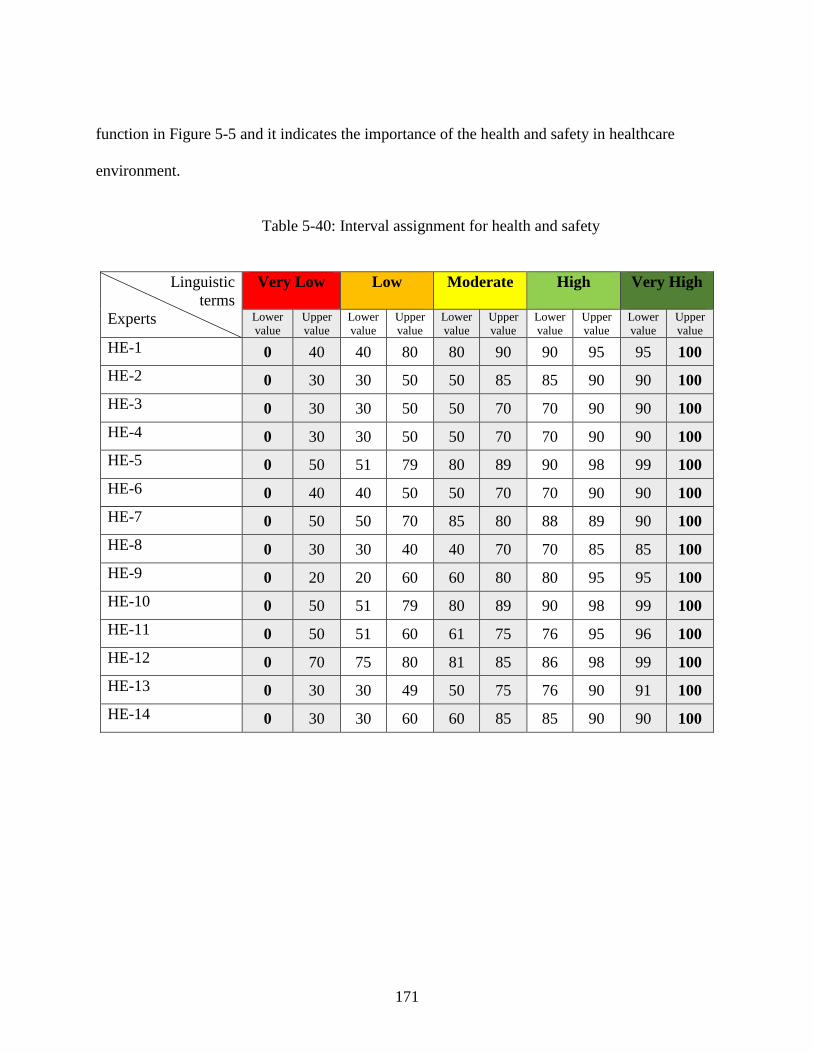
171
function in Figure 5-5 and it indicates the importance of the health and safety in healthcare
environment.
Table 5-40: Interval assignment for health and safety
Linguistic
terms
Experts
Very Low Low
Moderate
High
Very High
Lower
value
Upper
value
Lower
value
Upper
value
Lower
value
Upper
value
Lower
value
Upper
value
Lower
value
Upper
value
HE-1 0 40 40 80 80 90 90 95 95 100
HE-2 0 30 30 50 50 85 85 90 90 100
HE-3 0 30 30 50 50 70 70 90 90 100
HE-4 0 30 30 50 50 70 70 90 90 100
HE-5 0 50 51 79 80 89 90 98 99 100
HE-6 0 40 40 50 50 70 70 90 90 100
HE-7 0 50 50 70 85 80 88 89 90 100
HE-8 0 30 30 40 40 70 70 85 85 100
HE-9 0 20 20 60 60 80 80 95 95 100
HE-10 0 50 51 79 80 89 90 98 99 100
HE-11 0 50 51 60 61 75 76 95 96 100
HE-12 0 70 75 80 81 85 86 98 99 100
HE-13 0 30 30 49 50 75 76 90 91 100
HE-14 0 30 30 60 60 85 85 90 90 100
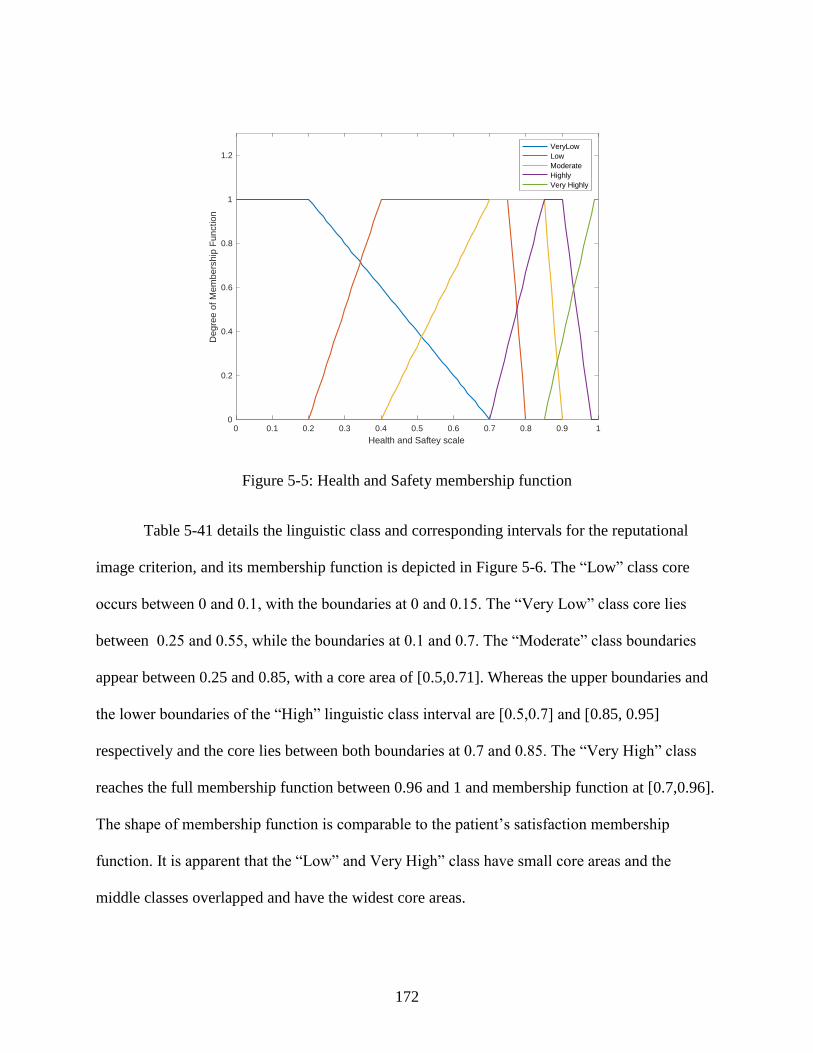
172
Figure 5-5: Health and Safety membership function
Table 5-41 details the linguistic class and corresponding intervals for the reputational
image criterion, and its membership function is depicted in Figure 5-6. The “Low” class core
occurs between 0 and 0.1, with the boundaries at 0 and 0.15. The “Very Low” class core lies
between 0.25 and 0.55, while the boundaries at 0.1 and 0.7. The “Moderate” class boundaries
appear between 0.25 and 0.85, with a core area of [0.5,0.71]. Whereas the upper boundaries and
the lower boundaries of the “High” linguistic class interval are [0.5,0.7] and [0.85, 0.95]
respectively and the core lies between both boundaries at 0.7 and 0.85. The “Very High” class
reaches the full membership function between 0.96 and 1 and membership function at [0.7,0.96].
The shape of membership function is comparable to the patient’s satisfaction membership
function. It is apparent that the “Low” and Very High” class have small core areas and the
middle classes overlapped and have the widest core areas.
0 0.1 0.2 0.3 0.4 0.5 0.6 0.7 0.8 0.9 1
Health and Saftey scale
0
0.2
0.4
0.6
0.8
1
1.2
Deg
ree
of M
em
bers
hip
Fun
ctio
n
VeryLow
Low
Moderate
Highly
Very Highly
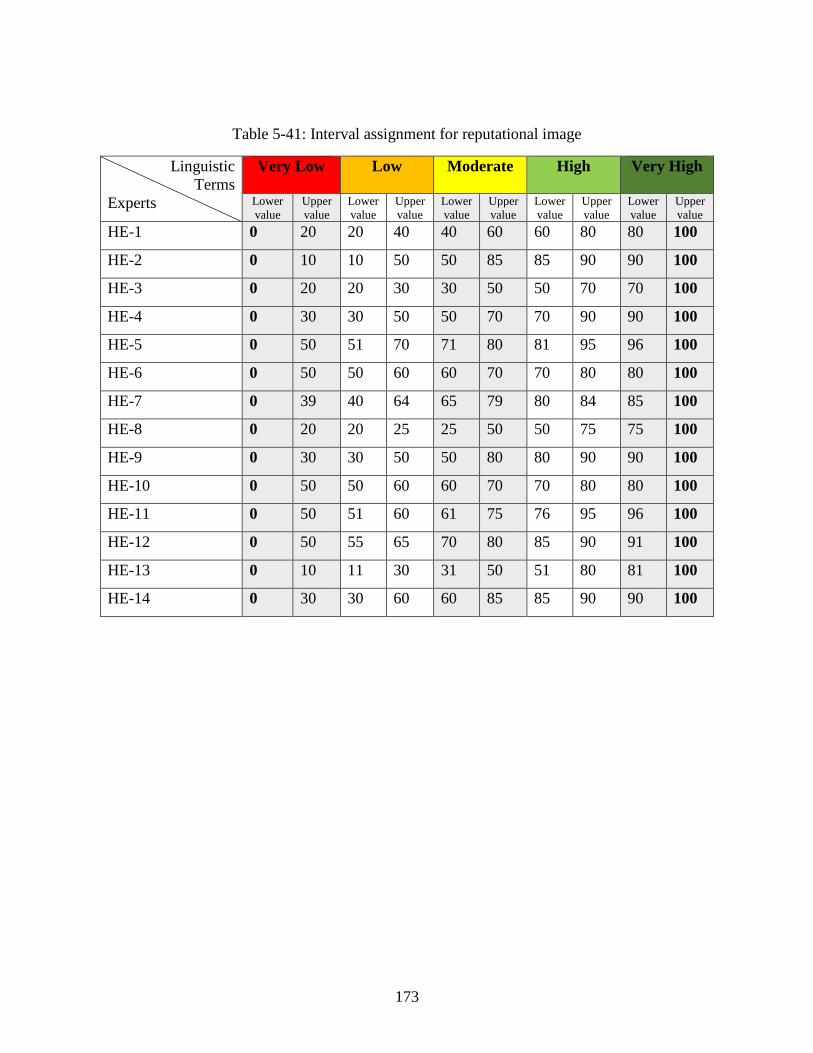
173
Table 5-41: Interval assignment for reputational image
Linguistic
Terms
Experts
Very Low Low
Moderate
High
Very High
Lower
value
Upper
value
Lower
value
Upper
value
Lower
value
Upper
value
Lower
value
Upper
value
Lower
value
Upper
value
HE-1 0 20 20 40 40 60 60 80 80 100
HE-2 0 10 10 50 50 85 85 90 90 100
HE-3 0 20 20 30 30 50 50 70 70 100
HE-4 0 30 30 50 50 70 70 90 90 100
HE-5 0 50 51 70 71 80 81 95 96 100
HE-6 0 50 50 60 60 70 70 80 80 100
HE-7 0 39 40 64 65 79 80 84 85 100
HE-8 0 20 20 25 25 50 50 75 75 100
HE-9 0 30 30 50 50 80 80 90 90 100
HE-10 0 50 50 60 60 70 70 80 80 100
HE-11 0 50 51 60 61 75 76 95 96 100
HE-12 0 50 55 65 70 80 85 90 91 100
HE-13 0 10 11 30 31 50 51 80 81 100
HE-14 0 30 30 60 60 85 85 90 90 100
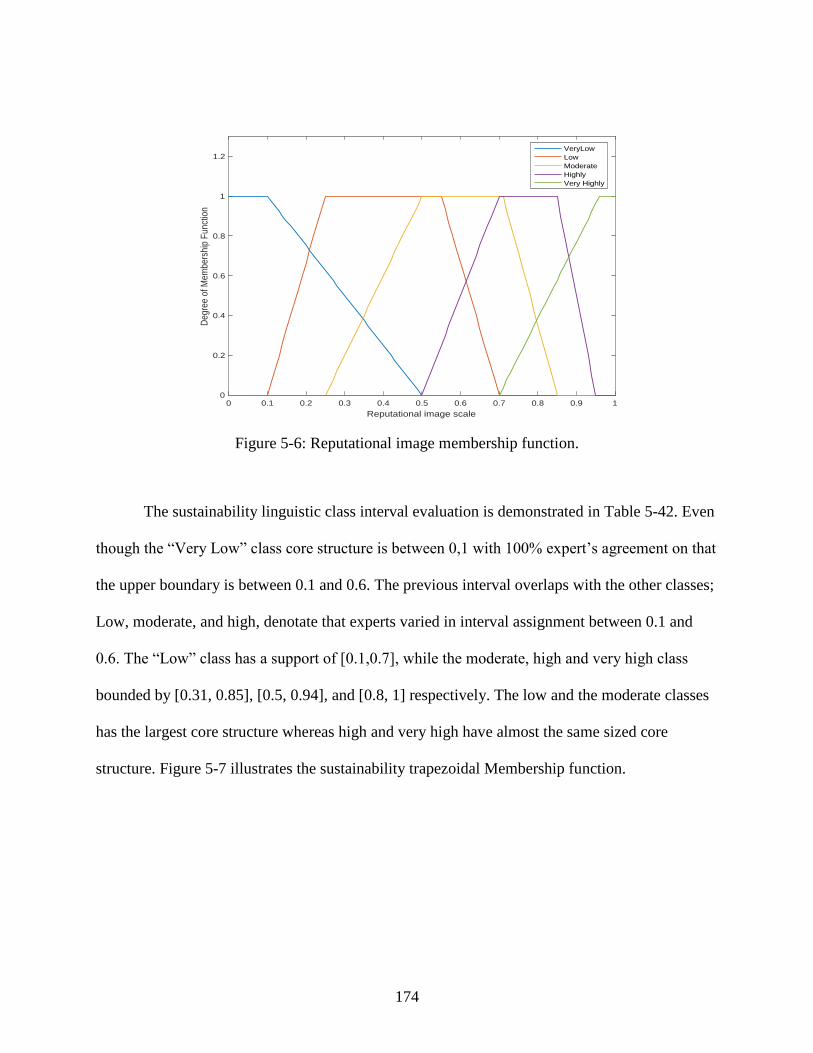
174
Figure 5-6: Reputational image membership function.
The sustainability linguistic class interval evaluation is demonstrated in Table 5-42. Even
though the “Very Low” class core structure is between 0,1 with 100% expert’s agreement on that
the upper boundary is between 0.1 and 0.6. The previous interval overlaps with the other classes;
Low, moderate, and high, denotate that experts varied in interval assignment between 0.1 and
0.6. The “Low” class has a support of [0.1,0.7], while the moderate, high and very high class
bounded by [0.31, 0.85], [0.5, 0.94], and [0.8, 1] respectively. The low and the moderate classes
has the largest core structure whereas high and very high have almost the same sized core
structure. Figure 5-7 illustrates the sustainability trapezoidal Membership function.
0 0.1 0.2 0.3 0.4 0.5 0.6 0.7 0.8 0.9 1
Reputational image scale
0
0.2
0.4
0.6
0.8
1
1.2
Deg
ree
of M
em
bers
hip
Fun
ctio
n
VeryLow
Low
Moderate
Highly
Very Highly
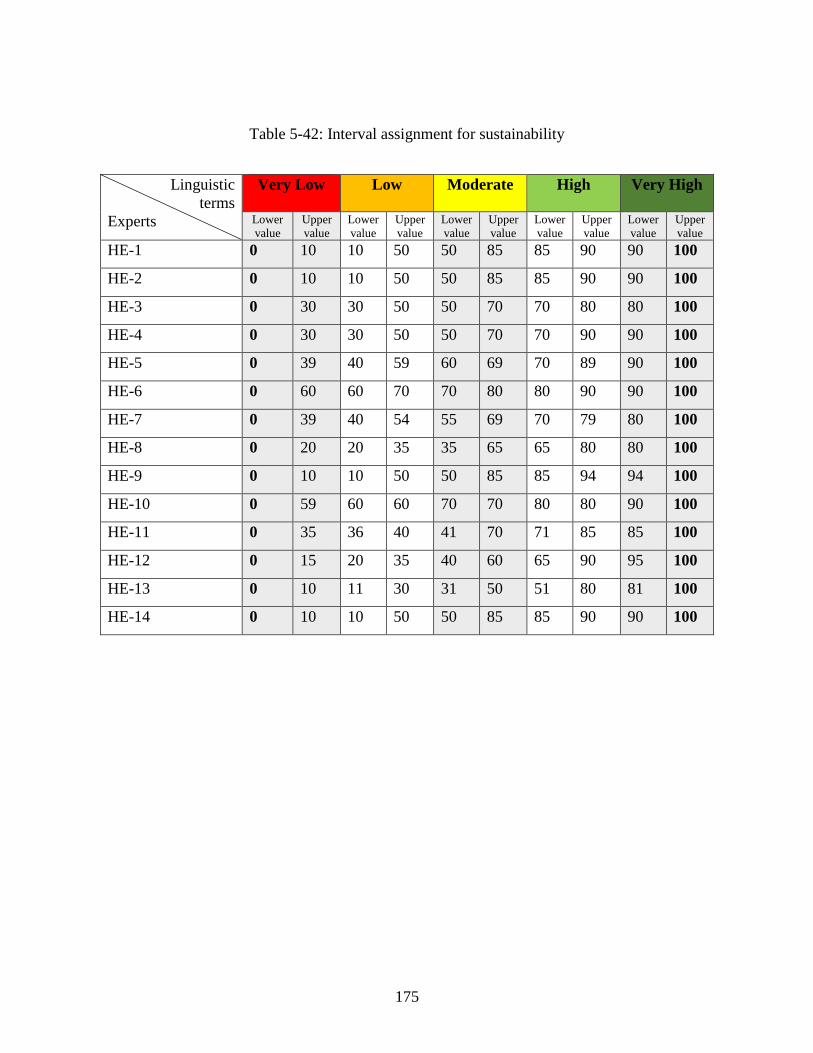
175
Table 5-42: Interval assignment for sustainability
Linguistic
terms
Experts
Very Low Low
Moderate
High
Very High
Lower
value
Upper
value
Lower
value
Upper
value
Lower
value
Upper
value
Lower
value
Upper
value
Lower
value
Upper
value
HE-1 0 10 10 50 50 85 85 90 90 100
HE-2 0 10 10 50 50 85 85 90 90 100
HE-3 0 30 30 50 50 70 70 80 80 100
HE-4 0 30 30 50 50 70 70 90 90 100
HE-5 0 39 40 59 60 69 70 89 90 100
HE-6 0 60 60 70 70 80 80 90 90 100
HE-7 0 39 40 54 55 69 70 79 80 100
HE-8 0 20 20 35 35 65 65 80 80 100
HE-9 0 10 10 50 50 85 85 94 94 100
HE-10 0 59 60 60 70 70 80 80 90 100
HE-11 0 35 36 40 41 70 71 85 85 100
HE-12 0 15 20 35 40 60 65 90 95 100
HE-13 0 10 11 30 31 50 51 80 81 100
HE-14 0 10 10 50 50 85 85 90 90 100
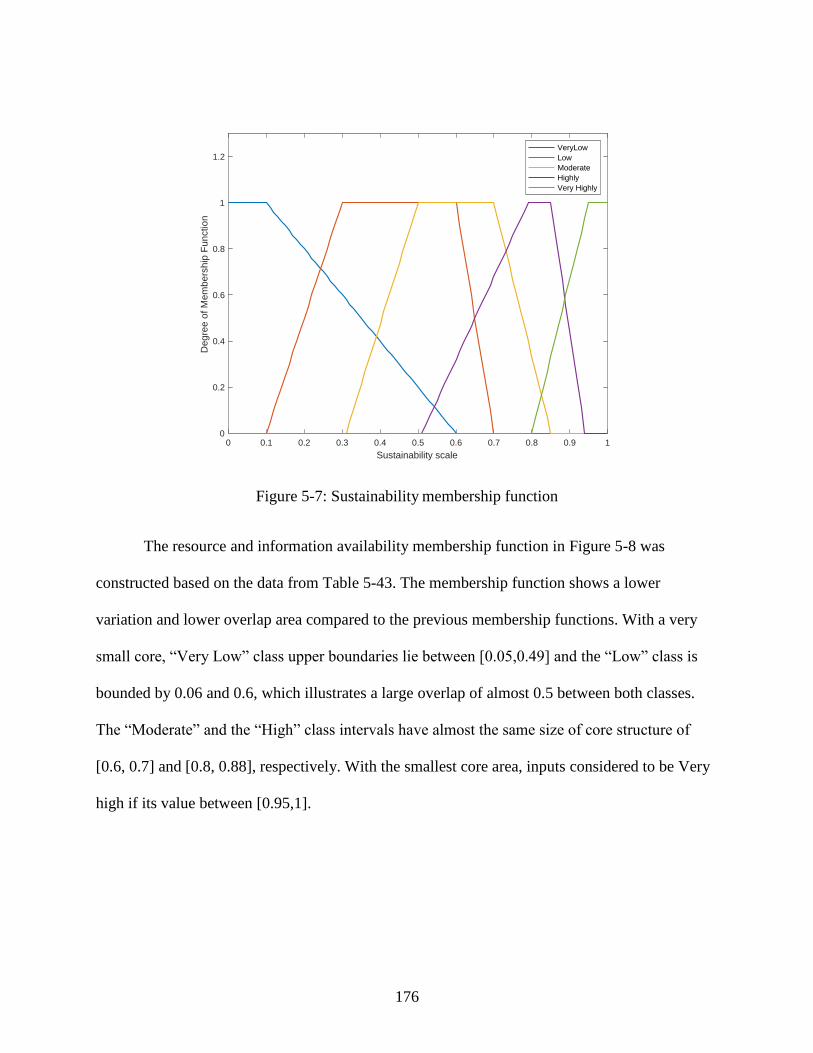
176
Figure 5-7: Sustainability membership function
The resource and information availability membership function in Figure 5-8 was
constructed based on the data from Table 5-43. The membership function shows a lower
variation and lower overlap area compared to the previous membership functions. With a very
small core, “Very Low” class upper boundaries lie between [0.05,0.49] and the “Low” class is
bounded by 0.06 and 0.6, which illustrates a large overlap of almost 0.5 between both classes.
The “Moderate” and the “High” class intervals have almost the same size of core structure of
[0.6, 0.7] and [0.8, 0.88], respectively. With the smallest core area, inputs considered to be Very
high if its value between [0.95,1].
0 0.1 0.2 0.3 0.4 0.5 0.6 0.7 0.8 0.9 1
Sustainability scale
0
0.2
0.4
0.6
0.8
1
1.2
Deg
ree
of M
em
bers
hip
Fun
ctio
n
VeryLow
Low
Moderate
Highly
Very Highly

177
Table 5-43: Interval assignment for resource and information availability
Linguistic
terms
Experts
Very Low Low
Moderate
High
Very High
Lower
value
Upper
value
Lower
value
Upper
value
Lower
value
Upper
value
Lower
value
Upper
value
Lower
value
Upper
value
HE-1 0 20 20 30 30 70 70 90 90 100
HE-2 0 10 10 50 50 85 85 90 90 100
HE-3 0 30 30 60 60 80 80 90 90 100
HE-4 0 20 20 50 50 70 70 90 90 100
HE-5 0 39 40 59 60 69 70 89 90 100
HE-6 0 20 20 40 40 60 60 80 80 100
HE-7 0 9 15 40 70 80 88 90 90 100
HE-8 0 10 10 50 50 85 85 90 90 100
HE-9 0 10 10 40 40 80 80 94 95 100
HE-10 0 49 50 59 60 69 70 89 90 100
HE-11 0 20 21 40 41 60 61 80 81 100
HE-12 0 39 40 59 60 84 85 94 95 100
HE-13 0 5 6 49 50 84 85 94 95 100
HE-14 0 10 10 50 50 85 85 90 90 100
178
Figure 5-8: Resource and information availability membership function
The top management commitment membership function shown in Figure 5-9, created
from experts’ evaluations for top management commitment presented in Table 5-44, appears to
be a mixed membership function both triangular and trapezoidal. The “Very High”, “High” and
the “Moderate” intervals class occupy the higher part of the graph, with supports areas of [0.5,
0.89], [0.6, 0.94], and [0.8, 1], respectively. The “Low” class has a triangular shape function
tipped at 0.5, with a support area of [0.06, 0.74] while the “Very Low” class is bounded by
[0,0.49], with a small core structure of 0.05 and wide upper boundary of 0.45.
0 0.1 0.2 0.3 0.4 0.5 0.6 0.7 0.8 0.9 1
Resource and information availability scale
0
0.2
0.4
0.6
0.8
1
1.2
Deg
ree
of M
embe
rshi
p F
unct
ion
VeryLow
Low
Moderate
Highly
Very Highly

179
Table 5-44: Interval assignment for top management commitment
Linguistic
terms
Experts
Very Low Low
Moderate
High
Very High
Lower
value
Upper
value
Lower
value
Upper
value
Lower
value
Upper
value
Lower
value
Upper
value
Lower
value
Upper
value
HE-1 0 30 30 50 50 70 70 85 85 100
HE-2 0 10 10 50 50 85 85 90 90 100
HE-3 0 30 30 50 50 60 60 80 80 100
HE-4 0 40 40 60 60 70 70 90 90 100
HE-5 0 39 40 59 60 69 70 89 90 100
HE-6 0 50 50 60 60 70 70 80 80 100
HE-7 0 49 50 74 75 89 90 94 95 100
HE-8 0 15 15 50 50 60 60 86 85 100
HE-9 0 40 40 60 60 80 80 94 94 100
HE-10 0 49 50 59 60 70 70 89 90 100
HE-11 0 45 46 50 51 70 71 87 88 100
HE-12 0 40 50 60 65 85 85 90 95 100
HE-13 0 5 6 49 50 84 85 94 95 100
HE-14 0 10 10 50 50 80 80 90 90 100
180
Figure 5-9: Top management commitment membership function
The evidence-based criterion is represented by a trapezoidal membership function as
well, as shown in Figure 5-10. There is an obvious variation among experts’ assessment for the
criterion intervals classes (Table 5-45), especially in the “Low”, “Moderate”, and “High” classes.
The core areas of these classes intersect as the core areas are [0.44, 0.51], [0.5, 0.8] and [0.6,
0.9], respectively. The other two classes; “Very Low” and “Very High,” overlap other classes in
their boundaries of [0.05, 0.5] and [0.6, 0.96], respectively. The membership has a full
membership function only at “Very Low” and “Very High” core areas.
0 0.1 0.2 0.3 0.4 0.5 0.6 0.7 0.8 0.9 1
Top management commitment scale
0
0.2
0.4
0.6
0.8
1
1.2
Deg
ree
of M
embe
rshi
p F
unct
ion
VeryLow
Low
Moderate
Highly
Very Highly

181
Table 5-45: Interval assignment for evidence-based criterion
Linguistic
terms
Experts
Very Low Low
Moderate
High
Very High
Lower
value
Upper
value
Lower
value
Upper
value
Lower
value
Upper
value
Lower
value
Upper
value
Lower
value
Upper
value
HE-1 0 40 40 70 70 90 90 95 95 100
HE-2 0 10 10 50 50 85 85 90 90 100
HE-3 0 20 20 40 40 50 50 60 60 100
HE-4 0 30 30 50 50 70 70 90 90 100
HE-5 0 50 51 70 71 80 81 95 96 100
HE-6 0 40 40 60 60 70 70 80 80 100
HE-7 0 39 40 64 65 79 80 89 90 100
HE-8 0 10 10 40 40 70 70 75 75 100
HE-9 0 30 30 60 60 80 80 94 94 100
HE-10 0 39 40 49 50 59 60 69 70 100
HE-11 0 30 31 40 41 50 51 80 81 100
HE-12 0 30 35 50 55 75 80 90 95 100
HE-13 0 5 6 49 80 84 85 94 95 100
HE-14 0 30 30 50 50 80 85 85 90 100
182
Figure 5-10: Evidence based membership function.
Table 5-46 shows a noticeable variation in the upper and lower value of the first three
classes and more and reasonable agreement in the last two classes. A trapezoidal function was
created based on the data from Table 5-46 and is presented in Figure 5-11. Note that the core
areas of the membership don’t overlap. Critical to quality was considered to be “Moderate” if the
input was between [0.6, 0.8], making its core the largest. It is bounded by 0.4 and 0.89. The
“Very Low” and the “Very High” classes had the smallest core structure, with [0, 0.05] and
[0.99, 1]. The “Low” and the “High” intervals classes existed between the intervals of [0.06,
0.79], and [0.6, 0.98], respectively.
0 0.1 0.2 0.3 0.4 0.5 0.6 0.7 0.8 0.9 1
Evidence based scale
0
0.2
0.4
0.6
0.8
1
1.2
Deg
ree
of M
em
bers
hip
Fun
ctio
n
VeryLow
Low
Moderate
Highly
Very Highly
183
Table 5-46: Interval assignment for critical to quality
Linguistic
terms
Experts
Very Low Low
Moderate
High
Very High
Lower
value
Upper
value
Lower
value
Upper
value
Lower
value
Upper
value
Lower
value
Upper
value
Lower
value
Upper
value
HE-1 0 30 30 60 60 80 80 90 90 100
HE-2 0 10 10 50 50 85 85 90 90 100
HE-3 0 20 20 40 40 60 60 80 80 100
HE-4 0 20 20 50 50 70 70 90 90 100
HE-5 0 50 51 79 80 89 90 98 99 100
HE-6 0 50 50 60 60 70 70 90 90 100
HE-7 0 39 40 74 75 89 90 94 95 100
HE-8 0 15 15 45 45 80 80 90 90 100
HE-9 0 20 20 50 50 80 80 94 94 100
HE-10 0 39 40 59 60 79 80 97 98 100
HE-11 0 45 46 50 51 75 76 86 87 100
HE-12 0 25 30 45 50 70 75 85 90 100
HE-13 0 5 6 49 50 84 85 94 95 100
HE-14 0 30 30 50 50 75 75 85 90 100
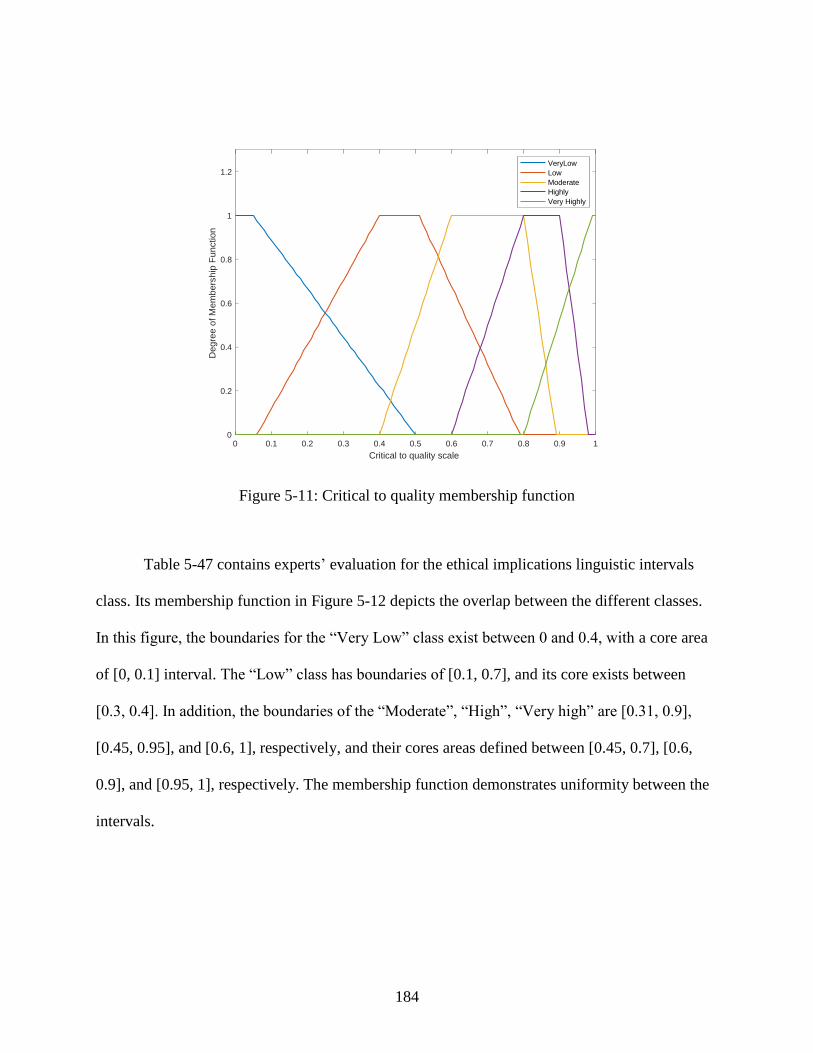
184
Figure 5-11: Critical to quality membership function
Table 5-47 contains experts’ evaluation for the ethical implications linguistic intervals
class. Its membership function in Figure 5-12 depicts the overlap between the different classes.
In this figure, the boundaries for the “Very Low” class exist between 0 and 0.4, with a core area
of [0, 0.1] interval. The “Low” class has boundaries of [0.1, 0.7], and its core exists between
[0.3, 0.4]. In addition, the boundaries of the “Moderate”, “High”, “Very high” are [0.31, 0.9],
[0.45, 0.95], and [0.6, 1], respectively, and their cores areas defined between [0.45, 0.7], [0.6,
0.9], and [0.95, 1], respectively. The membership function demonstrates uniformity between the
intervals.
0 0.1 0.2 0.3 0.4 0.5 0.6 0.7 0.8 0.9 1
Critical to quality scale
0
0.2
0.4
0.6
0.8
1
1.2
Deg
ree
of M
em
bers
hip
Fun
ctio
n
VeryLow
Low
Moderate
Highly
Very Highly
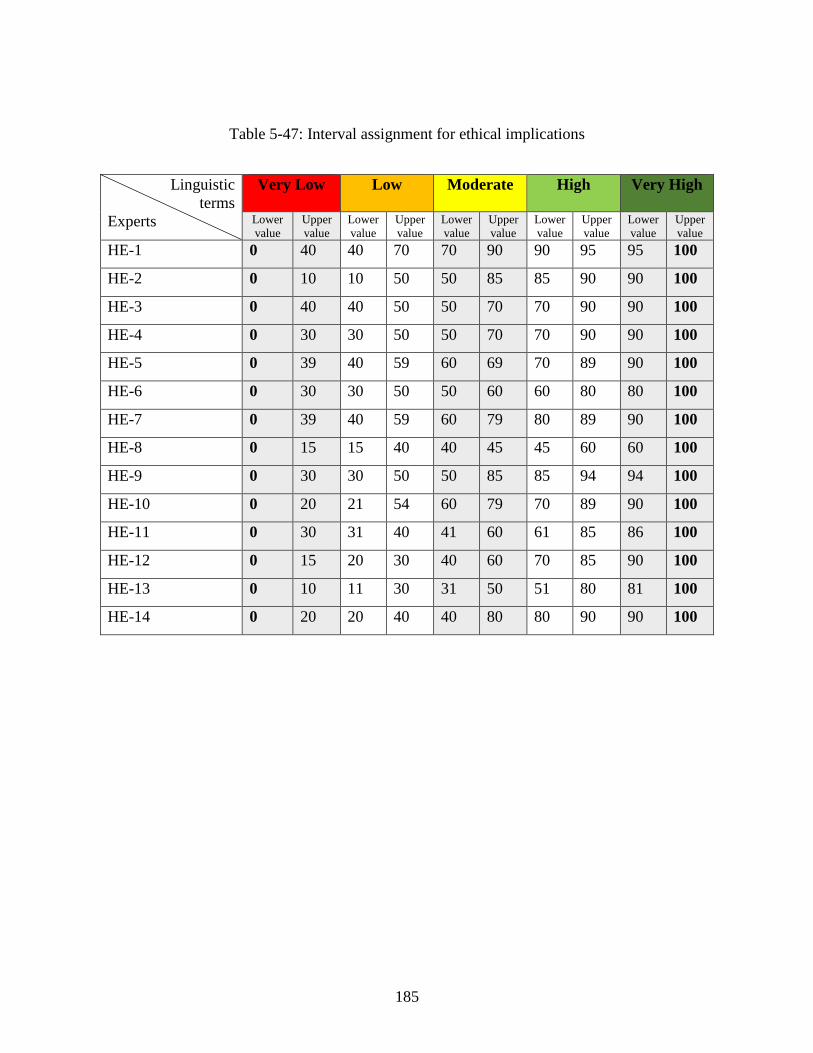
185
Table 5-47: Interval assignment for ethical implications
Linguistic
terms
Experts
Very Low Low
Moderate
High
Very High
Lower
value
Upper
value
Lower
value
Upper
value
Lower
value
Upper
value
Lower
value
Upper
value
Lower
value
Upper
value
HE-1 0 40 40 70 70 90 90 95 95 100
HE-2 0 10 10 50 50 85 85 90 90 100
HE-3 0 40 40 50 50 70 70 90 90 100
HE-4 0 30 30 50 50 70 70 90 90 100
HE-5 0 39 40 59 60 69 70 89 90 100
HE-6 0 30 30 50 50 60 60 80 80 100
HE-7 0 39 40 59 60 79 80 89 90 100
HE-8 0 15 15 40 40 45 45 60 60 100
HE-9 0 30 30 50 50 85 85 94 94 100
HE-10 0 20 21 54 60 79 70 89 90 100
HE-11 0 30 31 40 41 60 61 85 86 100
HE-12 0 15 20 30 40 60 70 85 90 100
HE-13 0 10 11 30 31 50 51 80 81 100
HE-14 0 20 20 40 40 80 80 90 90 100
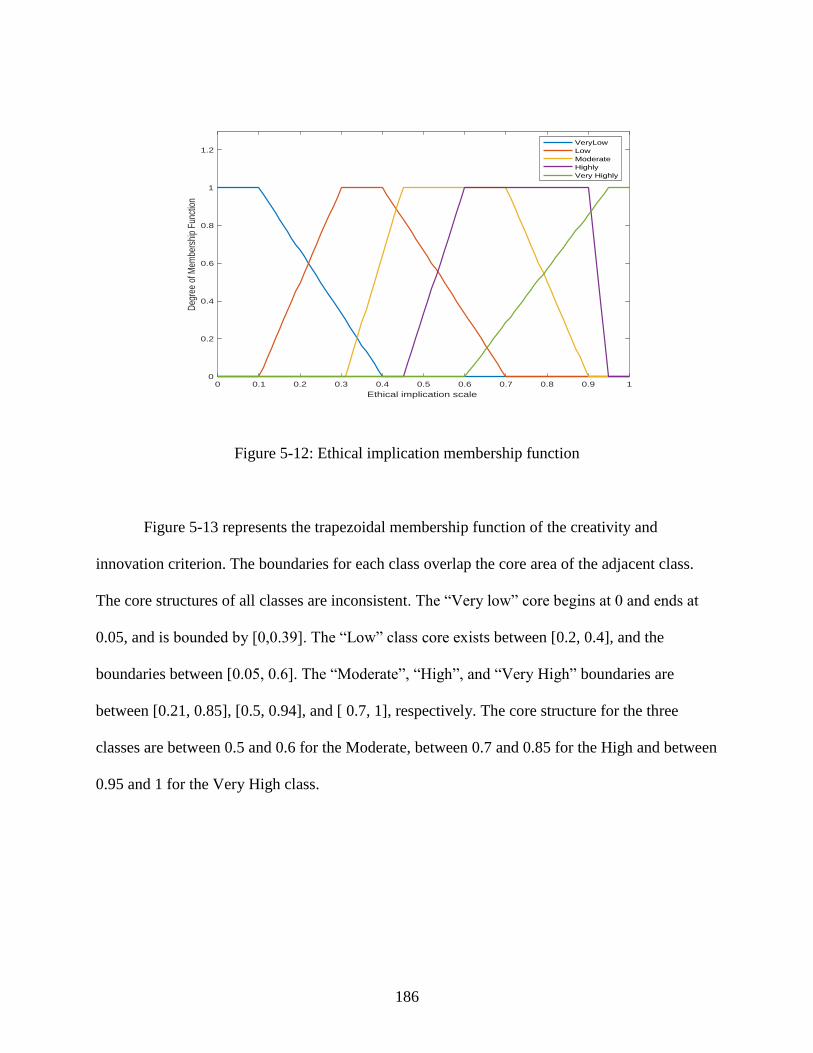
186
Figure 5-12: Ethical implication membership function
Figure 5-13 represents the trapezoidal membership function of the creativity and
innovation criterion. The boundaries for each class overlap the core area of the adjacent class.
The core structures of all classes are inconsistent. The “Very low” core begins at 0 and ends at
0.05, and is bounded by [0,0.39]. The “Low” class core exists between [0.2, 0.4], and the
boundaries between [0.05, 0.6]. The “Moderate”, “High”, and “Very High” boundaries are
between [0.21, 0.85], [0.5, 0.94], and [ 0.7, 1], respectively. The core structure for the three
classes are between 0.5 and 0.6 for the Moderate, between 0.7 and 0.85 for the High and between
0.95 and 1 for the Very High class.
0 0.1 0.2 0.3 0.4 0.5 0.6 0.7 0.8 0.9 1
Ethical implication scale
0
0.2
0.4
0.6
0.8
1
1.2
Deg
ree
of M
embe
rshi
p Fu
nctio
n
VeryLow
Low
Moderate
Highly
Very Highly

187
Table 5-48: Interval assignment for creativity and innovation
Linguistic
terms
Experts
Very Low Low
Moderate
High
Very High
Lower
value
Upper
value
Lower
value
Upper
value
Lower
value
Upper
value
Lower
value
Upper
value
Lower
value
Upper
value
HE-1 0 20 20 40 40 60 60 80 80 100
HE-2 0 10 10 50 50 85 85 90 90 100
HE-3 0 20 20 40 40 50 50 70 70 100
HE-4 0 20 20 50 50 70 70 90 90 100
HE-5 0 39 40 59 60 69 70 89 90 100
HE-6 0 30 30 60 60 70 70 80 80 100
HE-7 0 29 30 59 60 74 75 84 85 100
HE-8 0 5 5 40 40 50 50 70 70 100
HE-9 0 20 20 50 50 80 80 90 90 100
HE-10 0 5 6 50 51 60 61 70 71 100
HE-11 0 10 11 20 21 50 51 70 71 100
HE-12 0 20 25 40 45 70 75 89 90 100
HE-13 0 5 6 49 50 84 85 94 95 100
HE-14 0 20 20 50 50 80 80 85 90 100
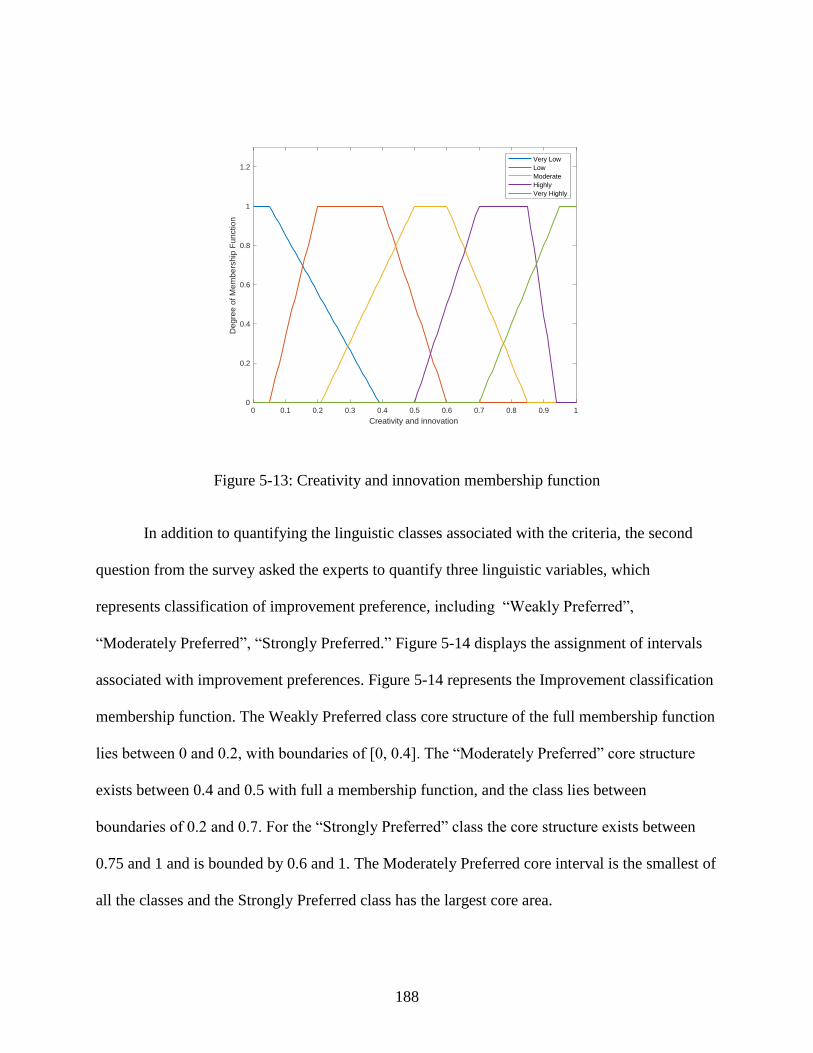
188
Figure 5-13: Creativity and innovation membership function
In addition to quantifying the linguistic classes associated with the criteria, the second
question from the survey asked the experts to quantify three linguistic variables, which
represents classification of improvement preference, including “Weakly Preferred”,
“Moderately Preferred”, “Strongly Preferred.” Figure 5-14 displays the assignment of intervals
associated with improvement preferences. Figure 5-14 represents the Improvement classification
membership function. The Weakly Preferred class core structure of the full membership function
lies between 0 and 0.2, with boundaries of [0, 0.4]. The “Moderately Preferred” core structure
exists between 0.4 and 0.5 with full a membership function, and the class lies between
boundaries of 0.2 and 0.7. For the “Strongly Preferred” class the core structure exists between
0.75 and 1 and is bounded by 0.6 and 1. The Moderately Preferred core interval is the smallest of
all the classes and the Strongly Preferred class has the largest core area.
0 0.1 0.2 0.3 0.4 0.5 0.6 0.7 0.8 0.9 1
Creativity and innovation
0
0.2
0.4
0.6
0.8
1
1.2
Deg
ree
of M
em
bers
hip
Fun
ctio
n
Very Low
Low
Moderate
Highly
Very Highly
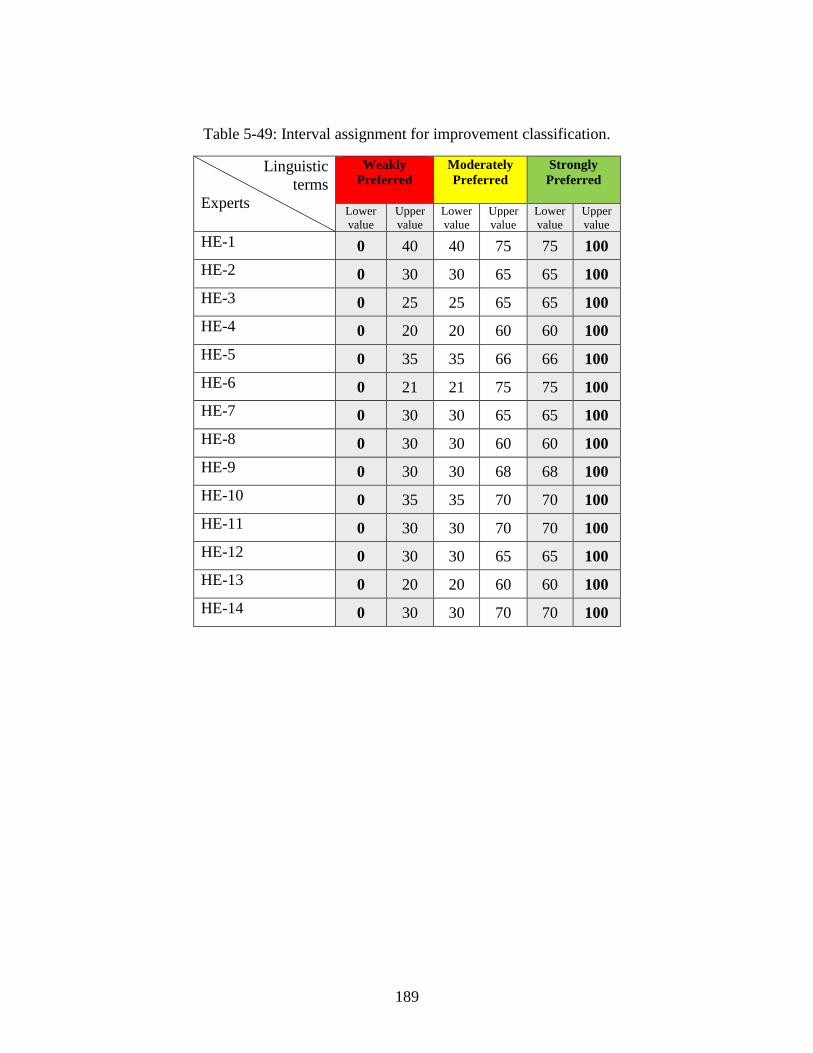
189
Table 5-49: Interval assignment for improvement classification.
Linguistic
terms
Experts
Weakly
Preferred
Moderately
Preferred
Strongly
Preferred
Lower
value
Upper
value
Lower
value
Upper
value
Lower
value
Upper
value
HE-1 0 40 40 75 75 100
HE-2 0 30 30 65 65 100
HE-3 0 25 25 65 65 100
HE-4 0 20 20 60 60 100
HE-5 0 35 35 66 66 100
HE-6 0 21 21 75 75 100
HE-7 0 30 30 65 65 100
HE-8 0 30 30 60 60 100
HE-9 0 30 30 68 68 100
HE-10 0 35 35 70 70 100
HE-11 0 30 30 70 70 100
HE-12 0 30 30 65 65 100
HE-13 0 20 20 60 60 100
HE-14 0 30 30 70 70 100
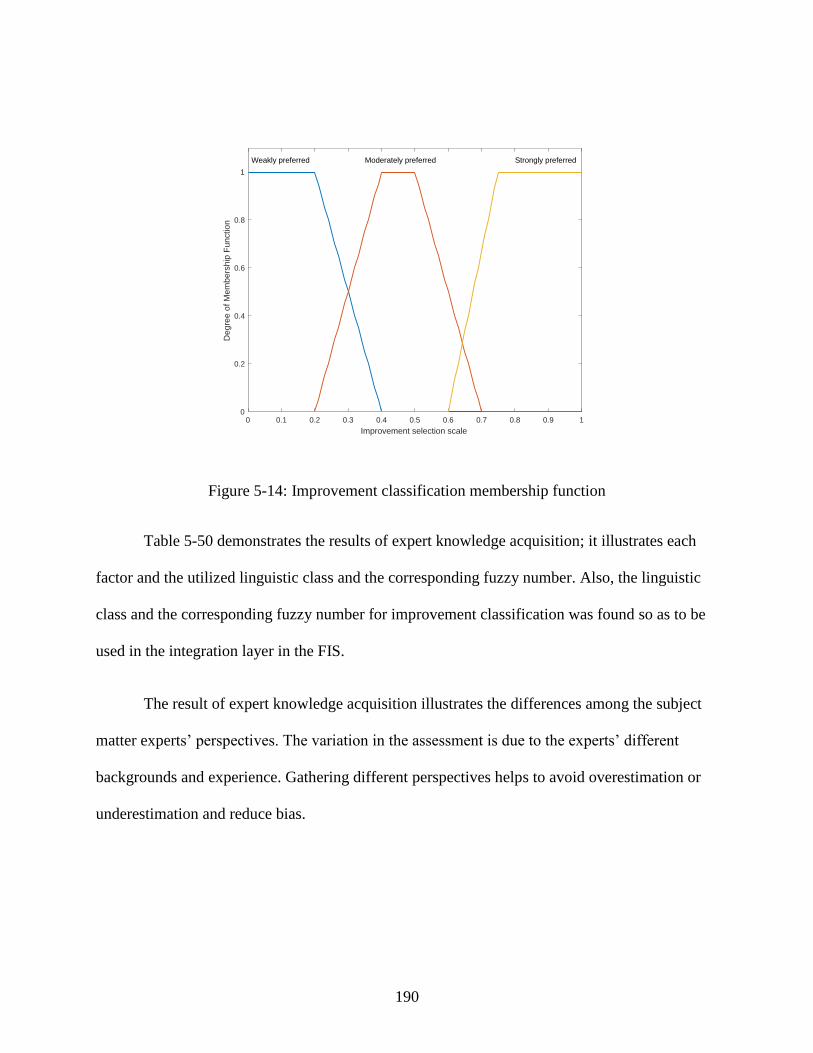
190
Figure 5-14: Improvement classification membership function
Table 5-50 demonstrates the results of expert knowledge acquisition; it illustrates each
factor and the utilized linguistic class and the corresponding fuzzy number. Also, the linguistic
class and the corresponding fuzzy number for improvement classification was found so as to be
used in the integration layer in the FIS.
The result of expert knowledge acquisition illustrates the differences among the subject
matter experts’ perspectives. The variation in the assessment is due to the experts’ different
backgrounds and experience. Gathering different perspectives helps to avoid overestimation or
underestimation and reduce bias.
0 0.1 0.2 0.3 0.4 0.5 0.6 0.7 0.8 0.9 1
Improvement selection scale
0
0.2
0.4
0.6
0.8
1
Deg
ree
of M
em
bers
hip
Fun
ctio
n
Weakly preferred Moderately preferred Strongly preferred
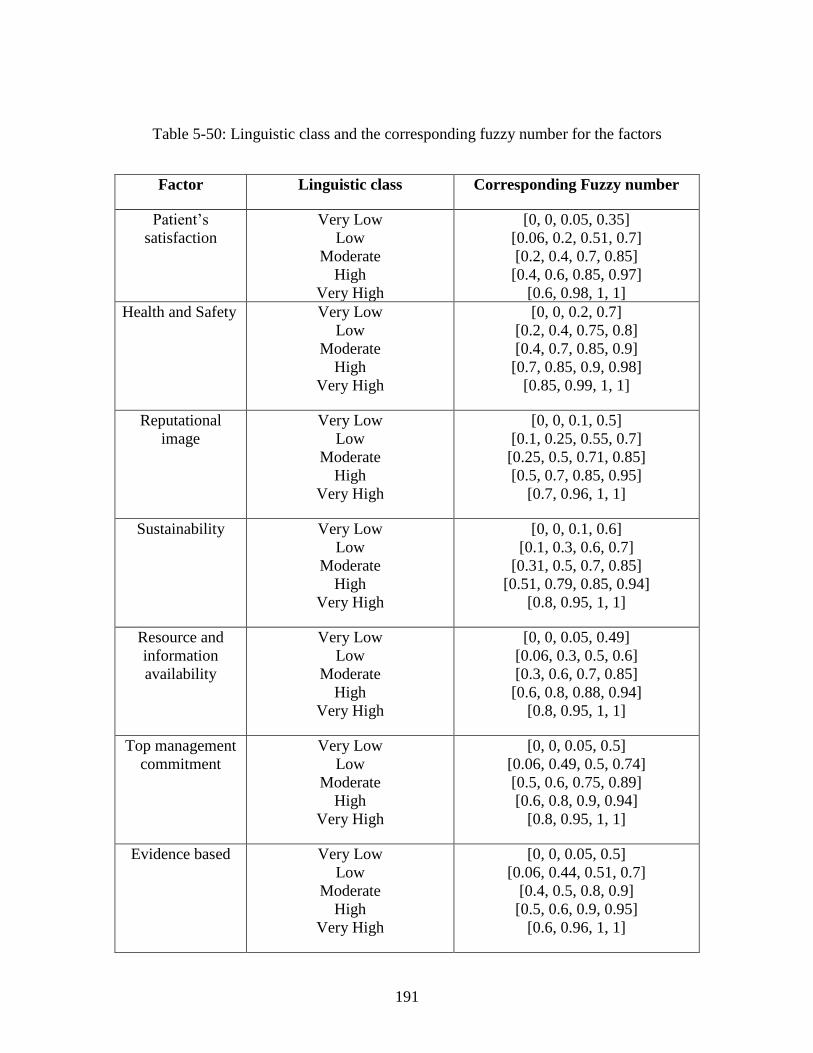
191
Table 5-50: Linguistic class and the corresponding fuzzy number for the factors
Factor Linguistic class Corresponding Fuzzy number
Patient’s
satisfaction
Very Low
Low
Moderate
High
Very High
[0, 0, 0.05, 0.35]
[0.06, 0.2, 0.51, 0.7]
[0.2, 0.4, 0.7, 0.85]
[0.4, 0.6, 0.85, 0.97]
[0.6, 0.98, 1, 1]
Health and Safety Very Low
Low
Moderate
High
Very High
[0, 0, 0.2, 0.7]
[0.2, 0.4, 0.75, 0.8]
[0.4, 0.7, 0.85, 0.9]
[0.7, 0.85, 0.9, 0.98]
[0.85, 0.99, 1, 1]
Reputational
image
Very Low
Low
Moderate
High
Very High
[0, 0, 0.1, 0.5]
[0.1, 0.25, 0.55, 0.7]
[0.25, 0.5, 0.71, 0.85]
[0.5, 0.7, 0.85, 0.95]
[0.7, 0.96, 1, 1]
Sustainability Very Low
Low
Moderate
High
Very High
[0, 0, 0.1, 0.6]
[0.1, 0.3, 0.6, 0.7]
[0.31, 0.5, 0.7, 0.85]
[0.51, 0.79, 0.85, 0.94]
[0.8, 0.95, 1, 1]
Resource and
information
availability
Very Low
Low
Moderate
High
Very High
[0, 0, 0.05, 0.49]
[0.06, 0.3, 0.5, 0.6]
[0.3, 0.6, 0.7, 0.85]
[0.6, 0.8, 0.88, 0.94]
[0.8, 0.95, 1, 1]
Top management
commitment
Very Low
Low
Moderate
High
Very High
[0, 0, 0.05, 0.5]
[0.06, 0.49, 0.5, 0.74]
[0.5, 0.6, 0.75, 0.89]
[0.6, 0.8, 0.9, 0.94]
[0.8, 0.95, 1, 1]
Evidence based Very Low
Low
Moderate
High
Very High
[0, 0, 0.05, 0.5]
[0.06, 0.44, 0.51, 0.7]
[0.4, 0.5, 0.8, 0.9]
[0.5, 0.6, 0.9, 0.95]
[0.6, 0.96, 1, 1]
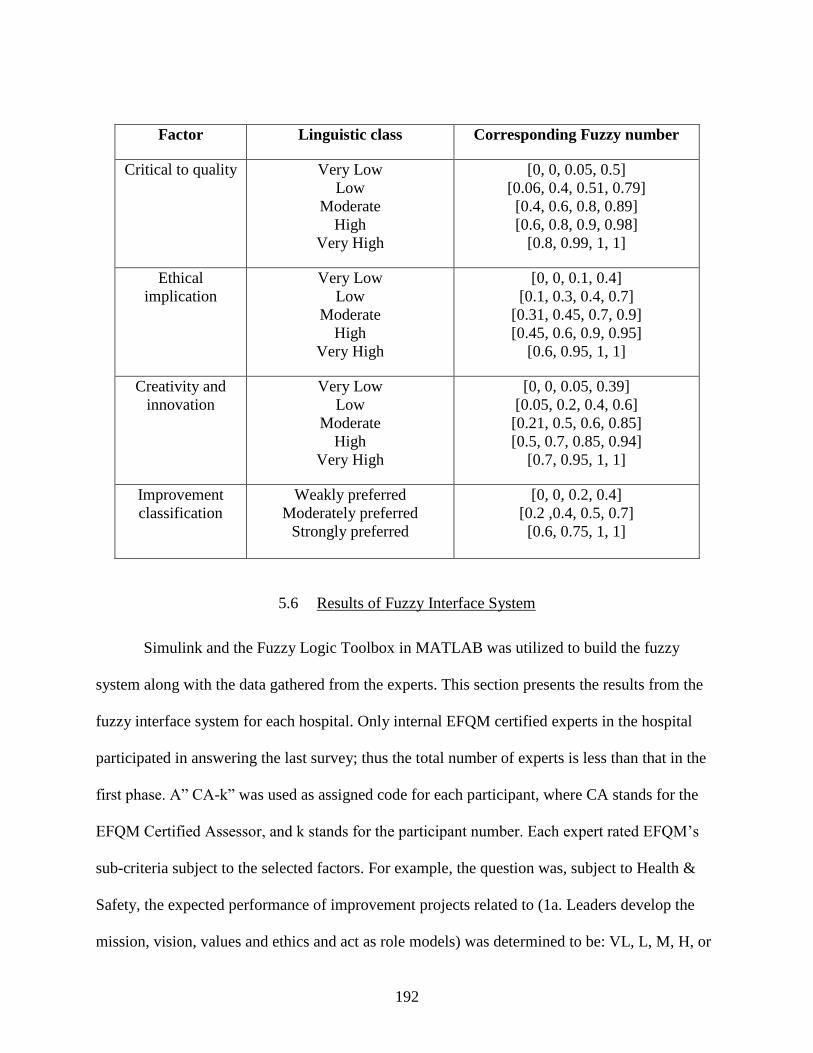
192
Factor Linguistic class Corresponding Fuzzy number
Critical to quality
Very Low
Low
Moderate
High
Very High
[0, 0, 0.05, 0.5]
[0.06, 0.4, 0.51, 0.79]
[0.4, 0.6, 0.8, 0.89]
[0.6, 0.8, 0.9, 0.98]
[0.8, 0.99, 1, 1]
Ethical
implication
Very Low
Low
Moderate
High
Very High
[0, 0, 0.1, 0.4]
[0.1, 0.3, 0.4, 0.7]
[0.31, 0.45, 0.7, 0.9]
[0.45, 0.6, 0.9, 0.95]
[0.6, 0.95, 1, 1]
Creativity and
innovation
Very Low
Low
Moderate
High
Very High
[0, 0, 0.05, 0.39]
[0.05, 0.2, 0.4, 0.6]
[0.21, 0.5, 0.6, 0.85]
[0.5, 0.7, 0.85, 0.94]
[0.7, 0.95, 1, 1]
Improvement
classification
Weakly preferred
Moderately preferred
Strongly preferred
[0, 0, 0.2, 0.4]
[0.2 ,0.4, 0.5, 0.7]
[0.6, 0.75, 1, 1]
5.6 Results of Fuzzy Interface System
Simulink and the Fuzzy Logic Toolbox in MATLAB was utilized to build the fuzzy
system along with the data gathered from the experts. This section presents the results from the
fuzzy interface system for each hospital. Only internal EFQM certified experts in the hospital
participated in answering the last survey; thus the total number of experts is less than that in the
first phase. A” CA-k” was used as assigned code for each participant, where CA stands for the
EFQM Certified Assessor, and k stands for the participant number. Each expert rated EFQM’s
sub-criteria subject to the selected factors. For example, the question was, subject to Health &
Safety, the expected performance of improvement projects related to (1a. Leaders develop the
mission, vision, values and ethics and act as role models) was determined to be: VL, L, M, H, or
193
VH. Note that out of the 32 sub-criteria, only 24 were included, as the facilities believed that
enablers’ sub-criteria are more related to improvement since they cover what and how the
organization do. Then all of the experts’ ratings were aggregated to end up with crisp values to
be used as inputs to the Simulink model.
The Simulink model was used to find the priority index for each alternative. The model
was built based on the number of the critical evaluation factors selected in the Fuzzy Delphi
method. The model inputs are the results obtained from the alternative rating from each factor
perspective and the weight assigned to each factor from Fuzzy Delphi step. The assigned weights
indicate the difference between factors importance from the facilities’ point of view. The model
consists of several Mamdani FISs built using the Fuzzy Logic Toolbox. The FISs were supplied
with membership functions obtained from the experts’ knowledge acquisition step.
5.6.1 Results for Hospital A
Table 5-51 to Table 5-58 below lay out the experts’ ratings for each alternative with
respect to the critical factors and the average fuzzy number. Five EFQM certified assessors in the
facility participated in rating the 24 sub-criteria; consequently a total of 960 ratings were given
for the expected performance. These ratings were aggregated using the fuzzy set in Table 4-5 and
the membership function in Figure 4-10 to end up with 192 fuzzy numbers for expected
performance. Then the fuzzy numbers of the expected performance were multiplied by the fuzzy
value of the factor’s weight to incorporate the factor importance in the ranking process, as shown
in

194
Table 5-59. Finally, the fuzzy number of the results was defuzzified to get 192 crisp
values. Table 5-60 summarizes the results of aggregating the EFQM assessors’ ratings for each
alternative.

195
Table 5-51: EFQM sub-criteria ratings subject to the patient satisfaction factor for Hospital A
Linguistic rating Fuzzy numbers
CA
-1
CA
-2
CA
-3
CA
-4
CA
-5
CA
-1
CA
-2
CA
-3
CA
-4
CA
-5 Average
Fuzzy
Number
1a. H H H H H [60,75,90] [60,75,90] [60,75,90] [60,75,90] [60,75,90] [60,75,90]
1b. H H VH M H [60,75,90] [60,75,90] [85,100,100] [35,50,65] [60,75,90] [60,75,87]
1c. H H VH H VH [60,75,90] [60,75,90] [85,100,100] [60,75,90] [85,100,100] [70,85,94]
1d. H H VH H H [60,75,90] [60,75,90] [85,100,100] [60,75,90] [60,75,90] [65,80,92]
1e. H H H H L [60,75,90] [60,75,90] [60,75,90] [60,75,90] [10,25,40] [50,65,80]
2a. H H VH H M [60,75,90] [60,75,90] [85,100,100] [60,75,90] [35,50,65] [60,75,87]
2b. H M M H H [60,75,90] [35,50,65] [35,50,65] [60,75,90] [60,75,90] [50,65,80]
2c. H M M VH M [60,75,90] [35,50,65] [35,50,65] [85,100,100] [35,50,65] [50,65,77]
2d. M M M VH M [35,50,65] [35,50,65] [35,50,65] [85,100,100] [35,50,65] [45,60,72]
3a. H H H VH L [60,75,90] [60,75,90] [60,75,90] [85,100,100] [10,25,40] [55,70,82]
3b. H H H VH M [60,75,90] [60,75,90] [60,75,90] [85,100,100] [35,50,65] [60,75,87]
3c. H H VH VH L [60,75,90] [60,75,90] [85,100,100] [85,100,100] [10,25,40] [60,75,84]
3d. H H VH VH M [60,75,90] [60,75,90] [85,100,100] [85,100,100] [35,50,65] [65,80,89]
3e. H M VH VH VL [60,75,90] [35,50,65] [85,100,100] [85,100,100] [0,0,15] [53,65,74]
4a. M M H VH H [35,50,65] [35,50,65] [60,75,90] [85,100,100] [60,75,90] [55,70,82]
4b. M M H VH VL [35,50,65] [35,50,65] [60,75,90] [85,100,100] [0,0,15] [43,55,67]
4c. H H H VH H [60,75,90] [60,75,90] [60,75,90] [85,100,100] [60,75,90] [65,80,92]
4d. H H H VH M [60,75,90] [60,75,90] [60,75,90] [85,100,100] [35,50,65] [60,75,87]
4e. M M H VH H [35,50,65] [35,50,65] [60,75,90] [85,100,100] [60,75,90] [55,70,82]
5a. H M M VH VH [60,75,90] [35,50,65] [35,50,65] [85,100,100] [85,100,100] [60,75,84]
5b. H H VH VH VH [60,75,90] [60,75,90] [85,100,100] [85,100,100] [85,100,100] [75,90,96]
5c. H M VH VH H [60,75,90] [35,50,65] [85,100,100] [85,100,100] [60,75,90] [65,80,89]
5d. H M VH H H [60,75,90] [35,50,65] [85,100,100] [60,75,90] [60,75,90] [60,75,87]
5e. VH VH VH H VH [85,100,100] [85,100,100] [85,100,100] [60,75,90] [85,100,100] [80,95,98]
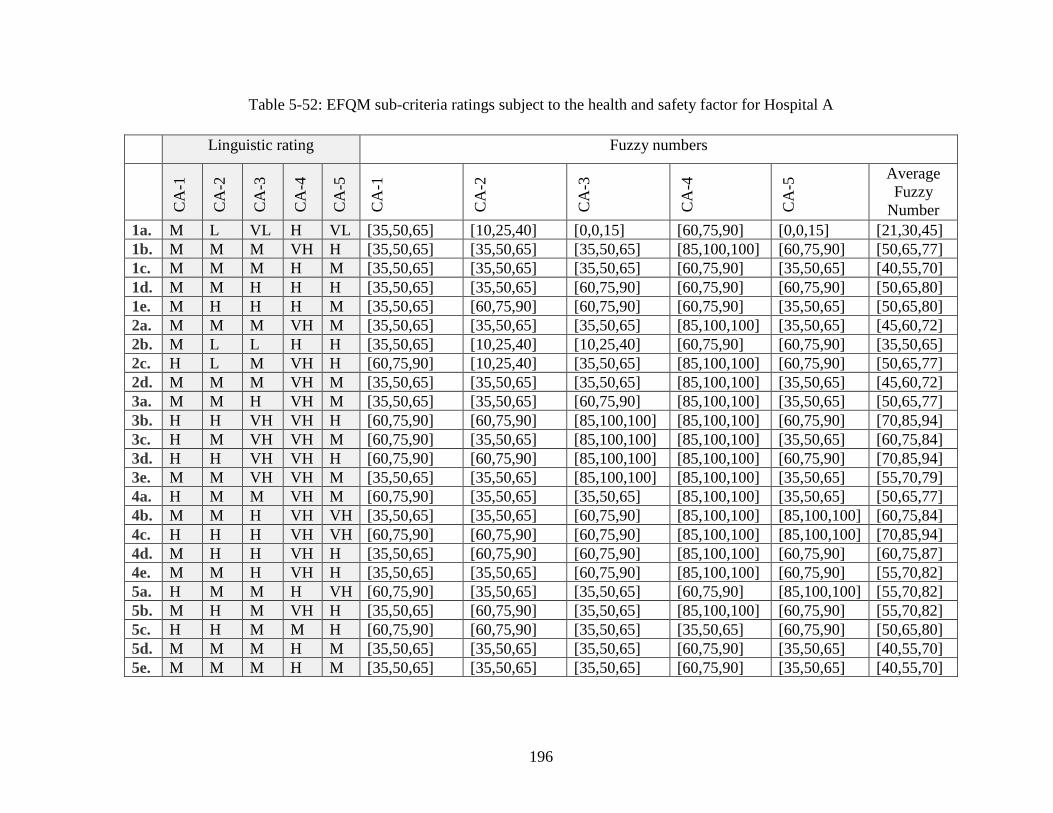
196
Table 5-52: EFQM sub-criteria ratings subject to the health and safety factor for Hospital A
Linguistic rating Fuzzy numbers
CA
-1
CA
-2
CA
-3
CA
-4
CA
-5
CA
-1
CA
-2
CA
-3
CA
-4
CA
-5 Average
Fuzzy
Number
1a. M L VL H VL [35,50,65] [10,25,40] [0,0,15] [60,75,90] [0,0,15] [21,30,45]
1b. M M M VH H [35,50,65] [35,50,65] [35,50,65] [85,100,100] [60,75,90] [50,65,77]
1c. M M M H M [35,50,65] [35,50,65] [35,50,65] [60,75,90] [35,50,65] [40,55,70]
1d. M M H H H [35,50,65] [35,50,65] [60,75,90] [60,75,90] [60,75,90] [50,65,80]
1e. M H H H M [35,50,65] [60,75,90] [60,75,90] [60,75,90] [35,50,65] [50,65,80]
2a. M M M VH M [35,50,65] [35,50,65] [35,50,65] [85,100,100] [35,50,65] [45,60,72]
2b. M L L H H [35,50,65] [10,25,40] [10,25,40] [60,75,90] [60,75,90] [35,50,65]
2c. H L M VH H [60,75,90] [10,25,40] [35,50,65] [85,100,100] [60,75,90] [50,65,77]
2d. M M M VH M [35,50,65] [35,50,65] [35,50,65] [85,100,100] [35,50,65] [45,60,72]
3a. M M H VH M [35,50,65] [35,50,65] [60,75,90] [85,100,100] [35,50,65] [50,65,77]
3b. H H VH VH H [60,75,90] [60,75,90] [85,100,100] [85,100,100] [60,75,90] [70,85,94]
3c. H M VH VH M [60,75,90] [35,50,65] [85,100,100] [85,100,100] [35,50,65] [60,75,84]
3d. H H VH VH H [60,75,90] [60,75,90] [85,100,100] [85,100,100] [60,75,90] [70,85,94]
3e. M M VH VH M [35,50,65] [35,50,65] [85,100,100] [85,100,100] [35,50,65] [55,70,79]
4a. H M M VH M [60,75,90] [35,50,65] [35,50,65] [85,100,100] [35,50,65] [50,65,77]
4b. M M H VH VH [35,50,65] [35,50,65] [60,75,90] [85,100,100] [85,100,100] [60,75,84]
4c. H H H VH VH [60,75,90] [60,75,90] [60,75,90] [85,100,100] [85,100,100] [70,85,94]
4d. M H H VH H [35,50,65] [60,75,90] [60,75,90] [85,100,100] [60,75,90] [60,75,87]
4e. M M H VH H [35,50,65] [35,50,65] [60,75,90] [85,100,100] [60,75,90] [55,70,82]
5a. H M M H VH [60,75,90] [35,50,65] [35,50,65] [60,75,90] [85,100,100] [55,70,82]
5b. M H M VH H [35,50,65] [60,75,90] [35,50,65] [85,100,100] [60,75,90] [55,70,82]
5c. H H M M H [60,75,90] [60,75,90] [35,50,65] [35,50,65] [60,75,90] [50,65,80]
5d. M M M H M [35,50,65] [35,50,65] [35,50,65] [60,75,90] [35,50,65] [40,55,70]
5e. M M M H M [35,50,65] [35,50,65] [35,50,65] [60,75,90] [35,50,65] [40,55,70]
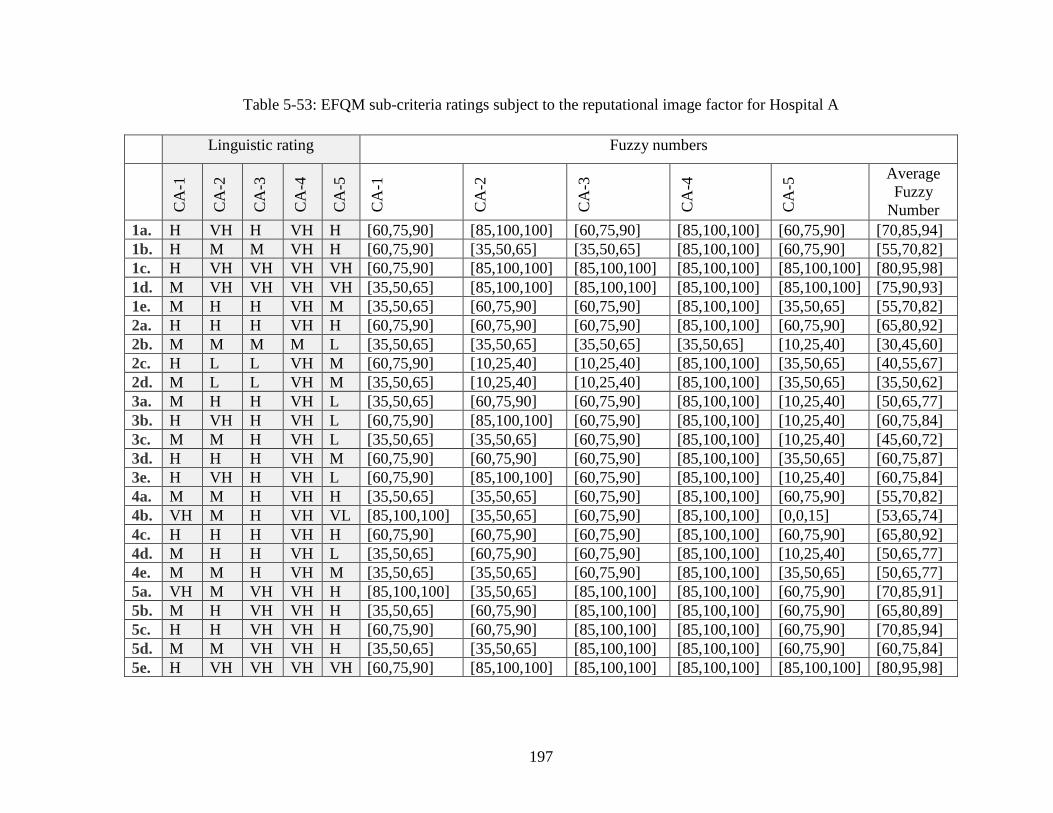
197
Table 5-53: EFQM sub-criteria ratings subject to the reputational image factor for Hospital A
Linguistic rating Fuzzy numbers
CA
-1
CA
-2
CA
-3
CA
-4
CA
-5
CA
-1
CA
-2
CA
-3
CA
-4
CA
-5 Average
Fuzzy
Number
1a. H VH H VH H [60,75,90] [85,100,100] [60,75,90] [85,100,100] [60,75,90] [70,85,94]
1b. H M M VH H [60,75,90] [35,50,65] [35,50,65] [85,100,100] [60,75,90] [55,70,82]
1c. H VH VH VH VH [60,75,90] [85,100,100] [85,100,100] [85,100,100] [85,100,100] [80,95,98]
1d. M VH VH VH VH [35,50,65] [85,100,100] [85,100,100] [85,100,100] [85,100,100] [75,90,93]
1e. M H H VH M [35,50,65] [60,75,90] [60,75,90] [85,100,100] [35,50,65] [55,70,82]
2a. H H H VH H [60,75,90] [60,75,90] [60,75,90] [85,100,100] [60,75,90] [65,80,92]
2b. M M M M L [35,50,65] [35,50,65] [35,50,65] [35,50,65] [10,25,40] [30,45,60]
2c. H L L VH M [60,75,90] [10,25,40] [10,25,40] [85,100,100] [35,50,65] [40,55,67]
2d. M L L VH M [35,50,65] [10,25,40] [10,25,40] [85,100,100] [35,50,65] [35,50,62]
3a. M H H VH L [35,50,65] [60,75,90] [60,75,90] [85,100,100] [10,25,40] [50,65,77]
3b. H VH H VH L [60,75,90] [85,100,100] [60,75,90] [85,100,100] [10,25,40] [60,75,84]
3c. M M H VH L [35,50,65] [35,50,65] [60,75,90] [85,100,100] [10,25,40] [45,60,72]
3d. H H H VH M [60,75,90] [60,75,90] [60,75,90] [85,100,100] [35,50,65] [60,75,87]
3e. H VH H VH L [60,75,90] [85,100,100] [60,75,90] [85,100,100] [10,25,40] [60,75,84]
4a. M M H VH H [35,50,65] [35,50,65] [60,75,90] [85,100,100] [60,75,90] [55,70,82]
4b. VH M H VH VL [85,100,100] [35,50,65] [60,75,90] [85,100,100] [0,0,15] [53,65,74]
4c. H H H VH H [60,75,90] [60,75,90] [60,75,90] [85,100,100] [60,75,90] [65,80,92]
4d. M H H VH L [35,50,65] [60,75,90] [60,75,90] [85,100,100] [10,25,40] [50,65,77]
4e. M M H VH M [35,50,65] [35,50,65] [60,75,90] [85,100,100] [35,50,65] [50,65,77]
5a. VH M VH VH H [85,100,100] [35,50,65] [85,100,100] [85,100,100] [60,75,90] [70,85,91]
5b. M H VH VH H [35,50,65] [60,75,90] [85,100,100] [85,100,100] [60,75,90] [65,80,89]
5c. H H VH VH H [60,75,90] [60,75,90] [85,100,100] [85,100,100] [60,75,90] [70,85,94]
5d. M M VH VH H [35,50,65] [35,50,65] [85,100,100] [85,100,100] [60,75,90] [60,75,84]
5e. H VH VH VH VH [60,75,90] [85,100,100] [85,100,100] [85,100,100] [85,100,100] [80,95,98]
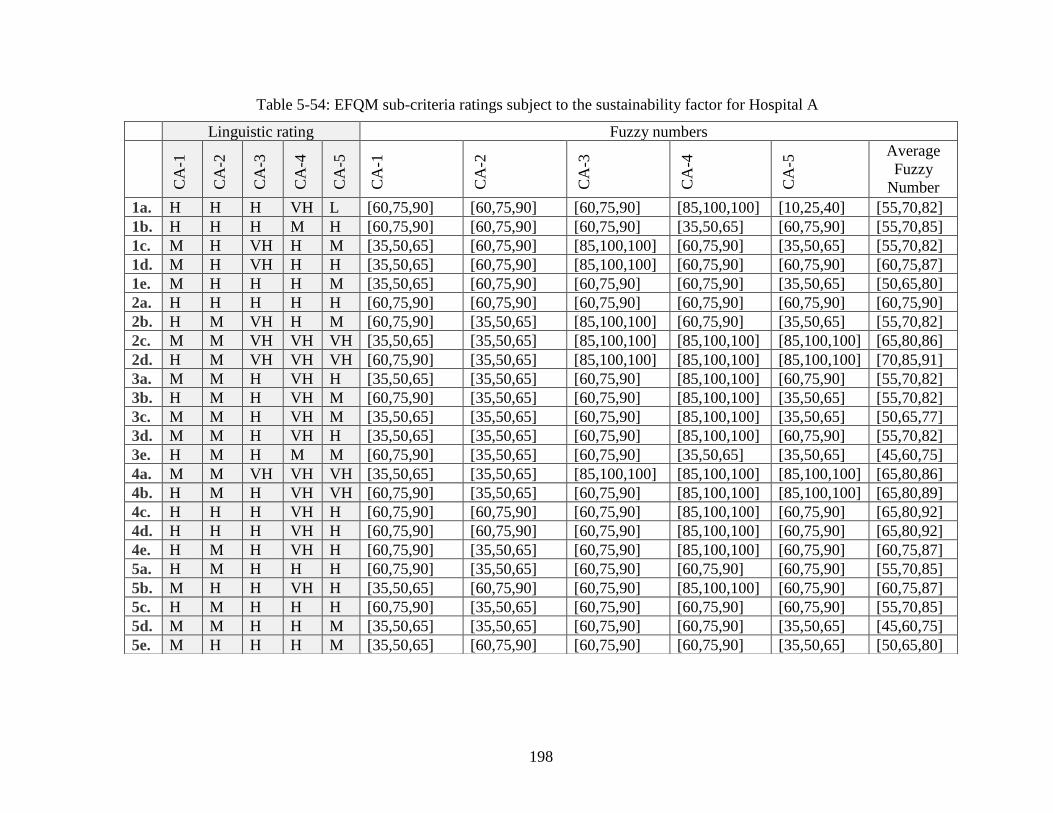
198
Table 5-54: EFQM sub-criteria ratings subject to the sustainability factor for Hospital A
Linguistic rating Fuzzy numbers
CA
-1
CA
-2
CA
-3
CA
-4
CA
-5
CA
-1
CA
-2
CA
-3
CA
-4
CA
-5 Average
Fuzzy
Number
1a. H H H VH L [60,75,90] [60,75,90] [60,75,90] [85,100,100] [10,25,40] [55,70,82]
1b. H H H M H [60,75,90] [60,75,90] [60,75,90] [35,50,65] [60,75,90] [55,70,85]
1c. M H VH H M [35,50,65] [60,75,90] [85,100,100] [60,75,90] [35,50,65] [55,70,82]
1d. M H VH H H [35,50,65] [60,75,90] [85,100,100] [60,75,90] [60,75,90] [60,75,87]
1e. M H H H M [35,50,65] [60,75,90] [60,75,90] [60,75,90] [35,50,65] [50,65,80]
2a. H H H H H [60,75,90] [60,75,90] [60,75,90] [60,75,90] [60,75,90] [60,75,90]
2b. H M VH H M [60,75,90] [35,50,65] [85,100,100] [60,75,90] [35,50,65] [55,70,82]
2c. M M VH VH VH [35,50,65] [35,50,65] [85,100,100] [85,100,100] [85,100,100] [65,80,86]
2d. H M VH VH VH [60,75,90] [35,50,65] [85,100,100] [85,100,100] [85,100,100] [70,85,91]
3a. M M H VH H [35,50,65] [35,50,65] [60,75,90] [85,100,100] [60,75,90] [55,70,82]
3b. H M H VH M [60,75,90] [35,50,65] [60,75,90] [85,100,100] [35,50,65] [55,70,82]
3c. M M H VH M [35,50,65] [35,50,65] [60,75,90] [85,100,100] [35,50,65] [50,65,77]
3d. M M H VH H [35,50,65] [35,50,65] [60,75,90] [85,100,100] [60,75,90] [55,70,82]
3e. H M H M M [60,75,90] [35,50,65] [60,75,90] [35,50,65] [35,50,65] [45,60,75]
4a. M M VH VH VH [35,50,65] [35,50,65] [85,100,100] [85,100,100] [85,100,100] [65,80,86]
4b. H M H VH VH [60,75,90] [35,50,65] [60,75,90] [85,100,100] [85,100,100] [65,80,89]
4c. H H H VH H [60,75,90] [60,75,90] [60,75,90] [85,100,100] [60,75,90] [65,80,92]
4d. H H H VH H [60,75,90] [60,75,90] [60,75,90] [85,100,100] [60,75,90] [65,80,92]
4e. H M H VH H [60,75,90] [35,50,65] [60,75,90] [85,100,100] [60,75,90] [60,75,87]
5a. H M H H H [60,75,90] [35,50,65] [60,75,90] [60,75,90] [60,75,90] [55,70,85]
5b. M H H VH H [35,50,65] [60,75,90] [60,75,90] [85,100,100] [60,75,90] [60,75,87]
5c. H M H H H [60,75,90] [35,50,65] [60,75,90] [60,75,90] [60,75,90] [55,70,85]
5d. M M H H M [35,50,65] [35,50,65] [60,75,90] [60,75,90] [35,50,65] [45,60,75]
5e. M H H H M [35,50,65] [60,75,90] [60,75,90] [60,75,90] [35,50,65] [50,65,80]
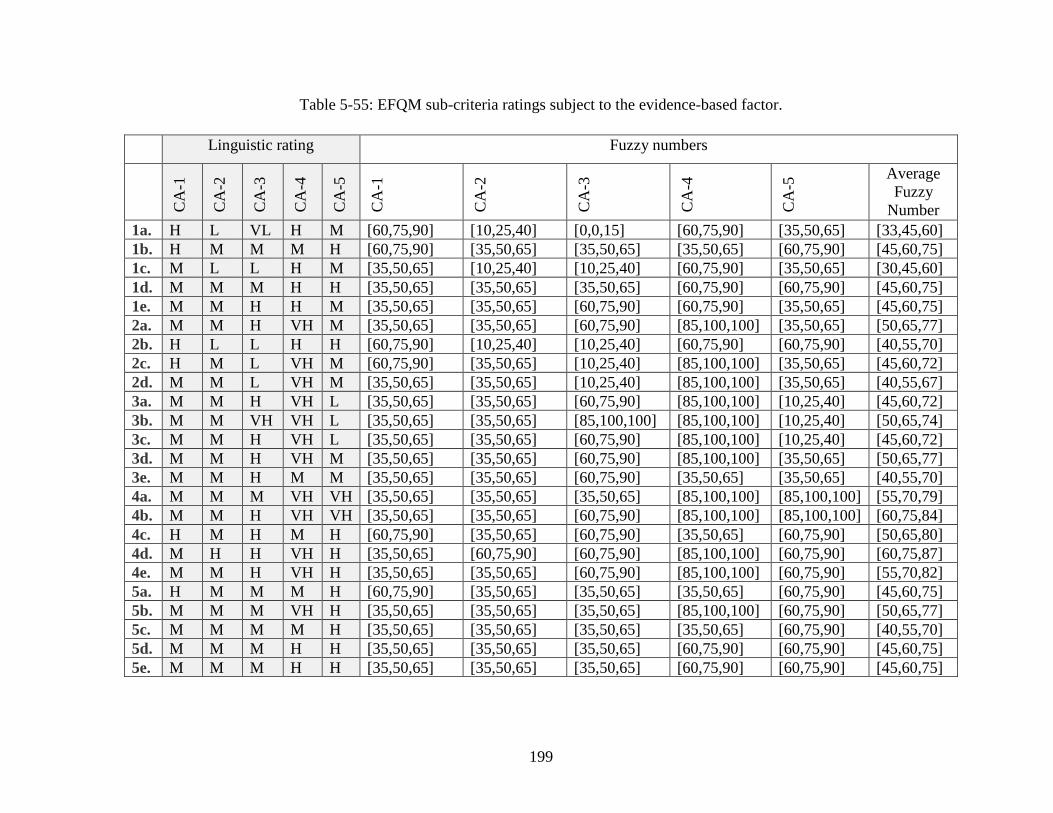
199
Table 5-55: EFQM sub-criteria ratings subject to the evidence-based factor.
Linguistic rating Fuzzy numbers
CA
-1
CA
-2
CA
-3
CA
-4
CA
-5
CA
-1
CA
-2
CA
-3
CA
-4
CA
-5 Average
Fuzzy
Number
1a. H L VL H M [60,75,90] [10,25,40] [0,0,15] [60,75,90] [35,50,65] [33,45,60]
1b. H M M M H [60,75,90] [35,50,65] [35,50,65] [35,50,65] [60,75,90] [45,60,75]
1c. M L L H M [35,50,65] [10,25,40] [10,25,40] [60,75,90] [35,50,65] [30,45,60]
1d. M M M H H [35,50,65] [35,50,65] [35,50,65] [60,75,90] [60,75,90] [45,60,75]
1e. M M H H M [35,50,65] [35,50,65] [60,75,90] [60,75,90] [35,50,65] [45,60,75]
2a. M M H VH M [35,50,65] [35,50,65] [60,75,90] [85,100,100] [35,50,65] [50,65,77]
2b. H L L H H [60,75,90] [10,25,40] [10,25,40] [60,75,90] [60,75,90] [40,55,70]
2c. H M L VH M [60,75,90] [35,50,65] [10,25,40] [85,100,100] [35,50,65] [45,60,72]
2d. M M L VH M [35,50,65] [35,50,65] [10,25,40] [85,100,100] [35,50,65] [40,55,67]
3a. M M H VH L [35,50,65] [35,50,65] [60,75,90] [85,100,100] [10,25,40] [45,60,72]
3b. M M VH VH L [35,50,65] [35,50,65] [85,100,100] [85,100,100] [10,25,40] [50,65,74]
3c. M M H VH L [35,50,65] [35,50,65] [60,75,90] [85,100,100] [10,25,40] [45,60,72]
3d. M M H VH M [35,50,65] [35,50,65] [60,75,90] [85,100,100] [35,50,65] [50,65,77]
3e. M M H M M [35,50,65] [35,50,65] [60,75,90] [35,50,65] [35,50,65] [40,55,70]
4a. M M M VH VH [35,50,65] [35,50,65] [35,50,65] [85,100,100] [85,100,100] [55,70,79]
4b. M M H VH VH [35,50,65] [35,50,65] [60,75,90] [85,100,100] [85,100,100] [60,75,84]
4c. H M H M H [60,75,90] [35,50,65] [60,75,90] [35,50,65] [60,75,90] [50,65,80]
4d. M H H VH H [35,50,65] [60,75,90] [60,75,90] [85,100,100] [60,75,90] [60,75,87]
4e. M M H VH H [35,50,65] [35,50,65] [60,75,90] [85,100,100] [60,75,90] [55,70,82]
5a. H M M M H [60,75,90] [35,50,65] [35,50,65] [35,50,65] [60,75,90] [45,60,75]
5b. M M M VH H [35,50,65] [35,50,65] [35,50,65] [85,100,100] [60,75,90] [50,65,77]
5c. M M M M H [35,50,65] [35,50,65] [35,50,65] [35,50,65] [60,75,90] [40,55,70]
5d. M M M H H [35,50,65] [35,50,65] [35,50,65] [60,75,90] [60,75,90] [45,60,75]
5e. M M M H H [35,50,65] [35,50,65] [35,50,65] [60,75,90] [60,75,90] [45,60,75]
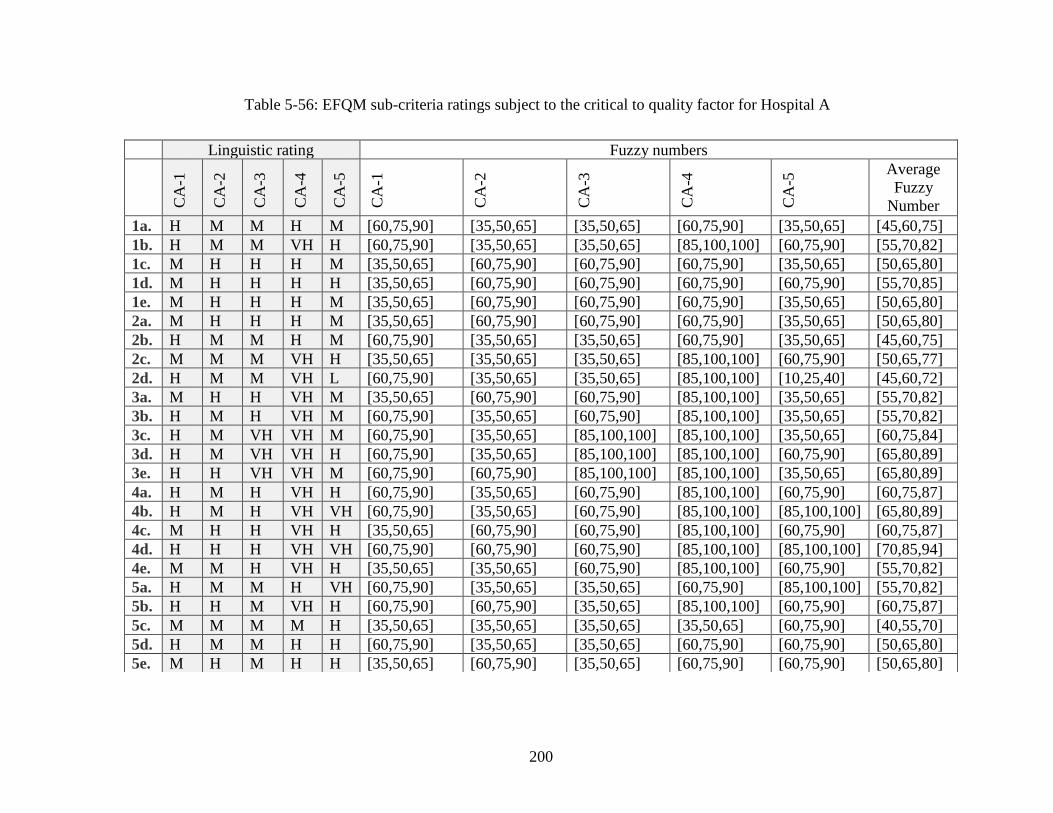
200
Table 5-56: EFQM sub-criteria ratings subject to the critical to quality factor for Hospital A
Linguistic rating Fuzzy numbers
CA
-1
CA
-2
CA
-3
CA
-4
CA
-5
CA
-1
CA
-2
CA
-3
CA
-4
CA
-5 Average
Fuzzy
Number
1a. H M M H M [60,75,90] [35,50,65] [35,50,65] [60,75,90] [35,50,65] [45,60,75]
1b. H M M VH H [60,75,90] [35,50,65] [35,50,65] [85,100,100] [60,75,90] [55,70,82]
1c. M H H H M [35,50,65] [60,75,90] [60,75,90] [60,75,90] [35,50,65] [50,65,80]
1d. M H H H H [35,50,65] [60,75,90] [60,75,90] [60,75,90] [60,75,90] [55,70,85]
1e. M H H H M [35,50,65] [60,75,90] [60,75,90] [60,75,90] [35,50,65] [50,65,80]
2a. M H H H M [35,50,65] [60,75,90] [60,75,90] [60,75,90] [35,50,65] [50,65,80]
2b. H M M H M [60,75,90] [35,50,65] [35,50,65] [60,75,90] [35,50,65] [45,60,75]
2c. M M M VH H [35,50,65] [35,50,65] [35,50,65] [85,100,100] [60,75,90] [50,65,77]
2d. H M M VH L [60,75,90] [35,50,65] [35,50,65] [85,100,100] [10,25,40] [45,60,72]
3a. M H H VH M [35,50,65] [60,75,90] [60,75,90] [85,100,100] [35,50,65] [55,70,82]
3b. H M H VH M [60,75,90] [35,50,65] [60,75,90] [85,100,100] [35,50,65] [55,70,82]
3c. H M VH VH M [60,75,90] [35,50,65] [85,100,100] [85,100,100] [35,50,65] [60,75,84]
3d. H M VH VH H [60,75,90] [35,50,65] [85,100,100] [85,100,100] [60,75,90] [65,80,89]
3e. H H VH VH M [60,75,90] [60,75,90] [85,100,100] [85,100,100] [35,50,65] [65,80,89]
4a. H M H VH H [60,75,90] [35,50,65] [60,75,90] [85,100,100] [60,75,90] [60,75,87]
4b. H M H VH VH [60,75,90] [35,50,65] [60,75,90] [85,100,100] [85,100,100] [65,80,89]
4c. M H H VH H [35,50,65] [60,75,90] [60,75,90] [85,100,100] [60,75,90] [60,75,87]
4d. H H H VH VH [60,75,90] [60,75,90] [60,75,90] [85,100,100] [85,100,100] [70,85,94]
4e. M M H VH H [35,50,65] [35,50,65] [60,75,90] [85,100,100] [60,75,90] [55,70,82]
5a. H M M H VH [60,75,90] [35,50,65] [35,50,65] [60,75,90] [85,100,100] [55,70,82]
5b. H H M VH H [60,75,90] [60,75,90] [35,50,65] [85,100,100] [60,75,90] [60,75,87]
5c. M M M M H [35,50,65] [35,50,65] [35,50,65] [35,50,65] [60,75,90] [40,55,70]
5d. H M M H H [60,75,90] [35,50,65] [35,50,65] [60,75,90] [60,75,90] [50,65,80]
5e. M H M H H [35,50,65] [60,75,90] [35,50,65] [60,75,90] [60,75,90] [50,65,80]
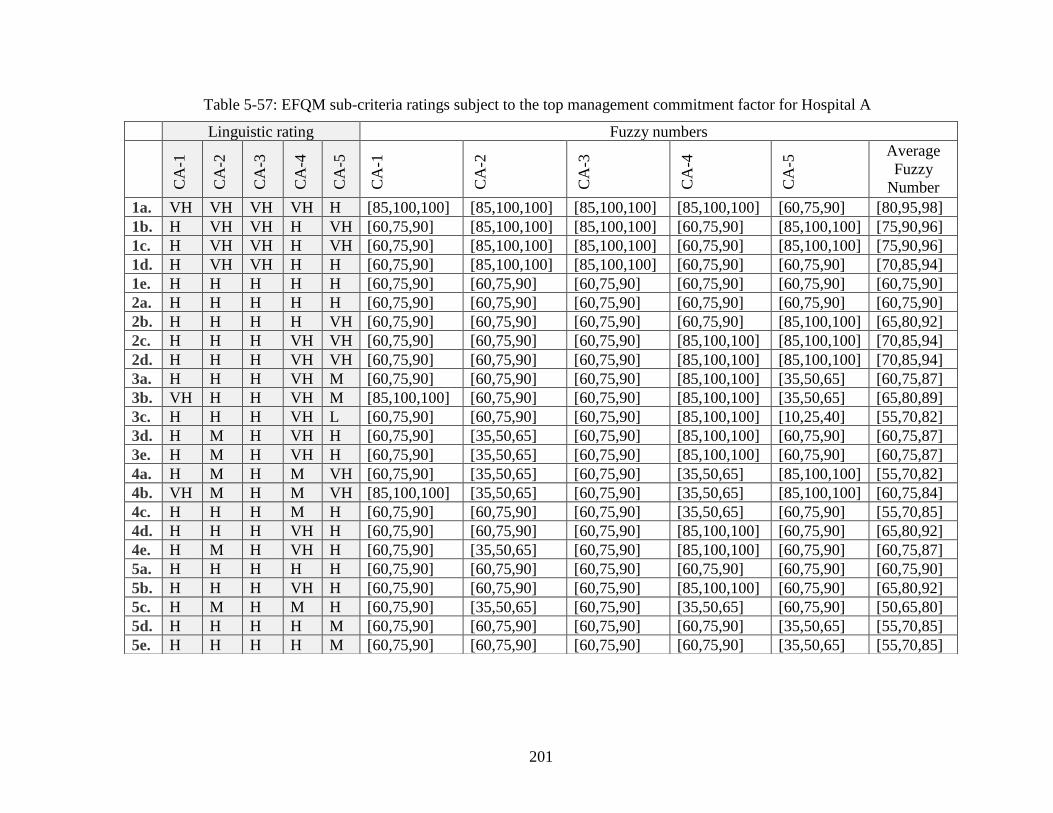
201
Table 5-57: EFQM sub-criteria ratings subject to the top management commitment factor for Hospital A
Linguistic rating Fuzzy numbers
CA
-1
CA
-2
CA
-3
CA
-4
CA
-5
CA
-1
CA
-2
CA
-3
CA
-4
CA
-5 Average
Fuzzy
Number
1a. VH VH VH VH H [85,100,100] [85,100,100] [85,100,100] [85,100,100] [60,75,90] [80,95,98]
1b. H VH VH H VH [60,75,90] [85,100,100] [85,100,100] [60,75,90] [85,100,100] [75,90,96]
1c. H VH VH H VH [60,75,90] [85,100,100] [85,100,100] [60,75,90] [85,100,100] [75,90,96]
1d. H VH VH H H [60,75,90] [85,100,100] [85,100,100] [60,75,90] [60,75,90] [70,85,94]
1e. H H H H H [60,75,90] [60,75,90] [60,75,90] [60,75,90] [60,75,90] [60,75,90]
2a. H H H H H [60,75,90] [60,75,90] [60,75,90] [60,75,90] [60,75,90] [60,75,90]
2b. H H H H VH [60,75,90] [60,75,90] [60,75,90] [60,75,90] [85,100,100] [65,80,92]
2c. H H H VH VH [60,75,90] [60,75,90] [60,75,90] [85,100,100] [85,100,100] [70,85,94]
2d. H H H VH VH [60,75,90] [60,75,90] [60,75,90] [85,100,100] [85,100,100] [70,85,94]
3a. H H H VH M [60,75,90] [60,75,90] [60,75,90] [85,100,100] [35,50,65] [60,75,87]
3b. VH H H VH M [85,100,100] [60,75,90] [60,75,90] [85,100,100] [35,50,65] [65,80,89]
3c. H H H VH L [60,75,90] [60,75,90] [60,75,90] [85,100,100] [10,25,40] [55,70,82]
3d. H M H VH H [60,75,90] [35,50,65] [60,75,90] [85,100,100] [60,75,90] [60,75,87]
3e. H M H VH H [60,75,90] [35,50,65] [60,75,90] [85,100,100] [60,75,90] [60,75,87]
4a. H M H M VH [60,75,90] [35,50,65] [60,75,90] [35,50,65] [85,100,100] [55,70,82]
4b. VH M H M VH [85,100,100] [35,50,65] [60,75,90] [35,50,65] [85,100,100] [60,75,84]
4c. H H H M H [60,75,90] [60,75,90] [60,75,90] [35,50,65] [60,75,90] [55,70,85]
4d. H H H VH H [60,75,90] [60,75,90] [60,75,90] [85,100,100] [60,75,90] [65,80,92]
4e. H M H VH H [60,75,90] [35,50,65] [60,75,90] [85,100,100] [60,75,90] [60,75,87]
5a. H H H H H [60,75,90] [60,75,90] [60,75,90] [60,75,90] [60,75,90] [60,75,90]
5b. H H H VH H [60,75,90] [60,75,90] [60,75,90] [85,100,100] [60,75,90] [65,80,92]
5c. H M H M H [60,75,90] [35,50,65] [60,75,90] [35,50,65] [60,75,90] [50,65,80]
5d. H H H H M [60,75,90] [60,75,90] [60,75,90] [60,75,90] [35,50,65] [55,70,85]
5e. H H H H M [60,75,90] [60,75,90] [60,75,90] [60,75,90] [35,50,65] [55,70,85]
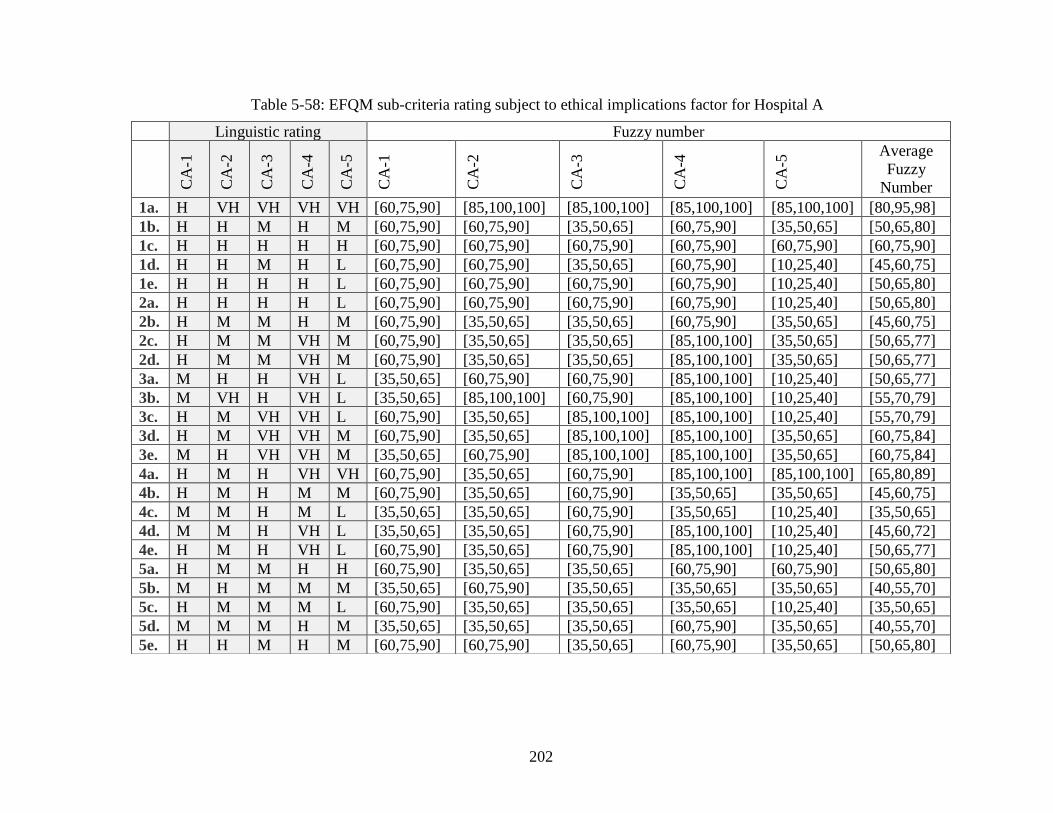
202
Table 5-58: EFQM sub-criteria rating subject to ethical implications factor for Hospital A
Linguistic rating Fuzzy number
CA
-1
CA
-2
CA
-3
CA
-4
CA
-5
CA
-1
CA
-2
CA
-3
CA
-4
CA
-5 Average
Fuzzy
Number
1a. H VH VH VH VH [60,75,90] [85,100,100] [85,100,100] [85,100,100] [85,100,100] [80,95,98]
1b. H H M H M [60,75,90] [60,75,90] [35,50,65] [60,75,90] [35,50,65] [50,65,80]
1c. H H H H H [60,75,90] [60,75,90] [60,75,90] [60,75,90] [60,75,90] [60,75,90]
1d. H H M H L [60,75,90] [60,75,90] [35,50,65] [60,75,90] [10,25,40] [45,60,75]
1e. H H H H L [60,75,90] [60,75,90] [60,75,90] [60,75,90] [10,25,40] [50,65,80]
2a. H H H H L [60,75,90] [60,75,90] [60,75,90] [60,75,90] [10,25,40] [50,65,80]
2b. H M M H M [60,75,90] [35,50,65] [35,50,65] [60,75,90] [35,50,65] [45,60,75]
2c. H M M VH M [60,75,90] [35,50,65] [35,50,65] [85,100,100] [35,50,65] [50,65,77]
2d. H M M VH M [60,75,90] [35,50,65] [35,50,65] [85,100,100] [35,50,65] [50,65,77]
3a. M H H VH L [35,50,65] [60,75,90] [60,75,90] [85,100,100] [10,25,40] [50,65,77]
3b. M VH H VH L [35,50,65] [85,100,100] [60,75,90] [85,100,100] [10,25,40] [55,70,79]
3c. H M VH VH L [60,75,90] [35,50,65] [85,100,100] [85,100,100] [10,25,40] [55,70,79]
3d. H M VH VH M [60,75,90] [35,50,65] [85,100,100] [85,100,100] [35,50,65] [60,75,84]
3e. M H VH VH M [35,50,65] [60,75,90] [85,100,100] [85,100,100] [35,50,65] [60,75,84]
4a. H M H VH VH [60,75,90] [35,50,65] [60,75,90] [85,100,100] [85,100,100] [65,80,89]
4b. H M H M M [60,75,90] [35,50,65] [60,75,90] [35,50,65] [35,50,65] [45,60,75]
4c. M M H M L [35,50,65] [35,50,65] [60,75,90] [35,50,65] [10,25,40] [35,50,65]
4d. M M H VH L [35,50,65] [35,50,65] [60,75,90] [85,100,100] [10,25,40] [45,60,72]
4e. H M H VH L [60,75,90] [35,50,65] [60,75,90] [85,100,100] [10,25,40] [50,65,77]
5a. H M M H H [60,75,90] [35,50,65] [35,50,65] [60,75,90] [60,75,90] [50,65,80]
5b. M H M M M [35,50,65] [60,75,90] [35,50,65] [35,50,65] [35,50,65] [40,55,70]
5c. H M M M L [60,75,90] [35,50,65] [35,50,65] [35,50,65] [10,25,40] [35,50,65]
5d. M M M H M [35,50,65] [35,50,65] [35,50,65] [60,75,90] [35,50,65] [40,55,70]
5e. H H M H M [60,75,90] [60,75,90] [35,50,65] [60,75,90] [35,50,65] [50,65,80]
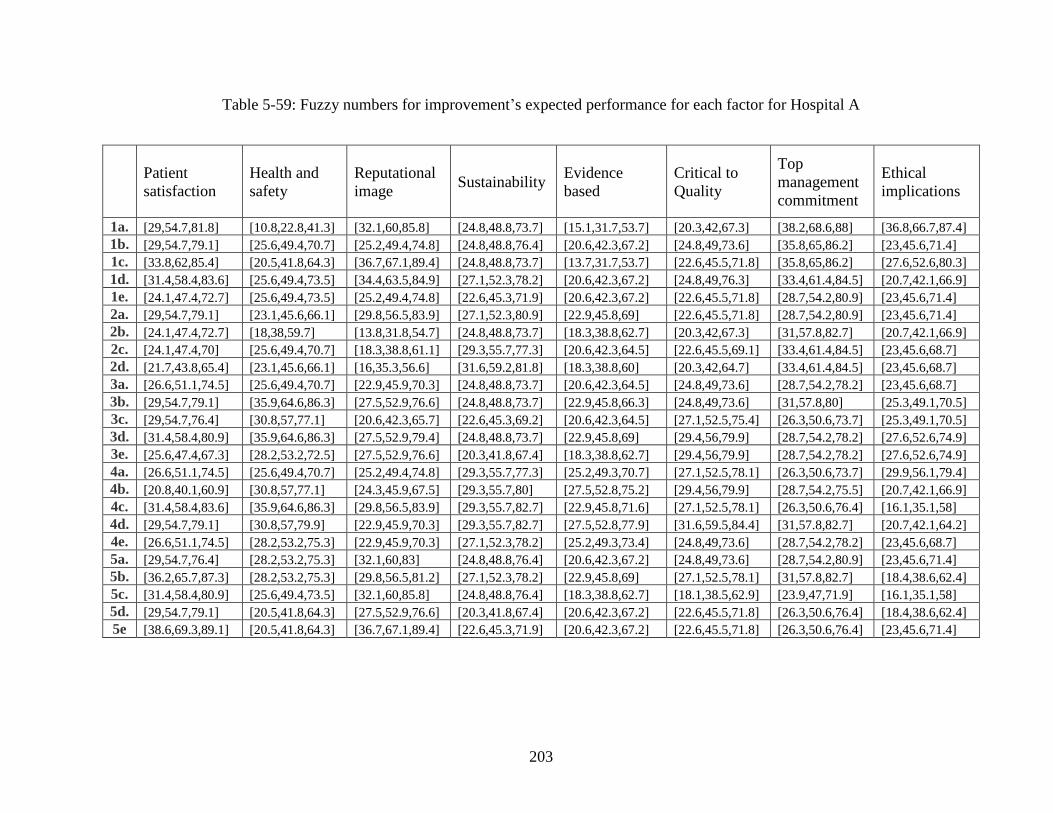
203
Table 5-59: Fuzzy numbers for improvement’s expected performance for each factor for Hospital A
Patient
satisfaction
Health and
safety
Reputational
image Sustainability
Evidence
based
Critical to
Quality
Top
management
commitment
Ethical
implications
1a. [29,54.7,81.8] [10.8,22.8,41.3] [32.1,60,85.8] [24.8,48.8,73.7] [15.1,31.7,53.7] [20.3,42,67.3] [38.2,68.6,88] [36.8,66.7,87.4]
1b. [29,54.7,79.1] [25.6,49.4,70.7] [25.2,49.4,74.8] [24.8,48.8,76.4] [20.6,42.3,67.2] [24.8,49,73.6] [35.8,65,86.2] [23,45.6,71.4]
1c. [33.8,62,85.4] [20.5,41.8,64.3] [36.7,67.1,89.4] [24.8,48.8,73.7] [13.7,31.7,53.7] [22.6,45.5,71.8] [35.8,65,86.2] [27.6,52.6,80.3]
1d. [31.4,58.4,83.6] [25.6,49.4,73.5] [34.4,63.5,84.9] [27.1,52.3,78.2] [20.6,42.3,67.2] [24.8,49,76.3] [33.4,61.4,84.5] [20.7,42.1,66.9]
1e. [24.1,47.4,72.7] [25.6,49.4,73.5] [25.2,49.4,74.8] [22.6,45.3,71.9] [20.6,42.3,67.2] [22.6,45.5,71.8] [28.7,54.2,80.9] [23,45.6,71.4]
2a. [29,54.7,79.1] [23.1,45.6,66.1] [29.8,56.5,83.9] [27.1,52.3,80.9] [22.9,45.8,69] [22.6,45.5,71.8] [28.7,54.2,80.9] [23,45.6,71.4]
2b. [24.1,47.4,72.7] [18,38,59.7] [13.8,31.8,54.7] [24.8,48.8,73.7] [18.3,38.8,62.7] [20.3,42,67.3] [31,57.8,82.7] [20.7,42.1,66.9]
2c. [24.1,47.4,70] [25.6,49.4,70.7] [18.3,38.8,61.1] [29.3,55.7,77.3] [20.6,42.3,64.5] [22.6,45.5,69.1] [33.4,61.4,84.5] [23,45.6,68.7]
2d. [21.7,43.8,65.4] [23.1,45.6,66.1] [16,35.3,56.6] [31.6,59.2,81.8] [18.3,38.8,60] [20.3,42,64.7] [33.4,61.4,84.5] [23,45.6,68.7]
3a. [26.6,51.1,74.5] [25.6,49.4,70.7] [22.9,45.9,70.3] [24.8,48.8,73.7] [20.6,42.3,64.5] [24.8,49,73.6] [28.7,54.2,78.2] [23,45.6,68.7]
3b. [29,54.7,79.1] [35.9,64.6,86.3] [27.5,52.9,76.6] [24.8,48.8,73.7] [22.9,45.8,66.3] [24.8,49,73.6] [31,57.8,80] [25.3,49.1,70.5]
3c. [29,54.7,76.4] [30.8,57,77.1] [20.6,42.3,65.7] [22.6,45.3,69.2] [20.6,42.3,64.5] [27.1,52.5,75.4] [26.3,50.6,73.7] [25.3,49.1,70.5]
3d. [31.4,58.4,80.9] [35.9,64.6,86.3] [27.5,52.9,79.4] [24.8,48.8,73.7] [22.9,45.8,69] [29.4,56,79.9] [28.7,54.2,78.2] [27.6,52.6,74.9]
3e. [25.6,47.4,67.3] [28.2,53.2,72.5] [27.5,52.9,76.6] [20.3,41.8,67.4] [18.3,38.8,62.7] [29.4,56,79.9] [28.7,54.2,78.2] [27.6,52.6,74.9]
4a. [26.6,51.1,74.5] [25.6,49.4,70.7] [25.2,49.4,74.8] [29.3,55.7,77.3] [25.2,49.3,70.7] [27.1,52.5,78.1] [26.3,50.6,73.7] [29.9,56.1,79.4]
4b. [20.8,40.1,60.9] [30.8,57,77.1] [24.3,45.9,67.5] [29.3,55.7,80] [27.5,52.8,75.2] [29.4,56,79.9] [28.7,54.2,75.5] [20.7,42.1,66.9]
4c. [31.4,58.4,83.6] [35.9,64.6,86.3] [29.8,56.5,83.9] [29.3,55.7,82.7] [22.9,45.8,71.6] [27.1,52.5,78.1] [26.3,50.6,76.4] [16.1,35.1,58]
4d. [29,54.7,79.1] [30.8,57,79.9] [22.9,45.9,70.3] [29.3,55.7,82.7] [27.5,52.8,77.9] [31.6,59.5,84.4] [31,57.8,82.7] [20.7,42.1,64.2]
4e. [26.6,51.1,74.5] [28.2,53.2,75.3] [22.9,45.9,70.3] [27.1,52.3,78.2] [25.2,49.3,73.4] [24.8,49,73.6] [28.7,54.2,78.2] [23,45.6,68.7]
5a. [29,54.7,76.4] [28.2,53.2,75.3] [32.1,60,83] [24.8,48.8,76.4] [20.6,42.3,67.2] [24.8,49,73.6] [28.7,54.2,80.9] [23,45.6,71.4]
5b. [36.2,65.7,87.3] [28.2,53.2,75.3] [29.8,56.5,81.2] [27.1,52.3,78.2] [22.9,45.8,69] [27.1,52.5,78.1] [31,57.8,82.7] [18.4,38.6,62.4]
5c. [31.4,58.4,80.9] [25.6,49.4,73.5] [32.1,60,85.8] [24.8,48.8,76.4] [18.3,38.8,62.7] [18.1,38.5,62.9] [23.9,47,71.9] [16.1,35.1,58]
5d. [29,54.7,79.1] [20.5,41.8,64.3] [27.5,52.9,76.6] [20.3,41.8,67.4] [20.6,42.3,67.2] [22.6,45.5,71.8] [26.3,50.6,76.4] [18.4,38.6,62.4]
5e [38.6,69.3,89.1] [20.5,41.8,64.3] [36.7,67.1,89.4] [22.6,45.3,71.9] [20.6,42.3,67.2] [22.6,45.5,71.8] [26.3,50.6,76.4] [23,45.6,71.4]
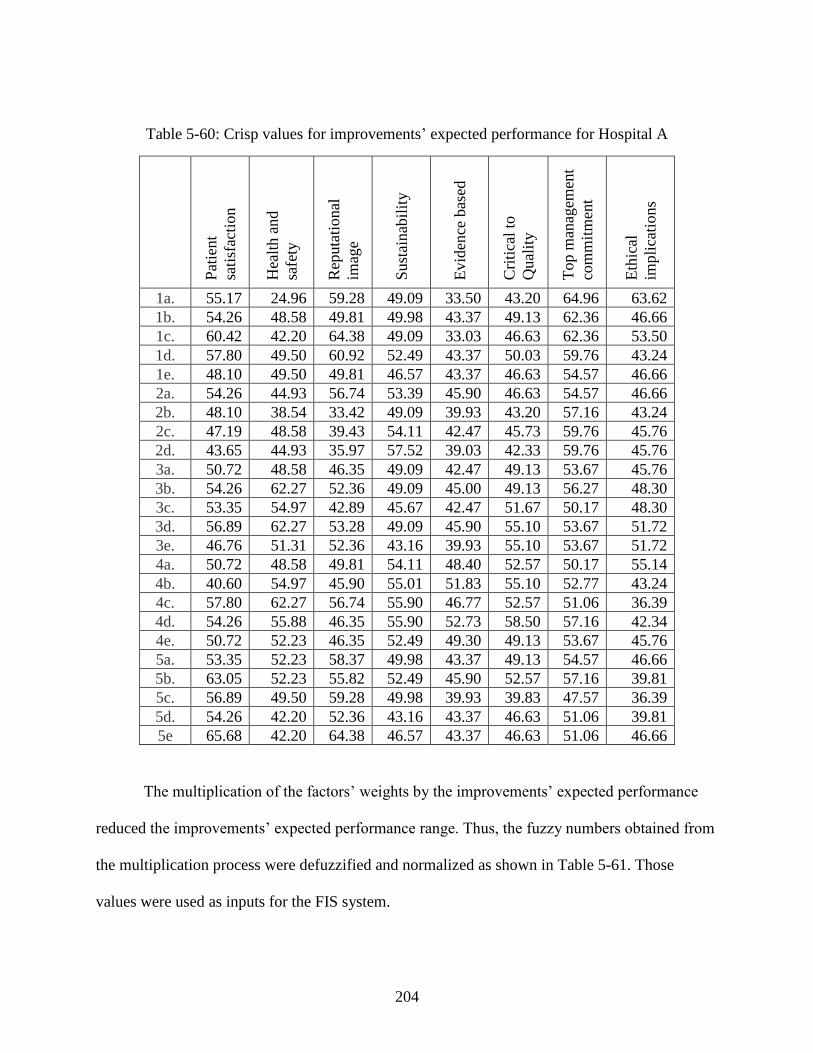
204
Table 5-60: Crisp values for improvements’ expected performance for Hospital A
Pat
ient
sati
sfac
tion
Hea
lth a
nd
safe
ty
Rep
uta
tional
imag
e
Sust
ainab
ilit
y
Evid
ence
bas
ed
Cri
tica
l to
Qual
ity
Top m
anag
emen
t
com
mit
men
t
Eth
ical
impli
cati
on
s
1a. 55.17 24.96 59.28 49.09 33.50 43.20 64.96 63.62
1b. 54.26 48.58 49.81 49.98 43.37 49.13 62.36 46.66
1c. 60.42 42.20 64.38 49.09 33.03 46.63 62.36 53.50
1d. 57.80 49.50 60.92 52.49 43.37 50.03 59.76 43.24
1e. 48.10 49.50 49.81 46.57 43.37 46.63 54.57 46.66
2a. 54.26 44.93 56.74 53.39 45.90 46.63 54.57 46.66
2b. 48.10 38.54 33.42 49.09 39.93 43.20 57.16 43.24
2c. 47.19 48.58 39.43 54.11 42.47 45.73 59.76 45.76
2d. 43.65 44.93 35.97 57.52 39.03 42.33 59.76 45.76
3a. 50.72 48.58 46.35 49.09 42.47 49.13 53.67 45.76
3b. 54.26 62.27 52.36 49.09 45.00 49.13 56.27 48.30
3c. 53.35 54.97 42.89 45.67 42.47 51.67 50.17 48.30
3d. 56.89 62.27 53.28 49.09 45.90 55.10 53.67 51.72
3e. 46.76 51.31 52.36 43.16 39.93 55.10 53.67 51.72
4a. 50.72 48.58 49.81 54.11 48.40 52.57 50.17 55.14
4b. 40.60 54.97 45.90 55.01 51.83 55.10 52.77 43.24
4c. 57.80 62.27 56.74 55.90 46.77 52.57 51.06 36.39
4d. 54.26 55.88 46.35 55.90 52.73 58.50 57.16 42.34
4e. 50.72 52.23 46.35 52.49 49.30 49.13 53.67 45.76
5a. 53.35 52.23 58.37 49.98 43.37 49.13 54.57 46.66
5b. 63.05 52.23 55.82 52.49 45.90 52.57 57.16 39.81
5c. 56.89 49.50 59.28 49.98 39.93 39.83 47.57 36.39
5d. 54.26 42.20 52.36 43.16 43.37 46.63 51.06 39.81
5e 65.68 42.20 64.38 46.57 43.37 46.63 51.06 46.66
The multiplication of the factors’ weights by the improvements’ expected performance
reduced the improvements’ expected performance range. Thus, the fuzzy numbers obtained from
the multiplication process were defuzzified and normalized as shown in Table 5-61. Those
values were used as inputs for the FIS system.
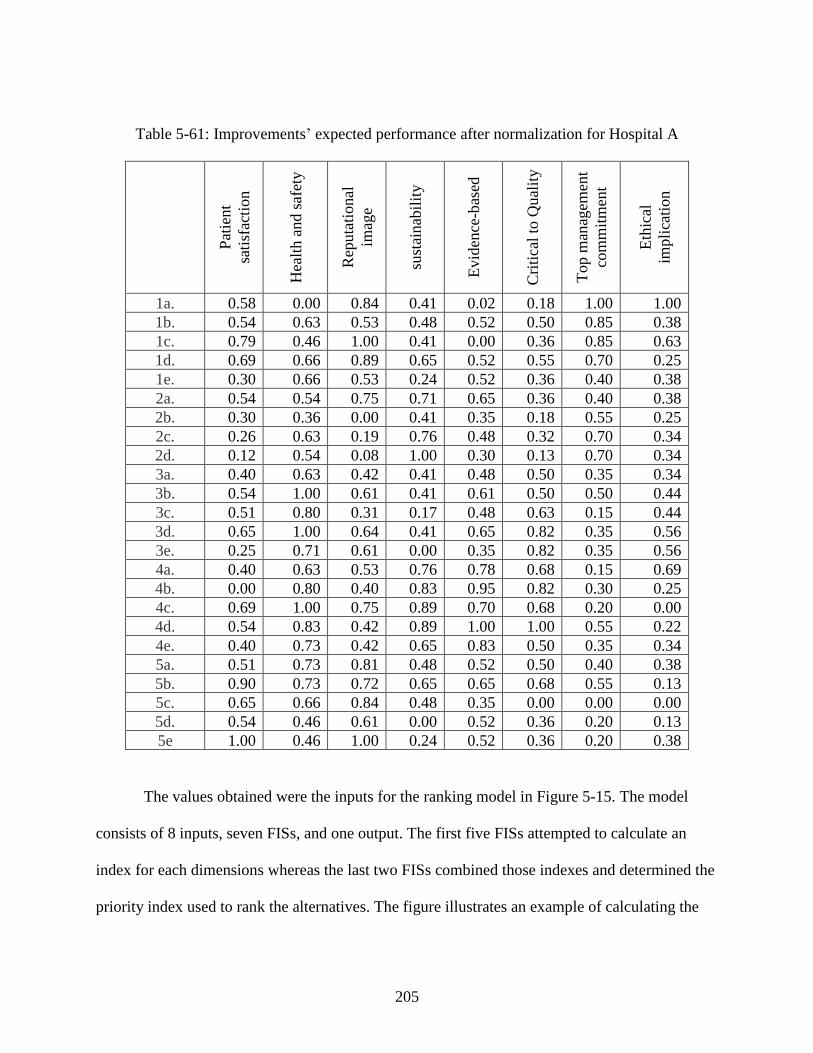
205
Table 5-61: Improvements’ expected performance after normalization for Hospital A
Pat
ient
sati
sfac
tion
Hea
lth a
nd s
afet
y
Rep
uta
tional
imag
e
sust
ainab
ilit
y
Evid
ence
-bas
ed
Cri
tica
l to
Qual
ity
Top m
anag
emen
t
com
mit
men
t
Eth
ical
impli
cati
on
1a. 0.58 0.00 0.84 0.41 0.02 0.18 1.00 1.00
1b. 0.54 0.63 0.53 0.48 0.52 0.50 0.85 0.38
1c. 0.79 0.46 1.00 0.41 0.00 0.36 0.85 0.63
1d. 0.69 0.66 0.89 0.65 0.52 0.55 0.70 0.25
1e. 0.30 0.66 0.53 0.24 0.52 0.36 0.40 0.38
2a. 0.54 0.54 0.75 0.71 0.65 0.36 0.40 0.38
2b. 0.30 0.36 0.00 0.41 0.35 0.18 0.55 0.25
2c. 0.26 0.63 0.19 0.76 0.48 0.32 0.70 0.34
2d. 0.12 0.54 0.08 1.00 0.30 0.13 0.70 0.34
3a. 0.40 0.63 0.42 0.41 0.48 0.50 0.35 0.34
3b. 0.54 1.00 0.61 0.41 0.61 0.50 0.50 0.44
3c. 0.51 0.80 0.31 0.17 0.48 0.63 0.15 0.44
3d. 0.65 1.00 0.64 0.41 0.65 0.82 0.35 0.56
3e. 0.25 0.71 0.61 0.00 0.35 0.82 0.35 0.56
4a. 0.40 0.63 0.53 0.76 0.78 0.68 0.15 0.69
4b. 0.00 0.80 0.40 0.83 0.95 0.82 0.30 0.25
4c. 0.69 1.00 0.75 0.89 0.70 0.68 0.20 0.00
4d. 0.54 0.83 0.42 0.89 1.00 1.00 0.55 0.22
4e. 0.40 0.73 0.42 0.65 0.83 0.50 0.35 0.34
5a. 0.51 0.73 0.81 0.48 0.52 0.50 0.40 0.38
5b. 0.90 0.73 0.72 0.65 0.65 0.68 0.55 0.13
5c. 0.65 0.66 0.84 0.48 0.35 0.00 0.00 0.00
5d. 0.54 0.46 0.61 0.00 0.52 0.36 0.20 0.13
5e 1.00 0.46 1.00 0.24 0.52 0.36 0.20 0.38
The values obtained were the inputs for the ranking model in Figure 5-15. The model
consists of 8 inputs, seven FISs, and one output. The first five FISs attempted to calculate an
index for each dimensions whereas the last two FISs combined those indexes and determined the
priority index used to rank the alternatives. The figure illustrates an example of calculating the
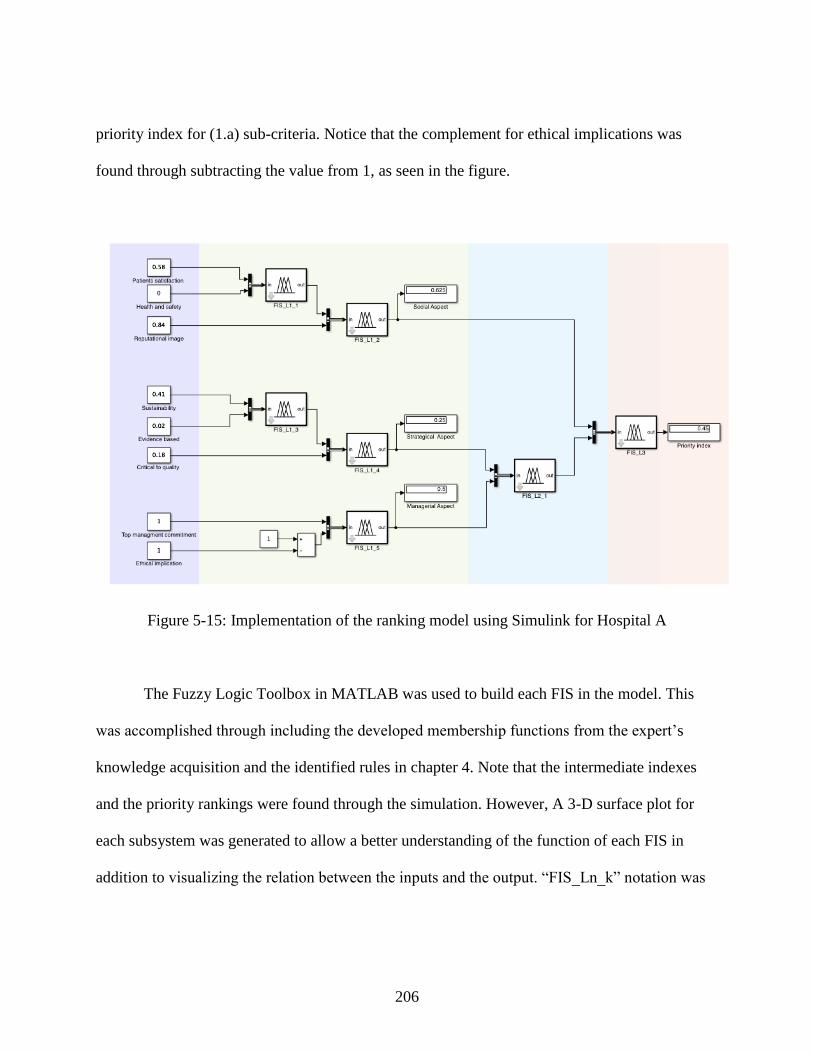
206
priority index for (1.a) sub-criteria. Notice that the complement for ethical implications was
found through subtracting the value from 1, as seen in the figure.
Figure 5-15: Implementation of the ranking model using Simulink for Hospital A
The Fuzzy Logic Toolbox in MATLAB was used to build each FIS in the model. This
was accomplished through including the developed membership functions from the expert’s
knowledge acquisition and the identified rules in chapter 4. Note that the intermediate indexes
and the priority rankings were found through the simulation. However, A 3-D surface plot for
each subsystem was generated to allow a better understanding of the function of each FIS in
addition to visualizing the relation between the inputs and the output. “FIS_Ln_k” notation was
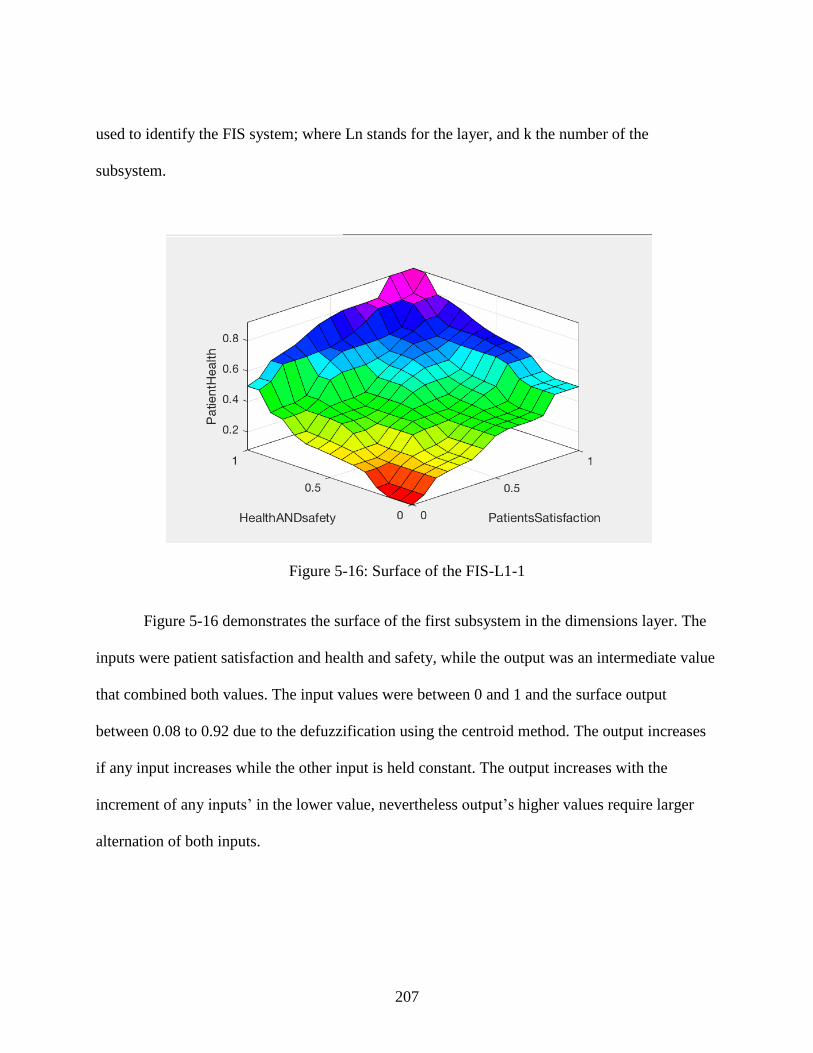
207
used to identify the FIS system; where Ln stands for the layer, and k the number of the
subsystem.
Figure 5-16: Surface of the FIS-L1-1
Figure 5-16 demonstrates the surface of the first subsystem in the dimensions layer. The
inputs were patient satisfaction and health and safety, while the output was an intermediate value
that combined both values. The input values were between 0 and 1 and the surface output
between 0.08 to 0.92 due to the defuzzification using the centroid method. The output increases
if any input increases while the other input is held constant. The output increases with the
increment of any inputs’ in the lower value, nevertheless output’s higher values require larger
alternation of both inputs.
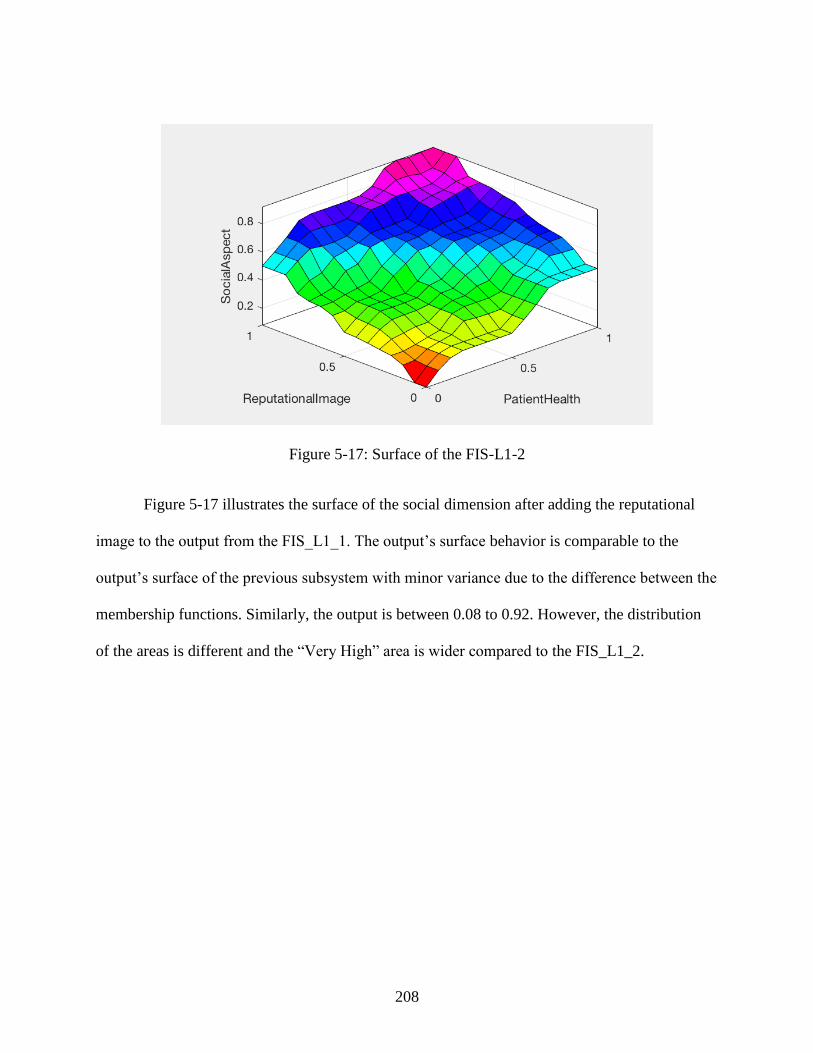
208
Figure 5-17: Surface of the FIS-L1-2
Figure 5-17 illustrates the surface of the social dimension after adding the reputational
image to the output from the FIS_L1_1. The output’s surface behavior is comparable to the
output’s surface of the previous subsystem with minor variance due to the difference between the
membership functions. Similarly, the output is between 0.08 to 0.92. However, the distribution
of the areas is different and the “Very High” area is wider compared to the FIS_L1_2.
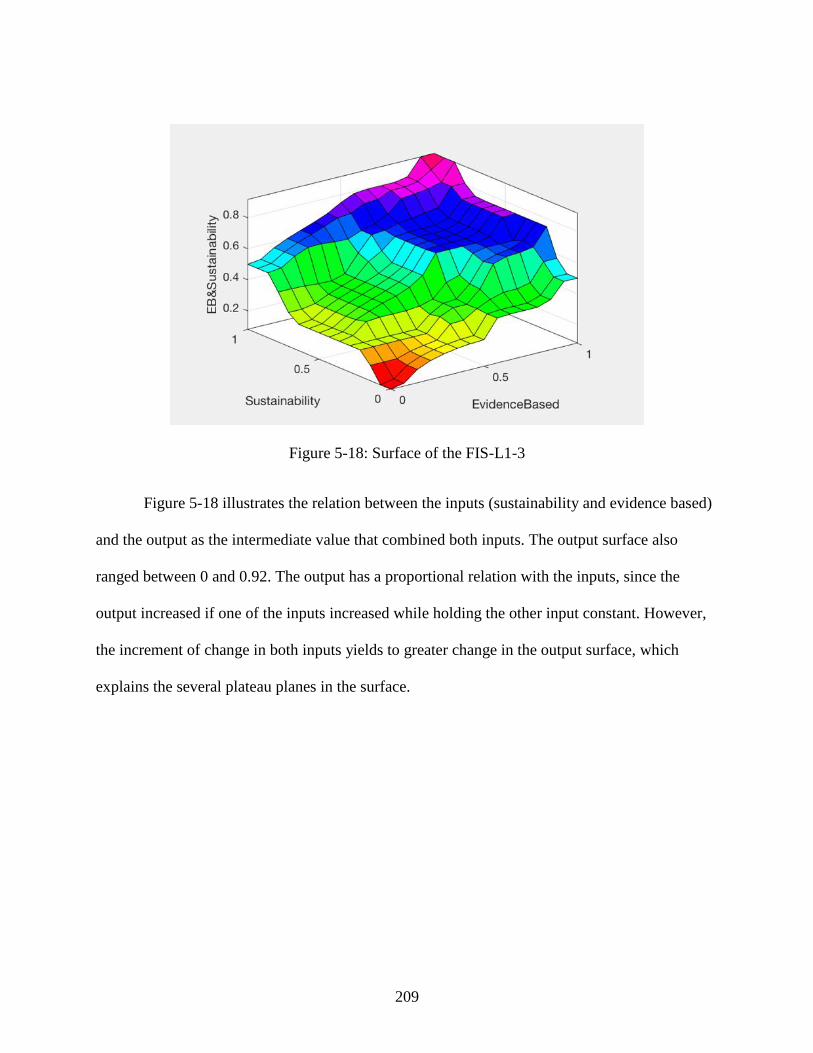
209
Figure 5-18: Surface of the FIS-L1-3
Figure 5-18 illustrates the relation between the inputs (sustainability and evidence based)
and the output as the intermediate value that combined both inputs. The output surface also
ranged between 0 and 0.92. The output has a proportional relation with the inputs, since the
output increased if one of the inputs increased while holding the other input constant. However,
the increment of change in both inputs yields to greater change in the output surface, which
explains the several plateau planes in the surface.
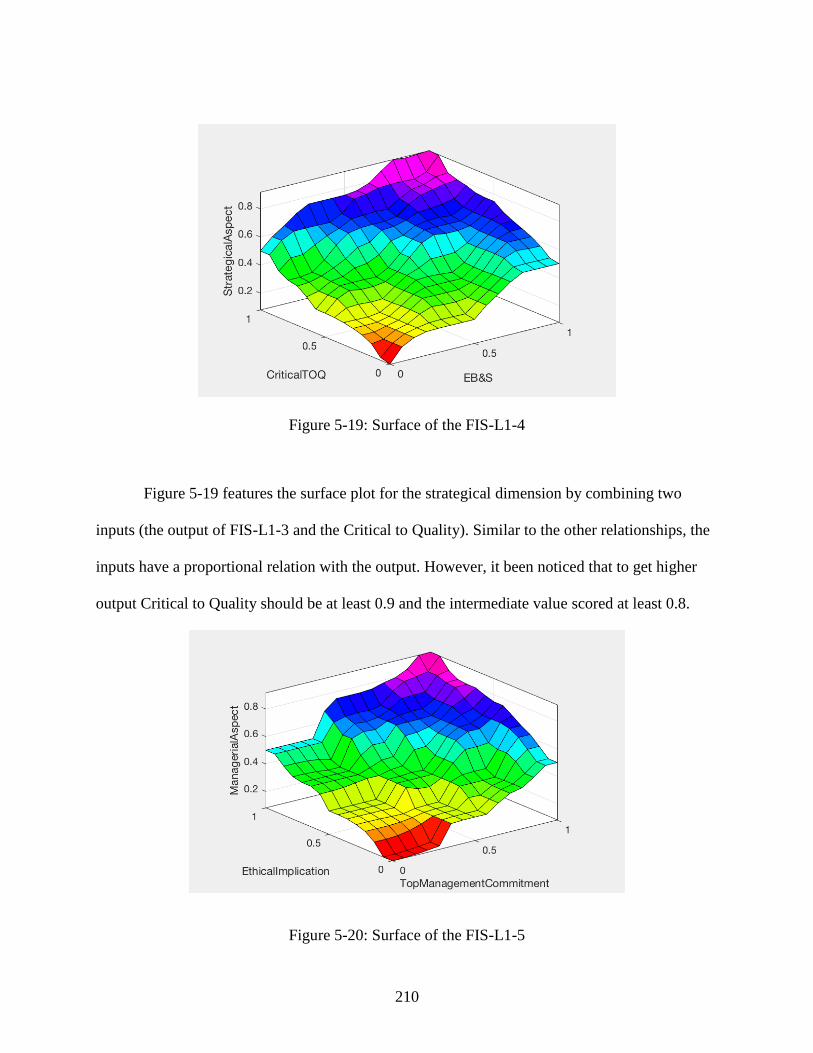
210
Figure 5-19: Surface of the FIS-L1-4
Figure 5-19 features the surface plot for the strategical dimension by combining two
inputs (the output of FIS-L1-3 and the Critical to Quality). Similar to the other relationships, the
inputs have a proportional relation with the output. However, it been noticed that to get higher
output Critical to Quality should be at least 0.9 and the intermediate value scored at least 0.8.
Figure 5-20: Surface of the FIS-L1-5
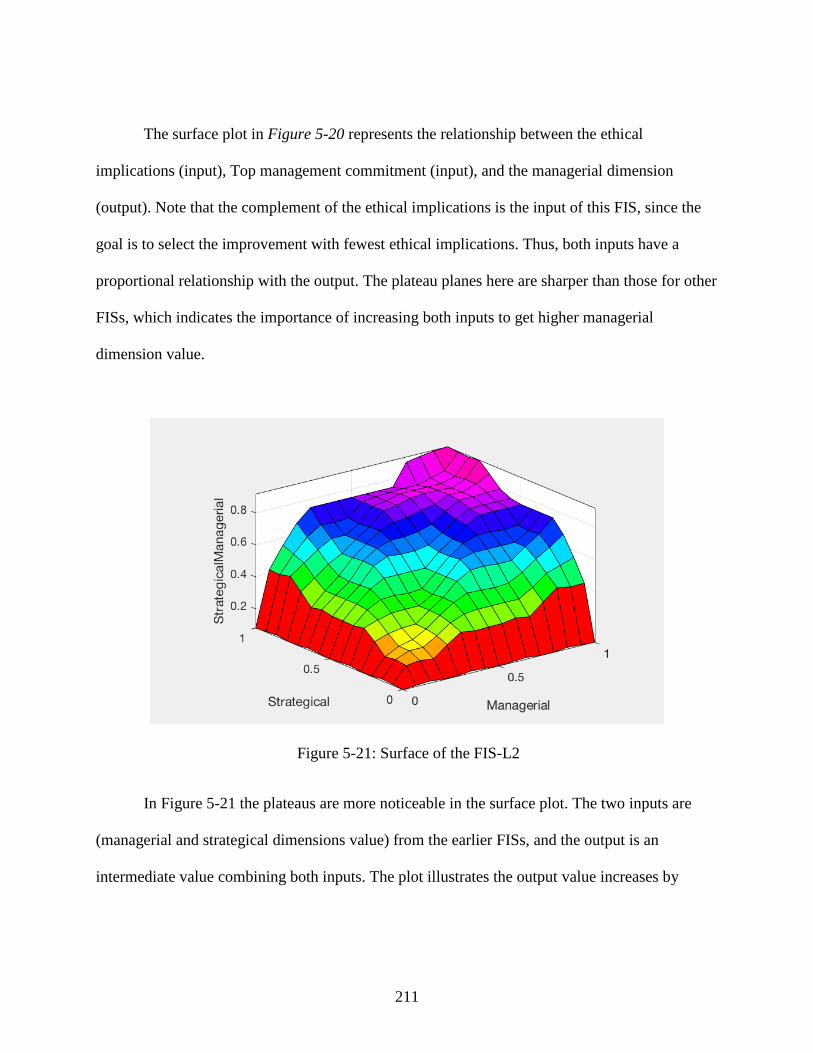
211
The surface plot in Figure 5-20 represents the relationship between the ethical
implications (input), Top management commitment (input), and the managerial dimension
(output). Note that the complement of the ethical implications is the input of this FIS, since the
goal is to select the improvement with fewest ethical implications. Thus, both inputs have a
proportional relationship with the output. The plateau planes here are sharper than those for other
FISs, which indicates the importance of increasing both inputs to get higher managerial
dimension value.
Figure 5-21: Surface of the FIS-L2
In Figure 5-21 the plateaus are more noticeable in the surface plot. The two inputs are
(managerial and strategical dimensions value) from the earlier FISs, and the output is an
intermediate value combining both inputs. The plot illustrates the output value increases by
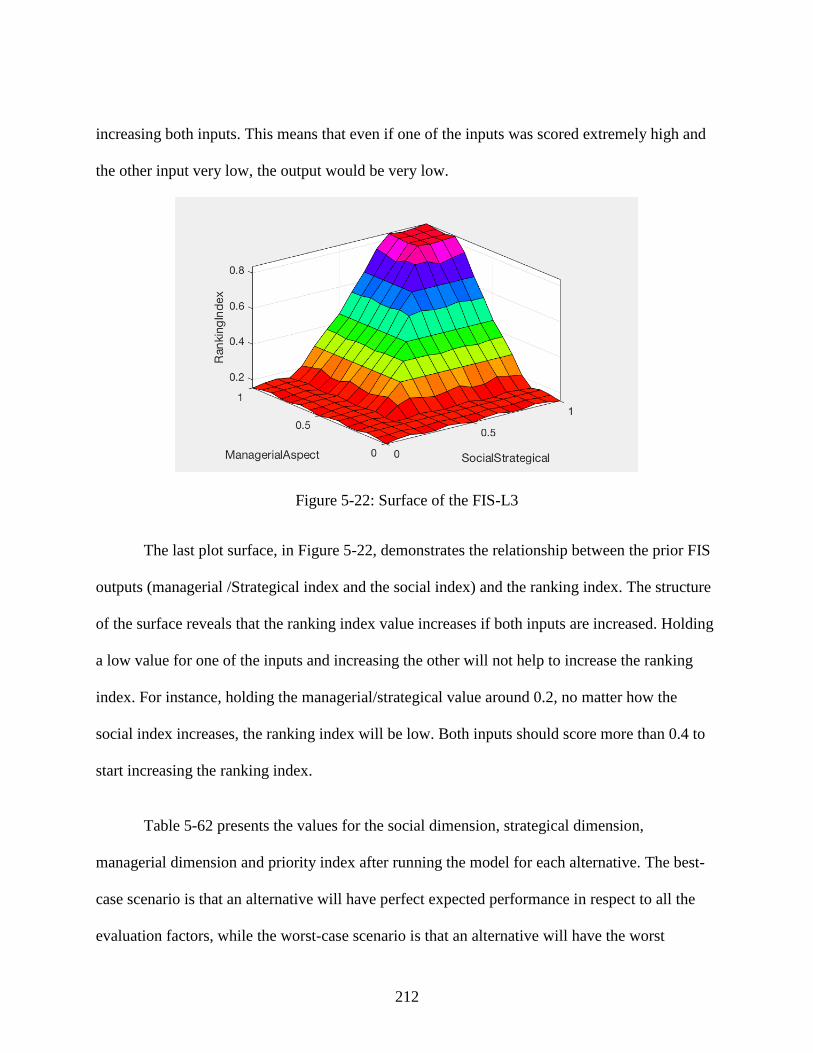
212
increasing both inputs. This means that even if one of the inputs was scored extremely high and
the other input very low, the output would be very low.
Figure 5-22: Surface of the FIS-L3
The last plot surface, in Figure 5-22, demonstrates the relationship between the prior FIS
outputs (managerial /Strategical index and the social index) and the ranking index. The structure
of the surface reveals that the ranking index value increases if both inputs are increased. Holding
a low value for one of the inputs and increasing the other will not help to increase the ranking
index. For instance, holding the managerial/strategical value around 0.2, no matter how the
social index increases, the ranking index will be low. Both inputs should score more than 0.4 to
start increasing the ranking index.
Table 5-62 presents the values for the social dimension, strategical dimension,
managerial dimension and priority index after running the model for each alternative. The best-
case scenario is that an alternative will have perfect expected performance in respect to all the
evaluation factors, while the worst-case scenario is that an alternative will have the worst
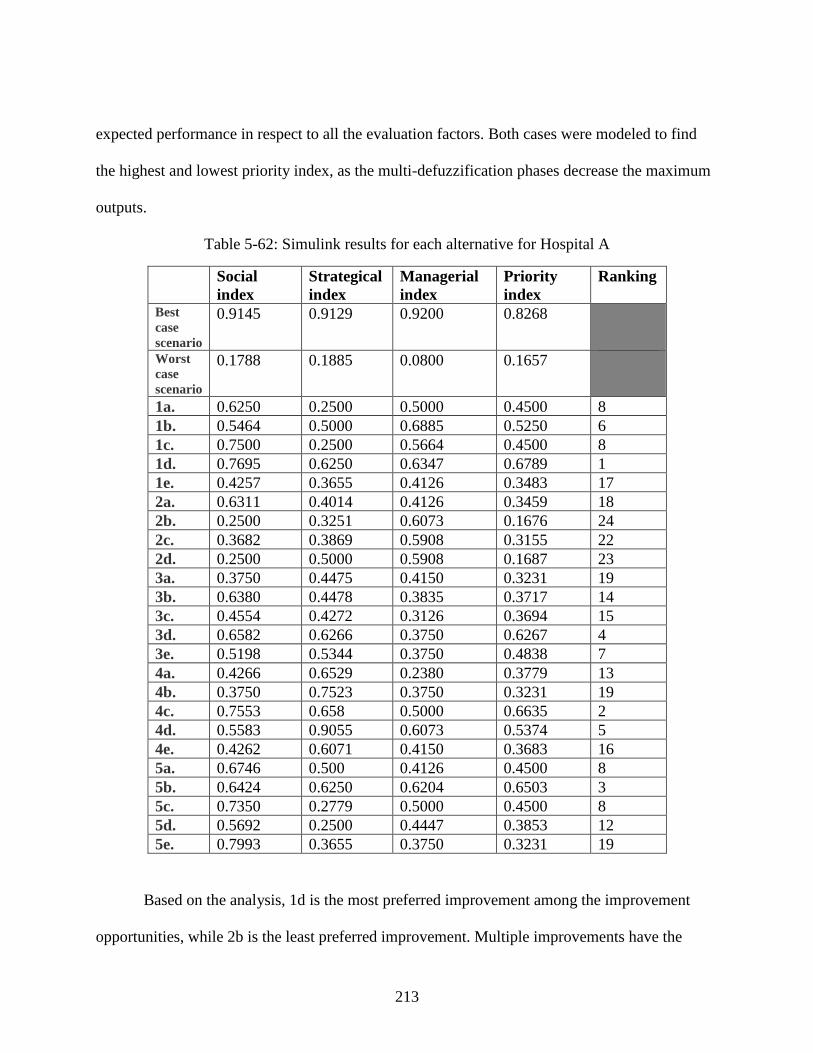
213
expected performance in respect to all the evaluation factors. Both cases were modeled to find
the highest and lowest priority index, as the multi-defuzzification phases decrease the maximum
outputs.
Table 5-62: Simulink results for each alternative for Hospital A
Social
index
Strategical
index
Managerial
index
Priority
index
Ranking
Best
case
scenario
0.9145 0.9129 0.9200 0.8268
Worst
case
scenario
0.1788 0.1885 0.0800 0.1657
1a. 0.6250 0.2500 0.5000 0.4500 8
1b. 0.5464 0.5000 0.6885 0.5250 6
1c. 0.7500 0.2500 0.5664 0.4500 8
1d. 0.7695 0.6250 0.6347 0.6789 1
1e. 0.4257 0.3655 0.4126 0.3483 17
2a. 0.6311 0.4014 0.4126 0.3459 18
2b. 0.2500 0.3251 0.6073 0.1676 24
2c. 0.3682 0.3869 0.5908 0.3155 22
2d. 0.2500 0.5000 0.5908 0.1687 23
3a. 0.3750 0.4475 0.4150 0.3231 19
3b. 0.6380 0.4478 0.3835 0.3717 14
3c. 0.4554 0.4272 0.3126 0.3694 15
3d. 0.6582 0.6266 0.3750 0.6267 4
3e. 0.5198 0.5344 0.3750 0.4838 7
4a. 0.4266 0.6529 0.2380 0.3779 13
4b. 0.3750 0.7523 0.3750 0.3231 19
4c. 0.7553 0.658 0.5000 0.6635 2
4d. 0.5583 0.9055 0.6073 0.5374 5
4e. 0.4262 0.6071 0.4150 0.3683 16
5a. 0.6746 0.500 0.4126 0.4500 8
5b. 0.6424 0.6250 0.6204 0.6503 3
5c. 0.7350 0.2779 0.5000 0.4500 8
5d. 0.5692 0.2500 0.4447 0.3853 12
5e. 0.7993 0.3655 0.3750 0.3231 19
Based on the analysis, 1d is the most preferred improvement among the improvement
opportunities, while 2b is the least preferred improvement. Multiple improvements have the
214
same ranking index; the organization can choose from among those opportunities by linking it to
the organization’s strategy and objectives. For example, 1a, 1c, 5a, and 5c all have a 0.4500
priority index. Thus, to choose one over the others the organization can evaluate the strategical,
managerial, and social indices; if the organization’s goal is to improve the organization’s social
impact then 4c is the best alternatives between the four candidates.
5.6.2 Results for Hospital B
The rating of alternatives process was repeated again in Hospital B with the participation
of three EFQM certified assessors. Table 5-63, Table 5-64, Table 5-65, Table 5-66, Table 5-67,
and Table 5-68. present the linguistic variables for the expected performance for each alternative,
the conversion of those variable into fuzzy numbers, the average fuzzy number for the
evaluation, and the final fuzzy set when factor importance weight was considered, respectively.
In this survey only three EFQM certified assessors participated, regardless of the reminder
messages sent to the internal EFQM certified assessors within the hospital. Thus, in total only
432 ratings were collected, which aggregated to 144 average fuzzy numbers using the
membership function in Figure 4-10 and the fuzzy set in Table 4-5. The defuzzified numbers in
Figure 5-23 were normalized (Table 5-70) to make the inputs adequate to create rules and serve
as inputs to the model in Figure 5-23. The model consists of six inputs, six FISs, and one output.
Four out of the six FISs are in the dimensions layer, one in the intermediate layer, and one in the
integration layer. The sub-criterion (1.a) is used as an example in the figure, while the results for
the other alternatives are presented in Table 5-71.
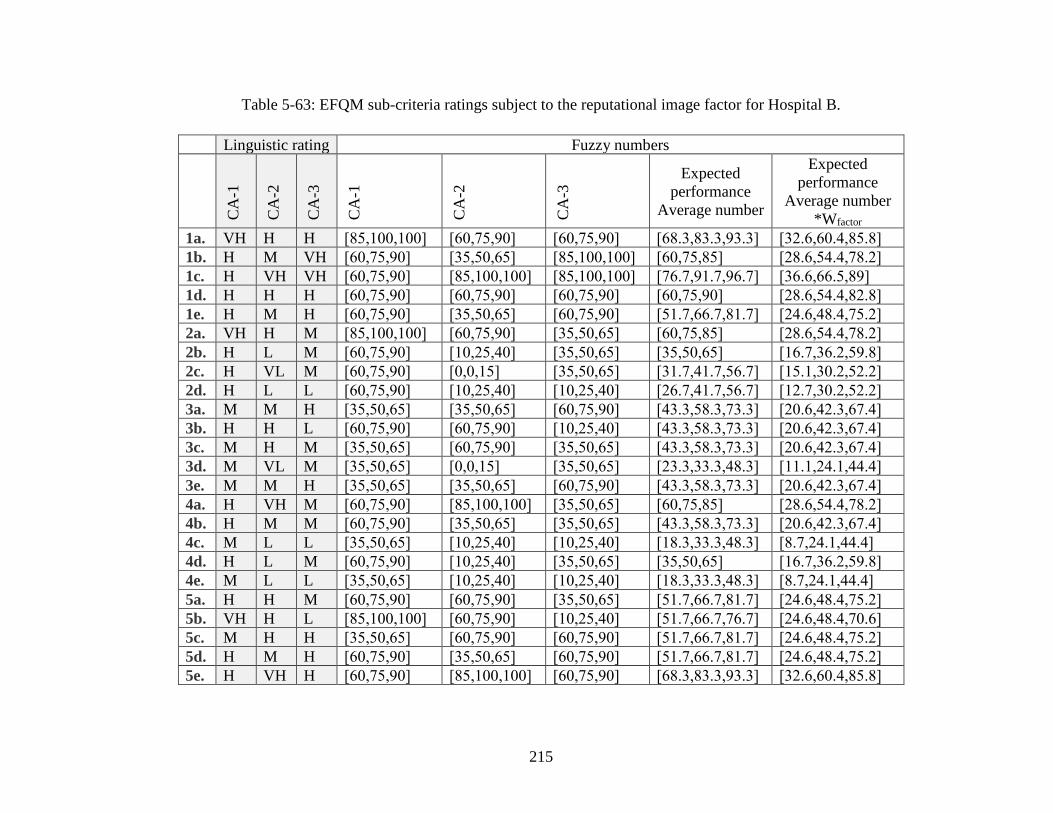
215
Table 5-63: EFQM sub-criteria ratings subject to the reputational image factor for Hospital B.
Linguistic rating Fuzzy numbers
CA
-1
CA
-2
CA
-3
CA
-1
CA
-2
CA
-3 Expected
performance
Average number
Expected
performance
Average number
*Wfactor
1a. VH H H [85,100,100] [60,75,90] [60,75,90] [68.3,83.3,93.3] [32.6,60.4,85.8]
1b. H M VH [60,75,90] [35,50,65] [85,100,100] [60,75,85] [28.6,54.4,78.2]
1c. H VH VH [60,75,90] [85,100,100] [85,100,100] [76.7,91.7,96.7] [36.6,66.5,89]
1d. H H H [60,75,90] [60,75,90] [60,75,90] [60,75,90] [28.6,54.4,82.8]
1e. H M H [60,75,90] [35,50,65] [60,75,90] [51.7,66.7,81.7] [24.6,48.4,75.2]
2a. VH H M [85,100,100] [60,75,90] [35,50,65] [60,75,85] [28.6,54.4,78.2]
2b. H L M [60,75,90] [10,25,40] [35,50,65] [35,50,65] [16.7,36.2,59.8]
2c. H VL M [60,75,90] [0,0,15] [35,50,65] [31.7,41.7,56.7] [15.1,30.2,52.2]
2d. H L L [60,75,90] [10,25,40] [10,25,40] [26.7,41.7,56.7] [12.7,30.2,52.2]
3a. M M H [35,50,65] [35,50,65] [60,75,90] [43.3,58.3,73.3] [20.6,42.3,67.4]
3b. H H L [60,75,90] [60,75,90] [10,25,40] [43.3,58.3,73.3] [20.6,42.3,67.4]
3c. M H M [35,50,65] [60,75,90] [35,50,65] [43.3,58.3,73.3] [20.6,42.3,67.4]
3d. M VL M [35,50,65] [0,0,15] [35,50,65] [23.3,33.3,48.3] [11.1,24.1,44.4]
3e. M M H [35,50,65] [35,50,65] [60,75,90] [43.3,58.3,73.3] [20.6,42.3,67.4]
4a. H VH M [60,75,90] [85,100,100] [35,50,65] [60,75,85] [28.6,54.4,78.2]
4b. H M M [60,75,90] [35,50,65] [35,50,65] [43.3,58.3,73.3] [20.6,42.3,67.4]
4c. M L L [35,50,65] [10,25,40] [10,25,40] [18.3,33.3,48.3] [8.7,24.1,44.4]
4d. H L M [60,75,90] [10,25,40] [35,50,65] [35,50,65] [16.7,36.2,59.8]
4e. M L L [35,50,65] [10,25,40] [10,25,40] [18.3,33.3,48.3] [8.7,24.1,44.4]
5a. H H M [60,75,90] [60,75,90] [35,50,65] [51.7,66.7,81.7] [24.6,48.4,75.2]
5b. VH H L [85,100,100] [60,75,90] [10,25,40] [51.7,66.7,76.7] [24.6,48.4,70.6]
5c. M H H [35,50,65] [60,75,90] [60,75,90] [51.7,66.7,81.7] [24.6,48.4,75.2]
5d. H M H [60,75,90] [35,50,65] [60,75,90] [51.7,66.7,81.7] [24.6,48.4,75.2]
5e. H VH H [60,75,90] [85,100,100] [60,75,90] [68.3,83.3,93.3] [32.6,60.4,85.8]
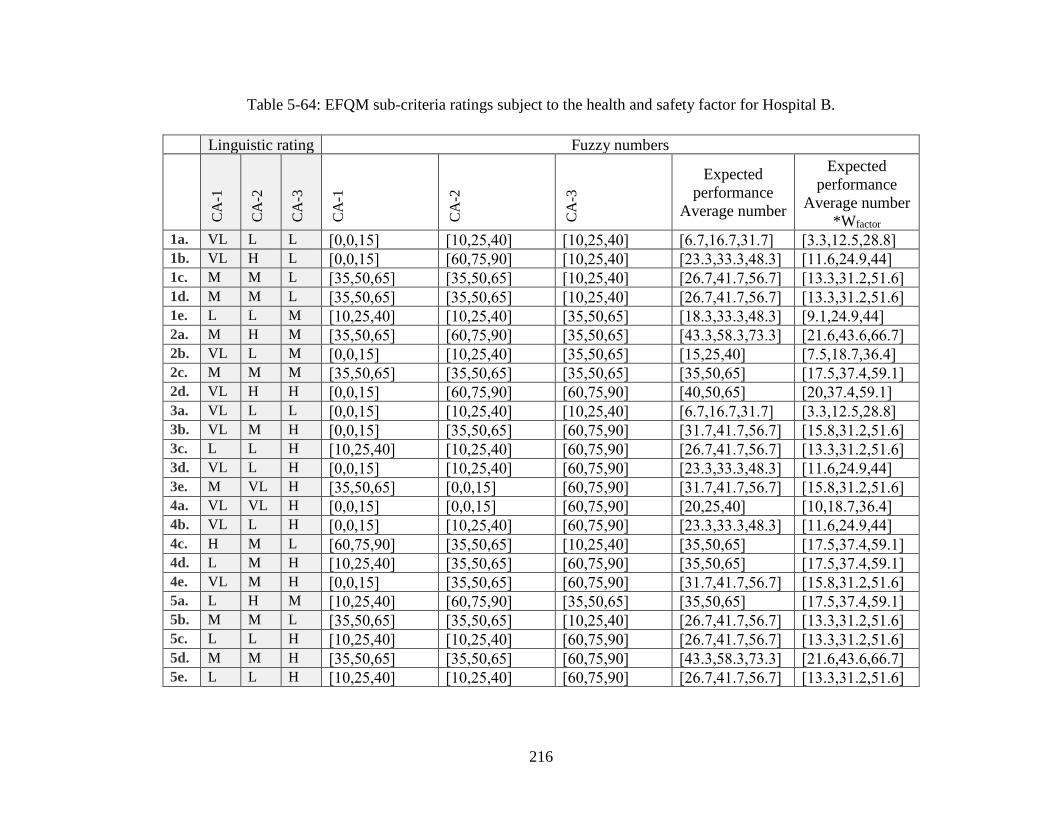
216
Table 5-64: EFQM sub-criteria ratings subject to the health and safety factor for Hospital B.
Linguistic rating Fuzzy numbers
CA
-1
CA
-2
CA
-3
CA
-1
CA
-2
CA
-3
Expected
performance
Average number
Expected
performance
Average number
*Wfactor
1a. VL L L [0,0,15] [10,25,40] [10,25,40] [6.7,16.7,31.7] [3.3,12.5,28.8] 1b. VL H L [0,0,15] [60,75,90] [10,25,40] [23.3,33.3,48.3] [11.6,24.9,44] 1c. M M L [35,50,65] [35,50,65] [10,25,40] [26.7,41.7,56.7] [13.3,31.2,51.6] 1d. M M L [35,50,65] [35,50,65] [10,25,40] [26.7,41.7,56.7] [13.3,31.2,51.6] 1e. L L M [10,25,40] [10,25,40] [35,50,65] [18.3,33.3,48.3] [9.1,24.9,44] 2a. M H M [35,50,65] [60,75,90] [35,50,65] [43.3,58.3,73.3] [21.6,43.6,66.7] 2b. VL L M [0,0,15] [10,25,40] [35,50,65] [15,25,40] [7.5,18.7,36.4] 2c. M M M [35,50,65] [35,50,65] [35,50,65] [35,50,65] [17.5,37.4,59.1] 2d. VL H H [0,0,15] [60,75,90] [60,75,90] [40,50,65] [20,37.4,59.1] 3a. VL L L [0,0,15] [10,25,40] [10,25,40] [6.7,16.7,31.7] [3.3,12.5,28.8] 3b. VL M H [0,0,15] [35,50,65] [60,75,90] [31.7,41.7,56.7] [15.8,31.2,51.6] 3c. L L H [10,25,40] [10,25,40] [60,75,90] [26.7,41.7,56.7] [13.3,31.2,51.6] 3d. VL L H [0,0,15] [10,25,40] [60,75,90] [23.3,33.3,48.3] [11.6,24.9,44] 3e. M VL H [35,50,65] [0,0,15] [60,75,90] [31.7,41.7,56.7] [15.8,31.2,51.6] 4a. VL VL H [0,0,15] [0,0,15] [60,75,90] [20,25,40] [10,18.7,36.4] 4b. VL L H [0,0,15] [10,25,40] [60,75,90] [23.3,33.3,48.3] [11.6,24.9,44] 4c. H M L [60,75,90] [35,50,65] [10,25,40] [35,50,65] [17.5,37.4,59.1] 4d. L M H [10,25,40] [35,50,65] [60,75,90] [35,50,65] [17.5,37.4,59.1] 4e. VL M H [0,0,15] [35,50,65] [60,75,90] [31.7,41.7,56.7] [15.8,31.2,51.6] 5a. L H M [10,25,40] [60,75,90] [35,50,65] [35,50,65] [17.5,37.4,59.1] 5b. M M L [35,50,65] [35,50,65] [10,25,40] [26.7,41.7,56.7] [13.3,31.2,51.6] 5c. L L H [10,25,40] [10,25,40] [60,75,90] [26.7,41.7,56.7] [13.3,31.2,51.6] 5d. M M H [35,50,65] [35,50,65] [60,75,90] [43.3,58.3,73.3] [21.6,43.6,66.7] 5e. L L H [10,25,40] [10,25,40] [60,75,90] [26.7,41.7,56.7] [13.3,31.2,51.6]
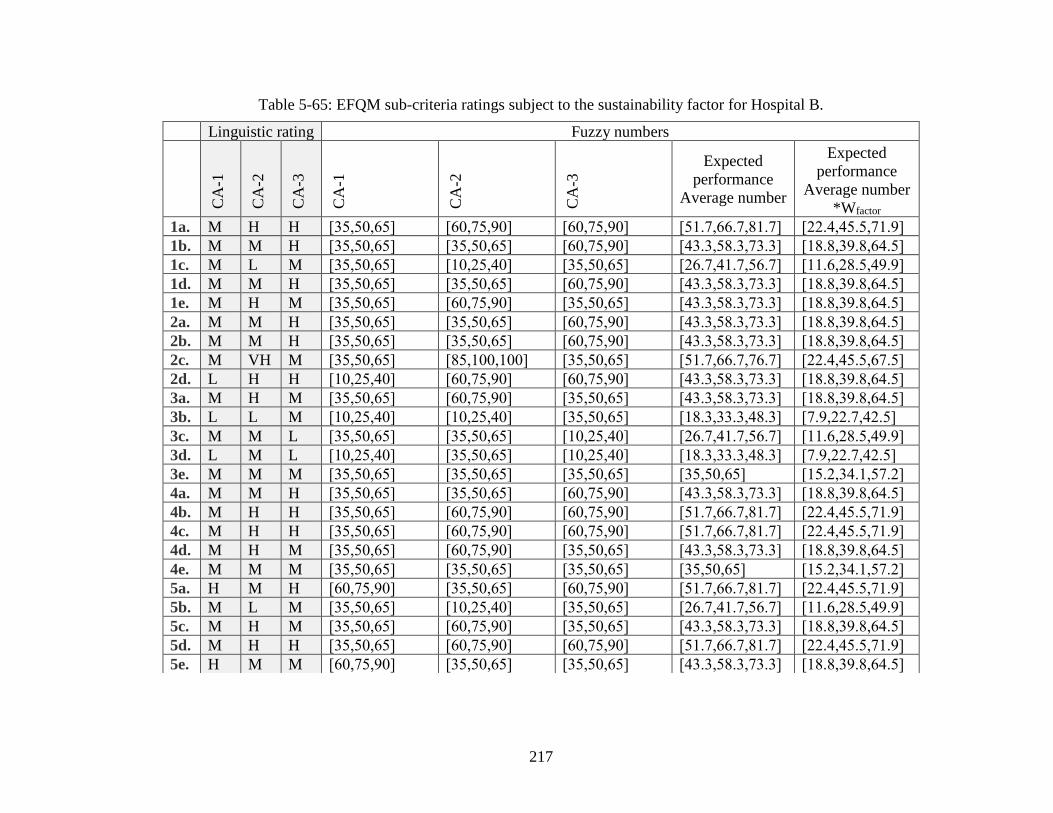
217
Table 5-65: EFQM sub-criteria ratings subject to the sustainability factor for Hospital B.
Linguistic rating Fuzzy numbers
CA
-1
CA
-2
CA
-3
CA
-1
CA
-2
CA
-3
Expected
performance
Average number
Expected
performance
Average number
*Wfactor
1a. M H H [35,50,65] [60,75,90] [60,75,90] [51.7,66.7,81.7] [22.4,45.5,71.9]
1b. M M H [35,50,65] [35,50,65] [60,75,90] [43.3,58.3,73.3] [18.8,39.8,64.5]
1c. M L M [35,50,65] [10,25,40] [35,50,65] [26.7,41.7,56.7] [11.6,28.5,49.9]
1d. M M H [35,50,65] [35,50,65] [60,75,90] [43.3,58.3,73.3] [18.8,39.8,64.5]
1e. M H M [35,50,65] [60,75,90] [35,50,65] [43.3,58.3,73.3] [18.8,39.8,64.5]
2a. M M H [35,50,65] [35,50,65] [60,75,90] [43.3,58.3,73.3] [18.8,39.8,64.5]
2b. M M H [35,50,65] [35,50,65] [60,75,90] [43.3,58.3,73.3] [18.8,39.8,64.5]
2c. M VH M [35,50,65] [85,100,100] [35,50,65] [51.7,66.7,76.7] [22.4,45.5,67.5]
2d. L H H [10,25,40] [60,75,90] [60,75,90] [43.3,58.3,73.3] [18.8,39.8,64.5]
3a. M H M [35,50,65] [60,75,90] [35,50,65] [43.3,58.3,73.3] [18.8,39.8,64.5]
3b. L L M [10,25,40] [10,25,40] [35,50,65] [18.3,33.3,48.3] [7.9,22.7,42.5]
3c. M M L [35,50,65] [35,50,65] [10,25,40] [26.7,41.7,56.7] [11.6,28.5,49.9]
3d. L M L [10,25,40] [35,50,65] [10,25,40] [18.3,33.3,48.3] [7.9,22.7,42.5]
3e. M M M [35,50,65] [35,50,65] [35,50,65] [35,50,65] [15.2,34.1,57.2]
4a. M M H [35,50,65] [35,50,65] [60,75,90] [43.3,58.3,73.3] [18.8,39.8,64.5]
4b. M H H [35,50,65] [60,75,90] [60,75,90] [51.7,66.7,81.7] [22.4,45.5,71.9]
4c. M H H [35,50,65] [60,75,90] [60,75,90] [51.7,66.7,81.7] [22.4,45.5,71.9]
4d. M H M [35,50,65] [60,75,90] [35,50,65] [43.3,58.3,73.3] [18.8,39.8,64.5]
4e. M M M [35,50,65] [35,50,65] [35,50,65] [35,50,65] [15.2,34.1,57.2]
5a. H M H [60,75,90] [35,50,65] [60,75,90] [51.7,66.7,81.7] [22.4,45.5,71.9]
5b. M L M [35,50,65] [10,25,40] [35,50,65] [26.7,41.7,56.7] [11.6,28.5,49.9]
5c. M H M [35,50,65] [60,75,90] [35,50,65] [43.3,58.3,73.3] [18.8,39.8,64.5]
5d. M H H [35,50,65] [60,75,90] [60,75,90] [51.7,66.7,81.7] [22.4,45.5,71.9]
5e. H M M [60,75,90] [35,50,65] [35,50,65] [43.3,58.3,73.3] [18.8,39.8,64.5]
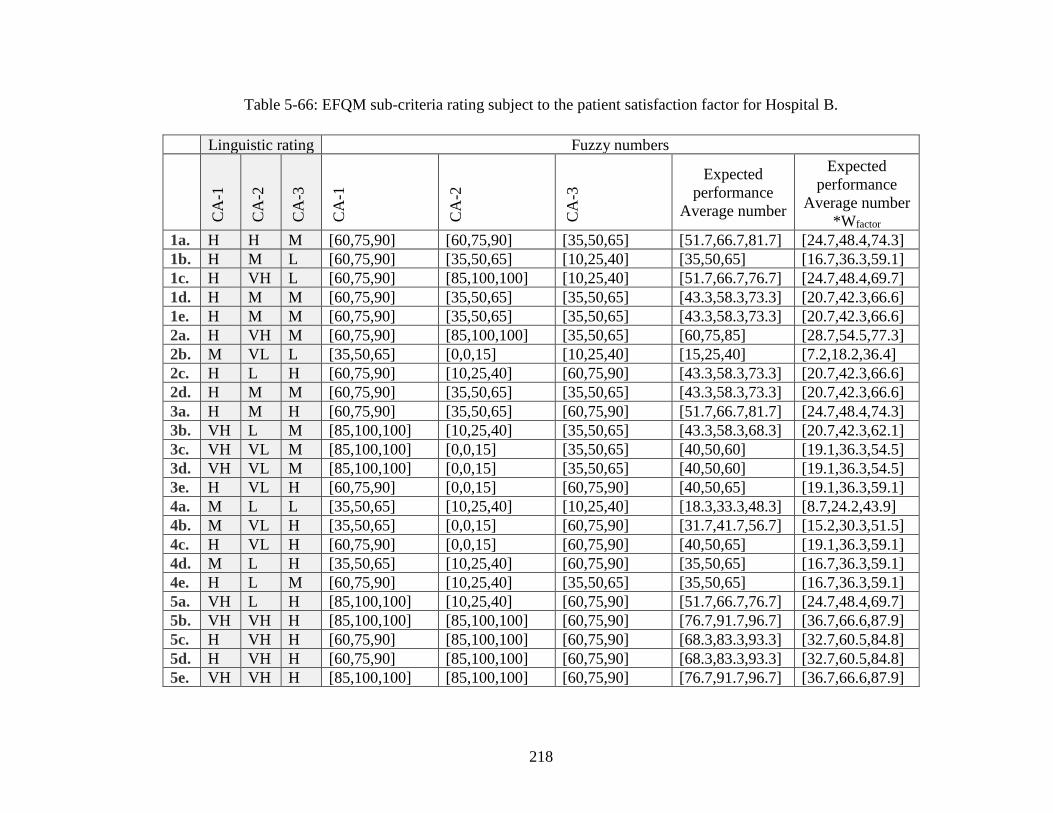
218
Table 5-66: EFQM sub-criteria rating subject to the patient satisfaction factor for Hospital B.
Linguistic rating Fuzzy numbers
CA
-1
CA
-2
CA
-3
CA
-1
CA
-2
CA
-3
Expected
performance
Average number
Expected
performance
Average number
*Wfactor
1a. H H M [60,75,90] [60,75,90] [35,50,65] [51.7,66.7,81.7] [24.7,48.4,74.3]
1b. H M L [60,75,90] [35,50,65] [10,25,40] [35,50,65] [16.7,36.3,59.1]
1c. H VH L [60,75,90] [85,100,100] [10,25,40] [51.7,66.7,76.7] [24.7,48.4,69.7]
1d. H M M [60,75,90] [35,50,65] [35,50,65] [43.3,58.3,73.3] [20.7,42.3,66.6]
1e. H M M [60,75,90] [35,50,65] [35,50,65] [43.3,58.3,73.3] [20.7,42.3,66.6]
2a. H VH M [60,75,90] [85,100,100] [35,50,65] [60,75,85] [28.7,54.5,77.3]
2b. M VL L [35,50,65] [0,0,15] [10,25,40] [15,25,40] [7.2,18.2,36.4]
2c. H L H [60,75,90] [10,25,40] [60,75,90] [43.3,58.3,73.3] [20.7,42.3,66.6]
2d. H M M [60,75,90] [35,50,65] [35,50,65] [43.3,58.3,73.3] [20.7,42.3,66.6]
3a. H M H [60,75,90] [35,50,65] [60,75,90] [51.7,66.7,81.7] [24.7,48.4,74.3]
3b. VH L M [85,100,100] [10,25,40] [35,50,65] [43.3,58.3,68.3] [20.7,42.3,62.1]
3c. VH VL M [85,100,100] [0,0,15] [35,50,65] [40,50,60] [19.1,36.3,54.5]
3d. VH VL M [85,100,100] [0,0,15] [35,50,65] [40,50,60] [19.1,36.3,54.5]
3e. H VL H [60,75,90] [0,0,15] [60,75,90] [40,50,65] [19.1,36.3,59.1]
4a. M L L [35,50,65] [10,25,40] [10,25,40] [18.3,33.3,48.3] [8.7,24.2,43.9]
4b. M VL H [35,50,65] [0,0,15] [60,75,90] [31.7,41.7,56.7] [15.2,30.3,51.5]
4c. H VL H [60,75,90] [0,0,15] [60,75,90] [40,50,65] [19.1,36.3,59.1]
4d. M L H [35,50,65] [10,25,40] [60,75,90] [35,50,65] [16.7,36.3,59.1]
4e. H L M [60,75,90] [10,25,40] [35,50,65] [35,50,65] [16.7,36.3,59.1]
5a. VH L H [85,100,100] [10,25,40] [60,75,90] [51.7,66.7,76.7] [24.7,48.4,69.7]
5b. VH VH H [85,100,100] [85,100,100] [60,75,90] [76.7,91.7,96.7] [36.7,66.6,87.9]
5c. H VH H [60,75,90] [85,100,100] [60,75,90] [68.3,83.3,93.3] [32.7,60.5,84.8]
5d. H VH H [60,75,90] [85,100,100] [60,75,90] [68.3,83.3,93.3] [32.7,60.5,84.8]
5e. VH VH H [85,100,100] [85,100,100] [60,75,90] [76.7,91.7,96.7] [36.7,66.6,87.9]
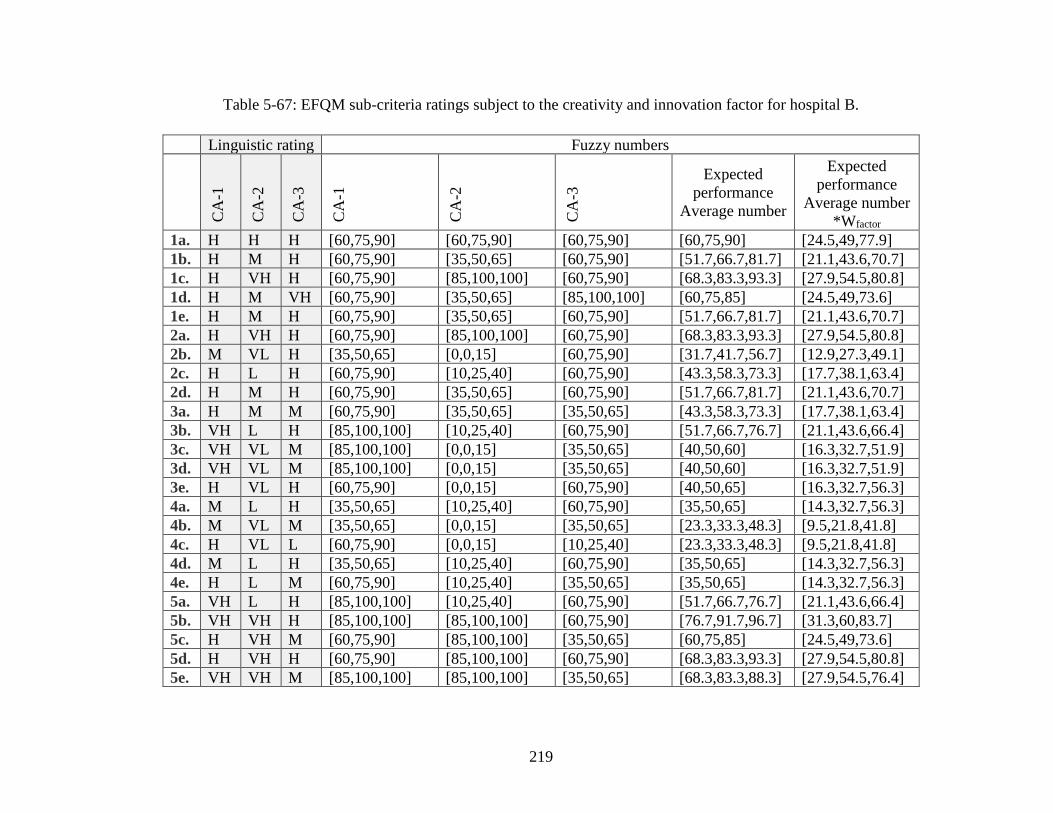
219
Table 5-67: EFQM sub-criteria ratings subject to the creativity and innovation factor for hospital B.
Linguistic rating Fuzzy numbers
CA
-1
CA
-2
CA
-3
CA
-1
CA
-2
CA
-3
Expected
performance
Average number
Expected
performance
Average number
*Wfactor
1a. H H H [60,75,90] [60,75,90] [60,75,90] [60,75,90] [24.5,49,77.9]
1b. H M H [60,75,90] [35,50,65] [60,75,90] [51.7,66.7,81.7] [21.1,43.6,70.7]
1c. H VH H [60,75,90] [85,100,100] [60,75,90] [68.3,83.3,93.3] [27.9,54.5,80.8]
1d. H M VH [60,75,90] [35,50,65] [85,100,100] [60,75,85] [24.5,49,73.6]
1e. H M H [60,75,90] [35,50,65] [60,75,90] [51.7,66.7,81.7] [21.1,43.6,70.7]
2a. H VH H [60,75,90] [85,100,100] [60,75,90] [68.3,83.3,93.3] [27.9,54.5,80.8]
2b. M VL H [35,50,65] [0,0,15] [60,75,90] [31.7,41.7,56.7] [12.9,27.3,49.1]
2c. H L H [60,75,90] [10,25,40] [60,75,90] [43.3,58.3,73.3] [17.7,38.1,63.4]
2d. H M H [60,75,90] [35,50,65] [60,75,90] [51.7,66.7,81.7] [21.1,43.6,70.7]
3a. H M M [60,75,90] [35,50,65] [35,50,65] [43.3,58.3,73.3] [17.7,38.1,63.4]
3b. VH L H [85,100,100] [10,25,40] [60,75,90] [51.7,66.7,76.7] [21.1,43.6,66.4]
3c. VH VL M [85,100,100] [0,0,15] [35,50,65] [40,50,60] [16.3,32.7,51.9]
3d. VH VL M [85,100,100] [0,0,15] [35,50,65] [40,50,60] [16.3,32.7,51.9]
3e. H VL H [60,75,90] [0,0,15] [60,75,90] [40,50,65] [16.3,32.7,56.3]
4a. M L H [35,50,65] [10,25,40] [60,75,90] [35,50,65] [14.3,32.7,56.3]
4b. M VL M [35,50,65] [0,0,15] [35,50,65] [23.3,33.3,48.3] [9.5,21.8,41.8]
4c. H VL L [60,75,90] [0,0,15] [10,25,40] [23.3,33.3,48.3] [9.5,21.8,41.8]
4d. M L H [35,50,65] [10,25,40] [60,75,90] [35,50,65] [14.3,32.7,56.3]
4e. H L M [60,75,90] [10,25,40] [35,50,65] [35,50,65] [14.3,32.7,56.3]
5a. VH L H [85,100,100] [10,25,40] [60,75,90] [51.7,66.7,76.7] [21.1,43.6,66.4]
5b. VH VH H [85,100,100] [85,100,100] [60,75,90] [76.7,91.7,96.7] [31.3,60,83.7]
5c. H VH M [60,75,90] [85,100,100] [35,50,65] [60,75,85] [24.5,49,73.6]
5d. H VH H [60,75,90] [85,100,100] [60,75,90] [68.3,83.3,93.3] [27.9,54.5,80.8]
5e. VH VH M [85,100,100] [85,100,100] [35,50,65] [68.3,83.3,88.3] [27.9,54.5,76.4]
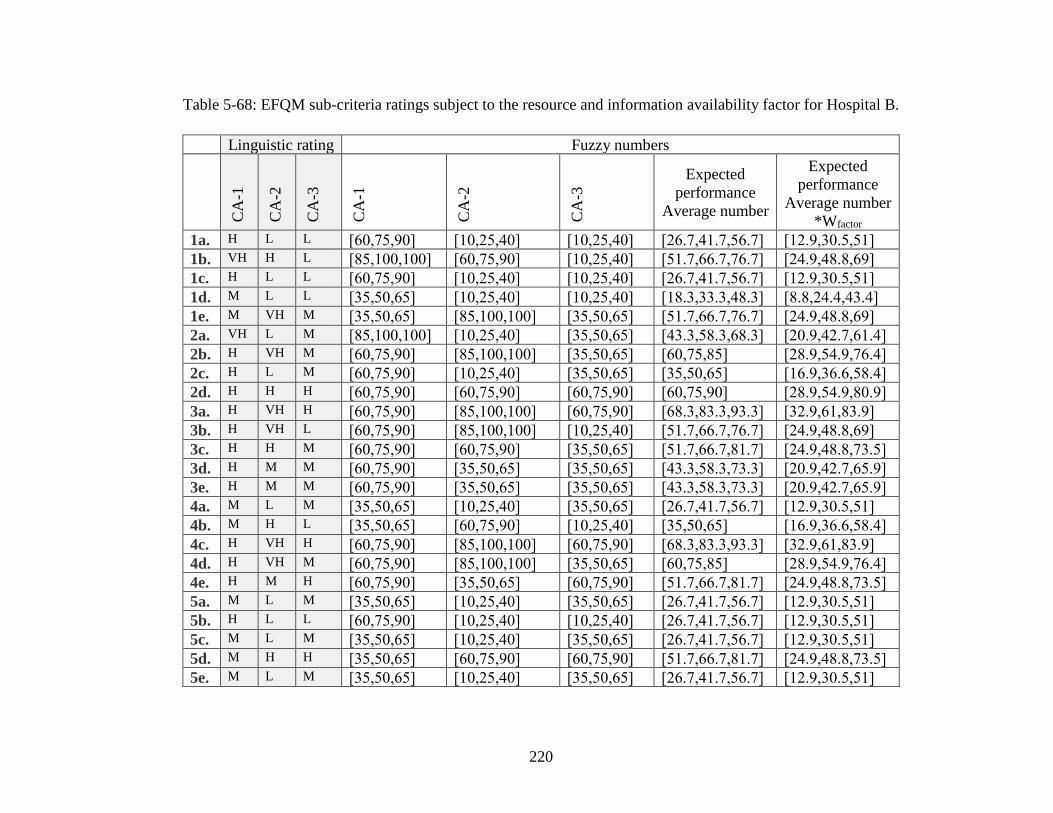
220
Table 5-68: EFQM sub-criteria ratings subject to the resource and information availability factor for Hospital B.
Linguistic rating Fuzzy numbers
CA
-1
CA
-2
CA
-3
CA
-1
CA
-2
CA
-3
Expected
performance
Average number
Expected
performance
Average number
*Wfactor
1a. H L L [60,75,90] [10,25,40] [10,25,40] [26.7,41.7,56.7] [12.9,30.5,51]
1b. VH H L [85,100,100] [60,75,90] [10,25,40] [51.7,66.7,76.7] [24.9,48.8,69]
1c. H L L [60,75,90] [10,25,40] [10,25,40] [26.7,41.7,56.7] [12.9,30.5,51]
1d. M L L [35,50,65] [10,25,40] [10,25,40] [18.3,33.3,48.3] [8.8,24.4,43.4]
1e. M VH M [35,50,65] [85,100,100] [35,50,65] [51.7,66.7,76.7] [24.9,48.8,69]
2a. VH L M [85,100,100] [10,25,40] [35,50,65] [43.3,58.3,68.3] [20.9,42.7,61.4]
2b. H VH M [60,75,90] [85,100,100] [35,50,65] [60,75,85] [28.9,54.9,76.4]
2c. H L M [60,75,90] [10,25,40] [35,50,65] [35,50,65] [16.9,36.6,58.4]
2d. H H H [60,75,90] [60,75,90] [60,75,90] [60,75,90] [28.9,54.9,80.9]
3a. H VH H [60,75,90] [85,100,100] [60,75,90] [68.3,83.3,93.3] [32.9,61,83.9]
3b. H VH L [60,75,90] [85,100,100] [10,25,40] [51.7,66.7,76.7] [24.9,48.8,69]
3c. H H M [60,75,90] [60,75,90] [35,50,65] [51.7,66.7,81.7] [24.9,48.8,73.5]
3d. H M M [60,75,90] [35,50,65] [35,50,65] [43.3,58.3,73.3] [20.9,42.7,65.9]
3e. H M M [60,75,90] [35,50,65] [35,50,65] [43.3,58.3,73.3] [20.9,42.7,65.9]
4a. M L M [35,50,65] [10,25,40] [35,50,65] [26.7,41.7,56.7] [12.9,30.5,51]
4b. M H L [35,50,65] [60,75,90] [10,25,40] [35,50,65] [16.9,36.6,58.4]
4c. H VH H [60,75,90] [85,100,100] [60,75,90] [68.3,83.3,93.3] [32.9,61,83.9]
4d. H VH M [60,75,90] [85,100,100] [35,50,65] [60,75,85] [28.9,54.9,76.4]
4e. H M H [60,75,90] [35,50,65] [60,75,90] [51.7,66.7,81.7] [24.9,48.8,73.5]
5a. M L M [35,50,65] [10,25,40] [35,50,65] [26.7,41.7,56.7] [12.9,30.5,51]
5b. H L L [60,75,90] [10,25,40] [10,25,40] [26.7,41.7,56.7] [12.9,30.5,51]
5c. M L M [35,50,65] [10,25,40] [35,50,65] [26.7,41.7,56.7] [12.9,30.5,51]
5d. M H H [35,50,65] [60,75,90] [60,75,90] [51.7,66.7,81.7] [24.9,48.8,73.5]
5e. M L M [35,50,65] [10,25,40] [35,50,65] [26.7,41.7,56.7] [12.9,30.5,51]
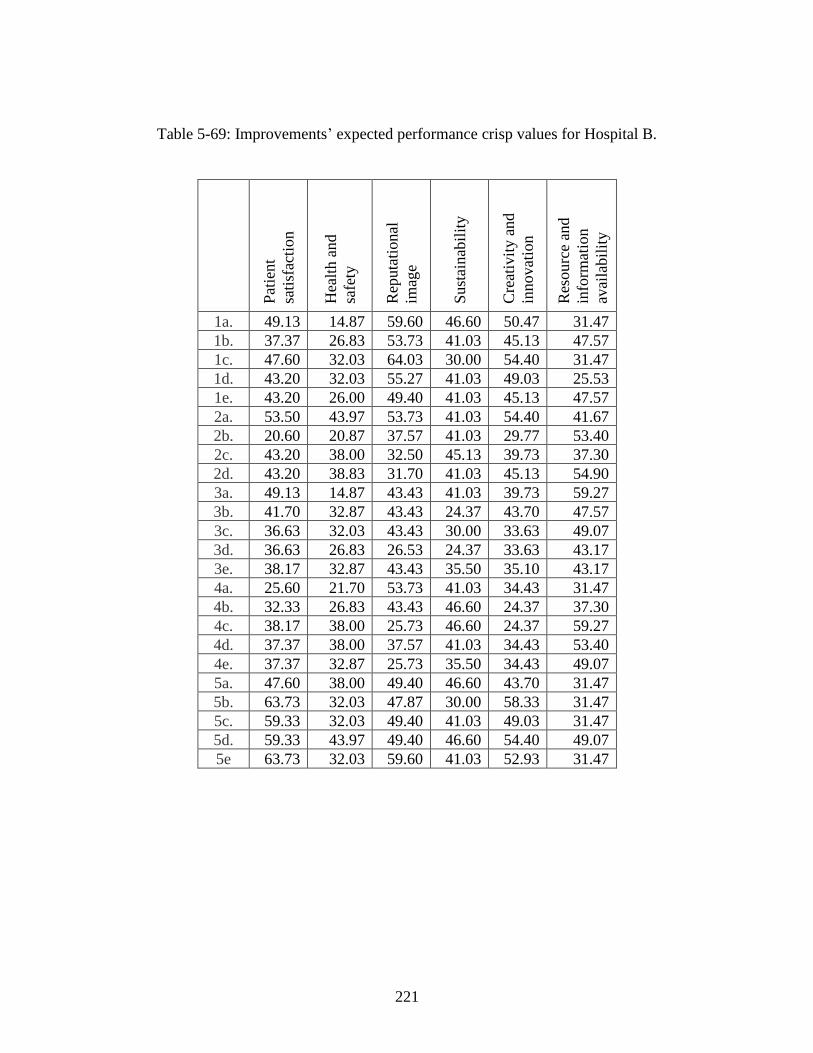
221
Table 5-69: Improvements’ expected performance crisp values for Hospital B.
Pat
ient
sati
sfac
tion
Hea
lth a
nd
safe
ty
Rep
uta
tional
imag
e
Sust
ainab
ilit
y
Cre
ativ
ity a
nd
innovat
ion
Res
ourc
e an
d
info
rmat
ion
avai
labil
ity
1a. 49.13 14.87 59.60 46.60 50.47 31.47
1b. 37.37 26.83 53.73 41.03 45.13 47.57
1c. 47.60 32.03 64.03 30.00 54.40 31.47
1d. 43.20 32.03 55.27 41.03 49.03 25.53
1e. 43.20 26.00 49.40 41.03 45.13 47.57
2a. 53.50 43.97 53.73 41.03 54.40 41.67
2b. 20.60 20.87 37.57 41.03 29.77 53.40
2c. 43.20 38.00 32.50 45.13 39.73 37.30
2d. 43.20 38.83 31.70 41.03 45.13 54.90
3a. 49.13 14.87 43.43 41.03 39.73 59.27
3b. 41.70 32.87 43.43 24.37 43.70 47.57
3c. 36.63 32.03 43.43 30.00 33.63 49.07
3d. 36.63 26.83 26.53 24.37 33.63 43.17
3e. 38.17 32.87 43.43 35.50 35.10 43.17
4a. 25.60 21.70 53.73 41.03 34.43 31.47
4b. 32.33 26.83 43.43 46.60 24.37 37.30
4c. 38.17 38.00 25.73 46.60 24.37 59.27
4d. 37.37 38.00 37.57 41.03 34.43 53.40
4e. 37.37 32.87 25.73 35.50 34.43 49.07
5a. 47.60 38.00 49.40 46.60 43.70 31.47
5b. 63.73 32.03 47.87 30.00 58.33 31.47
5c. 59.33 32.03 49.40 41.03 49.03 31.47
5d. 59.33 43.97 49.40 46.60 54.40 49.07
5e 63.73 32.03 59.60 41.03 52.93 31.47
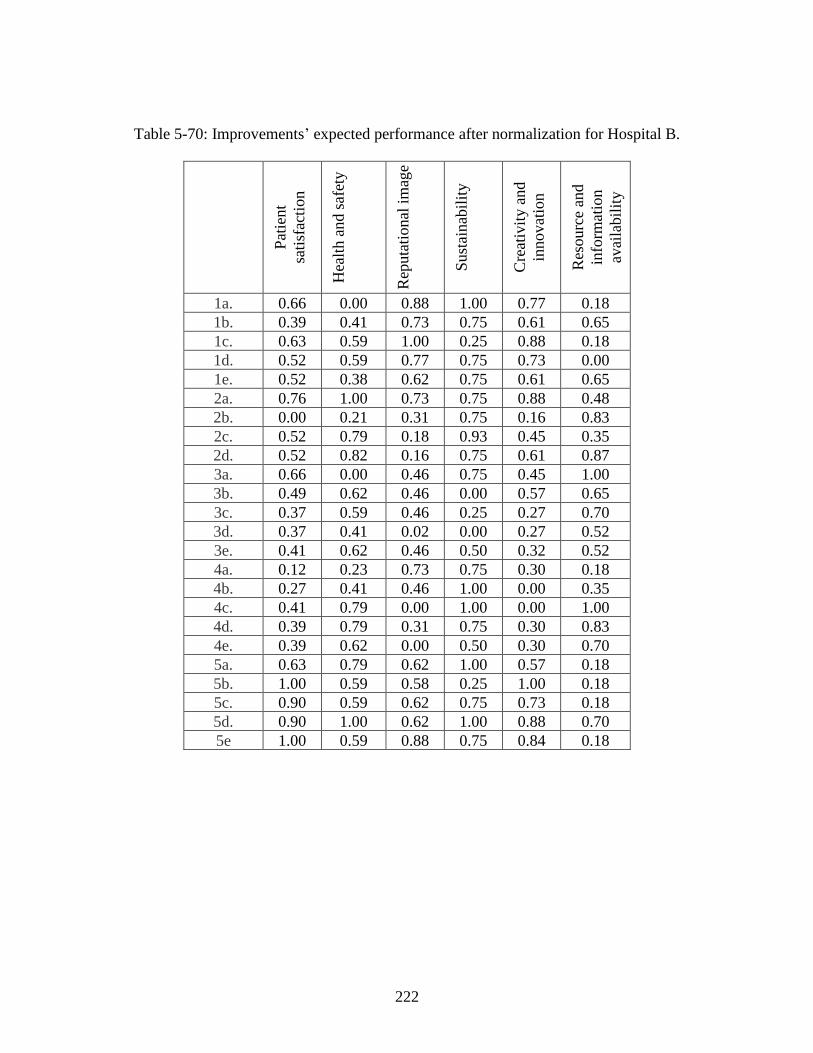
222
Table 5-70: Improvements’ expected performance after normalization for Hospital B.
Pat
ient
sati
sfac
tion
Hea
lth a
nd s
afet
y
Rep
uta
tional
im
age
Sust
ainab
ilit
y
Cre
ativ
ity a
nd
innovat
ion
Res
ourc
e an
d
info
rmat
ion
avai
labil
ity
1a. 0.66 0.00 0.88 1.00 0.77 0.18
1b. 0.39 0.41 0.73 0.75 0.61 0.65
1c. 0.63 0.59 1.00 0.25 0.88 0.18
1d. 0.52 0.59 0.77 0.75 0.73 0.00
1e. 0.52 0.38 0.62 0.75 0.61 0.65
2a. 0.76 1.00 0.73 0.75 0.88 0.48
2b. 0.00 0.21 0.31 0.75 0.16 0.83
2c. 0.52 0.79 0.18 0.93 0.45 0.35
2d. 0.52 0.82 0.16 0.75 0.61 0.87
3a. 0.66 0.00 0.46 0.75 0.45 1.00
3b. 0.49 0.62 0.46 0.00 0.57 0.65
3c. 0.37 0.59 0.46 0.25 0.27 0.70
3d. 0.37 0.41 0.02 0.00 0.27 0.52
3e. 0.41 0.62 0.46 0.50 0.32 0.52
4a. 0.12 0.23 0.73 0.75 0.30 0.18
4b. 0.27 0.41 0.46 1.00 0.00 0.35
4c. 0.41 0.79 0.00 1.00 0.00 1.00
4d. 0.39 0.79 0.31 0.75 0.30 0.83
4e. 0.39 0.62 0.00 0.50 0.30 0.70
5a. 0.63 0.79 0.62 1.00 0.57 0.18
5b. 1.00 0.59 0.58 0.25 1.00 0.18
5c. 0.90 0.59 0.62 0.75 0.73 0.18
5d. 0.90 1.00 0.62 1.00 0.88 0.70
5e 1.00 0.59 0.88 0.75 0.84 0.18
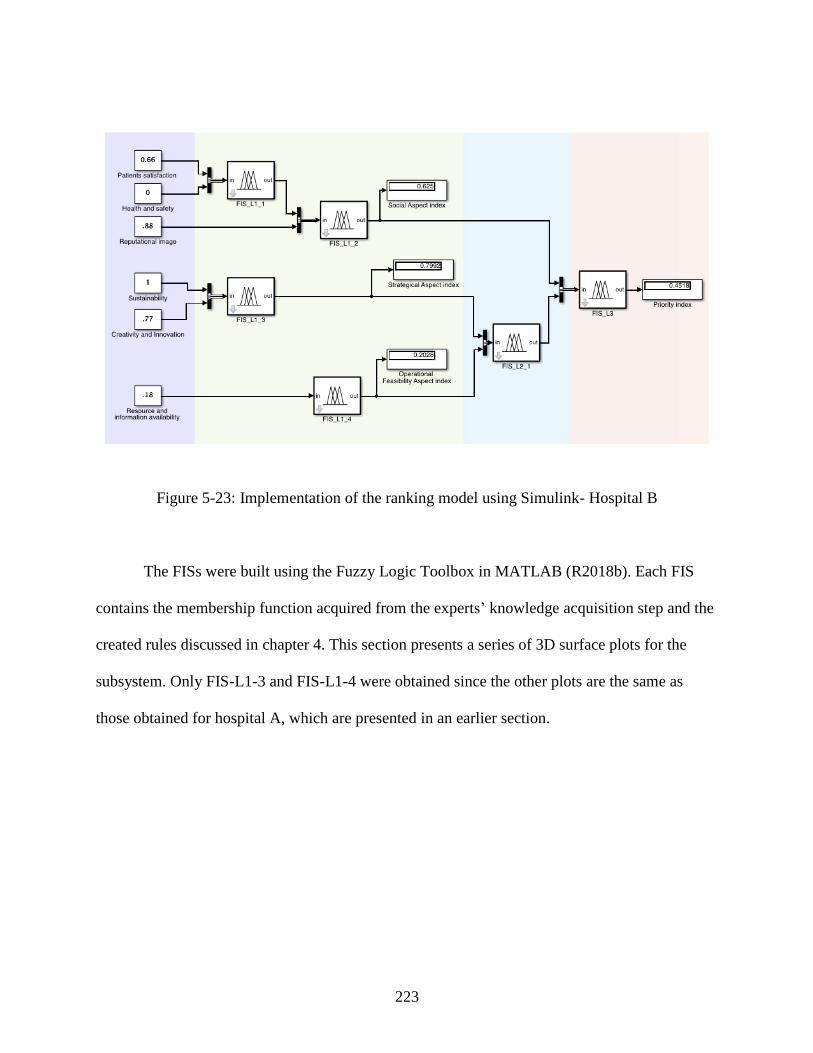
223
Figure 5-23: Implementation of the ranking model using Simulink- Hospital B
The FISs were built using the Fuzzy Logic Toolbox in MATLAB (R2018b). Each FIS
contains the membership function acquired from the experts’ knowledge acquisition step and the
created rules discussed in chapter 4. This section presents a series of 3D surface plots for the
subsystem. Only FIS-L1-3 and FIS-L1-4 were obtained since the other plots are the same as
those obtained for hospital A, which are presented in an earlier section.
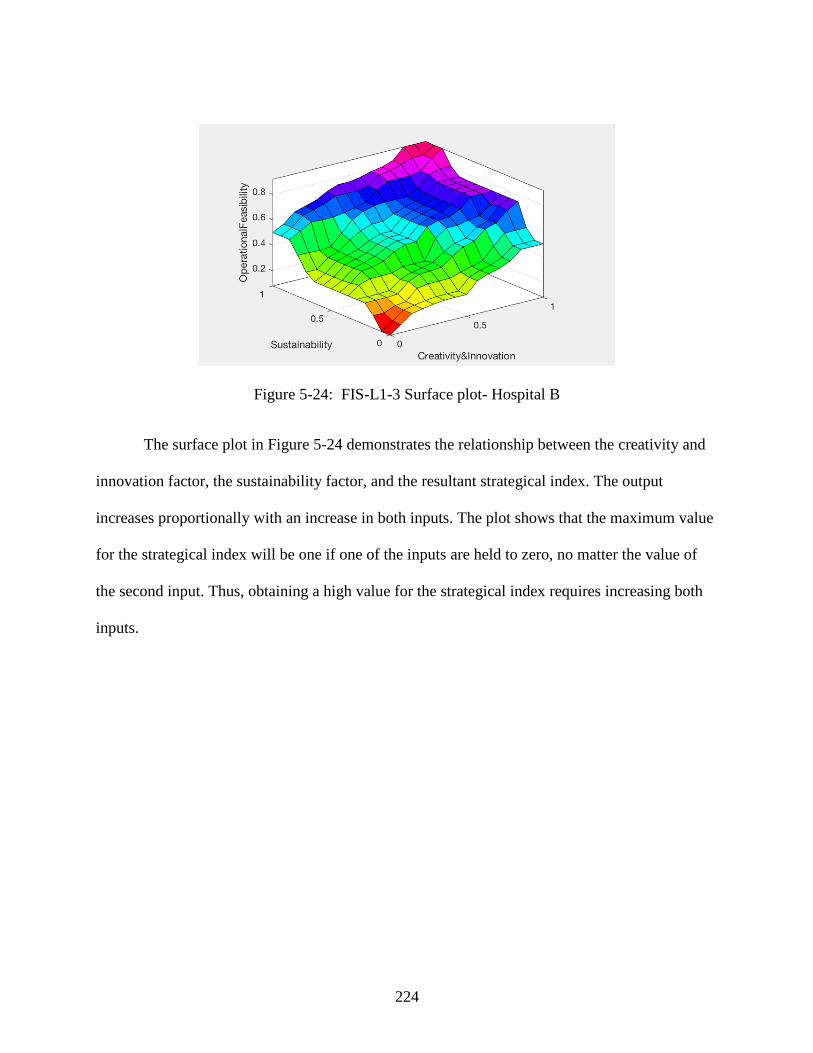
224
Figure 5-24: FIS-L1-3 Surface plot- Hospital B
The surface plot in Figure 5-24 demonstrates the relationship between the creativity and
innovation factor, the sustainability factor, and the resultant strategical index. The output
increases proportionally with an increase in both inputs. The plot shows that the maximum value
for the strategical index will be one if one of the inputs are held to zero, no matter the value of
the second input. Thus, obtaining a high value for the strategical index requires increasing both
inputs.
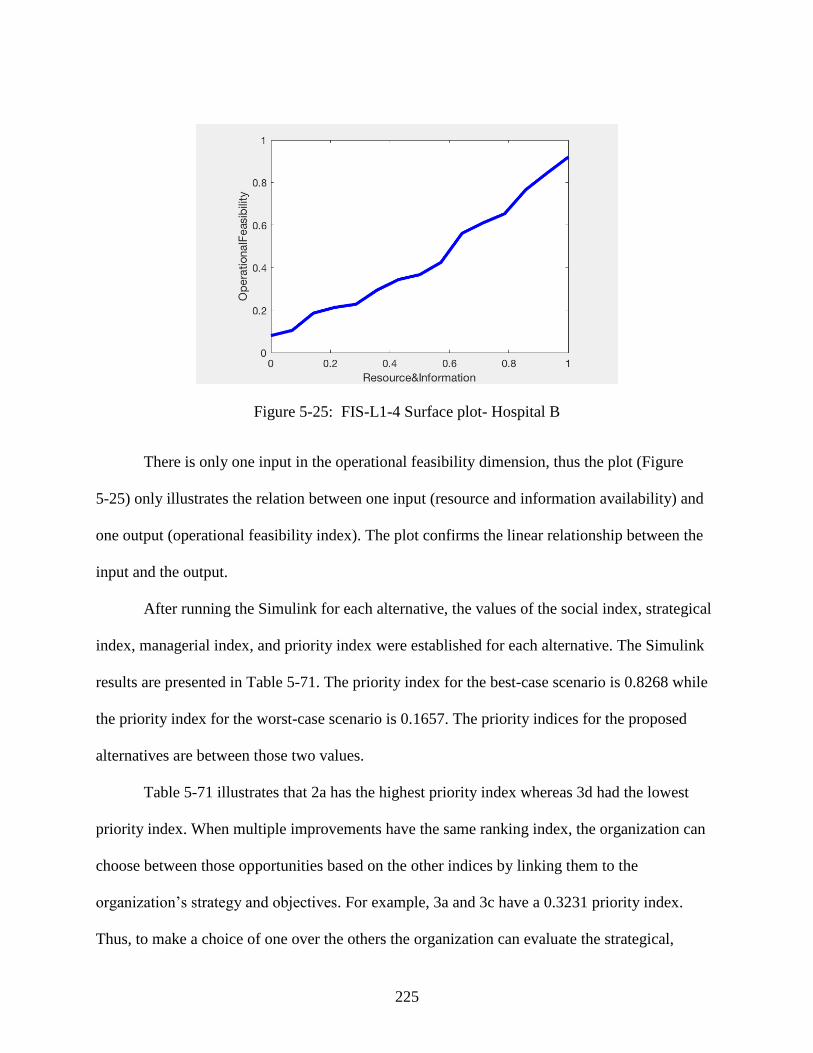
225
Figure 5-25: FIS-L1-4 Surface plot- Hospital B
There is only one input in the operational feasibility dimension, thus the plot (Figure
5-25) only illustrates the relation between one input (resource and information availability) and
one output (operational feasibility index). The plot confirms the linear relationship between the
input and the output.
After running the Simulink for each alternative, the values of the social index, strategical
index, managerial index, and priority index were established for each alternative. The Simulink
results are presented in Table 5-71. The priority index for the best-case scenario is 0.8268 while
the priority index for the worst-case scenario is 0.1657. The priority indices for the proposed
alternatives are between those two values.
Table 5-71 illustrates that 2a has the highest priority index whereas 3d had the lowest
priority index. When multiple improvements have the same ranking index, the organization can
choose between those opportunities based on the other indices by linking them to the
organization’s strategy and objectives. For example, 3a and 3c have a 0.3231 priority index.
Thus, to make a choice of one over the others the organization can evaluate the strategical,
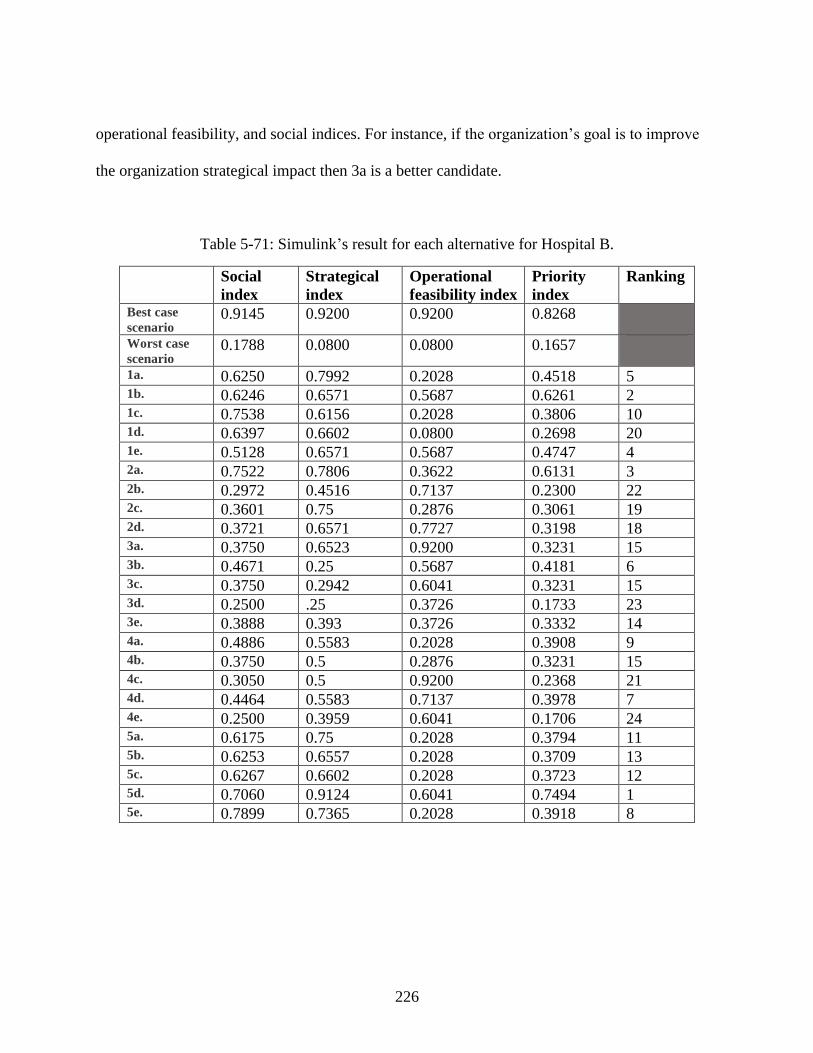
226
operational feasibility, and social indices. For instance, if the organization’s goal is to improve
the organization strategical impact then 3a is a better candidate.
Table 5-71: Simulink’s result for each alternative for Hospital B.
Social
index
Strategical
index
Operational
feasibility index
Priority
index
Ranking
Best case
scenario 0.9145 0.9200 0.9200 0.8268
Worst case
scenario 0.1788 0.0800 0.0800 0.1657
1a. 0.6250 0.7992 0.2028 0.4518 5 1b. 0.6246 0.6571 0.5687 0.6261 2 1c. 0.7538 0.6156 0.2028 0.3806 10 1d. 0.6397 0.6602 0.0800 0.2698 20 1e. 0.5128 0.6571 0.5687 0.4747 4 2a. 0.7522 0.7806 0.3622 0.6131 3 2b. 0.2972 0.4516 0.7137 0.2300 22 2c. 0.3601 0.75 0.2876 0.3061 19 2d. 0.3721 0.6571 0.7727 0.3198 18 3a. 0.3750 0.6523 0.9200 0.3231 15 3b. 0.4671 0.25 0.5687 0.4181 6 3c. 0.3750 0.2942 0.6041 0.3231 15 3d. 0.2500 .25 0.3726 0.1733 23 3e. 0.3888 0.393 0.3726 0.3332 14 4a. 0.4886 0.5583 0.2028 0.3908 9 4b. 0.3750 0.5 0.2876 0.3231 15 4c. 0.3050 0.5 0.9200 0.2368 21 4d. 0.4464 0.5583 0.7137 0.3978 7 4e. 0.2500 0.3959 0.6041 0.1706 24 5a. 0.6175 0.75 0.2028 0.3794 11 5b. 0.6253 0.6557 0.2028 0.3709 13 5c. 0.6267 0.6602 0.2028 0.3723 12 5d. 0.7060 0.9124 0.6041 0.7494 1 5e. 0.7899 0.7365 0.2028 0.3918 8
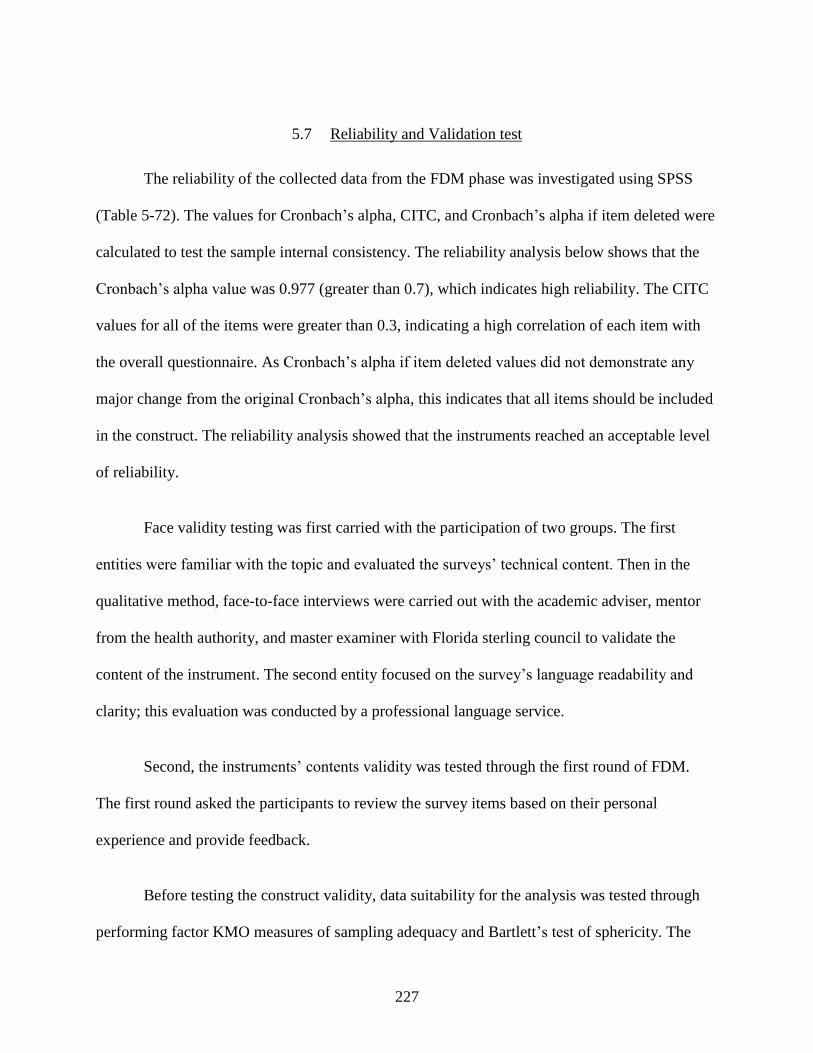
227
5.7 Reliability and Validation test
The reliability of the collected data from the FDM phase was investigated using SPSS
(Table 5-72). The values for Cronbach’s alpha, CITC, and Cronbach’s alpha if item deleted were
calculated to test the sample internal consistency. The reliability analysis below shows that the
Cronbach’s alpha value was 0.977 (greater than 0.7), which indicates high reliability. The CITC
values for all of the items were greater than 0.3, indicating a high correlation of each item with
the overall questionnaire. As Cronbach’s alpha if item deleted values did not demonstrate any
major change from the original Cronbach’s alpha, this indicates that all items should be included
in the construct. The reliability analysis showed that the instruments reached an acceptable level
of reliability.
Face validity testing was first carried with the participation of two groups. The first
entities were familiar with the topic and evaluated the surveys’ technical content. Then in the
qualitative method, face-to-face interviews were carried out with the academic adviser, mentor
from the health authority, and master examiner with Florida sterling council to validate the
content of the instrument. The second entity focused on the survey’s language readability and
clarity; this evaluation was conducted by a professional language service.
Second, the instruments’ contents validity was tested through the first round of FDM.
The first round asked the participants to review the survey items based on their personal
experience and provide feedback.
Before testing the construct validity, data suitability for the analysis was tested through
performing factor KMO measures of sampling adequacy and Bartlett’s test of sphericity. The
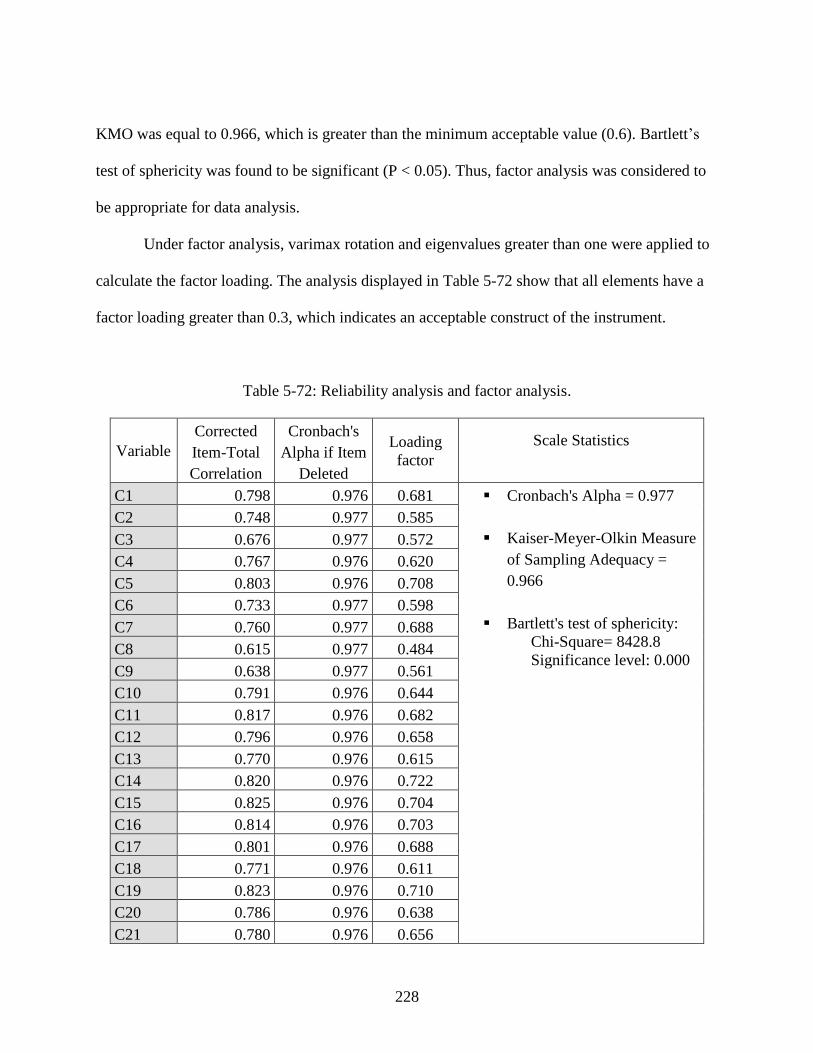
228
KMO was equal to 0.966, which is greater than the minimum acceptable value (0.6). Bartlett’s
test of sphericity was found to be significant (P < 0.05). Thus, factor analysis was considered to
be appropriate for data analysis.
Under factor analysis, varimax rotation and eigenvalues greater than one were applied to
calculate the factor loading. The analysis displayed in Table 5-72 show that all elements have a
factor loading greater than 0.3, which indicates an acceptable construct of the instrument.
Table 5-72: Reliability analysis and factor analysis.
Variable
Corrected
Item-Total
Correlation
Cronbach's
Alpha if Item
Deleted
Loading
factor
Scale Statistics
C1 0.798 0.976 0.681 ▪ Cronbach's Alpha = 0.977
▪ Kaiser-Meyer-Olkin Measure
of Sampling Adequacy =
0.966
▪ Bartlett's test of sphericity:
Chi-Square= 8428.8
Significance level: 0.000
C2 0.748 0.977 0.585
C3 0.676 0.977 0.572
C4 0.767 0.976 0.620
C5 0.803 0.976 0.708
C6 0.733 0.977 0.598
C7 0.760 0.977 0.688
C8 0.615 0.977 0.484
C9 0.638 0.977 0.561
C10 0.791 0.976 0.644
C11 0.817 0.976 0.682
C12 0.796 0.976 0.658
C13 0.770 0.976 0.615
C14 0.820 0.976 0.722
C15 0.825 0.976 0.704
C16 0.814 0.976 0.703
C17 0.801 0.976 0.688
C18 0.771 0.976 0.611
C19 0.823 0.976 0.710
C20 0.786 0.976 0.638
C21 0.780 0.976 0.656
229
Variable
Corrected
Item-Total
Correlation
Cronbach's
Alpha if Item
Deleted
Loading
factor
Scale Statistics
C22 0.754 0.977 0.617
C23 0.796 0.976 0.679
C24 0.814 0.976 0.715
C25 0.828 0.976 0.703
C26 0.682 0.977 0.486
C27 0.771 0.976 0.619
C28 0.798 0.976 0.653
Based on the data from hospital A, Fuzzy VIKOR was implemented to compare its
outcome with the framework’s results. The factors weight found from FDM analysis were
utilized in F-VIKOR as well for the factors weight. The other inputs for F-VIKOR were the
alternatives expected performance based on the EFQM assessors rating. The linguistic ratings
were fuzzified and the fuzzy expected performance average numbers were computed. Then, the
performance rating matrix was constructed, where each element represents the fuzzy expected
performance with respect to j criteria. The performance matrix was normalized using Eq.( 23 )
and Eq.( 24 ) as shown in Table 5-73. The next step was to measure the fuzzy distance between
the alternative and fuzzy best value, the distance between the alternative and the fuzzy worst
value, as well as the fuzzy compromise solution using Eq.( 25 ), Eq. ( 26 ) and Eq.( 27 ),
respectively. Then, the fuzzy numbers were defuzzied to obtain the crisp values for the S, R, and
Q. Finally, alternatives were sorted by the value of Q in ascending order as shown in Table 5-74.
Notice that alternatives with smaller Q value are preferred.
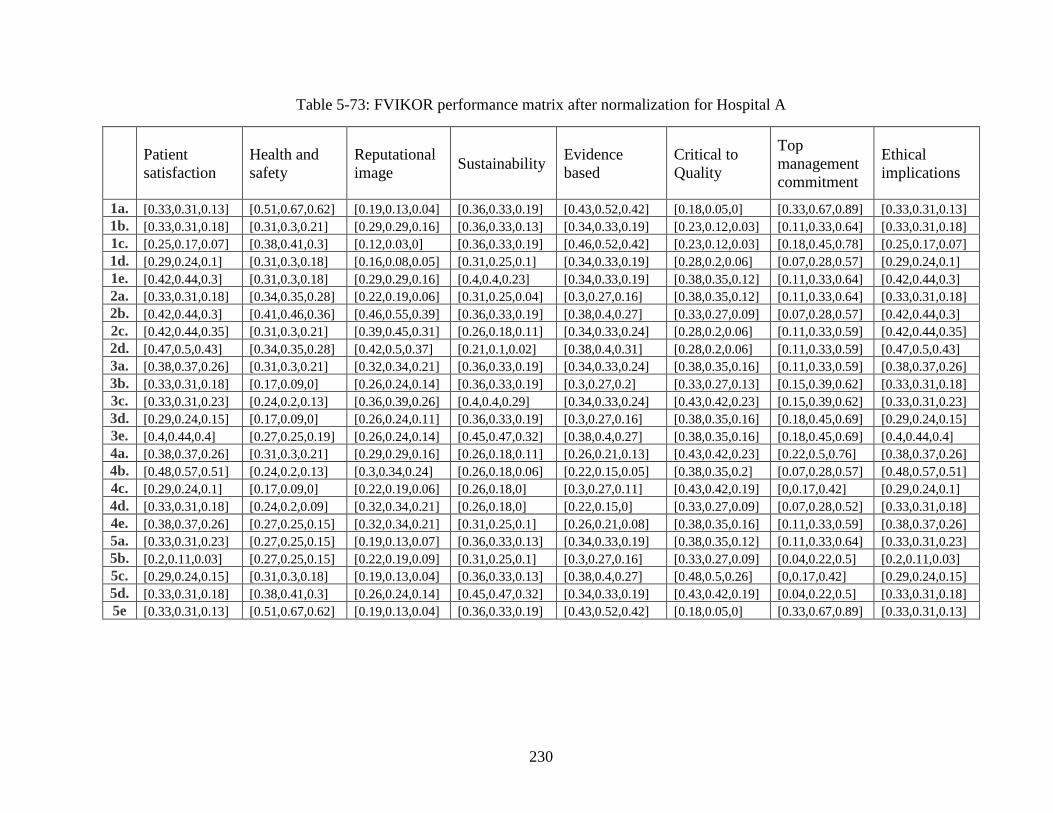
230
Table 5-73: FVIKOR performance matrix after normalization for Hospital A
Patient
satisfaction
Health and
safety
Reputational
image Sustainability
Evidence
based
Critical to
Quality
Top
management
commitment
Ethical
implications
1a. [0.33,0.31,0.13] [0.51,0.67,0.62] [0.19,0.13,0.04] [0.36,0.33,0.19] [0.43,0.52,0.42] [0.18,0.05,0] [0.33,0.67,0.89] [0.33,0.31,0.13]
1b. [0.33,0.31,0.18] [0.31,0.3,0.21] [0.29,0.29,0.16] [0.36,0.33,0.13] [0.34,0.33,0.19] [0.23,0.12,0.03] [0.11,0.33,0.64] [0.33,0.31,0.18]
1c. [0.25,0.17,0.07] [0.38,0.41,0.3] [0.12,0.03,0] [0.36,0.33,0.19] [0.46,0.52,0.42] [0.23,0.12,0.03] [0.18,0.45,0.78] [0.25,0.17,0.07]
1d. [0.29,0.24,0.1] [0.31,0.3,0.18] [0.16,0.08,0.05] [0.31,0.25,0.1] [0.34,0.33,0.19] [0.28,0.2,0.06] [0.07,0.28,0.57] [0.29,0.24,0.1]
1e. [0.42,0.44,0.3] [0.31,0.3,0.18] [0.29,0.29,0.16] [0.4,0.4,0.23] [0.34,0.33,0.19] [0.38,0.35,0.12] [0.11,0.33,0.64] [0.42,0.44,0.3]
2a. [0.33,0.31,0.18] [0.34,0.35,0.28] [0.22,0.19,0.06] [0.31,0.25,0.04] [0.3,0.27,0.16] [0.38,0.35,0.12] [0.11,0.33,0.64] [0.33,0.31,0.18]
2b. [0.42,0.44,0.3] [0.41,0.46,0.36] [0.46,0.55,0.39] [0.36,0.33,0.19] [0.38,0.4,0.27] [0.33,0.27,0.09] [0.07,0.28,0.57] [0.42,0.44,0.3]
2c. [0.42,0.44,0.35] [0.31,0.3,0.21] [0.39,0.45,0.31] [0.26,0.18,0.11] [0.34,0.33,0.24] [0.28,0.2,0.06] [0.11,0.33,0.59] [0.42,0.44,0.35]
2d. [0.47,0.5,0.43] [0.34,0.35,0.28] [0.42,0.5,0.37] [0.21,0.1,0.02] [0.38,0.4,0.31] [0.28,0.2,0.06] [0.11,0.33,0.59] [0.47,0.5,0.43]
3a. [0.38,0.37,0.26] [0.31,0.3,0.21] [0.32,0.34,0.21] [0.36,0.33,0.19] [0.34,0.33,0.24] [0.38,0.35,0.16] [0.11,0.33,0.59] [0.38,0.37,0.26]
3b. [0.33,0.31,0.18] [0.17,0.09,0] [0.26,0.24,0.14] [0.36,0.33,0.19] [0.3,0.27,0.2] [0.33,0.27,0.13] [0.15,0.39,0.62] [0.33,0.31,0.18]
3c. [0.33,0.31,0.23] [0.24,0.2,0.13] [0.36,0.39,0.26] [0.4,0.4,0.29] [0.34,0.33,0.24] [0.43,0.42,0.23] [0.15,0.39,0.62] [0.33,0.31,0.23]
3d. [0.29,0.24,0.15] [0.17,0.09,0] [0.26,0.24,0.11] [0.36,0.33,0.19] [0.3,0.27,0.16] [0.38,0.35,0.16] [0.18,0.45,0.69] [0.29,0.24,0.15]
3e. [0.4,0.44,0.4] [0.27,0.25,0.19] [0.26,0.24,0.14] [0.45,0.47,0.32] [0.38,0.4,0.27] [0.38,0.35,0.16] [0.18,0.45,0.69] [0.4,0.44,0.4]
4a. [0.38,0.37,0.26] [0.31,0.3,0.21] [0.29,0.29,0.16] [0.26,0.18,0.11] [0.26,0.21,0.13] [0.43,0.42,0.23] [0.22,0.5,0.76] [0.38,0.37,0.26]
4b. [0.48,0.57,0.51] [0.24,0.2,0.13] [0.3,0.34,0.24] [0.26,0.18,0.06] [0.22,0.15,0.05] [0.38,0.35,0.2] [0.07,0.28,0.57] [0.48,0.57,0.51]
4c. [0.29,0.24,0.1] [0.17,0.09,0] [0.22,0.19,0.06] [0.26,0.18,0] [0.3,0.27,0.11] [0.43,0.42,0.19] [0,0.17,0.42] [0.29,0.24,0.1]
4d. [0.33,0.31,0.18] [0.24,0.2,0.09] [0.32,0.34,0.21] [0.26,0.18,0] [0.22,0.15,0] [0.33,0.27,0.09] [0.07,0.28,0.52] [0.33,0.31,0.18]
4e. [0.38,0.37,0.26] [0.27,0.25,0.15] [0.32,0.34,0.21] [0.31,0.25,0.1] [0.26,0.21,0.08] [0.38,0.35,0.16] [0.11,0.33,0.59] [0.38,0.37,0.26]
5a. [0.33,0.31,0.23] [0.27,0.25,0.15] [0.19,0.13,0.07] [0.36,0.33,0.13] [0.34,0.33,0.19] [0.38,0.35,0.12] [0.11,0.33,0.64] [0.33,0.31,0.23]
5b. [0.2,0.11,0.03] [0.27,0.25,0.15] [0.22,0.19,0.09] [0.31,0.25,0.1] [0.3,0.27,0.16] [0.33,0.27,0.09] [0.04,0.22,0.5] [0.2,0.11,0.03]
5c. [0.29,0.24,0.15] [0.31,0.3,0.18] [0.19,0.13,0.04] [0.36,0.33,0.13] [0.38,0.4,0.27] [0.48,0.5,0.26] [0,0.17,0.42] [0.29,0.24,0.15]
5d. [0.33,0.31,0.18] [0.38,0.41,0.3] [0.26,0.24,0.14] [0.45,0.47,0.32] [0.34,0.33,0.19] [0.43,0.42,0.19] [0.04,0.22,0.5] [0.33,0.31,0.18]
5e [0.33,0.31,0.13] [0.51,0.67,0.62] [0.19,0.13,0.04] [0.36,0.33,0.19] [0.43,0.52,0.42] [0.18,0.05,0] [0.33,0.67,0.89] [0.33,0.31,0.13]
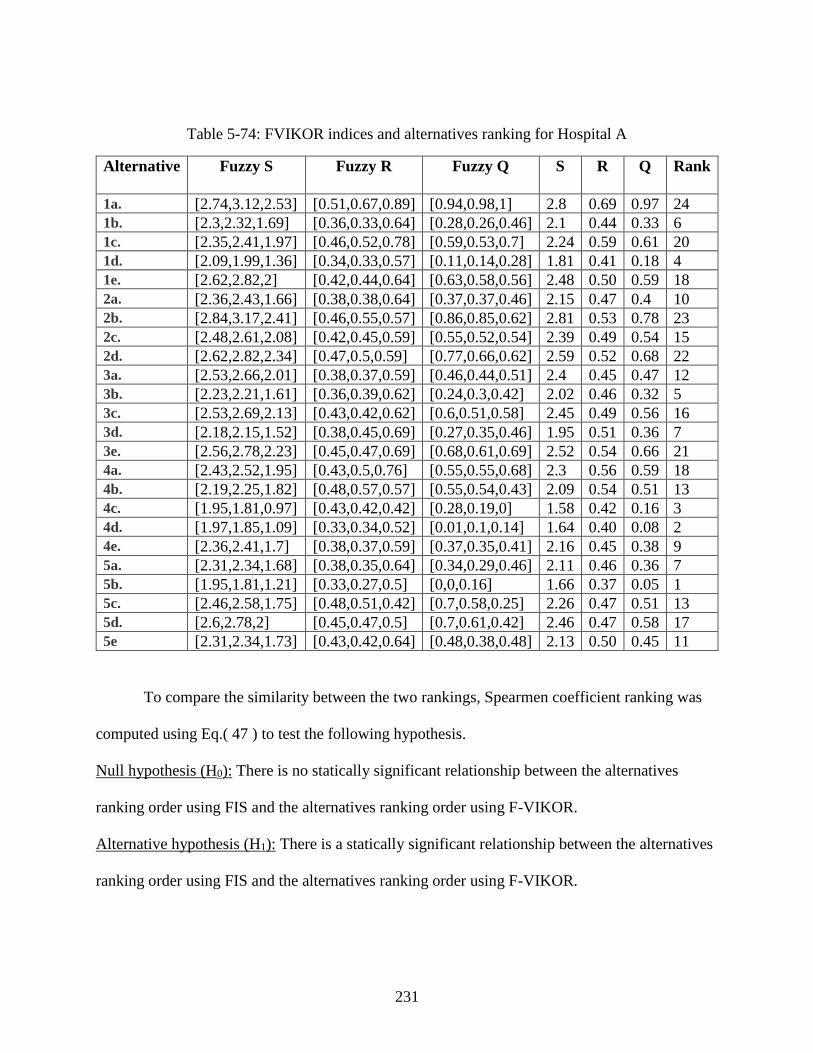
231
Table 5-74: FVIKOR indices and alternatives ranking for Hospital A
Alternative Fuzzy S Fuzzy R Fuzzy Q S R Q Rank
1a. [2.74,3.12,2.53] [0.51,0.67,0.89] [0.94,0.98,1] 2.8 0.69 0.97 24
1b. [2.3,2.32,1.69] [0.36,0.33,0.64] [0.28,0.26,0.46] 2.1 0.44 0.33 6
1c. [2.35,2.41,1.97] [0.46,0.52,0.78] [0.59,0.53,0.7] 2.24 0.59 0.61 20
1d. [2.09,1.99,1.36] [0.34,0.33,0.57] [0.11,0.14,0.28] 1.81 0.41 0.18 4
1e. [2.62,2.82,2] [0.42,0.44,0.64] [0.63,0.58,0.56] 2.48 0.50 0.59 18
2a. [2.36,2.43,1.66] [0.38,0.38,0.64] [0.37,0.37,0.46] 2.15 0.47 0.4 10
2b. [2.84,3.17,2.41] [0.46,0.55,0.57] [0.86,0.85,0.62] 2.81 0.53 0.78 23
2c. [2.48,2.61,2.08] [0.42,0.45,0.59] [0.55,0.52,0.54] 2.39 0.49 0.54 15
2d. [2.62,2.82,2.34] [0.47,0.5,0.59] [0.77,0.66,0.62] 2.59 0.52 0.68 22
3a. [2.53,2.66,2.01] [0.38,0.37,0.59] [0.46,0.44,0.51] 2.4 0.45 0.47 12
3b. [2.23,2.21,1.61] [0.36,0.39,0.62] [0.24,0.3,0.42] 2.02 0.46 0.32 5
3c. [2.53,2.69,2.13] [0.43,0.42,0.62] [0.6,0.51,0.58] 2.45 0.49 0.56 16
3d. [2.18,2.15,1.52] [0.38,0.45,0.69] [0.27,0.35,0.46] 1.95 0.51 0.36 7
3e. [2.56,2.78,2.23] [0.45,0.47,0.69] [0.68,0.61,0.69] 2.52 0.54 0.66 21
4a. [2.43,2.52,1.95] [0.43,0.5,0.76] [0.55,0.55,0.68] 2.3 0.56 0.59 18
4b. [2.19,2.25,1.82] [0.48,0.57,0.57] [0.55,0.54,0.43] 2.09 0.54 0.51 13
4c. [1.95,1.81,0.97] [0.43,0.42,0.42] [0.28,0.19,0] 1.58 0.42 0.16 3
4d. [1.97,1.85,1.09] [0.33,0.34,0.52] [0.01,0.1,0.14] 1.64 0.40 0.08 2
4e. [2.36,2.41,1.7] [0.38,0.37,0.59] [0.37,0.35,0.41] 2.16 0.45 0.38 9
5a. [2.31,2.34,1.68] [0.38,0.35,0.64] [0.34,0.29,0.46] 2.11 0.46 0.36 7
5b. [1.95,1.81,1.21] [0.33,0.27,0.5] [0,0,0.16] 1.66 0.37 0.05 1
5c. [2.46,2.58,1.75] [0.48,0.51,0.42] [0.7,0.58,0.25] 2.26 0.47 0.51 13
5d. [2.6,2.78,2] [0.45,0.47,0.5] [0.7,0.61,0.42] 2.46 0.47 0.58 17
5e [2.31,2.34,1.73] [0.43,0.42,0.64] [0.48,0.38,0.48] 2.13 0.50 0.45 11
To compare the similarity between the two rankings, Spearmen coefficient ranking was
computed using Eq.( 47 ) to test the following hypothesis.
Null hypothesis (H0): There is no statically significant relationship between the alternatives
ranking order using FIS and the alternatives ranking order using F-VIKOR.
Alternative hypothesis (H1): There is a statically significant relationship between the alternatives
ranking order using FIS and the alternatives ranking order using F-VIKOR.
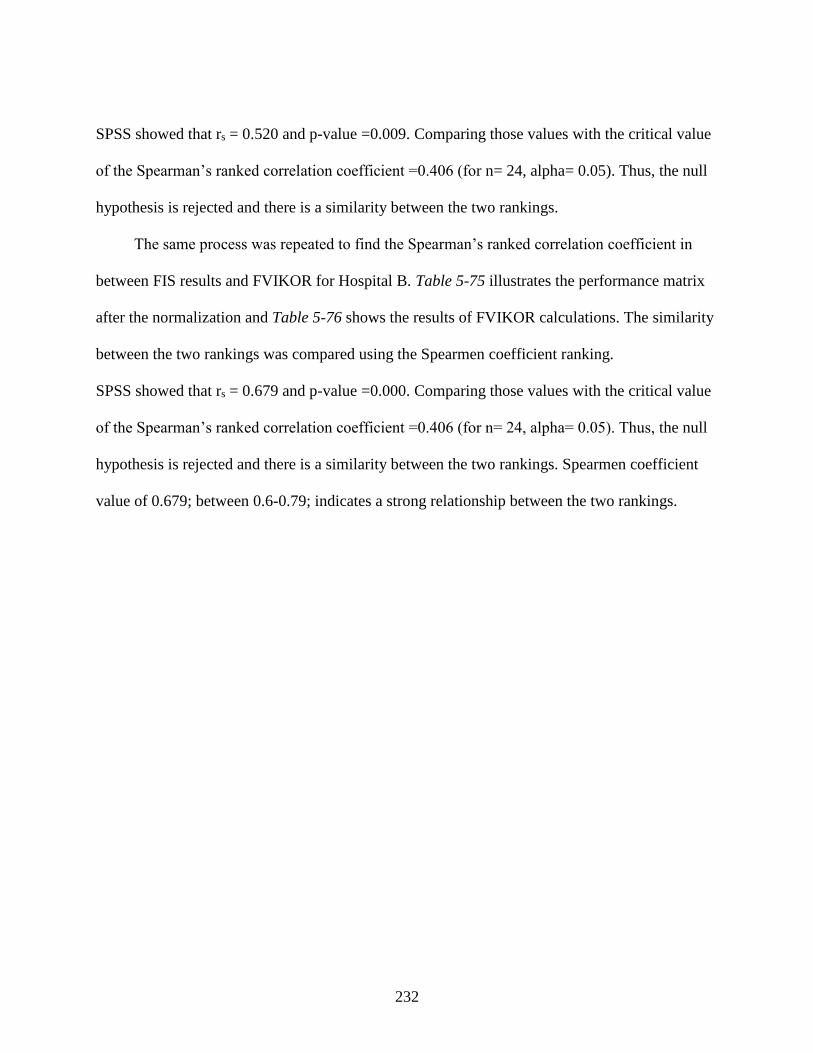
232
SPSS showed that rs = 0.520 and p-value =0.009. Comparing those values with the critical value
of the Spearman’s ranked correlation coefficient =0.406 (for n= 24, alpha= 0.05). Thus, the null
hypothesis is rejected and there is a similarity between the two rankings.
The same process was repeated to find the Spearman’s ranked correlation coefficient in
between FIS results and FVIKOR for Hospital B. Table 5-75 illustrates the performance matrix
after the normalization and Table 5-76 shows the results of FVIKOR calculations. The similarity
between the two rankings was compared using the Spearmen coefficient ranking.
SPSS showed that rs = 0.679 and p-value =0.000. Comparing those values with the critical value
of the Spearman’s ranked correlation coefficient =0.406 (for n= 24, alpha= 0.05). Thus, the null
hypothesis is rejected and there is a similarity between the two rankings. Spearmen coefficient
value of 0.679; between 0.6-0.79; indicates a strong relationship between the two rankings.
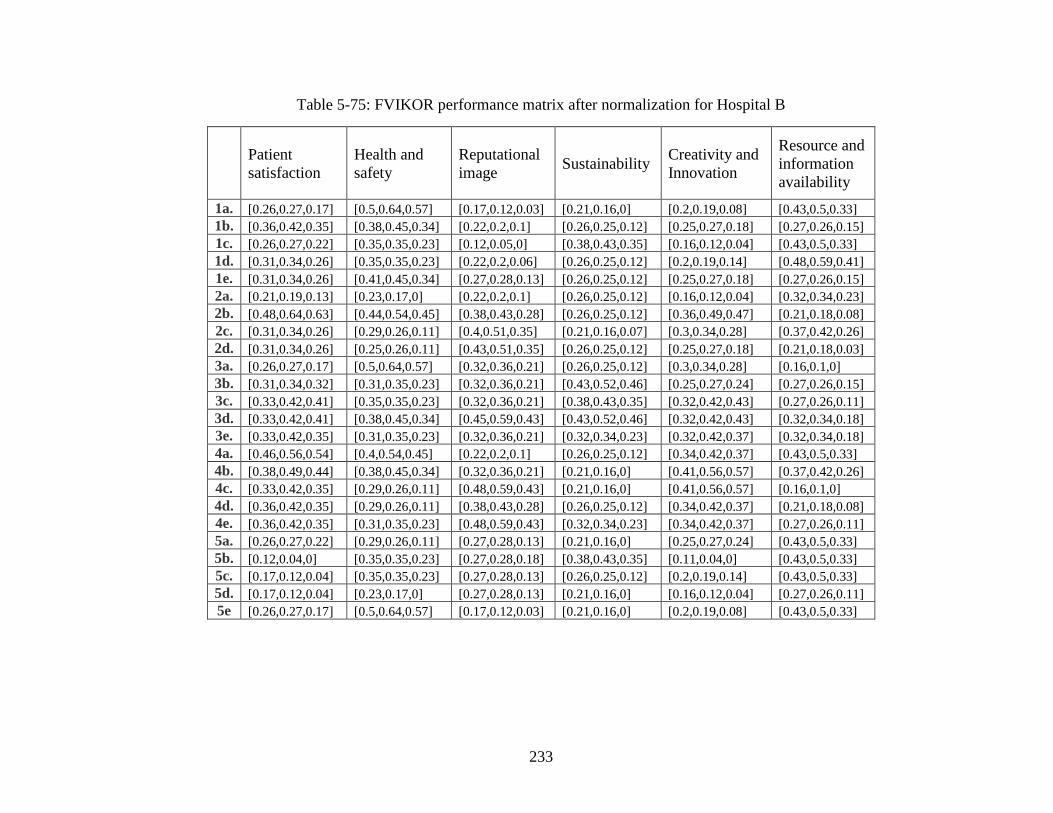
233
Table 5-75: FVIKOR performance matrix after normalization for Hospital B
Patient
satisfaction
Health and
safety
Reputational
image Sustainability
Creativity and
Innovation
Resource and
information
availability
1a. [0.26,0.27,0.17] [0.5,0.64,0.57] [0.17,0.12,0.03] [0.21,0.16,0] [0.2,0.19,0.08] [0.43,0.5,0.33]
1b. [0.36,0.42,0.35] [0.38,0.45,0.34] [0.22,0.2,0.1] [0.26,0.25,0.12] [0.25,0.27,0.18] [0.27,0.26,0.15]
1c. [0.26,0.27,0.22] [0.35,0.35,0.23] [0.12,0.05,0] [0.38,0.43,0.35] [0.16,0.12,0.04] [0.43,0.5,0.33]
1d. [0.31,0.34,0.26] [0.35,0.35,0.23] [0.22,0.2,0.06] [0.26,0.25,0.12] [0.2,0.19,0.14] [0.48,0.59,0.41]
1e. [0.31,0.34,0.26] [0.41,0.45,0.34] [0.27,0.28,0.13] [0.26,0.25,0.12] [0.25,0.27,0.18] [0.27,0.26,0.15]
2a. [0.21,0.19,0.13] [0.23,0.17,0] [0.22,0.2,0.1] [0.26,0.25,0.12] [0.16,0.12,0.04] [0.32,0.34,0.23]
2b. [0.48,0.64,0.63] [0.44,0.54,0.45] [0.38,0.43,0.28] [0.26,0.25,0.12] [0.36,0.49,0.47] [0.21,0.18,0.08]
2c. [0.31,0.34,0.26] [0.29,0.26,0.11] [0.4,0.51,0.35] [0.21,0.16,0.07] [0.3,0.34,0.28] [0.37,0.42,0.26]
2d. [0.31,0.34,0.26] [0.25,0.26,0.11] [0.43,0.51,0.35] [0.26,0.25,0.12] [0.25,0.27,0.18] [0.21,0.18,0.03]
3a. [0.26,0.27,0.17] [0.5,0.64,0.57] [0.32,0.36,0.21] [0.26,0.25,0.12] [0.3,0.34,0.28] [0.16,0.1,0]
3b. [0.31,0.34,0.32] [0.31,0.35,0.23] [0.32,0.36,0.21] [0.43,0.52,0.46] [0.25,0.27,0.24] [0.27,0.26,0.15]
3c. [0.33,0.42,0.41] [0.35,0.35,0.23] [0.32,0.36,0.21] [0.38,0.43,0.35] [0.32,0.42,0.43] [0.27,0.26,0.11]
3d. [0.33,0.42,0.41] [0.38,0.45,0.34] [0.45,0.59,0.43] [0.43,0.52,0.46] [0.32,0.42,0.43] [0.32,0.34,0.18]
3e. [0.33,0.42,0.35] [0.31,0.35,0.23] [0.32,0.36,0.21] [0.32,0.34,0.23] [0.32,0.42,0.37] [0.32,0.34,0.18]
4a. [0.46,0.56,0.54] [0.4,0.54,0.45] [0.22,0.2,0.1] [0.26,0.25,0.12] [0.34,0.42,0.37] [0.43,0.5,0.33]
4b. [0.38,0.49,0.44] [0.38,0.45,0.34] [0.32,0.36,0.21] [0.21,0.16,0] [0.41,0.56,0.57] [0.37,0.42,0.26]
4c. [0.33,0.42,0.35] [0.29,0.26,0.11] [0.48,0.59,0.43] [0.21,0.16,0] [0.41,0.56,0.57] [0.16,0.1,0]
4d. [0.36,0.42,0.35] [0.29,0.26,0.11] [0.38,0.43,0.28] [0.26,0.25,0.12] [0.34,0.42,0.37] [0.21,0.18,0.08]
4e. [0.36,0.42,0.35] [0.31,0.35,0.23] [0.48,0.59,0.43] [0.32,0.34,0.23] [0.34,0.42,0.37] [0.27,0.26,0.11]
5a. [0.26,0.27,0.22] [0.29,0.26,0.11] [0.27,0.28,0.13] [0.21,0.16,0] [0.25,0.27,0.24] [0.43,0.5,0.33]
5b. [0.12,0.04,0] [0.35,0.35,0.23] [0.27,0.28,0.18] [0.38,0.43,0.35] [0.11,0.04,0] [0.43,0.5,0.33]
5c. [0.17,0.12,0.04] [0.35,0.35,0.23] [0.27,0.28,0.13] [0.26,0.25,0.12] [0.2,0.19,0.14] [0.43,0.5,0.33]
5d. [0.17,0.12,0.04] [0.23,0.17,0] [0.27,0.28,0.13] [0.21,0.16,0] [0.16,0.12,0.04] [0.27,0.26,0.11]
5e [0.26,0.27,0.17] [0.5,0.64,0.57] [0.17,0.12,0.03] [0.21,0.16,0] [0.2,0.19,0.08] [0.43,0.5,0.33]
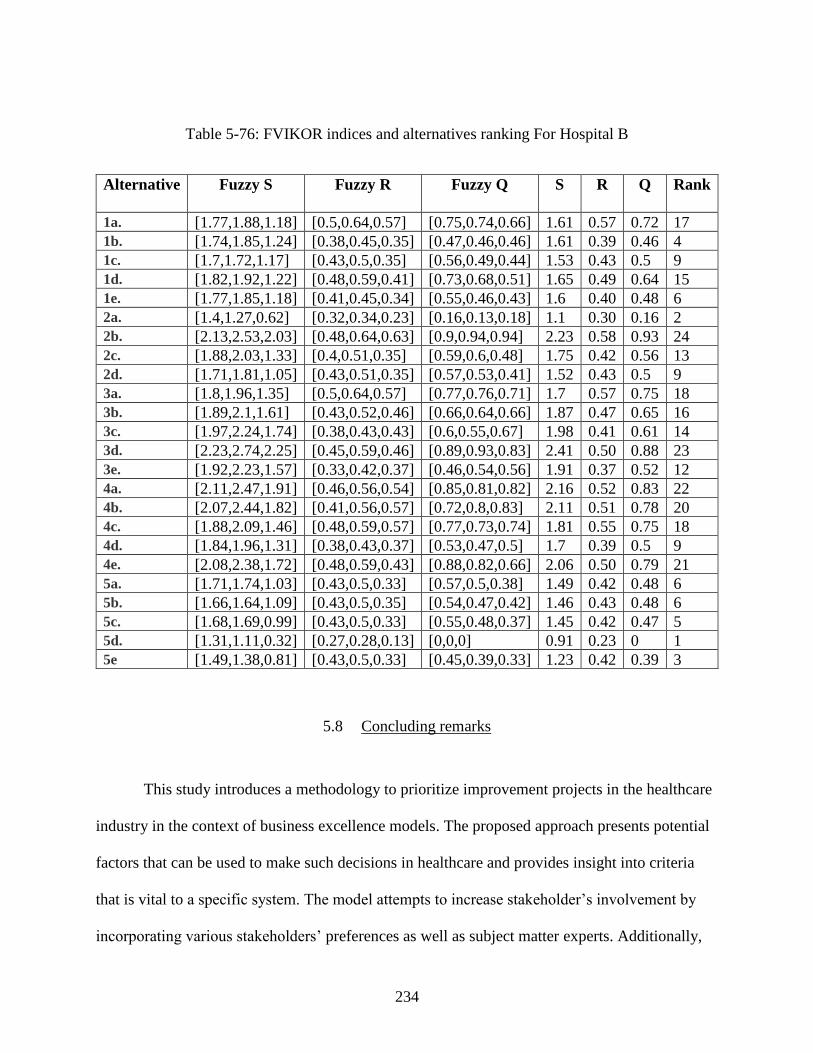
234
Table 5-76: FVIKOR indices and alternatives ranking For Hospital B
Alternative Fuzzy S Fuzzy R Fuzzy Q S R Q Rank
1a. [1.77,1.88,1.18] [0.5,0.64,0.57] [0.75,0.74,0.66] 1.61 0.57 0.72 17
1b. [1.74,1.85,1.24] [0.38,0.45,0.35] [0.47,0.46,0.46] 1.61 0.39 0.46 4
1c. [1.7,1.72,1.17] [0.43,0.5,0.35] [0.56,0.49,0.44] 1.53 0.43 0.5 9
1d. [1.82,1.92,1.22] [0.48,0.59,0.41] [0.73,0.68,0.51] 1.65 0.49 0.64 15
1e. [1.77,1.85,1.18] [0.41,0.45,0.34] [0.55,0.46,0.43] 1.6 0.40 0.48 6
2a. [1.4,1.27,0.62] [0.32,0.34,0.23] [0.16,0.13,0.18] 1.1 0.30 0.16 2
2b. [2.13,2.53,2.03] [0.48,0.64,0.63] [0.9,0.94,0.94] 2.23 0.58 0.93 24
2c. [1.88,2.03,1.33] [0.4,0.51,0.35] [0.59,0.6,0.48] 1.75 0.42 0.56 13
2d. [1.71,1.81,1.05] [0.43,0.51,0.35] [0.57,0.53,0.41] 1.52 0.43 0.5 9
3a. [1.8,1.96,1.35] [0.5,0.64,0.57] [0.77,0.76,0.71] 1.7 0.57 0.75 18
3b. [1.89,2.1,1.61] [0.43,0.52,0.46] [0.66,0.64,0.66] 1.87 0.47 0.65 16
3c. [1.97,2.24,1.74] [0.38,0.43,0.43] [0.6,0.55,0.67] 1.98 0.41 0.61 14
3d. [2.23,2.74,2.25] [0.45,0.59,0.46] [0.89,0.93,0.83] 2.41 0.50 0.88 23
3e. [1.92,2.23,1.57] [0.33,0.42,0.37] [0.46,0.54,0.56] 1.91 0.37 0.52 12
4a. [2.11,2.47,1.91] [0.46,0.56,0.54] [0.85,0.81,0.82] 2.16 0.52 0.83 22
4b. [2.07,2.44,1.82] [0.41,0.56,0.57] [0.72,0.8,0.83] 2.11 0.51 0.78 20
4c. [1.88,2.09,1.46] [0.48,0.59,0.57] [0.77,0.73,0.74] 1.81 0.55 0.75 18
4d. [1.84,1.96,1.31] [0.38,0.43,0.37] [0.53,0.47,0.5] 1.7 0.39 0.5 9
4e. [2.08,2.38,1.72] [0.48,0.59,0.43] [0.88,0.82,0.66] 2.06 0.50 0.79 21
5a. [1.71,1.74,1.03] [0.43,0.5,0.33] [0.57,0.5,0.38] 1.49 0.42 0.48 6
5b. [1.66,1.64,1.09] [0.43,0.5,0.35] [0.54,0.47,0.42] 1.46 0.43 0.48 6
5c. [1.68,1.69,0.99] [0.43,0.5,0.33] [0.55,0.48,0.37] 1.45 0.42 0.47 5
5d. [1.31,1.11,0.32] [0.27,0.28,0.13] [0,0,0] 0.91 0.23 0 1
5e [1.49,1.38,0.81] [0.43,0.5,0.33] [0.45,0.39,0.33] 1.23 0.42 0.39 3
5.8 Concluding remarks
This study introduces a methodology to prioritize improvement projects in the healthcare
industry in the context of business excellence models. The proposed approach presents potential
factors that can be used to make such decisions in healthcare and provides insight into criteria
that is vital to a specific system. The model attempts to increase stakeholder’s involvement by
incorporating various stakeholders’ preferences as well as subject matter experts. Additionally,
235
the model utilizes FIS to rank and select among multiple improvement opportunities in
healthcare. The ranking process doesn’t only depend on alternatives’ expected performance but
also on the computed factor weight.
The main advantage of the proposed method is it offers a simple way to gather input from
various participants without the need for them to be in the same room. Note that the study
attempted to minimize bias by relying on multiple responses for each input in both phases. Also,
the approach attempted to mitigate the subjectivity in human judgment by utilizing linguistic
terms instead of numbers. Another distinguishing characteristic of the proposed model is the
scalability. The model can be executed for any number of improvement opportunities or
evaluation factors.
The developed model was tested in the United Arab Emirates with the participation of
subject matter experts and related stakeholders. The model dealt with the participants uncertainty
through utilizing fuzzy logic. Participants’ uncertainty towards a factor is often referred to as a
“grey area” of judgment; Fuzzy logic deals with this uncertainty to ensure a qualified analysis
outcome. Fuzzy logic was used to merge the participants different opinions to overcome the
deficiencies in each and obtain desirable results.
The FDM phase in the model attempted to capture additional factors based on the
experts’ experience and knowledge in the field. FDM utilization can minimize the group pressure
and reduce participants’ biases because of the anonymity of the participants. Thus, the study is
an example of how FDM can be a suitable method for gathering participants’ opinions and
finding a consensus while reducing group pressure. Also, it demonstrates that FDM can be a
236
suitable tool for content validation and for gathering additional information that hasn’t been
explored in the literature.
Post FDM analysis, only eight criteria passed all of the conditions in Hospital A and six
criteria in Hospital B. The vital factors for Hospital A include: health and safety, patient
satisfaction, reputational image, sustainability, top management commitment, critical to quality,
ethical implications, and evidence-based. That represents almost 29% of all of the items on the
original list. The factors meeting the conditions for Hospital B are: health and safety, patient
satisfaction, reputational image, sustainability, resources and information availability, and
creativity and innovation, which represent almost 22% of the total number of items. Common
significant factors selected for both cases include health and safety, reputational image,
sustainability, and patient satisfaction. Health and safety had the highest importance weight in
both cases. The Venn diagrams show that other stakeholders’ perceptions bring more critical
factors into the evaluation process, which can impact the selection of evaluation factors. The rest
of the items failed to achieve the desirable consensus rate; hence they were removed from the list
of important factors. More factors could be added if lower values are defined in the comparison
conditions. For instance, if the average fuzzy number conditions are manipulated to be greater
than 0.55 rather than 0.65, more factors could be retained. Thus, it is important to define
conditions that match system objectives and tolerance.
The FIS phase modeling provided insight into each factor’s membership function. The
interval estimation method was used to model the factor’s membership function to model the
gray areas between the linguistics class’s subset. The variation in experts’ responses can be
explained by the differences in experts’ background, position and years of experience. FIS
237
modeling also clarified the relationship between the inputs and output in each subsystem, the
relationship between the subsystems, and the impact of these relationships on the final result.
The generated surface plots related the inputs to the output and clarified how to maximize the
outputs. For instance, in some cases, altering one input is sufficient to improve the output;
however in other cases both inputs must be changed to improve the output, as revealed by the
plateau planes in the surface plots.
The final output of the framework is not only a prioritization of the improvements, the
subsystem indices shed light on the expected performance of the alternatives from the
perspective of each dimension, which can help the healthcare entity to select an improvement
that matches their objectives.
238
CHAPTER 6: CONCLUSION AND FUTURE RESEARCH
6.1 Conclusion
In the modern era, Healthcare providers are encountering growing pressure in the form of
rising costs of healthcare delivery, financial constraints, and escalating standards of education
and living. Accordingly, the healthcare industry has undergone a profound transformation to
improve service efficiency and cope with patients' high expectations. More and more potential
improvement projects are being considered in the process of healthcare decision making. In
general, the decision of selecting the most effective improvement project from among a wide
range is a complex and time-consuming process. The process includes evaluation of different
potential projects with respect to various criteria, where some criteria must be given weight
according to the organization’s objectives. Some of the major obstacles to conducting an
effective evaluation are how to define important factors, how to quantify it, and how to get
qualitative input from the decision makers, since most of the decision makers prefer using
subjective linguistic terms for object rating.
The fuzzy logic approach is a potential technique to overcome those obstacles. Fuzzy
logic is a relatively contemporary method that can render human thinking and language in
numerical terms and can deals with the ‘fuzziness’ of human judgment Thus, this research
introduces an algorithm for ranking and selecting improvement opportunities in healthcare.
This study sought to develop a framework to prioritize improvement projects in the
healthcare industry in the context of business excellence models, seeking to incorporate different
stakeholders, in addition to the experts, in the selection process. The rationale behind considering
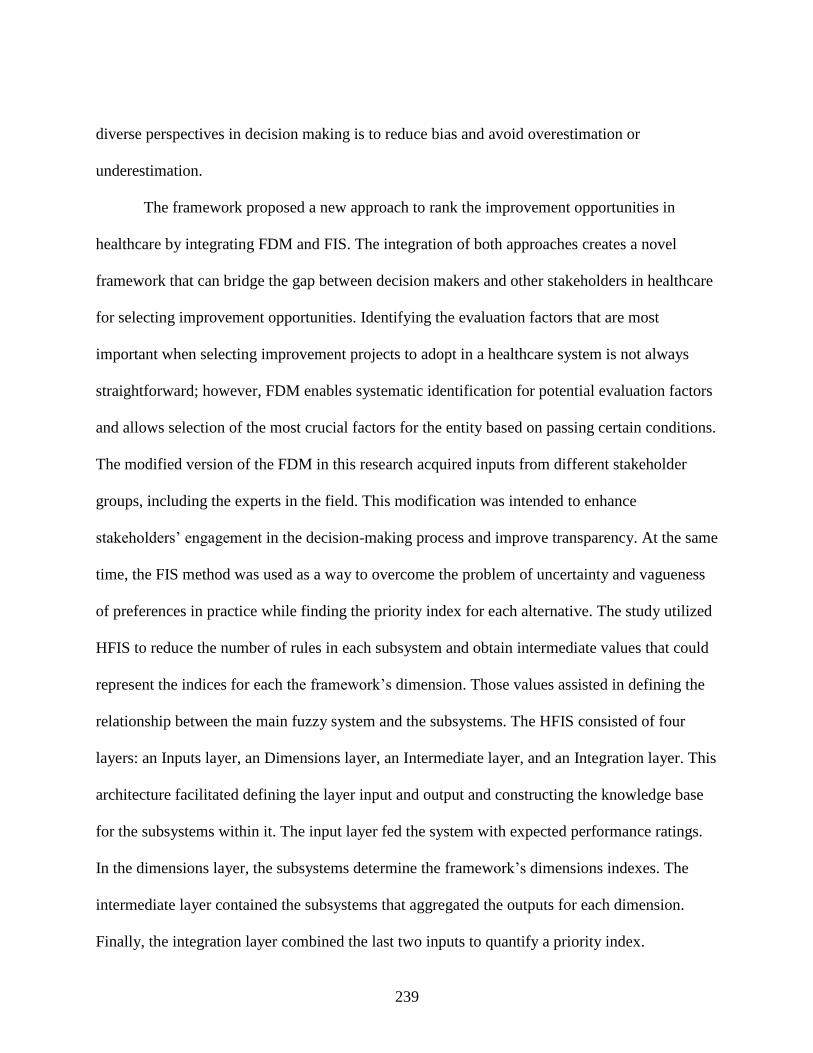
239
diverse perspectives in decision making is to reduce bias and avoid overestimation or
underestimation.
The framework proposed a new approach to rank the improvement opportunities in
healthcare by integrating FDM and FIS. The integration of both approaches creates a novel
framework that can bridge the gap between decision makers and other stakeholders in healthcare
for selecting improvement opportunities. Identifying the evaluation factors that are most
important when selecting improvement projects to adopt in a healthcare system is not always
straightforward; however, FDM enables systematic identification for potential evaluation factors
and allows selection of the most crucial factors for the entity based on passing certain conditions.
The modified version of the FDM in this research acquired inputs from different stakeholder
groups, including the experts in the field. This modification was intended to enhance
stakeholders’ engagement in the decision-making process and improve transparency. At the same
time, the FIS method was used as a way to overcome the problem of uncertainty and vagueness
of preferences in practice while finding the priority index for each alternative. The study utilized
HFIS to reduce the number of rules in each subsystem and obtain intermediate values that could
represent the indices for each the framework’s dimension. Those values assisted in defining the
relationship between the main fuzzy system and the subsystems. The HFIS consisted of four
layers: an Inputs layer, an Dimensions layer, an Intermediate layer, and an Integration layer. This
architecture facilitated defining the layer input and output and constructing the knowledge base
for the subsystems within it. The input layer fed the system with expected performance ratings.
In the dimensions layer, the subsystems determine the framework’s dimensions indexes. The
intermediate layer contained the subsystems that aggregated the outputs for each dimension.
Finally, the integration layer combined the last two inputs to quantify a priority index.
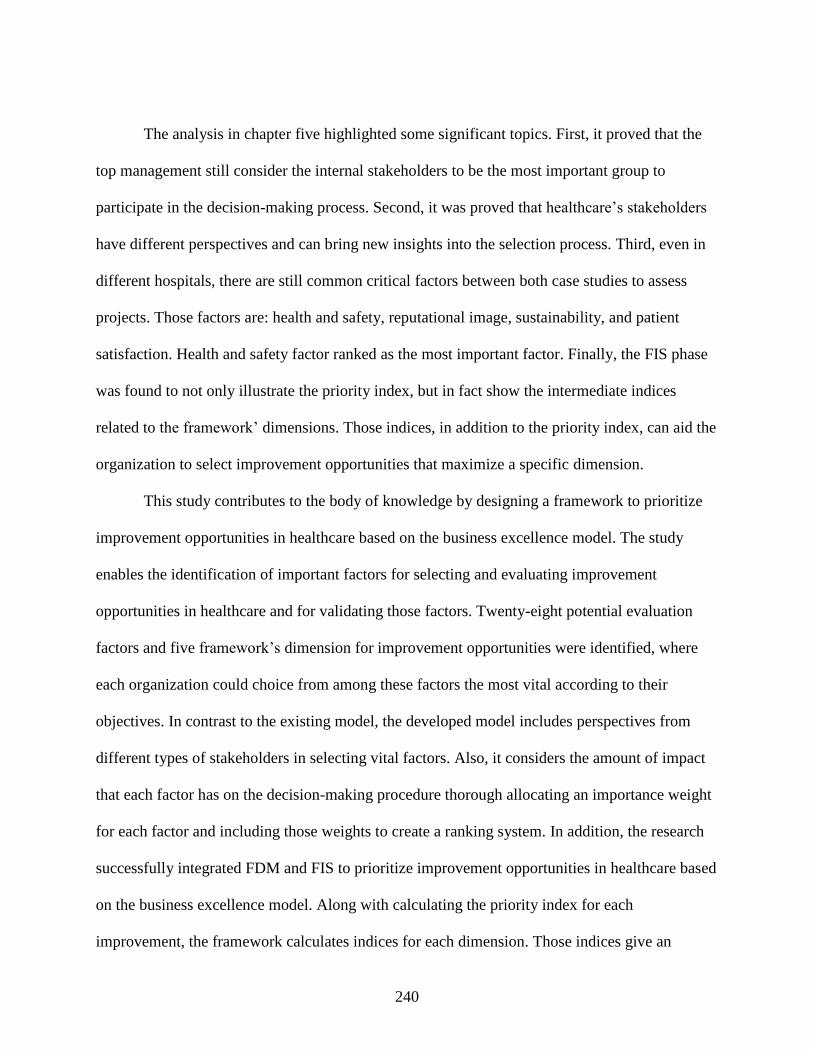
240
The analysis in chapter five highlighted some significant topics. First, it proved that the
top management still consider the internal stakeholders to be the most important group to
participate in the decision-making process. Second, it was proved that healthcare’s stakeholders
have different perspectives and can bring new insights into the selection process. Third, even in
different hospitals, there are still common critical factors between both case studies to assess
projects. Those factors are: health and safety, reputational image, sustainability, and patient
satisfaction. Health and safety factor ranked as the most important factor. Finally, the FIS phase
was found to not only illustrate the priority index, but in fact show the intermediate indices
related to the framework’ dimensions. Those indices, in addition to the priority index, can aid the
organization to select improvement opportunities that maximize a specific dimension.
This study contributes to the body of knowledge by designing a framework to prioritize
improvement opportunities in healthcare based on the business excellence model. The study
enables the identification of important factors for selecting and evaluating improvement
opportunities in healthcare and for validating those factors. Twenty-eight potential evaluation
factors and five framework’s dimension for improvement opportunities were identified, where
each organization could choice from among these factors the most vital according to their
objectives. In contrast to the existing model, the developed model includes perspectives from
different types of stakeholders in selecting vital factors. Also, it considers the amount of impact
that each factor has on the decision-making procedure thorough allocating an importance weight
for each factor and including those weights to create a ranking system. In addition, the research
successfully integrated FDM and FIS to prioritize improvement opportunities in healthcare based
on the business excellence model. Along with calculating the priority index for each
improvement, the framework calculates indices for each dimension. Those indices give an
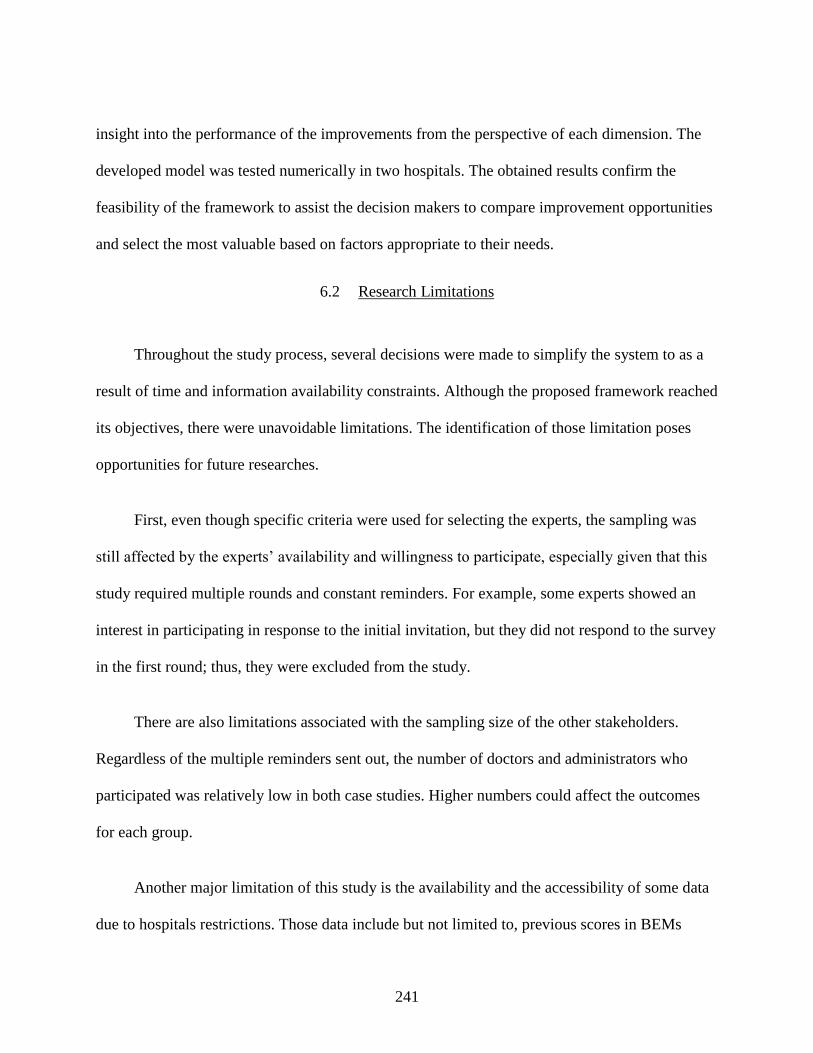
241
insight into the performance of the improvements from the perspective of each dimension. The
developed model was tested numerically in two hospitals. The obtained results confirm the
feasibility of the framework to assist the decision makers to compare improvement opportunities
and select the most valuable based on factors appropriate to their needs.
6.2 Research Limitations
Throughout the study process, several decisions were made to simplify the system to as a
result of time and information availability constraints. Although the proposed framework reached
its objectives, there were unavoidable limitations. The identification of those limitation poses
opportunities for future researches.
First, even though specific criteria were used for selecting the experts, the sampling was
still affected by the experts’ availability and willingness to participate, especially given that this
study required multiple rounds and constant reminders. For example, some experts showed an
interest in participating in response to the initial invitation, but they did not respond to the survey
in the first round; thus, they were excluded from the study.
There are also limitations associated with the sampling size of the other stakeholders.
Regardless of the multiple reminders sent out, the number of doctors and administrators who
participated was relatively low in both case studies. Higher numbers could affect the outcomes
for each group.
Another major limitation of this study is the availability and the accessibility of some data
due to hospitals restrictions. Those data include but not limited to, previous scores in BEMs
242
assessments, the ranking of the BEMs sub-criteria and the opportunities of improvements were
identified in the last evaluation.
Also, another limitation is the lack of possibility of validation through comparison. Since
no previous study used the same approaches and inability to access the internal hospitals’
ranking of the BEMs sub-criteria. Validating the framework through comparison was not an
option. Thus, the study is considered an initial study and its result can’t be generalized yet.
6.3 Future work
Framework development and implementation raised challenges and further questions,
opening the door to the pursuit of plenty of related future efforts. Even though this research can
serve as a valuable input for future studies to build on, replicating it in a different healthcare
setting or another country would be useful to compare the outcomes and make results more
generalizable. This poses as important research opportunity; such a task involves constructing
new membership functions and modifying the framework to cope with the characteristics of the
healthcare system chosen for study. A comparative study could focus on identifying priority
factors in other healthcare settings and test the existence of general patterns or divergence
between different countries or healthcare systems.
Also, surveying top management for who to include as stakeholders in the study yielded a
selection of only internal stakeholders. Future research could incorporate external stakeholders’
perspectives. Patients, for instance, are the end users, and incorporating their inputs might bring
additional factors into the study.
243
A separate research effort could focus on fuzzy rules construction. In this study the fuzzy
rules construction was established using the average between two factors; a future modification
could allow more systematic fuzzy rule construction. Also, the model assumed an equal
importance for all the rules; the study could be modified to assign a different importance to each
rule.
Another possible research opportunity is related to the factors’ weighting process. The
factor weighting in the study relied mainly on a subjective method; however, a comprehensive
approach that combines subjective and objective methods to determine factors’ weight could
enhance the outcome. Also, in total weight calculation, an important weight index for each group
could be included rather than assigning equivalent importance for all the stakeholders. This
differentiation would represent the impact of each stakeholder in the decision-making process.
The effort would focus on defining the importance indices for each group.
Another interesting field of further research is to measure the effectiveness of prioritizing
and implementing the improvement initiatives on the overall results of applying BEMs in
healthcare organization. Also, utilizing the previous BEM assessment for each sub-criterion as
input to the prioritization model, which serve as a feedback loop to the system.

244
APPENDIX A: EFQM AND MBNQA DETAILED CRITERIA AND SUB-
CRITERIA
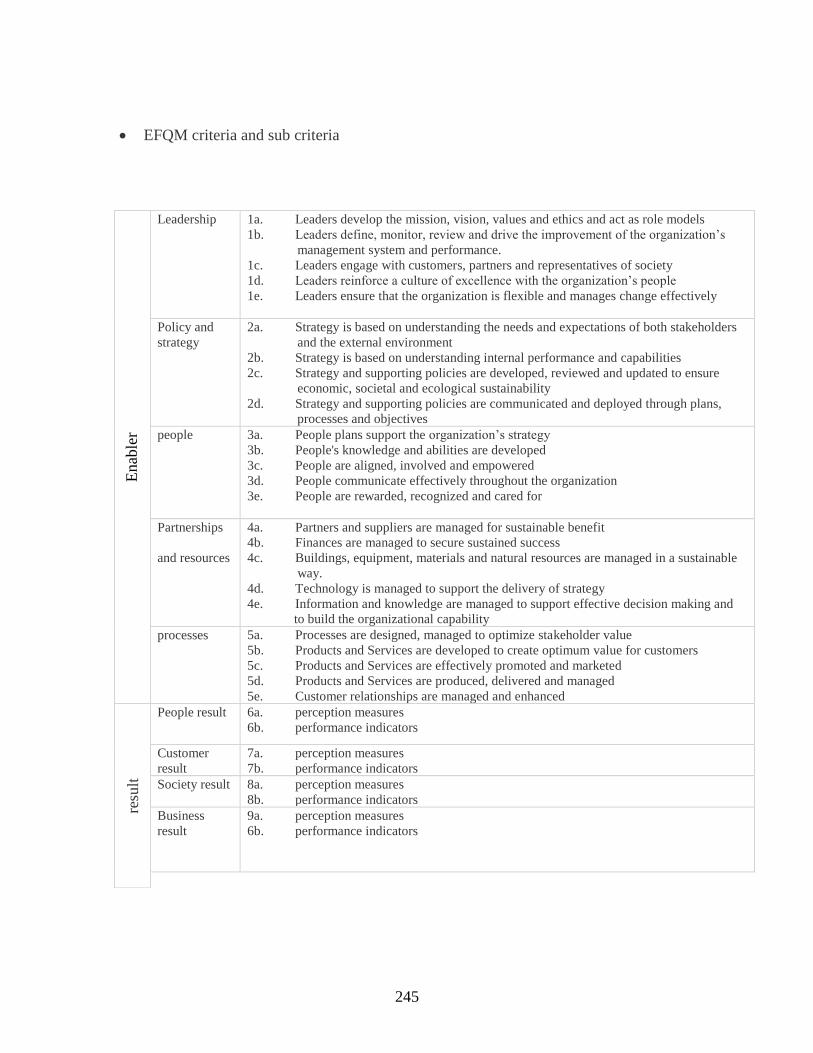
245
• EFQM criteria and sub criteria
Enab
ler
Leadership 1a. Leaders develop the mission, vision, values and ethics and act as role models
1b. Leaders define, monitor, review and drive the improvement of the organization’s
management system and performance.
1c. Leaders engage with customers, partners and representatives of society
1d. Leaders reinforce a culture of excellence with the organization’s people
1e. Leaders ensure that the organization is flexible and manages change effectively
Policy and
strategy
2a. Strategy is based on understanding the needs and expectations of both stakeholders
and the external environment
2b. Strategy is based on understanding internal performance and capabilities
2c. Strategy and supporting policies are developed, reviewed and updated to ensure
economic, societal and ecological sustainability
2d. Strategy and supporting policies are communicated and deployed through plans,
processes and objectives
people 3a. People plans support the organization’s strategy
3b. People's knowledge and abilities are developed
3c. People are aligned, involved and empowered
3d. People communicate effectively throughout the organization
3e. People are rewarded, recognized and cared for
Partnerships
and resources
4a. Partners and suppliers are managed for sustainable benefit
4b. Finances are managed to secure sustained success
4c. Buildings, equipment, materials and natural resources are managed in a sustainable
way.
4d. Technology is managed to support the delivery of strategy
4e. Information and knowledge are managed to support effective decision making and
to build the organizational capability
processes 5a. Processes are designed, managed to optimize stakeholder value
5b. Products and Services are developed to create optimum value for customers
5c. Products and Services are effectively promoted and marketed
5d. Products and Services are produced, delivered and managed
5e. Customer relationships are managed and enhanced
resu
lt
People result 6a. perception measures
6b. performance indicators
Customer
result
7a. perception measures
7b. performance indicators
Society result 8a. perception measures
8b. performance indicators
Business
result
9a. perception measures
6b. performance indicators
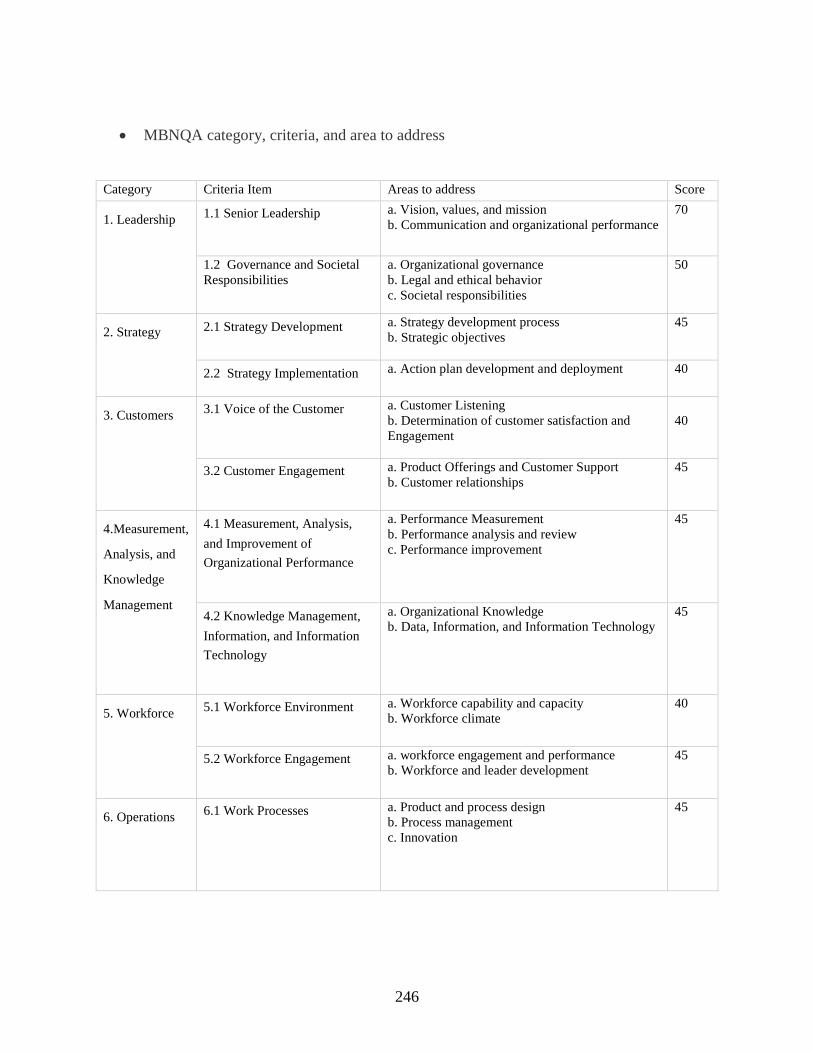
246
• MBNQA category, criteria, and area to address
Category Criteria Item Areas to address Score
1. Leadership 1.1 Senior Leadership a. Vision, values, and mission
b. Communication and organizational performance
70
1.2 Governance and Societal
Responsibilities
a. Organizational governance
b. Legal and ethical behavior
c. Societal responsibilities
50
2. Strategy 2.1 Strategy Development a. Strategy development process
b. Strategic objectives
45
2.2 Strategy Implementation a. Action plan development and deployment 40
3. Customers 3.1 Voice of the Customer a. Customer Listening
b. Determination of customer satisfaction and
Engagement
40
3.2 Customer Engagement
a. Product Offerings and Customer Support
b. Customer relationships
45
4.Measurement,
Analysis, and
Knowledge
Management
4.1 Measurement, Analysis,
and Improvement of
Organizational Performance
a. Performance Measurement
b. Performance analysis and review
c. Performance improvement
45
4.2 Knowledge Management,
Information, and Information
Technology
a. Organizational Knowledge
b. Data, Information, and Information Technology
45
5. Workforce 5.1 Workforce Environment
a. Workforce capability and capacity
b. Workforce climate
40
5.2 Workforce Engagement
a. workforce engagement and performance
b. Workforce and leader development
45
6. Operations 6.1 Work Processes
a. Product and process design
b. Process management
c. Innovation
45
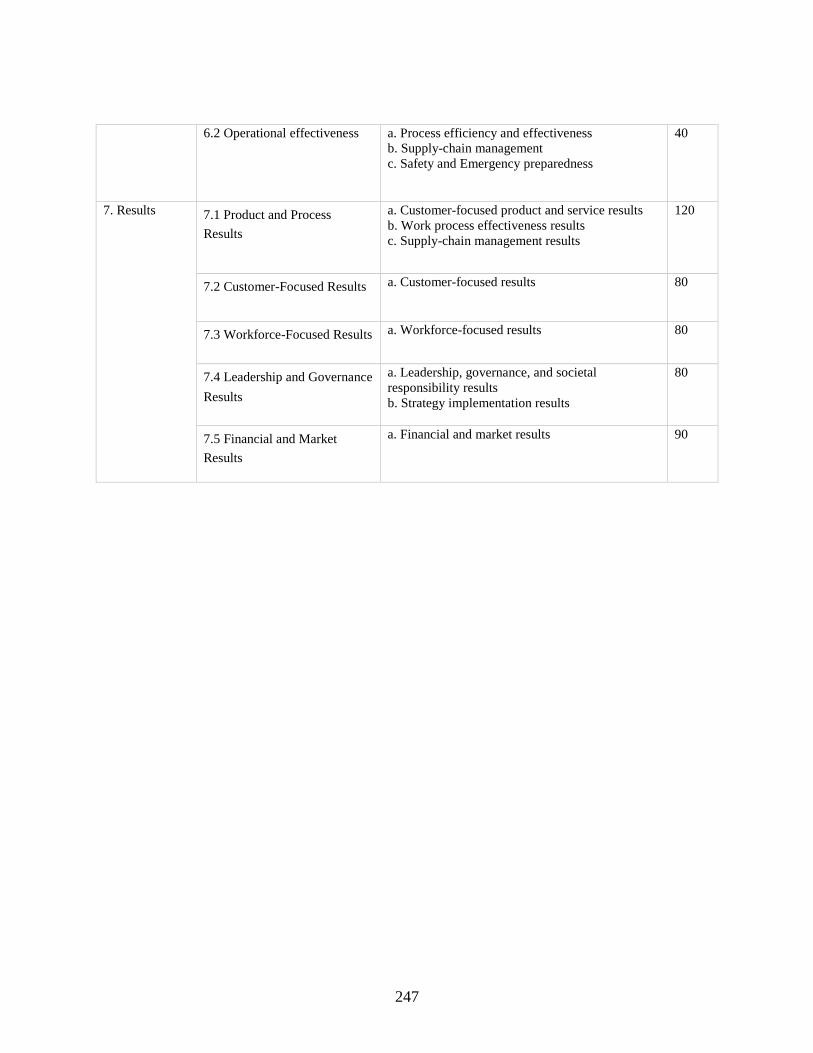
247
6.2 Operational effectiveness
a. Process efficiency and effectiveness
b. Supply-chain management
c. Safety and Emergency preparedness
40
7. Results 7.1 Product and Process
Results
a. Customer-focused product and service results
b. Work process effectiveness results
c. Supply-chain management results
120
7.2 Customer-Focused Results a. Customer-focused results 80
7.3 Workforce-Focused Results a. Workforce-focused results 80
7.4 Leadership and Governance
Results
a. Leadership, governance, and societal
responsibility results
b. Strategy implementation results
80
7.5 Financial and Market
Results
a. Financial and market results 90

248
APPENDIX B: UCF IRB APPROVAL
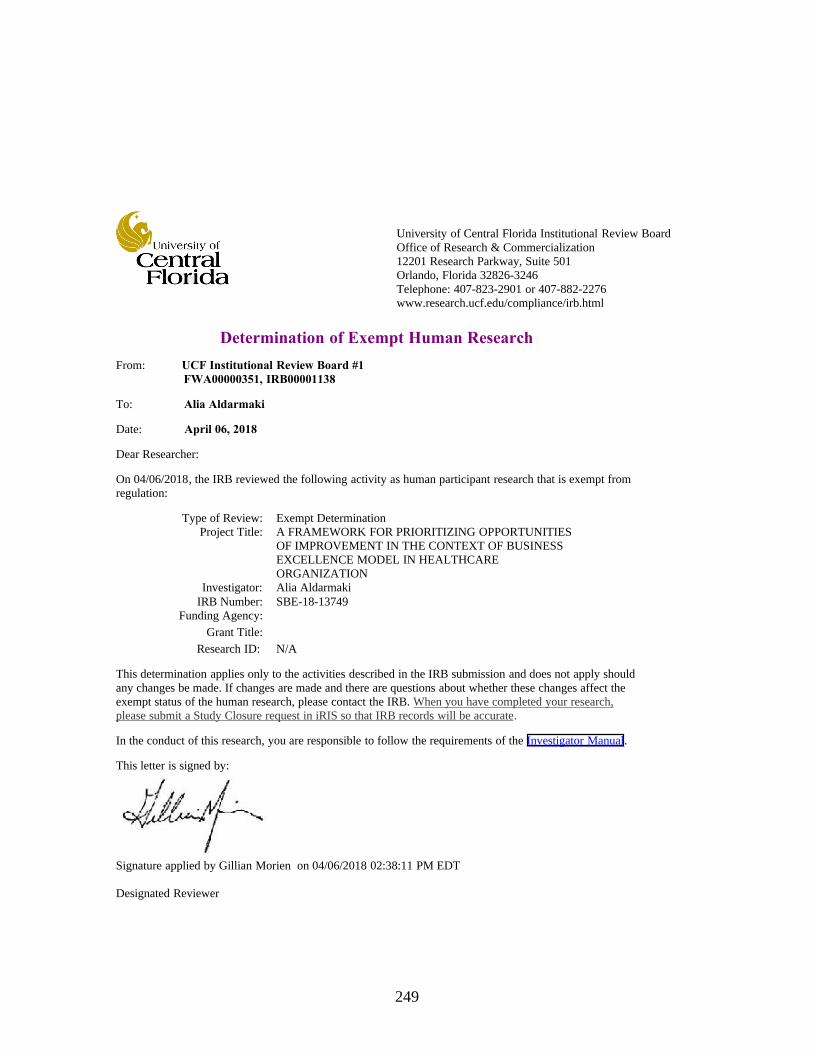
249
Page 1 of 1
Determination of Exempt Human Research
From: UCF Institutional Review Board #1
FWA00000351, IRB00001138
To: Alia Aldarmaki
Date: April 06, 2018
Dear Researcher:
On 04/06/2018, the IRB reviewed the following activity as human participant research that is exempt from
regulation:
Type of Review: Exempt Determination
Project Title: A FRAMEWORK FOR PRIORITIZING OPPORTUNITIES
OF IMPROVEMENT IN THE CONTEXT OF BUSINESS
EXCELLENCE MODEL IN HEALTHCARE
ORGANIZATION
Investigator: Alia Aldarmaki
IRB Number: SBE-18-13749
Funding Agency:
Grant Title:
Research ID: N/A
This determination applies only to the activities described in the IRB submission and does not apply should
any changes be made. If changes are made and there are questions about whether these changes affect the
exempt status of the human research, please contact the IRB. When you have completed your research,
please submit a Study Closure request in iRIS so that IRB records will be accurate.
In the conduct of this research, you are responsible to follow the requirements of the Investigator Manual.
This letter is signed by:
Signature applied by Gillian Morien on 04/06/2018 02:38:11 PM EDT
Designated Reviewer
University of Central Florida Institutional Review Board
Office of Research & Commercialization
12201 Research Parkway, Suite 501
Orlando, Florida 32826-3246
Telephone: 407-823-2901 or 407-882-2276
www.research.ucf.edu/compliance/irb.html

250
APPENDIX C: SEHA APPROVAL

251

252
Date: 23/11/2017
To: Managers of Training and Career Development
Health facilities belonging to “SEHA”
Topic: Facilitating Student Research Task
Greetings
Kindly be advised that the below mentioned student has been approved and allowed to complete
her research study at the health facilities of SEHA.
Please kindly cooperate with her to facilitate the task.
▪ Student’s Name: Alia Hamad Rashied AlDarmaki
▪ Course of Study: PhD in Industrial Engineering and Management.
▪ University: Engineering and Computer Science College, University of Florida, USA.
▪ Dissertation Title: A FRAMEWORK FOR PRIORITIZING OPPORTUNITIES OF
IMPROVEMENT IN THE CONTEXT OF A BUSINESS EXCELLENCE MODEL IN A
HEALTHCARE ORGANIZATION
The following research and investigation procedures are required:
• Direct communication with some leadership teams.
• Obtaining the results of previous surveys, if any.
• Responsiveness of all departments to various questionnaires and interviews of the study for
the purpose of results’ measuring.
Yours sincerely
Amal Saeed Al Junaibi
Acting Director of Training and Career Development
Headquarter

253
APPENDIX D: DUBAI HEALTH AUTHORITY APPROVAL

254
UNIVERSITY STUDENT RESEARCH EVALUATION COMMITTEE
APPROVAL LETTER
1 | P a g e
Reference: USREC02-04/PhD/2018 18 Feb 2018
Dear Ms. Alia Aldarmaki,
Title of Project:
“A framework for prioritizing opportunities of improvement in the context of business
Excellence model in healthcare organization”
Thank you for your request to conduct research in Dubai Health Authority. Your research
Proposal has been reviewed by University Student Research Evaluation Committee, and I am
pleased to inform you that your research proposal has been approved to be conducted in Dubai
Health Authority.
Please note that the following standard requirements are integral part of the approval:
1. This approval will be for a period of 1 year. At the end of this period, if the project has
been completed, abandoned, discontinued or not completed for any reason you are
required to inform the University Students Research Evaluation Committee.
2. Please remember that you must notify the Committee via email regarding any alteration
to the Project protocol.
3. Please apply for ethical approval through [email protected]. After getting your ethical
committee approval, you can officially start your research and data assembly.
4. Individuals or organizations conducting research studies in the Dubai Health Authority
are expected to provide a copy of the research results to the committee following the
completion of the study.
We wish you every success with your studies and beyond.
Yours sincerely
Dr. Mahera Abdulrahman, MD, MSc., PhD
Chair, University Students Research Evaluation Committee
Department of Medical Education - Dubai Health Authority
Email: [email protected]

255
APPENDIX E: ETHIC COMMITTEE APPROVAL

256

257

258

259
APPENDIX F: STAKEHOLDERS’ ANALYSIS
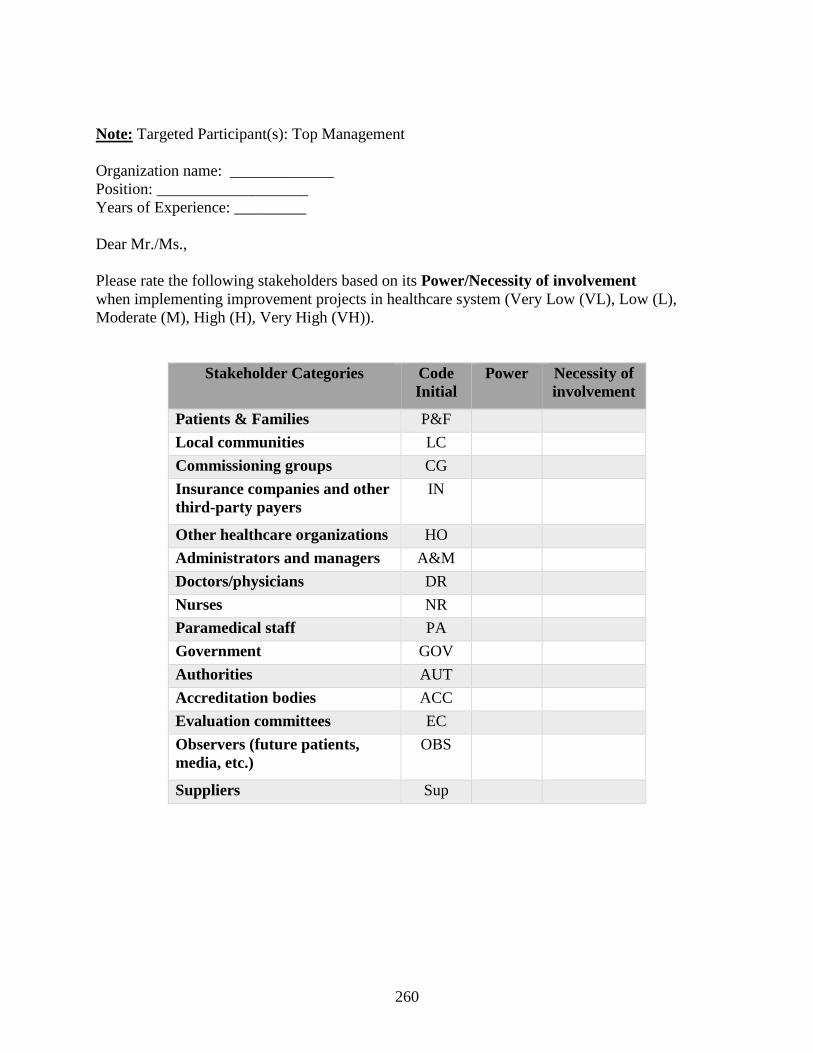
260
Note: Targeted Participant(s): Top Management
Organization name: _____________
Position: ___________________
Years of Experience: _________
Dear Mr./Ms.,
Please rate the following stakeholders based on its Power/Necessity of involvement
when implementing improvement projects in healthcare system (Very Low (VL), Low (L),
Moderate (M), High (H), Very High (VH)).
Stakeholder Categories Code
Initial
Power Necessity of
involvement
Patients & Families P&F
Local communities LC
Commissioning groups CG
Insurance companies and other
third-party payers
IN
Other healthcare organizations HO
Administrators and managers A&M
Doctors/physicians DR
Nurses NR
Paramedical staff PA
Government GOV
Authorities AUT
Accreditation bodies ACC
Evaluation committees EC
Observers (future patients,
media, etc.)
OBS
Suppliers Sup

261
APPENDIX G: FUZZY DELPHI SURVEYS
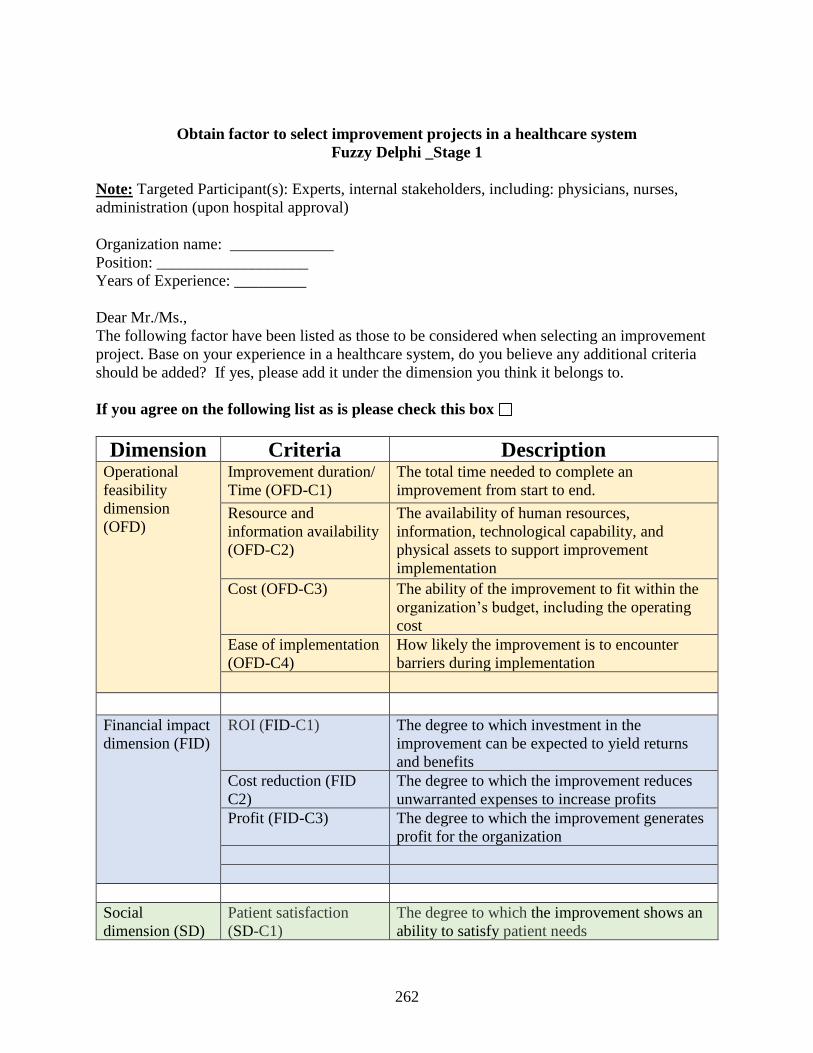
262
Obtain factor to select improvement projects in a healthcare system
Fuzzy Delphi _Stage 1
Note: Targeted Participant(s): Experts, internal stakeholders, including: physicians, nurses,
administration (upon hospital approval)
Organization name: _____________
Position: ___________________
Years of Experience: _________
Dear Mr./Ms.,
The following factor have been listed as those to be considered when selecting an improvement
project. Base on your experience in a healthcare system, do you believe any additional criteria
should be added? If yes, please add it under the dimension you think it belongs to.
If you agree on the following list as is please check this box
Dimension Criteria Description Operational
feasibility
dimension
(OFD)
Improvement duration/
Time (OFD-C1)
The total time needed to complete an
improvement from start to end.
Resource and
information availability
(OFD-C2)
The availability of human resources,
information, technological capability, and
physical assets to support improvement
implementation
Cost (OFD-C3) The ability of the improvement to fit within the
organization’s budget, including the operating
cost
Ease of implementation
(OFD-C4)
How likely the improvement is to encounter
barriers during implementation
Financial impact
dimension (FID)
ROI (FID-C1) The degree to which investment in the
improvement can be expected to yield returns
and benefits
Cost reduction (FID
C2)
The degree to which the improvement reduces
unwarranted expenses to increase profits
Profit (FID-C3) The degree to which the improvement generates
profit for the organization
Social
dimension (SD)
Patient satisfaction
(SD-C1)
The degree to which the improvement shows an
ability to satisfy patient needs
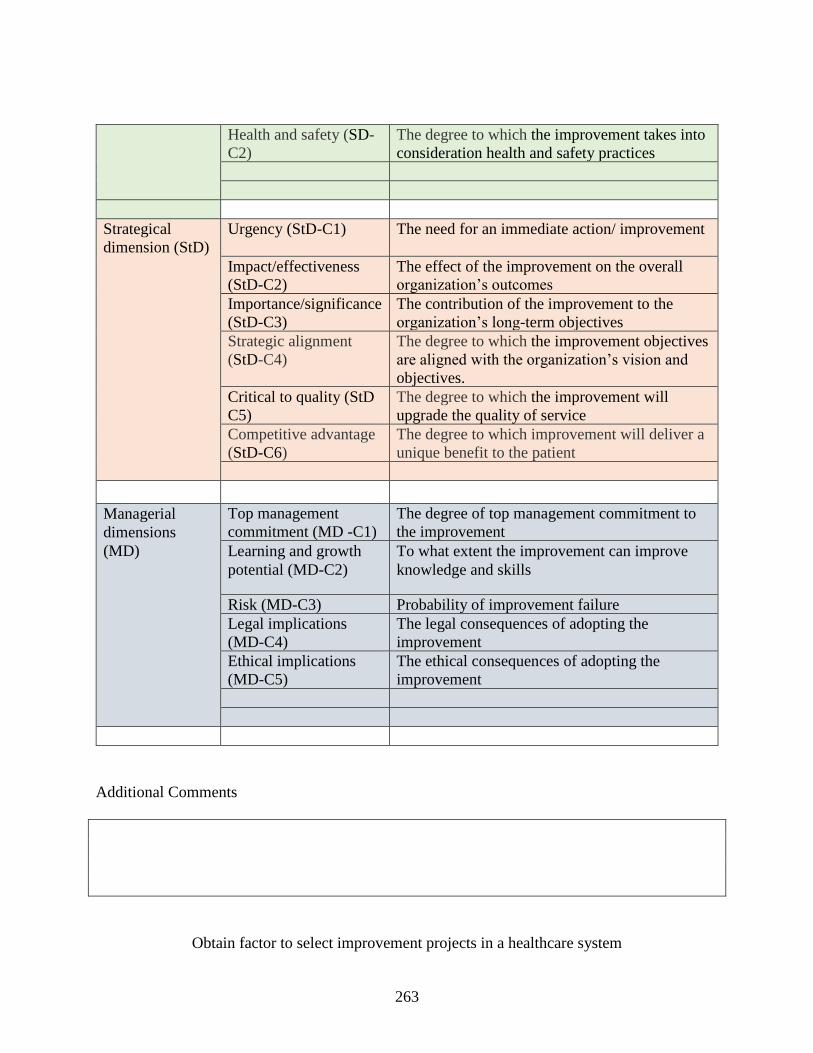
263
Health and safety (SD-
C2)
The degree to which the improvement takes into
consideration health and safety practices
Strategical
dimension (StD)
Urgency (StD-C1) The need for an immediate action/ improvement
Impact/effectiveness
(StD-C2)
The effect of the improvement on the overall
organization’s outcomes
Importance/significance
(StD-C3)
The contribution of the improvement to the
organization’s long-term objectives
Strategic alignment
(StD-C4)
The degree to which the improvement objectives
are aligned with the organization’s vision and
objectives.
Critical to quality (StD
C5)
The degree to which the improvement will
upgrade the quality of service
Competitive advantage
(StD-C6)
The degree to which improvement will deliver a
unique benefit to the patient
Managerial
dimensions
(MD)
Top management
commitment (MD -C1)
The degree of top management commitment to
the improvement
Learning and growth
potential (MD-C2)
To what extent the improvement can improve
knowledge and skills
Risk (MD-C3) Probability of improvement failure
Legal implications
(MD-C4)
The legal consequences of adopting the
improvement
Ethical implications
(MD-C5)
The ethical consequences of adopting the
improvement
Additional Comments
Obtain factor to select improvement projects in a healthcare system
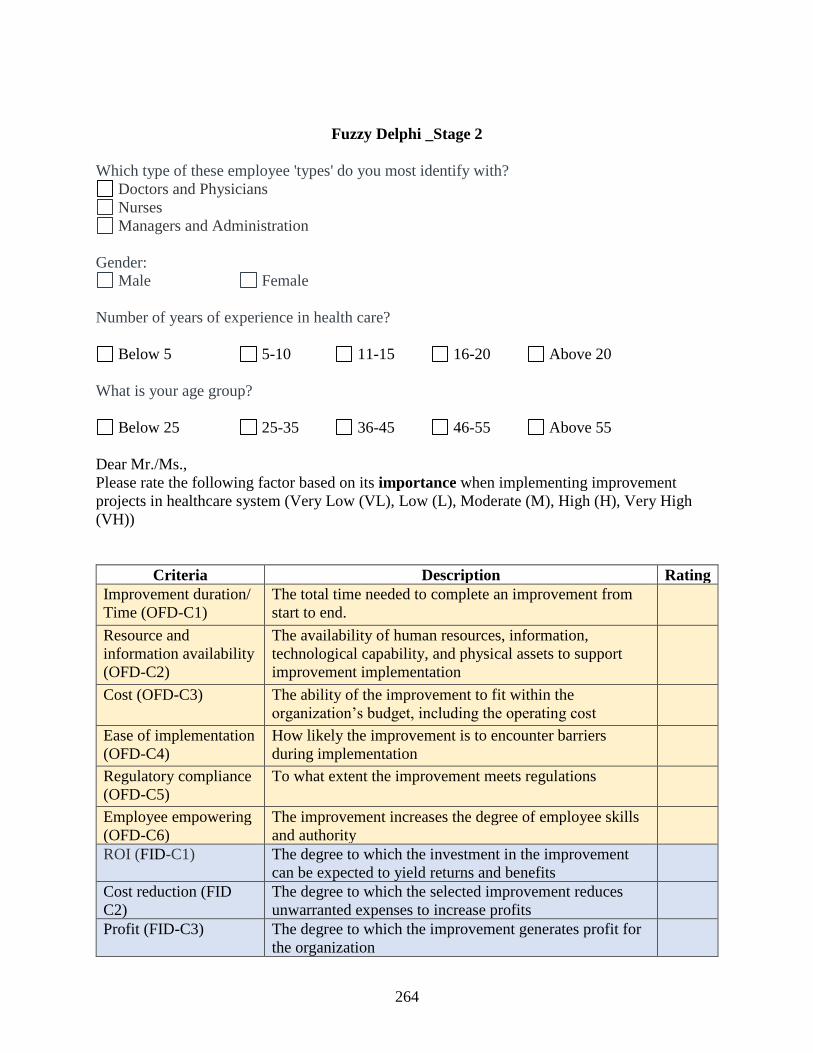
264
Fuzzy Delphi _Stage 2
Which type of these employee 'types' do you most identify with?
Doctors and Physicians
Nurses
Managers and Administration
Gender:
Male Female
Number of years of experience in health care?
Below 5 5-10 11-15 16-20 Above 20
What is your age group?
Below 25 25-35 36-45 46-55 Above 55
Dear Mr./Ms.,
Please rate the following factor based on its importance when implementing improvement
projects in healthcare system (Very Low (VL), Low (L), Moderate (M), High (H), Very High
(VH))
Criteria Description Rating
Improvement duration/
Time (OFD-C1)
The total time needed to complete an improvement from
start to end.
Resource and
information availability
(OFD-C2)
The availability of human resources, information,
technological capability, and physical assets to support
improvement implementation
Cost (OFD-C3) The ability of the improvement to fit within the
organization’s budget, including the operating cost
Ease of implementation
(OFD-C4)
How likely the improvement is to encounter barriers
during implementation
Regulatory compliance
(OFD-C5)
To what extent the improvement meets regulations
Employee empowering
(OFD-C6)
The improvement increases the degree of employee skills
and authority
ROI (FID-C1) The degree to which the investment in the improvement
can be expected to yield returns and benefits
Cost reduction (FID
C2)
The degree to which the selected improvement reduces
unwarranted expenses to increase profits
Profit (FID-C3) The degree to which the improvement generates profit for
the organization
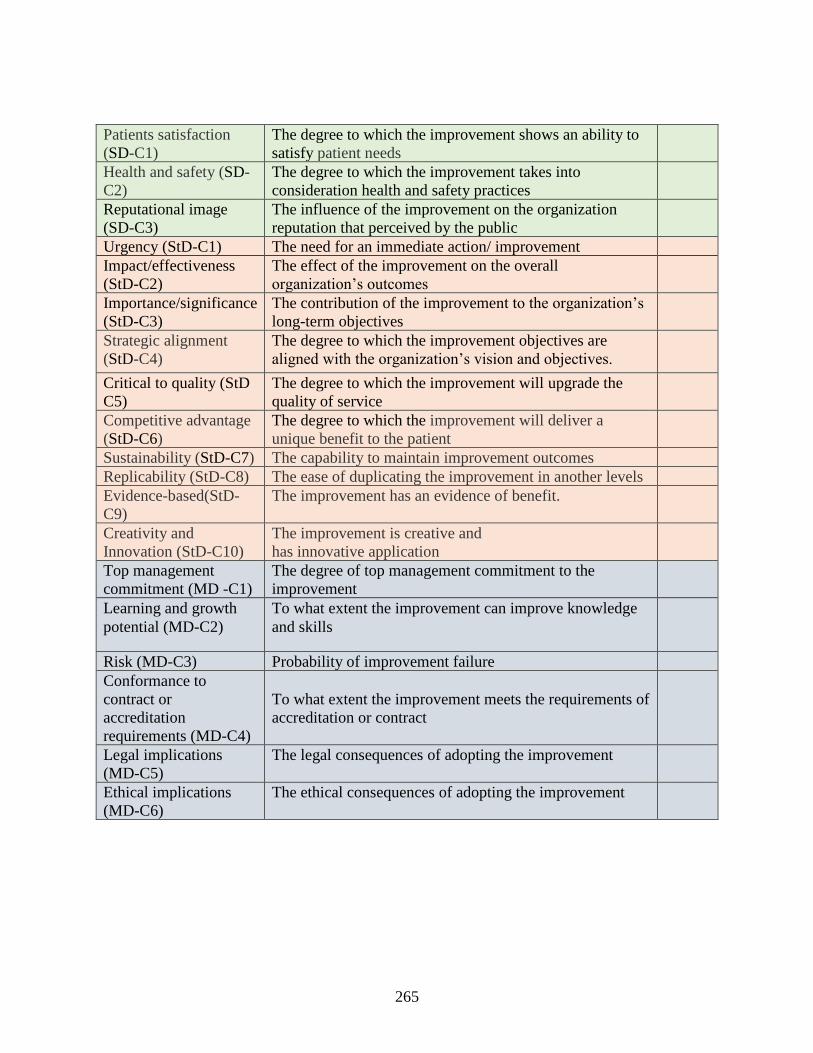
265
Patients satisfaction
(SD-C1)
The degree to which the improvement shows an ability to
satisfy patient needs
Health and safety (SD-
C2)
The degree to which the improvement takes into
consideration health and safety practices
Reputational image
(SD-C3)
The influence of the improvement on the organization
reputation that perceived by the public
Urgency (StD-C1) The need for an immediate action/ improvement
Impact/effectiveness
(StD-C2)
The effect of the improvement on the overall
organization’s outcomes
Importance/significance
(StD-C3)
The contribution of the improvement to the organization’s
long-term objectives
Strategic alignment
(StD-C4)
The degree to which the improvement objectives are
aligned with the organization’s vision and objectives.
Critical to quality (StD
C5)
The degree to which the improvement will upgrade the
quality of service
Competitive advantage
(StD-C6)
The degree to which the improvement will deliver a
unique benefit to the patient
Sustainability (StD-C7) The capability to maintain improvement outcomes
Replicability (StD-C8) The ease of duplicating the improvement in another levels
Evidence-based(StD-
C9)
The improvement has an evidence of benefit.
Creativity and
Innovation (StD-C10)
The improvement is creative and
has innovative application
Top management
commitment (MD -C1)
The degree of top management commitment to the
improvement
Learning and growth
potential (MD-C2)
To what extent the improvement can improve knowledge
and skills
Risk (MD-C3) Probability of improvement failure
Conformance to
contract or
accreditation
requirements (MD-C4)
To what extent the improvement meets the requirements of
accreditation or contract
Legal implications
(MD-C5)
The legal consequences of adopting the improvement
Ethical implications
(MD-C6)
The ethical consequences of adopting the improvement
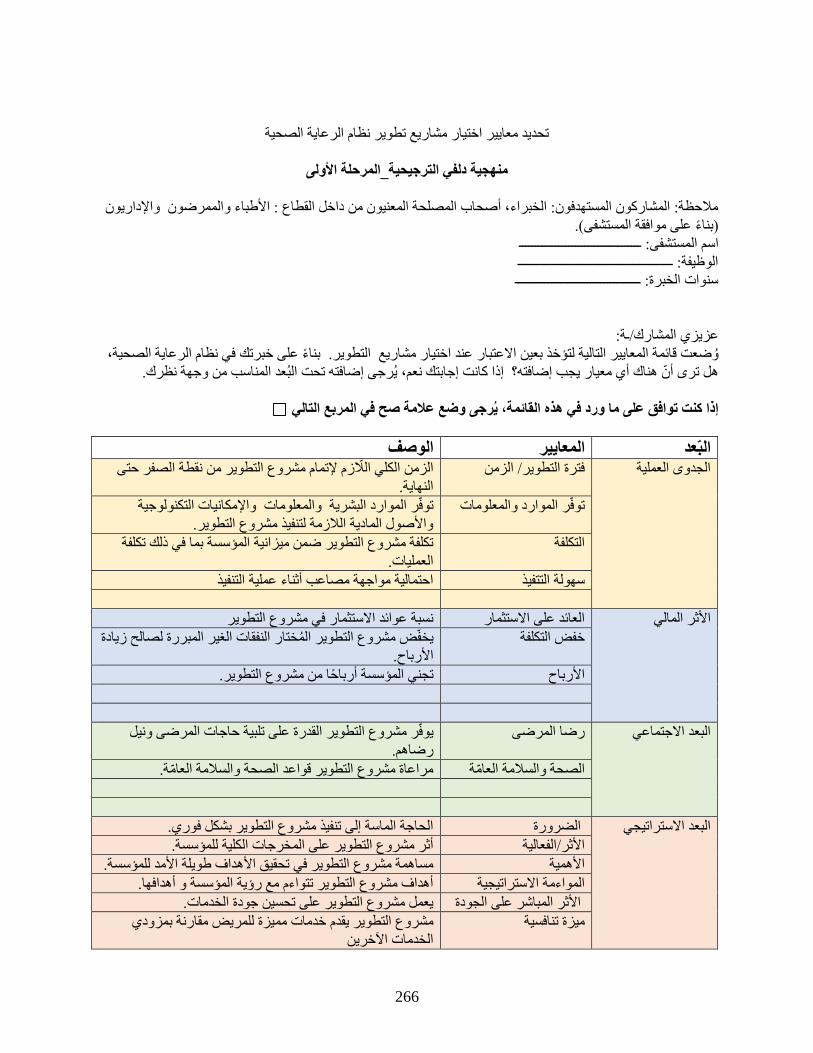
266
تحديد معايير اختيار مشاريع تطوير نظام الرعاية الصحية
منهجية دلفي الترجيحية_المرحلة الأولى
ملاحظة: المشاركون المستهدفون: الخبراء، أصحاب المصلحة المعنيون من داخل القطاع : الأطباء والممرضون والإداريون
)بناء على موافقة المستشفى(.
مستشفى: ـــــــــــــــــــــــــــــــــــــاسم ال
الوظيفة: ـــــــــــــــــــــــــــــــــــــــــــــــ
سنوات الخبرة: ــــــــــــــــــــــــــــــــــــــ
عزيزي المشارك/ـة:
بناء على خبرتك في نظام الرعاية الصحية، وضعت قائمة المعايير التالية لتؤخذ بعين الاعتبار عند اختيار مشاريع التطوير.
هل ترى أن هناك أي معيار يجب إضافته؟ إذا كانت إجابتك نعم، يرجى إضافته تحت البعد المناسب من وجهة نظرك.
إذا كنت توافق على ما ورد في هذه القائمة، يرجى وضع علامة صح في المربع التالي
الوصف اييرالمع البعدالزمن الكلي اللازم لإتمام مشروع التطوير من نقطة الصفر حتى فترة التطوير/ الزمن الجدوى العملية
النهاية.
توفر الموارد البشرية والمعلومات والإمكانيات التكنولوجية توفر الموارد والمعلومات
والأصول المادية اللازمة لتنفيذ مشروع التطوير.
تكلفة مشروع التطوير ضمن ميزانية المؤسسة بما في ذلك تكلفة كلفة الت
العمليات.
احتمالية مواجهة مصاعب أثناء عملية التنفيذ سهولة التتفيذ
نسبة عوائد الاستثمار في مشروع التطوير العائد على الاستثمار الأثر المالي
فقات الغير المبررة لصالح زيادة يخفض مشروع التطوير المختار الن خفض التكلفة
الأرباح.
تجني المؤسسة أرباحا من مشروع التطوير. الأرباح
يوفر مشروع التطوير القدرة على تلبية حاجات المرضى ونيل رضا المرضى البعد الاجتماعي
رضاهم.
لامة العامة.مراعاة مشروع التطوير قواعد الصحة والس الصحة والسلامة العامة
الحاجة الماسة إلى تنفيذ مشروع التطوير بشكل فوري. الضرورة البعد الاستراتيجي
أثر مشروع التطوير على المخرجات الكلية للمؤسسة. الأثر/الفعالية
مساهمة مشروع التطوير في تحقيق الأهداف طويلة الأمد للمؤسسة. الأهمية
أهداف مشروع التطوير تتواءم مع رؤية المؤسسة و أهدافها. ية المواءمة الاستراتيج
يعمل مشروع التطوير على تحسين جودة الخدمات. الأثر المباشر على الجودة
مقارنة بمزودي خدمات مميزة للمريض مشروع التطوير يقدم ميزة تنافسية
الخدمات الآخرين
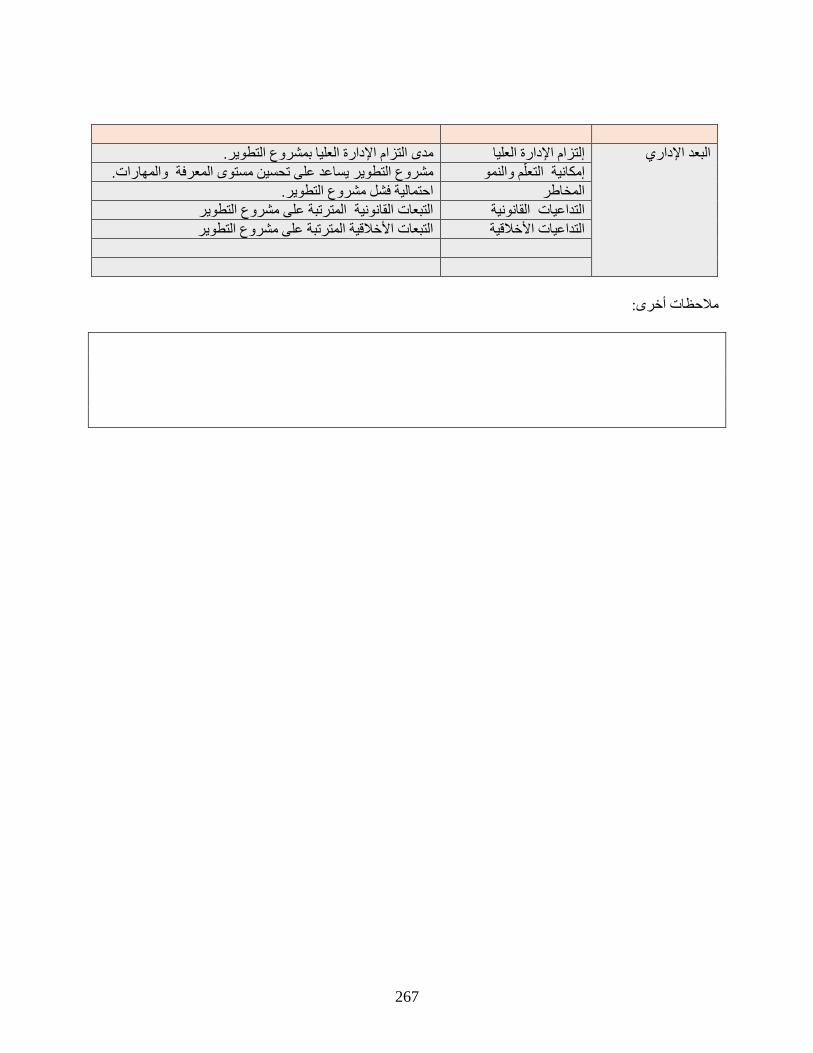
267
مدى التزام الإدارة العليا بمشروع التطوير. إلتزام الإدارة العليا البعد الإداري
مشروع التطوير يساعد على تحسين مستوى المعرفة والمهارات. إمكانية التعلم والنمو
احتمالية فشل مشروع التطوير. المخاطر
التبعات القانونية المترتبة على مشروع التطوير التداعيات القانونية
التبعات الأخلاقية المترتبة على مشروع التطوير ة التداعيات الأخلاقي
ملاحظات أخرى:
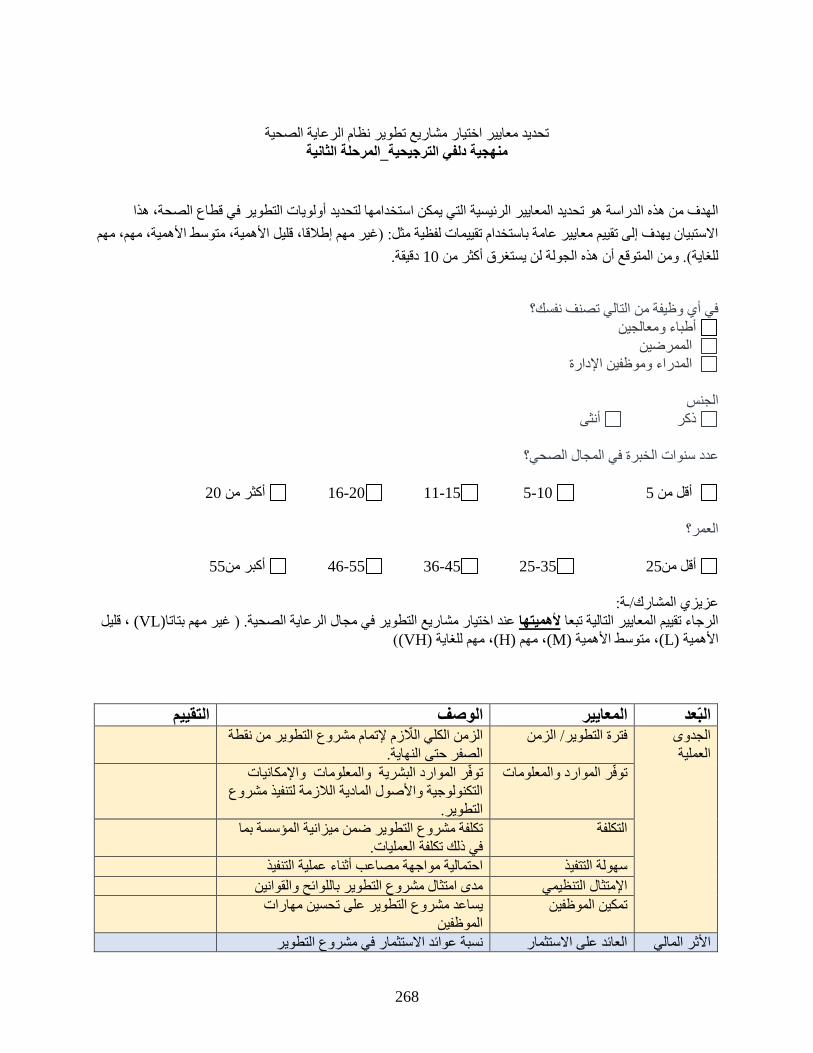
268
تحديد معايير اختيار مشاريع تطوير نظام الرعاية الصحية
منهجية دلفي الترجيحية_المرحلة الثانية
أولويات التطوير في قطاع الصحة، هذا التي يمكن استخدامها لتحديد الهدف من هذه الدراسة هو تحديد المعايير الرئيسية
الاستبيان يهدف إلى تقييم معايير عامة باستخدام تقييمات لفظية مثل: )غير مهم إطلاقا، قليل الأهمية، متوسط الأهمية، مهم، مهم
دقيقة. 10ذه الجولة لن يستغرق أكثر من للغاية(. ومن المتوقع أن ه
في أي وظيفة من التالي تصنف نفسك؟
أطباء ومعالجين
الممرضين
المدراء وموظفين الإدارة
الجنس
أنثى ذكر
ي المجال الصحي؟عدد سنوات الخبرة ف
20 أكثر من 20-16 15-11 10-5 5أقل من
العمر؟
55 أكبر من 55-46 45-36 35-25 25 أقل من
عزيزي المشارك/ـة:
، قليل (VL)عند اختيار مشاريع التطوير في مجال الرعاية الصحية. ) غير مهم بتاتا لأهميتهاالرجاء تقييم المعايير التالية تبعا
((VH)، مهم للغاية (H)، مهم (M)، متوسط الأهمية (L)الأهمية
التقييم الوصف ييرالمعا البعدالجدوى
العملية
الزمن الكلي اللازم لإتمام مشروع التطوير من نقطة فترة التطوير/ الزمن
الصفر حتى النهاية.
توفر الموارد البشرية والمعلومات والإمكانيات توفر الموارد والمعلومات
التكنولوجية والأصول المادية اللازمة لتنفيذ مشروع
ير. التطو
تكلفة مشروع التطوير ضمن ميزانية المؤسسة بما التكلفة
في ذلك تكلفة العمليات.
احتمالية مواجهة مصاعب أثناء عملية التنفيذ سهولة التتفيذ
مدى امتثال مشروع التطوير باللوائح والقوانين الإمتثال التنظيمي
مهارات تحسينيساعد مشروع التطوير على تمكين الموظفين
الموظفين
نسبة عوائد الاستثمار في مشروع التطوير العائد على الاستثمار الأثر المالي
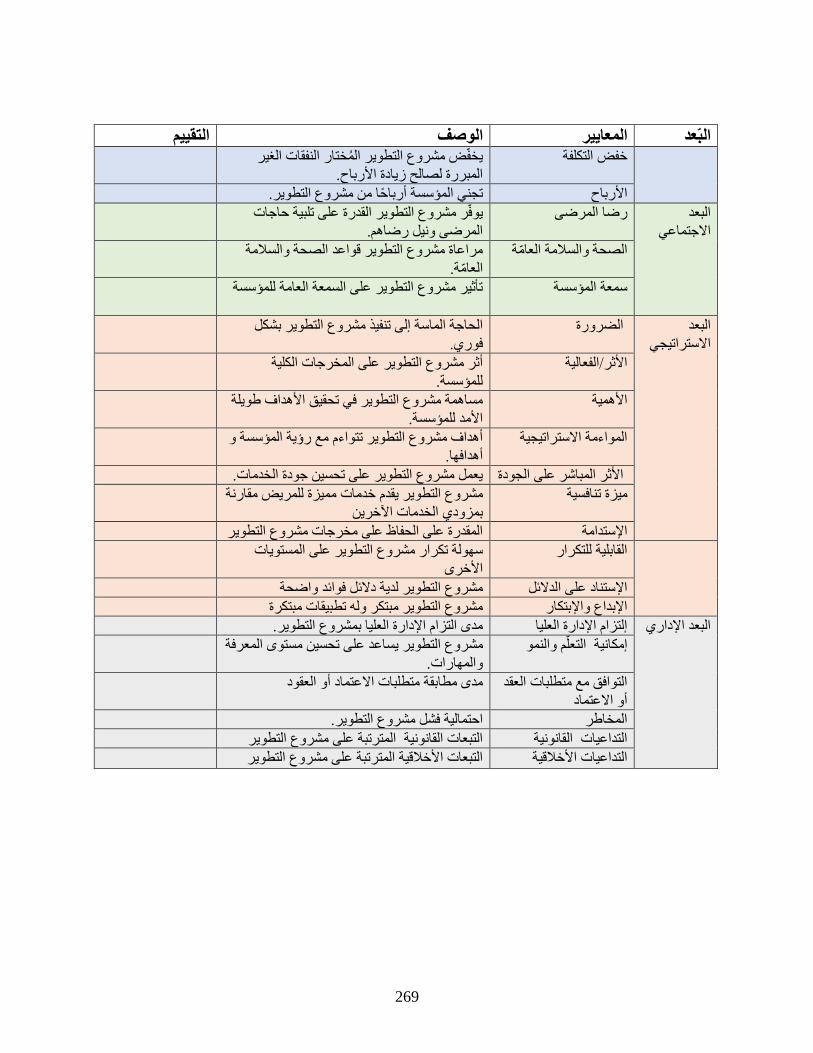
269
التقييم الوصف ييرالمعا البعديخفض مشروع التطوير المختار النفقات الغير خفض التكلفة
المبررة لصالح زيادة الأرباح.
تجني المؤسسة أرباحا من مشروع التطوير. الأرباح
البعد
الاجتماعي
يوفر مشروع التطوير القدرة على تلبية حاجات ا المرضى رض
المرضى ونيل رضاهم.
مراعاة مشروع التطوير قواعد الصحة والسلامة الصحة والسلامة العامة
العامة.
تأثير مشروع التطوير على السمعة العامة للمؤسسة سمعة المؤسسة
البعد
الاستراتيجي
إلى تنفيذ مشروع التطوير بشكل الحاجة الماسة الضرورة
فوري.
أثر مشروع التطوير على المخرجات الكلية الأثر/الفعالية
للمؤسسة.
مساهمة مشروع التطوير في تحقيق الأهداف طويلة الأهمية
الأمد للمؤسسة.
أهداف مشروع التطوير تتواءم مع رؤية المؤسسة و المواءمة الاستراتيجية
أهدافها.
يعمل مشروع التطوير على تحسين جودة الخدمات. الأثر المباشر على الجودة
مقارنة خدمات مميزة للمريض مشروع التطوير يقدم ميزة تنافسية
بمزودي الخدمات الآخرين
المقدرة على الحفاظ على مخرجات مشروع التطوير الإستدامة
ير على المستويات سهولة تكرار مشروع التطو القابلية للتكرار
الأخرى
مشروع التطوير لدية دلائل فوائد واضحة الإستناد على الدلائل
مشروع التطوير مبتكر وله تطبيقات مبتكرة الإبداع والإبتكار
البعد الإداري
مدى التزام الإدارة العليا بمشروع التطوير. إلتزام الإدارة العليا
روع التطوير يساعد على تحسين مستوى المعرفة مش إمكانية التعلم والنمو
والمهارات.
التوافق مع متطلبات العقد
أو الاعتماد
مدى مطابقة متطلبات الاعتماد أو العقود
احتمالية فشل مشروع التطوير. المخاطر
التبعات القانونية المترتبة على مشروع التطوير التداعيات القانونية
التبعات الأخلاقية المترتبة على مشروع التطوير الأخلاقية التداعيات

270
APPENDIX H: BEM’s SUB-CRITERIA RATING
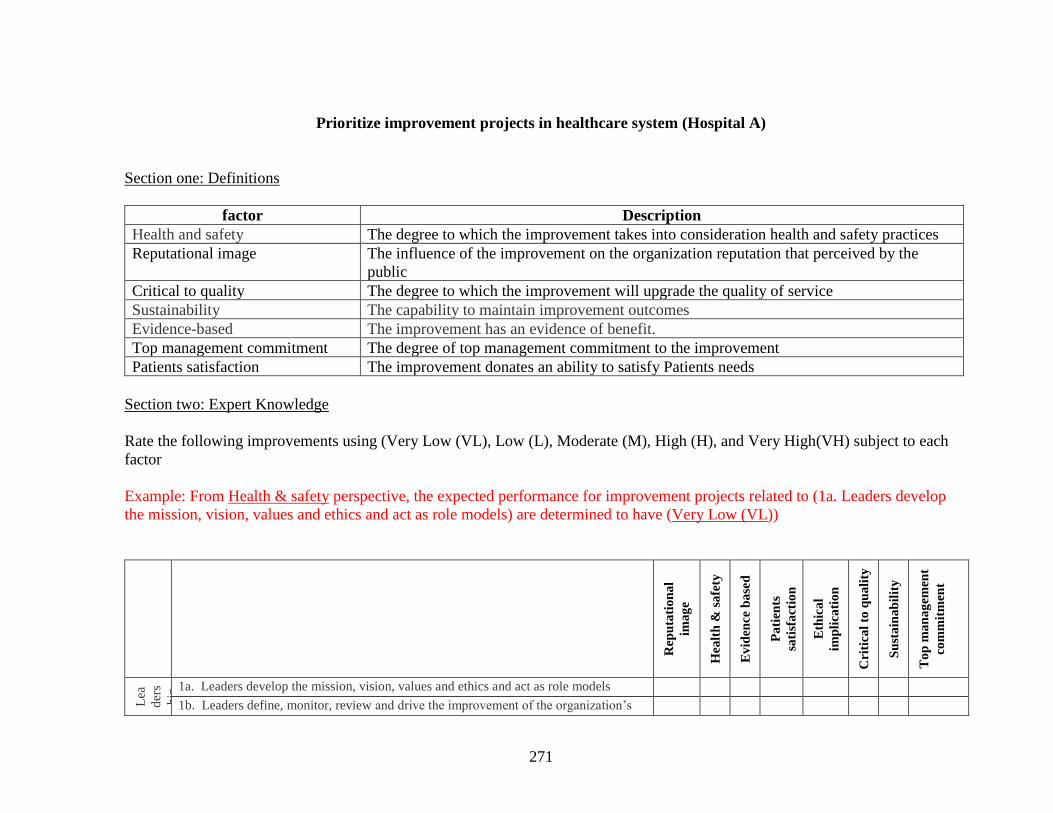
271
Prioritize improvement projects in healthcare system (Hospital A)
Section one: Definitions
factor Description
Health and safety The degree to which the improvement takes into consideration health and safety practices
Reputational image The influence of the improvement on the organization reputation that perceived by the
public
Critical to quality The degree to which the improvement will upgrade the quality of service
Sustainability The capability to maintain improvement outcomes
Evidence-based The improvement has an evidence of benefit.
Top management commitment The degree of top management commitment to the improvement
Patients satisfaction The improvement donates an ability to satisfy Patients needs
Section two: Expert Knowledge
Rate the following improvements using (Very Low (VL), Low (L), Moderate (M), High (H), and Very High(VH) subject to each
factor
Example: From Health & safety perspective, the expected performance for improvement projects related to (1a. Leaders develop
the mission, vision, values and ethics and act as role models) are determined to have (Very Low (VL))
Rep
uta
tio
na
l
ima
ge
Hea
lth
& s
afe
ty
Ev
iden
ce
ba
sed
Pa
tien
ts
sati
sfa
ctio
n
E
thic
al
imp
lica
tio
n
C
riti
cal
to q
ua
lity
Su
sta
ina
bil
ity
To
p m
an
ag
emen
t
com
mit
men
t
Lea
der
s
hip
1a. Leaders develop the mission, vision, values and ethics and act as role models 1b. Leaders define, monitor, review and drive the improvement of the organization’s
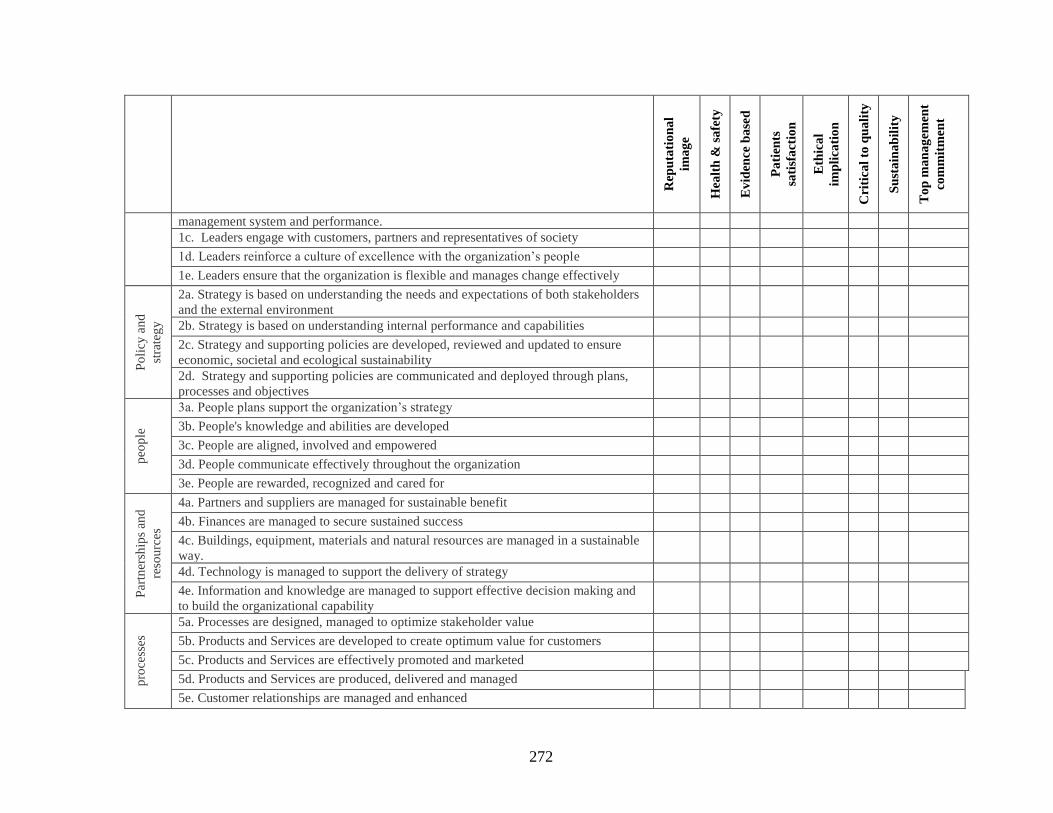
272
Rep
uta
tio
na
l
ima
ge
Hea
lth
& s
afe
ty
Ev
iden
ce b
ase
d
Pa
tien
ts
sati
sfa
ctio
n
E
thic
al
imp
lica
tio
n
C
riti
cal
to q
ua
lity
Su
sta
ina
bil
ity
To
p m
an
ag
emen
t
com
mit
men
t
management system and performance.
1c. Leaders engage with customers, partners and representatives of society 1d. Leaders reinforce a culture of excellence with the organization’s people 1e. Leaders ensure that the organization is flexible and manages change effectively
Po
licy
an
d
stra
teg
y
2a. Strategy is based on understanding the needs and expectations of both stakeholders
and the external environment
2b. Strategy is based on understanding internal performance and capabilities 2c. Strategy and supporting policies are developed, reviewed and updated to ensure
economic, societal and ecological sustainability
2d. Strategy and supporting policies are communicated and deployed through plans,
processes and objectives
peo
ple
3a. People plans support the organization’s strategy 3b. People's knowledge and abilities are developed 3c. People are aligned, involved and empowered 3d. People communicate effectively throughout the organization 3e. People are rewarded, recognized and cared for
Par
tner
ship
s an
d
reso
urc
es
4a. Partners and suppliers are managed for sustainable benefit 4b. Finances are managed to secure sustained success 4c. Buildings, equipment, materials and natural resources are managed in a sustainable
way.
4d. Technology is managed to support the delivery of strategy 4e. Information and knowledge are managed to support effective decision making and
to build the organizational capability
pro
cess
es
5a. Processes are designed, managed to optimize stakeholder value 5b. Products and Services are developed to create optimum value for customers 5c. Products and Services are effectively promoted and marketed 5d. Products and Services are produced, delivered and managed 5e. Customer relationships are managed and enhanced
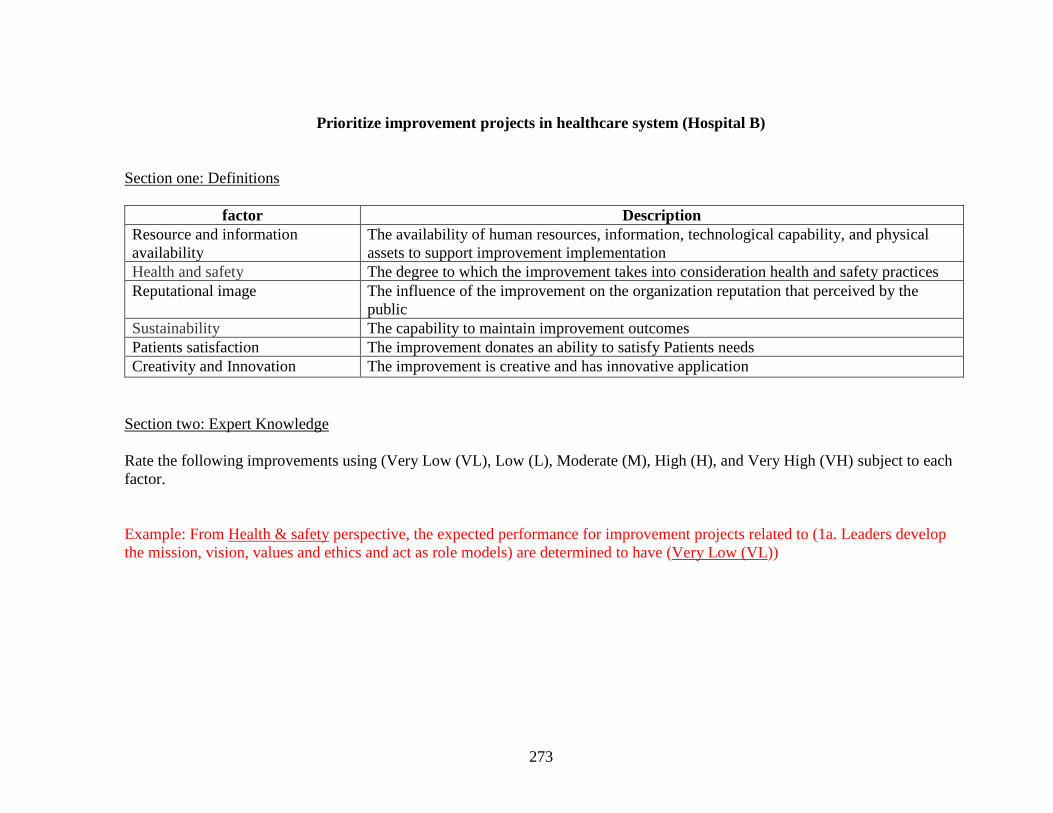
273
Prioritize improvement projects in healthcare system (Hospital B)
Section one: Definitions
factor Description
Resource and information
availability
The availability of human resources, information, technological capability, and physical
assets to support improvement implementation
Health and safety The degree to which the improvement takes into consideration health and safety practices
Reputational image The influence of the improvement on the organization reputation that perceived by the
public
Sustainability The capability to maintain improvement outcomes
Patients satisfaction The improvement donates an ability to satisfy Patients needs
Creativity and Innovation The improvement is creative and has innovative application
Section two: Expert Knowledge
Rate the following improvements using (Very Low (VL), Low (L), Moderate (M), High (H), and Very High (VH) subject to each
factor.
Example: From Health & safety perspective, the expected performance for improvement projects related to (1a. Leaders develop
the mission, vision, values and ethics and act as role models) are determined to have (Very Low (VL))
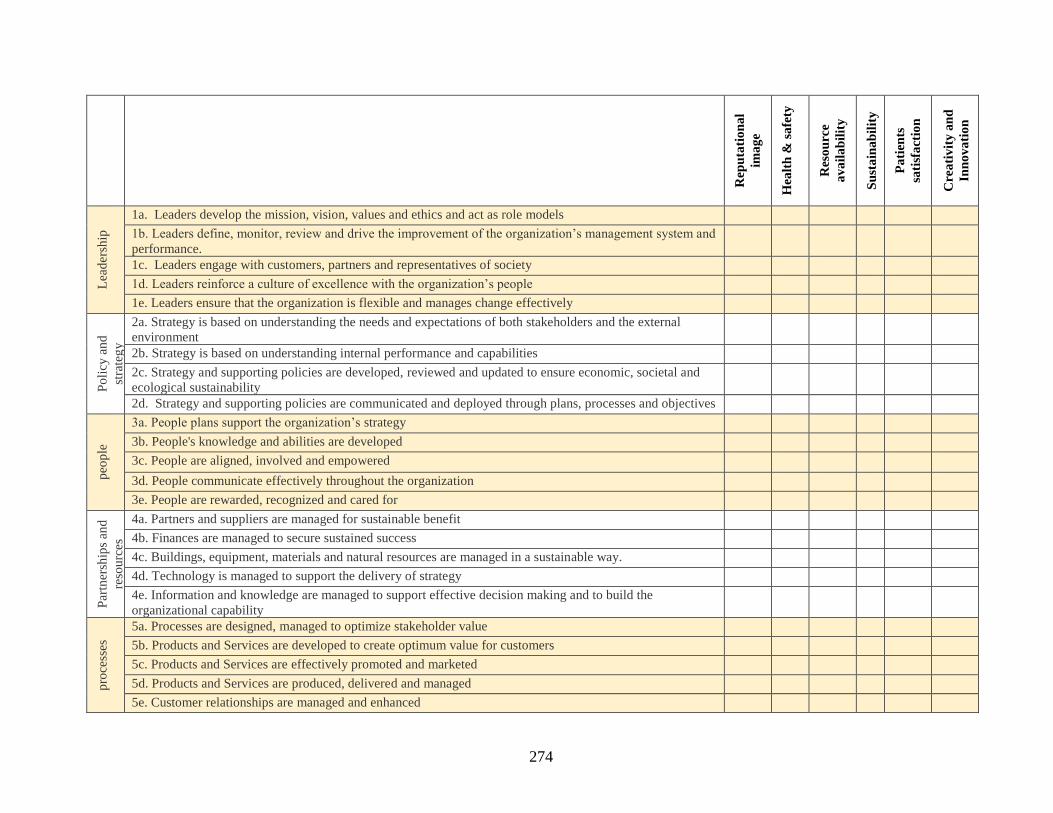
274
Rep
uta
tio
na
l
ima
ge
Hea
lth
& s
afe
ty
Res
ou
rce
av
ail
ab
ilit
y
Su
sta
ina
bil
ity
Pa
tien
ts
sati
sfa
ctio
n
Cre
ati
vit
y a
nd
Inn
ov
ati
on
Lea
der
ship
1a. Leaders develop the mission, vision, values and ethics and act as role models 1b. Leaders define, monitor, review and drive the improvement of the organization’s management system and
performance.
1c. Leaders engage with customers, partners and representatives of society 1d. Leaders reinforce a culture of excellence with the organization’s people 1e. Leaders ensure that the organization is flexible and manages change effectively
Po
licy
an
d
stra
teg
y
2a. Strategy is based on understanding the needs and expectations of both stakeholders and the external
environment
2b. Strategy is based on understanding internal performance and capabilities 2c. Strategy and supporting policies are developed, reviewed and updated to ensure economic, societal and
ecological sustainability
2d. Strategy and supporting policies are communicated and deployed through plans, processes and objectives
peo
ple
3a. People plans support the organization’s strategy 3b. People's knowledge and abilities are developed 3c. People are aligned, involved and empowered 3d. People communicate effectively throughout the organization 3e. People are rewarded, recognized and cared for
Par
tner
ship
s an
d
reso
urc
es
4a. Partners and suppliers are managed for sustainable benefit 4b. Finances are managed to secure sustained success 4c. Buildings, equipment, materials and natural resources are managed in a sustainable way. 4d. Technology is managed to support the delivery of strategy 4e. Information and knowledge are managed to support effective decision making and to build the
organizational capability
pro
cess
es
5a. Processes are designed, managed to optimize stakeholder value 5b. Products and Services are developed to create optimum value for customers 5c. Products and Services are effectively promoted and marketed 5d. Products and Services are produced, delivered and managed 5e. Customer relationships are managed and enhanced

275
APPENDIX I: EXPERT KNOWLEDGE ACQUISITION
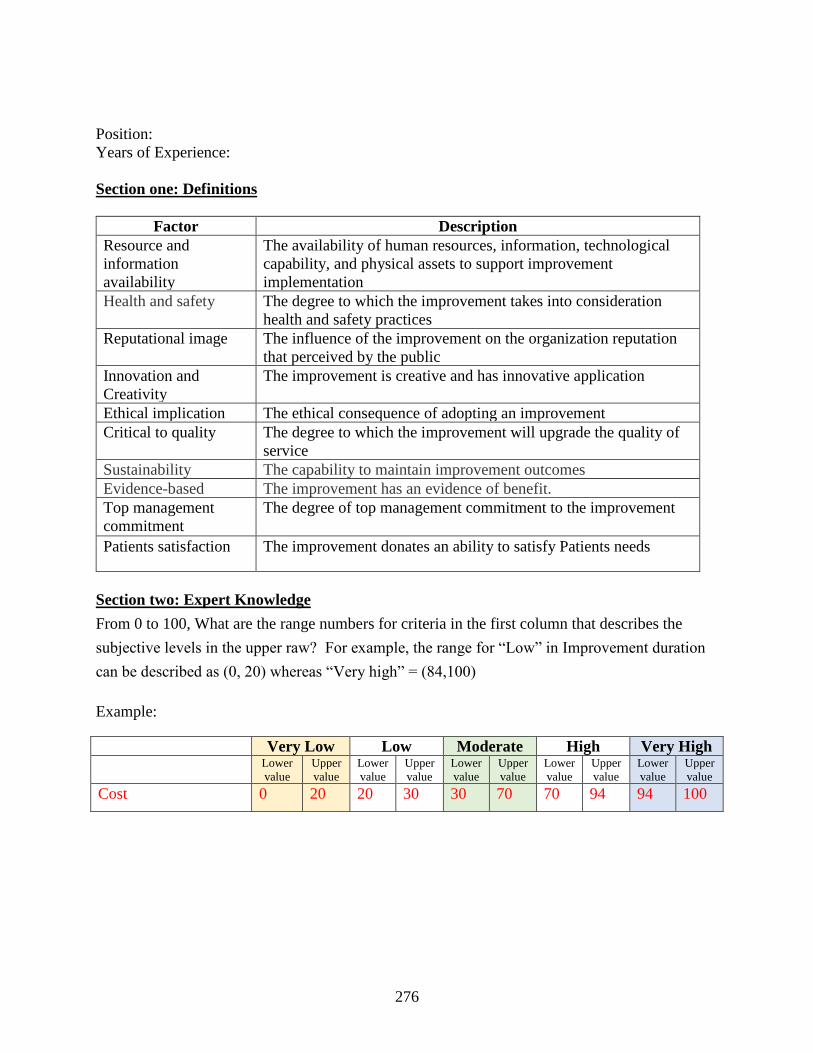
276
Position:
Years of Experience:
Section one: Definitions
Factor Description
Resource and
information
availability
The availability of human resources, information, technological
capability, and physical assets to support improvement
implementation
Health and safety The degree to which the improvement takes into consideration
health and safety practices
Reputational image The influence of the improvement on the organization reputation
that perceived by the public
Innovation and
Creativity
The improvement is creative and has innovative application
Ethical implication The ethical consequence of adopting an improvement
Critical to quality The degree to which the improvement will upgrade the quality of
service
Sustainability The capability to maintain improvement outcomes
Evidence-based The improvement has an evidence of benefit.
Top management
commitment
The degree of top management commitment to the improvement
Patients satisfaction The improvement donates an ability to satisfy Patients needs
Section two: Expert Knowledge
From 0 to 100, What are the range numbers for criteria in the first column that describes the
subjective levels in the upper raw? For example, the range for “Low” in Improvement duration
can be described as (0, 20) whereas “Very high” = (84,100)
Example:
Very Low Low Moderate High Very High
Lower
value
Upper
value
Lower
value
Upper
value
Lower
value
Upper
value
Lower
value
Upper
value
Lower
value
Upper
value
Cost 0 20 20 30 30 70 70 94 94 100
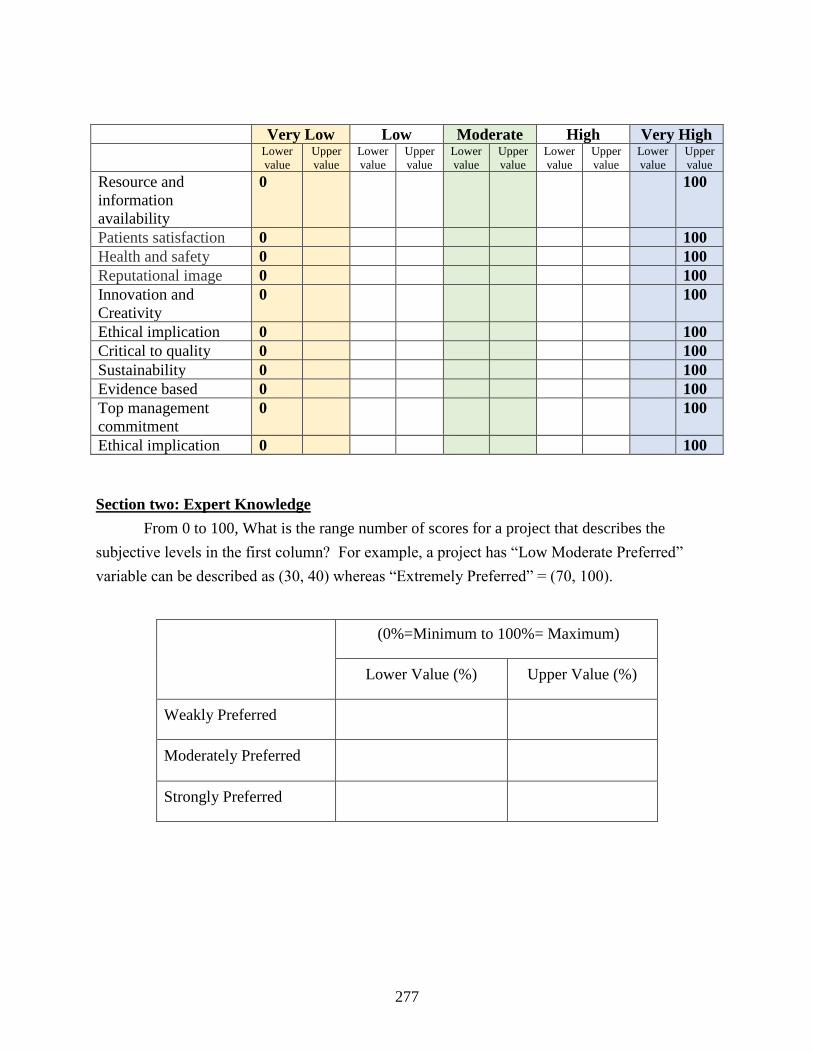
277
Very Low Low Moderate High Very High
Lower
value
Upper
value
Lower
value
Upper
value
Lower
value
Upper
value
Lower
value
Upper
value
Lower
value
Upper
value
Resource and
information
availability
0 100
Patients satisfaction 0 100
Health and safety 0 100
Reputational image 0 100
Innovation and
Creativity
0 100
Ethical implication 0 100
Critical to quality 0 100
Sustainability 0 100
Evidence based 0 100
Top management
commitment
0 100
Ethical implication 0 100
Section two: Expert Knowledge
From 0 to 100, What is the range number of scores for a project that describes the
subjective levels in the first column? For example, a project has “Low Moderate Preferred”
variable can be described as (30, 40) whereas “Extremely Preferred” = (70, 100).
(0%=Minimum to 100%= Maximum)
Lower Value (%) Upper Value (%)
Weakly Preferred
Moderately Preferred
Strongly Preferred

278
APPENDIX J: FUZZY DELPHI METHOD MACROSCODE
279
Sub FuzzyValue()
' data entery sheet variable
Dim EndingRow As Integer ' number of nurses
Dim EndingCol As Integer
EndingRow = 27
EndingCol = 35
i = 2 ' starting clo
j = 21 ' starting Row
Dim x As Integer
Dim y As Integer
x = 6 ' starting row in Expert sheet
y = 3 ' starting col in Expert sheet
Do
' put the curser back to the starting rows in both sheets
j = 21 ' starting Row
x = 6 ' starting row in Expert sheet
Do
' convert lingustic value to fuzzy value
If Cells(j, i) = "VL" Then
Worksheets("Expert").Cells(x, y) = 0
Worksheets("Expert").Cells(x, y + 1) = 0
Worksheets("Expert").Cells(x, y + 2) = 0.25
ElseIf Cells(j, i) = "L" Then
280
Worksheets("Expert").Cells(x, y) = 0
Worksheets("Expert").Cells(x, y + 1) = 0.25
Worksheets("Expert").Cells(x, y + 2) = 0.5
ElseIf Cells(j, i) = "M" Then
Worksheets("Expert").Cells(x, y) = 0.25
Worksheets("Expert").Cells(x, y + 1) = 0.5
Worksheets("Expert").Cells(x, y + 2) = 0.75
ElseIf Cells(j, i) = "H" Then
Worksheets("Expert").Cells(x, y) = 0.5
Worksheets("Expert").Cells(x, y + 1) = 0.75
Worksheets("Expert").Cells(x, y + 2) = 1
ElseIf Cells(j, i) = "VH" Then
Worksheets("Expert").Cells(x, y) = 0.75
Worksheets("Expert").Cells(x, y + 1) = 1
Worksheets("Expert").Cells(x, y + 2) = 1
End If
x = x + 1
j = j + 1
Loop While j <= EndingRow
i = i + 1
y = y + 3
Loop While i < EndingCol
End Sub
281
LIST OF REFERENCES
Abbasianjahromi, H. R., & Rajaie, H. (2013). APPLICATION OF FUZZY CBR AND MODM
APPROACHES IN THE PROJECT PORTFOLIO SELECTION IN CONSTRUCTION
COMPANIES. Iranian Journal of Science and Technology. Transactions of Civil
Engineering, 37(1), 143-155.
Abdallah, A. (2014). Implementing quality initiatives in healthcare organizations: drivers and
challenges. International Journal of Health Care Quality Assurance, 27(3), 166-181.
Abdallah, A., Haddadin, B. M., Al-Atiyat, H. M., Haddad, L. J., & Al-Sharif, S. L. (2013).
Investigating the Applicability of EFQM and KAIIAE in Jordanian Healthcare
Organizations: A Case Study. 7, 49-55.
Abdi, M. R. (2012). Product family formation and selection for reconfigurability using analytical
network process. International Journal of Production Research, 50(17), 4908-4921.
Abdullah, L. (2013). Fuzzy multi criteria decision making and its applications: A brief review of
category. Procedia-Social and Behavioral Sciences, 97, 131-136.
Agarwal, S., Gallo, J. J., Parashar, A., Agarwal, K. K., Ellis, S. G., Khot, U. N., Spooner, R.,
Murat Tuzcu, E., & Kapadia, S. R. (2016). Impact of lean six sigma process improvement
methodology on cardiac catheterization laboratory efficiency. Cardiovascular
Revascularization Medicine, 17(2), 95-101.
Aghdaie, M. H. m. a. y. c., Zolfani, S. H. s. h. g. c., & Zavadskas, E. K. e. z. v. l. (2012).
PRIORITIZING CONSTRUCTING PROJECTS OF MUNICIPALITIES BASED ON
AHP AND COPRASG: A CASE STUDY ABOUT FOOTBRIDGES IN IRAN.
282
Omavalitsuste ehitusprojektide prioritiseerimine käsutades analüütilist hierarhia
protsessi (AHP) Copras-G: jalakäijate silla juhtumianalüüs Iraanis., 7(2), 145-153.
Ahire, S. L., Golhar, D. Y., & Waller, M. A. (1996). Development and validation of TQM
implementation constructs. Decision Sciences, 27(1), 23.
Ahmad, S., & Schroeder, R. G. (2002). The importance of recruitment and selection process for
sustainability of total quality management, 19, 540.
Ahmed, H., Elkhatib, M., Adly, I., & Ragai, H. (2016). Design and Implementation of Fuzzy
Event-detection Algorithm for Border Monitoring on FPGA. International Journal of
Fuzzy Systems, 18(6), 1054-1064.
Akyürek, Ç. E., Sawalha, R., & Ide, S. (2015). Factors affecting the decision making process in
healthcare institutions Academy of Strategic Management Journal, 14, 1.
Al-Hawari, T., Khrais, S., Al-Araidah, O., & Al-Dwairi, A. (2011). 2D laser scanner selection
using fuzzy logic. Expert Systems With Applications, 38(5), 5614-5619.
Al-Marsumi, M. (2007). Total Quality Management in a Chosen Section of the Hospitals in
Amman, Jordan. Quality Management Journal, 14(1), 45-57.
Al-Tabbaa, O., Gadd, K., & Ankrah, S. (2013). Excellence models in the non-profit context:
strategies for continuous improvement. International Journal of Quality & Reliability
Management, 30(5), 590.
Aly, S., & Vrana, I. (2007). Multiple parallel fuzzy expert systems utilizing a hierarchical fuzzy
model. ZEMEDELSKA EKONOMIKA-PRAHA-, 53(2), 89.
Anil, K. S., & Balvir, T. (2007). Evolution of "Universal Business Excellence Model"
incorporating Vedic philosophy. Measuring Business Excellence, 11(3), 4-20.
283
Armacost, R. L., Hosseini, J. C., & Pet-Edwards, J. (1999). Using the Analytic Hierarchy
Process as a Two-phase Integrated Decision Approach for Large Nominal Groups. Group
Decision and Negotiation, 8(6), 535-555.
Atici, K. B., Simsek, A. B., Ulucan, A., & Tosun, M. U. (2015). A GIS-based Multiple Criteria
Decision Analysis approach for wind power plant site selection. Utilities Policy, 37, 86-
97.
Atici, K. B., & Ulucan, A. (2011). A multiple criteria energy decision support system.
Technological and Economic Development of Economy, 17(2), 219-245.
Azadfallah, M. (2016). Supplier Selection using MADM Method Under Uncertainty. Journal of
Supply Chain Management Systems, 5(3).
Bacudio, L. R., Benjamin, M. F. D., Eusebio, R. C. P., Holaysan, S. A. K., Promentilla, M. A. B.,
Yu, K. D. S., & Aviso, K. B. (2016). Analyzing barriers to implementing industrial
symbiosis networks using DEMATEL. Sustainable Production and Consumption, 7, 57-
65.
Bak, C. (1992). Lessons from the veterans of TQM, 17.
Bandyopadhyay, J., & Coppens , K. (2015). Six Sigma Approach to Healthcare Quality and
Productivity Management. International Journal of Quality & Productivity Management,
5(1), 1-12.
Bernardino, L. L., Teixeira, F., Barbosa, A., Lordelo, M., Jesus, A. R. d., & Lepikson, H. A.
(2016). After 20 years, what has remained of TQM? International Journal of Productivity
& Performance Management, 65(3), 378-400.
Berwick, D. M. (2003). Disseminating innovations in health care. Journal of the American
Medical Association, 289(15), 1969-1975.
284
Bhat, S., Gijo, E. V., & Jnanesh, N. A. (2014). Application of Lean Six Sigma methodology in
the registration process of a hospital. International Journal of Productivity &
Performance Management, 613-643.
Bhat, S., Gijo, E. V., & Jnanesh, N. A. (2016). Productivity and performance improvement in the
medical records department of a hospital: An application of Lean Six Sigma.
International Journal of Productivity and Performance Management, 65(1), 98-125.
Birdsall, I. A. (2003). It seemed like a good idea at the time: The forces affecting implementation
of strategies for an information technology project in the Department of Defense.
Bolat, B., Çebi, F., Tekin Temur, G., & Otay, I. (2014). A fuzzy integrated approach for project
selection. Journal of enterprise information management, 27(3), 247-260.
Botta, R., & Bahill, A. T. (2007). A prioritization process. Engineering Management Journal,
19(4), 20-27.
Bou-Llusar, J. C., Escrig-Tena, A. B., Roca-Puig, V., & Beltrán-Martín, I. (2009). An empirical
assessment of the EFQM Excellence Model: Evaluation as a TQM framework relative to
the MBNQA Model. Journal of Operations Management, 27(1), 1-22.
Boulter, L., Bendell, T., & Dahlgaard, J. (2013). Total quality beyond North America: A
comparative analysis of the performance of European Excellence Award winners.
International Journal of Operations & Production Management, 33(2), 197-215.
Brady, S. R. (2015). Utilizing and Adapting the Delphi Method for Use in Qualitative Research.
International Journal of Qualitative Methods, 14(5), 1-6.
Brah, S. A., Tee, S. S. L., & Rao, B. M. (2002). Relationship between TQM and performance of
Singapore companies, 356.
285
Broekhuizen, H., Groothuis-Oudshoorn, C., Til, J., Hummel, J., & Ijzerman, M. (2015). A
Review and Classification of Approaches for Dealing with Uncertainty in Multi-Criteria
Decision Analysis for Healthcare Decisions. Pharmacoeconomics, 33(5), 445-455.
Brown, M. G. (1993). Why does total quality fail in two out of three tries?, 80.
Brown, M. G. (2000). Baldrige award winning quality : how to interpret the Baldrige criteria for
performance excellence (10th ed.): Portland, Oregon : Productivity Inc.
Büyüközkan, G., & Öztürkcan, D. (2010). An integrated analytic approach for Six Sigma project
selection. Expert Systems with Applications, 37(8), 5835-5847.
Calvo-Mora, A., Leal, A., & Roldán, J. L. (2005). Relationships between the EFQM model
criteria: a study in Spanish universities. Total Quality Management & Business
Excellence, 16(6), 741-770.
Calvo-Mora, A., Picón, A., Ruiz, C., & Cauzo, L. (2014). The relationships between soft-hard
TQM factors and key business results. International Journal of Operations & Production
Management, 34(1), 115-143.
Canas, S. R. D., Ferreira, F. A. F., & Meidutė-Kavaliauskienė, I. (2015). Setting rents in
residential real estate: a methodological proposal using multiple criteria decision analysis.
International Journal of Strategic Property Management, 19(4), 368-380.
Cavana, R. Y., Delahaye, B. L., & Sekaran, U. (2001). Applied business research: Qualitative
and quantitative methods: John Wiley & Sons Australia.
Chakravorty, S. S. (2012). Prioritizing Improvement Projects: Benefit & Effort (B&E) Analysis.
Quality Management Journal, 19(1), 24-33.
286
Cheng, C.-H., & Lin, Y. (2002). O.R. Applications: Evaluating the best main battle tank using
fuzzy decision theory with linguistic criteria evaluation. European Journal of
Operational Research, 142, 174-186.
Cheng, E. W., & Li, H. (2005). Analytic network process applied to project selection. Journal of
construction engineering and management, 131(4), 459-466.
Cheng Lim, P., & Tang, N. K. (2000). The development of a model for total quality healthcare.
Managing Service Quality: An International Journal, 10(2), 103-111.
Chia-Wei, T., & Cheng-Ta, W. (2010). Obtaining a picture of undergraduate education quality: a
voice from inside the university. Higher Education(3), 269.
Chiarini, A., & Bracci, E. (2013). Implementing Lean Six Sigma in healthcare: issues from Italy.
Public Money & Management, 33(5), 361-368.
Claver-Cortes, E., Pereira-Moliner, J., Tari, J. J., & Molina-Azorin, J. F. (2008). TQM,
managerial factors and performance in the Spanish hotel industry. Industrial
Management & Data Systems, 108 (1-2), 228-244.
Conti, T. A. (2007). A history and review of the European Quality Award Model. TQM
Magazine, 19(2), 112-128.
Crossland, L., Janamian, T., & Jackson, C. (2014). Key elements of high-quality practice
organisation in primary health care: a systematic review. Medical Journal of Australia,
201(3), 47-51.
Cungen, C., Zaiyue, Z., & Shang, G. (2009). Multiplication Operation on Fuzzy Numbers:
ACADEMY PUBLISHER.
287
D'Souza, S. C., & Sequeira, A. H. (2011). Information Systems and Quality Management in
Healthcare Organization: An Empirical Study. Journal of Technology Management for
Growing Economies, 2(1), 47-60.
Dale, B. (2000). Excellence and total quality management: is there a difference?
LEATHERHEAD FOOD RA FOOD INDUSTRY JOURNAL, 3, 105-115.
Dalkey, N., & Helmer, O. (1963). AN EXPERIMENTAL APPLICATION OF THE DELPHI
METHOD TO THE USE OF EXPERTS. Management Science, 9(3), 458-467.
Danladi, A. d., Puwu, M. I. m., Michael, Y. y., & Garkida, B. M. b. g. (2016). USE OF FUZZY
LOGIC TO INVESTIGATE WEATHER PARAMETER IMPACT ON ELECTRICAL
LOAD BASED ON SHORT TERM FORECASTING. Nigerian Journal of Technology,
35(3), 562-567.
Davis, A. M. (2003). The art of requirements triage. Computer(3), 42.
De Belvis, A., Visnjic, A., Izzi, A., Bucci, S., Tanzariello, M., Marino, M., Sanna, T., Damiani,
G., Specchia, M. L., Ricciardi, G., et al. (2014). Which criteria to prioritize the healthcare
problems to be treated through the Integrated Care Pathways? European Journal of
Public Health, 24, 1101-1262.
Dean Jr, J. W., & Bowen, D. E. (1994). Management theory and total quality: improving
research and practice through theory development. Academy of Management Review,
19(3), 392-418.
Dean, J. W., & Bowen, D. E. (1994). MANAGEMENT THEORY AND TOTAL QUALITY:
IMPROVING RESEARCH AND PRACTICE THROUGH THEORY DEVELOPMENT.
Academy of Management Review, 19(3), 392-418.
288
Dehnavieh, R., Ebrahimipour, H., Nouri Hekmat, S., Taghavi, A., Jafari Sirizi, M., & Hossain
Mehrolhassani, M. (2012). EFQM-based Self-assessment of Quality Management in
Hospitals Affiliated to Kerman University of Medical Sciences. International Journal of
Hospital Research, 1(1), 57.
Del Rio, M. P., Feliu, J., Roch, I., Sanchez, A., Ordonez, A., Garcia-Caballero, J., & Gonzalez-
Baron, M. (2006). Application of European model of quality in oncology. Revista Clinica
Espanola, 206(3), 129-136.
Delbecq, A. L., Van de Ven, A. H., Gustafson, D. H., Van de Ven, A. H., & Gustafson, D. H.
(1975). Group techniques for program planning : a guide to nominal group and Delphi
processes: Glenview, Ill. : Scott, Foresman.
Deng, H., Yeh, C.-H., & Willis, R. J. (2000). Inter-company comparison using modified TOPSIS
with objective weights. Computers and Operations Research, 27, 963-973.
Dodangeh, Yusuff, R., Ismail, N., Ismail, M., Zadeh, M., & Jassbi, J. (2011). Designing fuzzy
multi criteria decision making model for best selection of areas for Improvement in
EFQM (European Foundation for Quality Management) model. African Journal of
Business Management, 5(12), 5010-5021.
Dodangeh, & Yusuff, R. M. (2011). A decision model for selecting of areas for improvement in
EFQM model. 2011 IEEE International Conference on Quality & Reliability (ICQR),
529.
Dodangeh, J., Rosnah, M., Ismail, N., Ismail, Y., Biekzadeh, M., & Jassbi, J. (2012). A Review
on Major Business Excellence Frameworks. Technics Technologies Education
Management, 7(3), 1386-1393.
289
Donahue, K. T., & vanOstenberg, P. (2000). Joint Commission International accreditation:
relationship to four models of evaluation. International Journal for Quality in Health
Care, 12(3), 243-246.
Dotun, A. (2001). TQM and business excellence: is there really a conflict? Measuring Business
Excellence, 5(3), 37-40.
Dow, D., Samson, D., & Ford, S. (1999). Exploding the myth: Do all quality management
practices contribute to superior quality performance? Production And Operations
Management, 8(1), 1-27.
Dror, S. (2008). The Balanced Scorecard versus quality award models as strategic frameworks.
Total Quality Management & Business Excellence, 19(6), 583-593.
Durlabhji, S. G., & Fusilier, M. R. (1999). The empowered classroom: Applying TQM to college
teaching. Managing Service Quality, 9(2), 110-115.
Dutt, M., Biswas, D., Arora, P., & Kar, N. (2012). Using the EFQM model effectively, 35, 11.
Easton, G. S., & Jarrell, S. L. (1998). The Effects of Total Quality Management on Corporate
Performance: An Empirical Investigation. Journal of Business, 71(2), 253-307.
Edelenbos, J., van Buuren, A., & van Schie, N. (2011). Co-producing knowledge: joint
knowledge production between experts, bureaucrats and stakeholders in Dutch water
management projects. Environmental Science and Policy, 14, 675-684.
EFQM. (2012). EFQM excellence model Retrieved from http://www.efqm.org/the-efqm-
excellence-model
Eghtesady, P., Brar, A. K., & Hall, M. (2013). Prioritizing quality improvement in pediatric
cardiac surgery. Journal of Thoracic and Cardiovascular Surgery, 143(3), 631-640.
290
Ellahham, S., Aljabbari, S., Harold , T., Raji, S., & AlZubaidi, A. (2015). Reducing Door to-
Balloon- Time for Acute ST Elevation Myocardial Infarction In Primary Percutaneous
Intervention: Transformation using Robust Performance Improvement. BMJ Quality
Improvement Reports, 4(1).
Escrig, A. B., & De Menezes, L. M. (2015). What characterizes leading companies within
business excellence models? An analysis of 'EFQM Recognized for Excellence'
recipients in Spain, 169, 362.
Eskildson, L. (1994). Improving the odds of TQM's success, 61.
Evans, J. R., Ford, M. W., Masterson, S. S., & Hertz, H. S. (2012). Beyond performance
excellence: research insights from Baldrige recipient feedback. Total Quality
Management & Business Excellence, 23(5/6), 489-506.
Evans, J. R., & Lindsay, W. M. (2005). The management and control of quality (6th ed.): Mason,
OH : Thomson/South-Western.
Ezzabadi, J. H., Saryazdi, M. D., & Mostafaeipour, A. (2015). Implementing Fuzzy Logic and
AHP into the EFQM model for performance improvement: A case study. Applied Soft
Computing Journal, 165.
Farahani, R. Z., SteadieSeifi, M., & Asgari, N. (2010). Review Article: Multiple criteria facility
location problems: A survey. Applied Mathematical Modelling, 34, 1689-1709.
Favaretti, C., Pieri, P. D., Torri, E., Guarrera, G., Fontana, F., Dei, F., Flor, L., & De Pieri, P.
(2015). An EFQM excellence model for integrated healthcare governance. International
Journal of Health Care Quality Assurance, 28(2), 156-172.
Fazlollahtabar, H., Mahdavi, I., Ashoori, M., Kaviani, S., & Mahdavi-Amiri, N. (2011). A multi-
objective decision-making process of supplier selection and order allocation for multi-
291
period scheduling in an electronic market. International Journal of Advanced
Manufacturing Technology, 52(9-12), 1039-1052.
Feiming Chen, c. c., & Yuqing Liu, l. c. (2016). Research on the risk factors of mobile business:
based on the sorting Delphi method. International Journal of Engineering Research in
Africa, 21, 215-230.
Fisher, C., Dauterive, J., & Barfield, J. (2001). Economic impacts of quality awards: Does
offering an award bring returns to the state? Total Quality Management, 12(7), 981-987.
Fleiszer, A. R., Semenic, S. E., Ritchie, J. A., Richer, M. C., & Denis, J. L. (2015). The
sustainability of healthcare innovations: a concept analysis. Journal of Advanced
Nursing, 71(7), 1484-1498.
Flynn, B. B., & Saladin, B. (2001). Further evidence on the validity of the theoretical models
underlying the Baldrige criteria. Journal of Operations Management, 19, 617-652.
Foster, Johnson, J. K., Nelson, E. C., & Batalden, P. B. (2007). Using a Malcolm Baldrige
framework to understand high-performing clinical microsystems. Quality & Safety in
Health Care, 16(5), 334-341.
Foster, J. J., & Pitts, W. (2009). Implementation of an insulin therapy protocol: applying the
Baldrige approach. American Journal of Health-System Pharmacy, 66(11), 1035-1038.
Fraser, V. J., & Olsen, M. A. (2002). The business of health care epidemiology: creating a vision
for service excellence. American Journal Of Infection Control, 30(2), 77-85.
Fuli, Z., Yandong, H., Yun, L., Xu, W., & Lin, Z. (2016). ELV Recycling Service Provider
Selection Using the Hybrid MCDM Method: A Case Application in China.
Sustainability, 8(5).
292
Gabus, A., & Fontela, E. (1972). World problems, an invitation to further thought within the
framework of DEMATEL. Battelle Geneva Research Center, Geneva, Switzerland.
Gallego, G., Taylor, S. J., & Brien, J. A. E. (2011). Setting priorities for high-cost medications in
public hospitals in Australia: should the public be involved? Australian Health Review,
35(2), 191-196.
García-Cascales, M. S., & Lamata, M. T. (2012). On rank reversal and TOPSIS method.
Mathematical and Computer Modelling, 56, 123-132.
Gené-Badia, J., Jodar-Solà, G., Peguero-Rodríguez, E., Contel-Segura, J. C., & Moliner-Molins,
C. (2001). The EFQM excellence model is useful for primary health care teams. Family
Practice, 18(4), 407-409.
Ghobadian, A., & Woo, H. S. (1996). Characteristics, benefits and shortcomings of four major
quality awards. International Journal of Quality & Reliability Management, 2(10).
Ghobadian, A., & Woo, H. S. (1996). Characteristics, benefits and shortcomings of four major
quality awards, 10.
Gijo, E. V., & Antony, J. (2013). Reducing Patient Waiting Time in Outpatient Department
Using Lean Six Sigma Methodology. Quality And Reliability Engineering International,
30(8), 1481-1491.
Gil-Lafuente, A. M., Merigó, J. M., & Vizuete, E. (2014). Analysis of luxury resort hotels by
using the fuzzy analytic hierarchy process and the fuzzy Delphi method. Economic
research-Ekonomska istraživanja, 27(1), 244-266.
Godwin, G. U. (2000). Using analytic hierarchy process to analyze the information technology
outsourcing decision. Industrial Management & Data Systems, 100(9).
293
Govindan, K., & Chaudhuri, A. (2016). Interrelationships of risks faced by third party logistics
service providers: A DEMATEL based approach. Transportation Research Part E, 90,
177-195.
Habib, M., Khan, R., & Piracha, J. L. (2009). Analytic network process applied to R&D project
selection. Paper presented at the Information and Communication Technologies, 2009.
ICICT'09. International Conference on.
Habibi, A., Jahantigh, F. F., & Sarafrazi, A. (2015). Fuzzy Delphi Technique for Forecasting and
Screening Items. Asian Journal of Research in Business Economics and Management,
5(2), 130-143.
Helmstedt, K. J., Shaw, J. D., Bode, M., Terauds, A., Springer, K., Robinson, S. A., &
Possingham, H. P. (2016). Prioritizing eradication actions on islands: it's not all or
nothing. Journal of Applied Ecology, 53(3), 733-741.
Henderson, R. J., Johnson, A. M., & Moodie, S. T. (2016). Revised Conceptual Framework of
Parent-to-Parent Support for Parents of Children Who Are Deaf or Hard of Hearing: A
Modified Delphi Study. American Journal of Audiology, 25(2), 110-126.
Henriksen, B., & Christian Røstad, C. (2010). Evaluating and prioritizing projects–setting
targets: the business effect evaluation methodology (BEEM). International Journal of
Managing Projects in Business, 3(2), 275-291.
Herat, A. T., Noorossana, R., parsa, S., & Serkani, E. S. (2012). Using DEMATEL - Analytic
network process (ANP) hybrid algorithm approach for selecting improvement projects of
Iranian excellence model in healthcare sector. African Journal of Business Management,
6(2), 627-645.
294
Herath, G., & Prato, T. (2006). Using multi-criteria decision analysis in natural resource
management: Aldershot, England ; Burlington, VT : Ashgate Pub.
Herzlinger, R. E. (2006). Why Innovation in Health Care Is So Hard. Harvard Business Review,
84(5), 58-66.
Hietschold, N., Reinhardt, R., & Gurtner, S. (2014). Measuring critical success factors of TQM
implementation successfully – a systematic literature review. International Journal of
Production Research, 52(21), 6254-6272.
Hochenedel, B., & Kleiner, B. (2016). Excellence In Healthcare Organizations. Insights to a
Changing World Journal, 1, 28-34.
Holland, K., & Fennell, S. (2000). Clinical governance is "ACE"--using the EFQM excellence
model to support baseline assessment. International Journal Of Health Care Quality
Assurance Incorporating Leadership In Health Services, 13(4-5), 170-177.
Holmes, M. C., Jenicke, L. O., & Hempel, J. L. (2015). A Framework for Six Sigma Project
Selection in Higher Educational Institutions, Using a Weighted Scorecard Approach.
Quality Assurance in Education: An International Perspective, 23(1), 30-46.
Hsieh, Y.-j., Huang, L.-y., & Wang, C.-t. (2012). A framework for the selection of Six Sigma
projects in services: case studies of banking and health care services in Taiwan. Service
Business, 6(2), 243-264.
Hsu, T.-H., & Pan, F. F. (2009). Application of Monte Carlo AHP in ranking dental quality
attributes. Expert Systems With Applications, 36(2), 2310-2316.
Hsu, Y.-L., Lee, C.-H., & Kreng, V. B. (2010). The application of Fuzzy Delphi Method and
Fuzzy AHP in lubricant regenerative technology selection. Expert Systems with
Applications, 37(1), 419-425.
295
Hu, G., Wang, L., Fetch, S., & Bidanda, B. (2008). A multi-objective model for project portfolio
selection to implement lean and Six Sigma concepts. International Journal of Production
Research, 46(23), 6611-6625.
Huang, Y., Li, X., Wilck, J., & Berg, T. (2012, January). Cost Reduction in Healthcare via Lean
Six Sigma. Paper presented at the IIE Annual Conference, Norcross, GA.
Idowu, P. A., Ajibola, S. O., Balogun, J. A., & Ogunlade, O. (2015). Development of a Fuzzy
Logic-based Model for Monitoring Cardiovascular Risk. Journal of Database
Management, 26(4), 38.
Imai, M. (1986). Kaizen (Ky'zen), the key to Japan's competitive success (1st ed.): New York :
Random House Business Division.
Ishikawa, A., Amagasa, M., Shiga, T., Tomizawa, G., Tatsuta, R., & Mieno, H. (1993). The
max-min Delphi method and fuzzy Delphi method via fuzzy integration. Fuzzy sets and
systems, 55(3), 241-253.
Ishizaka, A., & Labib, A. (2009). Analytic Hierarchy Process and Expert Choice: Benefits and
limitations. OR Insight, 22(4), 201-220.
Islam, R. (2007). MBNQA criteria in education: assigning weights from a Malaysian perspective
and proposition for an alternative evaluation scheme. International Transactions in
Operational Research, 14(5), 373-394.
Jackson, S. (2000). Achieving clinical governance in Women's Services through the use of the
EFQM Excellence Model. International Journal Of Health Care Quality Assurance
Incorporating Leadership In Health Services, 13(4-5), 182-190.
296
Jayamaha, N., Grigg, N., & Mann, R. (2009). A study of the validity of three major business
excellence models in the Asia Pacific region. Total Quality Management & Business
Excellence, 20(11), 1213-1227.
Jayasinha, Y. (2016). Decreasing Turnaround Time and Increasing Patient Satisfaction in a
Safety Net Hospital-Based Pediatrics Clinic Using Lean Six Sigma Methodologies.
Quality Management in Health Care, 25(1), 38-43.
Jung, J. Y., & Sang-Gyu, L. (2007). PROJECT CATEGORIZATION, PRIORITIZATION, AND
EXECUTION BASED ON SIX SIGMA CONCEPT: A CASE STUDY OF
OPERATIONAL IMPROVEMENT PROJECT. Project Management Journal, 38(1), 55-
60.
JúNIOR, R. R. D. N., & ASANO, E. (2015). Use of A Multi-Decision Criteria Analysis to
Support Healthcare Decision-Making for Private Payers in Brazil: Development of a
Model To Guide Reimbursement Decisions.
Kaili, L. I. U. (2016). Prioritizing Criteria for Evaluating Cultural Contents in EFL Textbooks
through AHP. Journal of Language Teaching & Research, 7(5), 841-850.
Kamarulzaman, N., Jomhari, N., Raus, N. M., & Yusoff, M. Z. M. (2015). Applying the Fuzzy
Delphi Method to Analyze the user Requirement for user Centred Design Process in
Order to Create Learning Applications. Indian Journal of Science and Technology, 8(32).
Kang, H.-Y., & Lee, A. H. I. (2007). Priority mix planning for semiconductor fabrication by
fuzzy AHP ranking. Expert Systems With Applications, 32, 560-570.
Kanji, G., & Moura e Sá, P. (2003). Sustaining healthcare excellence through performance
measurement. Total Quality Management & Business Excellence, 14(3), 269.
297
Karim, E., Ahmad, J., & Osman, K. (2017). Fuzzy Delphi Method for Content Validation of
Integrated Science Process Skills Instrument. International Journal of Academic
Research in Business and Social Sciences, 7(6), 773-785.
Kempowsky-Hamon, T., Valle, C., Lacroix-Triki, M., Hedjazi, L., Trouilh, L., Lamarre, S.,
Labourdette, D., Roger, L., Mhamdi, L., Dalenc, F., et al. (2015). Fuzzy logic selection as
a new reliable tool to identify molecular grade signatures in breast cancer--the
INNODIAG study. BMC Medical Genomics, 8.
Keshavarz Ghorabaee, M. m. k. g. y. c., Zavadskas, E. K. e. z. v. l., Amiri, M. a. a. a. i., &
Turskis, Z. z. t. v. l. (2016). Extended EDAS Method for Fuzzy Multi-criteria Decision-
making: An Application to Supplier Selection. International Journal of Computers,
Communications & Control, 11(3), 358-371.
Khan, A. a. g. c., & Maity, K. k. g. c. (2016). Application of MCDM-based TOPSIS Method for
the Optimization of Multi Quality Characteristics of Modern Manufacturing Processes.
International Journal of Engineering Research in Africa, 23, 33-51.
Khrais, S. k. j. e. j., Al-Hawari, T., & Al-Araidah, O. (2011). A fuzzy logic application for
selecting layered manufacturing techniques. Expert Systems With Applications, 38(8),
10286-10291.
Kiauta, M. (2012). Idea of quality versus idea of excellence. Quality Innovation Prosperity,
16(2), 103-114.
Kim, Y.-K., & Oh, H.-J. (2012). Causality Analysis on Health Care Evaluation Criteria for State-
Operated Mental Hospitals in Korea Using Malcolm Baldrige National Quality Award
Model. Community Mental Health Journal, 48(5), 643-651.
298
Kırış, Ş. (2014). AHP and multichoice goal programming integration for course planning.
International Transactions in Operational Research, 21(5), 819-833.
Kirkham, L., Garza-Reyes, J. A., Kumar, V., & Antony, J. (2014). Prioritisation of operations
improvement projects in the European manufacturing industry. International Journal of
Production Research, 52(18), 5323-5345.
Knapp, S. (2015). Lean Six Sigma implementation and organizational culture. International
Journal of Health Care Quality Assurance, 28(8), 855-863.
Kunst, P., & Lemmink, J. (2000). Quality management and business performance in hospitals: A
search for success parameters. Total Quality Management, 11(8), 1123-1133.
Kuo, Y.-F., & Chen, P.-C. (2008). Constructing performance appraisal indicators for mobility of
the service industries using Fuzzy Delphi Method. Expert Systems With Applications, 35,
1930-1939.
Lai, Y.-J., Liu, T.-Y., & Hwang, C.-L. (1994). Topsis for MODM. European Journal of
Operational Research, 76(3), 486-500.
Larson, A. (2003). Demystifying Six Sigma: a company-wide approach to continuous
improvement: AMACOM Div American Mgmt Assn.
Lau, A. W. T., Tang, S. L., & Li, Y. S. (2015). The level of TQM application by construction
contractors in Hong Kong, 830-862.
Laureani, A., Brady, M., & Antony, J. (2013). Applications of Lean Six Sigma in an Irish
hospital. Leadership in Health Services, 26(4), 322-337.
Lee, & Lee, D. H. (2013). A comparative study of quality awards: evolving criteria and research.
Service Business, 7(3), 347.
299
Lee, Zuckweiler, K. M., & Trimi, S. (2006). Modernization of the Malcolm Baldrige National
Quality Award. International Journal of Production Research, 44(23), 5089-5106.
Lee, H., Kim, C., Cho, H., & Park, Y. (2009). An ANP-based technology network for
identification of core technologies: A case of telecommunication technologies. Expert
Systems With Applications, 36(1), 894-908.
Lee, S. (2011). Evaluating Serviceability of Healthcare Servicescapes: Service Design
Perspective. International Journal of Design, 5(2), 61-71.
Lee, W.-S., Huang, A. Y., Chang, Y.-Y., & Cheng, C.-M. (2011). Analysis of decision making
factors for equity investment by DEMATEL and Analytic Network Process. Expert
Systems With Applications, 38(7), 8375-8383.
Leigh, J. A., Douglas, C. H., Lee, K., & Douglas, M. R. (2005). A case study of a preceptorship
programme in an acute NHS Trust - using the European Foundation for Quality
Management tool to support clinical practice development. Journal of Nursing
Management, 13(6), 508-518.
LePrevost, J., & Mazur, G. (2005). Quality infrastructure improvement: using QFD to manage
project priorities and project management resources, 10.
Lin, B. (1995). Total quality management in health care: a survey of current practices. Total
Quality Management, 6(1), 69-78.
Lin, R.-J. (2013). Using fuzzy DEMATEL to evaluate the green supply chain management
practices. Journal of Cleaner Production, 40, 32-39.
Litva, A., Coast, J., Donovan, J., Eyles, J., Shepherd, M., Tacchi, J., Abelson, J., & Morgan, K.
(2002). ‘The public is too subjective’: public involvement at different levels of health-
care decision making. Social Science & Medicine, 54(12), 1825-1837.
300
López-Viñas, M. L., Costa, N., Tirvió, C., Davins, J., Manzanera, R., Ribera, J., Constante, C., &
Vallès, R. (2014). Accreditation model for acute hospital care in Catalonia, Spain.
Medicina Clinica, 143, 68-73.
Macinati, M. S. (2008). The relationship between quality management systems and
organizational performance in the Italian National Health Service. Health Policy, 85(2),
228-241.
Madjid, T. (2003). CROSS: A Multicriteria Group-Decision-Making Model for Evaluating and
Prioritizing Advanced-Technology Projects at NASA. Interfaces(3), 40.
Mann, R., & Grigg, N. (2004). Helping the kiwi to fly: Creating world-class organizations in
New Zealand through a benchmarking initiative. Total Quality Management & Business
Excellence, 15(5-6), 707-718.
Mariscal, M. A., Herrero, S. G., & Toca Otero, A. (2012). Assessing safety culture in the
Spanish nuclear industry through the use of working groups. Safety Science, 50, 1237-
1246.
Marques, A. I., Rosa, M. J., Soares, P., Santos, R., Mota, J., & Carvalho, J. (2011). Evaluation of
physical activity programmes for elderly people - a descriptive study using the EFQM'
criteria. BMC Public Health.
Marques, A. I., Santos, L., Soares, P., Santos, R., Oliveira-Tavares, A., Mota, J., & Carvalho, J.
(2011). A proposed adaptation of the European Foundation for Quality Management
Excellence Model to physical activity programmes for the elderly-development of a
quality self-assessment tool using a modified Delphi process. International journal of
behavioral nutrition and Physical Activity, 8(1), 104.
301
Marriott, B., Garza-Reyes, J. A., Soriano-Meier, H., & Antony, J. (2013). An integrated
methodology to prioritise improvement initiatives in low volume-high integrity product
manufacturing organisations. Journal of Manufacturing Technology Management, 24(2),
197-217.
Marsh, K., Lanitis, T., Neasham, D., Orfanos, P., & Caro, J. (2014). Assessing the Value of
Healthcare Interventions Using Multi-Criteria Decision Analysis: A Review of the
Literature. Pharmacoeconomics, 32(4), 345-365.
Martin-Castilla, J. I. (2002). Possible Ethical Implications in the Deployment of the EFQM
Excellence Model. Journal of Business Ethics, 39(1-2), 125-134.
Martínez-Costa, M., & Jimenez-Jimenez, D. (2008). Are companies that implement TQM better
learning organisations? An empirical study. Total Quality Management & Business
Excellence, 19(11), 1101-1115.
Maruthur, N. M., Joy, S. M., Dolan, J. G., Shihab, H. M., & Singh, S. (2015). Use of the
Analytic Hierarchy Process for Medication Decision-Making in Type 2 Diabetes. PLoS
ONE, 10(5), 1-11.
Mashal, A., & Ahmed, E. (2015). Effects of TQM Practices on Banking Sector Performance:
The Case of Jordan. Journal of Applied Finance and Banking, 5(6), 113-126.
Mason, S. E., Nicolay, C. R., & Darzi, A. (2015). Review: The use of Lean and Six Sigma
methodologies in surgery: A systematic review. The Surgeon, 13, 91-100.
Matthies-Baraibar, C., Arcelay-Salazar, A., Cantero-Gonzalez, D., Colina-Alonso, A., Garcia-
Urbaneja, M., Gonzalez-Llinares, R. M., Letona-Aranburu, J., Martinez-Carazo, C.,
Mateos-del Pino, M., Nuno-Solinis, R., et al. (2014). Is organizational progress in the
EFQM model related to employee satisfaction? Bmc Health Services Research, 14.
302
MBNQA. (2015). 2015–2016 Baldrige Excellence Framework: A Systems Approach to
Improving Your Organization’s Performance Technology.
. Retrieved from http://www.nist.gov/baldrige.
Mehralian, G., Nazari, J. A., Rasekh, H. R., & Hosseini, S. (2016). TOPSIS approach to
prioritize critical success factors of TQM. TQM Journal, 28(2), 235-249.
Mellat-Parast, M. (2013). Supply chain quality managementAn inter-organizational learning
perspective. International Journal of Quality & Reliability Management, 30(5), 511.
Mena Mateo, J. M., de la Fuente, A. S.-V., Cañada Dorado, A., & Villamor Borrego, M. (2009).
Strategy for implementing and assessing a health care risk management unit in a primary
care area. Revista De Calidad Asistencial: Organo De La Sociedad Espanola De Calidad
Asistencial, 24(3), 95-103.
Mendelow, A. (1991). ‘Stakeholder Mapping’, Proceedings of the 2nd International Conference
on Information Systems.
Moeller, J., & Sonntag, A. K. (2001). Evaluation of health services organisations – German
experiences with the EFQM excellence approach in healthcare. TQM Magazine, 13(5),
361.
Mohammad, M., Mann, R., Grigg, N., & Wagner, J. P. (2009). Selection of quality improvement
initiatives: An initial conceptual model. Journal of Quality Measurement & Analysis,
5(2), 1-14.
Moreno-Rodrı´guez, J. M., Cabrerizo, F. J., Pérez, I. J., & Martı´nez, M. A. (2013). A consensus
support model based on linguistic information for the initial-self assessment of the EFQM
in health care organizations. Expert Systems With Applications, 40, 2792-2798.
303
Mosadeghrad, A. M. (2015). Developing and validating a total quality management model for
healthcare organisations. TQM Journal, 27(5), 544-564.
Mühlbacher, A. C., & Kaczynski, A. (2016). Making Good Decisions in Healthcare with Multi-
Criteria Decision Analysis: The Use, Current Research and Future Development of
MCDA. Applied Health Economics And Health Policy, 14(1), 29-40.
Müller, R. M., & Thoring, K. (2012). Design thinking vs. lean startup: A comparison of two
user-driven innovation strategies. Leading Through Design, 151.
Mundongo, T. H., Ditend, Y. G., VanCaillie, D., & Malonga, K. F. (2014). The assessment of
job satisfaction for the healthcare providers in university clinics of Lubumbashi,
Democratic Republic of Congo. The Pan African Medical Journal, 19, 265.
Nabitz, U., Klazinga, N., & Walburg, J. (2000). The EFQM excellence model: European and
Dutch experiences with the EFQM approach in health care. European Foundation for
Quality Management. International Journal for Quality in Health Care, 12(3), 191-201.
NACCHO, N. A. o. C. a. C. H. O. (2013). First Things First: Prioritizing Health Problems.
Retrieved from
http://archived.naccho.org/topics/infrastructure/accreditation/upload/Prioritization-
Summaries-and-Examples-2.pdf
Naylor, G. (1999). Using the business excellence model to develop a strategy for a healthcare
organisation. International Journal Of Health Care Quality Assurance Incorporating
Leadership In Health Services, 12(2-3), 37-44.
Nazemi, J. (2010). A process model for improvement through EFQM. World Applied Sciences
Journal, 8(3), 279-287.
304
NHEA. (2014). National Health Expenditure Data. Retrieved from
https://www.cms.gov/research-statistics-data-and-systems/statistics-trends-and-
reports/nationalhealthexpenddata/nationalhealthaccountshistorical.html
NIST. (2015, August 25, 2016). Malcolm Baldrige National Quality Award Recipients.
Retrieved from https://www.nist.gov/baldrige/baldrige-faqs-baldrige-award-recipients
Nistorescu, T., & Bogheanu, M. (2012). Considerations on the methodology for identifying and
prioritizing public investment projects in Romania. Annals of University of Craiova-
Economic Sciences Series, 1(40), 10-16.
Noorderhaben, N. (1995). Strategic decision making.
. UK: Addison-Wesley.
Oger, B., & Platt, D. E. (2002). Value Measurement and Value Creation Models in Europe and
the US: A Comparison of the EFQM Excellence Model and the Baldrige Award Criteria.
Comptabilité Contrôle Audit, 99-115.
OsseoAsare, A. E., & Longbottom, D. (2002). The need for education and training in the use of
the EFQM model for quality management in UK higher education institutions. Quality
Assurance in Education, 10(1), 26.
Otani, K., Waterman, B., Faulkner, K. M., Boslaugh, S., & Dunagan, W. C. (2010). How patient
reactions to hospital care attributes affect the evaluation of overall quality of care,
willingness to recommend, and willingness to return. Journal of Healthcare
Management, 55(1), 25-37.
Ovretveit, J., & Staines, A. (2007). Sustained improvement? Findings from an independent case
study of the Jönköping quality program. Quality Management in Health Care, 16(1), 68-
83.
305
Ozcan, Y. A. (2005). Quantitative methods in health care management : techniques and
applications (1st ed.): San Francisco, CA : Jossey-Bass.
Ozfirat, P. M., Ozfirat, M. K., Malli, T., & Kahraman, B. (2015). Integration of fuzzy analytic
hierarchy process and multi-objective fuzzy goal programming for selection problems:
An application on roadheader selection. Journal of Intelligent & Fuzzy Systems, 29(1),
53-62.
Oztaysi, B. o. i. e. t., Onar, S. C., & Kahraman, C. (2016). Fuzzy multicriteria prioritization of
Urban transformation projects for Istanbul. Journal of Intelligent & Fuzzy Systems, 30(4),
2459-2474.
Pan, F. (2011). Perceived values on hospital services: A fuzzy logic application. African Journal
of Business Management, 5(11), 4465-4475.
Pande, P. S., Cavanagh, R. R., & Neuman, R. P. (2000). The Six Sigma way : how GE, Motorola,
and other top companies are honing their performance: New York, NY : McGraw-Hill.
Persaud, A. (2002). Using the EFQM Excellence Model Within Health Care, a Practical Guide to
Success. International Journal of Health Care Quality Assurance, 15(4), 182-183.
Phillips, L., & Bana e Costa, C. (2007). Transparent prioritisation, budgeting and resource
allocation with multi-criteria decision analysis and decision conferencing. Annals of
Operations Research, 154(1), 51-68.
Pocha, C. (2010). Lean Six Sigma in Health Care and the Challenge of Implementation of Six
Sigma Methodologies at a Veterans Affairs Medical Center. Quality Management in
Health Care, 19(4), 312-318
306
Powell, T. C. (1995). TOTAL QUALITY MANAGEMENT AS COMPETITIVE
ADVANTAGE: A REVIEW AND EMPIRICAL STUDY. Strategic Management
Journal, 16(1), 15-37.
Pöyhönen, M. A., Hämäläinen, R. P., & Salo, A. A. (1997). An experiment on the numerical
modelling of verbal ratio statements. Journal of Multi‐Criteria Decision Analysis, 6(1), 1-
10.
Psychogios, A. G., & Wilkinson, A. (2007). Exploring TQM awareness in the Greek national
business context: between conservatism and reformism cultural determinants of TQM.
International Journal of Human Resource Management, 18(6), 1042-1062.
Pyzdek, T. a. (2014). Six sigma handbook : a complete guide for green belts, black belts, and
managers at all levels. Chicago, Ill.: McGraw-Hill Education LLC.
Radnor, Z., & Boaden, R. (2008). Lean in public services-panacea or paradox? Public Money
and Management, 23, 3-7.
RAND. (2010). Involving the Public in Healthcare Policy: An Update of the Research Evidence
and Proposed Evaluation Framework. Retrieved from
http://www.issuelab.org/resources/9924/pdf_cover.png
Ravichandran, T., & Rai, A. (1999). Total Quality Management in Information Systems
Development: Key Constructs and Relationships, 16, 119-155.
Rivers, P. A. (1999). Aligning information systems for effective total quality management
implementation in health care organizations. Total Quality Management, 10(2), 281-289.
Rowland-Jones, R. (2012). The EFQM concepts of excellence approach to management
development within the UAE healthcare industry utilizing action modalities. Human
Resource Development International, 15(4), 501-514.
307
Saaty, T. L. (1994). How to Make a Decision: The Analytic Hierarchy Process. Interfaces, 24(6),
19-43.
Saaty, T. L. (1996). Decision making with dependence and feedback: the analytic network
process: the organization and prioritization of complexity. Pittsburgh, PA: WS
publication.
Saaty, T. L. (2006). Rank from comparisons and from ratings in the analytic hierarchy/network
processes. European Journal of Operational Research, 168(2), 557-570.
Sabella, A. R., Kashou, R., & Omran, O. (2015). Assessing quality of management practices in
Palestinian hospitals. International Journal of Organizational Analysis, 23(2), 213-232.
Sabokbar, H. F., Hosseini, A., Banaitis, A., & Banaitiene, N. (2016). A NOVEL SORTING
METHOD TOPSIS-SORT: AN APPLICATION FOR TEHRAN ENVIRONMENTAL
QUALITY EVALUATION. E+M Ekonomie a Management(2), 87-104.
Safari, H., Abdollahi, B., & Ghasemi, R. (2012). Canonical correlation analysis between people
criterion and people results criterion in EFQM model. Total Quality Management &
Business Excellence, 23(5-6), 541-555.
Sanchez, E., Letona, J., Gonzalez, R., Garcia, M., Darpon, J., & Garay, J. I. (2006). A descriptive
study of the implementation of the EFQM excellence model and underlying tools in the
Basque Health Service. International Journal for Quality in Health Care, 18(1), 58-65.
Sancho-Royo, A., & Verdegay, J. L. (1999). Methods for the Construction of Membership
Functions. International Journal of Intelligent Systems, 14(12), 1213-1230.
Santos, S., Belton, V., & Howick, S. (2002). Adding value to performance measurement by
using system dynamics and multicriteria analysis. International Journal of Operations &
Production Management, 22(11), 1246-1272.
308
Saúl Torres, O., Nick, H., & Pedro Diaz, S. (2014). A Proposed Methodology for Prioritizing
Project Effects to Include in Cost-Benefit Analysis Using Resilience, Vulnerability and
Risk Perception. Sustainability, Vol 6, Iss 11, Pp 7945-7966 (2014)(11), 7945.
Savić, M., Djordjević, P., Nikolić, D., Mihajlović, I., & Živkovic, Ž. (2014). Modeling the
influence of EFQM criteria on employees satisfaction and loyalty in transition economy:
the study of banking sector in Serbia. Serbian Journal of Management, 9(1), 15-30.
Say Yen, T., & Shun, C. (2015). The Process of Strategic, Agile, Innovation Development: A
Healthcare Systems Implementation Case Study. Journal of Global Information
Management, 23(3), 1-22.
Schonberger, R. J. (1992). Is Strategy Strategic? Impact of Total Quality Management on
Strategy, 80.
Senel, B., Senel, M., & Sariyar, A. (2012). EVALUATION OF PERFORMANCES OF
AUTOMATIVE INDUSTRY COMPANIES TRADED AT ISTANBUL STOCK
EXCHANGE (IMKB) BY TOPSIS METHODOLOGY. Interdisciplinary Journal of
Contemporary Research In Business, 4(5), 892-914.
Shang, K., & Hossen, Z. (2013). Applying fuzzy logic to risk assessment and decision-making.
Canadian institute of actuaries.
Shin, Y. C., & Xu, C. (2009). Intelligent systems: modeling, optimization, and control (Vol. 30).
Boca Raton: FL: CRC Press.
Short, P. (1995). Total quality management in hospitals. Total Quality Management, 6(3), 255-
264.
Siddiqui, J., & Rahman, Z. (2007). TQM principles' application on information systems for
empirical goalsA study of Indian organizations. TQM Magazine, 19(1), 76-87.
309
Słowiński, R., & Teghem, J. (1990). Stochastic versus fuzzy approaches to multiobjective
mathematical programming under uncertainty: Dordrecht ; Boston, MA : Kluwer
Academic.
Smith, B. (2013). A Socio-Cultural Perspective on Patient Safety. Journal of Perioperative
Practice, 23(3), 36-36.
Sokovic, M., Pavletic, D., & Pipan, K. K. (2010). Quality Improvement Methodologies – PDCA
Cycle, RADAR Matrix, DMAIC and DFSS. Journal of Achievements in Materials and
Manufacturing Engineering(1), 476.
Sova, C. A., Helfgott, A., Chaudhury, A. S., Matthews, D., Thornton, T. F., & Vermeulen, S. J.
(2015). Multi-level stakeholder influence mapping: visualizing power relations across
actor levels in Nepal’s agricultural climate change adaptation regime. Systemic Practice
and Action Research, 28(4), 383-409.
Sri Yogi, K. (2015). An empirical and fuzzy logic approach to product quality and purchase
intention of customers in two wheelers. Pacific Science Review B: Humanities and Social
Sciences, 1, 57-69.
Stafinski, T., Menon, D., McCabe, C., & Philippon, D. J. (2011). To fund or not to fund.
Pharmacoeconomics, 29(9), 771-780.
Stahr, H. (2001). Developing a culture of quality within the United Kingdom healthcare system.
International Journal of Health Care Quality Assurance, 14(4), 174-180.
Stewart, A. (2003). An investigation of the suitability of the EFQM Excellence Model for a
pharmacy department within an NHS Trust. International Journal Of Health Care
Quality Assurance Incorporating Leadership In Health Services, 16(2-3), 65-76.
310
Stillwell, W. G., Von Winterfeldt, D., & John, R. S. (1987). Comparing hierarchical and
nonhierarchical weighting methods for eliciting multiattribute value models.
Management Science, 33(4), 442-450.
Strand, J., Carson, R. T., Navrud, S., Ortiz-Bobea, A., & Vincent, J. R. (2017). Using the Delphi
method to value protection of the Amazon rainforest. Ecological Economics, 131, 475-
484.
Stuart-Kregor, P. (2006). Marketing Masterclass — Are pharmaceutical (or healthcare)
companies achieving true ‘marketing excellence’? Journal of Medical Marketing, 6(1),
19-30.
Studer, Q. (2004). Healthcare Service: Moving From Good to GREAT. Marketing Health
Services, 24(2), 20-25.
Su Mi, D.-P. (2011). The quality movement: where are you going? Total Quality Management &
Business Excellence, 22(5), 493-516.
Sun, H. (2011). A systems research on quality management under the MBNQA framework.
Total Quality Management & Business Excellence, 22(11), 1195-1211.
Tahriri, F., Mousavi, M., Haghighi, S. H., & Dawal, S. Z. M. (2014). The application of fuzzy
Delphi and fuzzy inference system in supplier ranking and selection. Journal of
Industrial Engineering International, 10(3), 66.
Talwar, B. (2011). Business excellence models and the path ahead. TQM Journal, 23(1), 21-35.
Tata, J., & Prasad, S. (1998). Cultural and structural constraints on total quality management
implementation. Total Quality Management, 9(8), 703-710.
311
Tavana, M., & Sodenkamp, M. A. (2010). A fuzzy multi-criteria decision analysis model for
advanced technology assessment at Kennedy Space Center. The Journal of the
Operational Research Society, 61(10), 1459-1470.
Tekic, J., Majstorovic, V. D., & Markovic, D. (2015). Applying the Model of Excellence in
Dental Healthcare. Srpski Arhiv Za Celokupno Lekarstvo, 143(1-2), 56-62.
Theodorakioglou, Y. D., & Tsiotras, G. D. (2000). The need for the introduction of quality
management into Greek health care.
Tsai, C.-F., & Chen, Z.-Y. (2013). Crossing the fuzzy front end chasm: Effective product project
concept selection using a 2-tuple fuzzy linguistic approach. Journal of Intelligent &
Fuzzy Systems, 25(3), 755-770.
Usha, M., Bhimaraya, A. M., & Shalini, R. (2007). Quality management in a healthcare
organisation: a case of South Indian hospital. TQM Magazine, 19(2), 129-139.
Vahdat, S., Hamzehgardeshi, L., Hessam, S., & Hamzehgardeshi, Z. (2014). Patient involvement
in health care decision making: a review. Iranian Red Crescent Medical Journal, 16(1).
Vallejo, Saura, R. M., Sunol, R., Kazandjian, V., Urena, V., & Mauri, J. (2006). A proposed
adaptation of the EFQM fundamental concepts of excellence to health care based on the
PATH framework. International Journal for Quality in Health Care, 18(5), 327-335.
Vallejo, P., Ruiz-Sancho, A., Domínguez, M., Ayuso, M. J., Méndez, L., Romo, J., Ontoria, L.,
Rodriquez, P., Seriñá, C., & Arango, C. (2007). Improving quality at the hospital
psychiatric ward level through the use of the EFQM model. International Journal for
Quality in Health Care, 19(2), 74-79.
312
Van Schoten, S., De Blok, C., Spreeuwenberg, P., Groenewegen, P., & Wagner, C. (2016). The
EFQM Model as a framework for total quality management in healthcare. International
Journal of Operations & Production Management, 36(8), 901-922.
Vassilios, M., Sophia, T., & Constantine, A. (2007). A comparative analysis and review of
national quality awards in Europe: Development of critical success factors. TQM
Magazine, 19(5), 454-467.
Vaxevanidis, N. M., Krivokapic , Z., Stefanatos, S., Dasic, P., & Petropoulos , G. (2006).
Overview And A Comparison Of ISO 9000: 2000 Quality System Standards With
Related Automotive Ones (QS9000, ISO/TS 16949) And TQM Models (MBNQA and
EFQM). International Journal of Engineering, 4(2), 155.
Velasquez, M., & Hester, P. T. (2013). An analysis of multi-criteria decision making methods.
International Journal of Operations Research, 10(2), 56-66.
Vernero, S., Nabitz, U., Bragonzi, G., Rebelli, A., & Molinari, R. (2007). A two-level EFQM
self-assessment in an Italian hospital. International Journal of Health Care Quality
Assurance, 20(2-3), 215-231.
Vinodh, S., & Swarnakar, V. (2015). Lean Six Sigma project selection using hybrid approach
based on fuzzy DEMATEL–ANP–TOPSIS. International Journal of Lean Six Sigma,
6(4), 313.
Vinodh, S., & Vikas, S. (2015). Lean Six Sigma project selection using hybrid approach based
on fuzzy DEMATEL–ANP–TOPSIS. International Journal of Lean Six Sigma(4), 313.
Wali, A. A., Deshmukh, S. G., & Gupta, A. D. (2003). Critical success factors of TQM: a select
study of Indian organizations. Production Planning & Control, 14(1), 3-14.
313
Wang, F.-K., Hsu, C.-H., & Tzeng, G.-H. (2014). Applying a hybrid MCDM model for six
sigma project selection. Mathematical Problems in Engineering, 2014.
Wang, F. K., Hsu, C. H., & Tzeng, G. H. (2014). Applying a Hybrid MCDM Model for Six
Sigma Project Selection. Mathematical Problems in Engineering, 13.
Wang, T.-C. (2012). The interactive trade decision-making research: An application case of
novel hybrid MCDM model. Economic Modelling, 29, 926-935.
Water, H. v. d., & Vries, J. d. (2006). Choosing a quality improvement project using the analytic
hierarchy process. 23(4), 409-425.
Wey, W.-M. (2008). A multiobjective optimization model for urban renewal projects selection
with uncertainty considerations. Paper presented at the 2008 Fourth International
Conference on Natural Computation.
WHO. (2006). Quality of care: a process for making strategic choices in health systems.
WHO. (2018). Process of translation and adaptation of instruments. Retrieved from
http://www.who.int/substance_abuse/research_tools/translation/en/#
Willborn, W. W. O., & Cheng, T. C. E. (1994). Global management of quality assurance
systems: New York, NY : McGraw-Hill.
Winston, W. L. (1994). Operations research : applications and algorithms (3rd ed.): Belmont,
CA : Duxbury Press.
Wiseman, V., Mooney, G., Berry, G., & Tang, K. C. (2003). Involving the general public in
priority setting: experiences from Australia. Social Science & Medicine, 56, 1001-1012.
Worstell, J. (2002). Identifying, justifying and prioritizing technical projects. Chemical
engineering progress, 98(3), 72-79.
314
Wu, C.-H., & Fang, W.-C. (2011). Combining the Fuzzy Analytic Hierarchy Process and the
fuzzy Delphi method for developing critical competences of electronic commerce
professional managers. Quality & Quantity, 45(4), 751-768.
Wudhikarn, Chakpitak, & Neubert. (2015). Use of an Analytic Network Process and Monte
Carlo Analysis in New Product Formula Selection Decisions. Asia-Pacific Journal of
Operational Research, 32(2), -1.
Yayla, A. Y., Oztekin, A., Gumus, A. T., & Gunasekaran, A. (2015). A hybrid data analytic
methodology for 3PL transportation provider evaluation using fuzzy multi-criteria
decision making. International Journal of Production Research, 53(20), 6097-6113.
Yeh, H. L., Lin, C. S., Su, C. T., & Wang, P. C. (2011). Applying lean six sigma to improve
healthcare: An empirical study. African Journal of Business Management, 5(31), 12356-
12370.
Yin, R. K. (2013). Case study research : design and methods (4th ed.). Los Angeles, CA: Sage
Publications.
Yukseloglu, S. M., Yayla, A. Y., & Yildiz, K. (2015). Yarn selection for weaving process to
determine the parameters in OE rotor spinning machine by using TOPSIS methodology.
Industria Textila, 66(1), 3-10.
Zadeh, L. A. (1965). Fuzzy sets. Information and control, 8(3), 338-353.
Zandi, F. z. i. a. i., & Tavana, M. (2012). A fuzzy group multi-criteria enterprise architecture
framework selection model. Expert Systems With Applications, 39(1), 1165-1173.
Zeynali, M., Aghdaie, M. H., Rezaeiniya, N., & Zolfani, S. H. (2012). A hybrid fuzzy multiple
criteria decision making (MCDM) approach to combination of materials selection.
African Journal of Business Management, 6(45), 11171-11178.
315
Zhang, S.-f., & Liu, S.-y. (2011). A GRA-based intuitionistic fuzzy multi-criteria group decision
making method for personnel selection. Expert Systems With Applications, 38, 11401-
11405.
Zhou, F., Lin, Y., Wang, X., Zhou, L., & He, Y. (2016). ELV recycling service provider
selection using the hybrid MCDM method: a case application in China. Sustainability,
8(5), 482.
Zimring, C., Augenbroe, G. L., Malone, E. B., & Sadler, B. L. (2008). Implementing Healthcare
Excellence: The Vital Role of the CEO in Evidence-Based Design. Herd-Health
Environments Research & Design Journal, 1(3), 7-21.
Zink, K., & Schmidt, A. (1995). Measuring universities against the European Quality Award
criteria. Total Quality Management, 5(5-6), 547–562.