Embed Size (px)
Citation preview
Impact assessment of wetlands:
a framework for the UK Environment Agency
Mike AcremanCentre for Ecology and Hydrology
Wallingford, UK
Environmental impact assessment• EIA “… a means of drawing together, in a
systematic way, an assessment of a project's likely significant environmental effects”
• “... enables environmental factors to be given due weight, along with economic or social factors, when planning applications are being considered”
• EU Directive 97/11/EC • National legislation on EIA
European drivers for “water” EIAs• Habitats Directive (92/43/EEC) - conservation of natural habitats - wild fauna and flora- Special Areas of Conservation (SACs)- maintain at, or restore to, 'favourable conservation status'
• Birds Directive (79/409/EEC) - special measures to conserve the habitats of listed species - Special Protection Areas (SPAs).
• Water Framework Directive (2000/60/EC) - achieve ‘good status’ in all water bodies
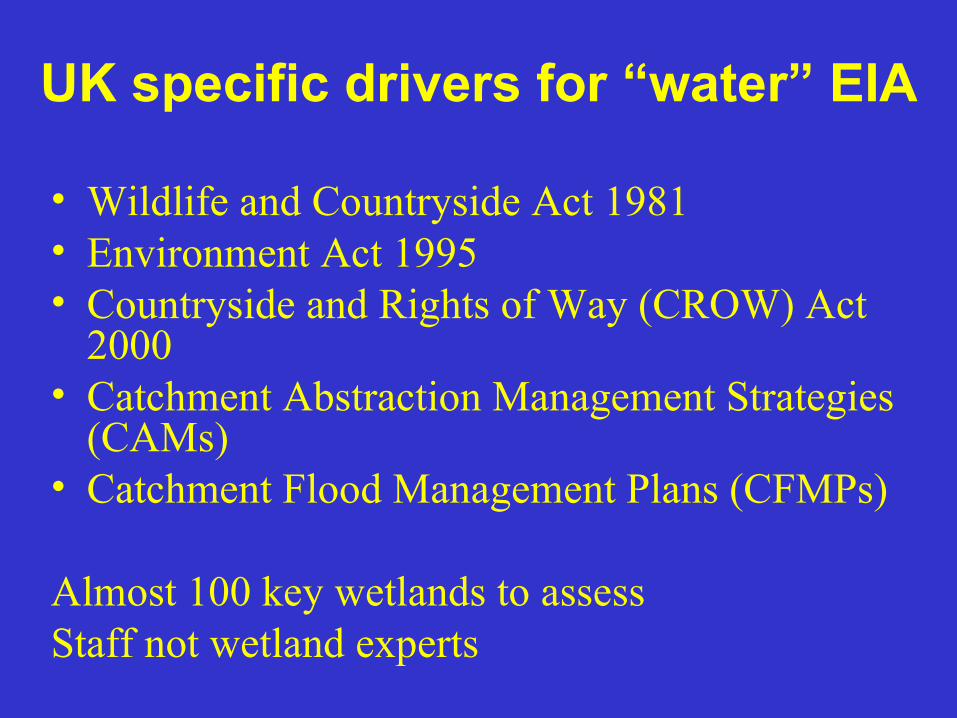
UK specific drivers for “water” EIA
• Wildlife and Countryside Act 1981 • Environment Act 1995• Countryside and Rights of Way (CROW) Act
2000• Catchment Abstraction Management Strategies
(CAMs)• Catchment Flood Management Plans (CFMPs)
Almost 100 key wetlands to assessStaff not wetland experts
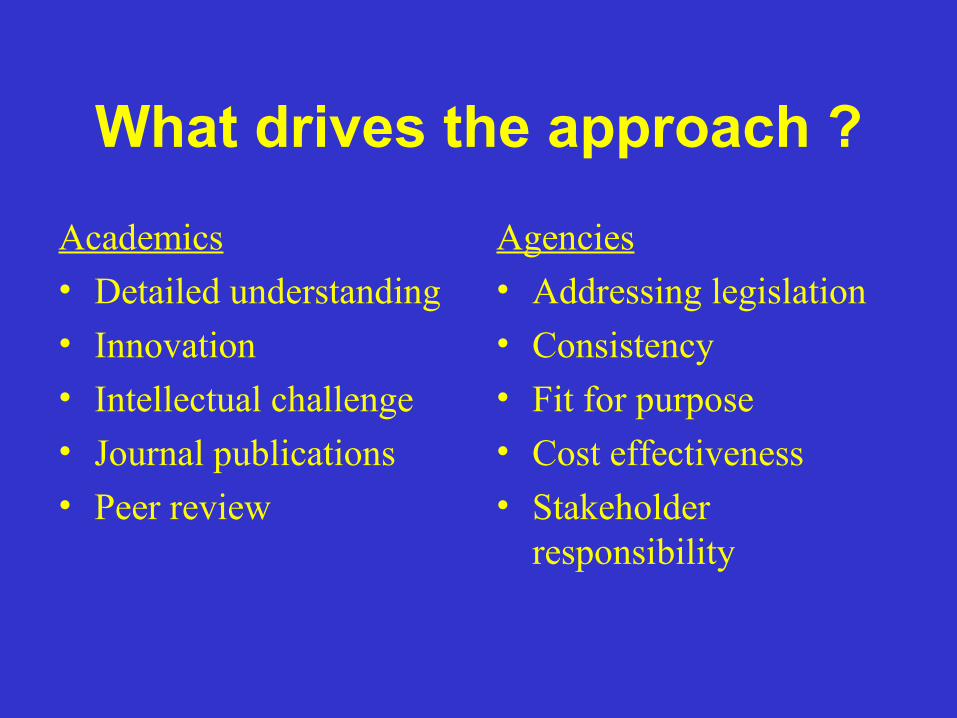
What drives the approach ?
Academics• Detailed understanding• Innovation• Intellectual challenge• Journal publications• Peer review
Agencies• Addressing legislation• Consistency• Fit for purpose• Cost effectiveness• Stakeholder
responsibility

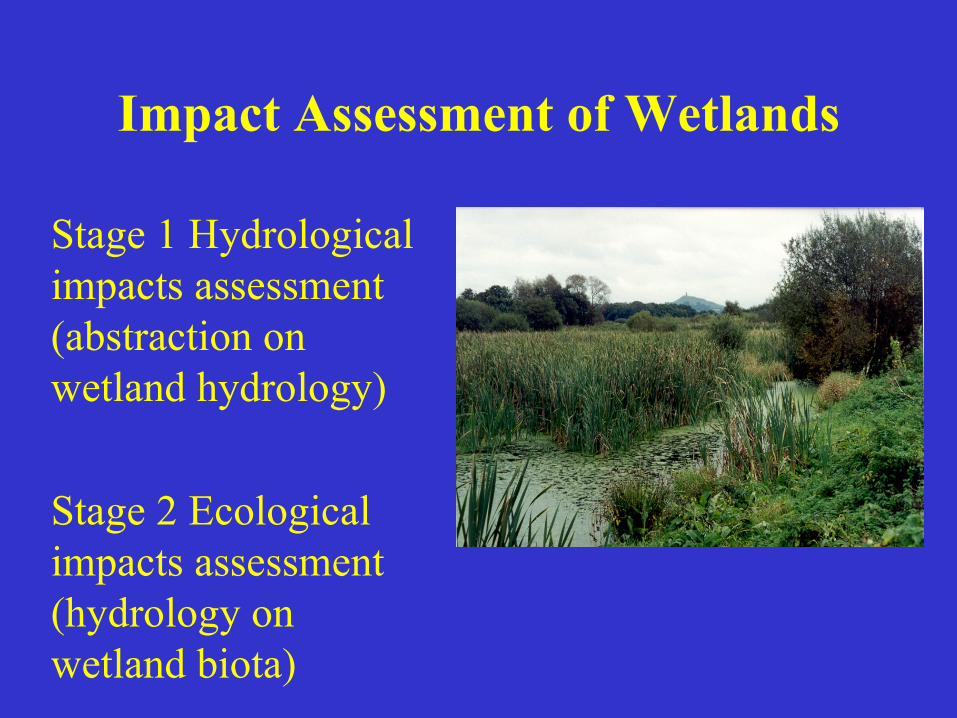
Impact Assessment of Wetlands
Stage 1 Hydrological impacts assessment (abstraction on wetland hydrology)
Stage 2 Ecological impacts assessment (hydrology on wetland biota)
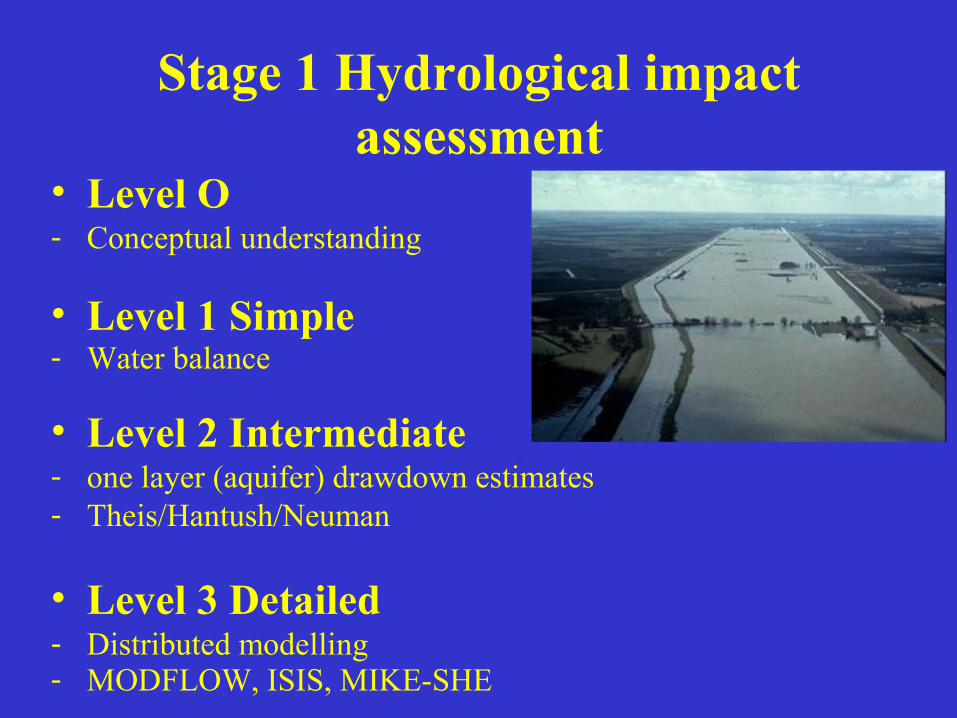
Stage 1 Hydrological impact assessment
• Level O- Conceptual understanding
• Level 1 Simple- Water balance
• Level 2 Intermediate- one layer (aquifer) drawdown estimates- Theis/Hantush/Neuman
• Level 3 Detailed- Distributed modelling- MODFLOW, ISIS, MIKE-SHE
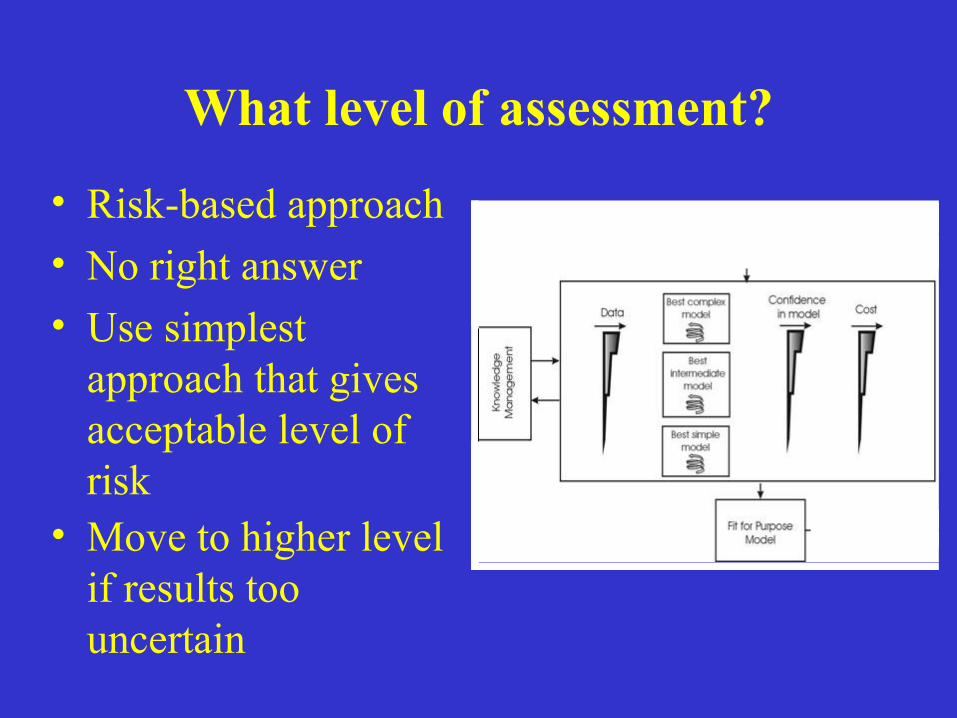
What level of assessment?
• Risk-based approach• No right answer• Use simplest
approach that gives acceptable level of risk
• Move to higher level if results too uncertain
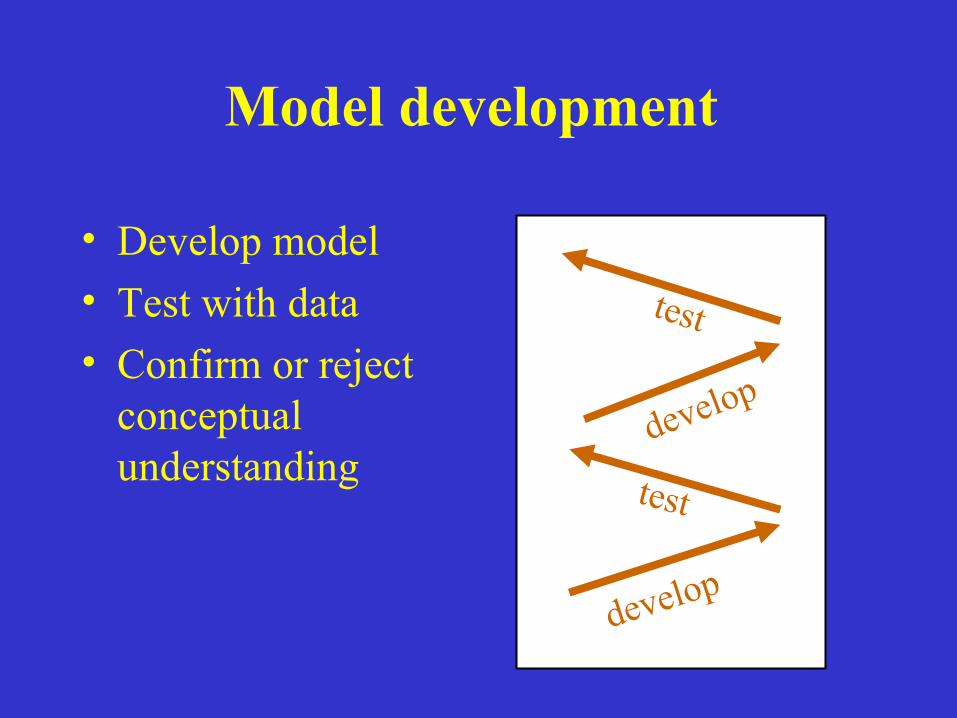
Model development
• Develop model• Test with data• Confirm or reject
conceptual understanding
develop
test
develop
test
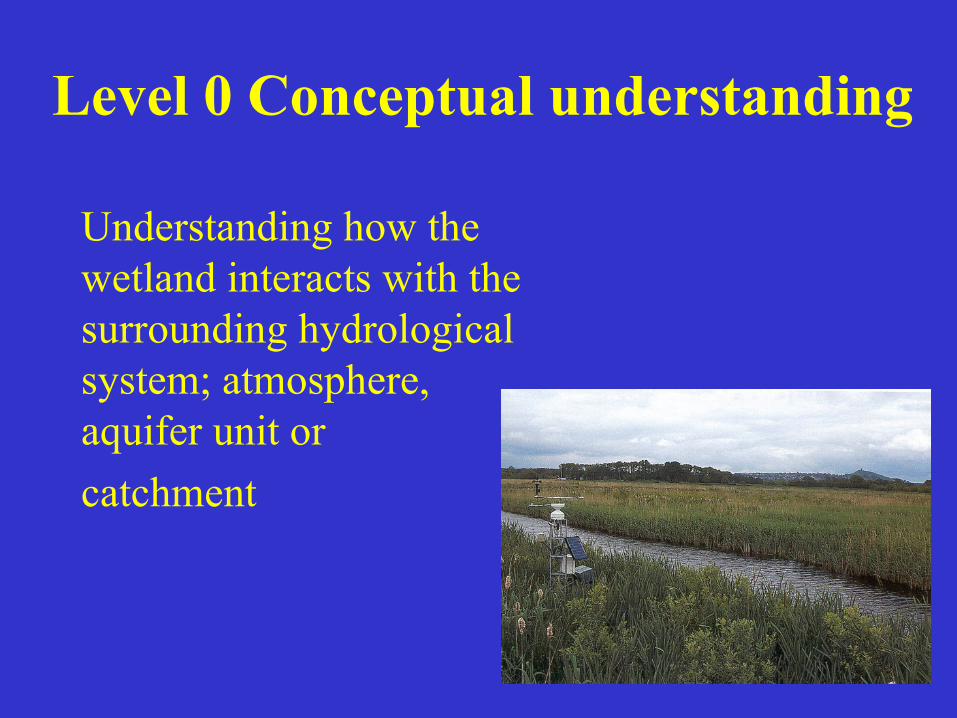
Level 0 Conceptual understanding
Understanding how the wetland interacts with the surrounding hydrological system; atmosphere, aquifer unit or catchment
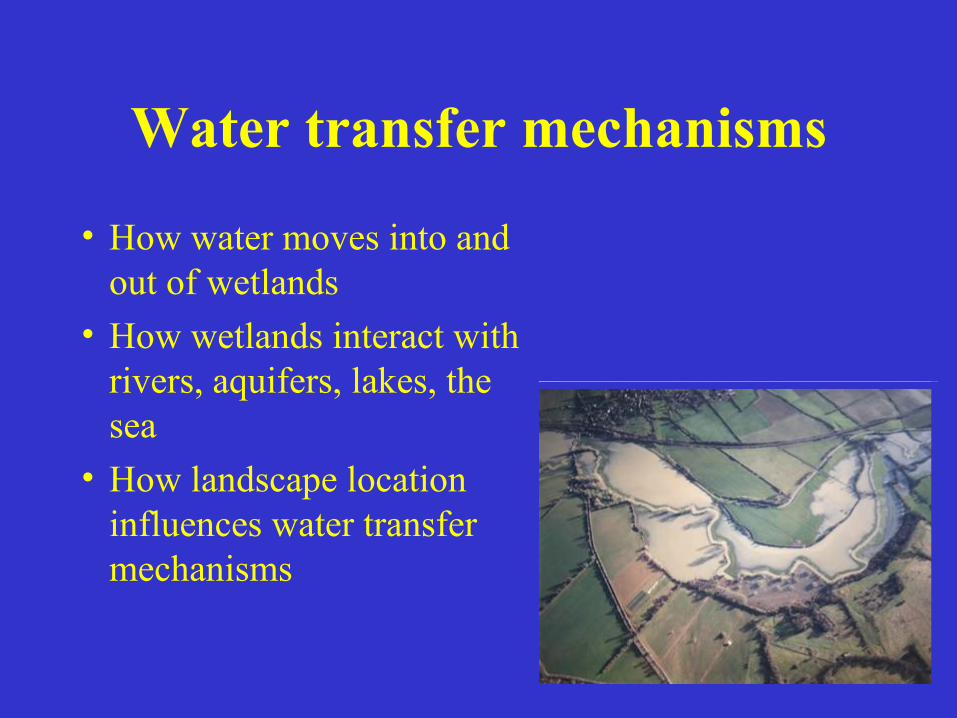
Water transfer mechanisms
• How water moves into and out of wetlands
• How wetlands interact with rivers, aquifers, lakes, the sea
• How landscape location influences water transfer mechanisms
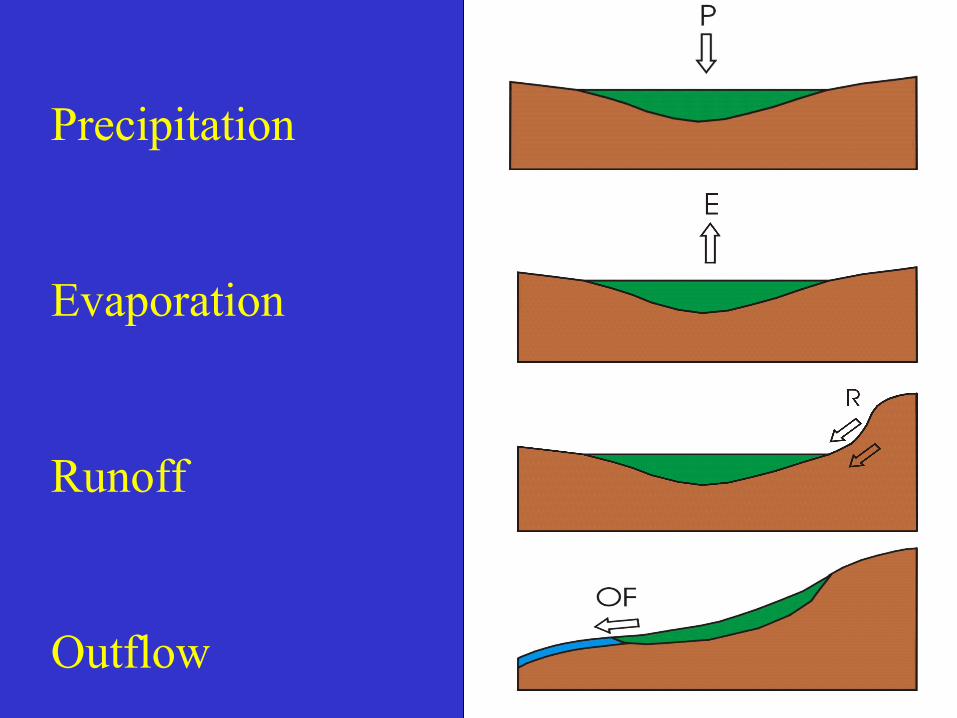
Precipitation
Evaporation
Runoff
Outflow
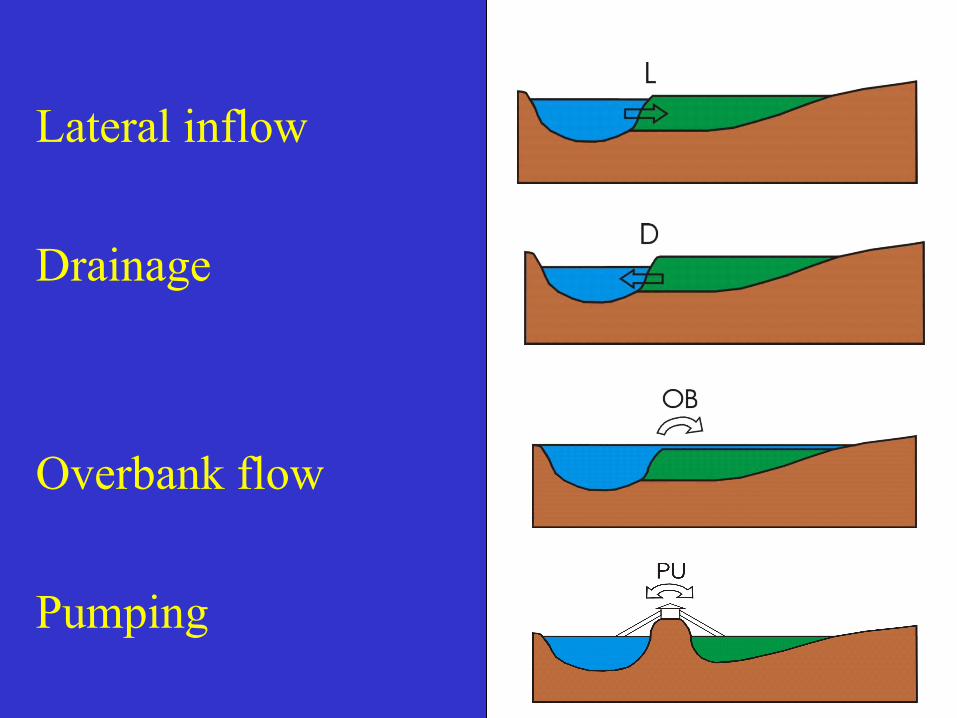
Lateral inflow
Drainage
Overbank flow
Pumping
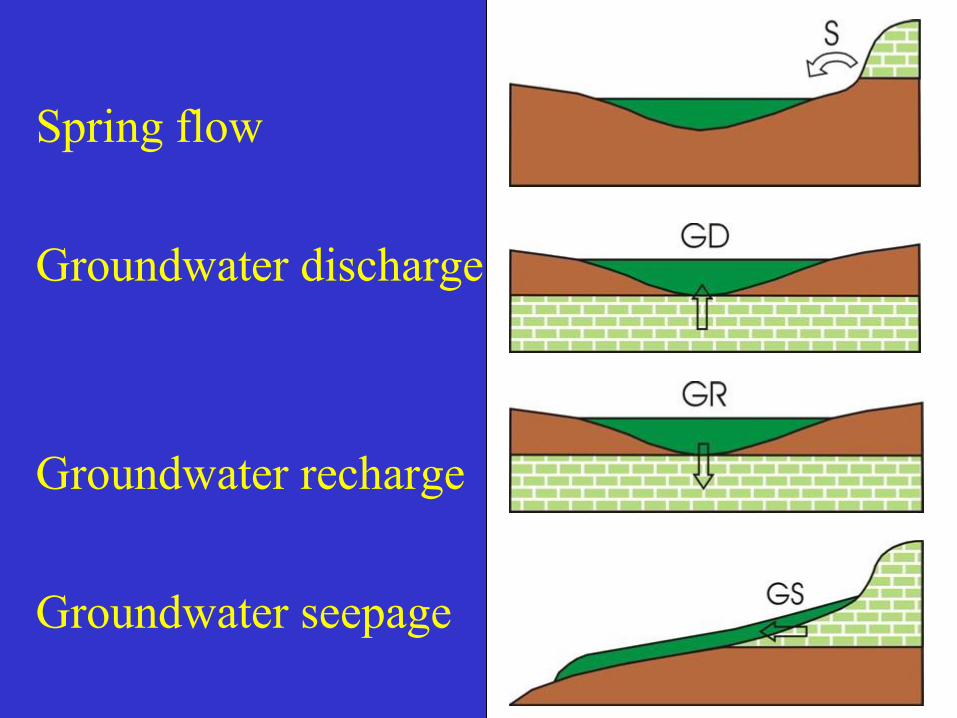
Spring flow
Groundwater discharge
Groundwater recharge
Groundwater seepage
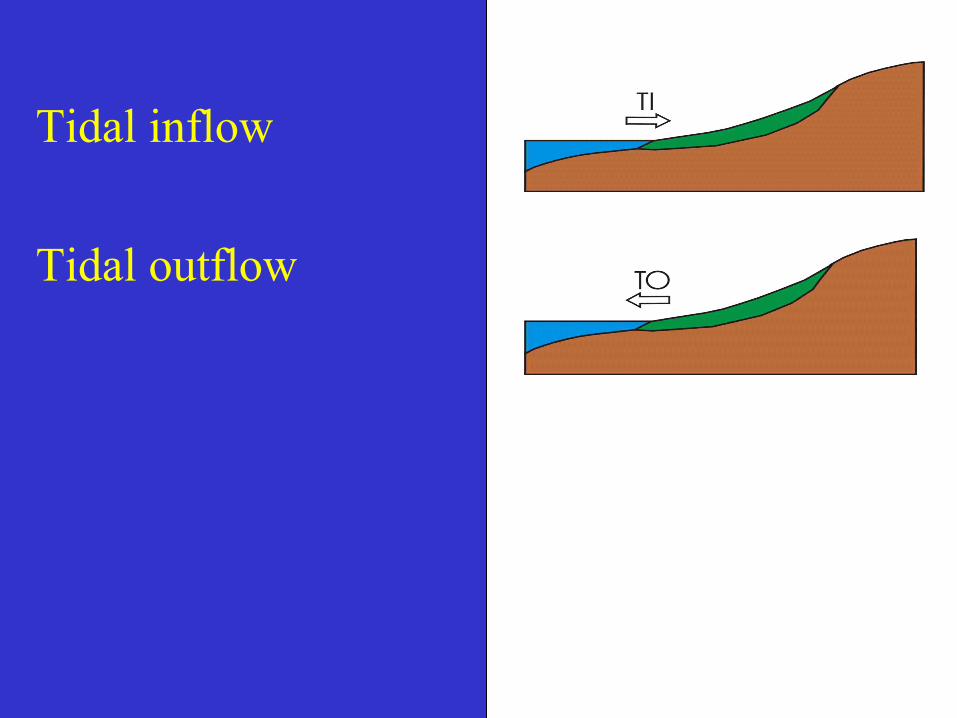
Tidal inflow
Tidal outflow
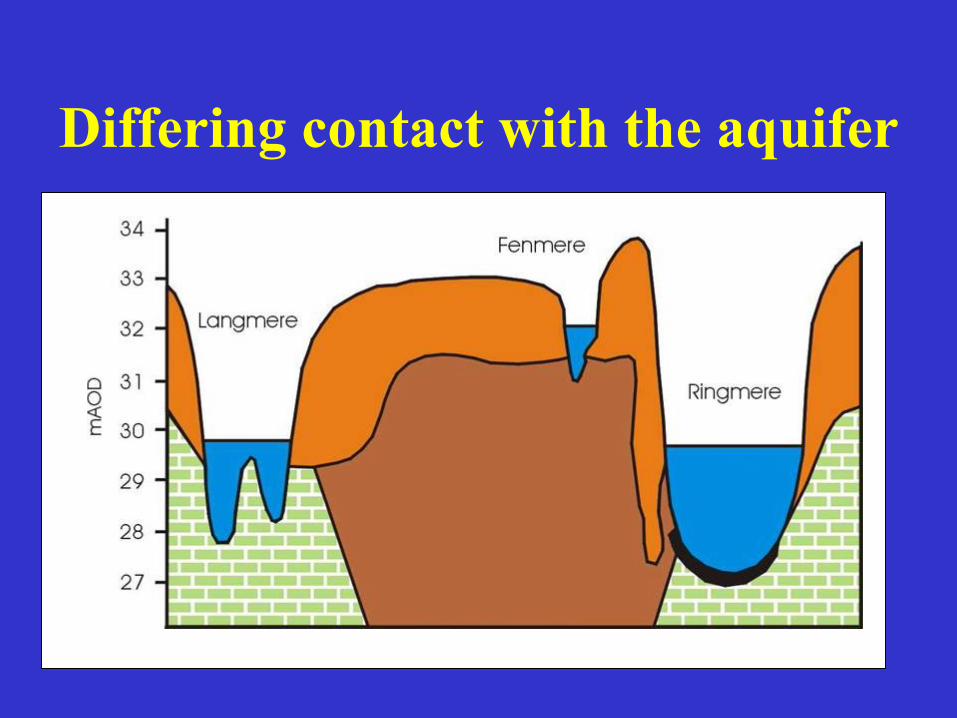
Differing contact with the aquifer
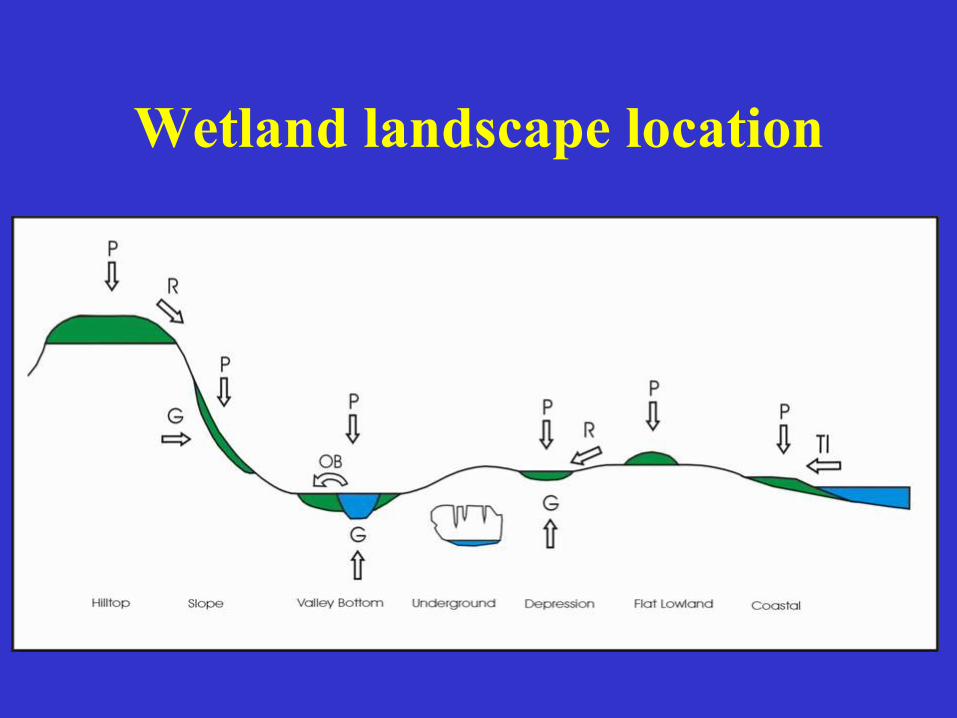
Wetland landscape location
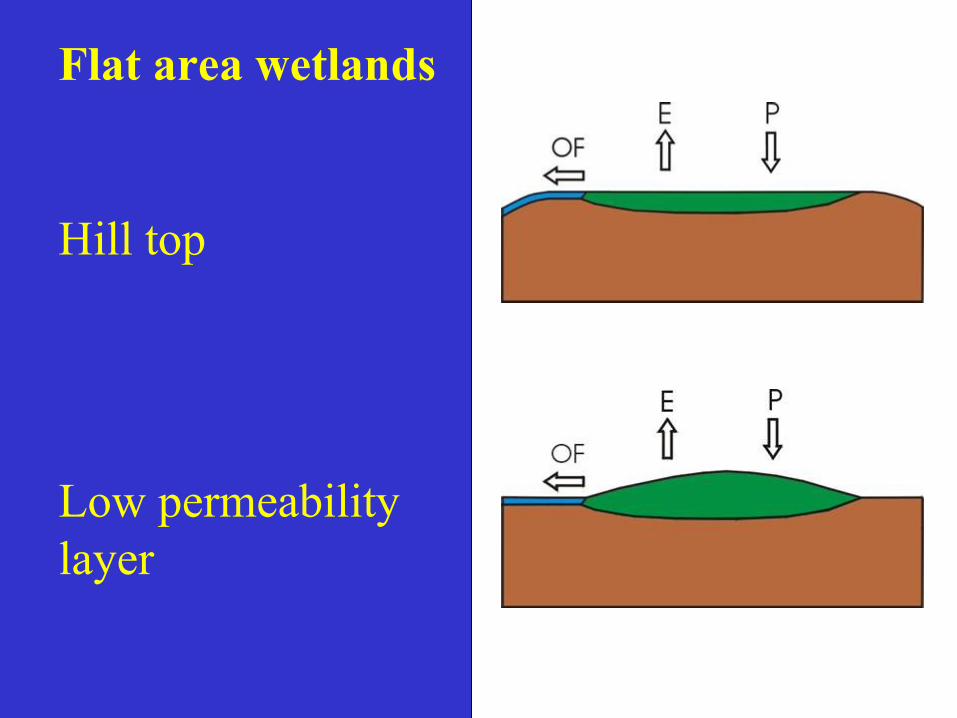
Flat area wetlands
Hill top
Low permeability layer
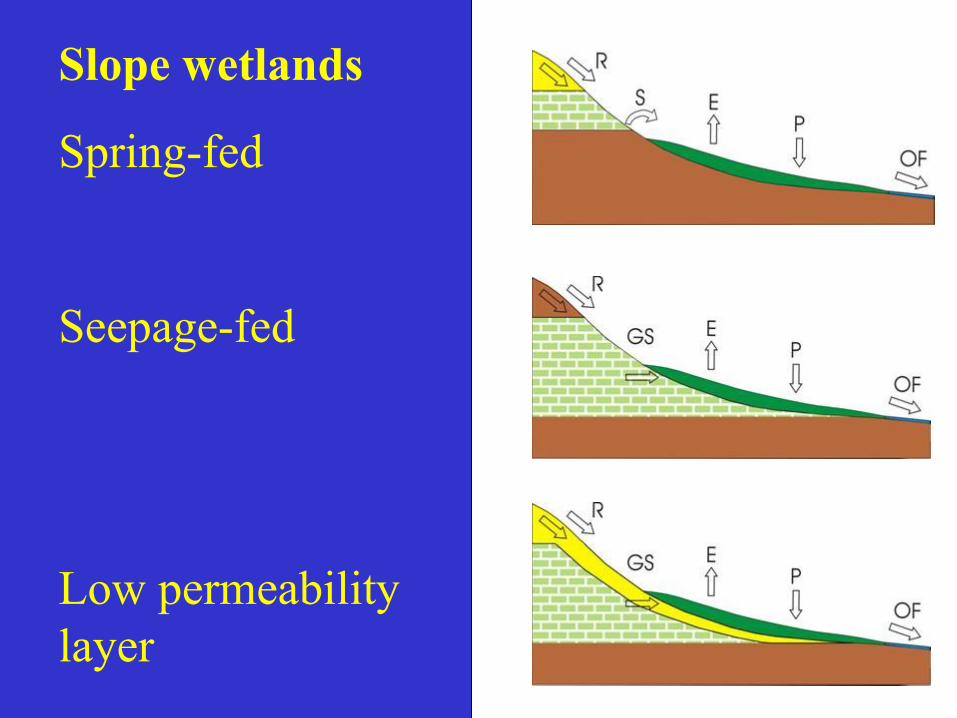
Slope wetlands
Spring-fed
Seepage-fed
Low permeability layer
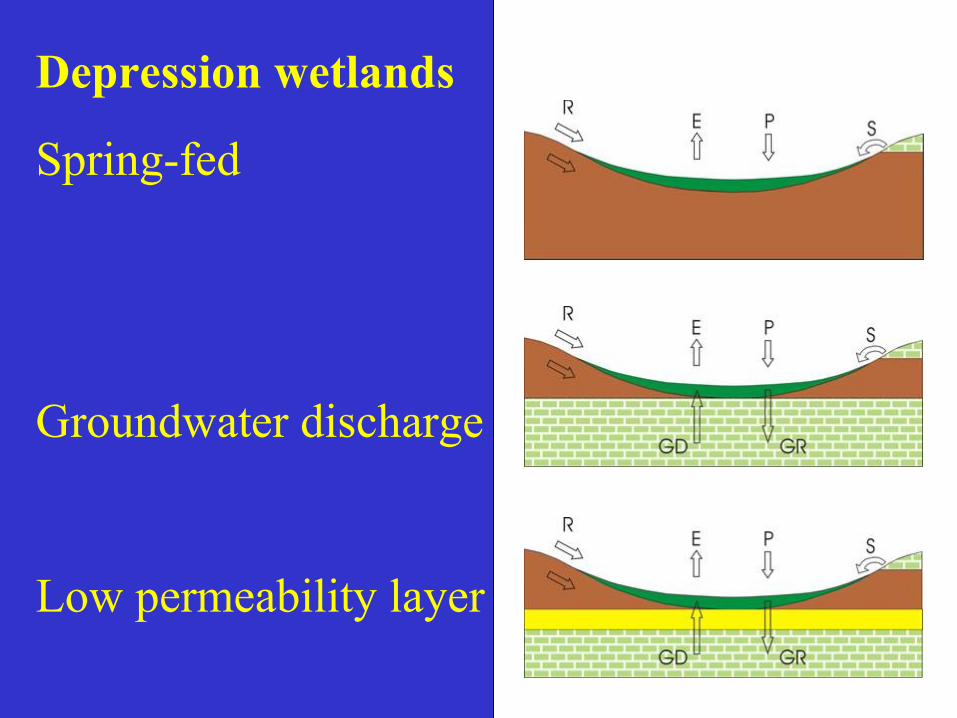
Depression wetlands
Spring-fed
Groundwater discharge
Low permeability layer
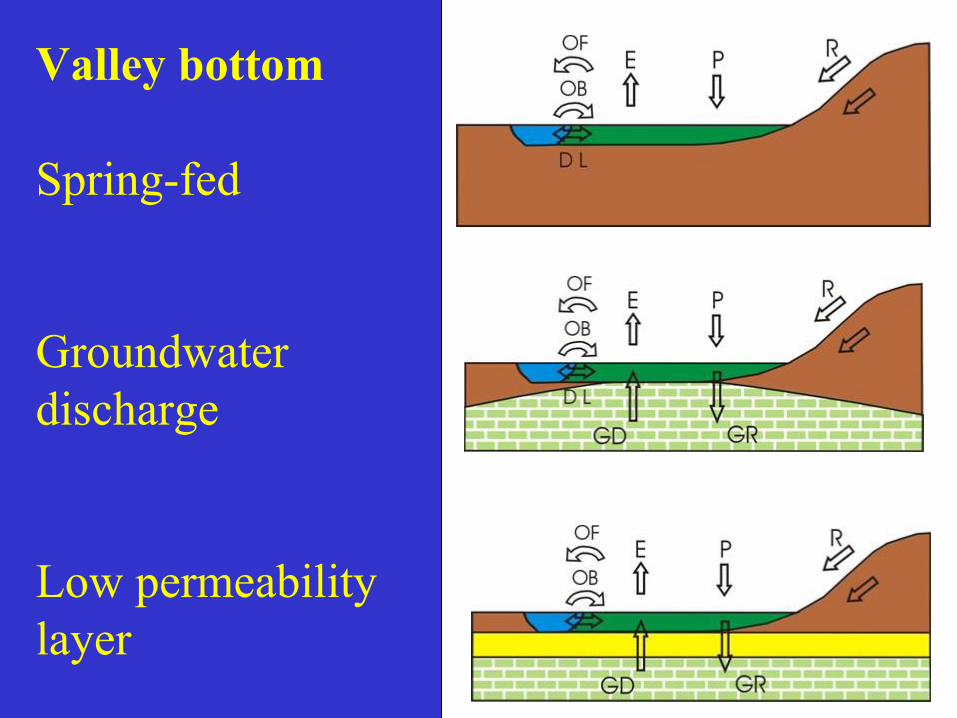
Valley bottom
Spring-fed
Groundwater discharge
Low permeability layer
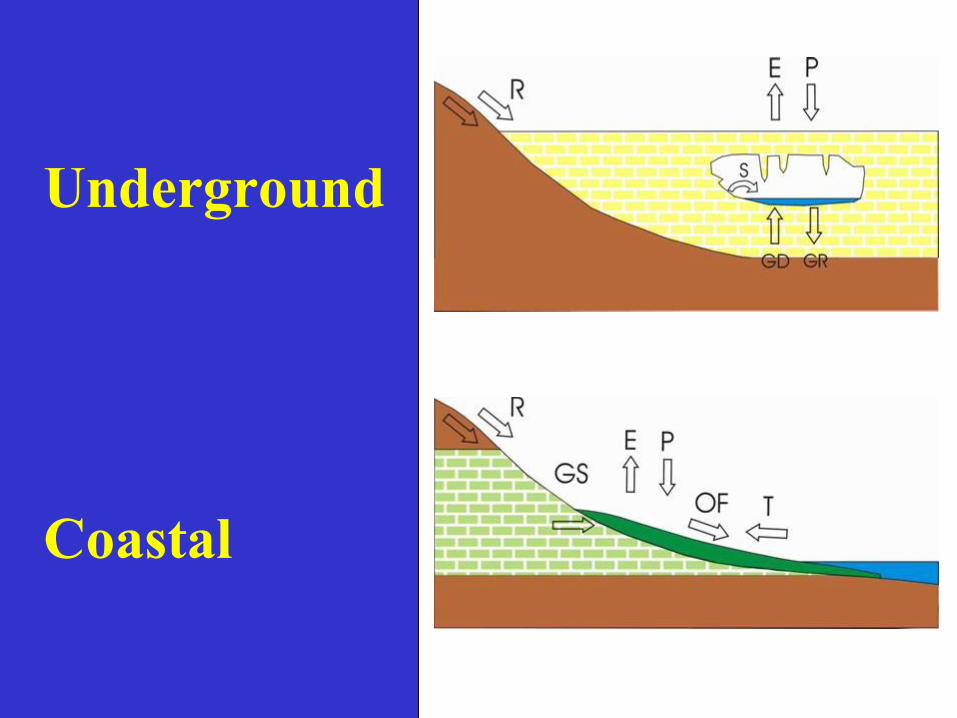
Underground
Coastal
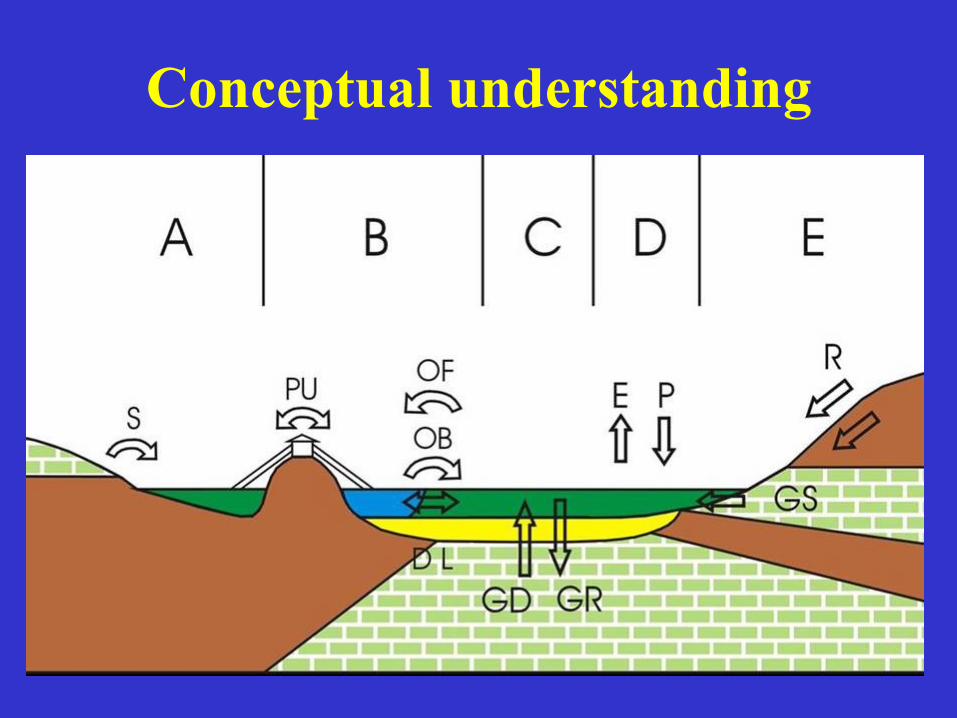
Conceptual understanding
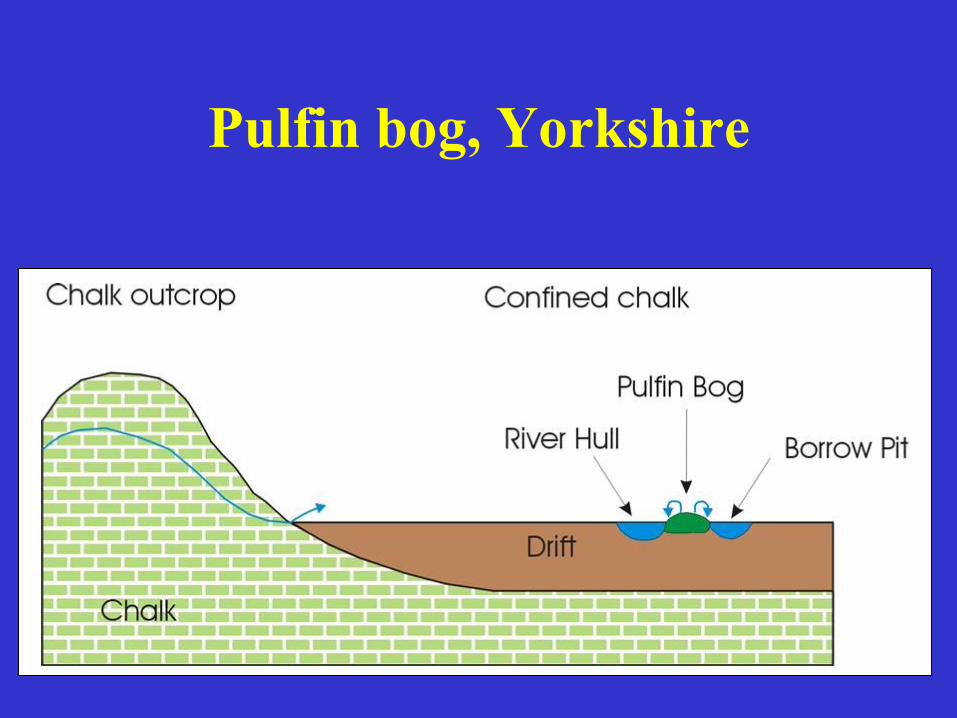
Pulfin bog, Yorkshire
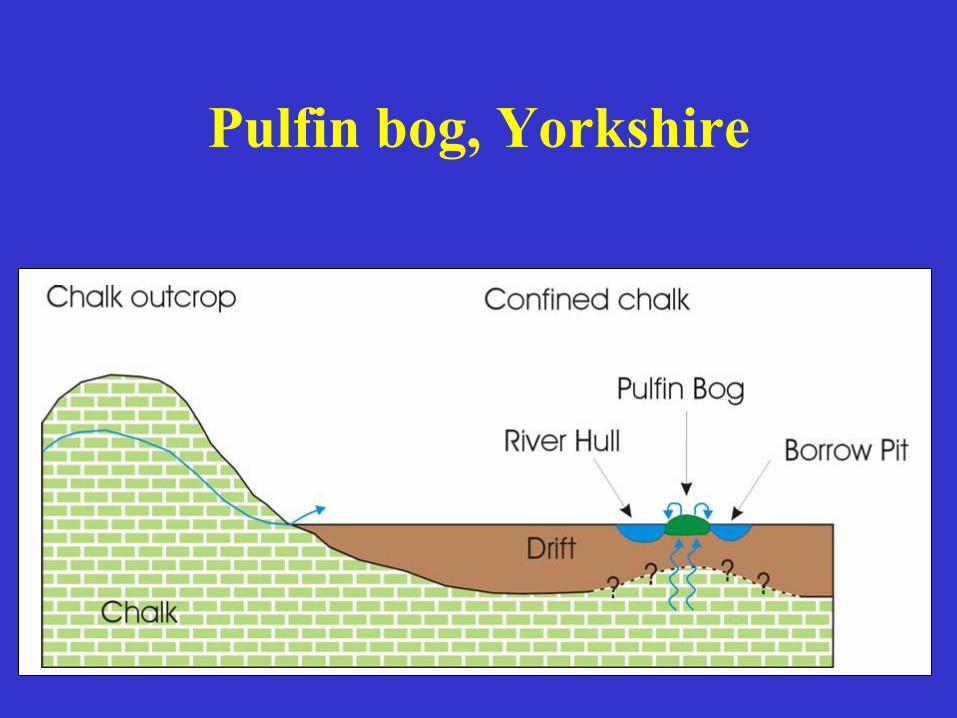
Pulfin bog, Yorkshire
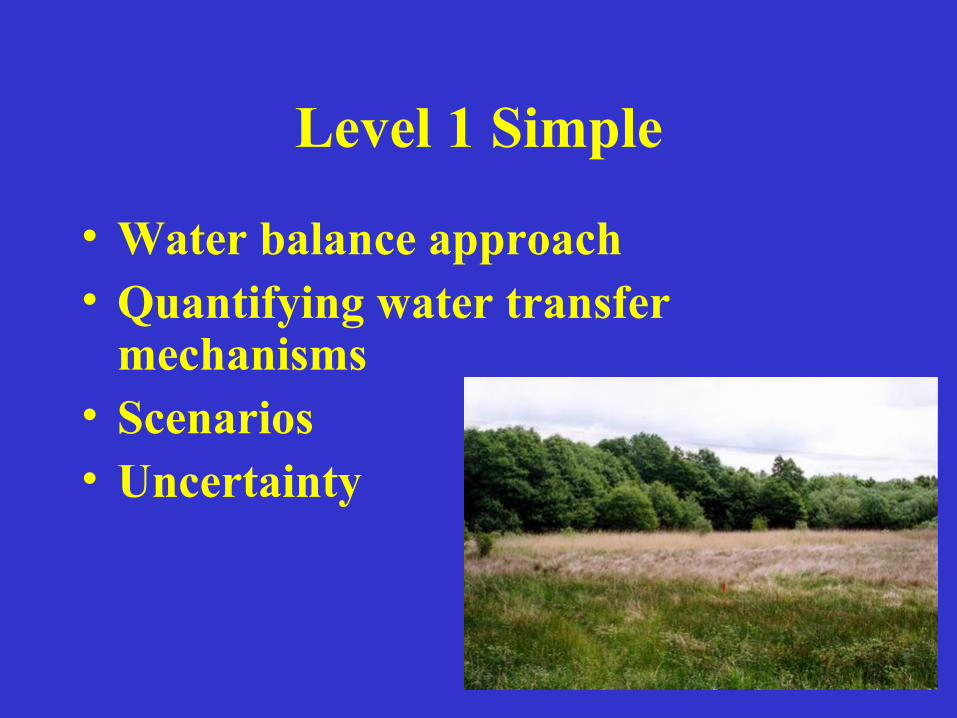
Level 1 Simple
• Water balance approach• Quantifying water transfer
mechanisms• Scenarios• Uncertainty
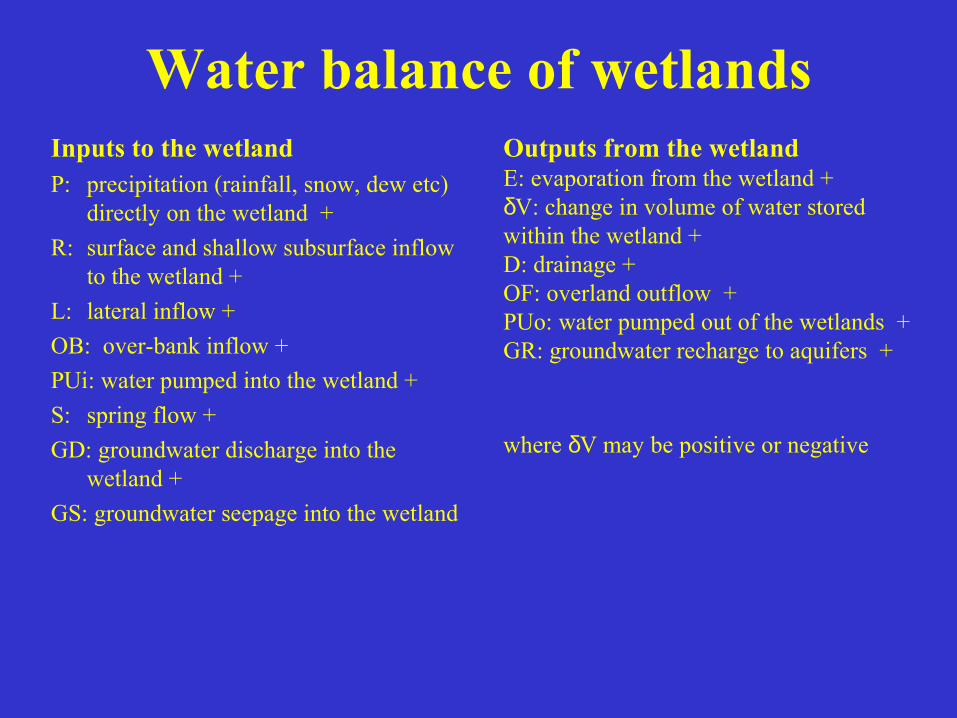
Water balance of wetlandsInputs to the wetland P: precipitation (rainfall, snow, dew etc)
directly on the wetland +R: surface and shallow subsurface inflow
to the wetland +L: lateral inflow +OB: over-bank inflow +PUi: water pumped into the wetland +S: spring flow +GD: groundwater discharge into the
wetland +GS: groundwater seepage into the wetland
Outputs from the wetland E: evaporation from the wetland +δV: change in volume of water stored within the wetland +D: drainage +OF: overland outflow +PUo: water pumped out of the wetlands +GR: groundwater recharge to aquifers +
where δV may be positive or negative
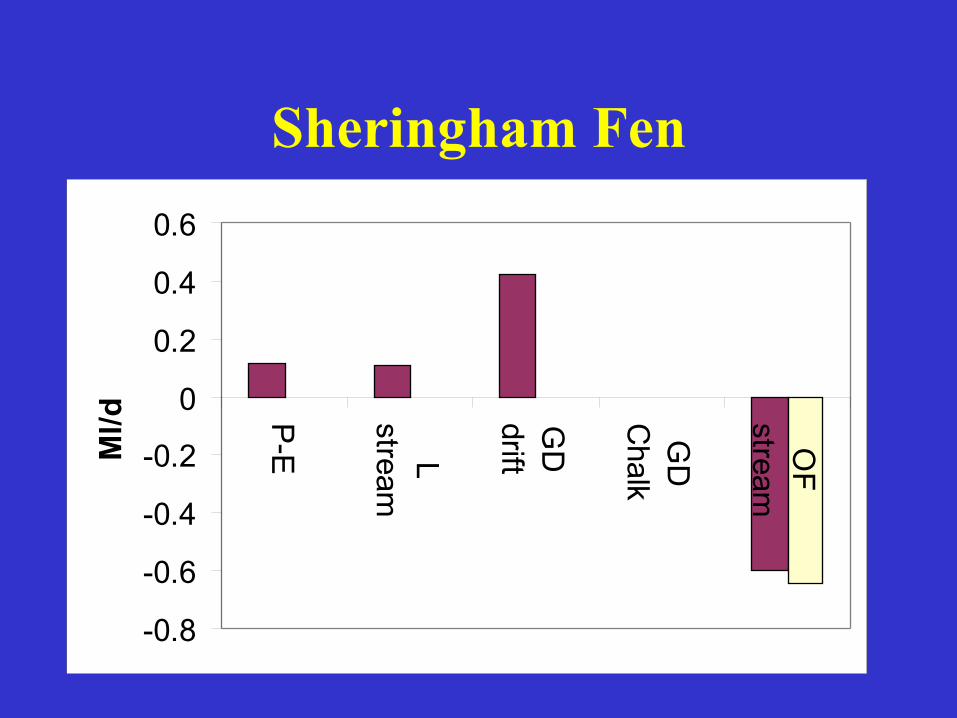
Sheringham Fen
-0.8
-0.6
-0.4
-0.2
0
0.2
0.4
0.6
P-E L
stream
GD
drift
GD
Chalk
OF
stream
Ml/d

Scenarios for Lopham and Redgrave Fen
-1.2
-0.8
-0.4
0
0.4
0.8
1.2
P-E
L riverL Little FenL M
iddleL Zone 1G
D C
halkD
riverD
Middle
D Little Fen
D Zone 1
GR
Chalk
Ml/d no abstraction
full licensed
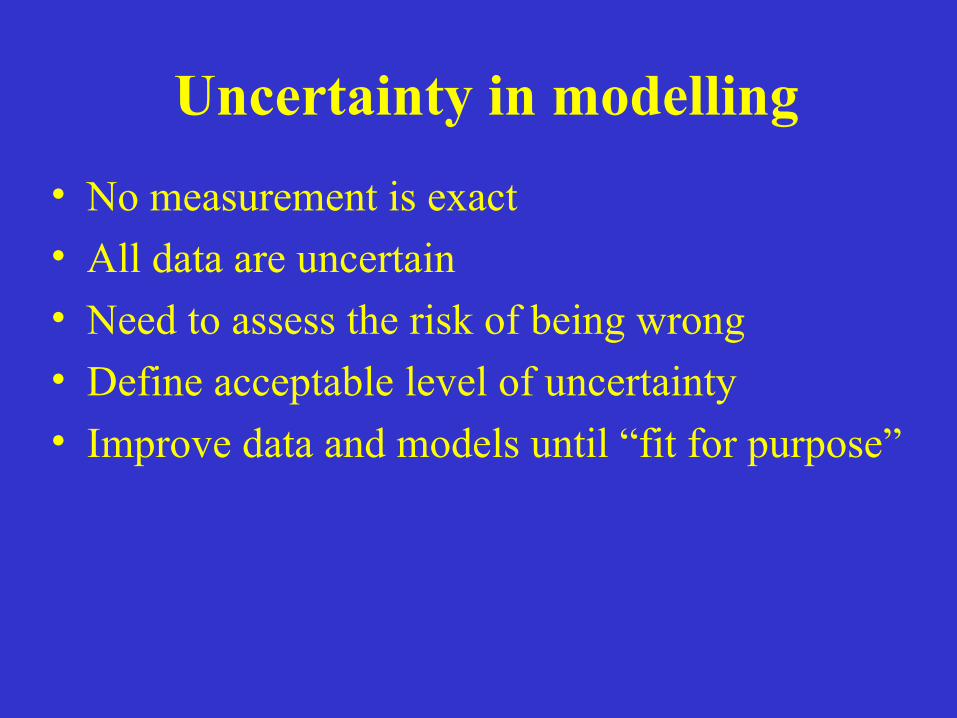
Uncertainty in modelling• No measurement is exact • All data are uncertain • Need to assess the risk of being wrong • Define acceptable level of uncertainty• Improve data and models until “fit for purpose”
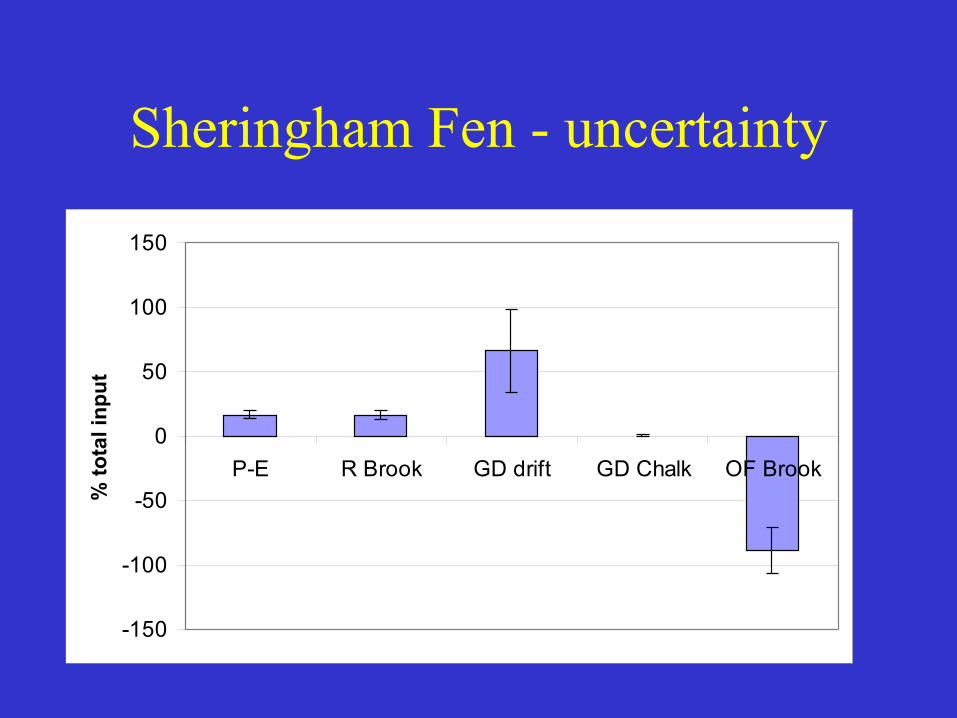
Sheringham Fen - uncertainty
-150
-100
-50
0
50
100
150
P-E R Brook GD drift GD Chalk OF Brook
% to
tal i
nput
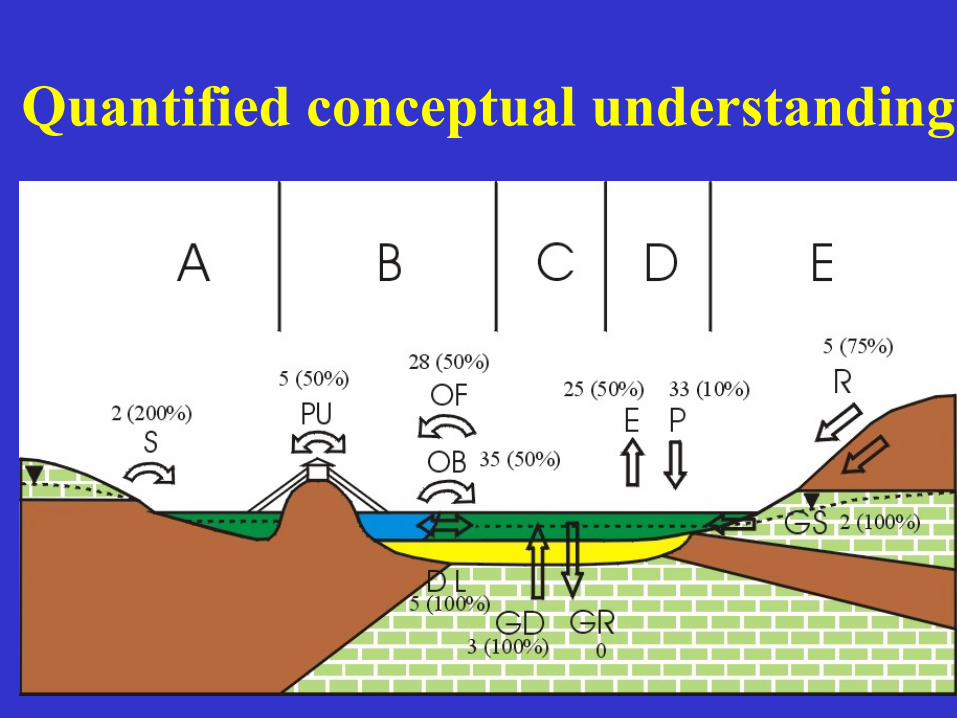
Quantified conceptual understanding
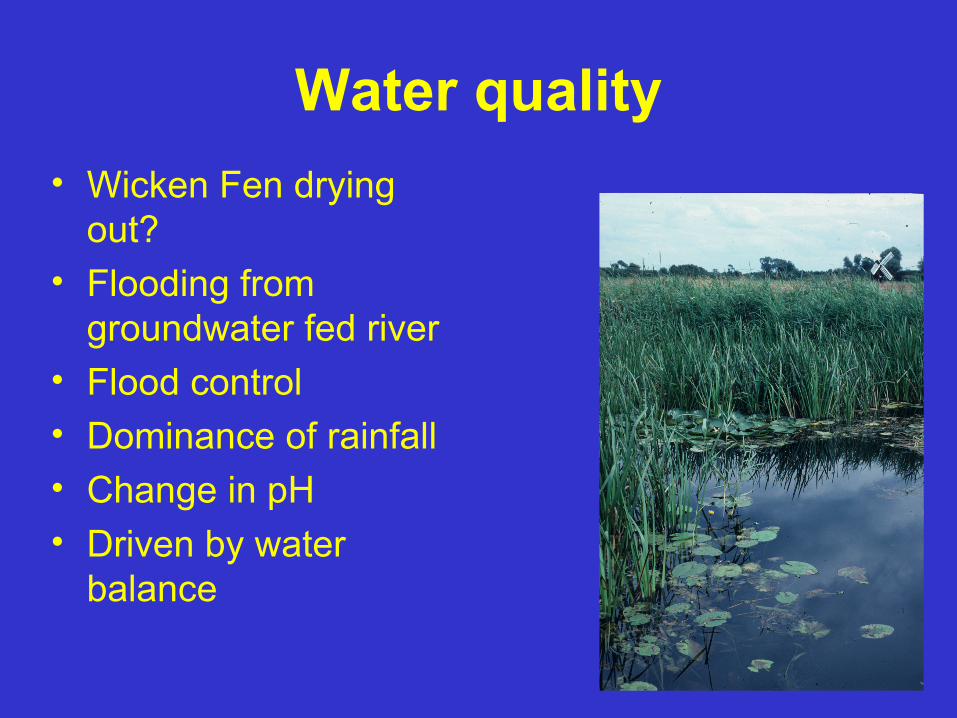
Water quality• Wicken Fen drying
out?• Flooding from
groundwater fed river• Flood control• Dominance of rainfall• Change in pH• Driven by water
balance
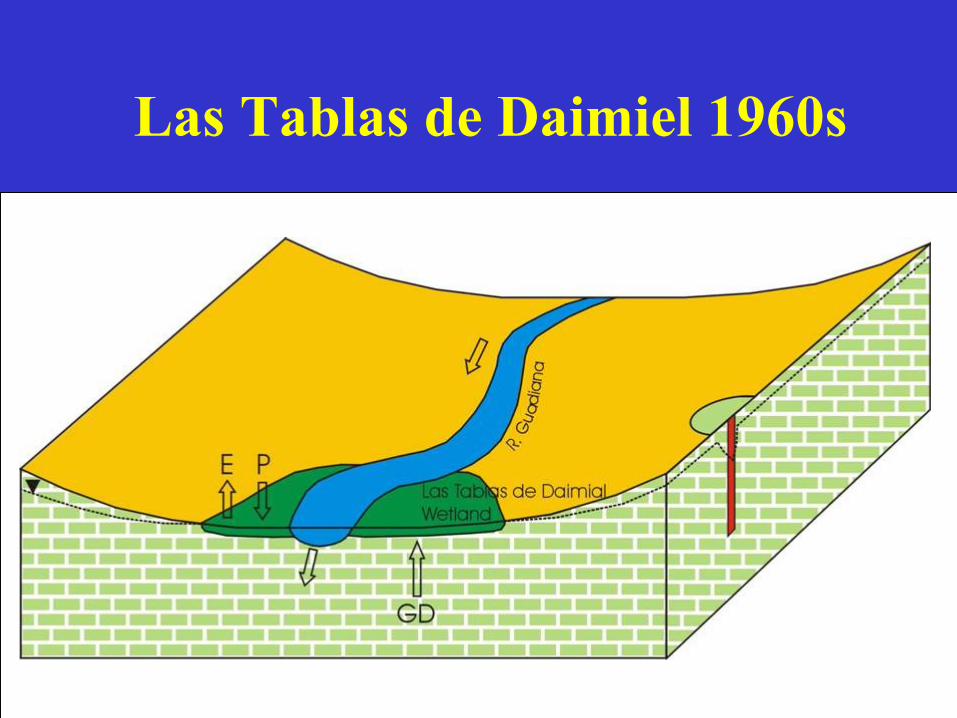
Las Tablas de Daimiel 1960s
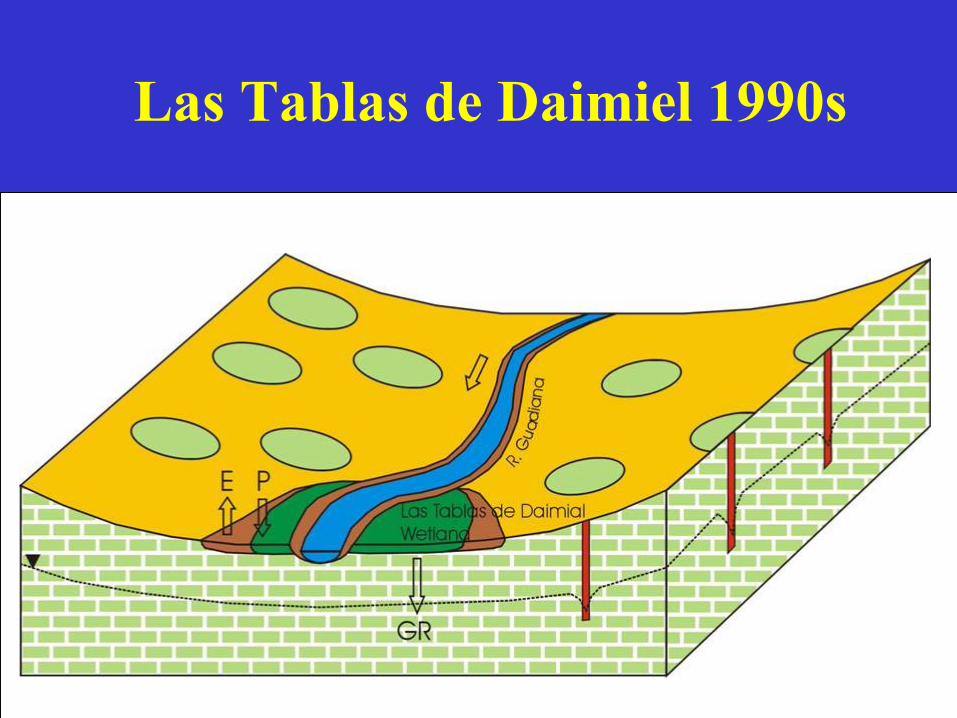
Las Tablas de Daimiel 1990s
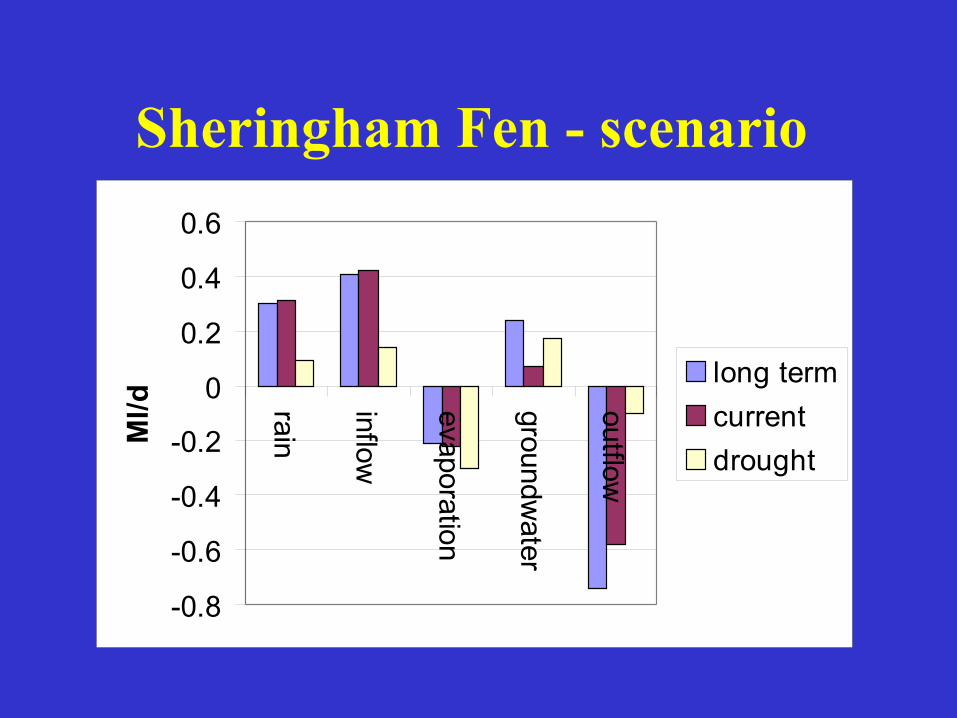
Sheringham Fen - scenario
-0.8
-0.6
-0.4
-0.2
0
0.2
0.4
0.6
rain
inflow
evaporation
groundwater
outflow
Ml/d
long termcurrentdrought
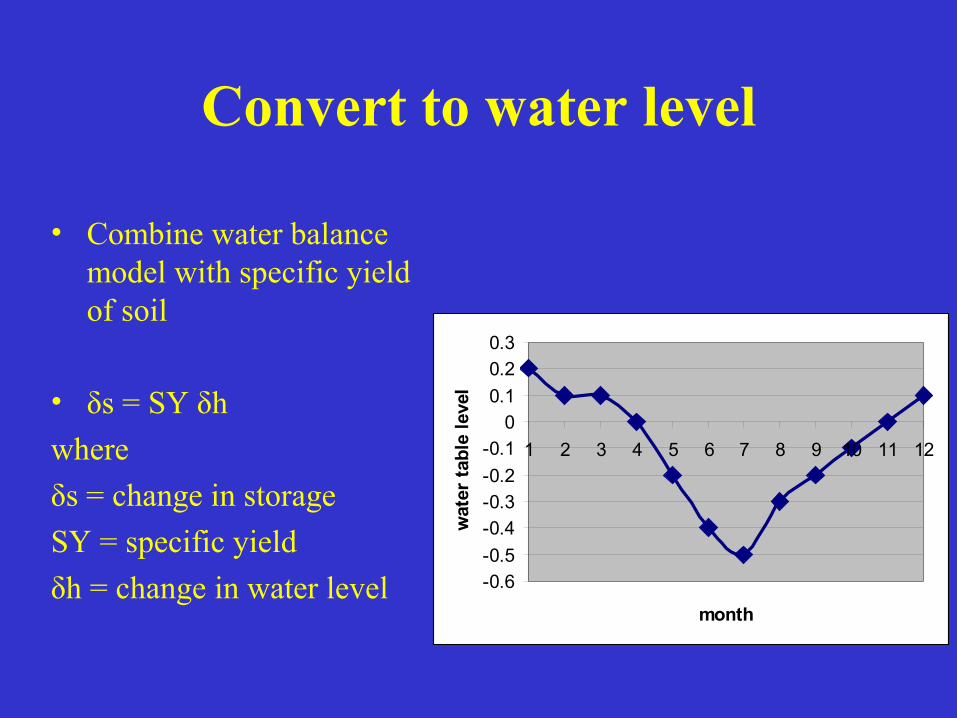
Convert to water level
• Combine water balance model with specific yield of soil
• δs = SY δhwhere δs = change in storageSY = specific yield δh = change in water level -0.6
-0.5-0.4-0.3-0.2-0.1
00.10.20.3
1 2 3 4 5 6 7 8 9 10 11 12
month
wat
er ta
ble
leve
l
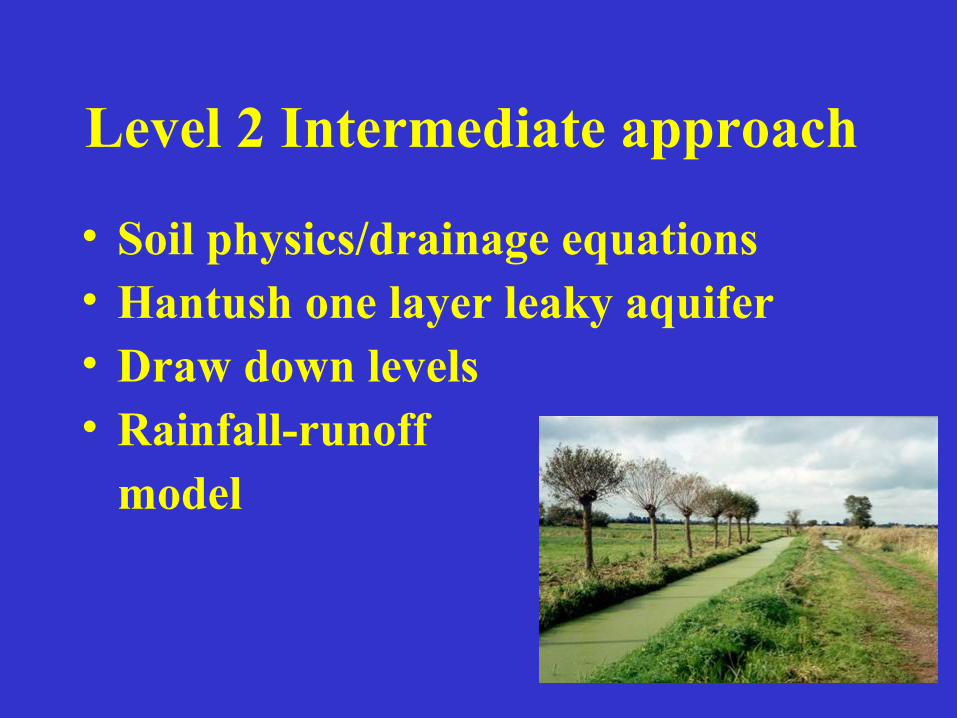
Level 2 Intermediate approach
• Soil physics/drainage equations• Hantush one layer leaky aquifer• Draw down levels• Rainfall-runoff model
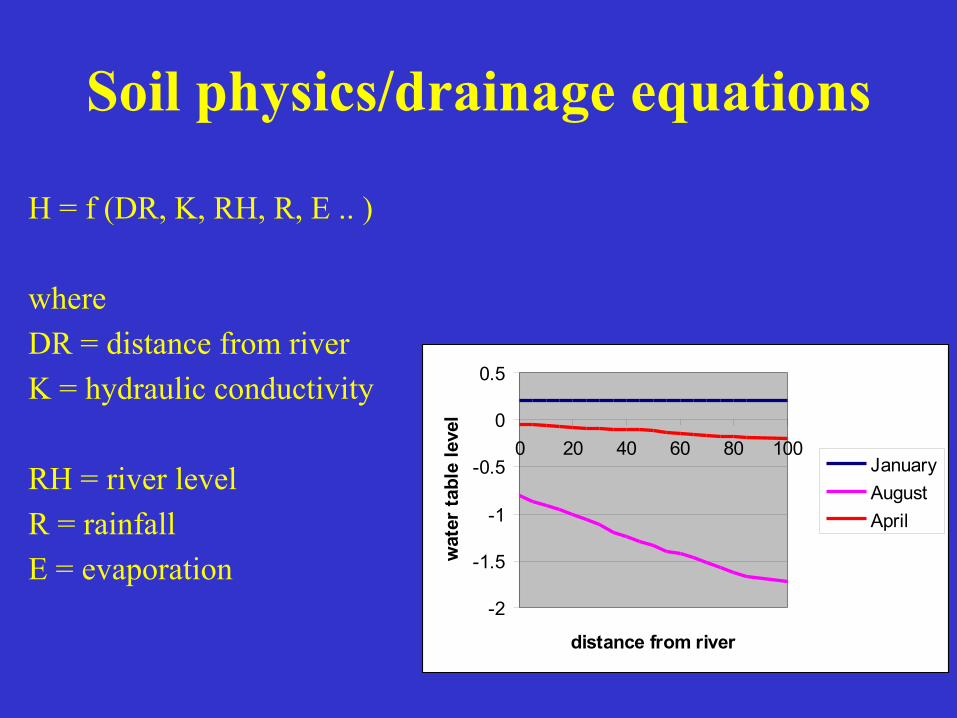
Soil physics/drainage equations
H = f (DR, K, RH, R, E .. )
whereDR = distance from riverK = hydraulic conductivity
RH = river levelR = rainfallE = evaporation
-2
-1.5
-1
-0.5
0
0.5
0 20 40 60 80 100
distance from river
wat
er ta
ble
leve
lJanuaryAugustApril
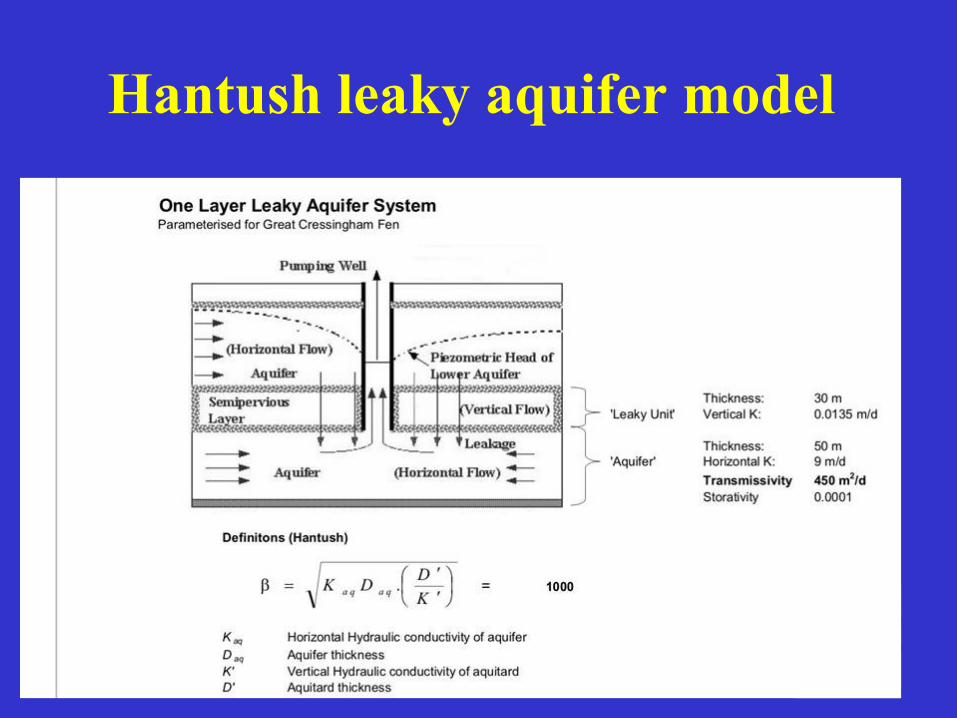
Example simple assessmentHantush leaky aquifer model
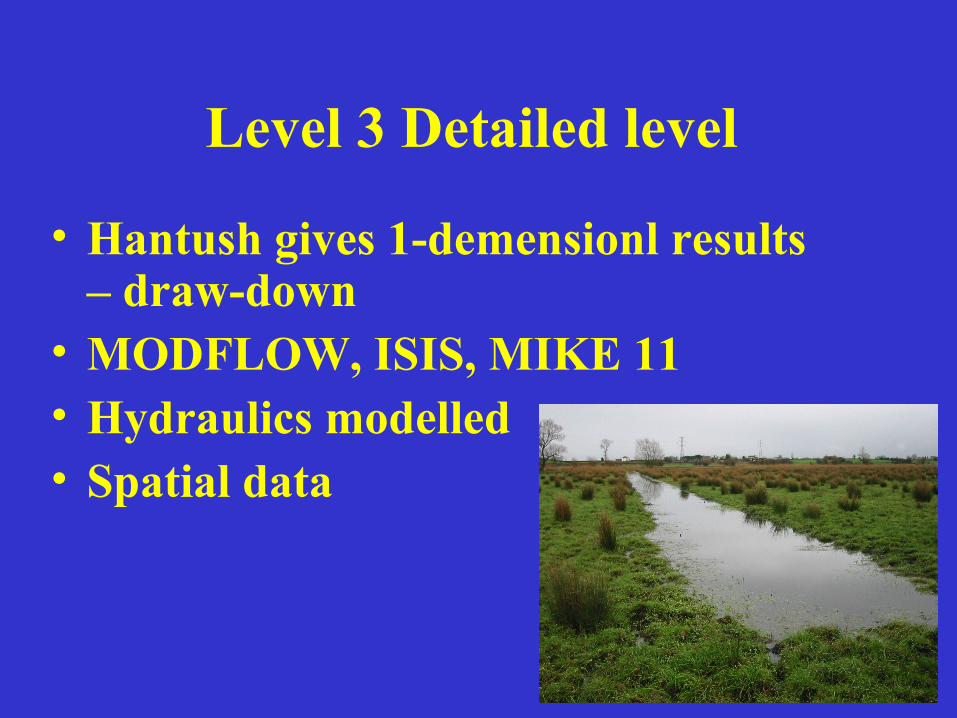
Level 3 Detailed level
• Hantush gives 1-demensionl results – draw-down
• MODFLOW, ISIS, MIKE 11• Hydraulics modelled• Spatial data
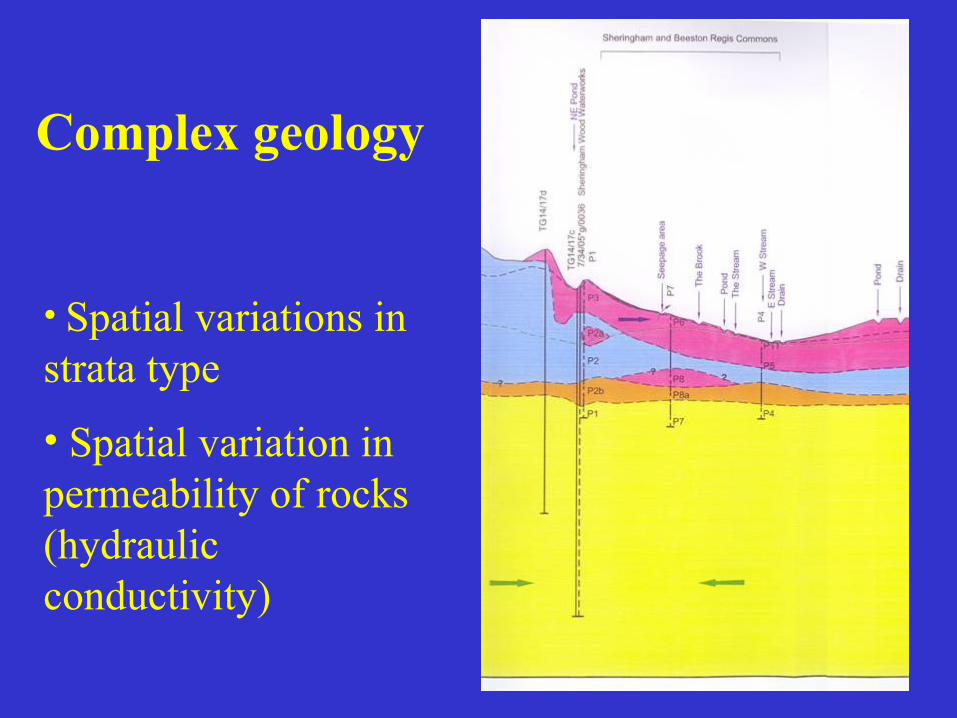
Complex geology
• Spatial variations in strata type
• Spatial variation in permeability of rocks (hydraulic conductivity)
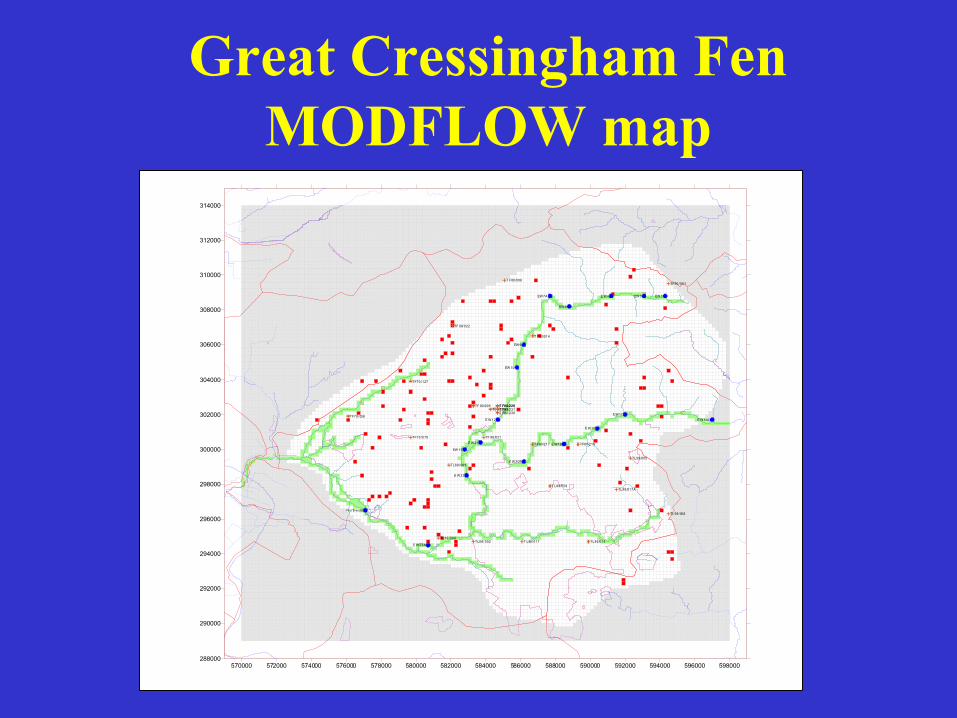
Great Cressingham Fen MODFLOW map
570000 572000 574000 576000 578000 580000 582000 584000 586000 588000 590000 592000 594000 596000 598000288000
290000
292000
294000
296000
298000
300000
302000
304000
306000
308000
310000
312000
314000
N orthw old
E W 23A
E W 22
EW 13
E W 12
EW 10
EW 9
EW 7A
EW 6
E W 4 EW 3 EW 1
E W 14AE W 17
E W 18
E W 19
E W 20B
E W 21
TF70/ 038
TF70/ 070
TF70/ 127
TF 80/005
T F80/006
T F80/014
TF 80/021
TF 80/ 022
TF 80/192
TF80/216T F80/217
T F80/225T F80/226
T F80/230T F80/231
TF90/ 001
TL89/ 002
TL89/ 005
TL89/ 006TL89/014T L89/ 017
T L89/019
TL99/005
TL99/ 008
TL99/017A
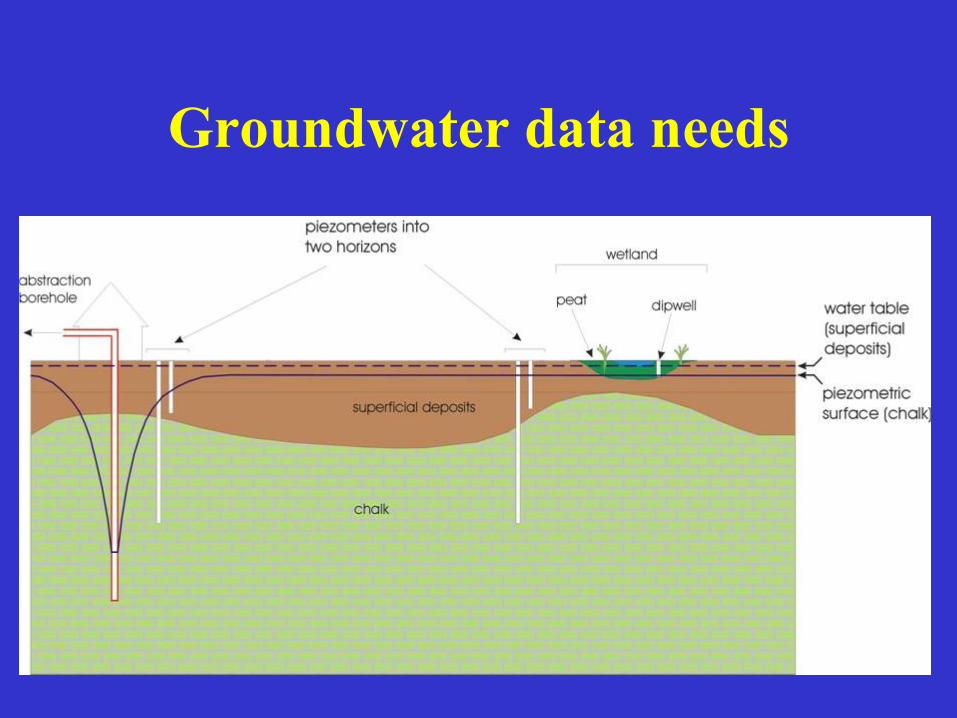
Groundwater data needs
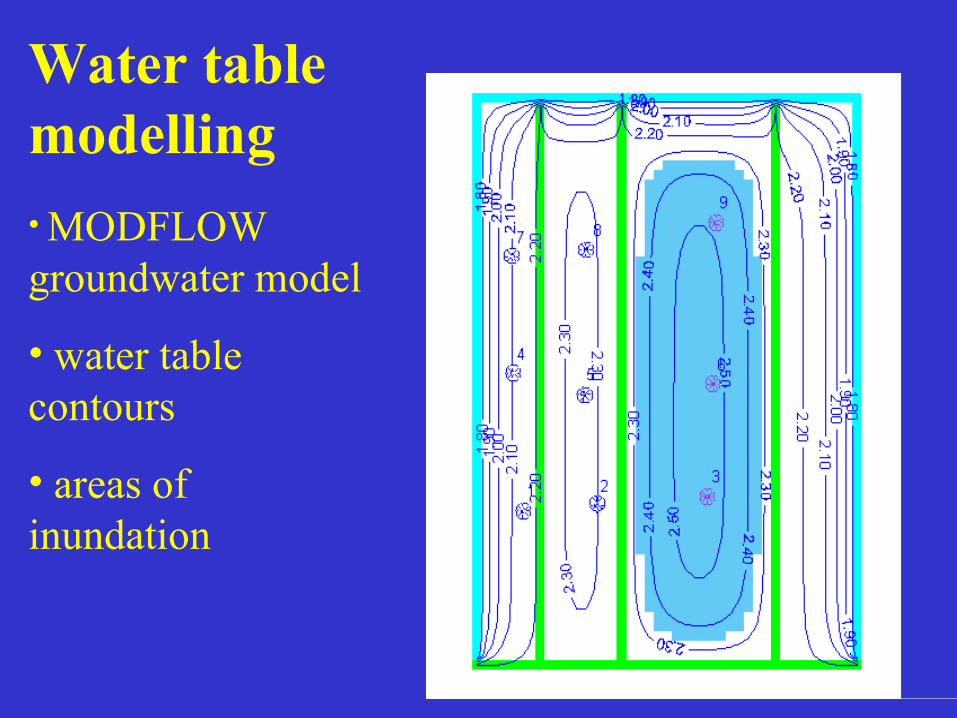
Water table modelling• MODFLOW groundwater model
• water table contours
• areas of inundation
Impact Assessment of Wetlands
Stage 1 Hydrological impacts assessment (abstraction on wetland hydrology)
Stage 2 Ecological impacts assessment (hydrology on wetland biota)
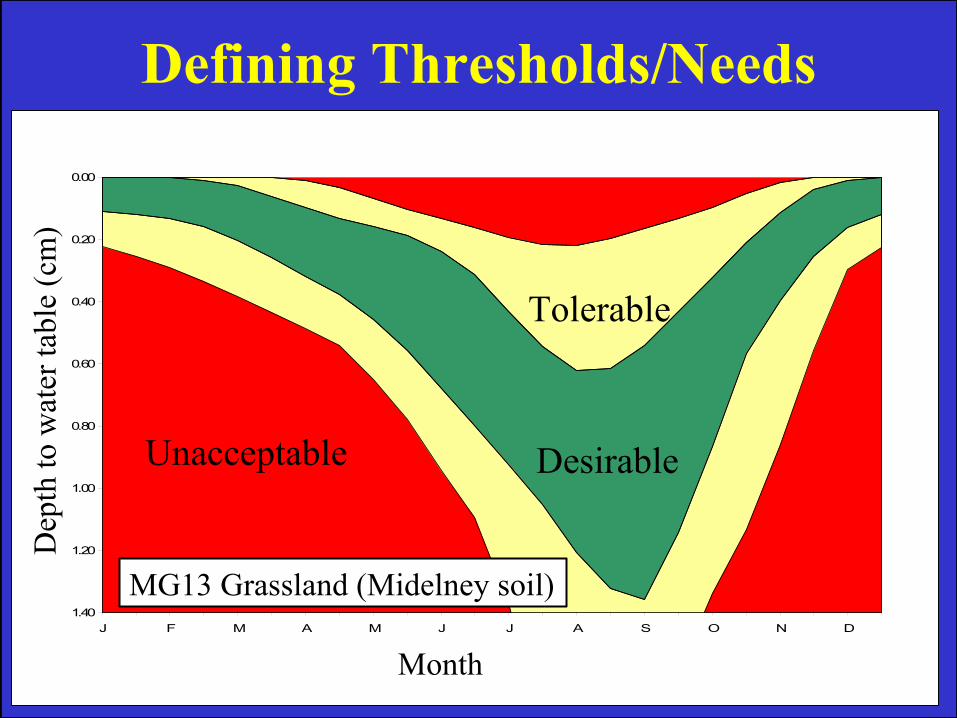
Defining Thresholds/Needs
0.00
0.20
0.40
0.60
0.80
1.00
1.20
1.40J F M A M J J A S O N D
Desirable
Tolerable
Unacceptable
MG13 Grassland (Midelney soil)
Month
Dep
th to
wat
er ta
ble
(cm
)
N
0 150m
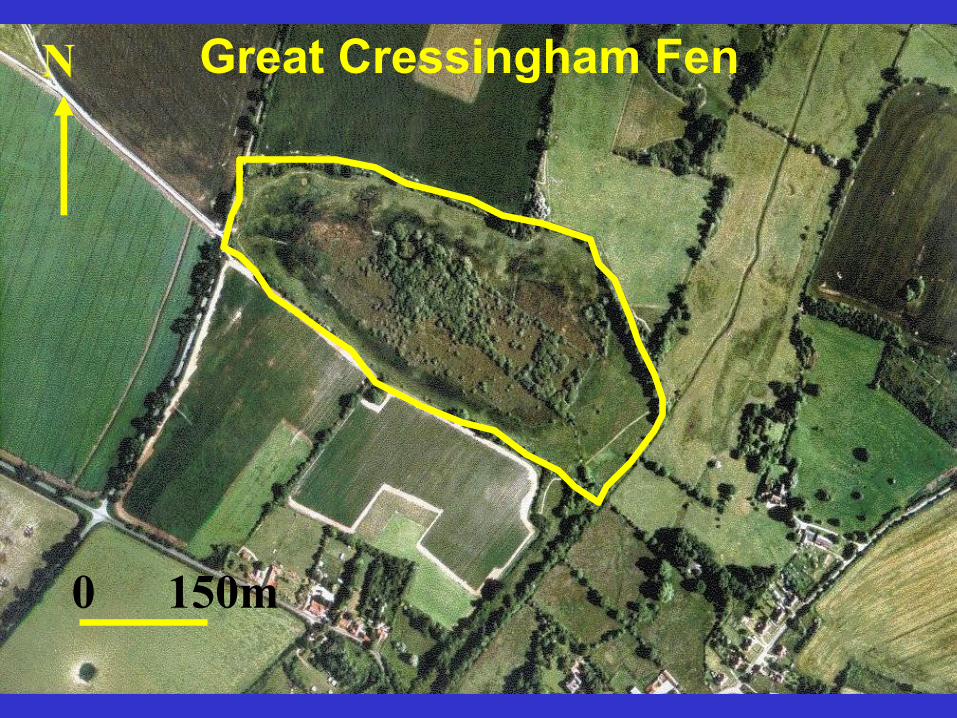
Great Cressingham Fen
Great Cressingham Fen - Summary
• The ADDITIONAL shallow water table drawdown related to an increase from natural (no abstraction) to full licensed abstraction is predicted to be around 11 cm
• Given the relative sensitivity of M13 to reduced water levels, an adverse effect cannot be ruled out at this stage.
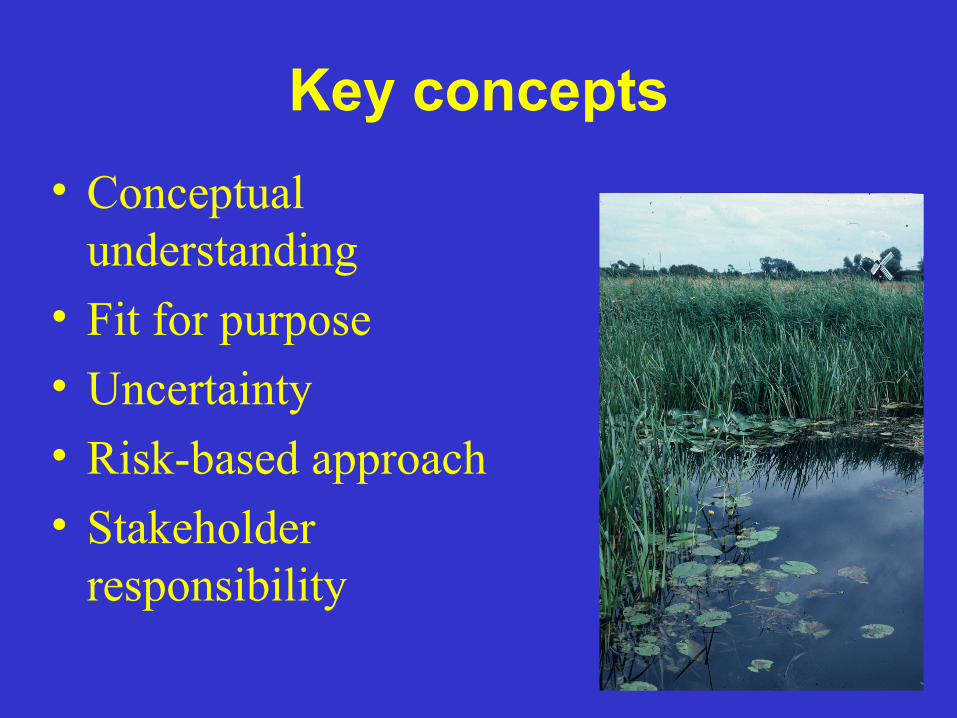
Key concepts• Conceptual
understanding• Fit for purpose• Uncertainty• Risk-based approach• Stakeholder
responsibility
http://www.uni-tuebingen.de/gracos/gif/eu.gif
EUROWET
Integration of European Wetland research in sustainable management of the water cycle
Hydrology Task Force review paper